1. Introduction
As non-renewable fossil energy sources such as oil and natural gas continue to diminish and deplete, geothermal energy has emerged as a renewable, clean, and environmentally friendly alternative [
1,
2]. Geothermal energy is a special mineral resource and is able promote to human economic development and the utilization of the Earth’s internal thermal energy resources, with large reserves and wide distribution, and it is clean, environmentally friendly, stable, reliable, etc. It is the Earth’s cleanest green, low-carbon, recyclable renewable energy [
3]. In recent years, the prediction model of geothermal anomaly areas has been a focal point of research for geothermal experts and scholars, both domestically and internationally.
In the 1970s, American scientist T.L. Saaty proposed the Analytic Hierarchy Process (AHP) method [
4], which combines qualitative and quantitative methods in an analytical approach. The principle of this method is to establish a hierarchical structure model and compare elements pairwise to determine the weight values of each element. The distribution of geothermal resources is typically linked to lithology [
5], seismic activity [
6], fault distribution [
7], Bouguer gravity anomaly [
8], surface temperature [
9], and various other factors. Numerous scholars from China, the United States, and Japan have effectively predicted and assessed geothermal resources, as well as unexplored geothermal zones, through the development of mathematical models that incorporate influencing factors closely associated with geothermal phenomena. In 2013, Chinese scholar Kong Weizhen et al. combined the fuzzy summation analysis method with the AHP method to establish a fuzzy AHP method and created an evaluation method for shallow geothermal energy suitability zoning based on fuzzy AHP [
10]. In 2016, Zhang Yanjun et al. used a Geographic Information System (GIS) environment to predict the deep hydrothermal geothermal potential areas in the western Anatolian region of Turkey based on five geothermal-related influencing factors, including seismic epicenters, faults, Bouguer gravity anomalies, magnetic anomalies, and infrared remote sensing [
11].
In 2021, Zuo Liqiong et al. conducted a suitability evaluation of mid-deep geothermal exploration in Taizhou, Jiangsu, using the ArcGIS geographical information system software and the comprehensive index method. Eventually, they divided the geothermal resources in the region into areas with good development and utilization conditions, areas with relatively good conditions, and general areas [
12]. In 2023, Faisal Alqahtani et al. evaluated the geothermal energy in the Lu’nayyil Volcanic Field in the western part of Saudi Arabia by using remote sensing, surface temperature, and geophysical data such as gravity, magnetic, and surface temperature data [
13]. The Dianxi region is rich in geothermal resources [
14] and is one of the exploration areas for high-temperature geothermal resources in China. However, there has been no previous research on predicting favorable geothermal anomaly areas in the Eryuan area of Dali. This paper, through a multidisciplinary approach that combines remote sensing, GIS, and geophysics, establishes a hierarchical structure model to predict geothermal potential in the Eryuan area for the first time. The data used in this study include lithology, seismic epicenter data, fault distribution, Bouguer gravity anomalies, SRTM-DEM images, and Landsat 8 remote sensing images. After transforming these data into evidence maps, they are normalized to generate predictive maps. Then, based on the hierarchical structure model, the geothermal potential prediction map is generated. The main purpose of this study is to use freely available datasets and conduct multi-criteria analysis to predict favorable areas. The combination of different indicators is supported by expert opinions to generate a priority map for geothermal potential. The research results will provide a reliable basis for conducting geothermal-related research in the Dali and neighboring areas. The results of the study show that in the Dali Eryuan area, all the areas showed good geothermal potential except for the central area. Among them, the Niujie–Sanying–Gromwell Lake area and the Liantie–Qiaohou area were classified as primary geothermally favorable areas, whereas the towns of Youshou, Dengchuan, and Xixiang were presented as secondary geothermally favorable areas. We verified the accuracy and reliability of the prediction model through validation with known hot spring sites. In this study, we adopted a multidisciplinary approach, including remote sensing, GIS, and geophysical techniques, as well as the introduction of hierarchical modeling and the AHP method, to assess the geothermal potential from the perspective of synthesizing data from multiple sources. This comprehensive approach is the first of its kind in the field of geothermal exploration suitability assessment and provides a more comprehensive and accurate prediction model for the study. In addition, this study incorporates multiple factors such as lithology, seismic activity, fault distribution, and Bouguer gravity anomaly into the prediction model and generates a highly credible geothermal potential prediction map through normalization and weight assignment. The accuracy and reliability of the prediction model are further ensured through validation with known hot spring points, which provides a strong scientific basis for the decision-making of actual geothermal resource development. In summary, this study constructed an innovative geothermal potential prediction model through the comprehensive use of multidisciplinary methods, which fills the gap in the assessment of geothermal potential in the Eryuan area of Dali and provides important theoretical and practical guidance for decision making on the development of geothermal resources in similar areas. It has important theoretical and practical value.
2. Geological Setting of the Study Area
2.1. Stratigraphic Outcrop
The Eryuan area is divided by the Luoping Mountain, with the eastern part being the Eryuan Basin [
15], which has a larger area and more exposed strata [
16], mainly from the Paleozoic era. The western part is the Qiaohou–Hanzhuang Basin, with a smaller area, and the exposed strata mainly originate from the Mesozoic era. The basement consists of metamorphic rocks from the Lower Cambrian Cangshan Group, with the absence of Cambrian strata, and is overlaid by Ordovician strata up to Quaternary strata [
17]. Among these, the primary lithology of the Ordovician Xiangyang Formation comprises gray-white sandstone and gray-green shale; the main lithology of the Devonian includes gray-black limestone, dolomitic limestone, and limestone; the primary lithology of the Carboniferous and Lower Permian consists of light gray and gray-white limestone; the principal lithology of the Permian Basalt Formation is dense, almond-shaped basalt; the predominant lithology of the Triassic, Tertiary, and Quaternary periods encompasses sandstone and siltstone [
18]. The region has undergone marine sedimentation, with early Paleozoic sedimentation representing shallow marine facies strata, later followed by thick layers of basic volcanic rocks. Mesozoic sedimentation comprises shallow marine facies and intercalated marine-continental facies strata. The Cenozoic era witnessed the development of substantial intermountain basin conglomerates, sandstones, clays, and fluvial–lacustrine deposits, and alluvial deposits [
19]. The study area is primarily characterized by the exposure of Triassic, Carboniferous, and Devonian limestones.
2.2. Tectonic Development
During the Paleozoic era, the Eryuan area primarily underwent carbonate platform sedimentation. Previous research findings indicate that the Mojiang area exhibited a deep-water depositional environment, while the northern Chenghai region displayed a coastal depositional environment [
20]. Towards the end of the Late Devonian, a marine transgression occurred, leading to a further deepening of the water bodies within the region. Throughout the Devonian period, the Yangtze Block and the Lanping–Simao Block had not yet experienced rifting, resulting in an overall stable platform sedimentation characterized by the development of open platform facies, platform margin facies, and shallow marine shelf facies [
21]. In the Carboniferous period, the opening of the Paleo–Tethys Ocean caused rifting along the margin of the Yangtze Block, while the Ailaoshan Ocean separated the Yangtze Block from the Lanping–Simao Block, creating a stable block with a relatively active small ocean basin pattern. The predominant sedimentation during this time continued to involve platform carbonate deposition [
22]. The collisional orogeny commenced during the Permian period. The Triassic sediments exhibit a chronological sequence characterized by early marine transgression and subsequent marine regression [
23]. Throughout the Early Triassic, the collisional orogenic activity was intense within the region, leading to the deposition of alluvial fan-dominated terrestrial sediments [
24]. In the Middle Triassic, the Middle Tethys Ocean began to form through tensional rifting in the geologically weak zones of western Yunnan. This process resulted in the creation of a new oceanic trough and marked the entry of the study area into a foreland basin stage. By the conclusion of the Late Triassic, the Middle Tethys Ocean had closed, triggering a retreat of the sea in the region [
25], leading to the gradual transition into a coal swamp environment. The Early Jurassic period brought about extensive uplift and denudation of the area. Starting from the Middle Jurassic, the region experienced further uplift, eventually evolving into a terrestrial environment [
26]. This period saw the development of interactions between land and sea, characterized by the deposition of red land-sourced clastic and carbonate rocks, along with pre-lake sandy mudstone and coarse land-sourced clastic rocks [
27].
2.3. Geothermal Conditions
Dali Prefecture is situated in the central-western part of Yunnan Province and falls within the southern extent of the Convection-type Geothermal Resource Belt of the Southern Tibet–Sichuan–Western Yunnan Uplift Mountain. The region boasts an abundance of geothermal resources owing to intense tectonic activity and magmatic events [
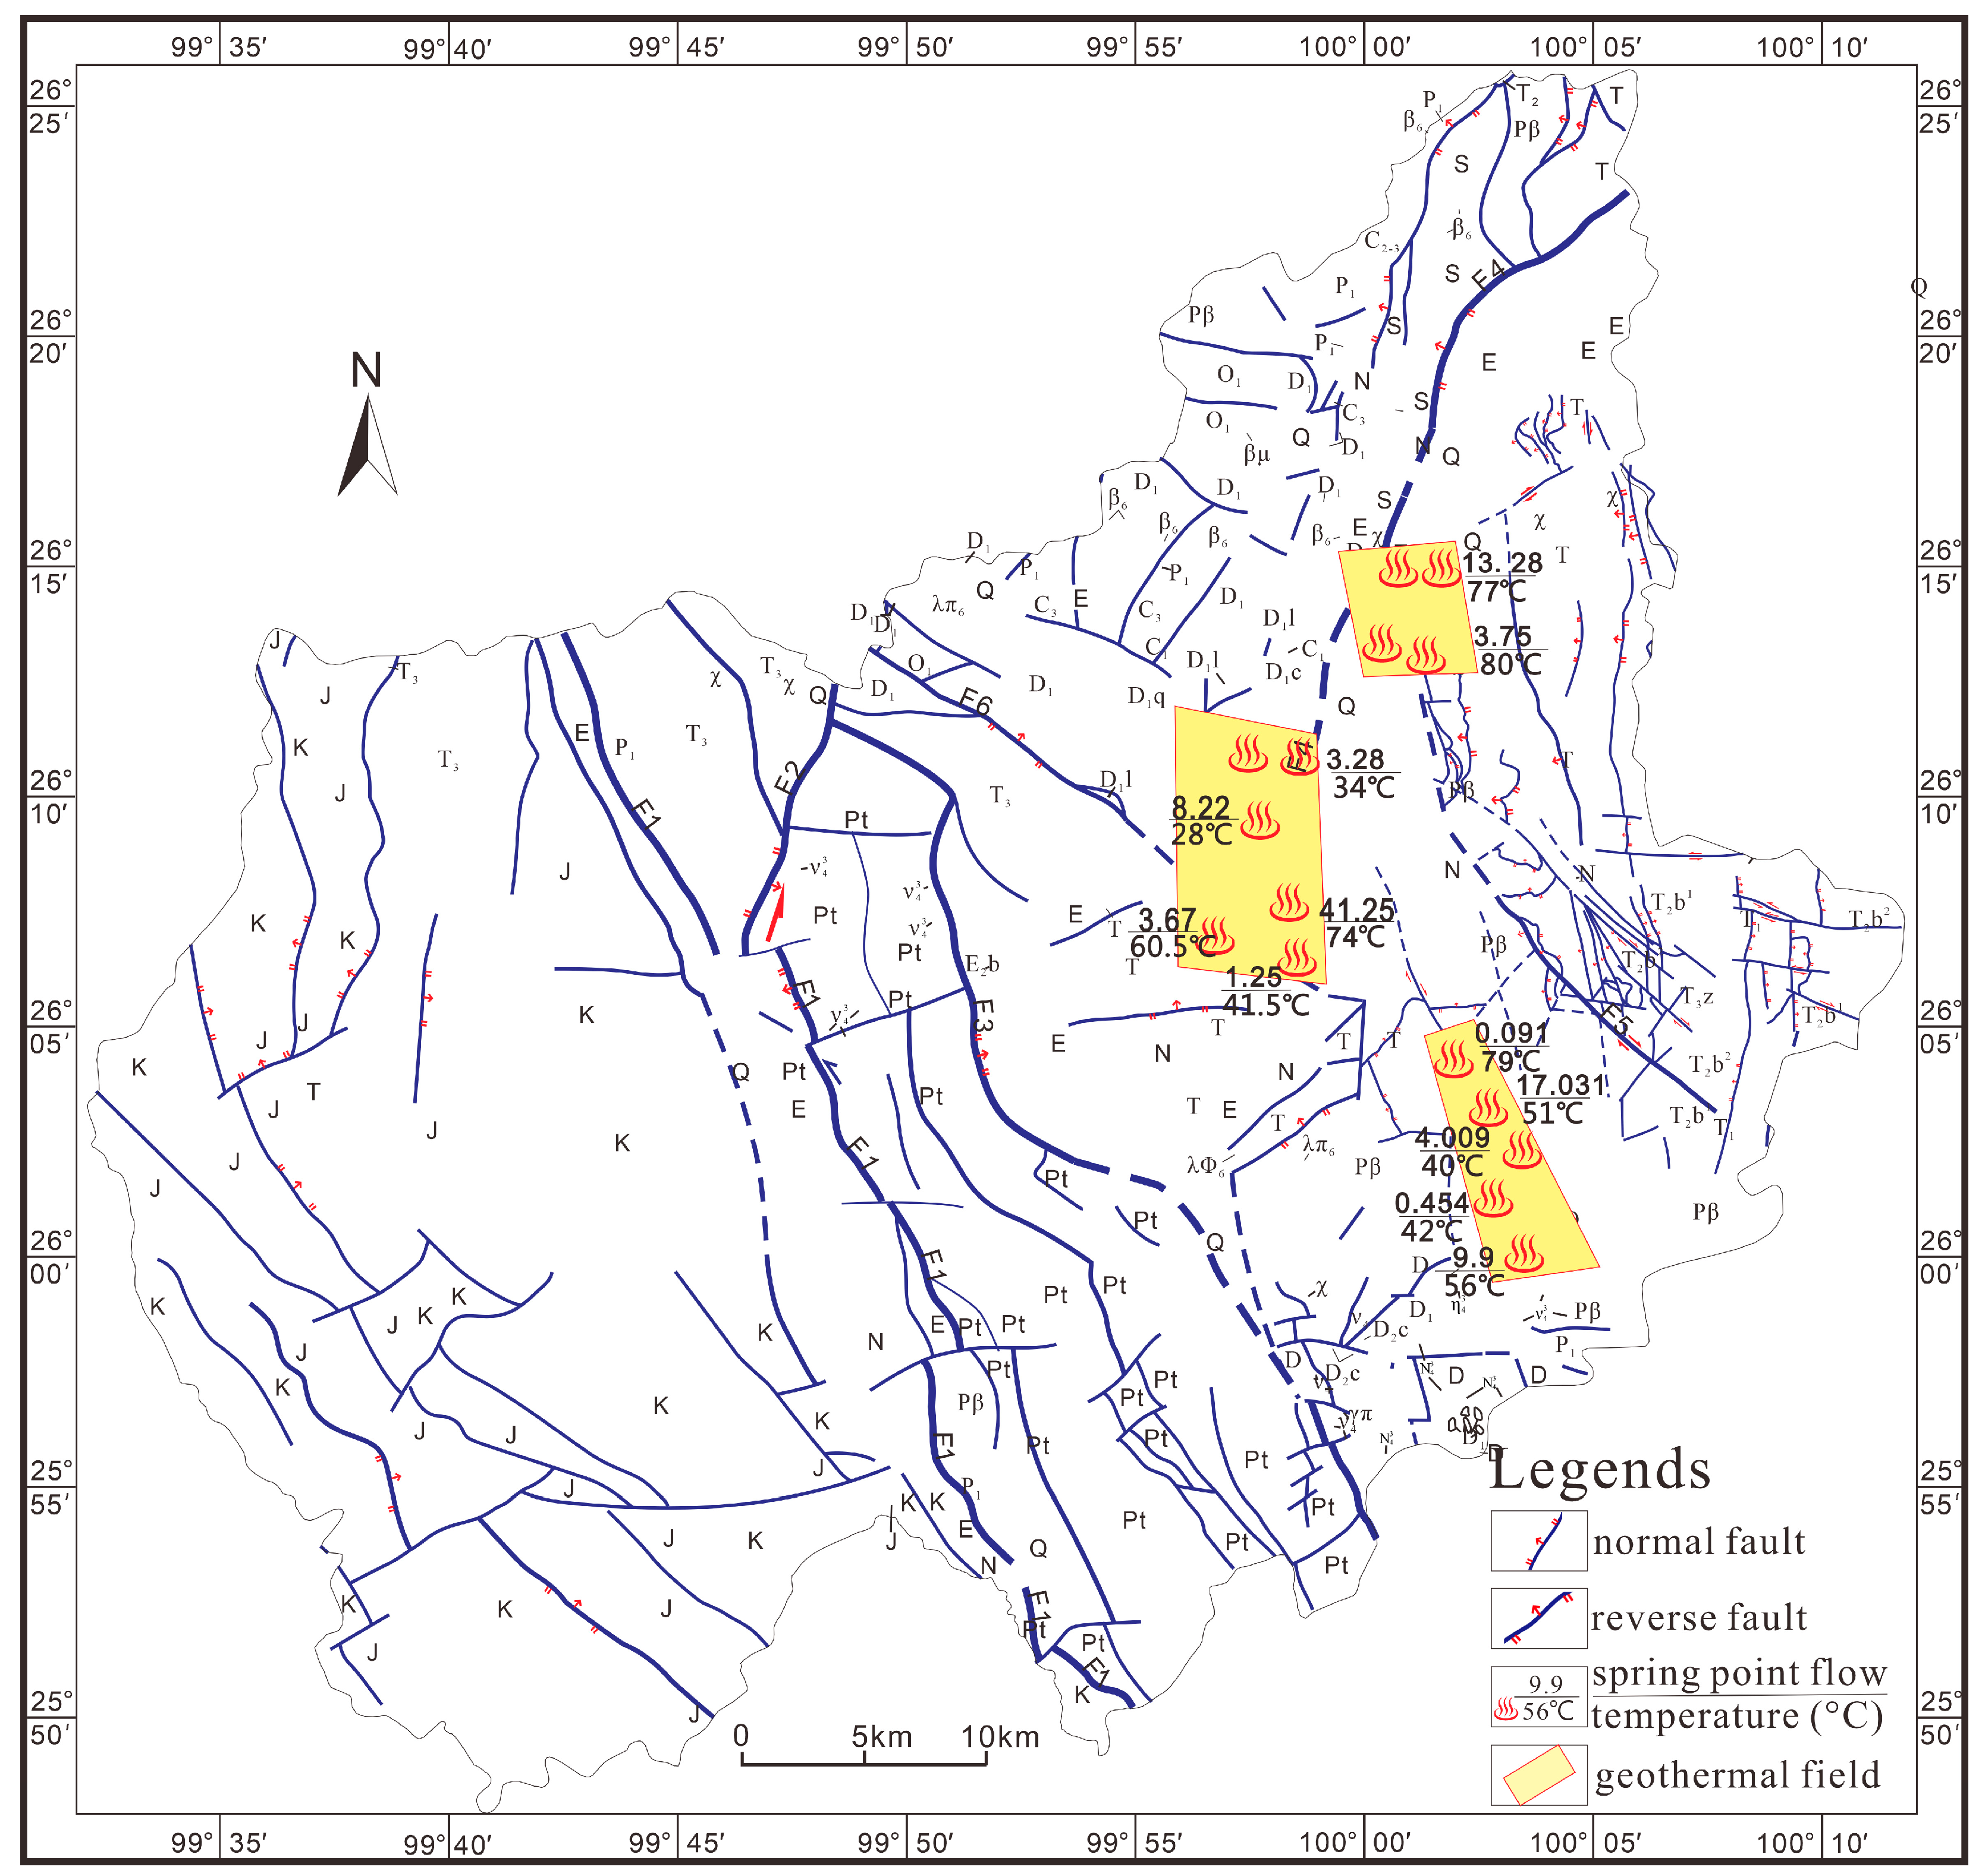
28], earning it the reputation of being the “hometown of hot springs.” As shown in
Figure 1, encircling the Eryuan Basin, a belt-like distribution of numerous warm (hot) springs is evident, primarily concentrated in three zones: the Niu Street–Sanying area in Eryuan, the Eryuan–Liancheng area, and the Xiasankou–Xihu area [
29]. Drawing from the collection and preliminary analysis of past data, a total of 103 geothermal hot spring outcrops have been identified across the entire 29,459 square kilometers of the prefecture, along with over 30 privately developed geothermal wells. Below the surface, a wealth of heat sources exists, encompassing geothermal fluids, rock heat conduction, and subterranean hot water.
The distribution of geothermal temperatures within the Eryuan area remains fairly uniform, influenced by geothermal heat flow and gradients, with temperature gradients typically ranging from 25 °C to 40 °C per kilometer and increasing progressively with depth [
30]. Abundant underground hot water resources are prevalent in this locality, featuring water temperatures that typically range from 50 °C to 80 °C, with instances even surpassing 80 °C. These conditions establish a favorable environment for direct geothermal applications, including heating and hot spring bathing.
Several key geothermal display zones are spread throughout the region, encompassing Jiutai–Yuhu, Niu Street–Sanying, and Xiasankou–Chengxi–Wenshui, and comprising more than 30 natural outcrop sites. Water temperatures in these hot springs span from 38 °C to 78 °C. A majority of these springs are characterized as sulfur springs and carbonate springs [
31], distinguished by excellent water quality, elevated water temperatures, stable flow rates, and notable health and medicinal advantages. Notably, the “Dali Geothermal Country” initiative currently stands as the largest hot spring leisure resort in Yunnan Province [
32].
All in all, the Eryuan area of Dali boasts abundant geothermal potential, a uniform temperature distribution, favorable heat storage conditions, and copious subterranean hot water resources, collectively establishing a solid foundation for geothermal energy development and utilization. Concurrently, the region presents expansive prospects for heat supply, hot spring tourism, and other related sectors. The geothermal resources within the Eryuan area of Dali hold substantial economic value and development prospects and are poised to play a pivotal role in local economic growth and the promotion of sustainable energy utilization.
3. Materials and Methods
3.1. Materials
This paper primarily focuses on selecting geological data (lithology, faults), infrared remote sensing data (Landsat 8 satellite imagery, SRTM-DEM imagery), and geophysical data (seismic activity, Bouguer gravity) as evidence factors to formulate a fuzzy logic model for identifying geothermal sites within the designated study area. The pertinent data and images corresponding to the aforementioned evidence factors were sourced from public platforms, and subsequent digital processing and analysis of these datasets were executed employing the ArcGIS platform. The different types of data are analyzed and processed in the ways and with the sources shown in
Table 1.
The lithology and fault data were sourced from prior studies, geological maps prepared by the Yunnan Geological and Environmental Supervision Institute, and the findings of field surveys conducted in the study area from February to May 2022, utilizing a scale of 1:200,000. Subsequent to corrections made to the earlier study data based on actual field surveys in the Eryuan area, the lithology and fault-distribution maps were meticulously redrawn to better reflect the true conditions.
Landsat 8 satellite imagery and SRTM-DEM data were obtained from the Geographic Spatial Data Cloud Platform of the Computer Network Information Center, Chinese Academy of Sciences “
http://www.gscloud.cn (accessed on 30 June 2023)”. This dataset includes vital information such as the acquisition date (2 January 2021, 03:47), orbit number (131/42), cloud cover (0.01%), sensor (OLI-TIRS), and spatial resolution (30 m). By employing ArcGIS and ENVI software, the Landsat 8 satellite imagery and SRTM-DEM data were seamlessly integrated and mosaicked into a comprehensive composite. The Landsat 8 data underwent several digital image-processing techniques, including radiometric calibration and atmospheric correction, to retrieve accurate land surface temperatures [
33].
Seismic activity data were procured from the United States Geological Survey (USGS). The Earthquake Hazards Program, established by the USGS in 1977, aims to prevent and mitigate earthquake-related disasters. Data spanning the timeframe from 1977 to 2023 were collated, encompassing details about earthquake epicenter coordinates, magnitude, and depth. To mitigate potential detection bias and considering that data predating 1980 might be unreliable due to technological constraints, the analysis exclusively considered seismic activity occurring between 1980 and 2023. Given that earthquake epicenters closer to the Earth’s surface tend to have a more pronounced impact and induce fractures, and lower-magnitude earthquakes may be categorized as aftershocks or background noise rather than originating events [
34], earthquakes are typically classified into different categories based on the depth of the source. These categories include very shallow-source earthquakes (0 ≤ M ≤ 30, where M represents the depth of the epicenter), shallow-source earthquakes (30 < M < 70), medium-source earthquakes (70 ≤ M ≤ 300), and deep-source earthquakes (M > 300 km) [
35]. Consequently, this analysis specifically focuses on very shallow-source earthquakes with depths within 30 km.
Bouguer gravity anomaly data originated from the International Gravity Bureau. The grid spans longitudes from 99° to 101° and latitudes from 25° to 27°, utilizing the WGM2012_Bouguer_ponc_2min gravity model. WGM2012 gravity anomalies are derived from Earth global gravity models EGM2008 and DTU10, incorporating 1′ × 1′ resolution terrain corrections sourced from the ETOPO1 model. These corrections encompass contributions from various surface masses, encompassing the atmosphere, land, oceans, inland seas, lakes, ice caps, and ice shelves [
36]. The computation of these values employs a spherical harmonic methodology, incorporating theoretical advancements to ensure precise calculations on a global scale.
3.2. Methods
3.2.1. Geologic Map—Lithology
Lithology pertains to the physical and chemical attributes of rocks, encompassing their composition, structure, texture, and properties [
37]. A strong correlation exists between lithology and geothermal resources [
38], as rocks of diverse lithologies exhibit distinctive traits like porosity, permeability, and thermal conductivity. These traits exert an influence on the conveyance and retention of geothermal energy [
39]. Hence, a thorough examination and comprehension of lithology bear immense significance in the advancement and utilization of geothermal energy.
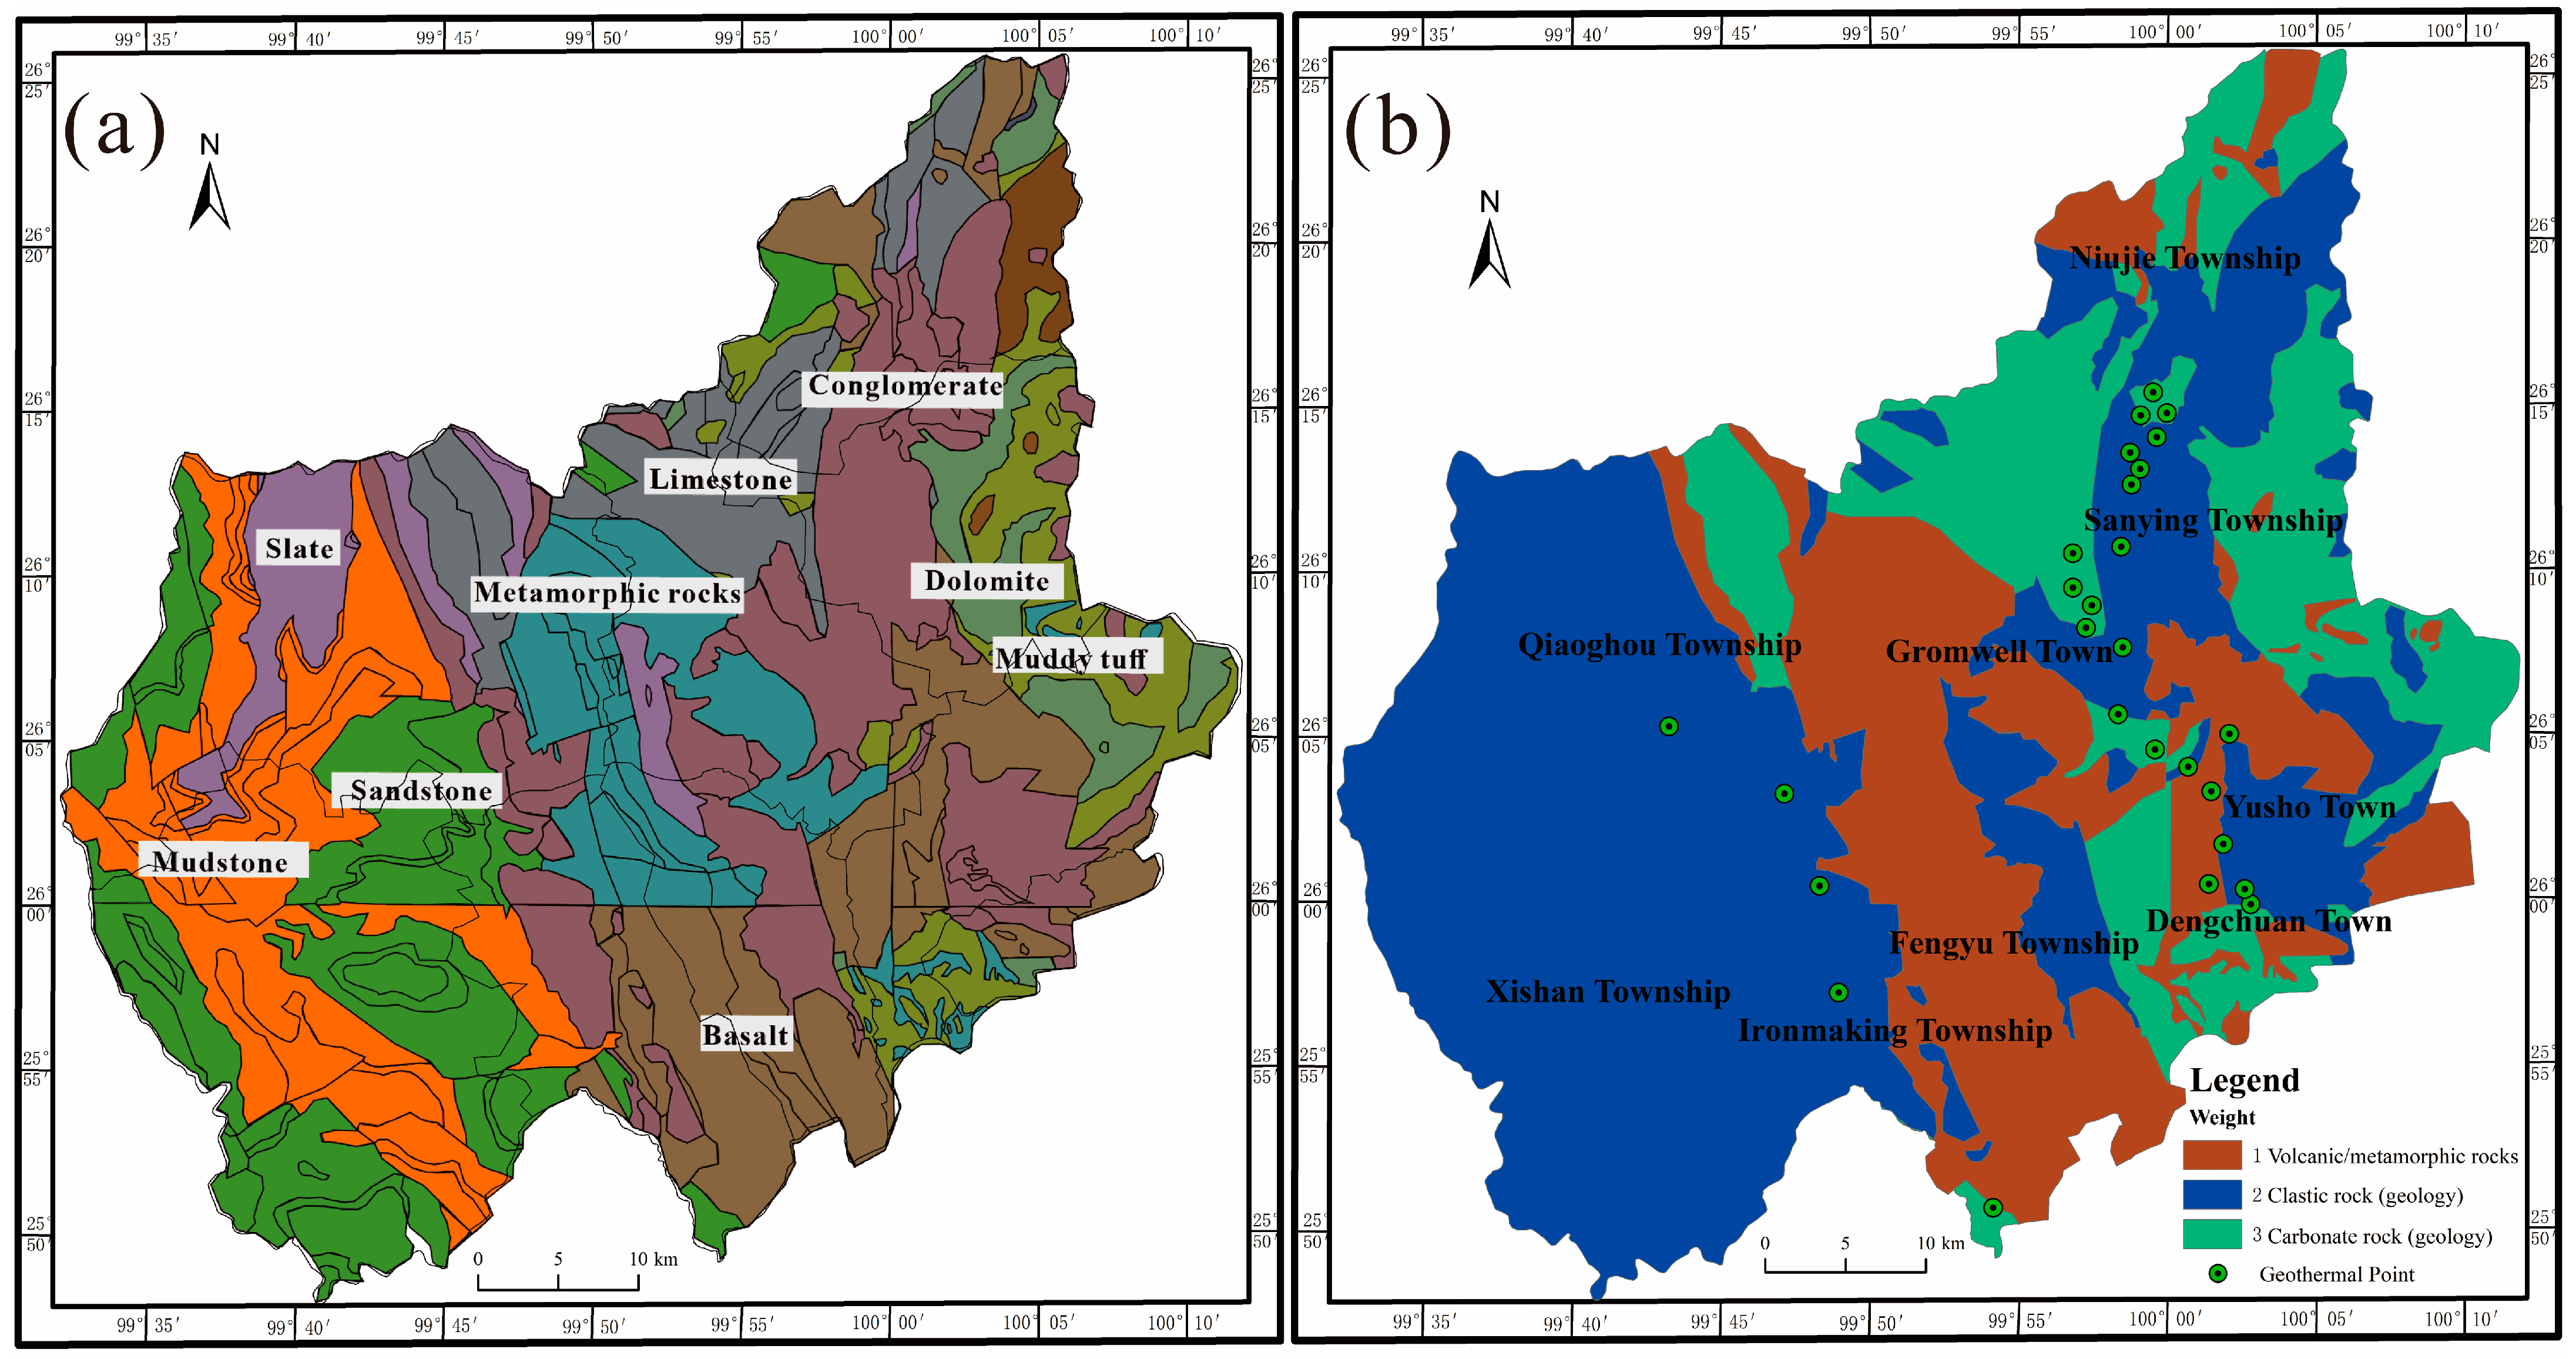
Before superimposing the lithology map onto other layers of evidence, it becomes imperative to allocate a value to the layer of the evidence map signifying the extent of rocks’ impact on geothermal resources within the Eryuan area. The classification of lithologies is based on common lithologies in geology, and the lithology in the Eryuan area is categorized into three distinct types, each assigned differing weight values based on their respective impact on geothermal resources. Among them, the influence of lithology on geothermal resources mainly reflects the thermal properties, porosity, permeability, and heat capacity of rocks. In this study, the degree of influence of lithology on geothermal resources was determined mainly via the number of geothermal hot spots contained in the distribution location of each lithology. The reconfigured lithology map is depicted in
Figure 2b. The rocks are sequenced in a descending order of their influence on geothermal activity, with carbonate rocks exerting the most significant influence, succeeded by clastic rocks and, finally, metamorphic/volcanic rocks.
3.2.2. Landsat 8 Images
In recent times, the utilization of remote sensing, specifically Landsat 8, has proven successful in acquiring information regarding land surface temperature [
40] and has found effective applications within geothermal studies [
13]. Presently, several approaches exist for deducing land surface temperature from thermal infrared remote sensing data. These methods include (1) the atmospheric correction method [
41]; (2) the single-window algorithm [
42]; (3) the split-window algorithm [
43]; and (4) the multi-channel algorithm [
44]. The fundamental principle underlying land temperature inversion initially involves estimating the atmospheric impact on the thermal radiation emanating from the land surface. Subsequently, this atmospheric influence is subtracted from the overall thermal radiation captured by the satellite sensor, yielding the intensity of thermal radiation at the land surface, which is subsequently converted into the corresponding land surface temperature [
45].
In the process of radiative exchange between the ground and the atmosphere, the thermal infrared radiant energy received by the satellite, denoted as L
λ, encompasses three constituent components: atmospheric upwelling radiance L
u, energy received by the satellite sensor subsequent to atmospheric attenuation of the actual ground radiance, and atmospheric downwelling radiance L
d. Therefore, based on this theoretical process described above, the radiative transfer equation [
46] can be used to represent the brightness value of thermal infrared radiation received by the satellite sensor:
where ε is the emissivity of the land surface; T
S represents the true temperature of the land surface, measured in Kelvin (K); τ denotes the transmissivity of the atmosphere in infrared wavelengths; and B(T
S) is the brightness of the blackbody thermal radiation at this real temperature.
where, τ = 0.95, L
u = 0.36, and L
d = 0.62.
The true surface temperature Ts can be obtained as a function of Planck’s formula:
where K
1 = 666.09 W/(m
2 ×µm × sr) and K
2 = 1282.71 K.
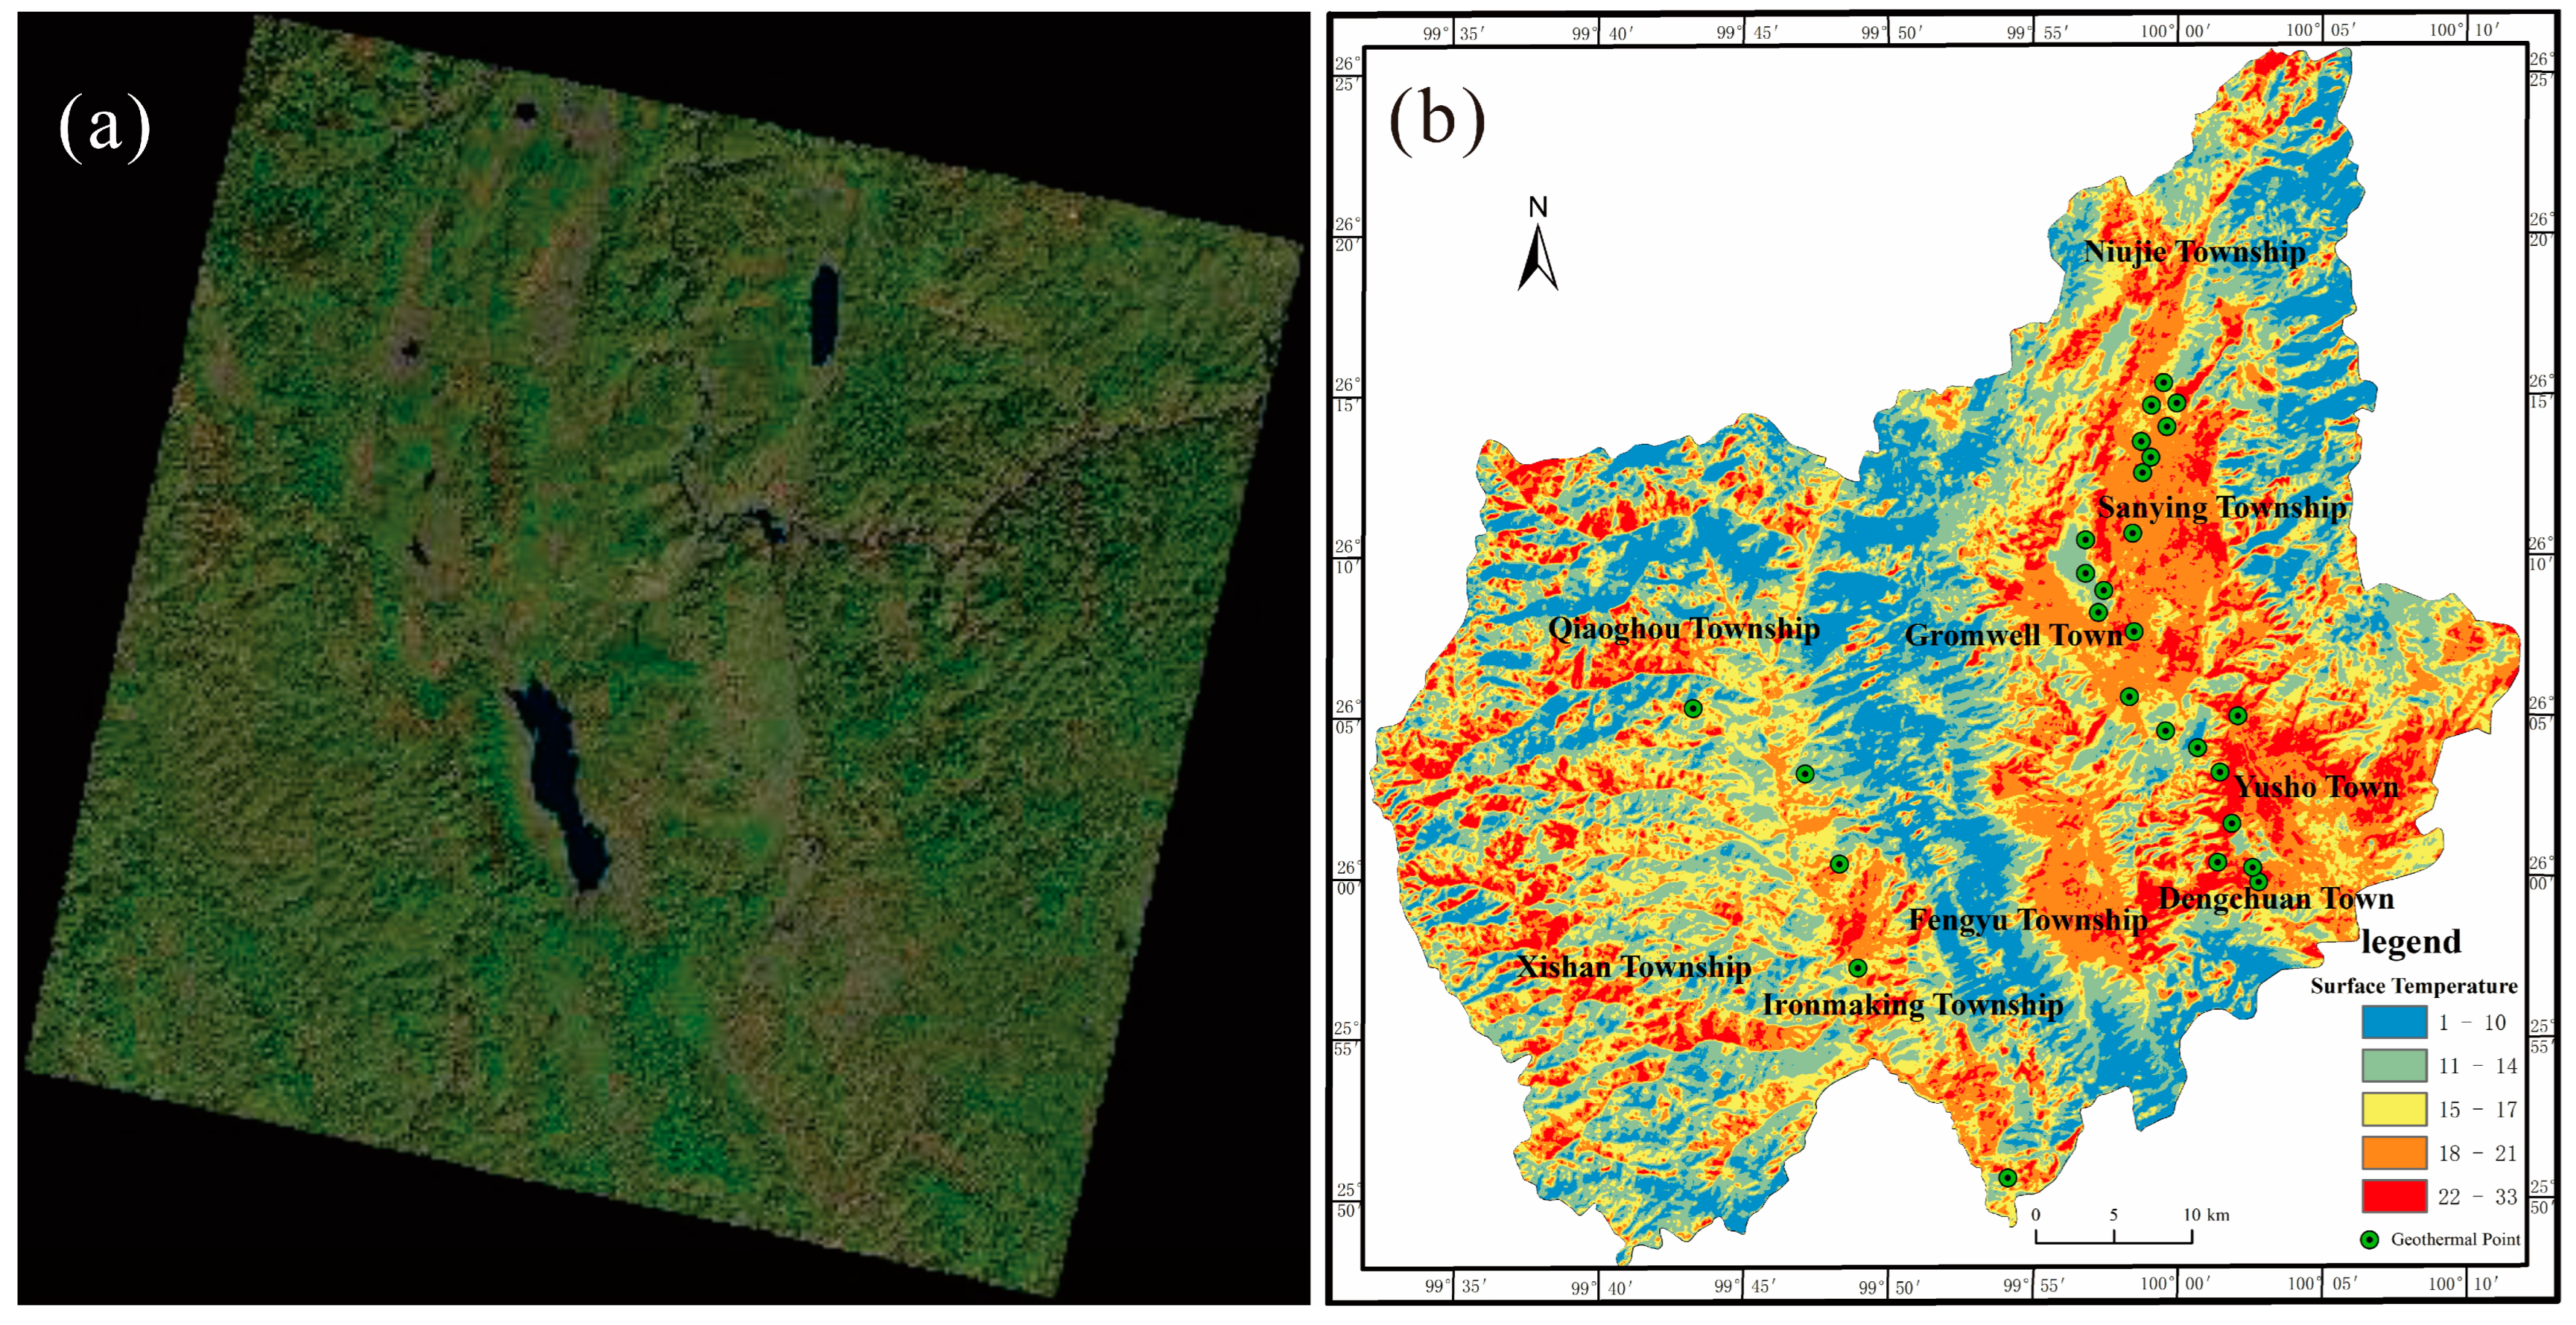
The land surface temperature map in this study was derived from Landsat 8 remote sensing image data using the atmospheric correction method. The Landsat-8 data were imported into ENVI, and various operations were carried out, including radiometric calibration, atmospheric correction, the calculation of the average elevation for the study area, image fusion, NOVI band operation, the calculation of land surface emissivity, the computation of black body radiance, and the inversion of the land surface temperature distribution based on the inverse function of Planck’s formula. These processes were executed to calculate the land surface temperature in the Eryuan region.
From
Figure 3b, it can be observed that geothermal anomalies are uniformly distributed in regions with higher land surface temperatures. This suggests the feasibility of utilizing Landsat-8 data as an evidence factor for predicting geothermally favorable areas. The inversion of land surface temperature provides essential support for identifying and investigating areas with geothermal potential. Such information carries significant importance for the development and utilization of geothermal resources. As depicted in
Figure 3b, approximately 66.7% (the number of hot spots with surface temperatures in the range of 22–33 °C/total number of hot spots) of geothermal anomalies are concentrated in regions with elevated land surface temperatures, indicating a robust correlation between land surface temperature and geothermal anomalies.
3.2.3. Geologic Map—Faults
Faults typically create underground fractures and voids, which can act as pathways for the transport and storage of geothermal energy [
47,
48,
49]. Geothermal energy is conveyed to the surface through fractures and pores in faults, giving rise to the creation of hot springs and geothermal areas [
50]. Positive and reverse faults emerge as a consequence of stress distribution within the Earth’s crust. The activity of these faults within subsurface rock formations can profoundly influence the transport and accumulation of geothermal fluids. Positive faults materialize due to tensile stresses in the crust, leading to both the upward and downward displacement of rock formations along the fault plane. In geothermal systems, positive faults can manifest as fissures and channels [
51], facilitating the movement of geothermal fluids between rock layers. This enhances hydrothermal fluid circulation and augments the efficiency of heat transfer [
52]. Moreover, the presence of positive faults can alter the flow paths of groundwater, ultimately resulting in the warming and conveyance of geothermal water [
53].
Conversely, reverse faults arise from compressive stresses within the Earth’s crust [
54], engendering relative upward and downward shifts of rock layers along the fault plane. These reverse faults have the potential to establish thermal reservoirs that store and amass geothermal fluids [
55,
56]. Additionally, reverse faults might induce stress accumulation in subsurface rock strata [
57], thereby enhancing the stability and sustainability of geothermal systems. The presence of faults provides easier access to geothermal energy, promoting its utilization and development. Therefore, comprehending and studying the impact of faults on geothermal energy hold significant importance.
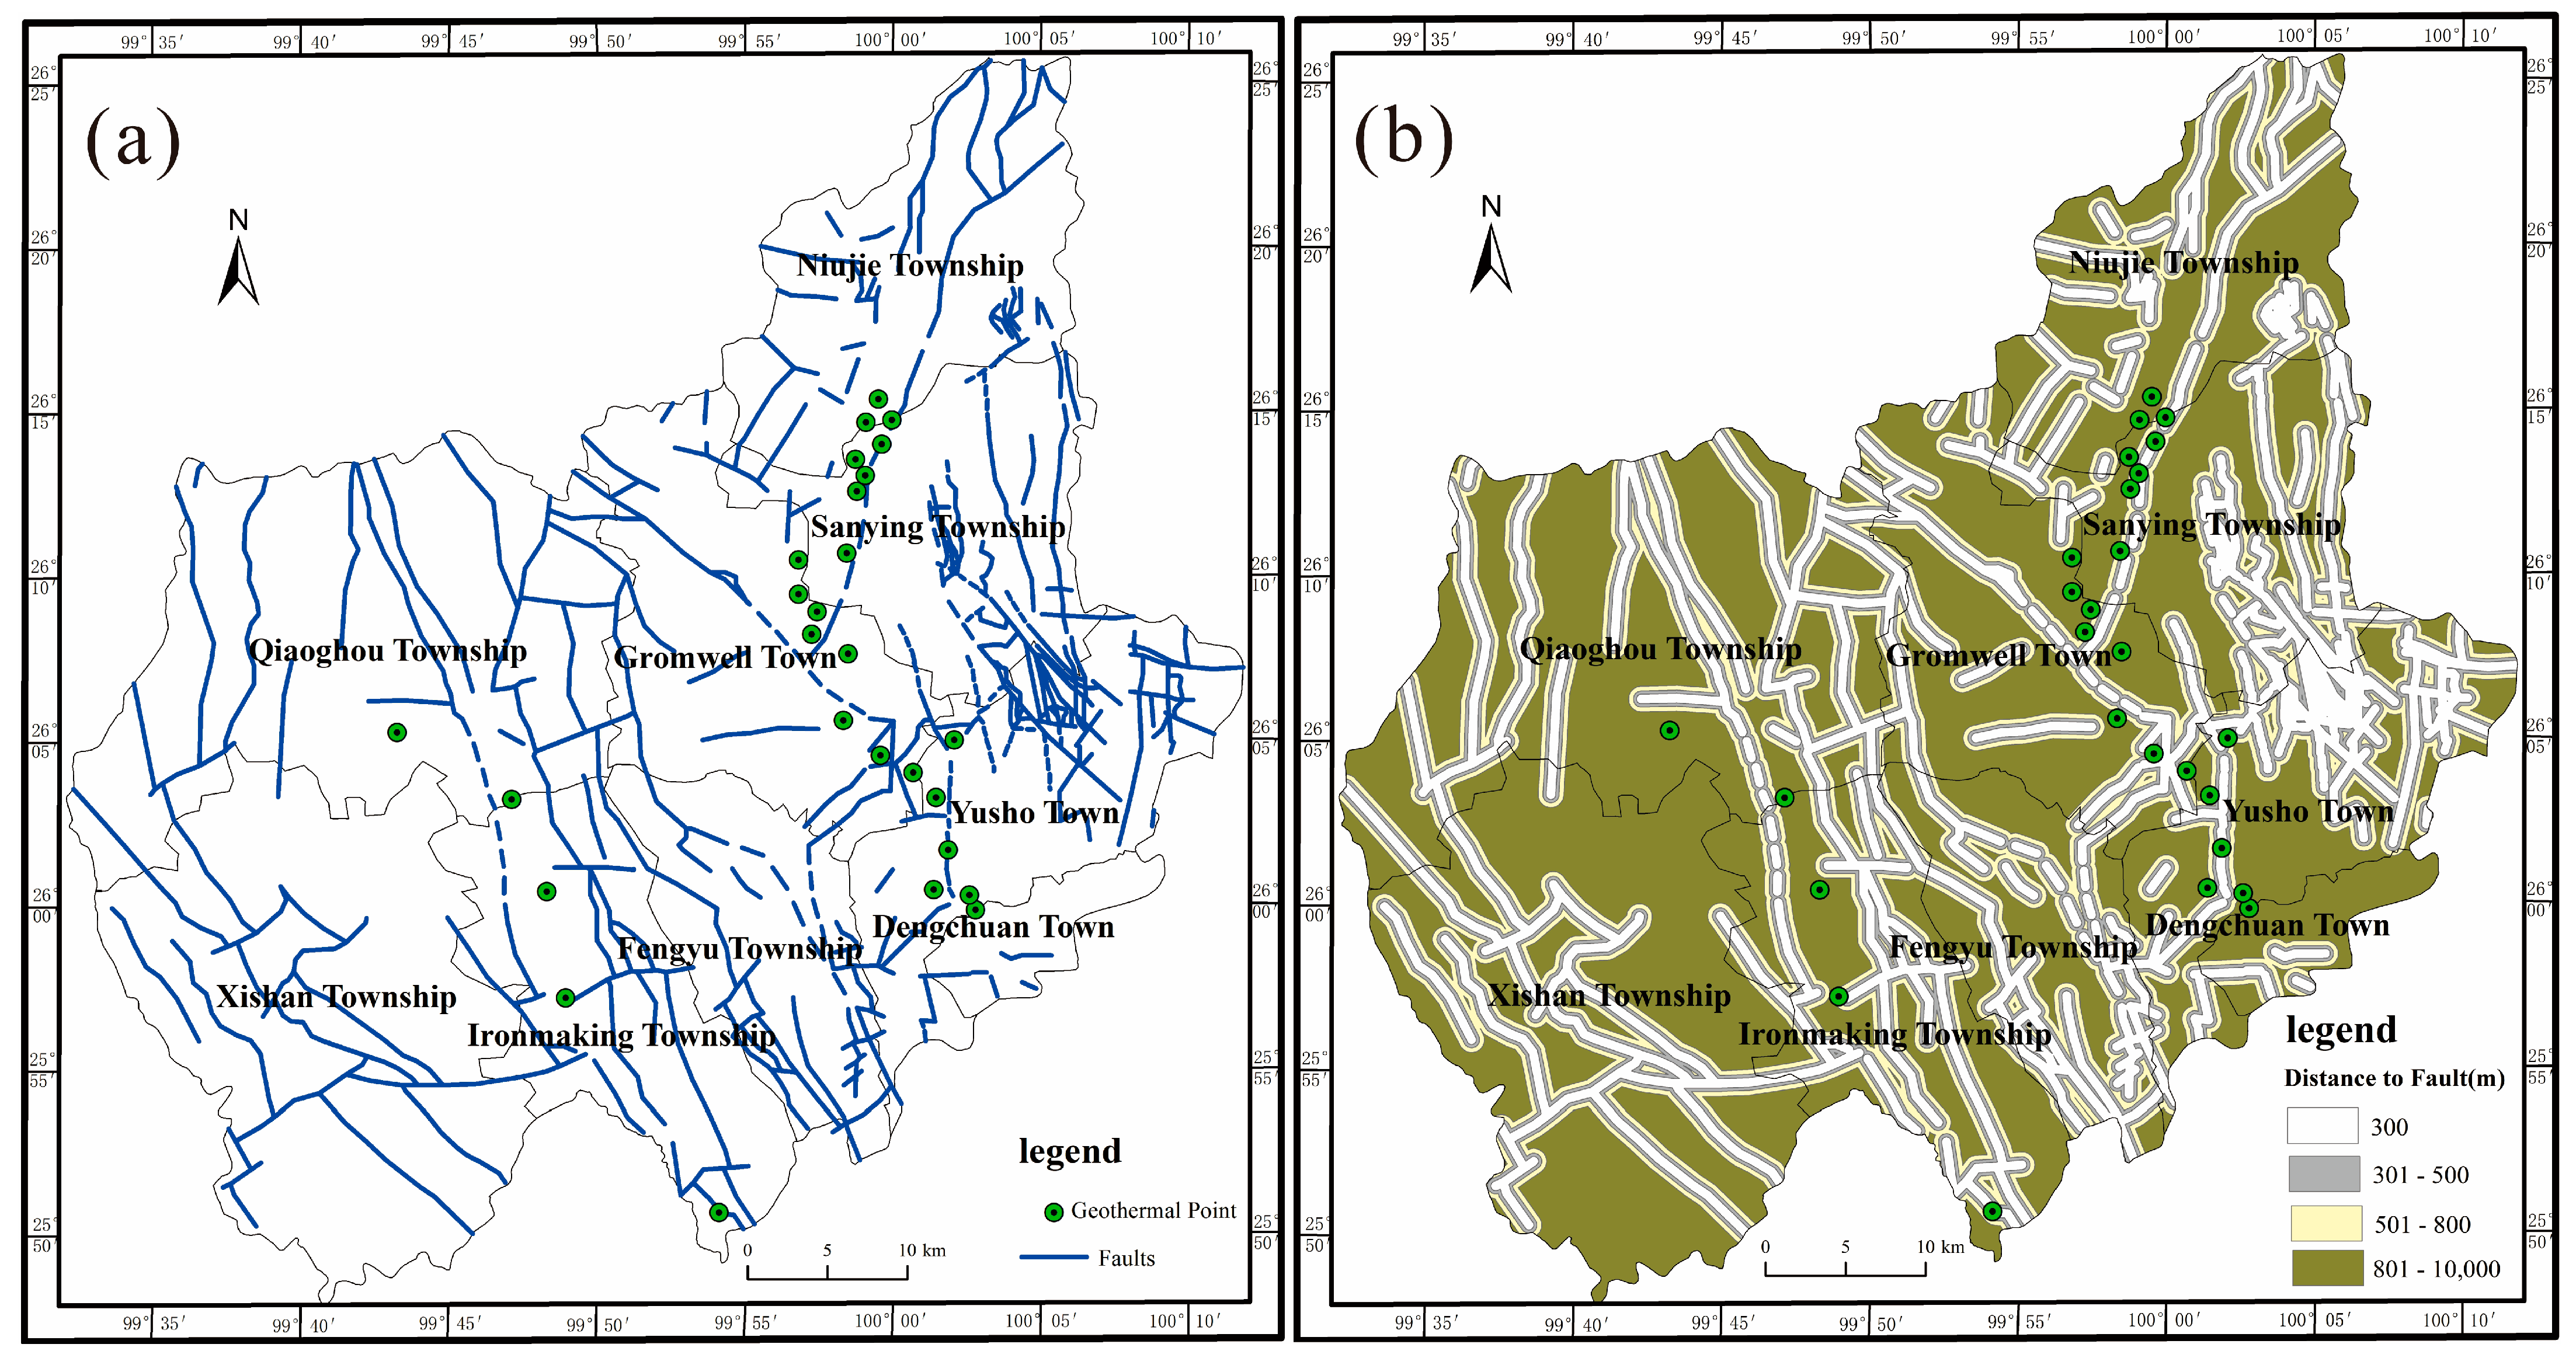
By integrating the 1:200,000 geological map of Eryuan County and field survey findings, we generated a spatial distribution map of faults. We performed multi-ring buffering analysis on the faults within the ArcGIS environment, setting buffer distances of 300 m, 500 m, and 800 m, respectively, and confined the study area to the administrative boundary of Eryuan County. The geothermal distribution map was superimposed with the faults to quantify the relationship between geothermal anomalies and fault distribution. In
Figure 4b, each grid cell represents the distance to the nearest fault. As depicted in
Figure 4a, 70.4% ((Number of points located near faults/total number of points, below) of geothermal anomalies are situated close to faults. This observation highlights a substantial correlation between faults and geothermal anomalies, suggesting that the distance to faults can serve as an evidence factor for predicting areas with geothermal potential.
3.2.4. Earthquake Activity
Earthquakes result from crustal fractures, releasing energy that includes geothermal energy. Earthquakes induce crustal fractures and deformations, giving rise to underground fissures and pores. These fissures and pores act as pathways and reservoirs for the transport of geothermal energy [
58]. The geothermal energy produced from fractures and pores formed by earthquakes is conveyed to the surface, leading to the emergence of geothermal anomalies and hot springs. Furthermore, earthquakes can impact the flow and distribution of subsurface water, thereby affecting the transmission and utilization of geothermal energy. The study of seismic activity offers valuable insights into the development and utilization of geothermal energy [
28]. Analyzing seismic activity aids in identifying the location and characteristics of areas rich in geothermal energy, offering essential guidance for geothermal development.
To acquire representative seismic parameters, each fault is treated as an independent seismic source. Based on the focal mechanism solution, the majority of fault planes in the Eryuan area exhibit a dip angle of 48°. As a result, the epicenter density value is computed within a circular area with a radius of 27 km (30/tan48°), centered on each seismic event. The Gutenberg–Richter relationship, a widely employed empirical relationship in seismology, describes the statistical correlation between the frequency of seismic events and their magnitudes [
59]. This relationship indicates that within a seismic zone or region, smaller seismic events occur more frequently than larger ones. The Gutenberg–Richter relationship has been extensively utilized in seismology [
60], providing a statistical framework for understanding seismic activity characteristics, predicting trends, and assessing earthquake hazards. It is important to note that the Gutenberg–Richter relationship is empirical and cannot forecast specific times and locations of earthquake occurrences. Nevertheless, it offers valuable insights into the overall distribution and trends of seismic activity.
To explore the spatial relationship between seismic activity and geothermal hotspots, the seismic events must be transformed into an epicenter density map using the following steps:
- (1)
Select seismic data with focal depths less than 30 km from the period between 1980 and 2023.
- (2)
Classify the seismic data into four ranges based on their magnitudes (3.2 ≤ M ≤ 4.1; 4.2 ≤ M ≤ 4.3; 4.4 ≤ M ≤ 4.6; 4.7 ≤ M ≤ 6.1). The categorization principle ensures an approximately equal number of seismic events in each range.
- (3)
Generate four seismic epicenter density maps and compute the annual average frequency λm for each density map.
Seismic annual average frequency
- (4)
Use the mathematical expression of the Gutenberg–Richter relationship [
61]:
where λ
m represents the number of seismic events with magnitudes greater than or equal to M, M is the magnitude of seismic events, and a and b are constants. Constant a is commonly referred to as the number of events at magnitude one or as the amplitude parameter, describing the distribution density of seismic events in magnitudes. Constant b is known as the slope parameter, representing the relationship between the frequencies and magnitudes of seismic events.
- (5)
Exclude data with λm equal to zero and duplicate values. λm values equal to zero or the same in two ranges indicate the absence of seismic events within that magnitude range. For instance, if λ1 = λ2, it means no seismic events occurred in the range of λ1 ≤ M ≤ λ2, as λ2 would be greater than λ1 if any seismic event had occurred.
- (6)
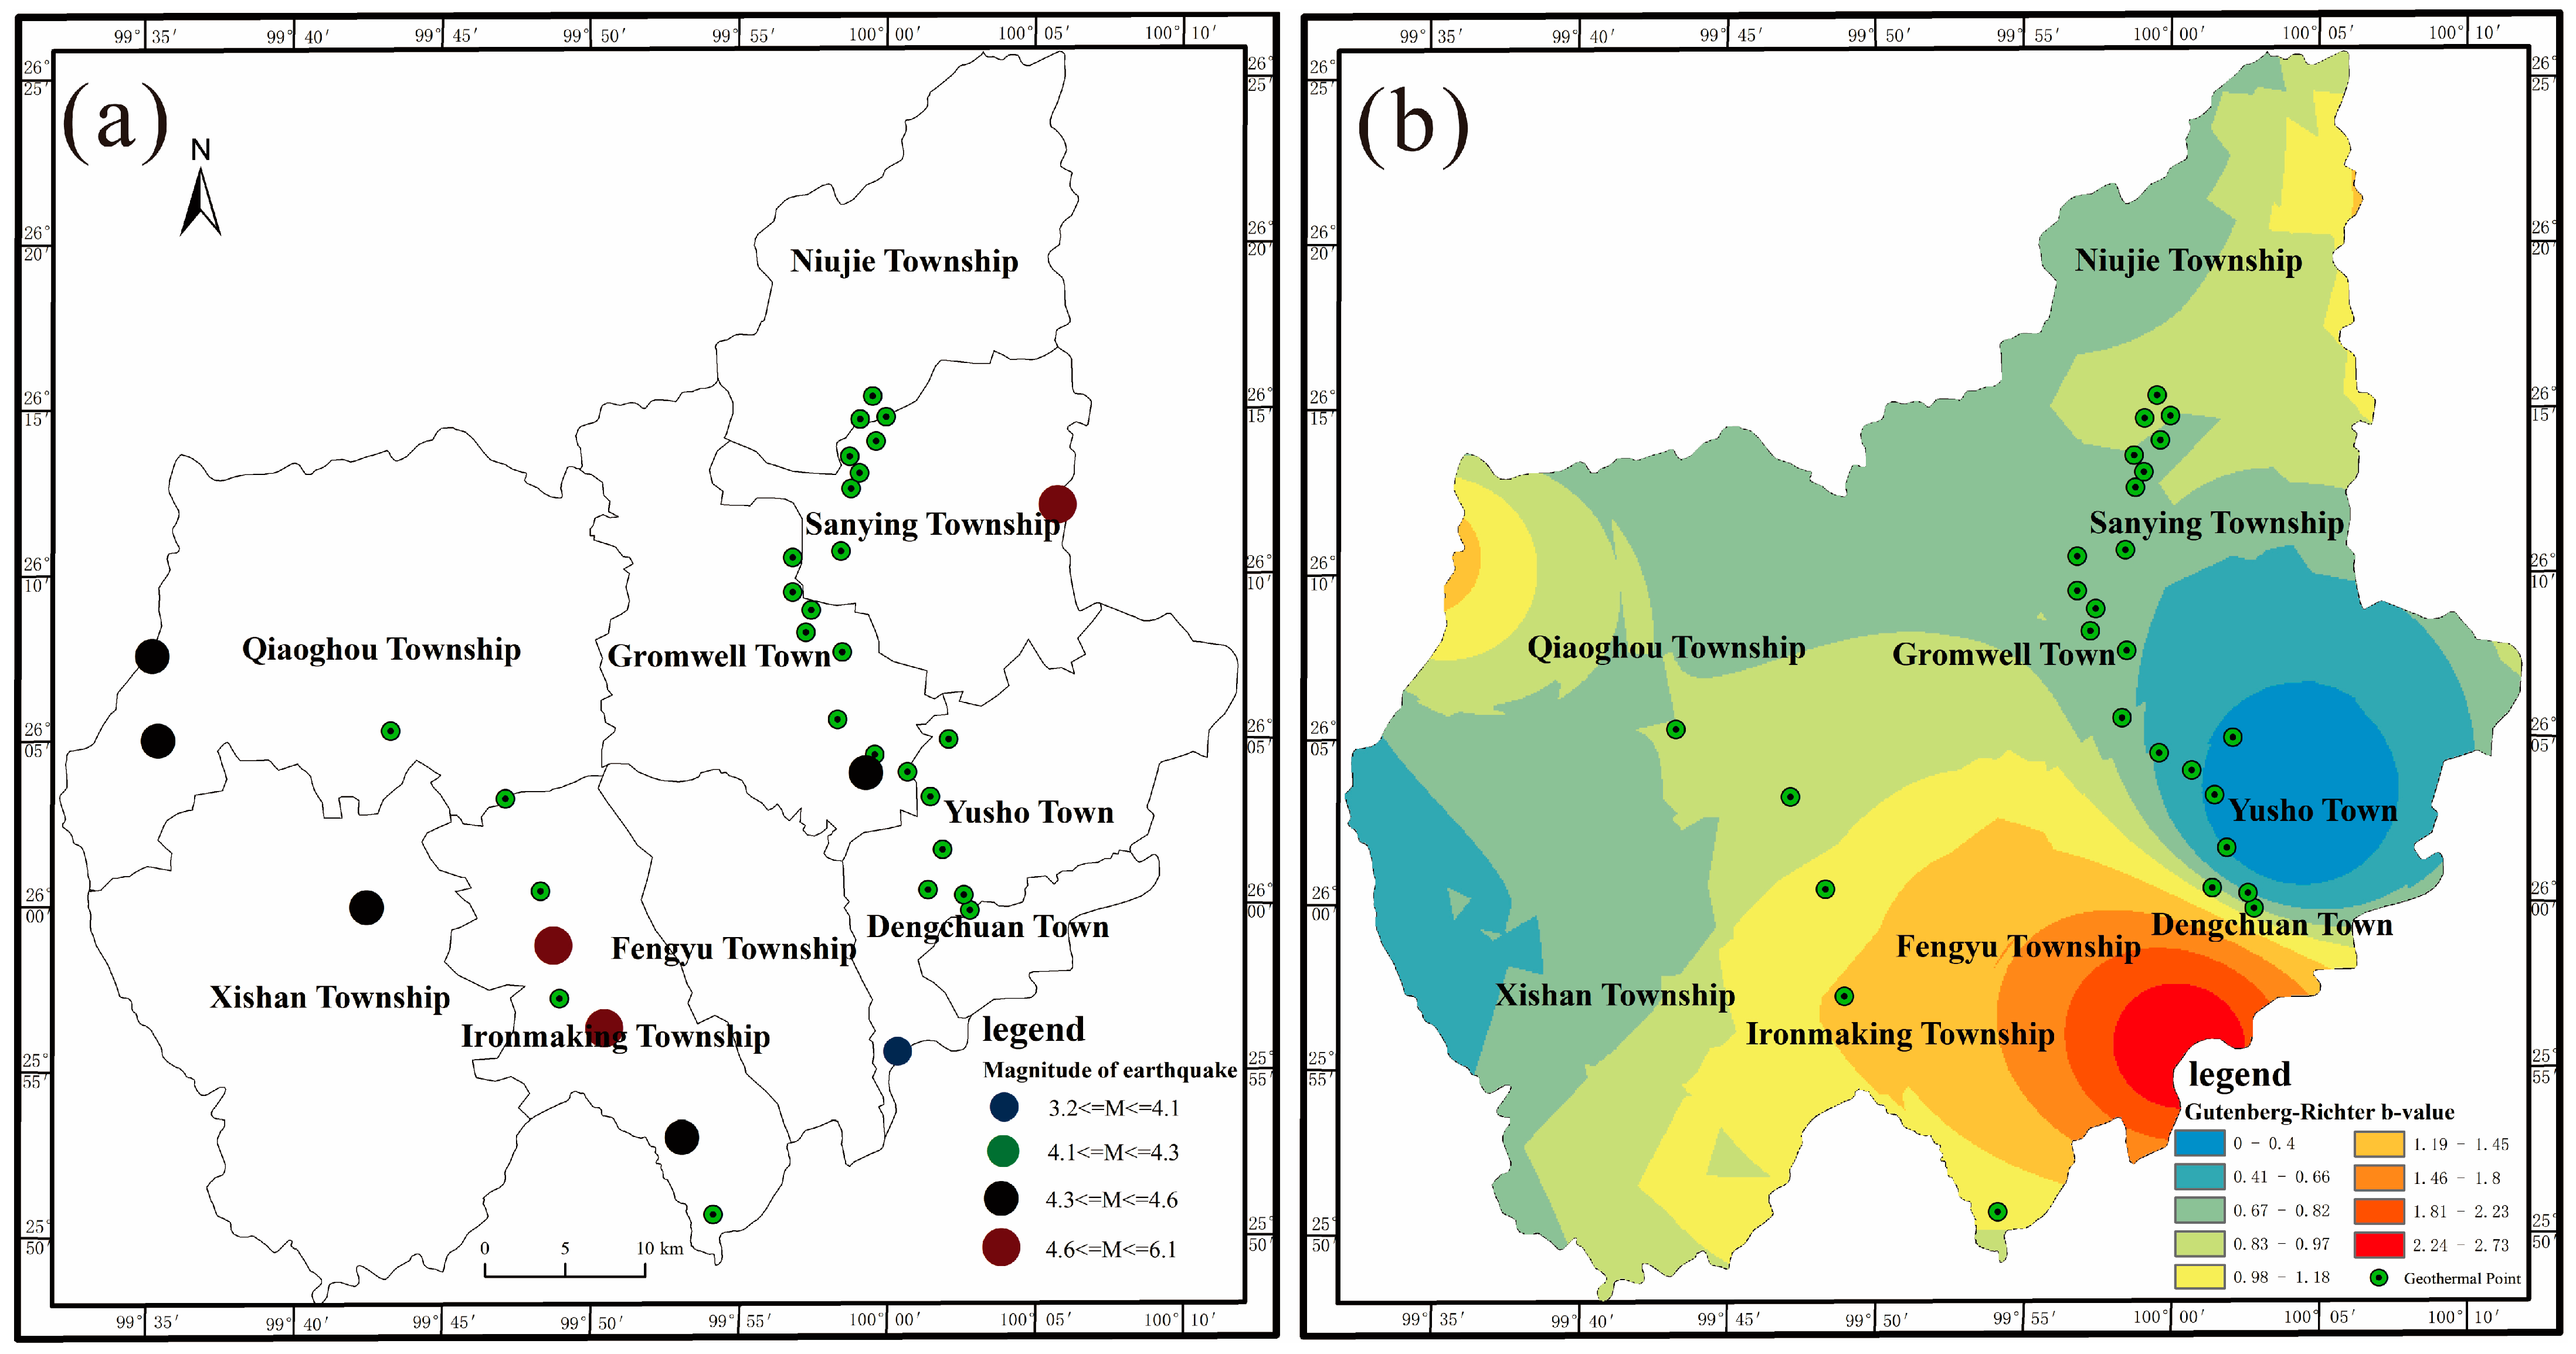
Calculate the corresponding B-values for each grid cell, and use spatial interpolation to obtain the Gutenberg–Richter B-value map (
Figure 5b).
3.2.5. Bugge Gravity Anomaly
Bouguer Gravity Anomalies and Their Relationship with Geothermal Activity
The Bouguer gravity anomaly refers to the disparity between the measured gravity field on the Earth’s surface and the theoretical gravity field [
62,
63]. There exists a discernible relationship between geothermal activity and Bouguer gravity anomalies. Geothermal activities have the potential to induce alterations in the density and volume of subsurface rocks, leading to fluctuations in Bouguer gravity anomalies [
64]. By assessing the distribution of and alterations in Bouguer gravity anomalies, it becomes feasible to deduce changes in the density and volume of subsurface rock formations, thus facilitating an understanding of the distribution and characteristics of geothermal activities. Consequently, the measurement of Bouguer gravity anomalies holds significant value as a reference for geothermal exploration.
Bouguer gravity anomaly maps can be instrumental in comprehending regional tectonics, delineating major fault structures, and identifying potential hydrothermal activities [
65]. In regions where gravity-anomaly contour lines are notably extended or form a strip shape with lower anomaly values at the center and higher values on both sides of the low-gravity zone, it is often indicative of the presence of low-density rock zones. These zones are frequently associated with long-axis tilts and grabens that are shaped by layers of low-density rock [
66,
67]. The occurrence of primary grabens can, to a certain extent, signal the presence of geothermal resources. Many significant deposits of organic minerals are interconnected with grabens, which are also frequent sites of groundwater emergence [
68,
69] and often serve as gathering places for lakes.
In order to investigate the correlation between Bouguer gravity anomalies and geothermal activity, it is necessary to transform the Bouguer gravity anomaly data into a map reflecting the distance from the primary graben. The specific steps involved in this operation are outlined as follows:
- (1)
Identify areas where gravity values exhibit pronounced changes and the slope is >0.06 (mean + standard deviation), delineating these regions as the main graben linear distribution map.
- (2)
Conduct multi-ring buffer analysis of the primary graben system within the ArcGIS environment.
- (3)
Generate a distance map to the primary graben.
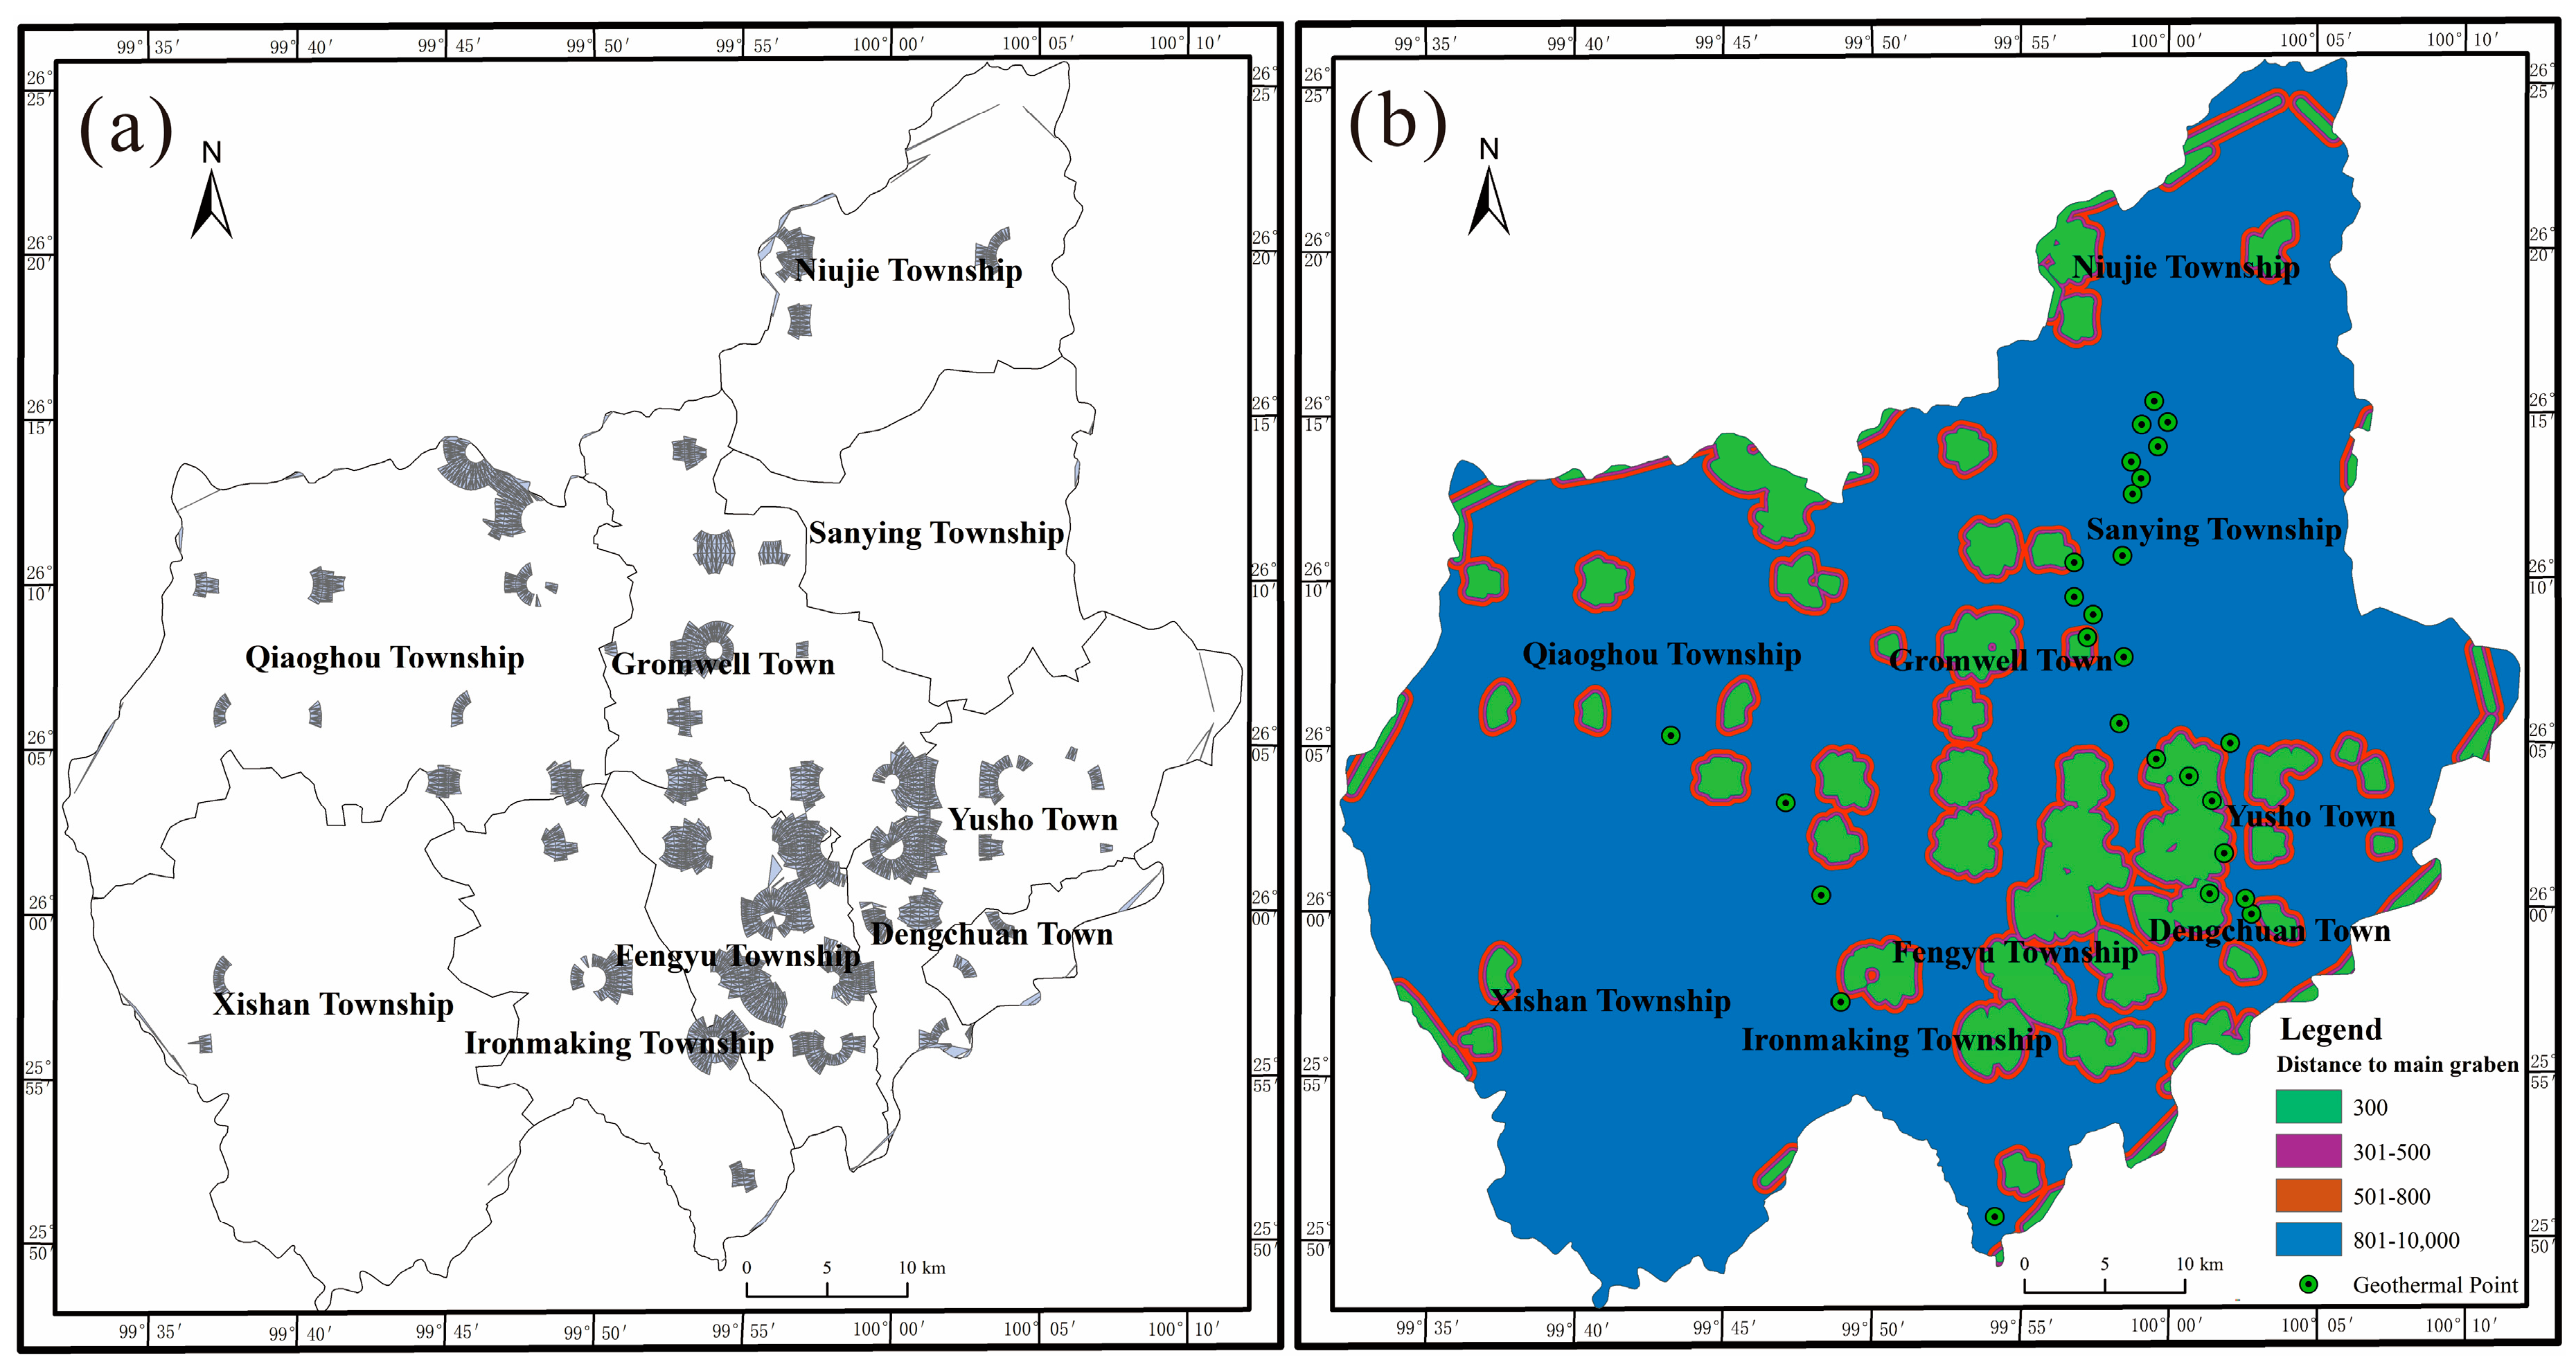
As depicted in
Figure 6b, approximately 29.6% of the geothermal hotspots are situated within a distance of less than 800 m from the primary graben. This suggests that the correlation between the primary graben and geothermal hotspots is comparatively weak when contrasted with other evidential factors. It is important to note, however, that this does not preclude the potential impact of the primary graben on the geothermal system through other means, such as influencing the pathways of hydrothermal fluids or affecting the distribution of the geothermal field.
3.2.6. SRTM-DEM Images
SRTM-DEM (Shuttle Radar Topography Mission–Digital Elevation Model) data are obtained from radar instruments onboard space shuttles, providing elevation information about Earth’s surface [
70,
71]. The SRTM-DEM data offer valuable insights for terrain analysis in geothermal exploration [
72]. Terrain features such as mountains, rivers, and faults have a significant impact on the distribution and flow of geothermal energy, affecting underground water pathways and geothermal energy transmission [
73]. Analyzing SRTM-DEM data enables us to understand topographical undulations and variations, thereby inferring the distribution and characteristics of geothermal resources.
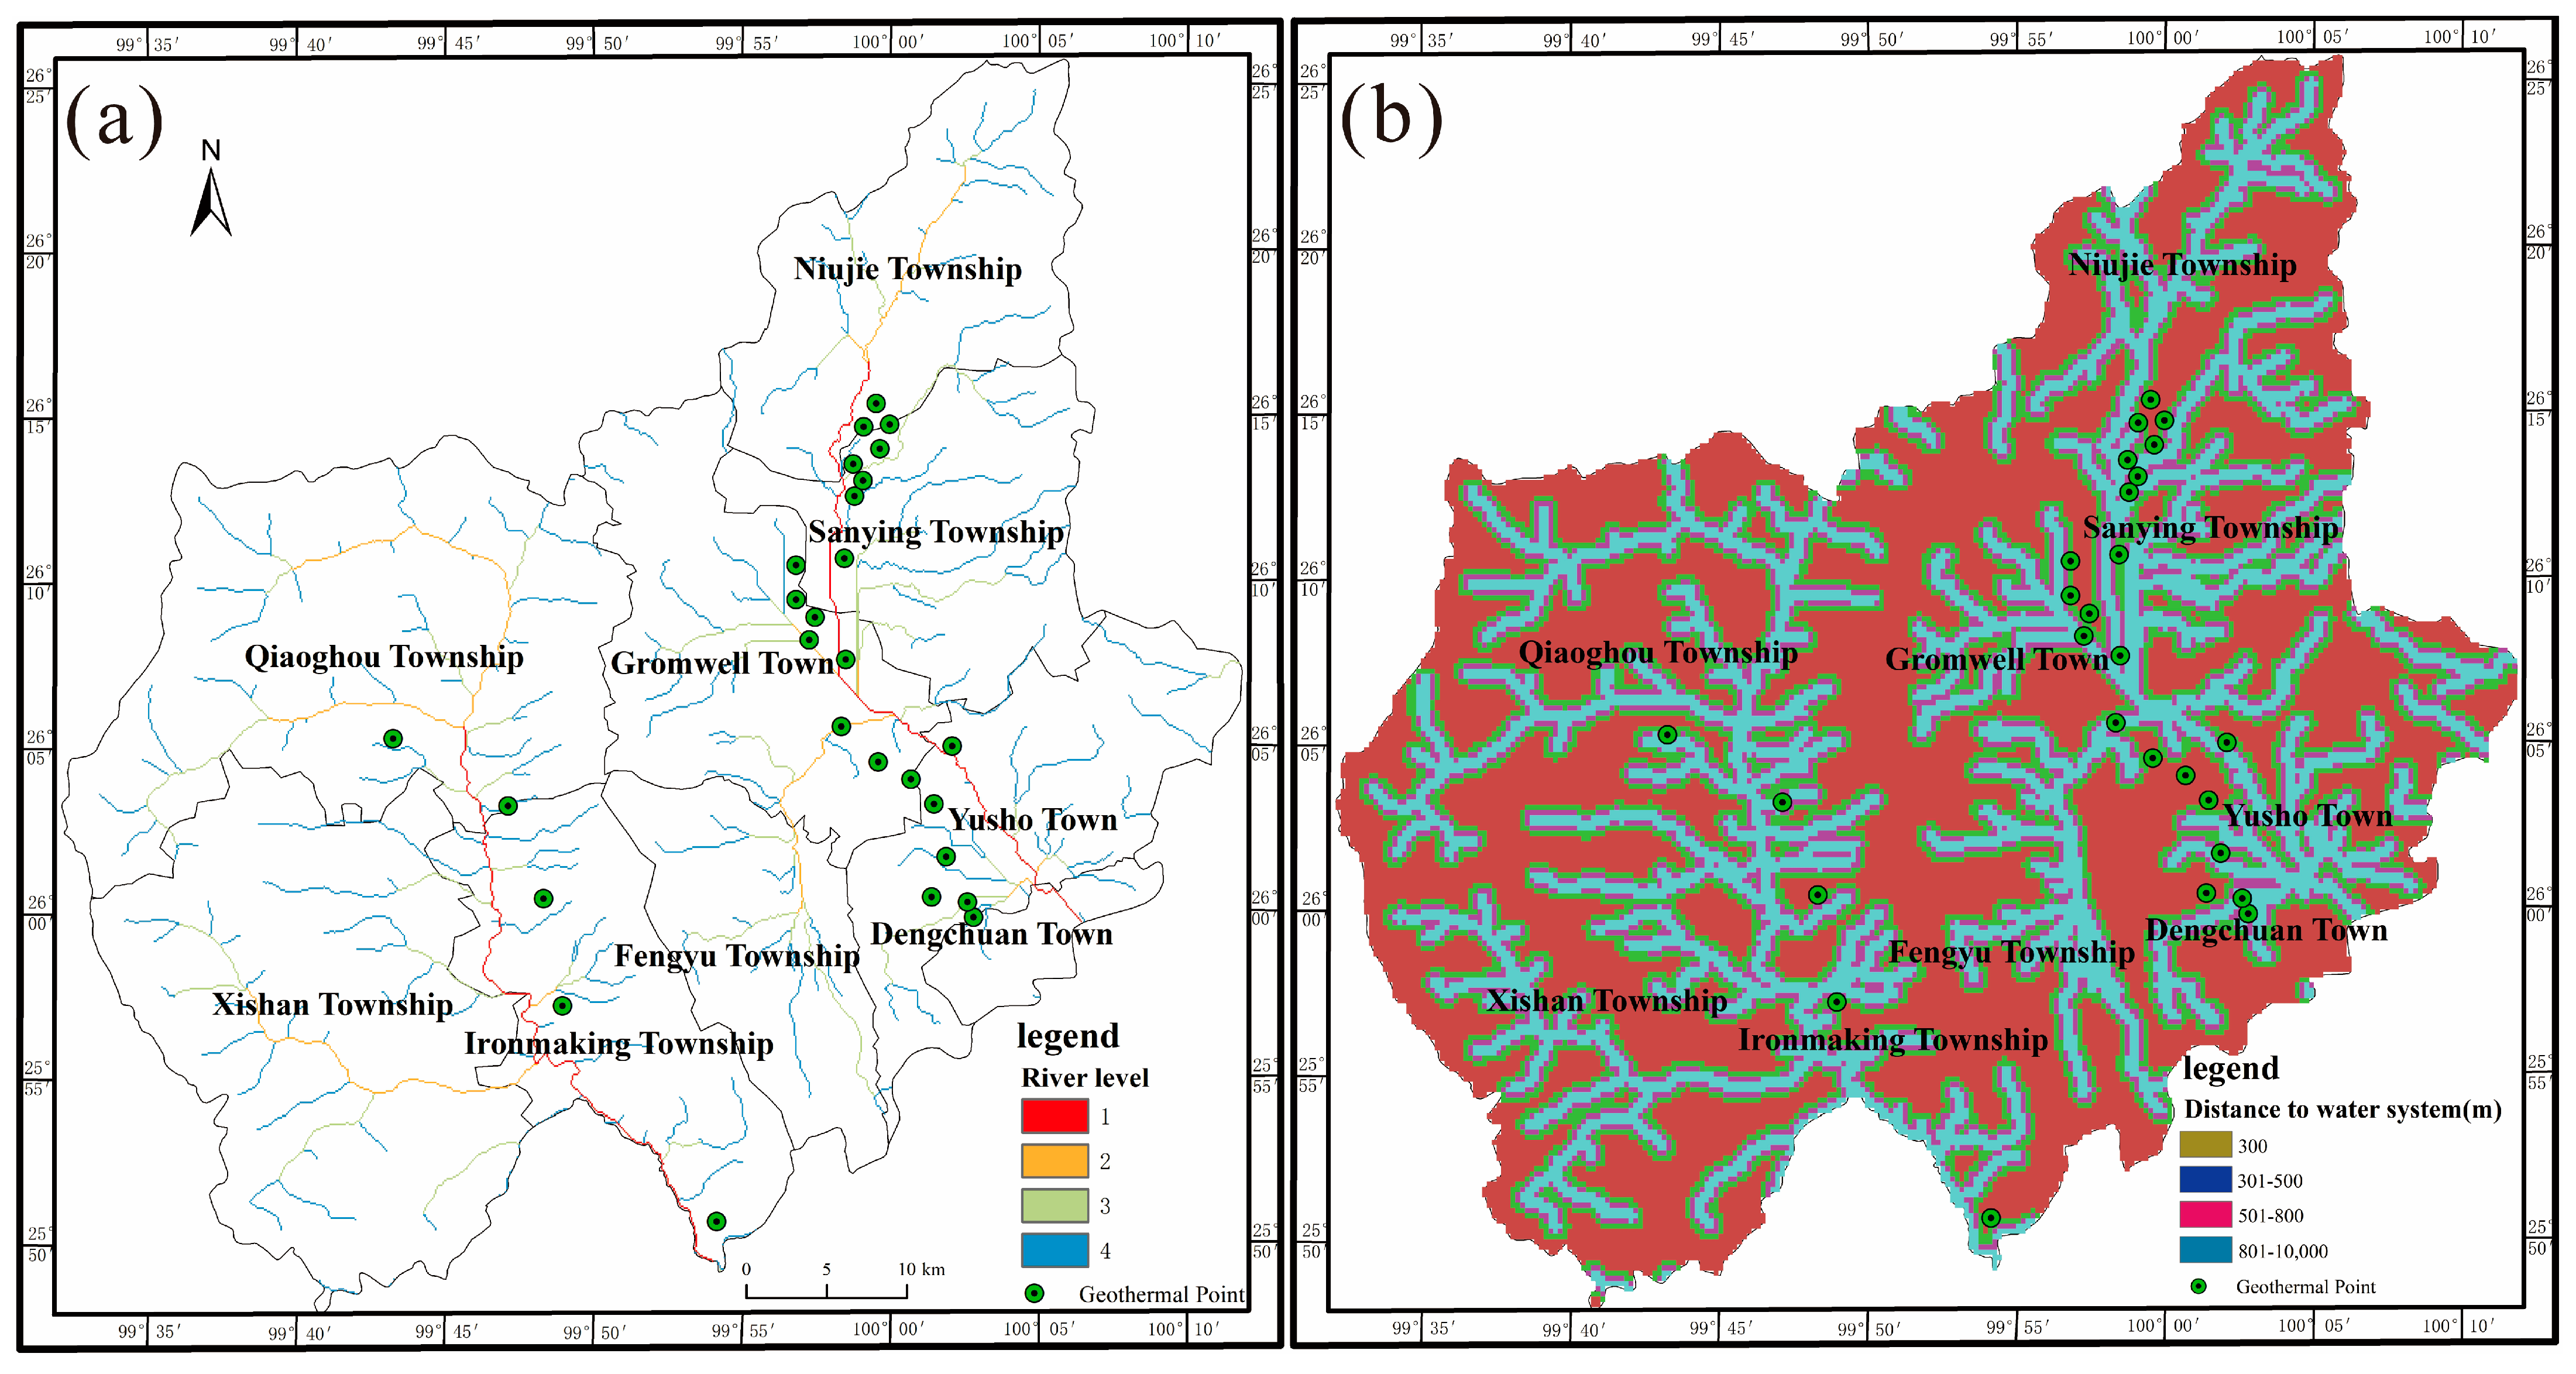
A close relationship exists between water systems and geothermal phenomena. Water systems are essential sources and mediators of geothermal energy, transferring this energy to the surface through groundwater circulation and flow [
74]. Groundwater within water systems can also store geothermal energy, forming geothermal reservoirs. Therefore, understanding the connection between water systems and geothermal energy is crucial for developing and utilizing geothermal resources.
Commonly used surface runoff and overland flow models employ digital elevation models (DEMs) to determine the flow direction of each grid cell in a depression-filled DEM. This is followed by the computation of the accumulation of grid cells along the flow direction, representing flow accumulation. Assuming each grid cell contributes to water flow, flow accumulation represents the water volume of that grid cell.
Based on the aforementioned approach, the two SRTM-DEM images within the study area were merged into a comprehensive dataset using ArcGIS. Further steps included depression filling, flow direction analysis, flow accumulation statistics, the determination of minimum flow paths, and river connectivity. To investigate the relationship between water system distribution and geothermal hotspots, water system distribution was analyzed using buffer analysis to determine the distance to water systems as an influencing factor.
As depicted in
Figure 7b, 77.8% of the water system distribution lies within a distance of 800 m from water systems, indicating a strong relationship between water systems and geothermal hotspots. The distance to water systems can be considered as a supporting factor in the geothermal prediction model.
3.2.7. Establishing Evidence Factor Weights via AHP
The Analytic Hierarchy Process (AHP) is an effective method for addressing multi-objective decision-making systems, seamlessly integrating qualitative and quantitative analyses in a systematic and hierarchical fashion [
75]. By delving deeply into the essence, influential factors, and internal relationships of intricate problems, AHP mathematically formalizes the decision-making process using limited quantitative information, offering a straightforward evaluation approach for complex decision problems characterized by multiple objectives, criteria, and unstructured attributes.
To construct a prediction model of geothermal potential using AHP, the following steps can be undertaken [
76]:
- (1)
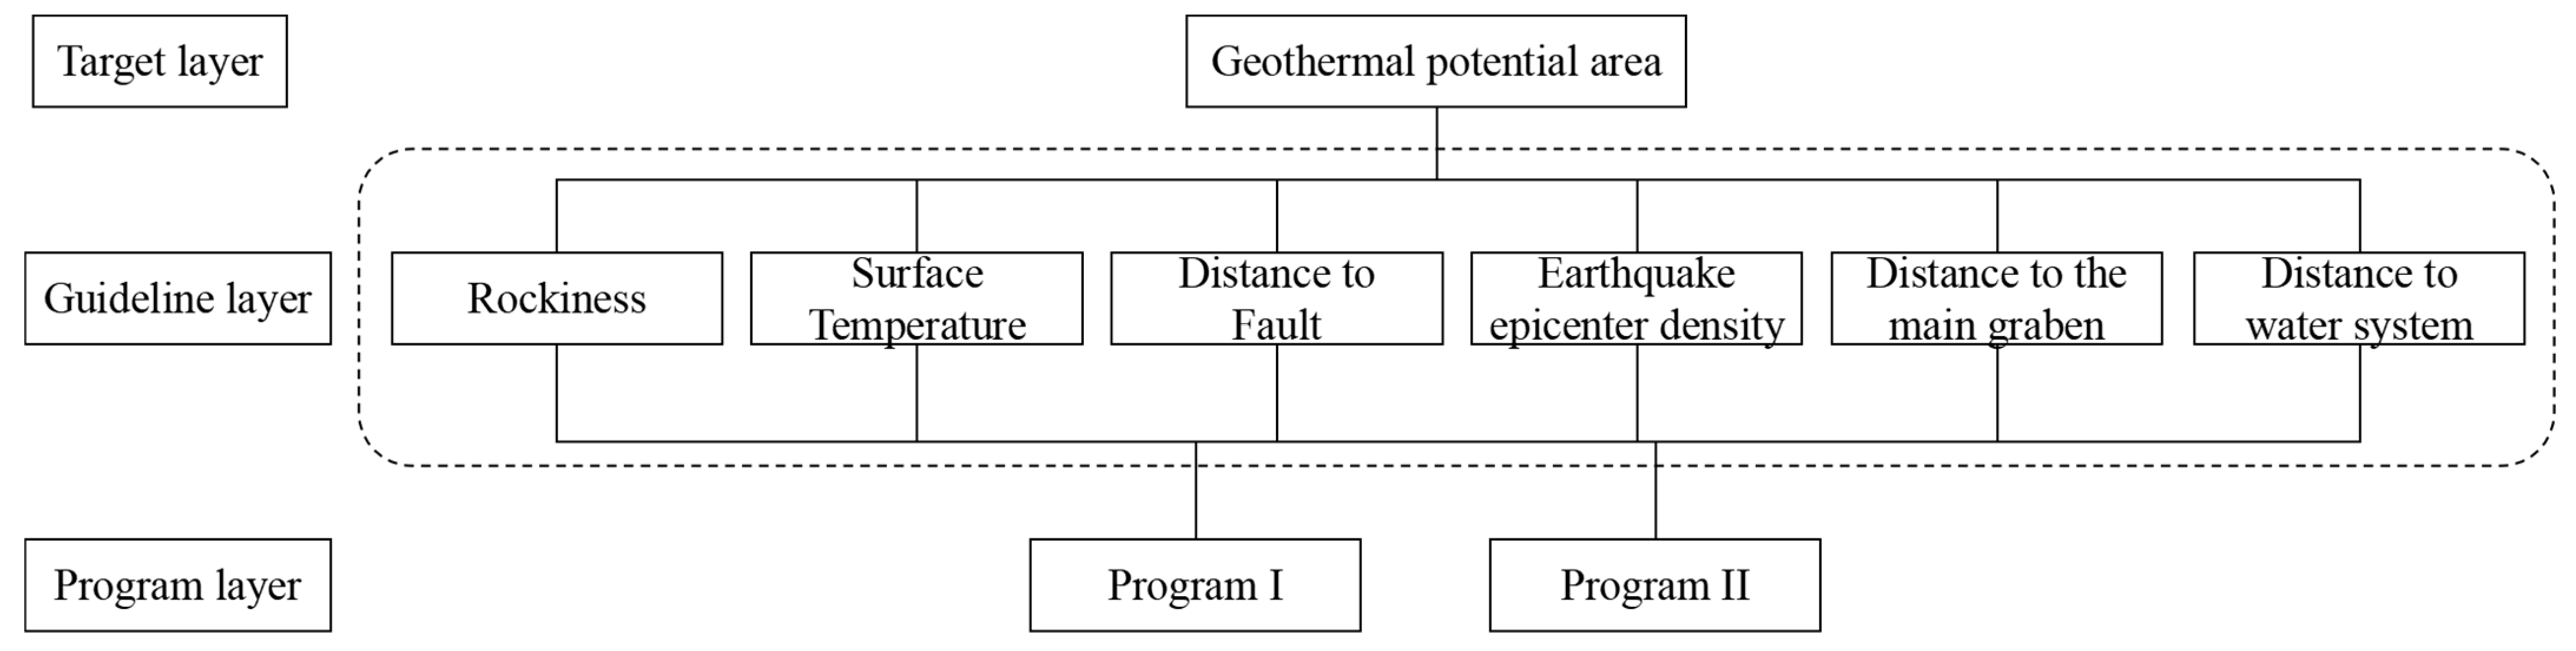
Build the hierarchical structural model [
77]: The objective layer pertains to the prediction of geothermal potential zones. This layer comprises a single element representing the model’s prediction outcomes and objectives. The criterion layer encompasses elements like lithology, surface temperature, distance to faults, seismic epicenter density, distance to main grabens, and proximity to water systems. This layer includes multiple elements, functioning as an intermediary to achieve the objective layer and serving as evidential factors for the prediction model. The alternative layer comprises diverse measures and schemes for achieving the objective layer.
- (2)
Develop the judgment matrix: Assuming the elements in the objective layer are denoted as C and the elements in the criterion layer are denoted as A1, A2, …, Am, and using the elements in the objective layer C as criteria, the relative significance of the elements in the criterion layer is compared to establish their weights. This process forms the judgment comparison matrix, as demonstrated below:
The notation “aij” represents the importance of A
1 relative to A
2 with respect to the objective C. The numerical values and their corresponding meanings are presented in the following table (
Table 2):
- (3)
Calculate the maximum eigenvalue λmax and the corresponding normalized eigenvector W = (w1, …, wm)T for the judgment matrix A. The vector W represents the weights of each criterion element relative to a certain element in the previous level.
The calculation of λ
max and W is as follows [
78]:
Compute the product Mi for each row of the judgment matrix:
Calculate the mth root of Mi
⋯⋯
] Tand normalize
, i.e.,
then,
⋯⋯
]T is the desired eigenvector;
Calculate the maximum characteristic root λ
max of the judgment matrix:
where (AW)
i denotes the i-th element of vector AW.
The steps of the consistency test of the judgment matrix are as follows:
- (1)
Calculate the consistency index CI:
- (2)
Find the corresponding average random consistency index RI:
- (3)
Calculate the consistency ratio CR:
- (4)
When CR < 0.01, the consistency of the judgment matrix is considered acceptable, indicating that the weight assignment is reasonable and credible.
3.2.8. Weighted Stacking Technology
The weighted overlay technique is a commonly used mathematical and engineering method for combining multiple signals or data to obtain a comprehensive result [
79]. It finds wide applications in various fields, such as signal processing [
80], image processing [
81], machine learning [
82], and more. In this study, the weighted overlay technique is employed to spatially integrate multiple evidence weight factors and generate the geothermal potential map of the research area. This tool needs to be run in the ArcGIS environment, and the application of standard value ratios across all different input data is crucial for effective integration [
83].
The weighted overlay method consists of the following steps:
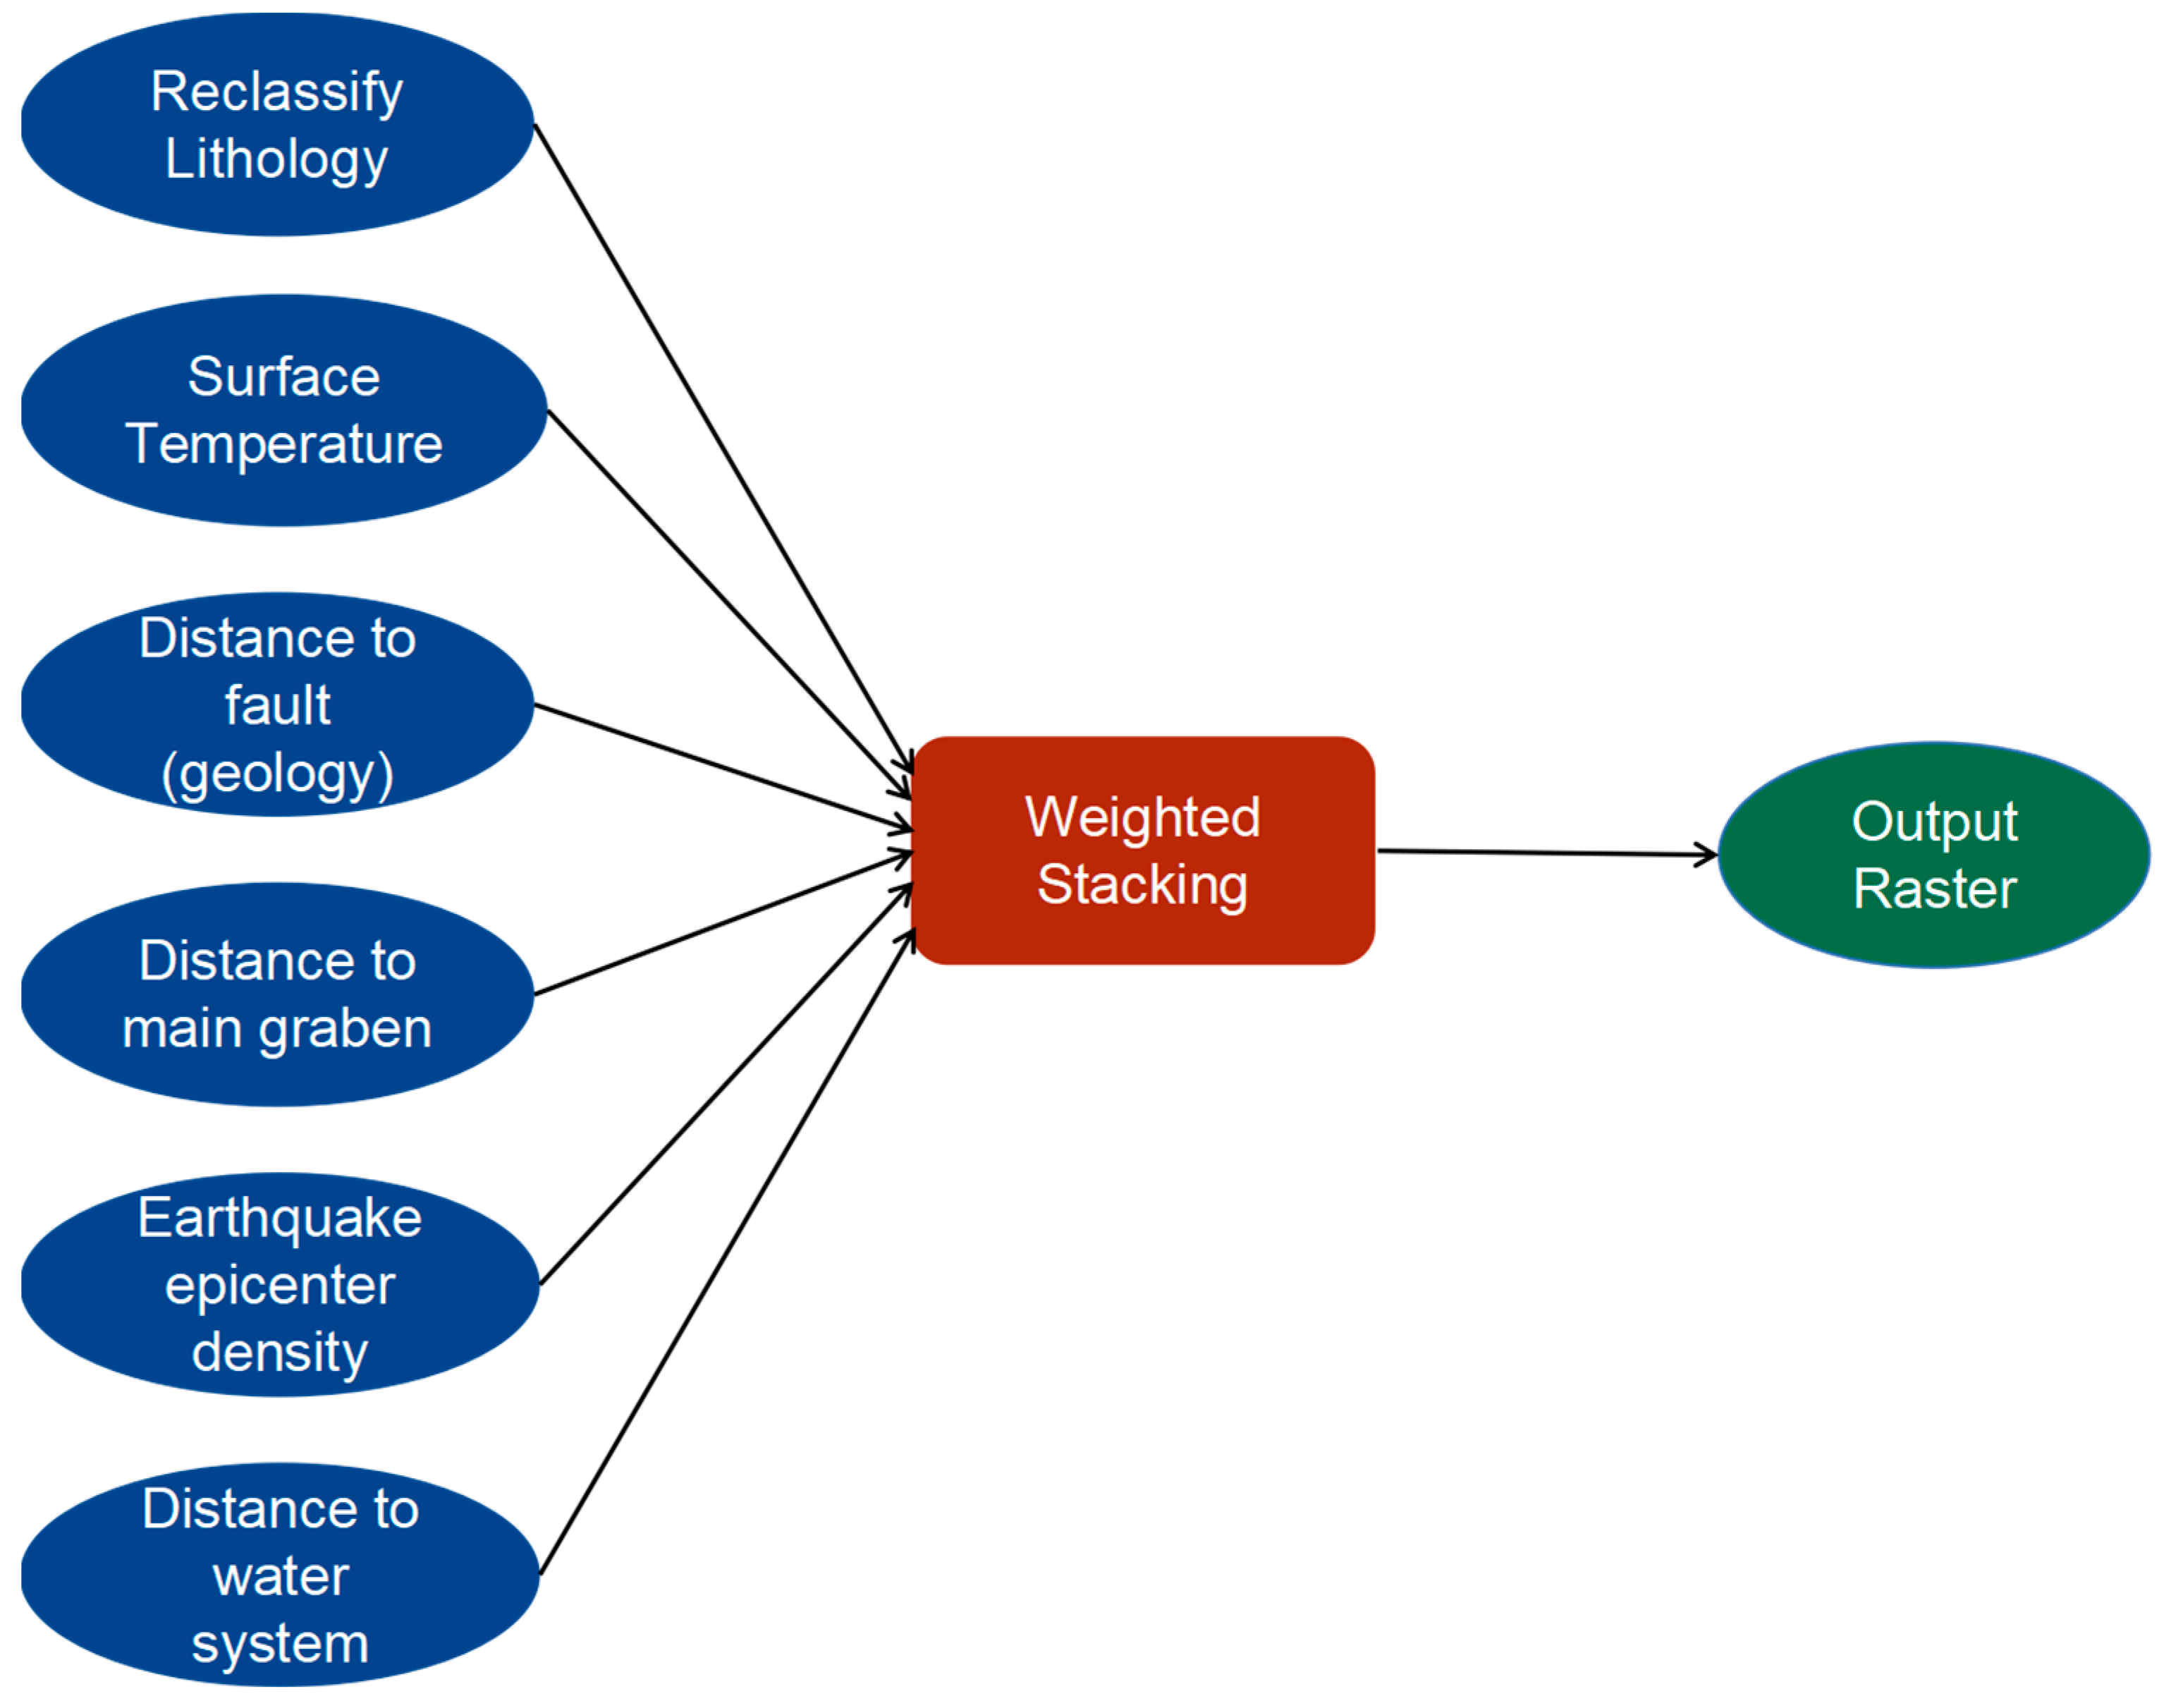
- (1)
Reclassify the values in the input raster to have the same assessment level (suitability or priority and risk) or some similar unified level. In this study, the input rasters include lithology, surface temperature, distance to faults, distance to the main grabens, seismic epicenter density, and distance to water systems(
Figure 8).
- (2)
Multiply the pixel values of each input raster by their respective importance weights.
- (3)
Sum up the results of each weighted input raster to generate the output raster.
The mathematical expression of the weighted overlay technique [
84] can be represented as
where output is the final comprehensive result; w
1, w
2, …, w
n are the corresponding weights; and Input
1, Input
2, …, Input
n are the input signals or data.
4. Results
By utilizing GIS, remote sensing, and geophysical techniques, multiple data were transformed into evidence factor layers, which were then integrated using the weighted overlay tool, and the results were presented in map format.
4.1. Lithology and Surface Temperature
In the study area, sedimentary rocks are widely distributed [
23], with carbonate rocks being the predominant lithology for potential thermal reservoirs. Taking this geological background into consideration, the analysis of lithology prioritizes carbonate rocks. Consequently, various rock types in the study area were classified, leading to the creation of a reclassified lithology map based on the 1:200,000 geological map (
Figure 2b). Based on field exploration, carbonate rocks, clastic rocks, and volcanic/metamorphic rocks are assigned high, medium, and low importance levels for geothermal resources, respectively.
A thorough examination of the lithology map (
Figure 2b) and the surface temperature map (
Figure 3b) reveals that the areas with the greatest geothermal significance, characterized by carbonate rocks, are exposed in Niu Street Township, Sanying Township, Yousuo Township, and Dengchuan Township. In the western region beyond Luoping Mountain, extensive outcrops of clastic rocks with medium importance are identified. In the eastern region east of Luoping Mountain, extensive exposures of volcanic/metamorphic rocks with low importance are observed.
Figure 3b highlights that the surface temperature in the eastern region of Eryuan is relatively higher than that in the western region. Along the line connecting Niu Street Township, Sanying Township, Yousuo Township, and Dengchuan Township, elevated surface temperatures are recorded, indicating that the eastern region of Eryuan exhibits the most favorable geothermal conditions.
4.2. Distance to Faults and Seismic Epicenter Density
The distribution of faults in the Eryuan area is illustrated in
Figure 4a, revealing widespread fault development, with the greatest density observed near Yousuo Township. Most known geothermal hotspots align with fault lines.
Figure 4b displays the distance to faults, with white denoting a distance of 300 m, gray representing a distance between 300 and 500 m, and yellow indicating a distance between 500 and 800 m.
As portrayed in
Figure 5a, earthquakes with a magnitude of 4.3 or higher have occurred in the Sanying–Niu Street and Qiaohou–Fengyu regions. Upon combining the distribution of geothermal hotspots, it is evident that geothermally favorable areas correlate with seismic epicenter magnitudes. Regions with relatively higher seismic epicenter magnitudes are more prone to having hot springs. Furthermore, areas with varying magnitudes of seismic epicenter are more susceptible to geothermal events (
Figure 5b). The B-value can be utilized to describe the frequency distribution of seismic events at distinct magnitudes. A higher B-value indicates a more frequent occurrence of smaller-magnitude earthquakes, along with a rarer occurrence of larger-magnitude earthquakes. Conversely, a lower B-value suggests a more frequent occurrence of larger-magnitude earthquakes, coupled with a rarer occurrence of smaller-magnitude earthquakes. Therefore, in the southern part of the study area, where seismic events of larger magnitudes are most frequent, conditions are more prone to geothermal events.
4.3. Distance to Main Streams and Distance to Water Systems
Through an analysis of the spatial distribution of the primary stream system (
Figure 6a,b), it becomes evident that extensive systems of primary stream are present in the central region of Eryuan County, with the greatest concentration observed in locations like Cibi Lake Town, Fengyu Town, and Dengchuan Town, among others. This pattern points towards a substantial potential for geothermal occurrences in the central part of Eryuan County, particularly in the central-southern areas where prospects are the most promising. The notably high geothermal potential recorded in these regions can be attributed to the prevalence of well-developed karst carbonate rocks in the surrounding vicinity. For instance, in the proximity of Cibi Lake Town, the presence of limestone with robust solubility characteristics has been identified, indicating the likelihood of these areas evolving into high-quality reservoirs.
Turning to the water system distribution map (
Figure 7a), distinct colors denote varying grades of water systems. The grading of water systems is based on factors such as river flow and morphology. Different tiers of river networks signify differing accumulative flow rates, with higher grades corresponding to primary streams and lower grades aligning with tributaries. Along the pathways stretching from Dengchuan Town to Sanying Town, and from Liantie Township to Qiaohou Town, two primary water flows exist, while the remainder represent tributaries. It can be discerned from the map that geothermal hotspots align with the main water flows, indicating a robust correlation between water systems and the potential for geothermal events.
In the map of the distance to water systems (
Figure 7b), it is evident that the density of geothermal hotspots intensifies as the proximity to the primary water systems diminishes. The majority of geothermal events occur within the yellow region, which corresponds to the vicinity of approximately 300 m from the water systems.
4.4. Hierarchical Structure Model and Weights
To guarantee the precision and dependability of the prediction model, a multivariate correlation analysis of the impacting factors was conducted within the ArcGIS environment using the “Band Set Statistics” tool. The objective of this analysis is to validate whether a high degree of correlation exists among the influencing factors, thereby ensuring their independence within the model. The resultant correlation matrix depicts the correlation coefficient value, elucidating the interrelationship between the two datasets. The correlation linking two layers serves as a gauge of their interdependence. This correlation is the quotient of the covariance between the two layers divided by the product of their standard deviations. As a correlation is a ratio, it is dimensionless. The formula for calculating correlation is outlined as follows:
Correlations span a range from −1 to +1. Positive correlations signify a direct relationship between two layers; for instance, when the pixel value of one layer increases, the pixel value of the other layer may also increase. Conversely, a negative correlation indicates an inverse relationship, where one variable varies as the other changes. A correlation of 0 denotes no dependency between the two layers. Upon observing the generated correlation matrix (
Table 3), it becomes apparent that the absolute value of the correlation coefficient between the two layers is nearly equal to 0. This suggests the absence of significant covariance issues among the influencing factors in our study. The outcome of this analysis further reinforces the credibility of our predictive model. By addressing multicollinearity, we have ensured that each influencing factor in our model can autonomously contribute valid information to predict geothermal potential. Consequently, our prediction model is deemed reliable when considering each individual influencing factor.
The constructed hierarchical structure model is shown in
Figure 9. The objective layer represents the prediction of areas with geothermal potential, while the criteria layer consists of evidence factors such as lithology, surface temperature, distance to faults, seismic focal density, distance to main streams, and distance to water systems. These evidence factors play different roles in predicting the occurrence of geothermal events to varying degrees. By constructing the evidence weight matrix (
Table 4), pairwise comparisons are made among the evidence factors. Finally, the weights of each evidence factor in the geothermal prediction process are determined.
After the hierarchical structure model was constructed based on the identified evidence factors, the weights of each evidence factor were determined as accurately as possible through expert scoring and other methods (
Table 5). It can be observed that the weights of lithology, surface temperature, distance to faults, seismic focal density, distance to main streams, and distance to water systems are 0.35576, 0.1153, 0.1674, 0.0716, 0.0338, and 0.2546, respectively. It is evident that lithology and distance to water systems have the most significant impact among the various influencing factors affecting geothermal events. Therefore, in the subsequent geothermal potential area prediction process, particular attention should be given to these two factors.
5. Discussion
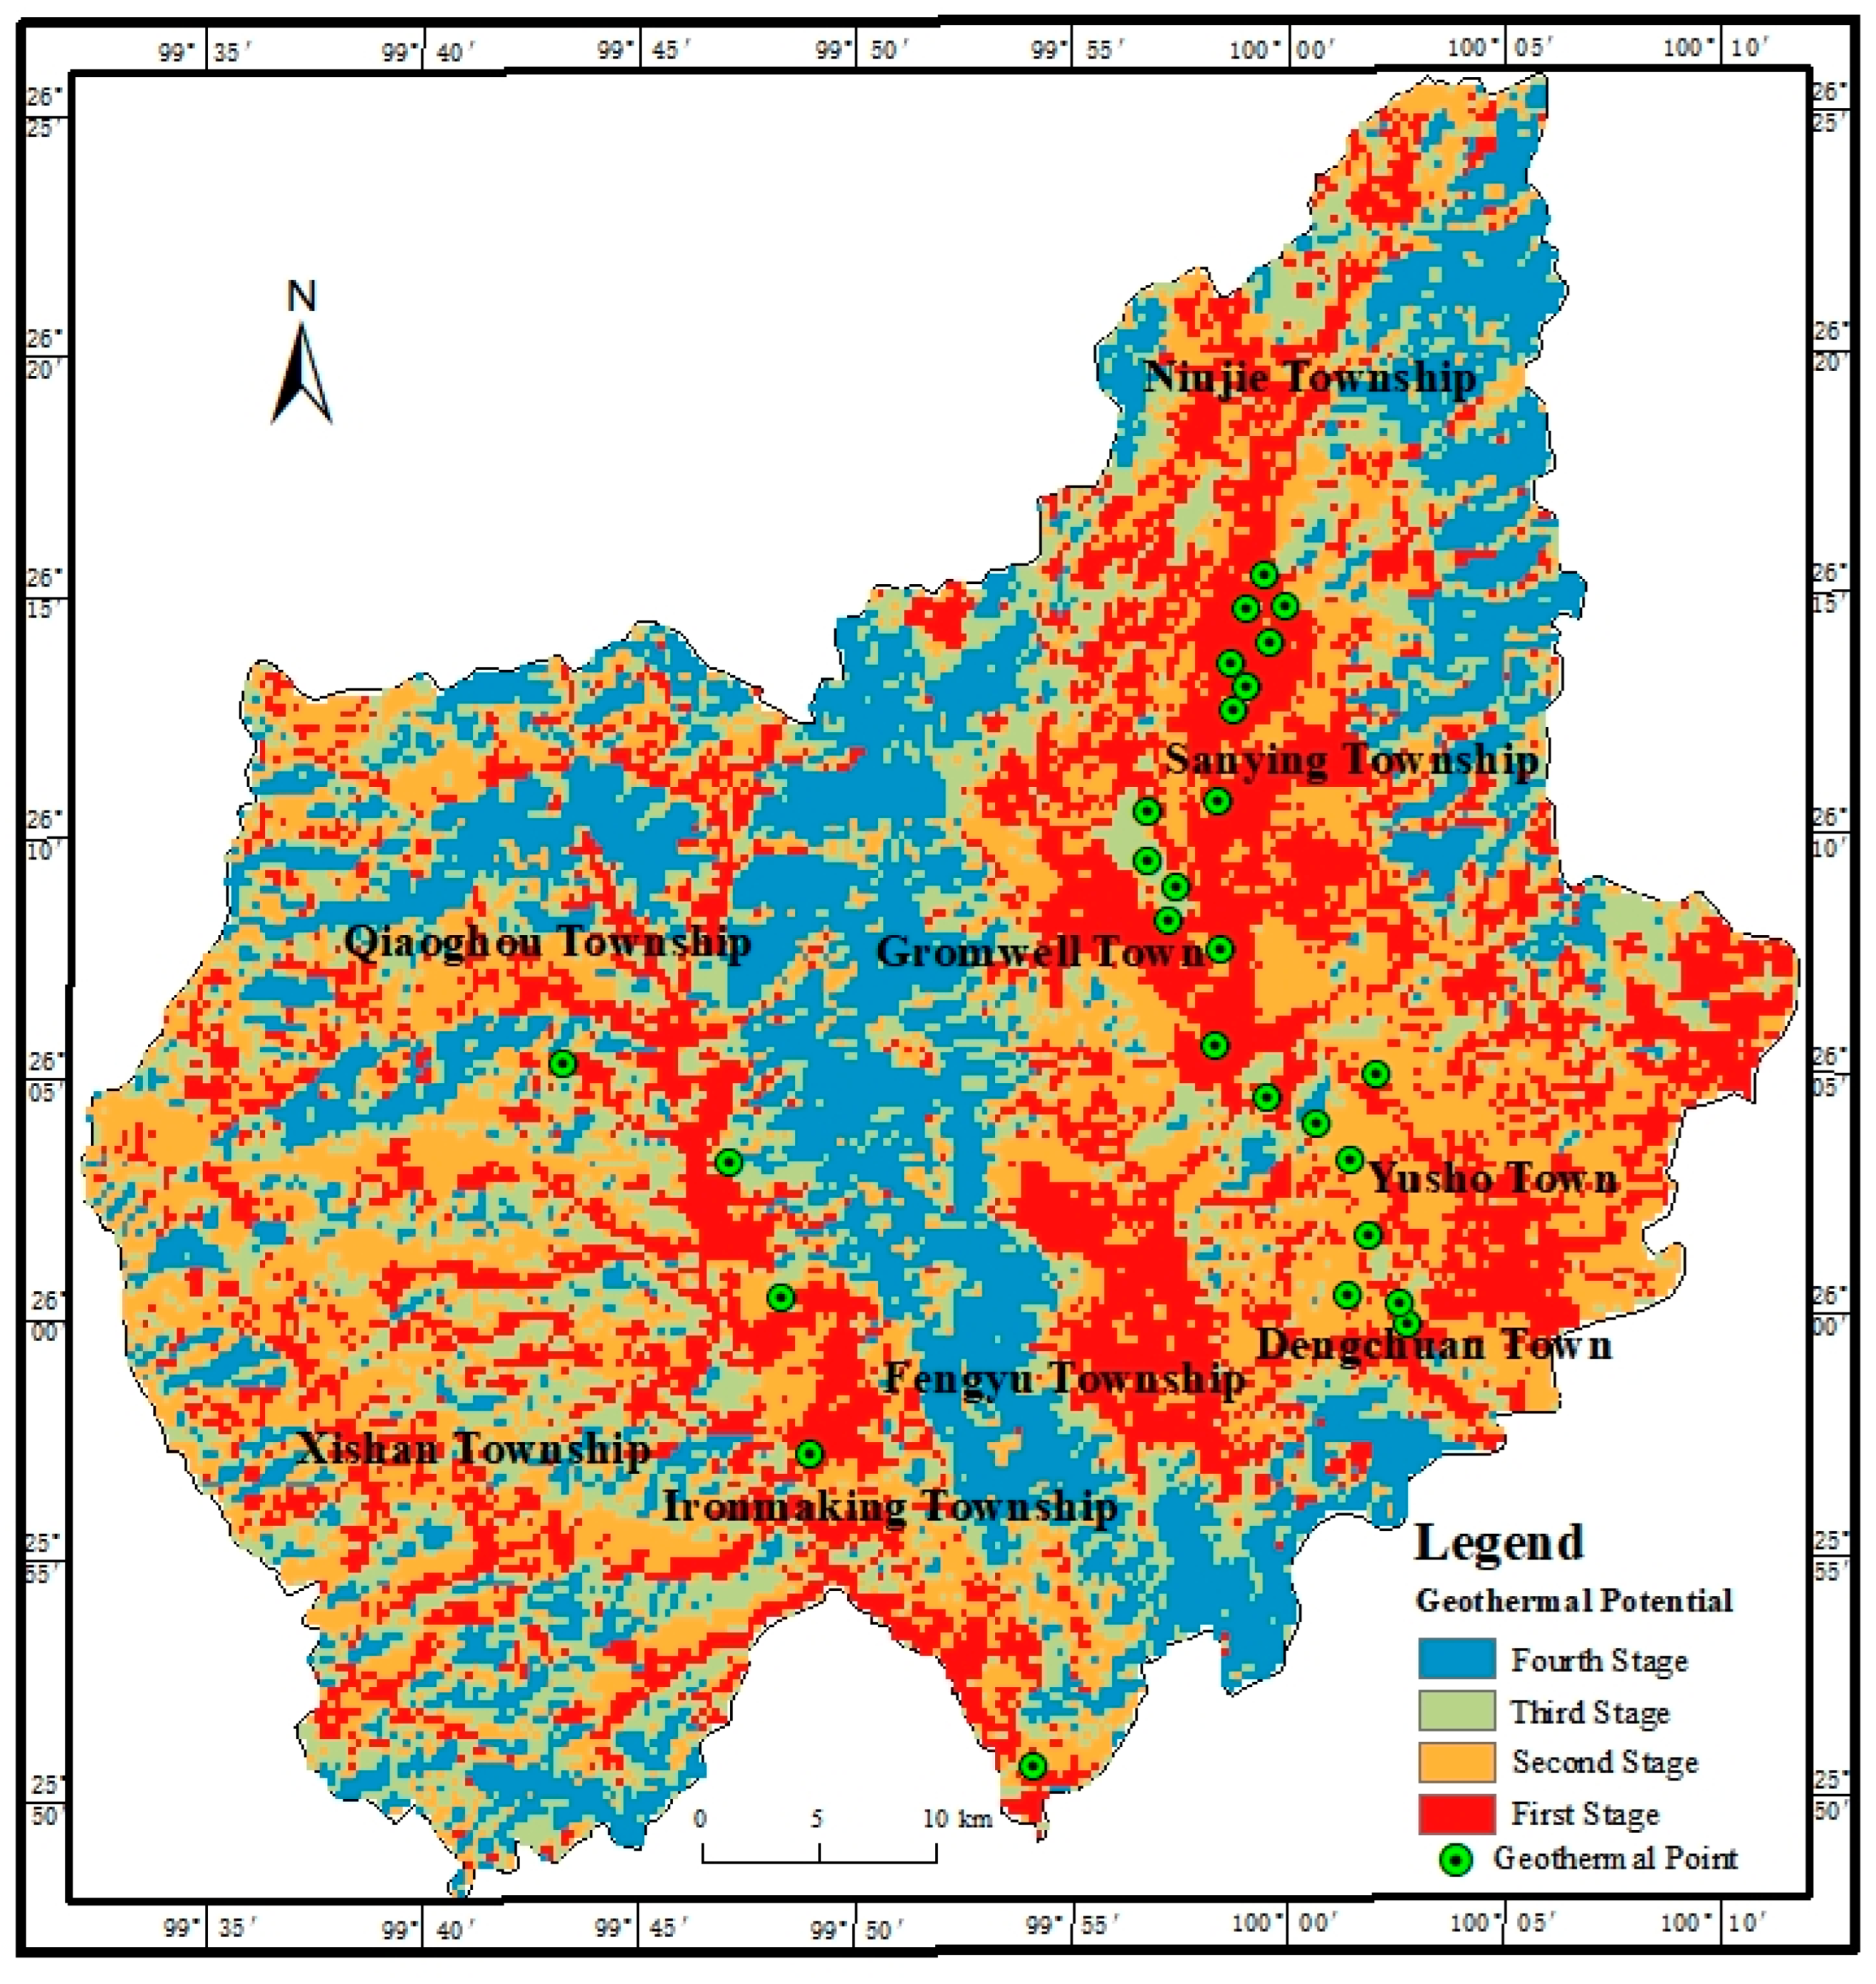
The geothermal potential map (
Figure 10), created by integrating various input layers (thematic maps), depicts diverse ranges of favorable areas to varying extents. The research area has been classified into four levels based on geothermal potential values: Level 1 (red) signifies the extremely favorable area, Level 2 (yellow) represents the highly favorable area, Level 3 (yellow-green) indicates the moderately favorable area, and Level 4 (blue) designates the less favorable area. Overall, as depicted in
Figure 10, with the exception of the central region, Dali County exhibits high geothermal potential values across varying degrees. Particularly noteworthy are the areas encompassing Niu Street–San Ying–Cibi Lake Town and Liantie Township–Qiao Hou Town, which manifest exceedingly high geothermal potential due to the prevalence of carbonate rocks and clastic rocks. Carbonate rocks boast good solubility, while clastic rocks feature favorable porosity, rendering them ideal for heat reservoirs. The inversion map of surface temperatures signifies these two zones as having the highest surface temperatures. Furthermore, significant faults and primary water systems are prominently developed in these regions. The geothermal potential values are marginally lower in Ruo Shuo Town, Deng Chuan Town, and Xi Xiang Town.
Figure 9 reveals that all known geothermal hotspots are situated within the areas with high potential value projected by the model, thus affirming the accuracy and dependability of the model.
In comparison to prior studies conducted in analogous geological settings, this study amalgamates multiple factors such as lithology, seismicity, fault distribution, and Bouguer gravity anomaly. This comprehensive approach provides a deeper understanding of influencing factors on geothermal potential, thereby enhancing the insights compared to previous studies of a similar nature. This study conducts geothermal potential prediction within the Eryuan area of Dali. Despite variations in the geological context, the successful prediction of geothermal potential areas is achieved by employing interdisciplinary methods encompassing remote sensing, GIS, and geophysics. The hierarchical model is utilized, and the model’s accuracy is validated based on existing hot spring sites, showcasing the novelty and applicability of this research.
Nevertheless, it is important to acknowledge a significant limitation that emerged during the course of this study. Due to the confidential nature of magnetic anomaly data, our access to these crucial data was restricted. This limitation could potentially impact the accuracy of our predictive modeling of geothermal potential. Magnetic anomaly data typically play a pivotal role in geological exploration by providing insights into subsurface rock and strata, influencing the assessment and distribution of geothermal resources. The unavailability of magnetic anomaly data may have led to the underutilization of this essential information during the modeling process. Despite this limitation, the study adopts a multidisciplinary approach, integrating various data sources such as lithology, seismic epicenter data, fault distribution, Bouguer gravity anomalies, SRTM-DEM images, Landsat 8 remote sensing images, and hierarchical modeling with the AHP method, to achieve an effective prediction of geothermal potential. Rigorous efforts were made to conduct a thorough analysis within the constraints of available data in an attempt to mitigate potential impacts stemming from this limitation.
Future research endeavors could aim to access more comprehensive geologic and geophysical data to offset existing limitations. Concurrently, data providers are encouraged to consider open data sharing, fostering further advancements in geothermal resource research. Despite data limitations, this study has yielded significant results in the establishment and application of predictive models, offering valuable insights and guidance for future studies of a similar nature.
6. Conclusions
Through a geothermal case study in Eryuan County, we have successfully employed a multi-criteria assessment methodology to preliminarily explore geothermal potential, thus contributing to the global pursuit of renewable energy exploration. This study has identified areas with promising geothermal potential, such as Sanying Town and Commonwealth Lake Town, which warrant further investigation. These surface geothermal indicators have validated the accuracy of the potential geothermal map.
This study has underscored the significance of GIS as a crucial tool for integrating diverse data sources to map significant geothermal prospects, thereby furnishing essential information for geoscientists and the sustainable energy sector to advance the global development of sustainable energy. The integration methods of GIS streamline exploration analysis, mitigate computational complexity, and facilitate cost-effective exploration. These methods offer utility in situations with limited data and can serve as a valuable reference for development in other regions.
In the future, more refined lithology analysis can be conducted in conjunction with geothermal potential prediction to examine the impact of various lithologies on the distribution of geothermal resources, thereby enhancing the precision of the prediction model. Additionally, geological and geophysical data can be incorporated to comprehensively analyze the formation and distribution mechanisms of geothermal resources, leading to the optimization of the prediction model. A more thorough investigation into the transportation and storage mechanisms of geothermal fluids underground is recommended. This should encompass the exploration of fluid flow paths, permeability, and reservoir characteristics, providing a deeper theoretical foundation for the exploration and development of geothermal resources.
Author Contributions
Conceptualization, X.Z. and Y.Z.; data download and acquisition, X.Z. and Y.L.; writing—original draft, X.Z. and Y.Z.; format checking, Y.H. and J.Z. (Jianlong Zhao); supervision, Y.Y. and J.L.; funding acquisition, J.Z. (Jinchuan Zhang) and D.Z. All authors have read and agreed to the published version of the manuscript.
Funding
This study was supported by the Research Program on Key Technologies for the Detection and Development of Medium and Deep Geothermal Energy in Yunnan Province under Grant No. 202302AF080001.
Data Availability Statement
Not applicable.
Acknowledgments
The authors would like to thank China University of Geosciences (Beijing) for their financial support for this research.
Conflicts of Interest
The authors declare no conflict of interest.
References
- Shan, D. Numerical Simulation Study of Wellbore Heat Transfer Coupled with Heat Flow in Random Fractured Reservoir. Master’s Dissertation, Northeast Petroleum University, Daqing, China, 2021. [Google Scholar]
- Wang, G. Development of New Geothermal Energy to Build a Clean, Low-Carbon, Safe and Efficient Energy System. J. Geol. 2020, 94, 1921–1922. [Google Scholar]
- Gao, J. Review of Numerical Simulation Studies on Geothermal Resources Development and Utilization. Geotherm. Energy 2021, 3, 3–11. [Google Scholar]
- Zuo, J. Discussion of Judgment Matrix in Hierarchical Analysis of Hierarchy (AHP). J. Manag. Eng. 1987, 1, 104–105. [Google Scholar]
- Yusuf, A.; San, L.H.; Abir, I.A. A Preliminary Geothermal Prospectivity Mapping Based on Integrated GIS, Remote-Sensing, and Geophysical Techniques around Northeastern Nigeria. Sustainability 2021, 13, 8525. [Google Scholar] [CrossRef]
- Uzelli, T.; Bilgiç, E.; Öztürk, B.; Baba, A.; Sözbilir, H.; Tatar, O. Effects of Seismic Activity on Groundwater Level and Geothermal Systems in İzmir, Western Anatolia, Turkey: The Case Study from October 30, 2020 Samos Earthquake. Turk. J. Earth Sci. 2021, 30, 758–778. [Google Scholar] [CrossRef]
- Veloso, E.E.; Tardani, D.; Elizalde, D.; Godoy, B.E.; Sánchez-Alfaro, P.A.; Aron, F.; Morata, D. A Review of the Geodynamic Constraints on the Development and Evolution of Geothermal Systems in the Central Andean Volcanic Zone (18–28 Lat. S). Int. Geol. Rev. 2020, 62, 1294–1318. [Google Scholar] [CrossRef]
- Nouraliee, J.; Ebrahimi, D.; Dashti, A.; Gholami Korzani, M.; Sangin, S. Appraising Mahallat Geothermal Region using Thermal Surveying Data Accompanied by the Geological, Geochemical and Gravity Analyses. Sci. Rep. 2021, 11, 12190. [Google Scholar] [CrossRef]
- Ali, T.; Haider, W.; Haziq, M.; Khan, M.O.; Hussain, A. The Development and Validation of Correlation Charts to Predict the Undisturbed Ground Temperature of Pakistan: A Step towards Potential Geothermal Energy Exploration. Eng 2023, 4, 1837–1850. [Google Scholar] [CrossRef]
- Kong, W.; Guo, M.; Chen, M.; Guo, N. Research on Zoning Evaluation Method of Shallow Geothermal Energy Suitability Based on Fuzzy AHP. China Min. Ind. 2013, 22, 107–110+113. [Google Scholar]
- Zhang, Y.; Yu, H.; Li, J.; Yu, Z.; Zhang, J. GIS Prediction Modeling of Deep Hydrothermal Geothermal Potential Zones—A Case Study of West Anatolia Region in Turkey. J. Jilin Univ. (Earth Sci. Ed.) 2016, 46, 855–864. [Google Scholar]
- Zuo, L.; Wang, C.; Zou, P.; Du, J.; Jing, H.; Qiu, Y. Evaluation of the Suitability of Medium and Deep Geothermal Exploration in Taizhou Area of Jiangsu Based on ArcGIS. J. Geol. 2021, 45, 75–82. [Google Scholar]
- Alqahtani, F.; Aboud, E.; Ehsan, M.; Naseer, Z.; Abdulfarraj, M.; Abdelwahed, M.F.; El-Masry, N. Geothermal Exploration Using Remote Sensing, Surface Temperature, and Geophysical Data in Lunayyir Volcanic Field, Saudi Arabia. Sustainability 2023, 15, 7645. [Google Scholar] [CrossRef]
- Ma, Y. Deep Geothermal Resources in China: Potential, Distribution, Exploitation, and Utilization. Energy Geosci. 2023, 100209. [Google Scholar] [CrossRef]
- Wei, Y.; Wei, X.; Li, D.; Chen, Y.; Shen, X.; Sun, C. Remote Sensing Image Characterization and Activity Analysis of the Heqing-Eryuan Fault Zone in Northwestern Yunnan. Quat. Res. 2017, 37, 234–249. [Google Scholar]
- Zhao, S. Causal Mechanism and Hazard Zoning of Geologic Hazards in Eryuan County, Yunnan Province. Master’s Dissertation, China University of Geosciences (Beijing), Beijing, China, 2016. [Google Scholar]
- Li, X. Research on Hydrochemical Characteristics and Causes of Niujie Hot Spring in Eryuan County, Yunnan. Master’s Dissertation, China University of Geosciences (Beijing), Beijing, China, 2018. [Google Scholar]
- Yunnan Geology and Mineral Bureau. Geological Monographs of the Ministry of Geology and Minerals of The People’s Republic of China 1 Regional Geology No. 21 Regional Geology of Yunnan Province; Geological Publishing House: Beijing, China, 1990. [Google Scholar]
- Zhang, Y. (Ed.) Rock Stratigraphy of Yunnan Province; China University of Geosciences Press: Wuhan, China, 1996. [Google Scholar]
- Sun, S. Late Paleozoic Sea-Level Changes and Sedimentary Evolution of the Eastern Margin of the Lamping Basin, Western Yunnan. Master’s Dissertation, China University of Geosciences (Beijing), Beijing, China, 2013. [Google Scholar]
- Wang, C.; Deng, J.; Lu, Y.; Bagas, L.; Kemp, A.; Campbell, T. Age, Nature, and Origin of Ordovician Zhibenshan Granite from the Baoshan Terrane in the Sanjiang Region and Its Significance for Understanding Proto-Tethys Evolution. Int. Geol. Rev. 2015, 57, 1922–1939. [Google Scholar] [CrossRef]
- Liao, Z.; Chen, Y.; Wei, Z.; Li, M. Tectonic Evolution of Western Yunnan since the Late Paleozoic. J. Tongji Univ. (Nat. Sci. Ed.) 2003, 09, 1029–1033. [Google Scholar]
- Dong, L.; Wang, P.; Ren, F.; Sun, J.; Niu, H.; Zhou, Y. Sedimentary Record of Late Permian-Late Triassic Basin-Mountain Evolution in the Heqing-Eryuan Area, Western Margin of Yangzi. China Geol. Surv. 2022, 9, 32–40. [Google Scholar] [CrossRef]
- Zhou, Y.; Wang, J.; Zou, G.; Wang, P.; Ren, F.; Dong, L.; Li, J.; Ning, K. Study on the Alluvial Fan-Delta Depositional System of the Lower Triassic Qingtianbao Formation in Junmachang, Eryuan County, Western Yunnan. Sediment. Tethys Geol. 2013, 33, 6–15. [Google Scholar]
- Zhang, J.; Liang, Y.; Liu, W. Modification and Destruction of the Heqing Manganese Deposit in Western Yunnan by Cenozoic Overturning Tectonics and Exploration of the Mine Search Model. Adv. Geosci. 2021, 11, 409. [Google Scholar] [CrossRef]
- Bai, Z.; Wang, C. Stratigraphic Imaging of Wide-Angle Seismic Profiles in Chafang-Binchuan and Menglian-Malong, Yunnan. Geophys. J. 2004, 47, 257–267. [Google Scholar]
- Tong, Z.; Zhang, J.; Li, T. Geological Characteristics and Fluid Inclusions of the Penjieshan Antimony Deposit, Western Yunnan. J. Petrol. 2016, 32, 2379–2391. [Google Scholar]
- Chen, Z.; Chang, R.; Zhao, W.; Li, S.; Guo, H.; Xiao, K.; Wu, L.; Hou, D.; Zou, L. Quantitative Prediction and Evaluation of Geothermal Resource Areas in the Southwest Section of the Mid-Spine Belt of Beautiful China. Int. J. Digit. Earth 2022, 15, 748–769. [Google Scholar] [CrossRef]
- Wu, Y.; Zhou, X.; Zhuo, L.; Tao, G.; Ma, J.; Wang, Y. Structural Controls of the Northern Red River Fault Zone on the Intensity of Hydrothermal Activity and Distribution of Hot Springs in the Yunnan-Tibet Geothermal Belt. Geothermics 2023, 109, 102641. [Google Scholar] [CrossRef]
- Xu, S.; Guo, Y. Fundamentals of Geothermics; Science Press: Beijing, China, 2009. [Google Scholar]
- Deng, C.; Xiang, P. The Chitosan/Zeolite Composite Adsorbed Fluoride Ions from Eryuan Hot Spring Water in Yunnan Province. In Proceedings of the IOP Conference Series: Earth and Environmental Science, Manchester, UK, 17–18 September 2020; IOP Publishing: Bristol, UK, 2020; Volume 514, p. 052039. [Google Scholar]
- Li, J. Urban Transformative Tourism: A Case Study of Dali City, China. AU-HIU Int. Multidiscip. J. 2022, 2, 62–74. [Google Scholar]
- Sajib, M.Q.U.; Wang, T. Estimation of Land Surface Temperature in an Agricultural Region of Bangladesh from Landsat 8: Intercomparison of Four Algorithms. Sensors 2020, 20, 1778. [Google Scholar] [CrossRef]
- Kumar, N.; Hazarika, D.; Sain, K. Earthquakes: Basics of Seismology and Computational Techniques. In Basics of Computational Geophysics; Elsevier: Amsterdam, The Netherlands, 2021; pp. 47–80. [Google Scholar]
- Rodkin, M.V.; Liperovskaya, E.V. On the Difference in Physical Mechanisms of Earthquakes at Different Depths and Their Ionospheric Response. Izv. Phys. Solid Earth 2023, 59, 377–390. [Google Scholar] [CrossRef]
- Julzarika, A.; Aditya, T.; Subaryono, S.; Harintaka, H. Vertical Accuracy Evaluation of Digital Terrain Model (DTM) ALOS PALSAR-2 in Rote Dead Sea Area-Indonesia. Geod. List 2021, 75, 9–28. [Google Scholar]
- Meng, Q.; Liu, J.; Pu, H.; Huang, B.; Zhang, Z.; Wu, J. Effects of Cyclic Loading and Unloading Rates on the Energy Evolution of Rocks with Different Lithology. Geomech. Energy Environ. 2023, 34, 100455. [Google Scholar] [CrossRef]
- Juncu, D.; Árnadóttir, T.; Geirsson, H.; Gunnarsson, G. The Effect of Fluid Compressibility and Elastic Rock Properties on Deformation of Geothermal Reservoirs. Geophys. J. Int. 2019, 217, 122–134. [Google Scholar] [CrossRef]
- Liu, K.; Zhang, Y.; He, Q.; Zhang, S.; Jia, W.; He, X.; Zhang, H.; Wang, L.; Wang, S. Characteristics of Thermophysical Parameters in the Wugongshan Area of South China and Their Insights for Geothermal Genesis. Front. Environ. Sci. 2023, 11, 1112143. [Google Scholar] [CrossRef]
- Jiang, Y.; Lin, W. A Comparative Analysis of Retrieval Algorithms of Land Surface Temperature from Landsat-8 Data: A Case Study of Shanghai, China. Int. J. Environ. Res. Public Health 2021, 18, 5659. [Google Scholar] [CrossRef] [PubMed]
- Zhao, F.; Peng, Z.; Qian, J.; Chu, Z.; Zhao, Z.; Chao, J.; Xu, S. Detection of Geothermal Potential Based on Land Surface Temperature Derived from Remotely Sensed and In-Situ Data. Geo-Spat. Inf. Sci. 2023, 1–17. [Google Scholar] [CrossRef]
- Liu, N.; Abdullah, J. Inversion of Land Surface Temperature by Remote Sensing Technology: A Case Study of Shapingba District in Chongqing. In Proceedings of the International Conference on Geographic Information and Remote Sensing Technology (GIRST 2022), Kuala Lumpur, Malaysia, 11–12 February 2023; SPIE: Bellingham, WA, USA, 2023; Volume 12552, pp. 503–508. [Google Scholar]
- Moisa, M.B.; Dejene, I.N.; Merga, B.B.; Gemeda, D.O. Impacts of Land Use/Land Cover Dynamics on Land Surface Temperature Using Geospatial Techniques in Anger River Sub-Basin, Western Ethiopia. Environ. Earth Sci. 2022, 81, 99. [Google Scholar] [CrossRef]
- Ali, S.A.; Parvin, F.; Ahmad, A. Retrieval of Land Surface Temperature from Landsat 8 OLI and TIRS: A Comparative Analysis between Radiative Transfer Equation-Based Method and Split-Window Algorithm. Remote Sens. Earth Syst. Sci. 2022, 6, 1–21. [Google Scholar] [CrossRef]
- Dong, B.; Dong, S.; Wang, Y.; Wen, F.; Yu, C.; Zhou, J.; Song, R. Detecting Geothermal Resources in a Plateau Area: Constraints from Land Surface Temperature Characteristics Using Landsat 8 Data. Front. Earth Sci. 2022, 10, 785900. [Google Scholar] [CrossRef]
- He, J.; Luan, W.L.; Ma, N.; Sun, H. Retrieval of Land Surface Temperature from Landsat 8 Data of the Dandong-Liaoyang Geothermal Area. Res. Sq. 2020, 1–34. [Google Scholar] [CrossRef]
- Morata, D.; Gallardo, R.; Maza, S.; Arancibia, G.; López-Contreras, C.; Mura, V.; Cannatelli, C.; Reich, M. Hydrothermal Alteration in the Nevados de Chillán Geothermal System, Southern Andes: Multidisciplinary Analysis of a Fractured Reservoir. Minerals 2023, 13, 722. [Google Scholar] [CrossRef]
- Wang, Y.; Ma, F.; Xie, H.; Wang, G.; Wang, Z. Fracture Characteristics and Heat Accumulation of Jixianian Carbonate Reservoirs in the Rongcheng Geothermal Field, Xiong’an New Area. Acta Geol. Sin.-Engl. Ed. 2021, 95, 1902–1914. [Google Scholar] [CrossRef]
- Wang, G.; Kuang, J. Genetic Analysis of Geothermal Resources in Deep-Seated Fault Area in Tonghe County, Northeast China and Implications of Geothermal Exploration. Sustainability 2022, 14, 5431. [Google Scholar] [CrossRef]
- Wu, Y.; Zhou, X. Structural Control Effects on Hot Springs’ Hydrochemistry in the Northern Red River Fault Zone: Implications for Geothermal Systems in Fault Zones. J. Hydrol. 2023, 623, 129836. [Google Scholar] [CrossRef]
- Acosta, F.; Moeck, I.S. Influence of Normal Faults on Geothermal Reservoir Performance: Insights from Numerical Modeling. Geothermics 2019, 77, 10–22. [Google Scholar]
- Acosta, F.; Moeck, I.S. Modeling the Impact of High-Angle Normal Faults on Geothermal Reservoir Performance: A Parametric Study. Geothermics 2021, 92, 101990. [Google Scholar]
- Selvaggi, G.; Amoroso, O.; Chiarabba, C.; De Gori, P. Effects of Normal Faulting on the Larderello-Travale Geothermal System (Italy) Inferred from Seismic Anisotropy. Geothermics 2018, 75, 98–108. [Google Scholar]
- Duwiquet, H.; Arbaret, L.; Guillou-Frottier, L.; Heap, M.J.; Bellanger, M. On the Geothermal Potential of Crustal Fault Zones: A Case Study from the Pontgibaud Area (French Massif Central, France). Geotherm. Energy 2019, 7, 33. [Google Scholar] [CrossRef]
- Fu, L.; Li, S.; Sun, Y.; Wang, H. Simulation of Fault-Controlled Fluid Flow in Enhanced Geothermal Systems. J. Volcanol. Geotherm. Res. 2019, 371, 18–30. [Google Scholar]
- Meng, X.; Wang, C.; Zhang, Y. Influence of Fault Activation on Hydraulic Connectivity of Geothermal Reservoirs. J. Volcanol. Geotherm. Res. 2020, 396, 106826. [Google Scholar]
- Heidbach, O.; Reiter, K.; Ziegler, M. Integrating Stress and Fluid Flow Predictions for Geothermal Reservoir Management: A Case Study from the North German Basin. Geothermics 2019, 80, 178–191. [Google Scholar]
- Gudmundsson, A. Transport of Geothermal Fluids along Dikes and Fault Zones. Energies 2022, 15, 7106. [Google Scholar] [CrossRef]
- da Silva, S.L.E.F. κ-Generalized Gutenberg–Richter Law and the Self-Similarity of Earthquakes. Chaos Solitons Fractals 2021, 143, 110622. [Google Scholar] [CrossRef]
- Meng, Z.; Liu, J.; Xie, Z.; Lv, Y. Correlation Analysis between Spatial and Temporal Distribution Characteristics of b-Value and Seismic Hazard. Adv. Geophys. 2021, 36, 30–38. [Google Scholar]
- Chen, K.P.; Chang, W.Y.; Yen, H.Y. Forecasting Methodology Based on Alternative Presentation of the Gutenberg–Richter Relation. Pure Appl. Geophys. 2019, 176, 3411–3423. [Google Scholar] [CrossRef]
- Balogun, O.B.; Osazuwa, I.B. The Gravity Field and Gravity Data Reduction across the Continental Area of Nigeria. Geod. Geodyn. 2023, 14, 304–320. [Google Scholar] [CrossRef]
- Abubakar, A.; Likkason, O.K. Exploring the Application of Potential Field Gravity Method in Characterizing Regional-Trends of the Earth’s Sequence System over the Sokoto Basin. Geod. Geodyn. 2022, 13, 67–75. [Google Scholar]
- Yang, Y.; Wang, S.; Pan, Y.; Gao, G. Study on the Distribution Characteristics of Gravity Anomalies in Sichuan-Yunnan Area. J. Yunnan Univ. (Nat. Sci. Ed.) 2021, 43, 921–928. [Google Scholar]
- Zhang, J.; Yang, Y.; Zhang, L. Study on the Spatial Distribution Pattern of Concealed Rock Bodies in Western Zhen’an Based on Gravity Anomaly. Phys. Chem. Explor. 2023, 47, 618–627. [Google Scholar]
- Eppelbaum, L.V.; Ben-Avraham, Z.; Katz, Y.I.; Cloetingh, S.; Kaban, M.K. Giant Quasi-Ring Mantle Structure in the African–Arabian Junction: Results Derived from the Geological–Geophysical Data Integration. Geotectonics 2021, 55, 58–82. [Google Scholar] [CrossRef]
- Sokol, S.A. Late Cenozoic Displacement Transfer Analysis Within Deep Springs Valley, Eastern California with Gravity Modeling; The University of Texas at Dallas: Richardson, TX, USA, 2019. [Google Scholar]
- Ait Lemkademe, A.; El Ghorfi, M.; Zouhri, L.; Heddoun, O.; Khalil, A.; Maacha, L. Origin and Salinization Processes of Groundwater in the Semi-Arid Area of Zagora Graben, Southeast Morocco. Water 2023, 15, 2172. [Google Scholar] [CrossRef]
- Gouasmia, M.; Dhahri, F.; Abdelkader, M.; Salhi, I.; Gabtni, H.; Soussi, M. Integrated Hydrogeological Study of a Tectonically Controlled Aquifer System: The Rohia–Sbiba Graben, Central Tunisia. J. Earth Syst. Sci. 2021, 130, 221. [Google Scholar] [CrossRef]
- Li, Y.; Fu, H.; Zhu, J.; Wu, K.; Yang, P.; Wang, L.; Gao, S. A Method for SRTM DEM Elevation Error Correction in Forested Areas Using ICESat-2 Data and Vegetation Classification Data. Remote Sens. 2022, 14, 3380. [Google Scholar] [CrossRef]
- Uuemaa, E.; Ahi, S.; Montibeller, B.; Muru, M.; Kmoch, A. Vertical Accuracy of Freely Available Global Digital Elevation Models (ASTER, AW3D30, MERIT, TanDEM-X, SRTM, and NASADEM). Remote Sens. 2020, 12, 3482. [Google Scholar] [CrossRef]
- Gentana, D.; Sulaksana, N.; Sukiyah, E.; Yuningsih, E.T. Morphotectonics of Mount Rendingan Area Related to the Appearances of Geothermal Surface Manifestations. Indones. J. Geosci. 2019, 6, 291–309. [Google Scholar] [CrossRef]
- Sarkar, D.; Mondal, P.; Sutradhar, S.; Sarkar, P. Morphometric Analysis Using SRTM-DEM and GIS of Nagar River Basin, Indo-Bangladesh Barind Tract. J. Indian Soc. Remote Sens. 2020, 48, 597–614. [Google Scholar] [CrossRef]
- Wang, G.; Lin, W. Formation Mechanism and Genesis Mode of Major Hydrothermal Geothermal Systems in China. J. Geol. 2020, 94, 1923–1937. [Google Scholar]
- Li, H.; Zou, G.; Zhang, K.; Rong, Y.; Zhu, J.; Liu, Y.; Li, G. Selection of Hybrid Energy Storage Based on Interval Analytic Hierarchy Process. In Proceedings of the 2023 8th Asia Conference on Power and Electrical Engineering (ACPEE), Tianjin, China, 14–16 April 2023; IEEE: New York, NY, USA, 2023; pp. 754–758. [Google Scholar]
- Nesterenko, O. Ontology and Analytic Hierarchy Process in the Information and Analytical Systems. In International Scientific Conference “Intellectual Systems of Decision Making and Problem of Computational Intelligence”; Springer International Publishing: Berlin/Heidelberg, Germany, 2020; pp. 302–314. [Google Scholar]
- Zhang, C. Evaluation of the Suitability of Shallow Geothermal Energy Based on Hierarchical Analysis Method-Fuzzy Comprehensive Evaluation Modeling-Taking Changle County, Shandong Province as an Example. China Geol. Surv. 2022, 9, 91–99. [Google Scholar]
- Huang, L.; Liang, J.; Liu, B.; Wen, F.; Yu, Y.; Sun, Z. Suitability Zoning of Ground Source Heat Pump in Guang’an City Based on Combined Empowerment Method. Sci. Technol. Eng. 2022, 22, 5116–5124. [Google Scholar]
- Hou, P.; Feng, W.; Zhan, L.; Xiao, H.; Tao, J. Habitat Suitability Evaluation Based on GIS Technology—Taking Bazhou District, Bazhong City, Sichuan Province as an Example. Sichuan For. Surv. Des. 2019, 4, 6–13. [Google Scholar]
- Zhang, S.; Ma, S.; Jiao, Y. Design of Subband Segmentation and Reconstruction System Using Weighted Stacked Structured Filter Banks. Telecommun. Eng. 2019, 59, 3. [Google Scholar]
- Guo, L.; Yi, H. High Dynamic Range Image Fusion Algorithm Based on Local Weighted Superposition. Acta Photon. Sin. 2022, 51, 1110001–1110010. [Google Scholar]
- Yang, W.; Yang, J.; Chen, S.; Kuang, L.; Wang, E.; Zhou, C. Fault Detection in Seismic Data Based on U-Net Deep Learning Network. Pet. Geophys. Explor. 2021, 56, 688–697. [Google Scholar]
- Abdekareem, M.; Al-Arifi, N.; Abdalla, F.; Mansour, A.; El-Baz, F. Fusion of Remote Sensing Data Using GIS-Based AHP-Weighted Overlay Techniques for Groundwater Sustainability in Arid Regions. Sustainability 2022, 14, 7871. [Google Scholar]
- Imtiaz, I.; Umar, M.; Latif, M.; Ahmed, R.; Azam, M. Landslide Susceptibility Mapping: Improvements in Variable Weights Estimation through Machine Learning Algorithms—A Case Study of Upper Indus River Basin, Pakistan. Environ. Earth Sci. 2022, 81, 112. [Google Scholar] [CrossRef]
| Disclaimer/Publisher’s Note: The statements, opinions and data contained in all publications are solely those of the individual author(s) and contributor(s) and not of MDPI and/or the editor(s). MDPI and/or the editor(s) disclaim responsibility for any injury to people or property resulting from any ideas, methods, instructions or products referred to in the content. |
© 2023 by the authors. Licensee MDPI, Basel, Switzerland. This article is an open access article distributed under the terms and conditions of the Creative Commons Attribution (CC BY) license (https://creativecommons.org/licenses/by/4.0/).


 ,
, 


