Abstract
Partial discharge (PD) that occurs due to insulation breakdown is a precursor to plant failure. PD emits electromagnetic pulses which radiate through space and can be detected using appropriate sensing devices. This paper proposed an enhanced radiolocation technique to locate PD. This approach depends on sensing the radio frequency spectrum and the extraction of PD location features from PD signals. We hypothesize that the statistical characterization of the received PD signals generates many features that represent distinct PD locations within a substation. It is assumed that the waveform of the received signal is altered due to attenuation and distortion during propagation. A methodology for the identification of PD locations based on extracted signal features has been developed using a fingerprint matching algorithm. First, the original extracted signal features are used as inputs to the algorithm. Secondly, Principal Component Analysis (PCA) is used to improve PD localization accuracy by transforming the original extracted features into s new informative feature subspace (principal components) with reduced dimensionality. The few selected PCs are then used as inputs into the algorithm to develop a new PD localization model. This work has established that PCA can provide robust PC representative features with spatially distinctive patterns, a prerequisite for a good fingerprinting localization model. The results indicate that the location of a discharge can be determined from the selected PCs with improved localization accuracy compared to using the original extracted PD features directly.
1. Introduction
Energized electrical apparatus and its insulation systems may become over-stressed due to aging and the ever-increasing demand for electricity. Over time, this could lead to the deterioration of the equipment/insulation, and performance degradation. Such compromised apparatus could breakdown without advanced warning. The damage that comes with such unexpected breakdowns could be irreversible and can sometimes lead to loss of lives. The cost associated with unplanned power cuts and repairs/or replacements is uneconomical. Consequently, the continuous functioning of electrical assets is highly desirable to avoid catastrophic failure and maintain the necessary reliability of the power infrastructure.
To cope with the ever-increasing energy demand, whilst minimizing maintenance and operation costs, utility operators must adopt efficient and cost-effective solutions for monitoring their aging infrastructure, which is prone to failure. This is because building new infrastructure could be prohibitively expensive. Advances in technology have enabled condition-based maintenance, a strategy that evaluates the health condition of equipment at any given time by performing continuous monitoring. Several methods have been developed that can assess the condition of electrical equipment. Amongst others, partial discharge monitoring has emerged as an important tool for assessing the status of electrical insulation systems. Partial discharge can be defined as a localized electrical discharge that does not completely bridge the insulation between conductors. PD occurs in a variety of locations and insulation mediums in electrical apparatus. PD may be due to the presence of gas bubbles, voids, or impurities in solid insulation, at conductor–dielectric interfaces, liquid insulation and along the surface of insulators [1,2]. Irrespective of the causal mechanism, PD is a precursor to insulation failure. The continuous occurrence of PD increases the damage in the insulation system as deterioration progresses, thereby giving rise to a vicious cycle of breakdown [3]. With PD as a progressive symptom of compromised insulation, the continuous monitoring of PD will permit the early detection of PD activity. This enables proactive and preventative maintenance to be carried out in its early stages before the equipment loses performance and/or suffers catastrophic failure. Thus, the cost of expensive repairs/replacement and unplanned outages can be significantly reduced.
PD emits part of the energy it produces as electromagnetic emissions in the form of radio signals, acoustic emissions in the audible or ultrasonic ranges and light [4]. Consequently, PD can be detected using appropriate sensors that monitor the energy exchanges that take place during discharge activities. Once the presence of PD has been identified, it is a matter of urgency to locate the point of discharge on the item of plant that is experiencing PD as quickly and accurately as possible. This enables utilities to carry out corrective maintenance operations when the maintenance activity is cost effective. PD location can be determined by sensing the acoustic emission [4,5] in the ultrasonic range using appropriate detectors; however, this is usually limited to small installations. Another method for locating PD, which is considered more suited for larger installations, is to monitor the radio spectrum for radio frequency pulses emitted by the discharges [6,7].
RF-based methods have received much attention lately, due to their suitability for larger installations. A radiometric technique for the accurate localization of PD has been reported in [3,8]. In [9,10], a van was equipped with the appropriate devices and was periodically driven around a substation to monitor the presence of PD. Authors in [11,12] used a time delay technique based on energy accumulation to determine the location of a discharge source. They installed two sets of four omnidirectional antennas in the environment of interest to monitor the electromagnetic emission. In another attempt, authors in [6] used both omnidirectional and directional antennas to locate the source of discharge in an air-insulated substation. Here, the time delay feature was calculated using cross-correlation based on the received wavefront. In [13], the authors estimated the location of PD using signal time delay based on high-order statistics. Four omnidirectional antennas were installed to monitor the UHF signals emitted by PD. The authors in [14] used time-domain reflectometry (TDR) based on TDoA to locate PD along a cable. Most of the works that have been reported for the accurate localization of PD used the time difference of arrival (TDoA), direction of arrival (DoA) and/or received signal strength (RSS) of the PD radio signal as the basic principles. The time-based technique has been shown to attain acceptable accuracy; however, it requires accurate time synchronization and line-of-sight (LOS) propagation, which makes it uneconomical. The DoA technique requires directional antenna array, making it complex. The RSS-based technique may be cost-effective, but its accuracy deteriorates with distance. RSS-based techniques also require detailed signal propagation models for every propagation environment, and this is non-trivial to establish. On the other hand, ready-made models will fail to capture the unique complex radio environment in which PD is expected, leading to poor performance.
In this paper, an efficient method for identifying the PD location based on location fingerprinting has been developed. Here, instead of the well-known signal parameters such as TDoA or RSS, the received PD waveform will be exploited to extract manifold signatures that will become representative of the PD signal features. These signatures will form location fingerprints that match the true location of the discharge. With a rich database of PD location fingerprints, a pattern-matching algorithm can be trained to build a flexible PD localization model. The developed model will be used to infer PD location whenever a new PD event is observed. This method takes into cognizance the fact that the fingerprint data could be overwhelming given that a lot of features may be extracted from the PD waveform. As such, issues of redundancy and the curse of dimensionality may arise, leading to poor generalization and, hence, poor performance.
To enhance the localization accuracy and deal with the problem of curse of dimensionality, a novel methodology based on Principal Component Analysis is proposed in this paper. As a proof of concept, statistical features will be extracted from PD signals. PCA will then be applied to transform the extracted PD features into a small dimension of informative feature space, otherwise known as principal components. The PD localization methodology described in this paper uses multivariable K-nearest neighbour (MKNN) as a fingerprint-matching algorithm. The algorithm is named multivariable because in this application it has two outputs (two-dimensional). Two PD localization models will be developed using MKNN. The first model will be based on the PD extracted signal features as location fingerprints. The second and improved model will used the informative principal components as location fingerprints. These two models will be used to estimate the locations of PD sources in two dimensions.
2. Methodology
With the high cost of building new infrastructure to cope with the ever-increasing demand for electricity, utilities have to adopt efficient methods for monitoring their ageing assets. One such efficient method is PD monitoring. PD localization helps in the early identification of the part of the plant that is experiencing insulation degradation.
This paper proposes a statistical characterization of the received radio signals that emanate from the PD source to generate location dependent features that will enable PD localization. PCA, a dimensionality reduction technique, is used to enhance the PD localization system by transforming the PD features into a few new informative feature subspaces. The architecture of the proposed PD location methodology is shown in Figure 1. As a proof of concept, emulated PD pulses captured by three identical antennas are taken as examples. Firstly, the measured radio signals are pre-processed. Then, the statistical features of the signals are computed. At the same time, the PCA algorithm is used to extract the most informative features of the measured PD signals to create a feature/location database. Finally, a pattern-matching algorithm is used to infer the PD location for a new PD observation from the database, and the localization accuracy is computed. The effectiveness of the proposed PCA-based methodology is verified by comparing the localization result with that of the original extracted PD features.
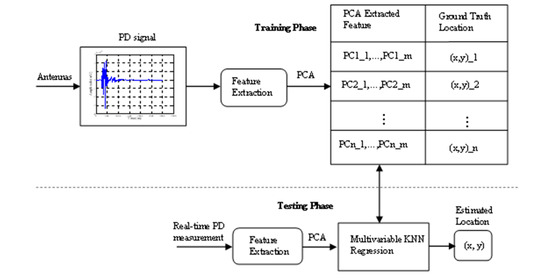
Figure 1.
Generic architecture for the proposed PD localisation system.
3. Modelling PD Localisation
Consider a wireless PD localization system overlaid in an electrical substation with N sensor nodes (antennas) that are visible within the substation. A two-dimensional uniform grid is constructed over the space. We assume that each grid point represents a discharge source, and therefore any estimate of the PD location is restricted to these grid points. If the grid spacing results in and points along the and axes, respectively, then there will be discharge locations in that space. A location in this space is represented with label (), where and represent the 2-D coordinates and z the height of the sensing device. In this paper, without loss of generality, we assume that for all coordinates on the grid.
The data of PD measurements are collected from the predefined locations on the grid. If signal parameters are extracted from PD measured at each grid point, then the dimension of . A total of entries are recorded in the database. Each entry in the database includes a mapping of the grid coordinate to the matrix of corresponding signal parameters from all antennas in the area. These entries are otherwise known as the training set. The signal parameters are expected to exhibit strong correlations with location. Each element in each vector in the database is assumed to be a true mean of the signal parameters from each of the antennas. This is usually achieved by collecting a large number of samples of the signals at each point on the grid. The fundamental problem of the proposed localization system is how to infer PD location using training information in the database when a new PD observation is received. Therefore, the problem of estimating the location of PD becomes a mapping of the extracted features onto PD source locations. This can be modelled as in Equation (1):
where r ∈ R is the extracted feature matrix from locations, captured by sensors. is the function of the extracted features, and accounts for the noise.
4. Experimental Procedure
A description of the experimental setup is first presented, which includes the PD signal acquisition. Secondly, the details of the testbed for the case study where the measurement campaign was conducted is presented. The data collection process is finally discussed.
4.1. Partial Discharge RF Signal Acquisition
The gradually developing decay of insulation systems in HV apparatus caused by partial discharge is one of the leading causes of electrical equipment failure. Thus, PD measurement has become one of the most reliable methods for assessing the status of HV insulation systems. PD is the result of the energy exchanges that accompany the interaction processes within a compromised insulation. PD emits pulses in the radio frequency spectrum which radiate to the surrounding environment. This allows for the non-invasive, free-standing radiometric detection and measurement of PD. A method based on radio frequency PD measurement is particularly useful since it obviates the need to de-energize any equipment. The measurement of partial discharge RF signals brings additional information, which may enable the determination of the location of the discharge. The acquired RF signals will be analysed in this paper and used to estimate the PD location.
The type of PD that is considered in this work represents internal discharge that usually occurs in gas-filled cavities. Internal discharges produce current pulses which can be detected using appropriate devices. For the measurement campaign reported herein, a pulse signal generator was used to generate emulated PD events. The generated pulse had a rise time of 10 ns, which is typical of PD. The low rise time gives rise to pulses extending into the radio frequency spectrum. An omnidirectional antenna was connected to the pulse generator and radiate the generated PD pulse into the surroundings. This arrangement represents the PD source that is used in the experiment reported herein. The PD measurements were performed using monopole antennas connected to a multichannel digital oscilloscope (LeCroy SDA900 serial data analyser) via 50 ohms coaxial cables to reduce the reflection of the signal from the antenna. Each antenna was connected to a channel on the oscilloscope. The recorded signals were saved throughout the measurement campaign. A sample of the measured PD pulse is shown in Figure 2.
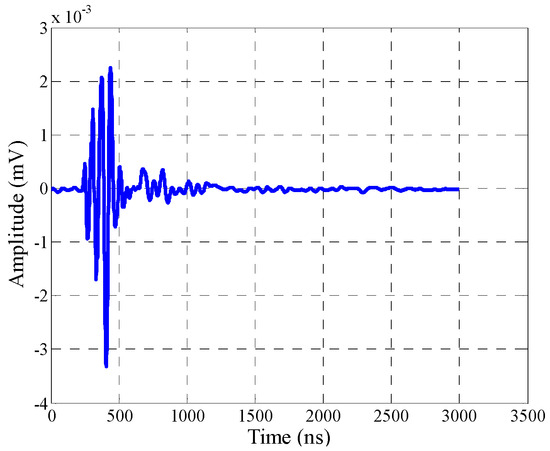
Figure 2.
Recorded PD signal.
4.2. Testbed
A testbed was designed as a case study for the verification of the proposed methodology. The laboratory in which the testbed was designed is part of the building housing the Electronic and Electrical Engineering Department at the University of Strathclyde. The dimension of the testbed, which is the floor in the laboratory, are 19.2 m × 8.4 m. The rectangular-shaped floor comprises several obstructions in the form of walls, metals, furniture, cabinets, robotic arms and communication targets, etc. The testbed had a continuous flux of people moving in and out of laboratory at the time the experiment was conducted. The presence of clutter in the laboratory is likely to give rise to the complex, multipath-rich, propagation environments that are expected in electrical installations. As a proof of concept, three inexpensive off-the-shelf monopole antennas were used as receivers to capture the emitted PD signals. These antennas were installed in a triangular-shaped arrangement to provide a fair coverage in the testbed. The testbed described herein is a representation of the proposed methodology for PD detection and localization using an array of sensor nodes.
4.3. Data Collection
The physical floor space in the laboratory was discretized using a superimposed uniform grid. A 1 m × 1 m grid was first designed to collect training data. Each grid point is considered a possible PD source. The grid comprised 144 distinct locations where PD data were harvested for training the fingerprint matching algorithm. These positions were uniformly distributed in the testbed. The simulated PD event described in Section 4.1 was used to generate PD at each grid point. Twenty (20) discharges were generated from every distinct training location. This was accomplished by moving the monopole antenna across the testbed stopping at each marked training location. The ground truth was noted at each location before moving on to the new location. Thus, at each location on the grid, we had a set of 20 PD measurements. These waveforms were further analysed to extract location-dependent features. The (ground truth location, features) pairs from the 144 locations formed the training data.
A similar arrangement was designed to collect an independent dataset that would be used for testing/validating the trained model. Another grid (2.5 m × 2.5 m) was overlaid on the same floor with 32 grid points, which would serve as ‘test’ locations. The test locations were also uniformly distributed in the testbed, but all at different points from the training locations. Again, 20 discharges were generated from every distinct test location. These ‘test’ data were collected on different days from the training data. The ground truth was also noted at each location. However, the ground truth information from ‘test’ locations would be used only for the evaluation of the localisation error and would not be included as part of the fingerprints presented to the trained model. Only the extracted features were supplied to the model. This arrangement of data collection was deliberately adopted to ensure that the training and test data were disjointed enough to provide realistic results.
4.4. PD Feature Extraction
Though the raw PD data collected at each location may be comparable to each other in the time domain, they contains unique characteristics that can be used to distinguish PD from different locations. These characteristics are called features. The aim of feature generation is to discover compact and informative representations of the raw data collected. The derivation and analysis of these features invariably leads to the determination of the PD location. Among other parameters, time domain features often involve statistical features that are functions of the location of the discharge site. Table 1 shows the statistical parameters that were extracted from received PD waveforms. Intuitively, the unique nature of the received PD waveforms from one location to another was created by the different propagation paths each radiated signal took to reach the receiver from the discharge site. The uniqueness in each propagation channel was due to the effects of attenuation and multipath propagation. Given the cluttered radio environment in the substation, these effects may vary quite markedly. This suggests that extracting features from the received PD waveform will provide a rich fingerprinting database for learning patterns and estimating the PD location.

Table 1.
PD statistical features.
As a proof of concept, five statistical features given in Table 1 were extracted from the PD waveforms recorded during the measurement campaign. A total of fifteen features were generated for each PD pulse, since three antennas were deployed to sense the radiated pulses. With the increased number of antennas, the dimension of the generated features can be overwhelming and may lead to redundancy, increasing the computational cost. In addition, the different statistical features were more often than not correlated with one another, therefore having a negligible contribution. Consequently, we aimed to transform the generated statistical features onto a small set of linearly uncorrelated, independent yet informative features using principal component analysis. PCA is an unsupervised machine-learning technique that uses orthogonal transformation to map the entire PD features onto a new feature subspace of linearly uncorrelated variables known as Principal Components (PCs) [15,16]. In other words, PCA finds components that maximize the variation in the PD features. The first principal component corresponds to the first variable in the new feature subspace. It captures the largest variability in the PD dataset. All succeeding PCs in turn capture different percentages of the remaining variation in decreasing order under the constraint that each is orthogonal to the previous component. The resulting PC matrix in the new feature subspace is a linear combination of the generated PD features. However, not all the PCs need to be used as input to the PD localization algorithm. As mentioned earlier, PCA invariably rotates the extracted PD features about their mean in order to project these features onto new coordinates, such that the first few dimensions retain the most variance and, hence, more information, as shown by the scree plot in Figure 3. The scree plot only shows the first five components out of a possible fifteen components that explain 95% of the total variance. The first PC explains 57% of the variance, which is less than 2/3 of the total variability in the PD feature space, and therefore more components might be needed. It can be seen that the first four PCs explain approximately 93% of the total variability, and this is a reasonable way to reduce dimensionality. The rest of the PCs, assumed to be noise, are discarded, and the entire feature space is transformed to a lower dimensional feature subspace (four PCs), with the most important information retained. An exhaustive search method is also used to determine the optimal number of PCs that form the new feature subspace. This further confirms that four is the optimal number of PCs to be used as the input to the developed model.
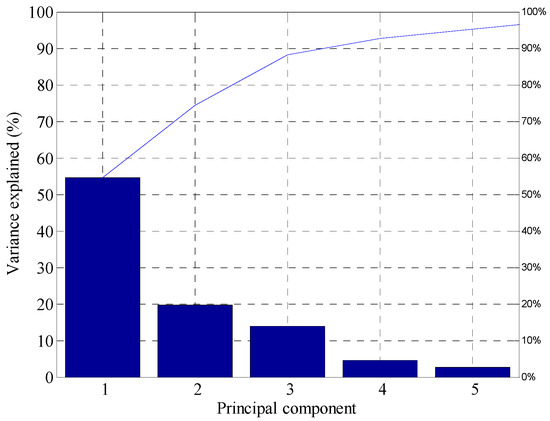
Figure 3.
Scree plot of principal components.
5. Multivariable KNN Regression for PD Localization
Deriving the functional relationship between the location of discharge and the extracted features from PD measurements is not trivial due to the complex radio propagation environment occasioned by the severe multipath and absence of line-of-sight propagation path. The inverse problem of inferring the PD location from the extracted features is also challenging. Machine learning techniques enable the unknown functional dependency to be derived from observation (data), that is, by learning from examples, without detailed knowledge of the desired dependency. One such algorithm for the location fingerprinting problem is the K-nearest neighbour (KNN) algorithm [17]. KNN is a supervised learning technique that can be used for both classification and regression problems. In this paper, KNN is used as a regression algorithm since the PD location fingerprinting problem is a function approximation problem. The regression problem here is a mapping of the extracted features onto the physical coordinates of the PD locations. Let be the number of observations or labeled examples to be used for training KNN. For a regression problem, each example consists of pair , , where is a vector containing extracted features and is the label or predictor, which in our case is the location coordinates . This makes our PD localization problem a multivariable regression problem, since we have two predictor variables. Therefore, we introduced the multivariate KNN (MKNN) regression to learn the relationship between the extracted features and the location coordinates. One of the factors that informed our choice of the KNN algorithm was its ability to work well with non-linear relationships. The KNN algorithm is also a simple and intuitive algorithm. The KNN algorithm involves training (learning the non-linear relationship in the data) and then testing on out-of-sample data (that is, new observations that have not been seen during training). We therefore needed two sets of data, training and test data, to implement the MKNN algorithm. One important question in KNN implementation is the choice of K-parameter (number of nearest neighbours) that would make a good model for predictions. Here, we employed five-fold cross-validation [18] to choose the optimal K. In cross-validation, the training data are split into training and testing sets multiple times and the algorithm’s performance is evaluated for different values of ‘K’. This permits the selection of ‘K’ that results in the best overall performance on the dataset. To see how well our predictions matched the true values, we used mean square error (MSE) for tuning and evaluating the models. Our five-fold cross-validation was performed using the training data for a grid of numbers of neighbours from 1 to 10. We took the minimum MSE to find the best setting for the number of neighbours. From here, we found that the optimal K was 6; that is, the K with the smallest value of MSE. Cross-validation helps to avoid underfitting and overfitting. Underfitting occurs when the model is influenced too much by the noisy data, that is, when K is too small. When K is too large, the prediction depends on many neighbouring observations. That means the model is not influenced enough by the training data. This is called overfitting. Therefore, in the subsequent analysis of the PD localization problem, we will evaluate the PD location using ‘K = 6′ nearest neighbours for optimal predictions.
Final PD Location Prediction
Whenever a PD activity is detected and the real-time RF signal is measured, we can find the discharge location. This is achieved by first extracting the statistical features of the RF signal and then identifying the most informative PCs as its fingerprint. To estimate the source location of the measured PD, MKNN searches the database for the nearest neighbours by calculating the Euclidean distance between the new observation (features) and each (location, fingerprints) pair in the database. The K (5) most similar entries in the database to the new fingerprint (i.e., fingerprints with the shortest distance) are selected as the nearest neighbours. The average of the physical coordinates associated with the nearest neighbours is returned as the predicted PD location for the new PD observation. Thus, the estimated PD location is given by Equation (2).
where is the predicted PD location and (, ) is the physical coordinate of the closest neighbour.
6. Experimental Results
To verify the effectiveness of the methodology introduced in this paper, the PD measurements recorded during the measurement campaign reported in Section 4 were used. There were two independent datasets collected, which represented training and test datasets to be used with the pattern-matching algorithm. The training sets were made of PD measurements with their two-dimensional locations (x, y) from 144 training grid points. The test set contained only the measurement data from 32 distinct test points without the ground truth locations.
Both the training and test PD data were processed such that the features extracted from the measurement data were representative of the PD emanating from a particular location. These features were further processed using PCA to generate a more decorrelated yet informative lower-dimensional feature set. Two PD localization models were developed using the Multivariable K-Nearest Neighbour (MKNN) algorithm. The first model was based on the original statistical features extracted from the PD signals. The second model was based on the principal components features, which were the result of the PCA. The first dataset (features/locations) was used to train the pattern-matching algorithm. Both the PD features and their corresponding locations were fed as inputs to the algorithm. In MKNN, a database of the features and their corresponding locations was created, which constituted the training of the algorithm.
To validate the developed models, the test data that were generated from 32 distinct locations were used. For the first model, the PD statistical features of the test data were used as the input to the trained model. For each PD feature set, the model predicted the location of the PD. In the second model, the principal components selected after applying PCA to the features of the test data were used as the input to the model and for each set of PCs, and this model predicted the PD location. In this section, the results of these two models will be presented and discussed.
6.1. Spatial Description of PD Fingerprints
First, we can establish the premise upon which this work is based. Any unique characteristic of the received signal that distinguishes locations can be a fingerprint candidate for inferring the PD location. One salient feature of the proposed method is that it would benefit from the rich multipath propagation that characterizes the electrical substations. The multipath effect adds to the uniqueness of the extracted signal parameter. PCA, on the other hand, produces high variability amongst the features which creates distinctiveness in the spatial location–feature pair that is needed for the enhanced performance of PD localization models. The spatial maps of the statistical features shown in Figure 4. Figure 4a–e demonstrate how these features vary with location, as measured by each of the three receiving antennas.
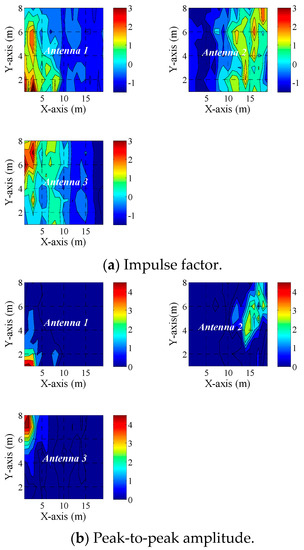
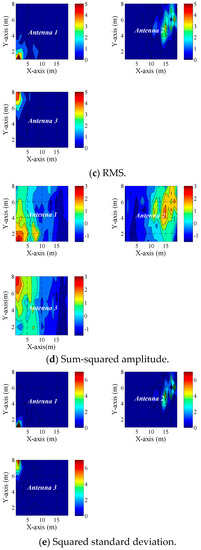
Figure 4.
Spatial patterns for (a) impulse factor, (b) peak-to-peak amplitude, (c) RMS, (d) sum-squared amplitude and (e) squared standard deviation of received PD pulse.
The spatial map of how each of the four PCs extracted from PD features varied with respect to location is shown in Figure 5. A higher variability captured by the PCs indicates that there was a PC-location pattern that exists in the data. This unique spatial pattern shows that the PCs extracted from the generated PD features were more distinguishable fingerprint features compared to the original extracted features in Figure 4, which can prove to be robust fingerprints to infer PD location. This assertion will be validated using the models developed. Both the original extracted PD features and the PCs are used to create independent fingerprint databases which will be used independently in the MKNN algorithm to develop PD localization models. The results of the two models will be compared.
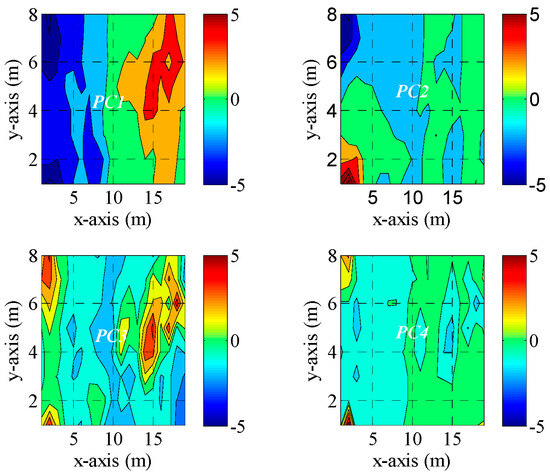
Figure 5.
Spatial pattern for the extracted PCs.
6.2. Accuracy
The accuracy of PD localization using the original extracted PD features was first analysed. The PD features listed in Table 1 were extracted from each measurement point for testing and validation. These features were used to obtain the estimated PD test locations. The error (Euclidean distance between the estimated location and the true PD location) for each estimated location was computed. The map of error distribution for all 32 PD test locations is shown in Figure 6a. The emulated PD source was located at each coordinate of the test points.
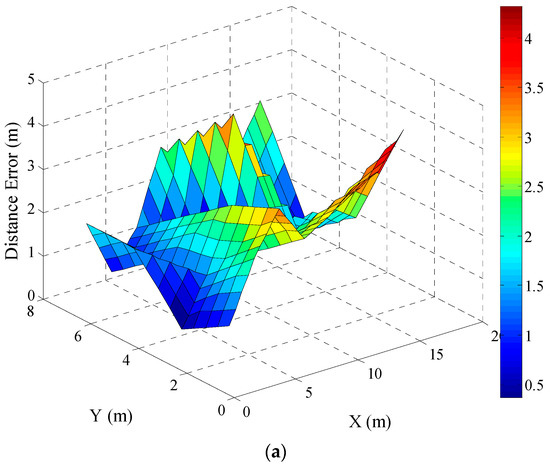
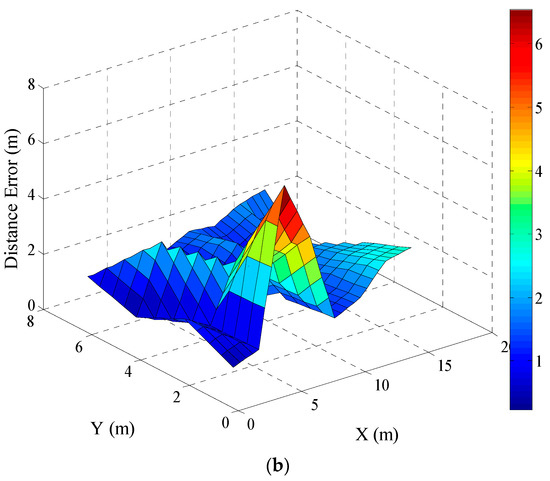
Figure 6.
Location error for testing positions using (a) PD original features and (b) PCs.
Secondly, the PD localization result using principal components from PCA was analysed. Here, the PD features were transformed using PCA, and the resulting principal components for the 32 test locations were used as fingerprint inputs to the trained model, and their locations were estimated. The map of the error distribution for all the 32 PD test locations estimated using PCs features is shown in Figure 6b. This distribution shows the varying degree of localization error in the testbed. The performance of the models differs from location to location, which was expected. The difference in the deviations may have been a result of the positioning of the receivers in the testbed and/or the obstructions during measurements. The points closer to any receiving antennas performed better compared to locations that were far away from all the receiving antennas. The other exception could be because of obstructions during measurements or a marked shift in the composition of the testbed when the test data were measured. However, the result indicates that the proposed methodology returned a high accuracy, with more than 25% of the estimated PD location having errors less than 1 m and a minimum error of 0.3 m when using principal components as input. Compared with the MKNN model using original PD features, the PCA technique was able to locate 94% of the test locations within 3 m.
The statistical metrics for the localization result of the 32 PD test sources are shown in Figure 7. The mean, which is the average localization error, the median and the 75th percentile of the localization error for the two MKNN models based on PD features and PCs, respectively, are presented. The accuracy was significantly enhanced when the mean error was reduced from 2.05 m to 1.78 m when using principal components as the input instead of the original PD features. Table 2 shows the improvement in localization accuracy when PCA was applied to the PD features and PCs were later used for locating PD. By comparing the two models, it can be observed that the PCs-MKNN model improved the location accuracy by 15%, 22.19% and 29% in terms of mean error, median and 75th percentile of the localization error, respectively.
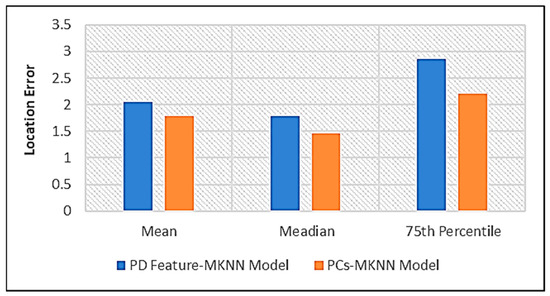
Figure 7.
Localization accuracy.

Table 2.
Improvement in accuracy.
6.3. Computation Cost
The PD feature space impacts the computational complexity of the MKNN PD localisation model. MKNN, a pattern-matching algorithm that was used for location estimation in this paper, first created a database where all training examples were stored. To locate a source of PD for a new sample, the new sample was compared to all training examples to identify examples that were closest neighbours to that sample. Here, closest neighbours mean those with shorter distances to the test sample. Suppose there are training samples; for each training sample, we compute the distance from the new test sample to the training sample. In addition, there is a cost of to compute the smallest distance. The cost of finding the nearest neighbours for a single new sample in MKNN is therefore given by . This can be costly for a resource constraint system such as the one considered in this paper. However, by integrating PCA, the number of features used in calculating distance was reduced whilst improving the accuracy. PCA compresses relevant information in the data into a small number of principal components for model training and validation. By using PCA, the dimension of the original features is reduced by 73%. This implies that the integration of PCA can reduce the computational burden of the proposed PD location identification methodology.
6.4. Discussion
The PD localization results indicated that error in the estimated locations for the proposed methodology increased as the distance between the discharge source and the receiving antennas increased. This is due to degradation in the received signals, a result of the increase in the distance of propagation. This problem can be overcome by installing more antennas, making each source closer to a receiving antenna. However, the average error for the PC-MKNN model was less than when the original PD features were used directly. The improved accuracy of the proposed methodology can be explained: when PCA is applied to the PD features, it reduces the correlation between individual features and projects much of the variance into the first few principal components, which are linearly uncorrelated. This gives rise to more distinguishable fingerprint features and, hence, improves performance (localisation error). By reducing the dimensionality, PCA helps remove noise in the features. This reduces overfitting and can improve the generalization of the algorithm, making it more robust to new data. PCA generated PCs that represented decorrelated features, which produced a better spatial distinction among the features. This resulted in an improvement in the localisation result. The statistical summary of the localisation error is listed in Table 2. The mean localisation error of the proposed method was 1.78 m and the median was 1.46 m. This implies that 50% of the time, the PCs-MKNN model located PD sources with an error less than 1.50 m. compared with the PD feature-MKNN model, and the PCs-MKNN model improved the localisation accuracy by 22.19%. With the proposed PCs-MKNN model, the PD location can be identified much more effectively. Moreover, the trade-off between performance and computational cost in the KNN model is addressed. This was undertaken by limiting the feature space and number of neighbours. MKNN models that are less computationally expensive can be directly implemented on portable embedded devices.
7. Comparison of PD Localization Solutions
In the existing literature, most of the techniques that have been proposed for partial discharge localization have been based on received signal strength, time-difference-of-arrival and/or direction of arrival.
In [19], a system for PD localization was proposed based on RSS. Two testbeds were considered in an 18 m2 empty room. Seven sensors were deployed in the first testbed and eight were deployed in the second testbed to sense the PD signals. The testbeds were divided into nine test locations where PDs were generated. The distance between the emitter and the receiver was computed using estimated path loss exponent. With this method, the best estimated location gave an error of 0.78 m in the first testbed and 1.06 m in the second testbed. The authors in [20] proposed an RSS-based PD localization methodology that uses Soft Defined Radio (SDR) technology. The received signal strength collected using SDR was used as the location fingerprint to infer the PD location. The experimental result indicated that the single PD location that was estimated had a location error of 1.3 m. Another RSS-based PD localization methodology is proposed in [21]. The technique is based on clustering and compressed sensing. The method was applied to identify HV apparatus with PD. A 24 m2 testbed was created with a 1 m × 1 m grid overlaid across the testbed. The experimental result shows that this method was able to locate equipment experiencing PD within 3 m for 89% of the locations. In [22], TDOA-probability methodology was proposed for PD localization. Here, the TDOA fingerprint was used to estimate the location of PD. Three sources of PD were created to test the developed technique, and the result shows that three of the sources were located with errors of 0.56 m, 1.59 m and 0.18 m, respectively. Another time-based PD localization technique was proposed in [23]. The time delay of arrival and Gaussian mixture model were combined to estimate PD locations. Eight test locations were generated, and the result showed a minimum error of 0.5 m and a mean error of 1.4 m. The PCA-enhanced PD localization solution that is proposed in this paper is based on feature extraction from PD radio frequency signals other than RSS and/or TDOA. The extracted PD features are further processed using PCA to generate lower dimensional yet informative features for locating PD using a fingerprint-matching algorithm—MKNN. The result of this simple proposed solution indicated a high accuracy, with more than 25% of the estimated PD location having errors less than 1 m and a minimum error of 0.3 m. Compared with other techniques in the literature, our proposed technique was able to locate 94% of the test locations within 3 m.
8. Conclusions
This paper investigates the problem of determining the location of partial discharge in HV electrical installations by measuring the PD signals. The developed methodology is based on feature extraction, the Multivariable K-Nearest Neighbour (M-KNN) algorithm and Principal Component Analysis (PCA). First, statistical features were extracted from the PD measurement. With a high number of antennas and increased grid space, the dimensions of the PD data would be high. Moreover, most of the generated statistical features had small variance, highly correlated with each other. PCA was used to further process the extracted features in order to effectively reduce the dimensions of the PD data and decorrelate the features whilst retaining maximum information in the feature space. PCA transformed the PD statistical features by projecting them onto a small set of linearly uncorrelated yet informative features known as principal components (PCs). This gave rise to more distinguishable fingerprint features. To evaluate the effectiveness of using principal components as features rather than original features extracted from PD waveforms, a multivariable KNN algorithm was trained to learn the underlying PCs–location relationship. The trained model was then used to infer the PD location from new PC features. The experimental results demonstrate that the PCA based features outperformed the model developed using the statistical features generated directly from the PD waveforms. The PC-MKNN model provided a significant improvement, with the median error reduced by 22.19% compared to using PD statistical features as inputs for the MKNN model. It also offers a 73% reduction in computational load. In practice, an accurate and less computational model is desirable since it can be easily implemented directly on portable embedded devices. In addition, by using PCs as input features, an MKNN partial discharge localization model that is robust against noise was developed.
The results presented in this paper were obtained using PD of a single type emanating from different locations. The use of the methodology described in this paper for locating sources of multiple PD types will be investigated further.
Author Contributions
Conceptualization, E.T.I. and R.A.; methodology, E.T.I.; software, E.T.I.; validation, E.T.I., C.T. and R.A.; formal analysis, E.T.I.; investigation, E.T.I.; resources, E.T.I. and C.T.; data curation, R.A.; writing—original draft preparation, E.T.I.; writing—review and editing, E.T.I., C.T. and R.A.; visualization, E.T.I. and C.T.; supervision, R.A.; project administration, R.A. All authors have read and agreed to the published version of the manuscript.
Funding
The authors acknowledge the Engineering and Physical Sciences Research Council for their support of this work under grant EP/J015873/1 and Tertiary Education Trust Fund (TETFund) Nigeria.
Data Availability Statement
Data sharing is not applicable to this article.
Conflicts of Interest
The authors declare no conflict of interest.
References
- Morsalin, S.; Das, N. Diagnostic aspects of partial discharge measurement at very low frequency: A Review. IET Sci. Meas. Technol. 2020, 14, 825–841. [Google Scholar] [CrossRef]
- Illias, H.A.; Tunio, M.A.; Bakar, A.H.A.; Mokhlis, H.; Chen, G. Partial discharge phenomena within an artificial void in cable insulation geometry: Experimental validation and simulation. IEEE Trans. Dielectr. Electr. Insul. 2016, 23, 451–459. [Google Scholar] [CrossRef]
- Moore, P.J.; Portugues, I.E.; Glover, I.A. Partial discharge investigation of a power transformer using wireless wideband radio-frequency measurements. IEEE Trans. Power Deliv. 2006, 21, 528–530. [Google Scholar] [CrossRef]
- Evagorou, D.; Kyprianou, A.; Lewin, P.L.; Stavrou, A.; Efthymiou, V.; Metaxas, A.C.; Georghiou, G.E. Feature extraction of partial discharge signals using the wavelet packet transform and classification with a probabilistic neural network. IET Sci. Meas. Technol. 2010, 4, 177–192. [Google Scholar] [CrossRef]
- Lu, Y.; Tan, X.; Hu, X. PD detection and localisation by acoustic measurements in an oil-filled transformer. IEE Proc.—Sci. Meas. Technol. 2000, 147, 81–85. [Google Scholar] [CrossRef]
- Li, P.; Zhou, W.; Yang, S.; Liu, Y.; Tian, Y.; Wang, Y. Method for partial discharge localisation in air-insulated substations. IET Sci. Meas. Technol. 2017, 11, 331–338. [Google Scholar] [CrossRef]
- Mohamed, F.P.; Siew, W.H.; Soraghan, J.J.; Strachan, S.M.; Mcwilliam, J. Remote monitoring of partial discharge data from insulated power cables. IET Sci. Meas. Technol. 2014, 8, 319–326. [Google Scholar] [CrossRef]
- Portugues, I.E.; Moore, P.J.; Glover, I.A.; Johnstone, C.; McKosky, R.H.; Goff, M.B.; Van Der Zel, L. RF-based partial discharge early warning system for air-insulated substations. IEEE Trans. Power Deliv. 2009, 24, 20–29. [Google Scholar] [CrossRef]
- Judd, M.D. Radiometric partial discharge detection. In Proceedings of the International Conference on Condition Monitoring and Diagnosis, Beijing, China, 21–24 April 2008. [Google Scholar]
- Portugues, I.E.; Moore, P.J.; Carder, P. The use of radiometric partial discharge location equipment in distribution substations. In Proceedings of the 18th International Conference and Exhibition on Electricity Distribution, Turin, Italy, 6–9 June 2005. [Google Scholar]
- Hou, H.; Sheng, G.; Miao, P.; Li, X.; Hu, Y.; Jiang, X. Partial discharge location based on radio frequency antenna array in substation. High Volt. Eng. 2012, 38, 1334–1340. [Google Scholar]
- Tang, J.; Xie, Y. Partial discharge location based on time difference of energy accumulation curve of multiple signals. IET Electr. Power Appl. 2011, 5, 175–180. [Google Scholar] [CrossRef]
- Hou, H.; Sheng, G.; Jiang, X. Robust Time Delay Estimation Method for Locating UHF Signals of Partial Discharge in Substation. IEEE Trans. Power Deliv. 2013, 28, 1960–1968. [Google Scholar]
- Mor, A.R.; Morshuis, P.H.F.; Llovera, P.; Fuster, V.; Quijano, A. Localization techniques of partial discharges at cable ends in off-line single sided partial discharge cable measurement. IEEE Trans. Dielectr. Electr. Insul. 2016, 23, 428–434. [Google Scholar] [CrossRef]
- Rahman, M.S.A.; Lewin, P.L.; Rapisarda, P. Autonomous localization of partial discharge sources within large transformer windings. IEEE Trans. Dielectr. Electr. Insul. 2016, 23, 1088–1098. [Google Scholar] [CrossRef]
- Fang, S.; Lin, T. Principal component localization in indoor WLAN environments. IEEE Trans. Mob. Comput. 2012, 11, 100–110. [Google Scholar] [CrossRef]
- Dai, D.N.; Minh, T.L. Enhanced Indoor Localisation Based BLE Using Gaussian Process Regression and Improved Weighted kNN. IEEE Access 2021, 9, 143795–143806. [Google Scholar]
- Kohavi, R. A study of cross-validation and bootstrap for accuracy estimation and model selection. Ijcai 1995, 14, 1137–1145. [Google Scholar]
- Khan, U.F.; Lazaridis, P.I.; Mohamed, H.; Albarracín, R.; Zaharis, Z.D.; Atkinson, R.C.; Tachtatzis, C.; Glover, I.A. An efficient algorithm for partial discharge localization in high-voltage systems using received signal strength. Sensors 2018, 18, 4000. [Google Scholar] [CrossRef]
- Mohamed, H.; Lazaridis, P.; Upton, D.; Mistry, K.; Saeed, B. Partial discharge localization based on received signal strength. In Proceedings of the 23rd International Conference Automation and Computation (ICAC), Huddersfield, UK, 7–8 September 2017. [Google Scholar]
- Li, Z.; Luo, L.; Zhou, N.; Sheng, G.; Jiang, X. A novel partial discharge localization method in substation based on a wireless UHF sensor array. Sensors 2017, 17, 1909. [Google Scholar] [CrossRef]
- Zhu, M.; Wang, Y.; Liu, Q. Localization of multiple partial discharge sources in air-insulated substation using probability-based algorithm. IEEE Trans. Dielectr. Electr. Insul. 2017, 24, 157–166. [Google Scholar] [CrossRef]
- Mishra, D.K.; Sarkar, B.; Koley, C.; Roy, N.K. An unsupervised Gaussian mixer model for detection and localization of partial discharge sources using RF sensors. IEEE Trans. Dielectr. Electr. Insul. 2017, 24, 2589–2598. [Google Scholar] [CrossRef]
Disclaimer/Publisher’s Note: The statements, opinions and data contained in all publications are solely those of the individual author(s) and contributor(s) and not of MDPI and/or the editor(s). MDPI and/or the editor(s) disclaim responsibility for any injury to people or property resulting from any ideas, methods, instructions or products referred to in the content. |
© 2023 by the authors. Licensee MDPI, Basel, Switzerland. This article is an open access article distributed under the terms and conditions of the Creative Commons Attribution (CC BY) license (https://creativecommons.org/licenses/by/4.0/).