


Optimizing Solar Parabolic Trough Receivers with External Fins: An Experimental Study on Enhancing Heat Transfer and Thermal Efficiency †

 , ,
, ,
Abstract
:1. Introduction
2. Materials and Methods
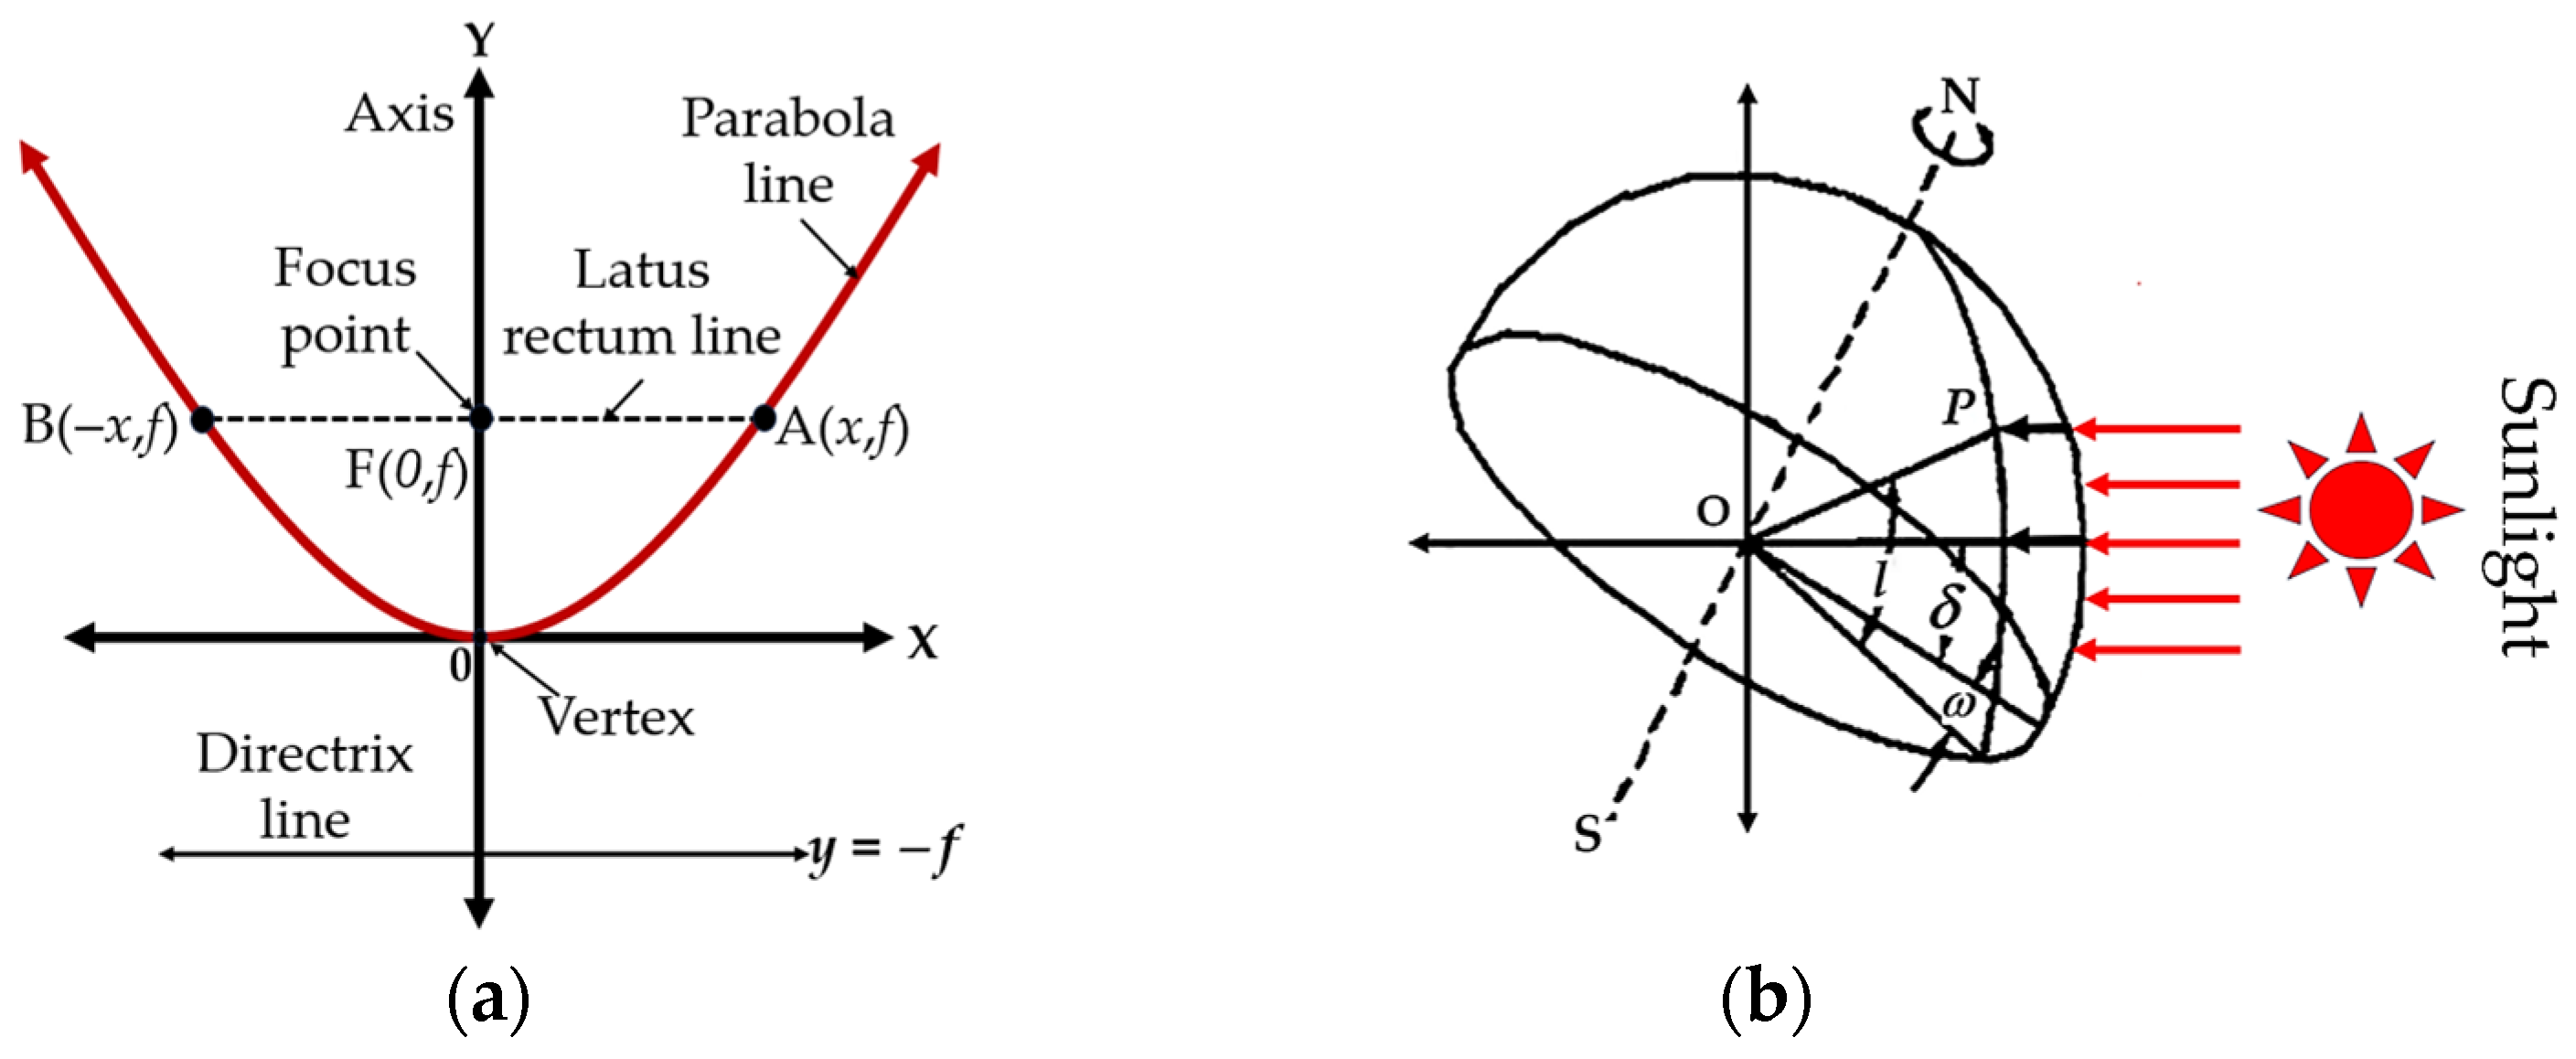
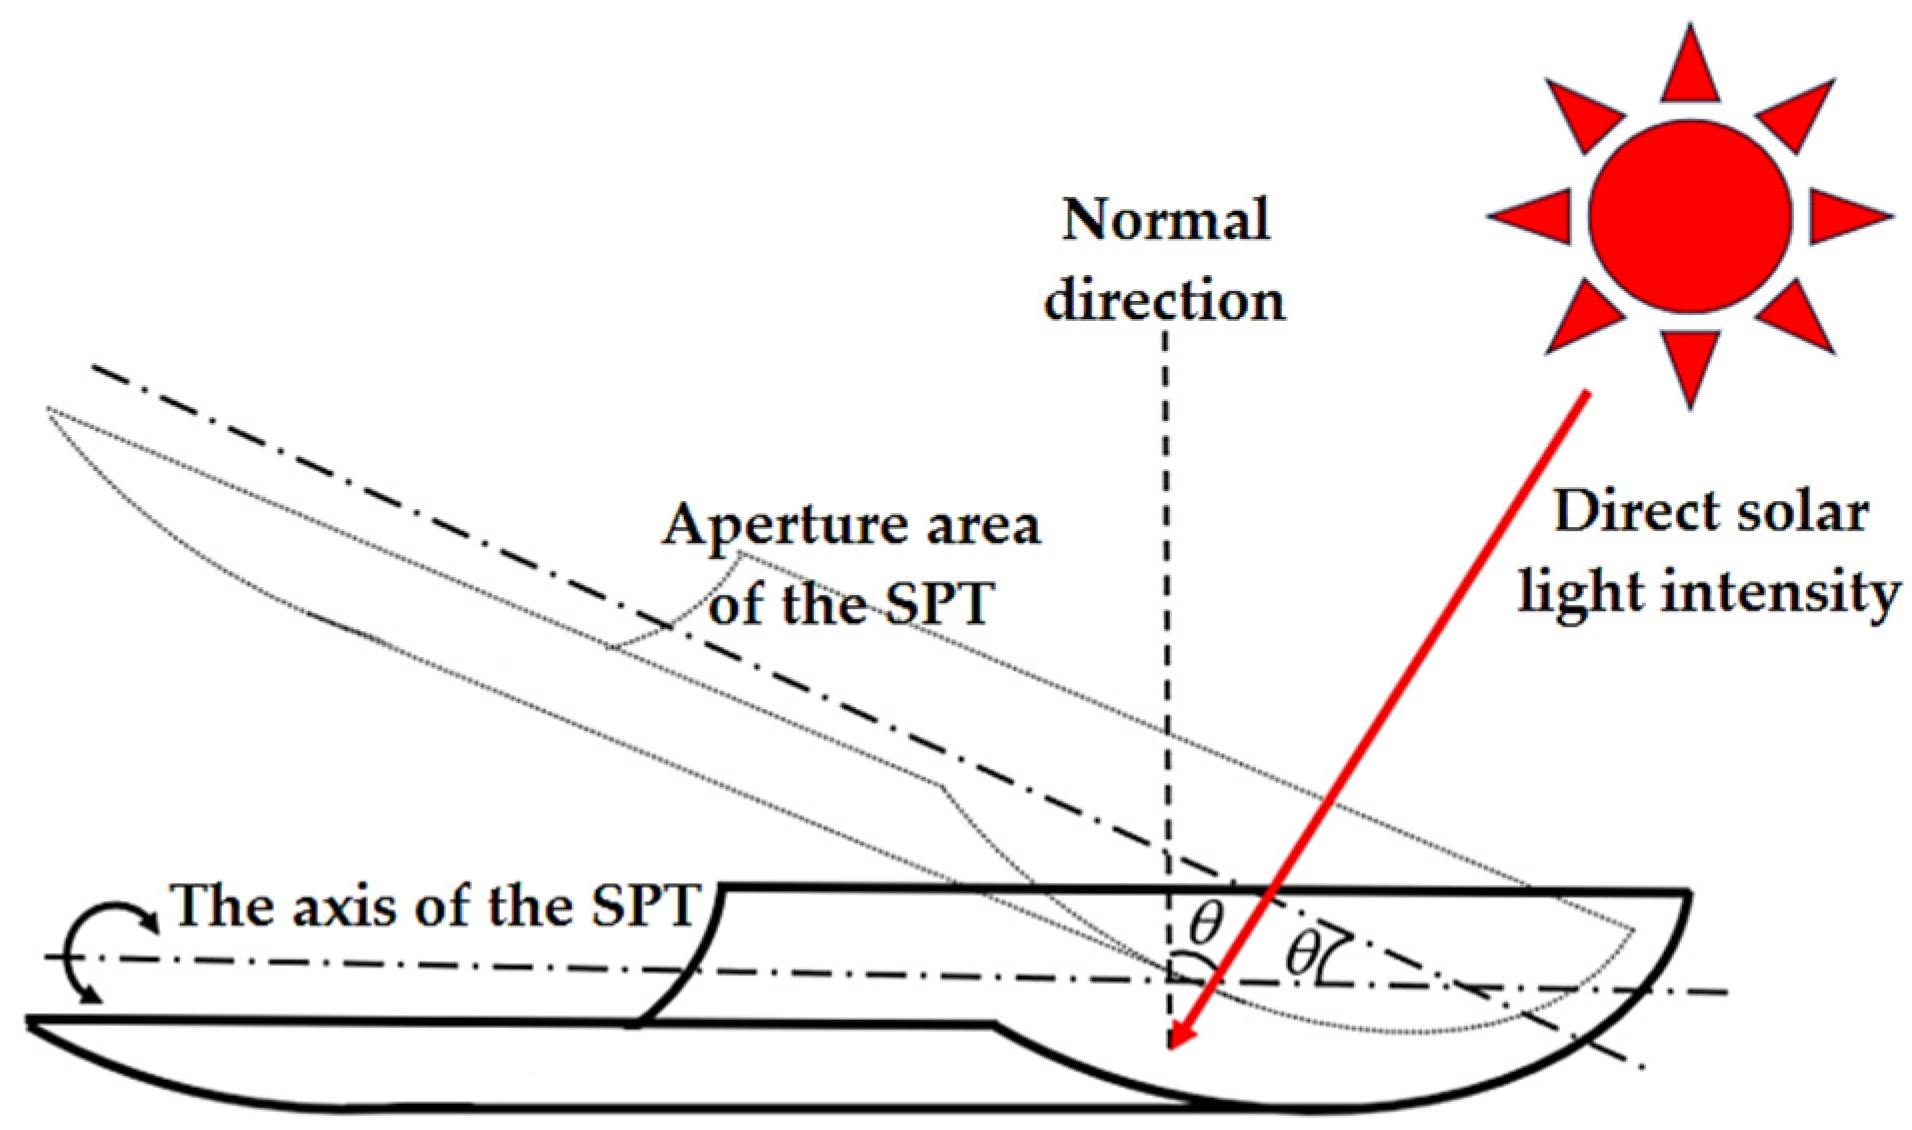
2.1. Basic Concepts of the Parabola and Earth–Sun Angles
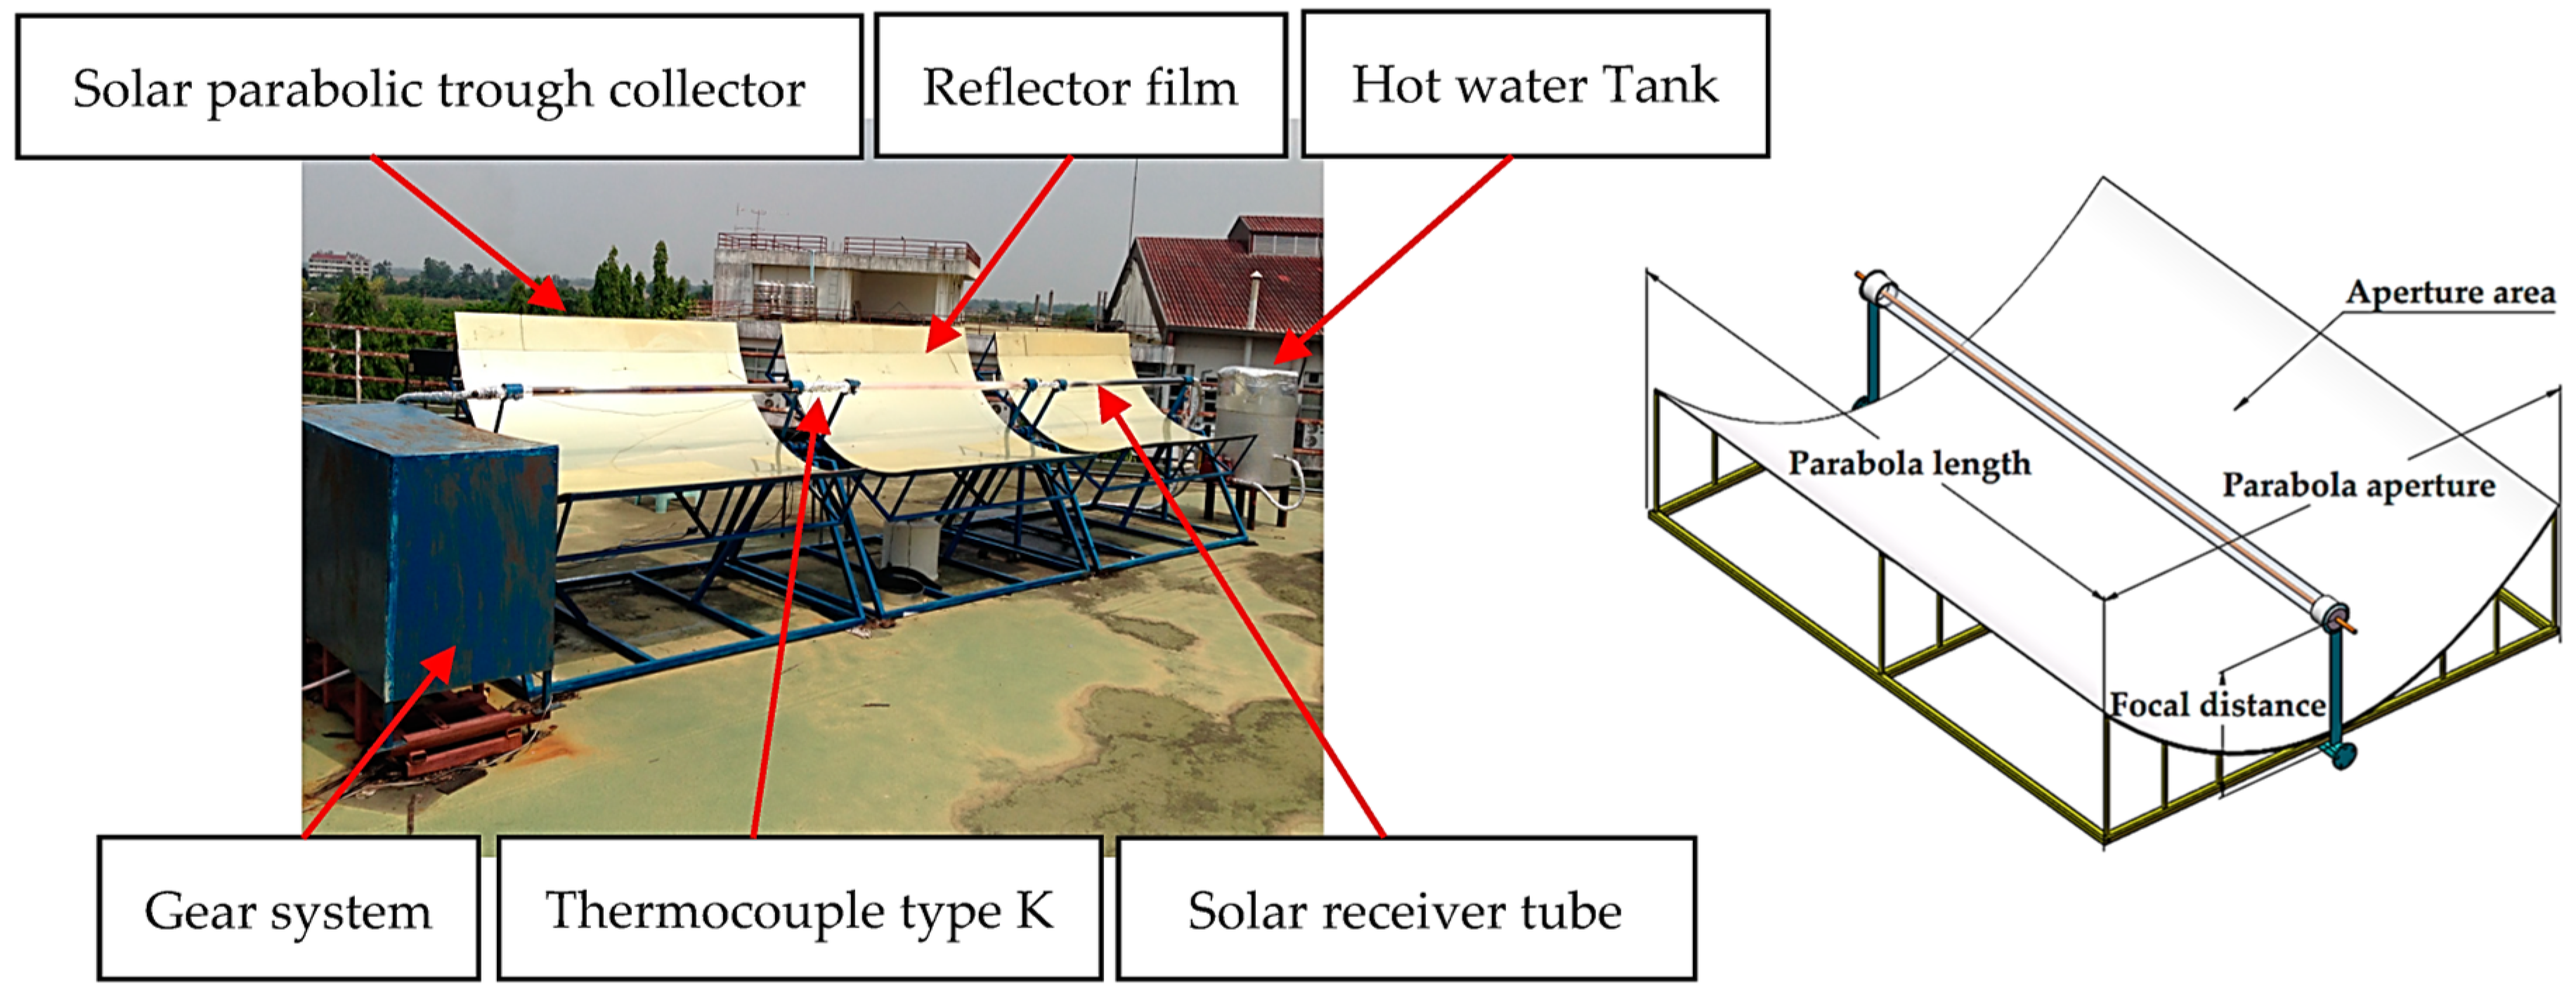
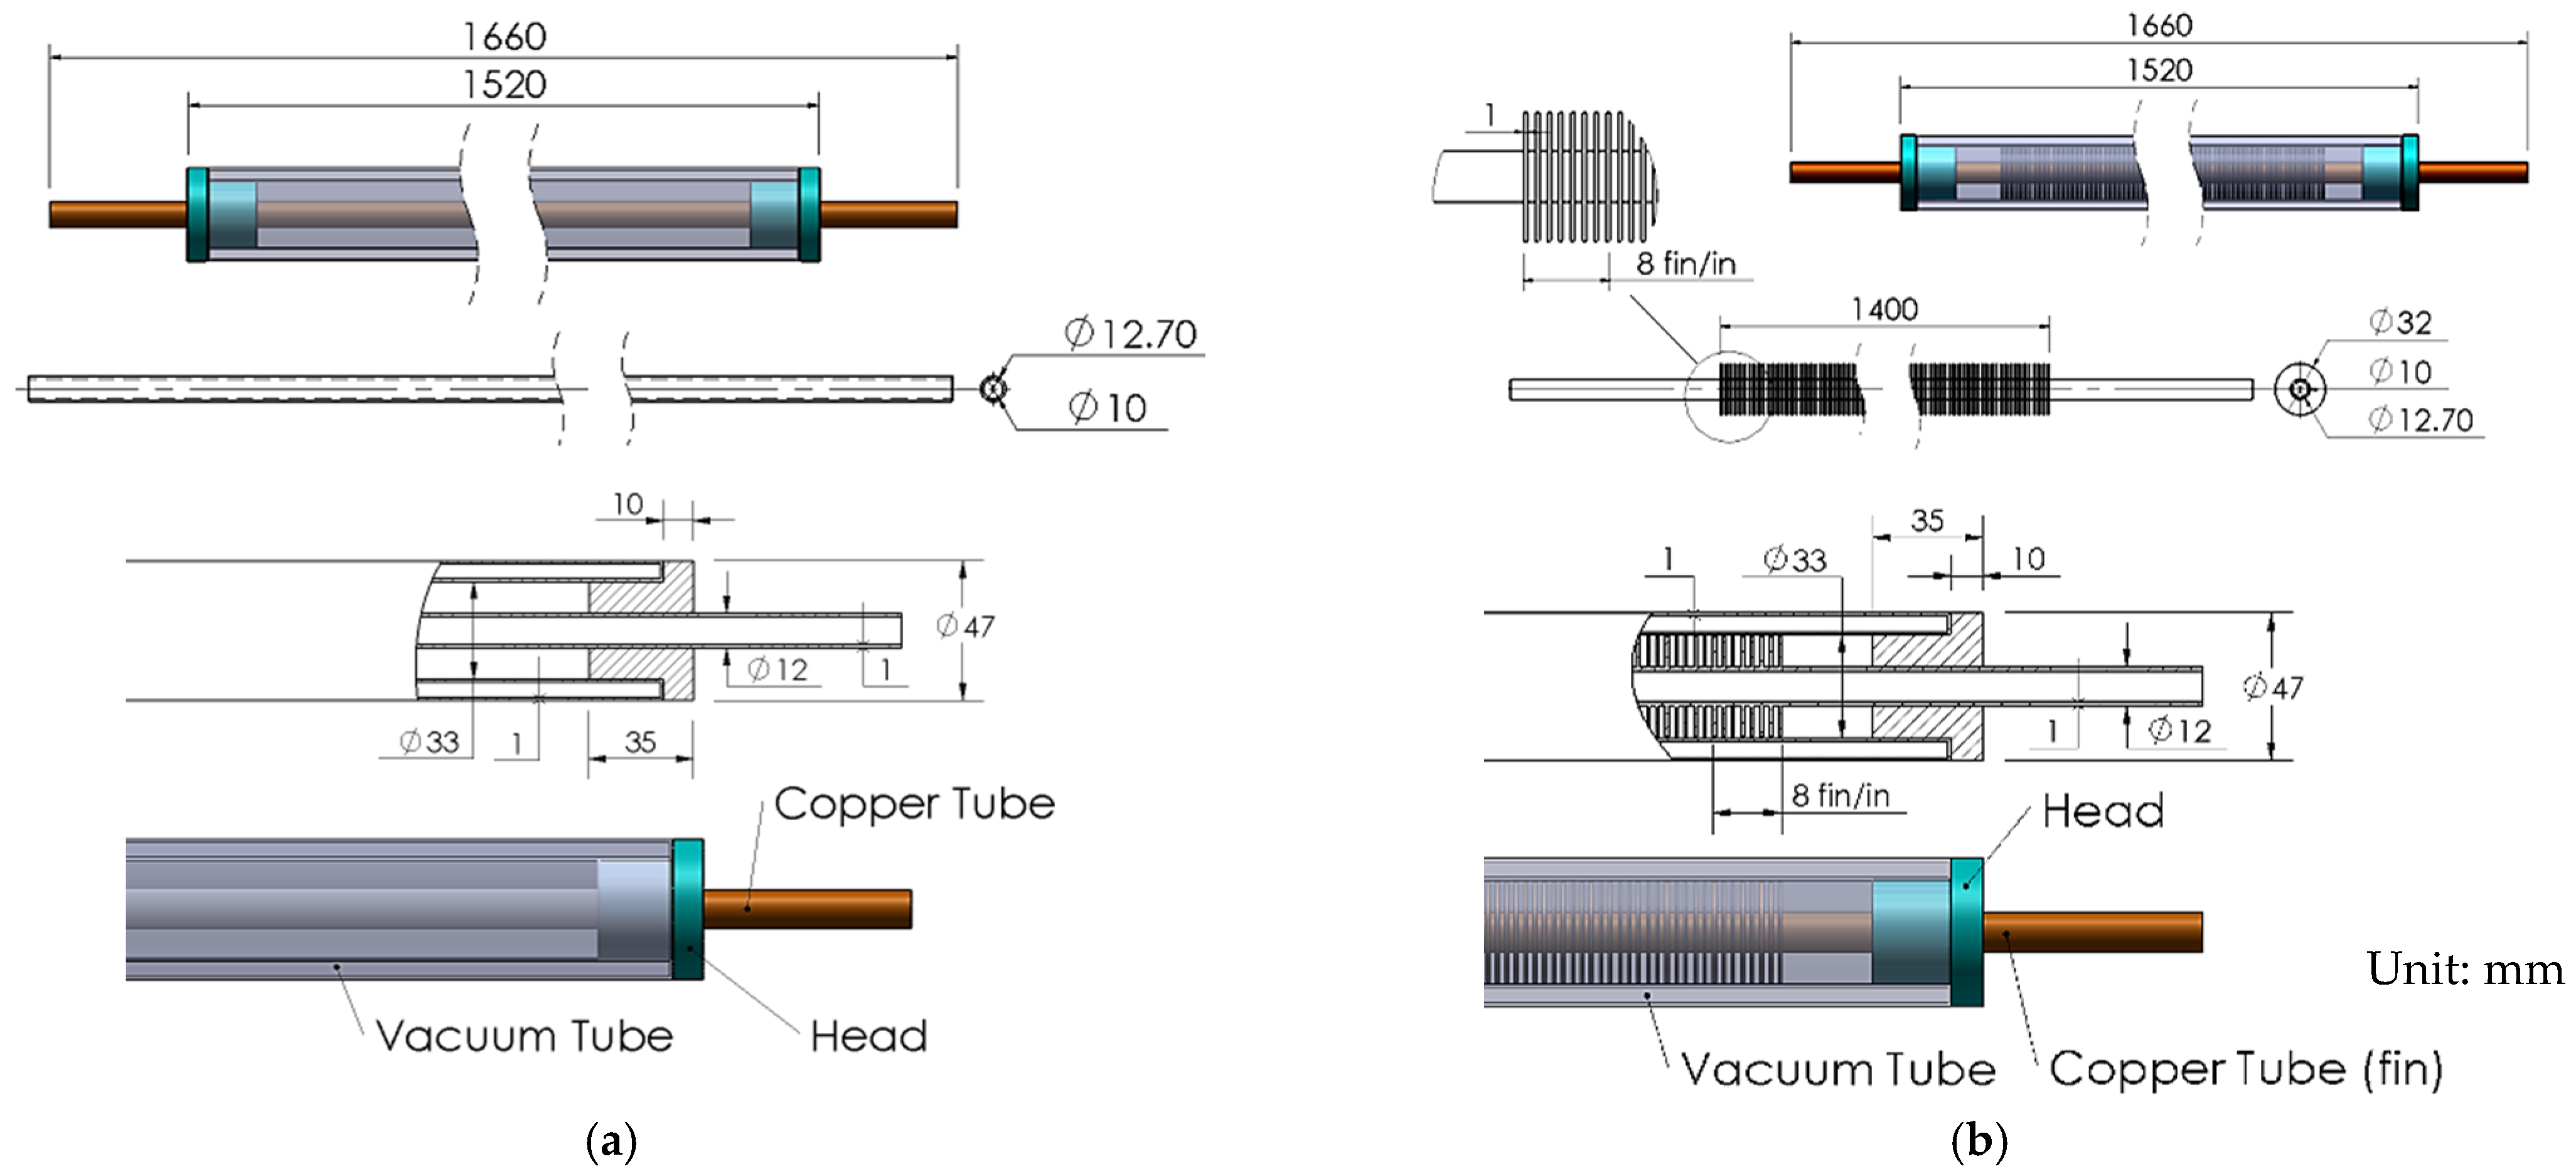
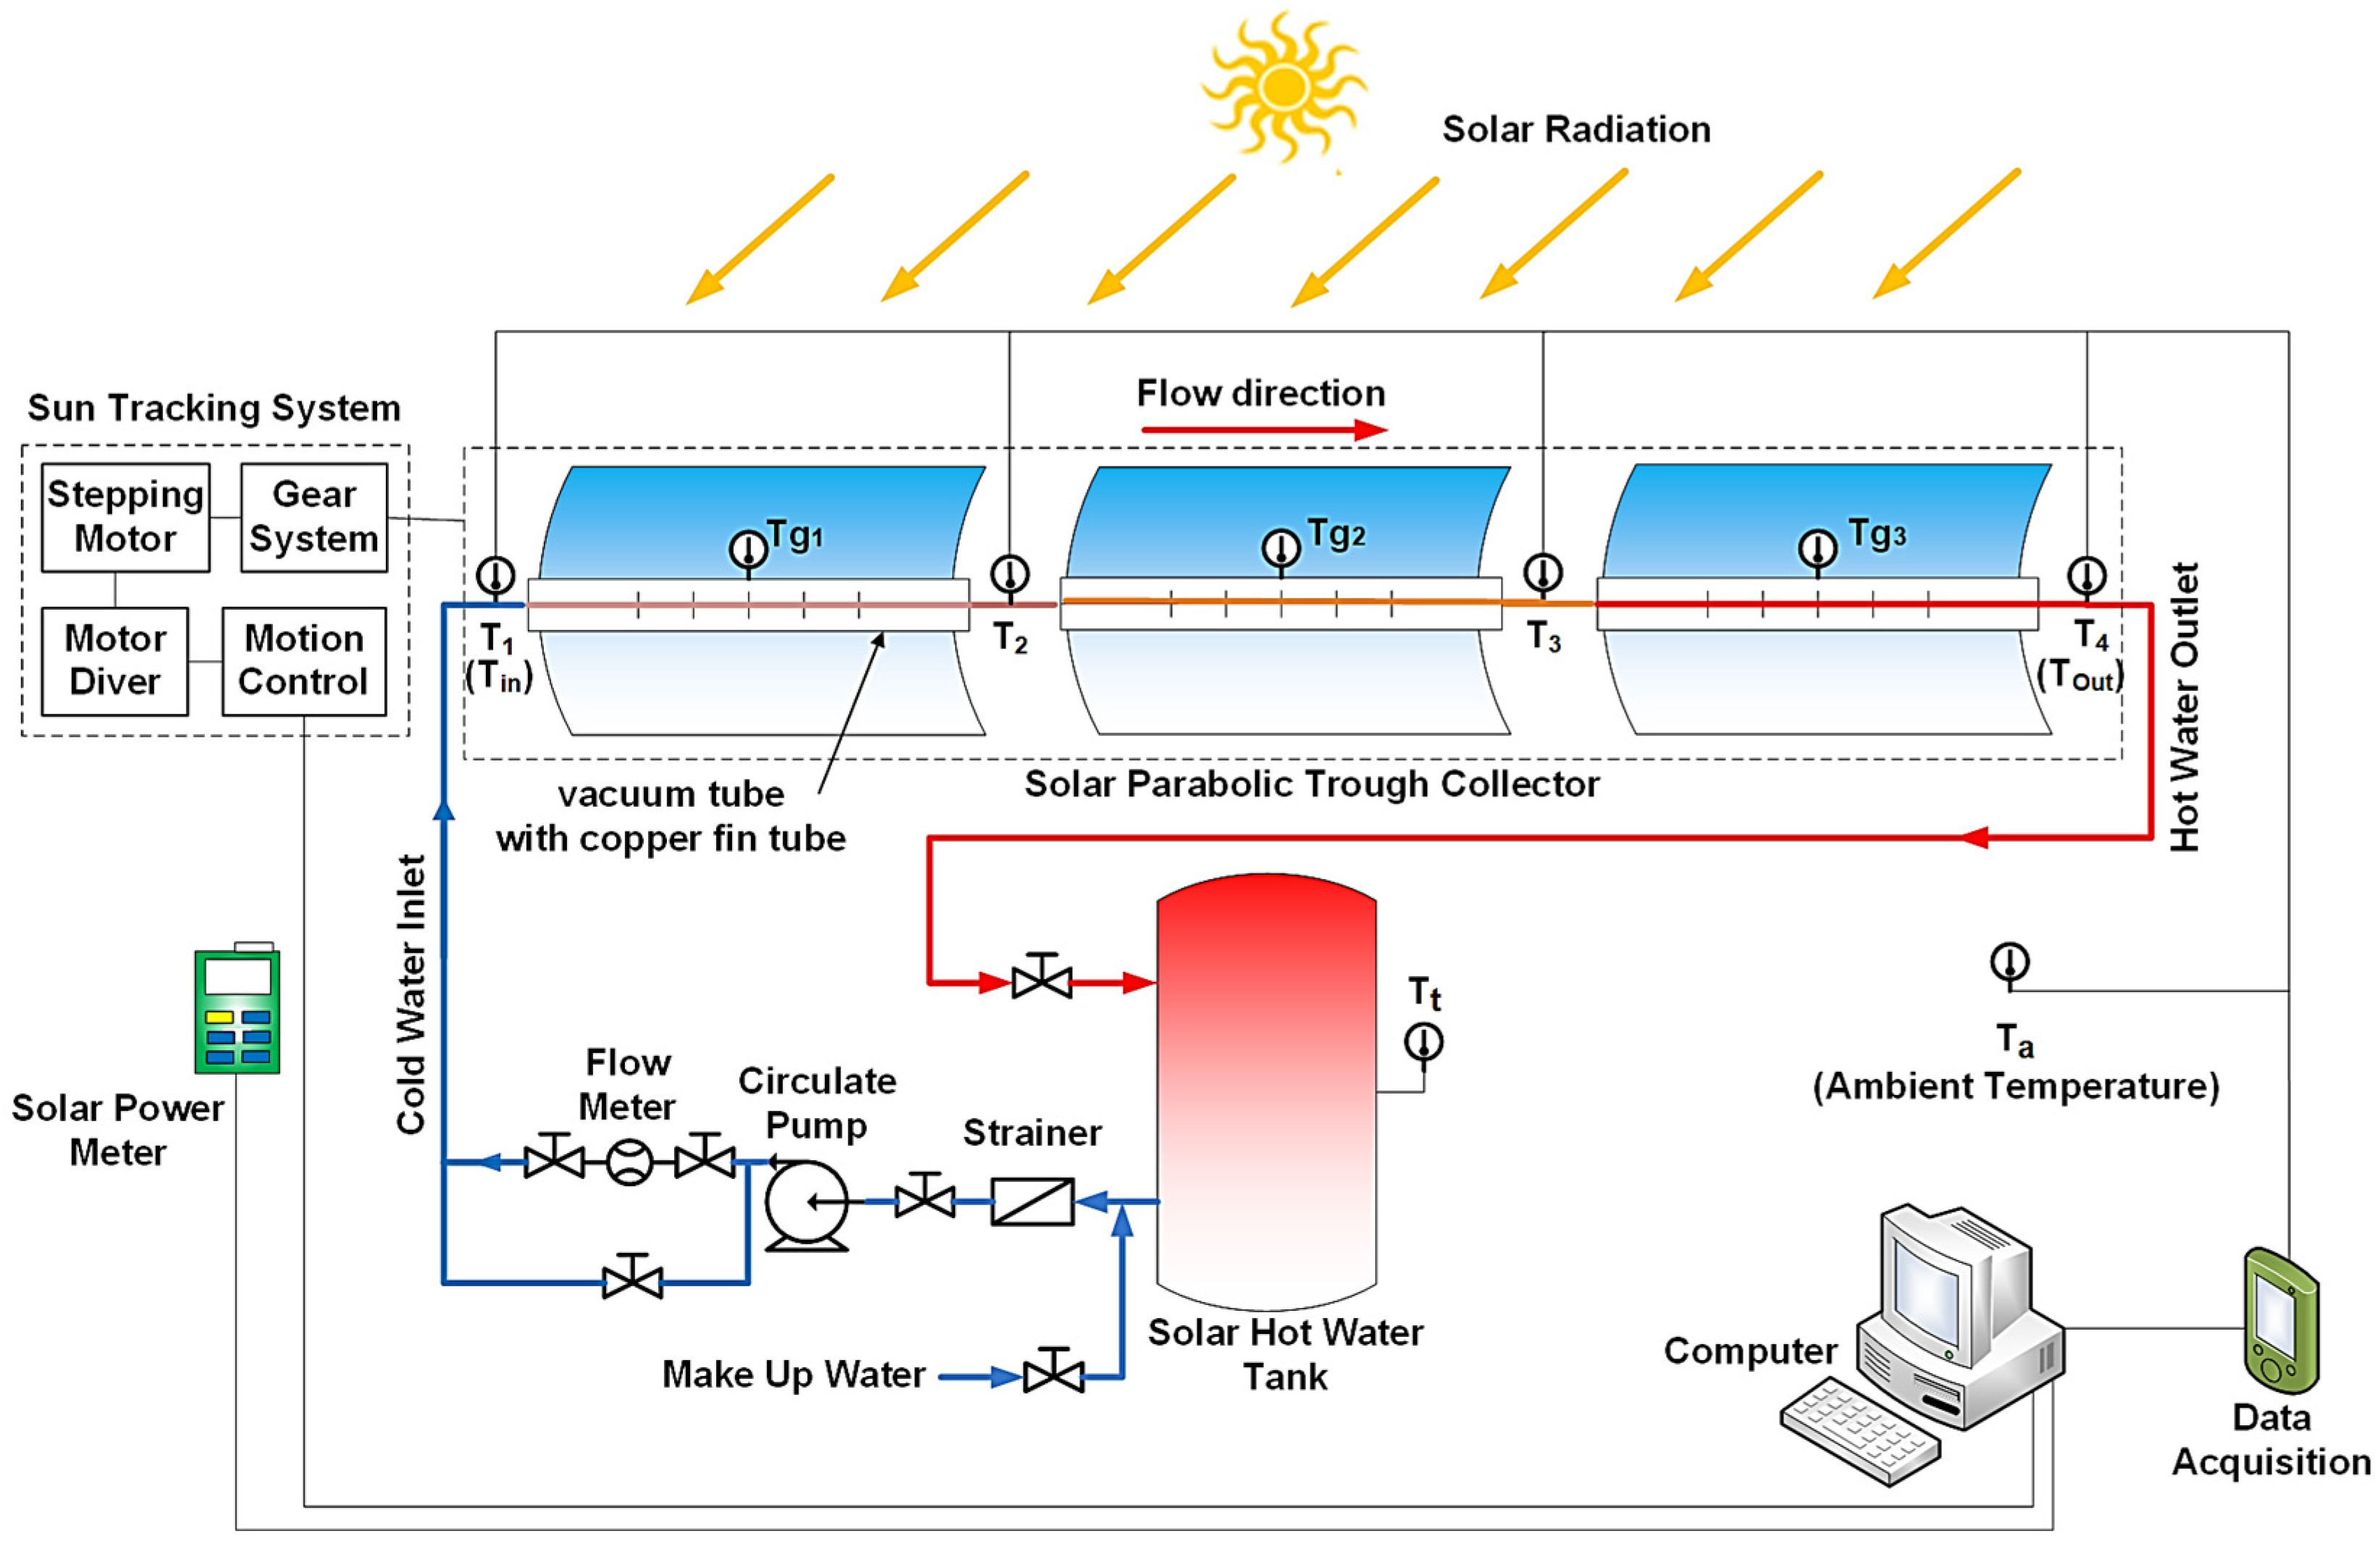
2.2. Experimental Setup
2.3. The Solar Tracking System
2.4. Data Reduction
2.5. Economic Evaluation
2.6. Uncertainty Analysis
3. Results and Discussion
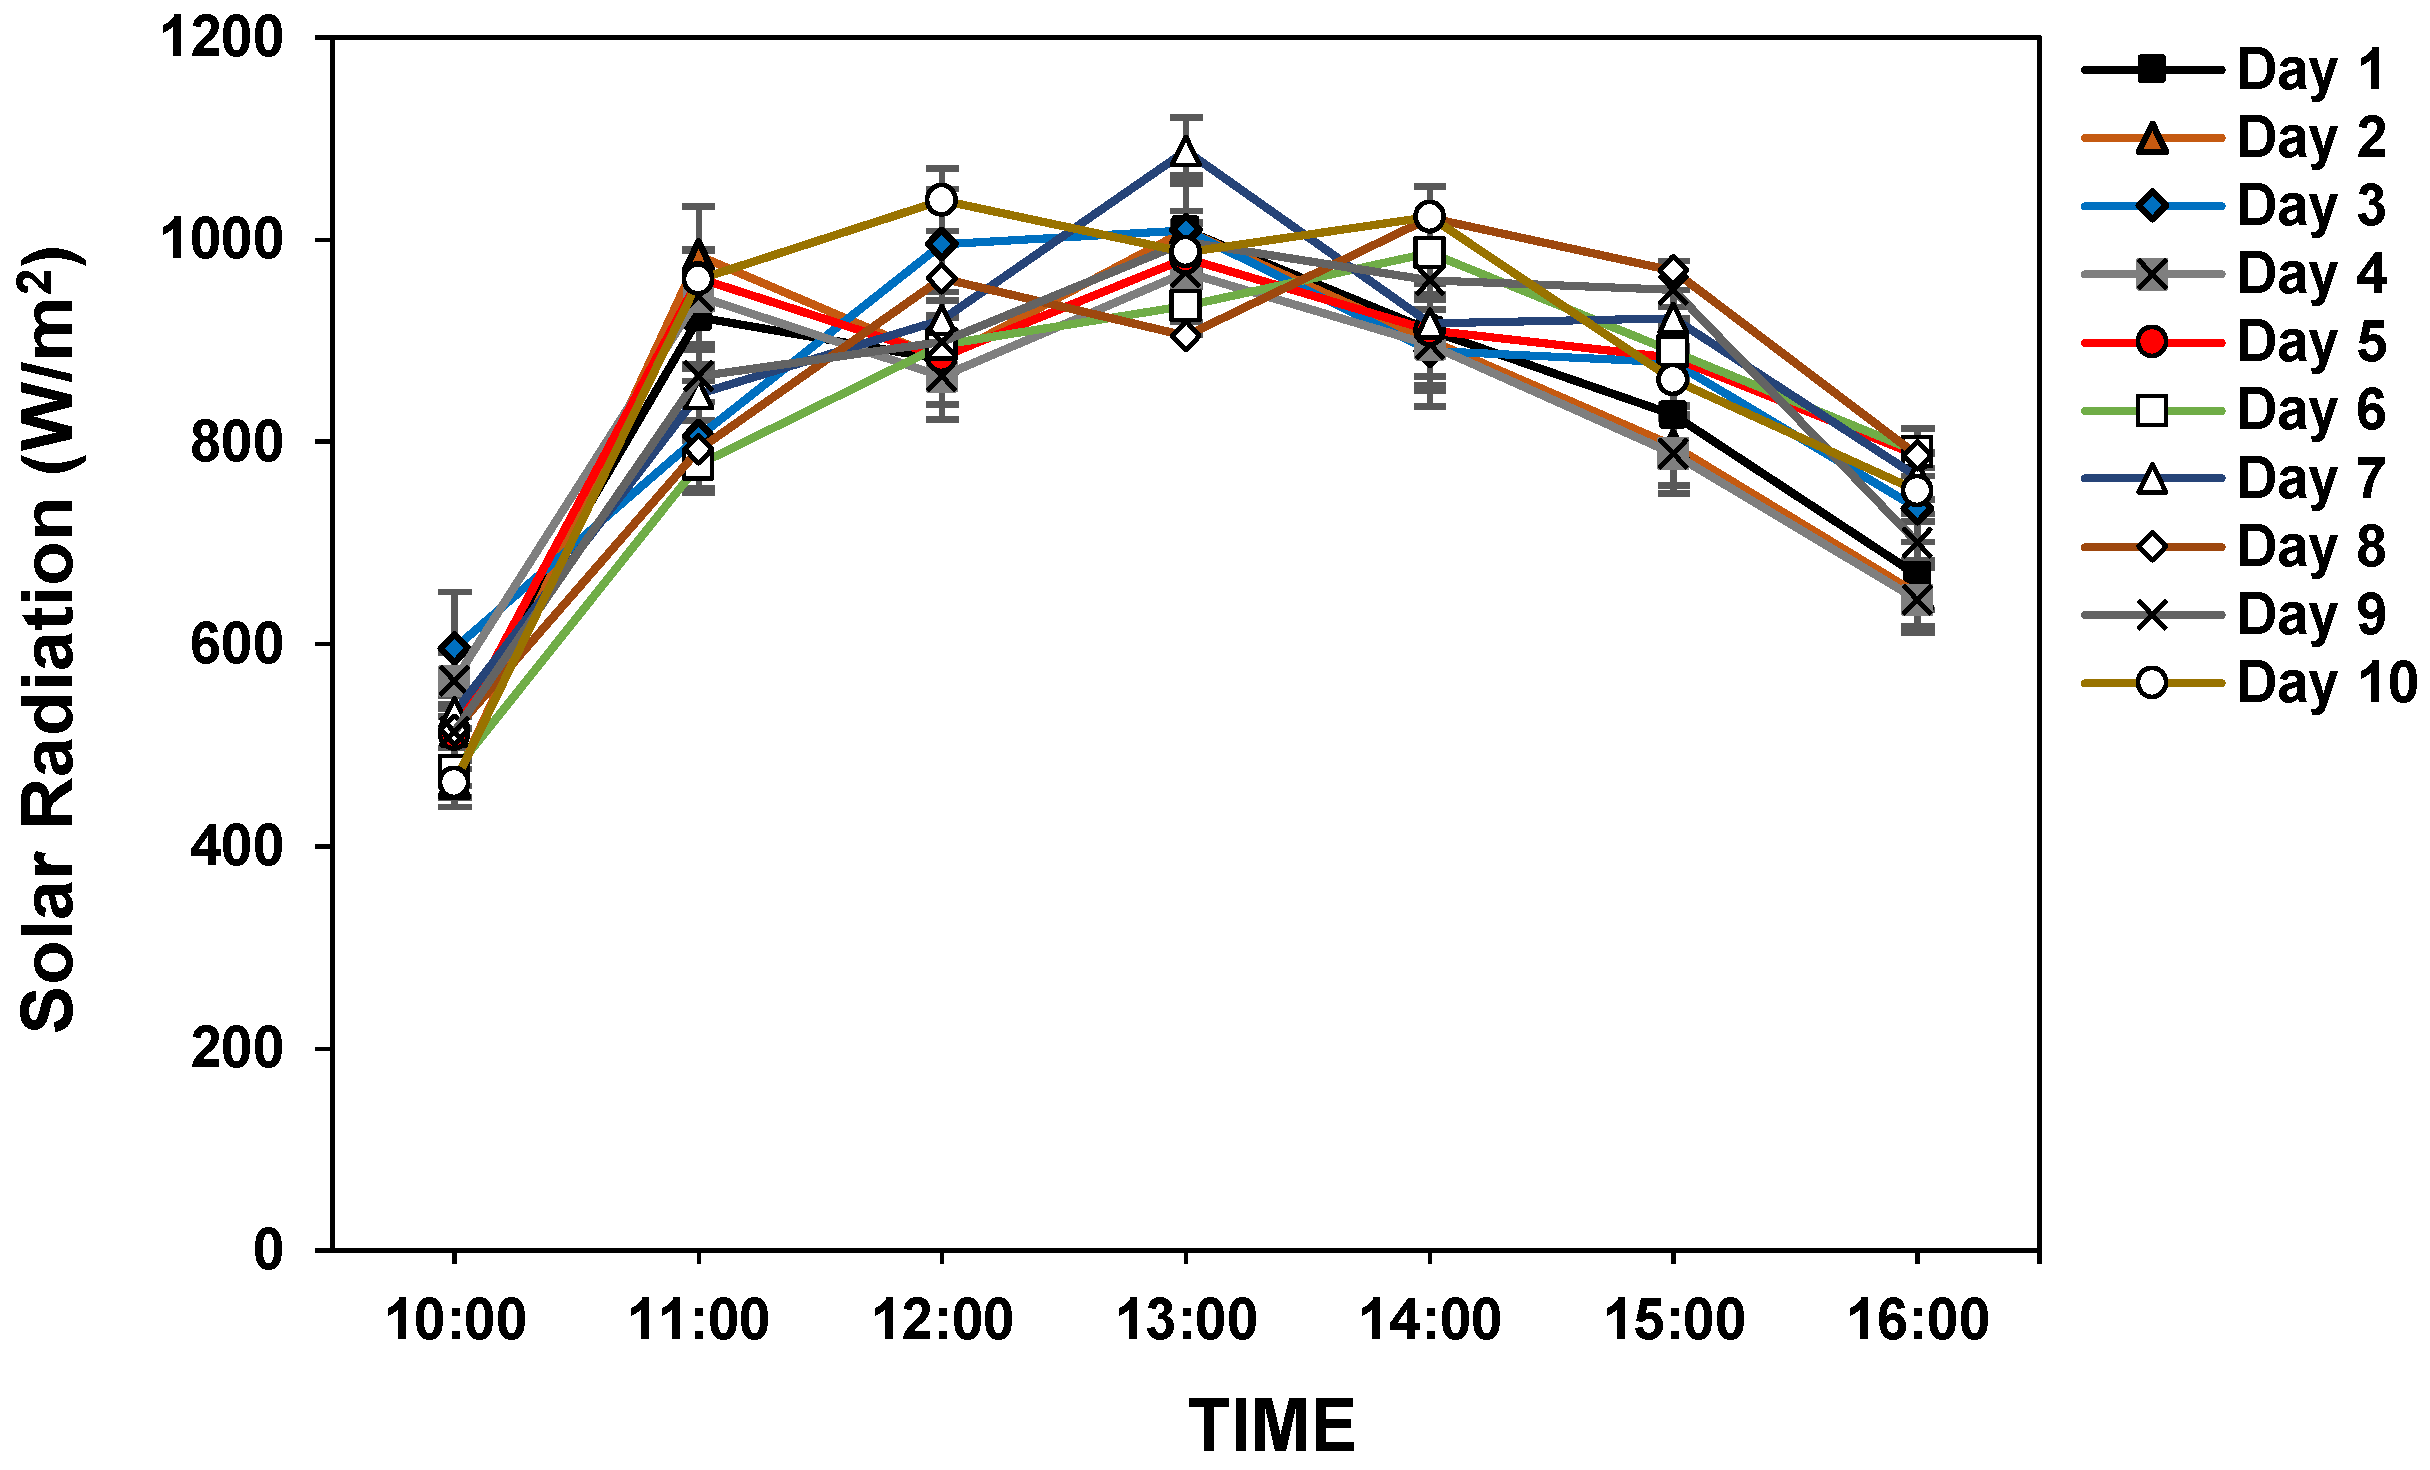
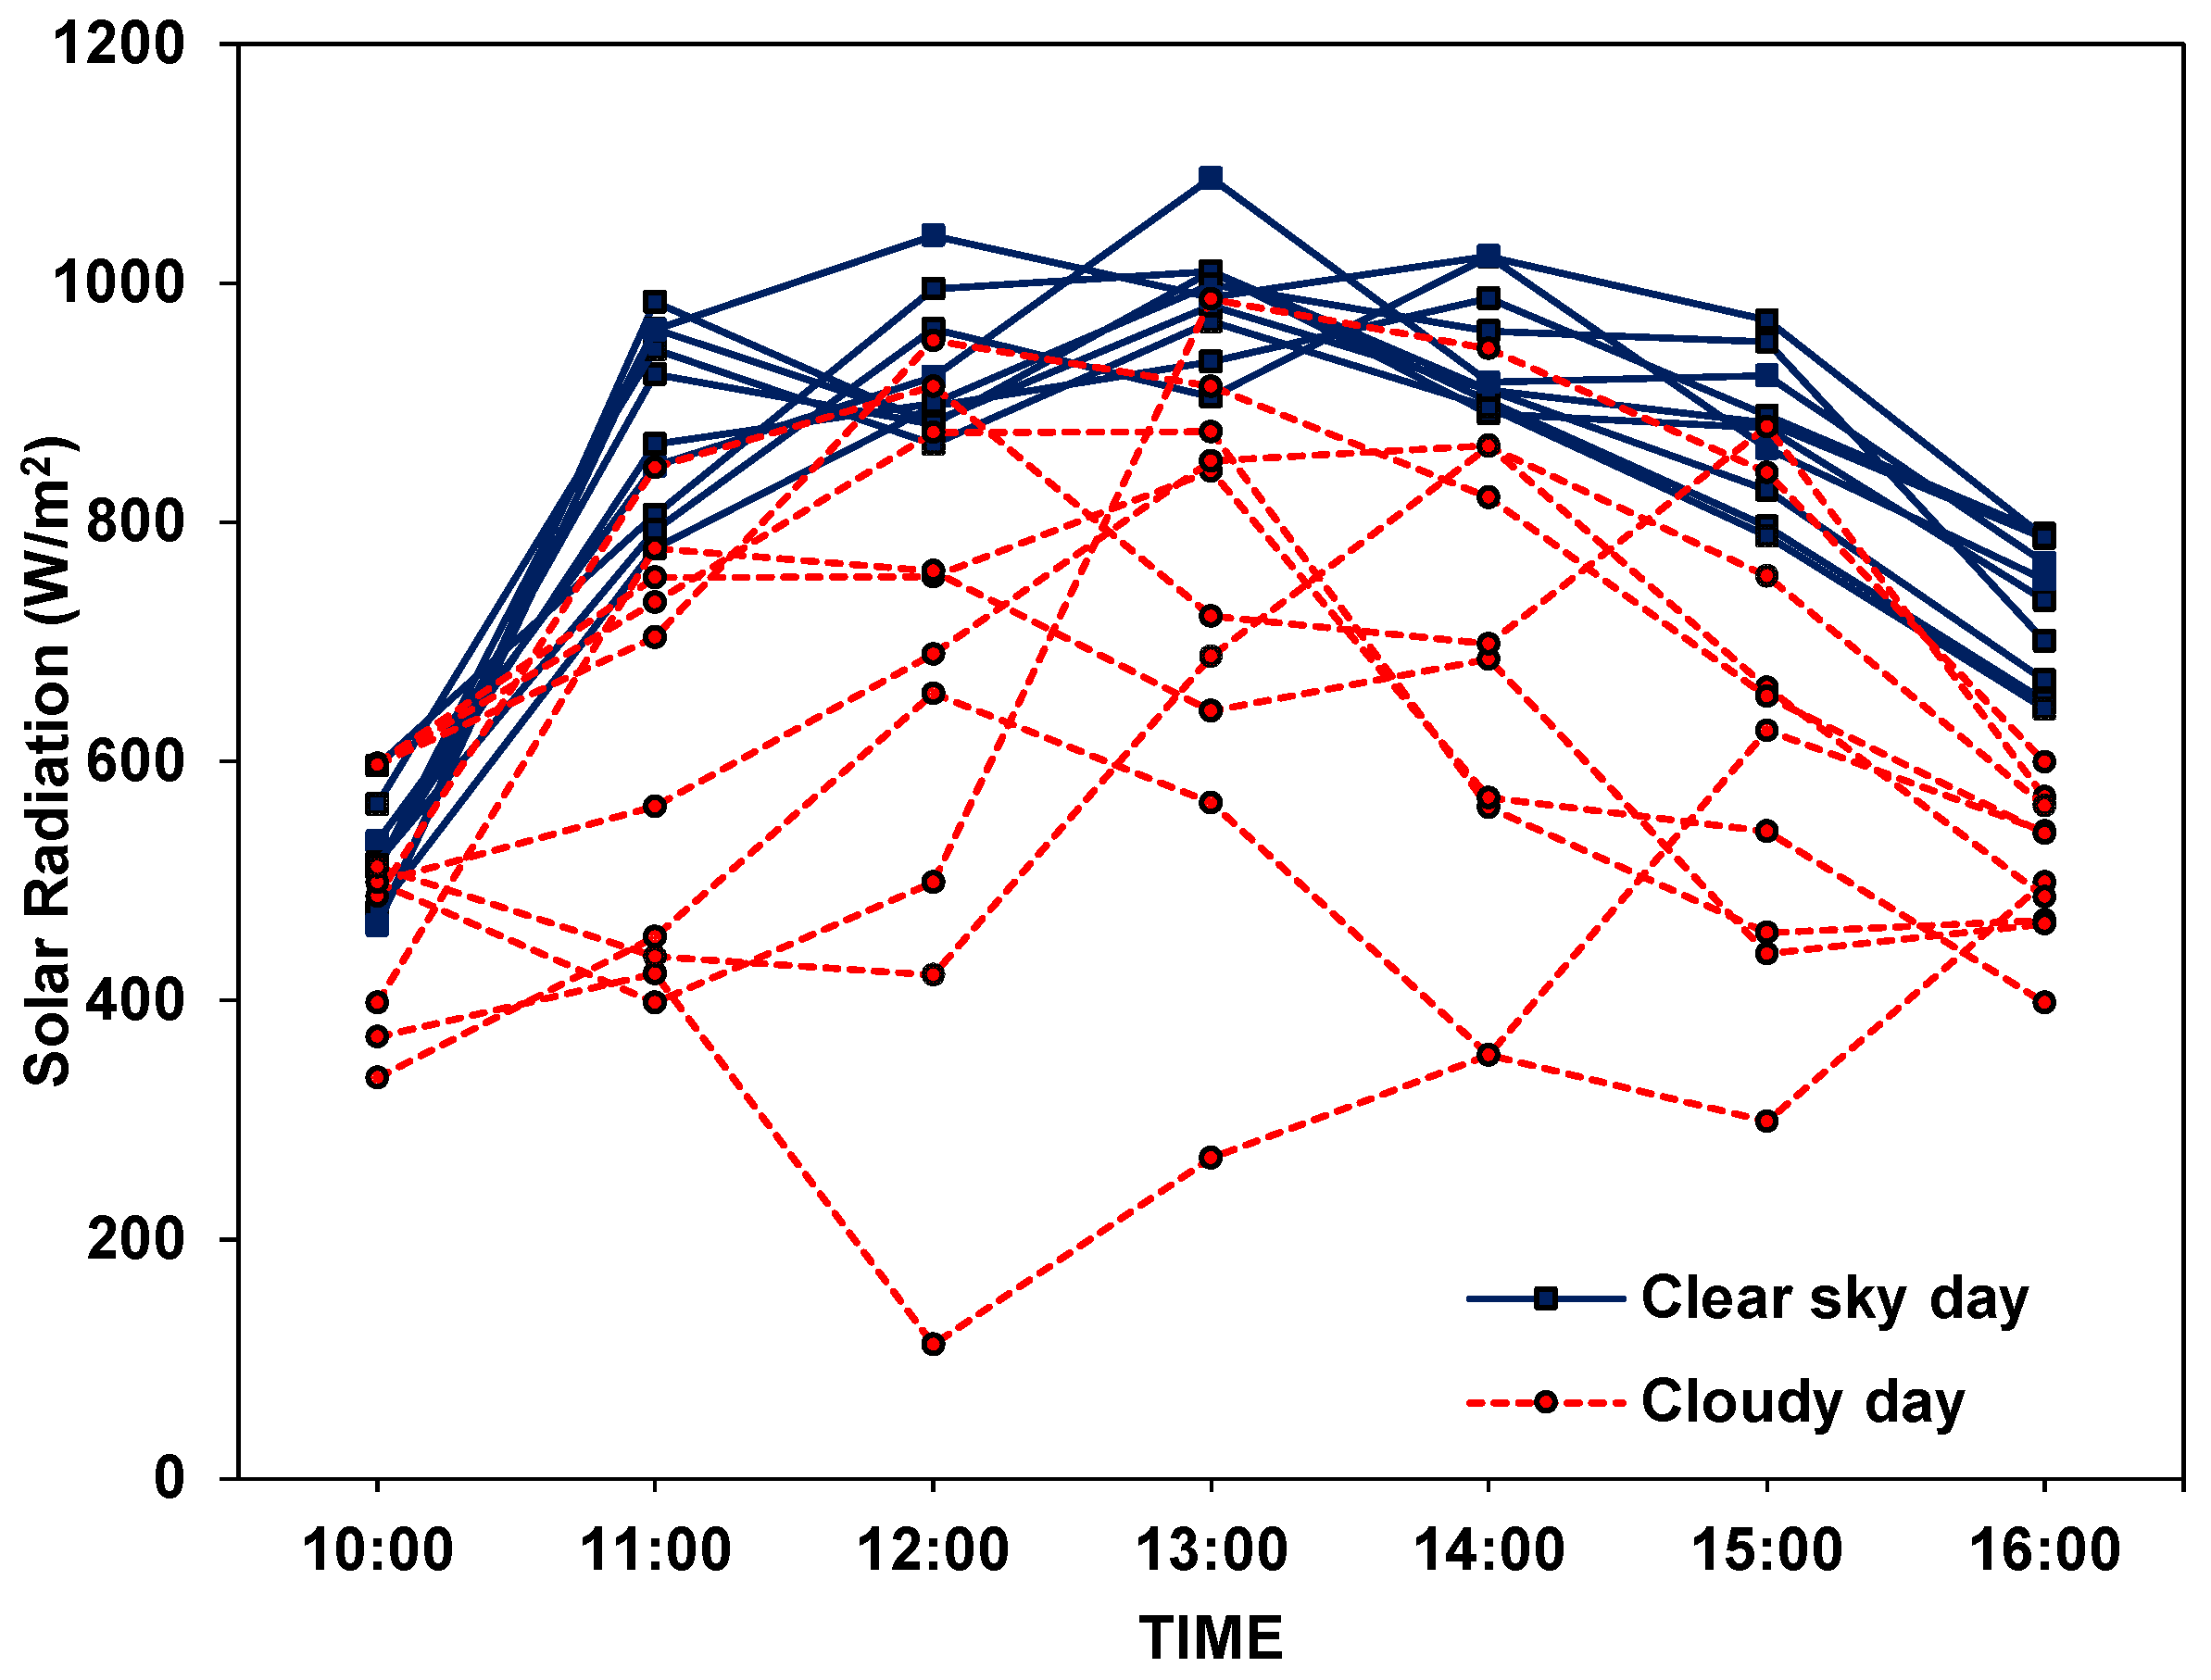
3.1. Solar Radiation with Time
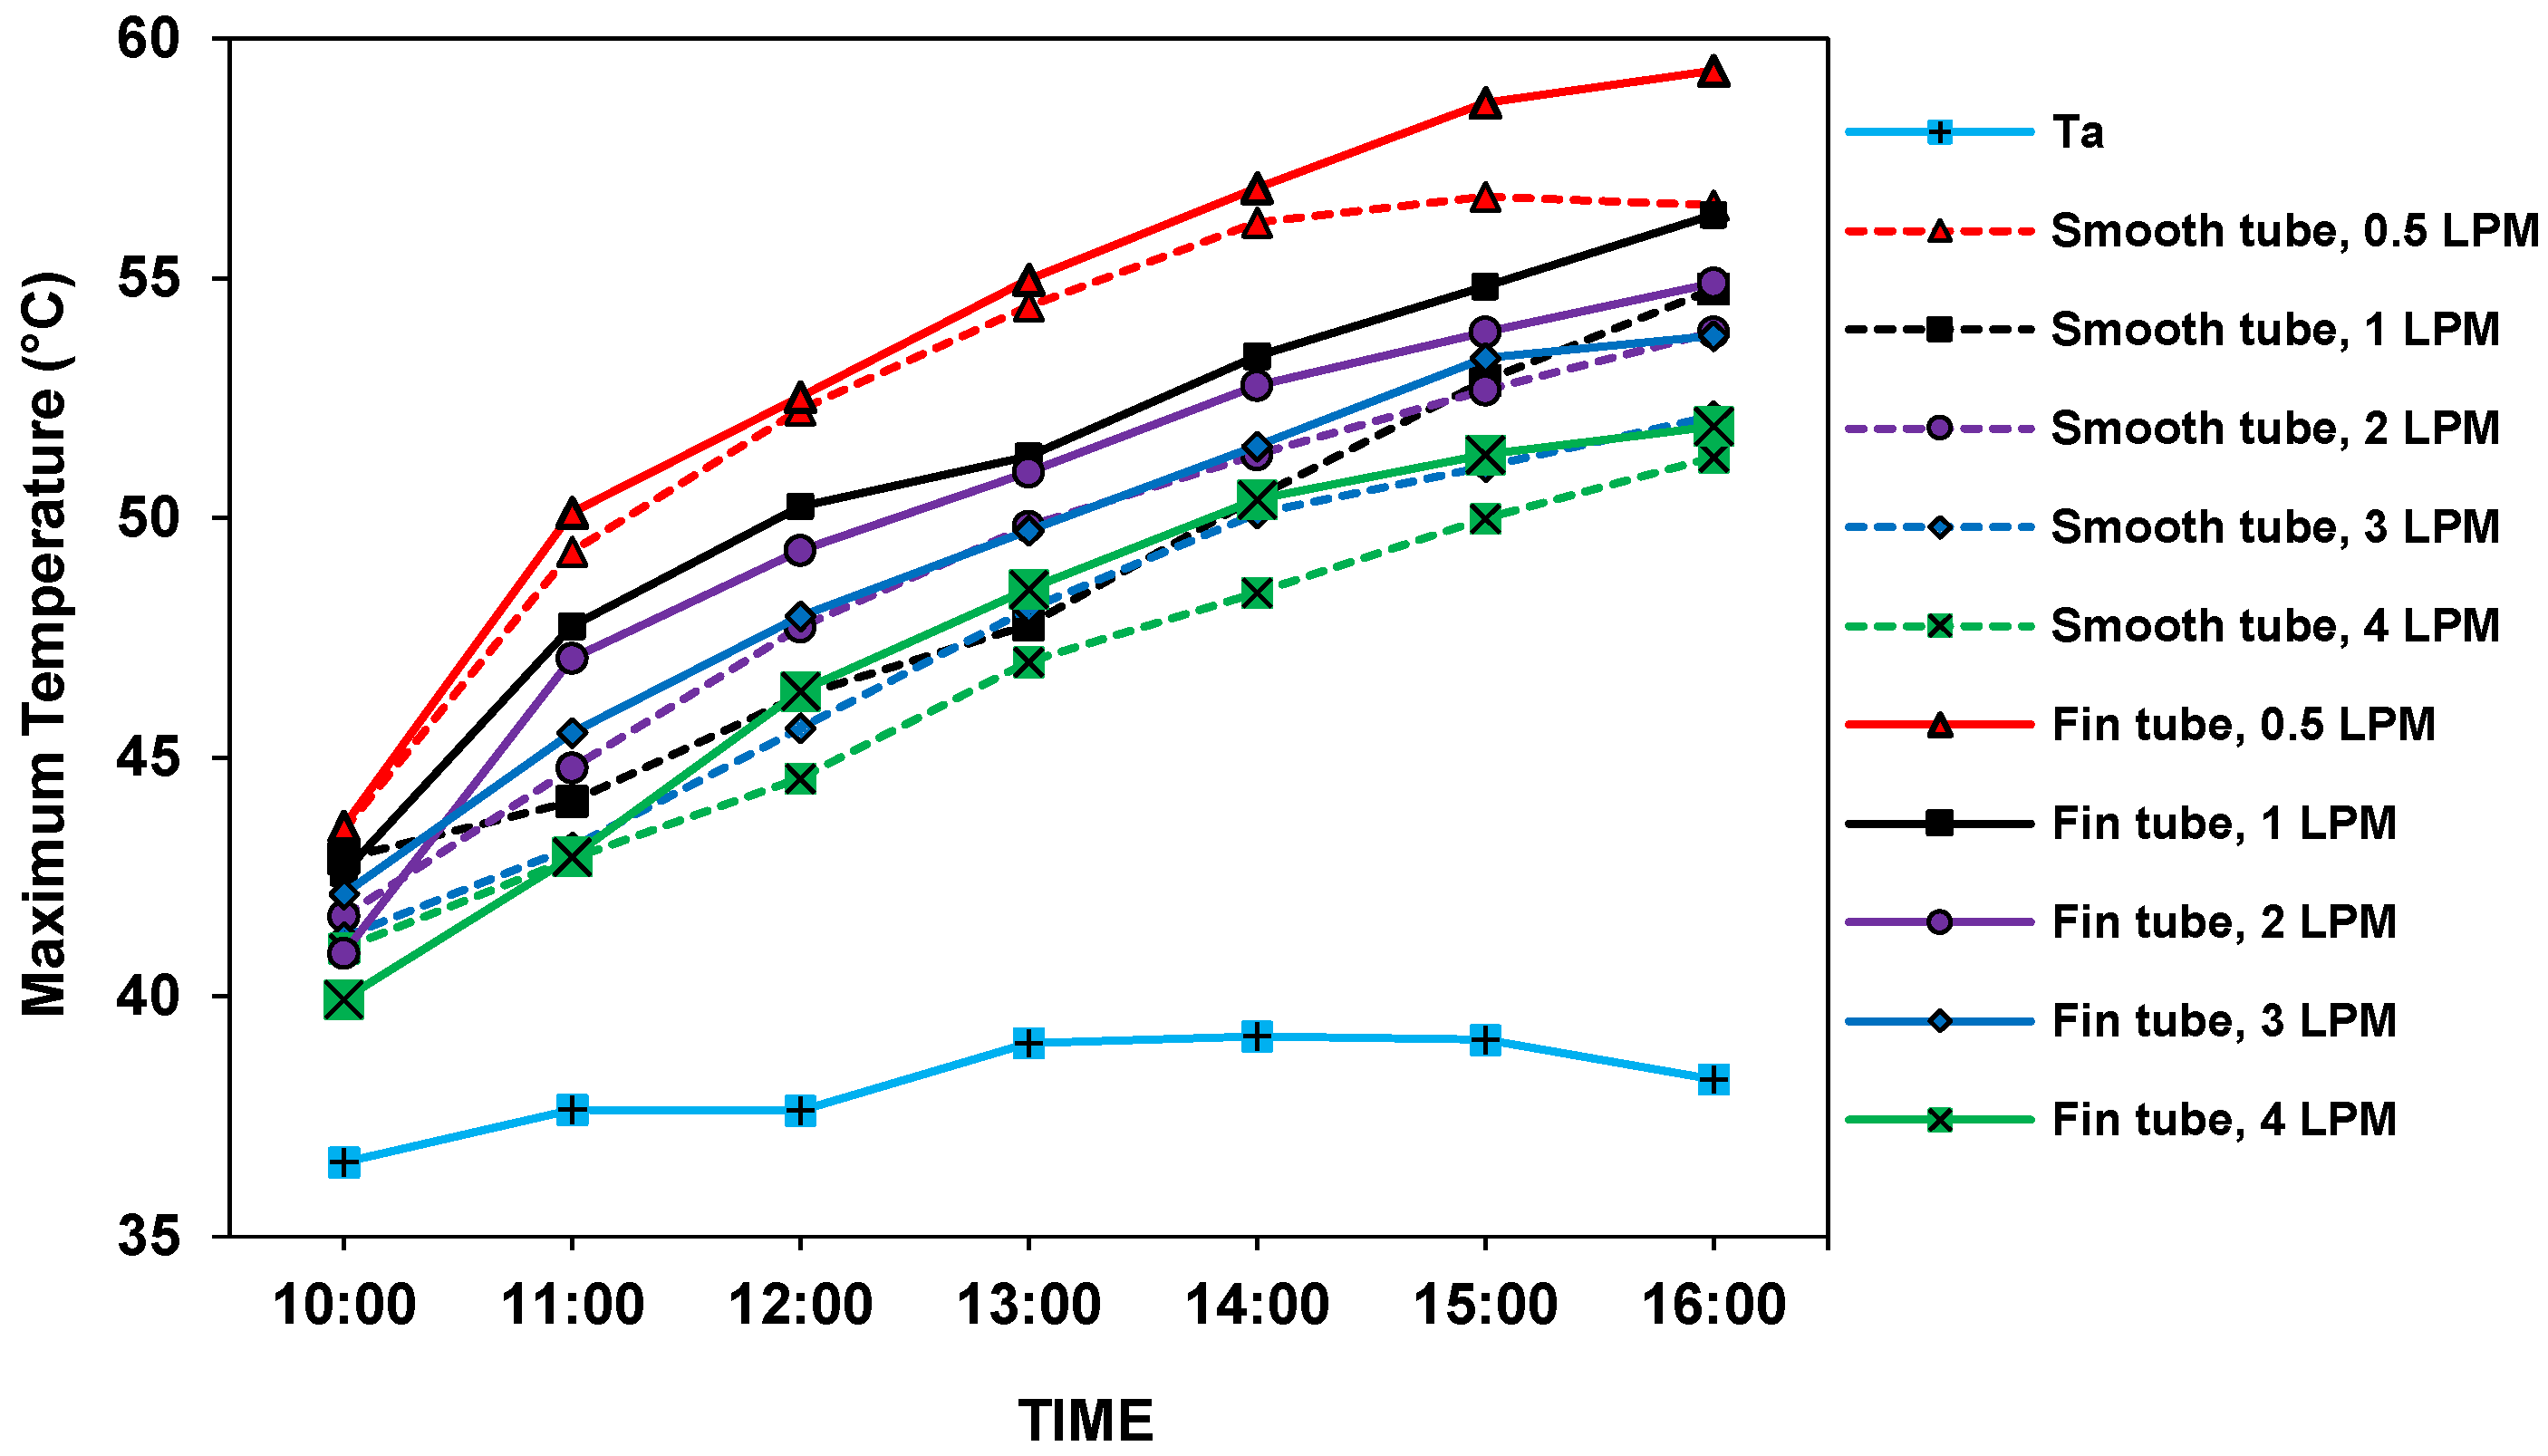
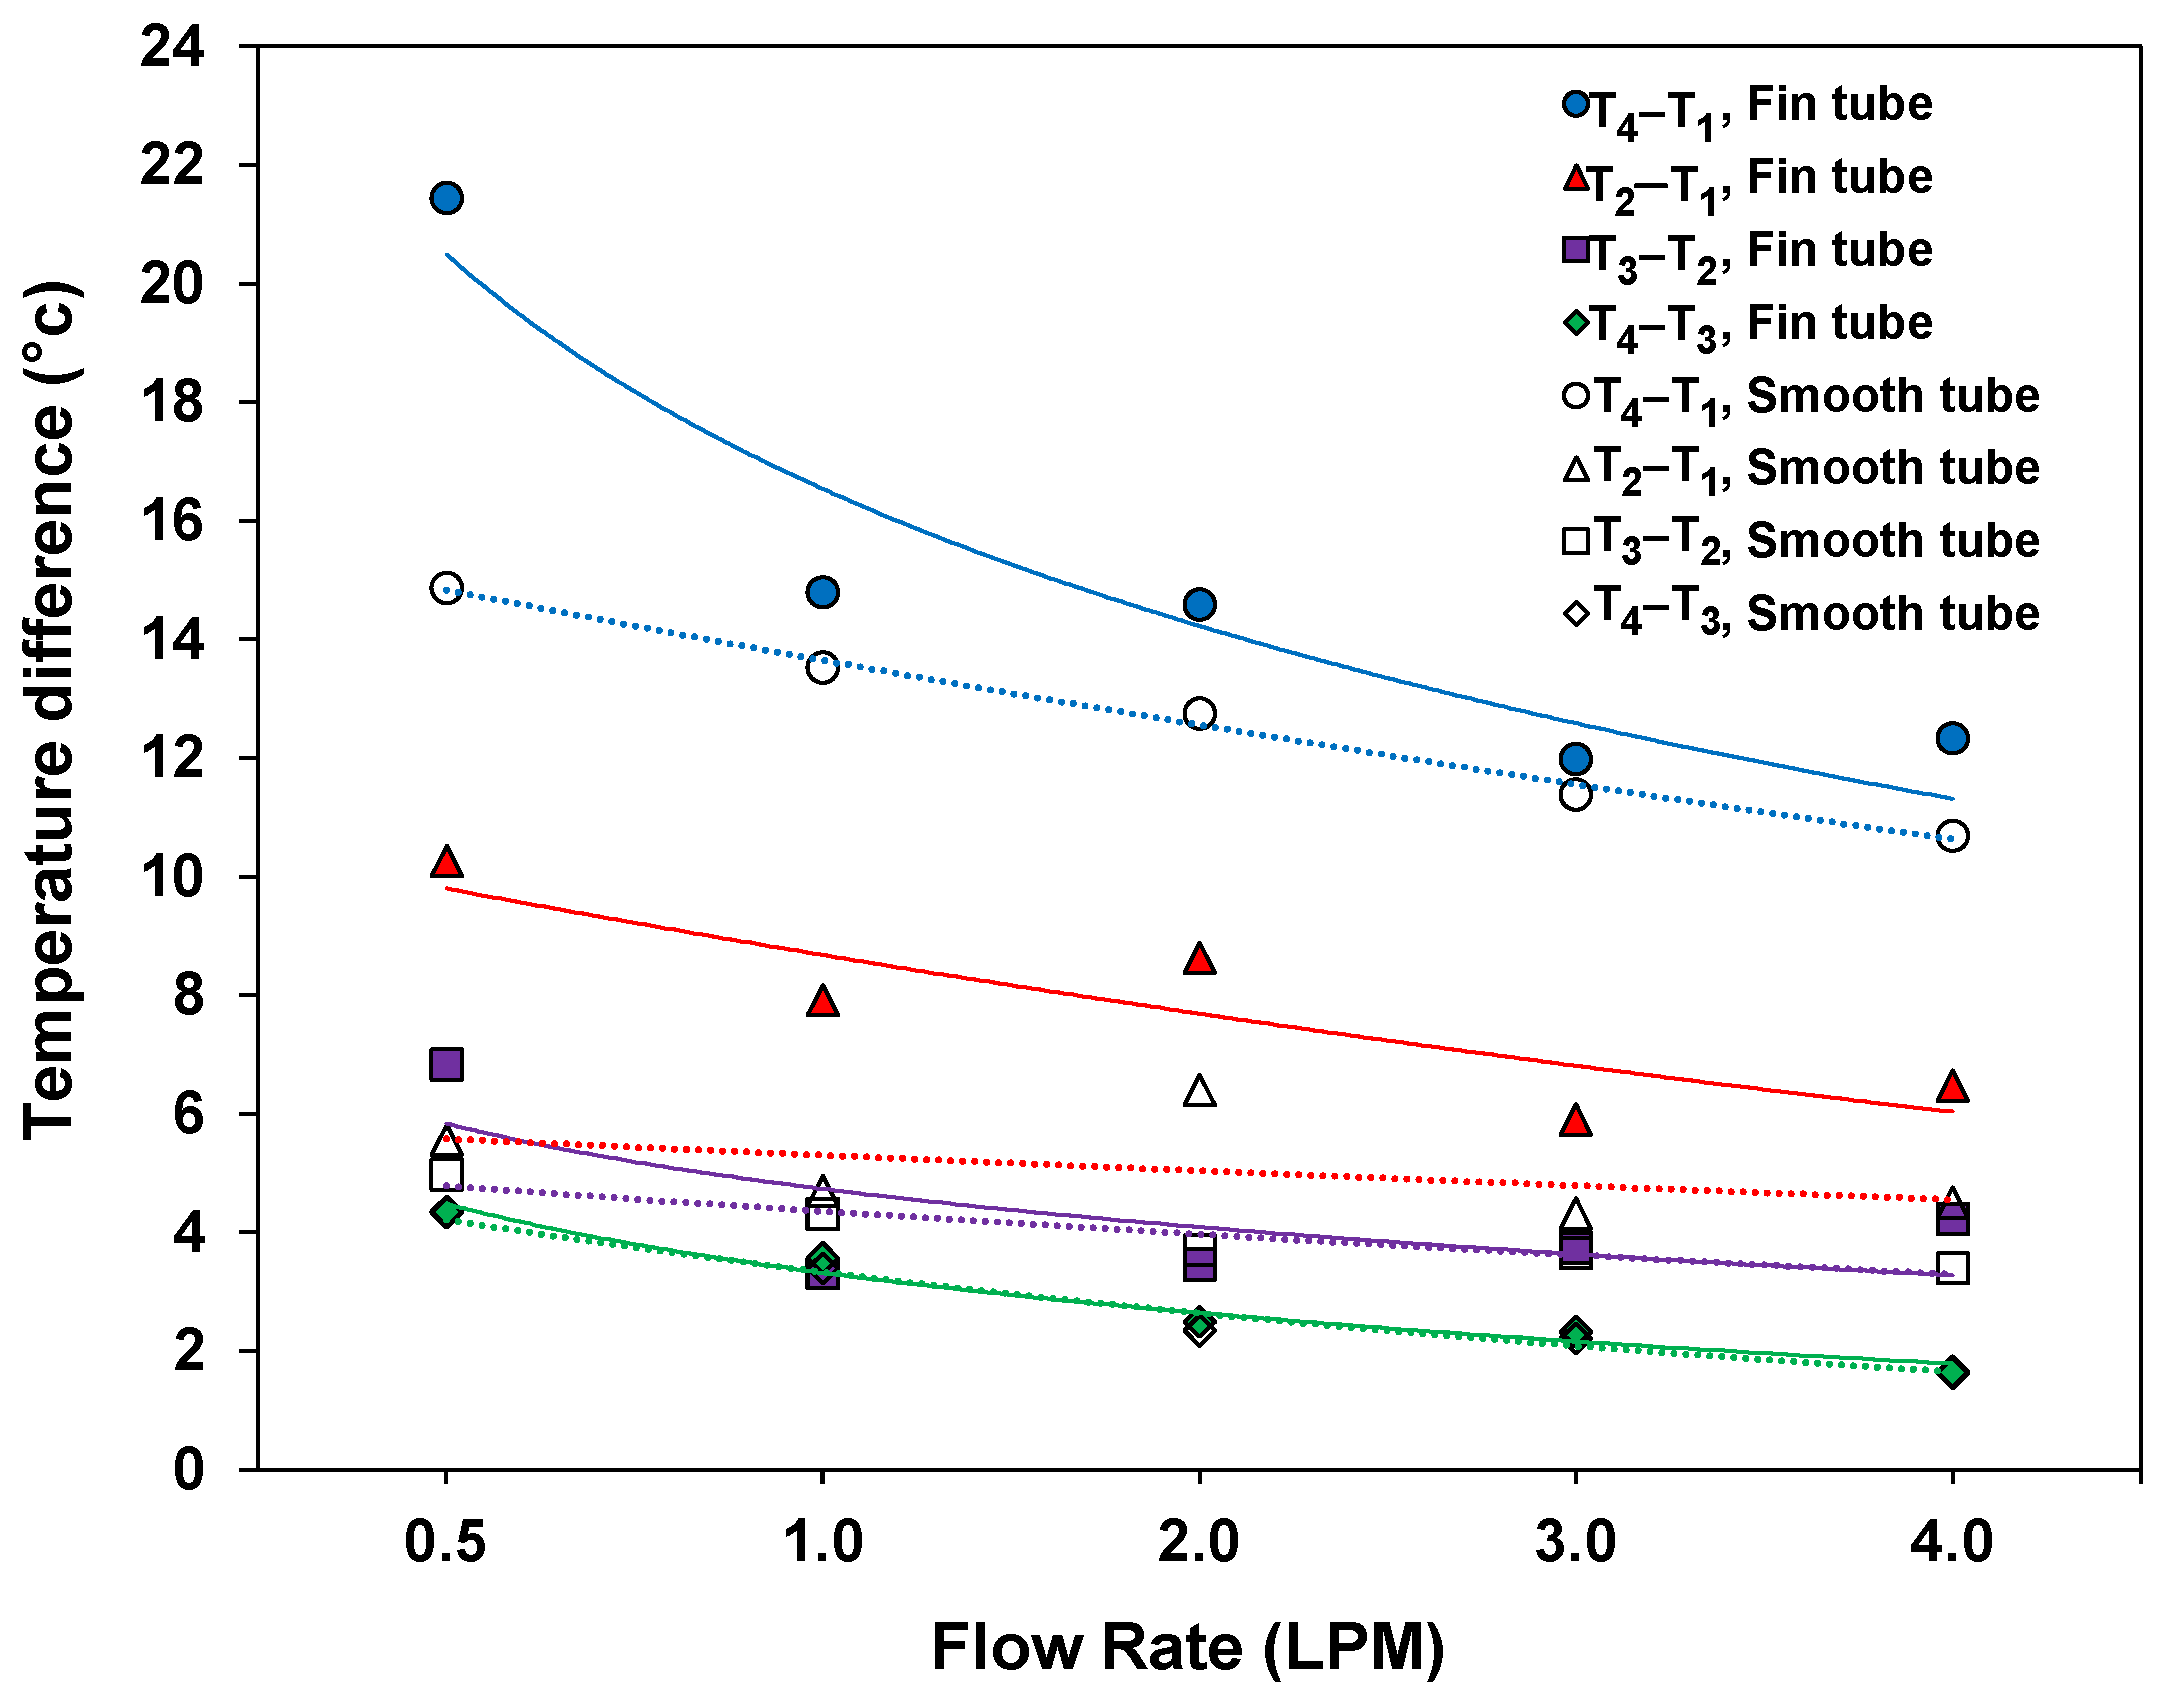
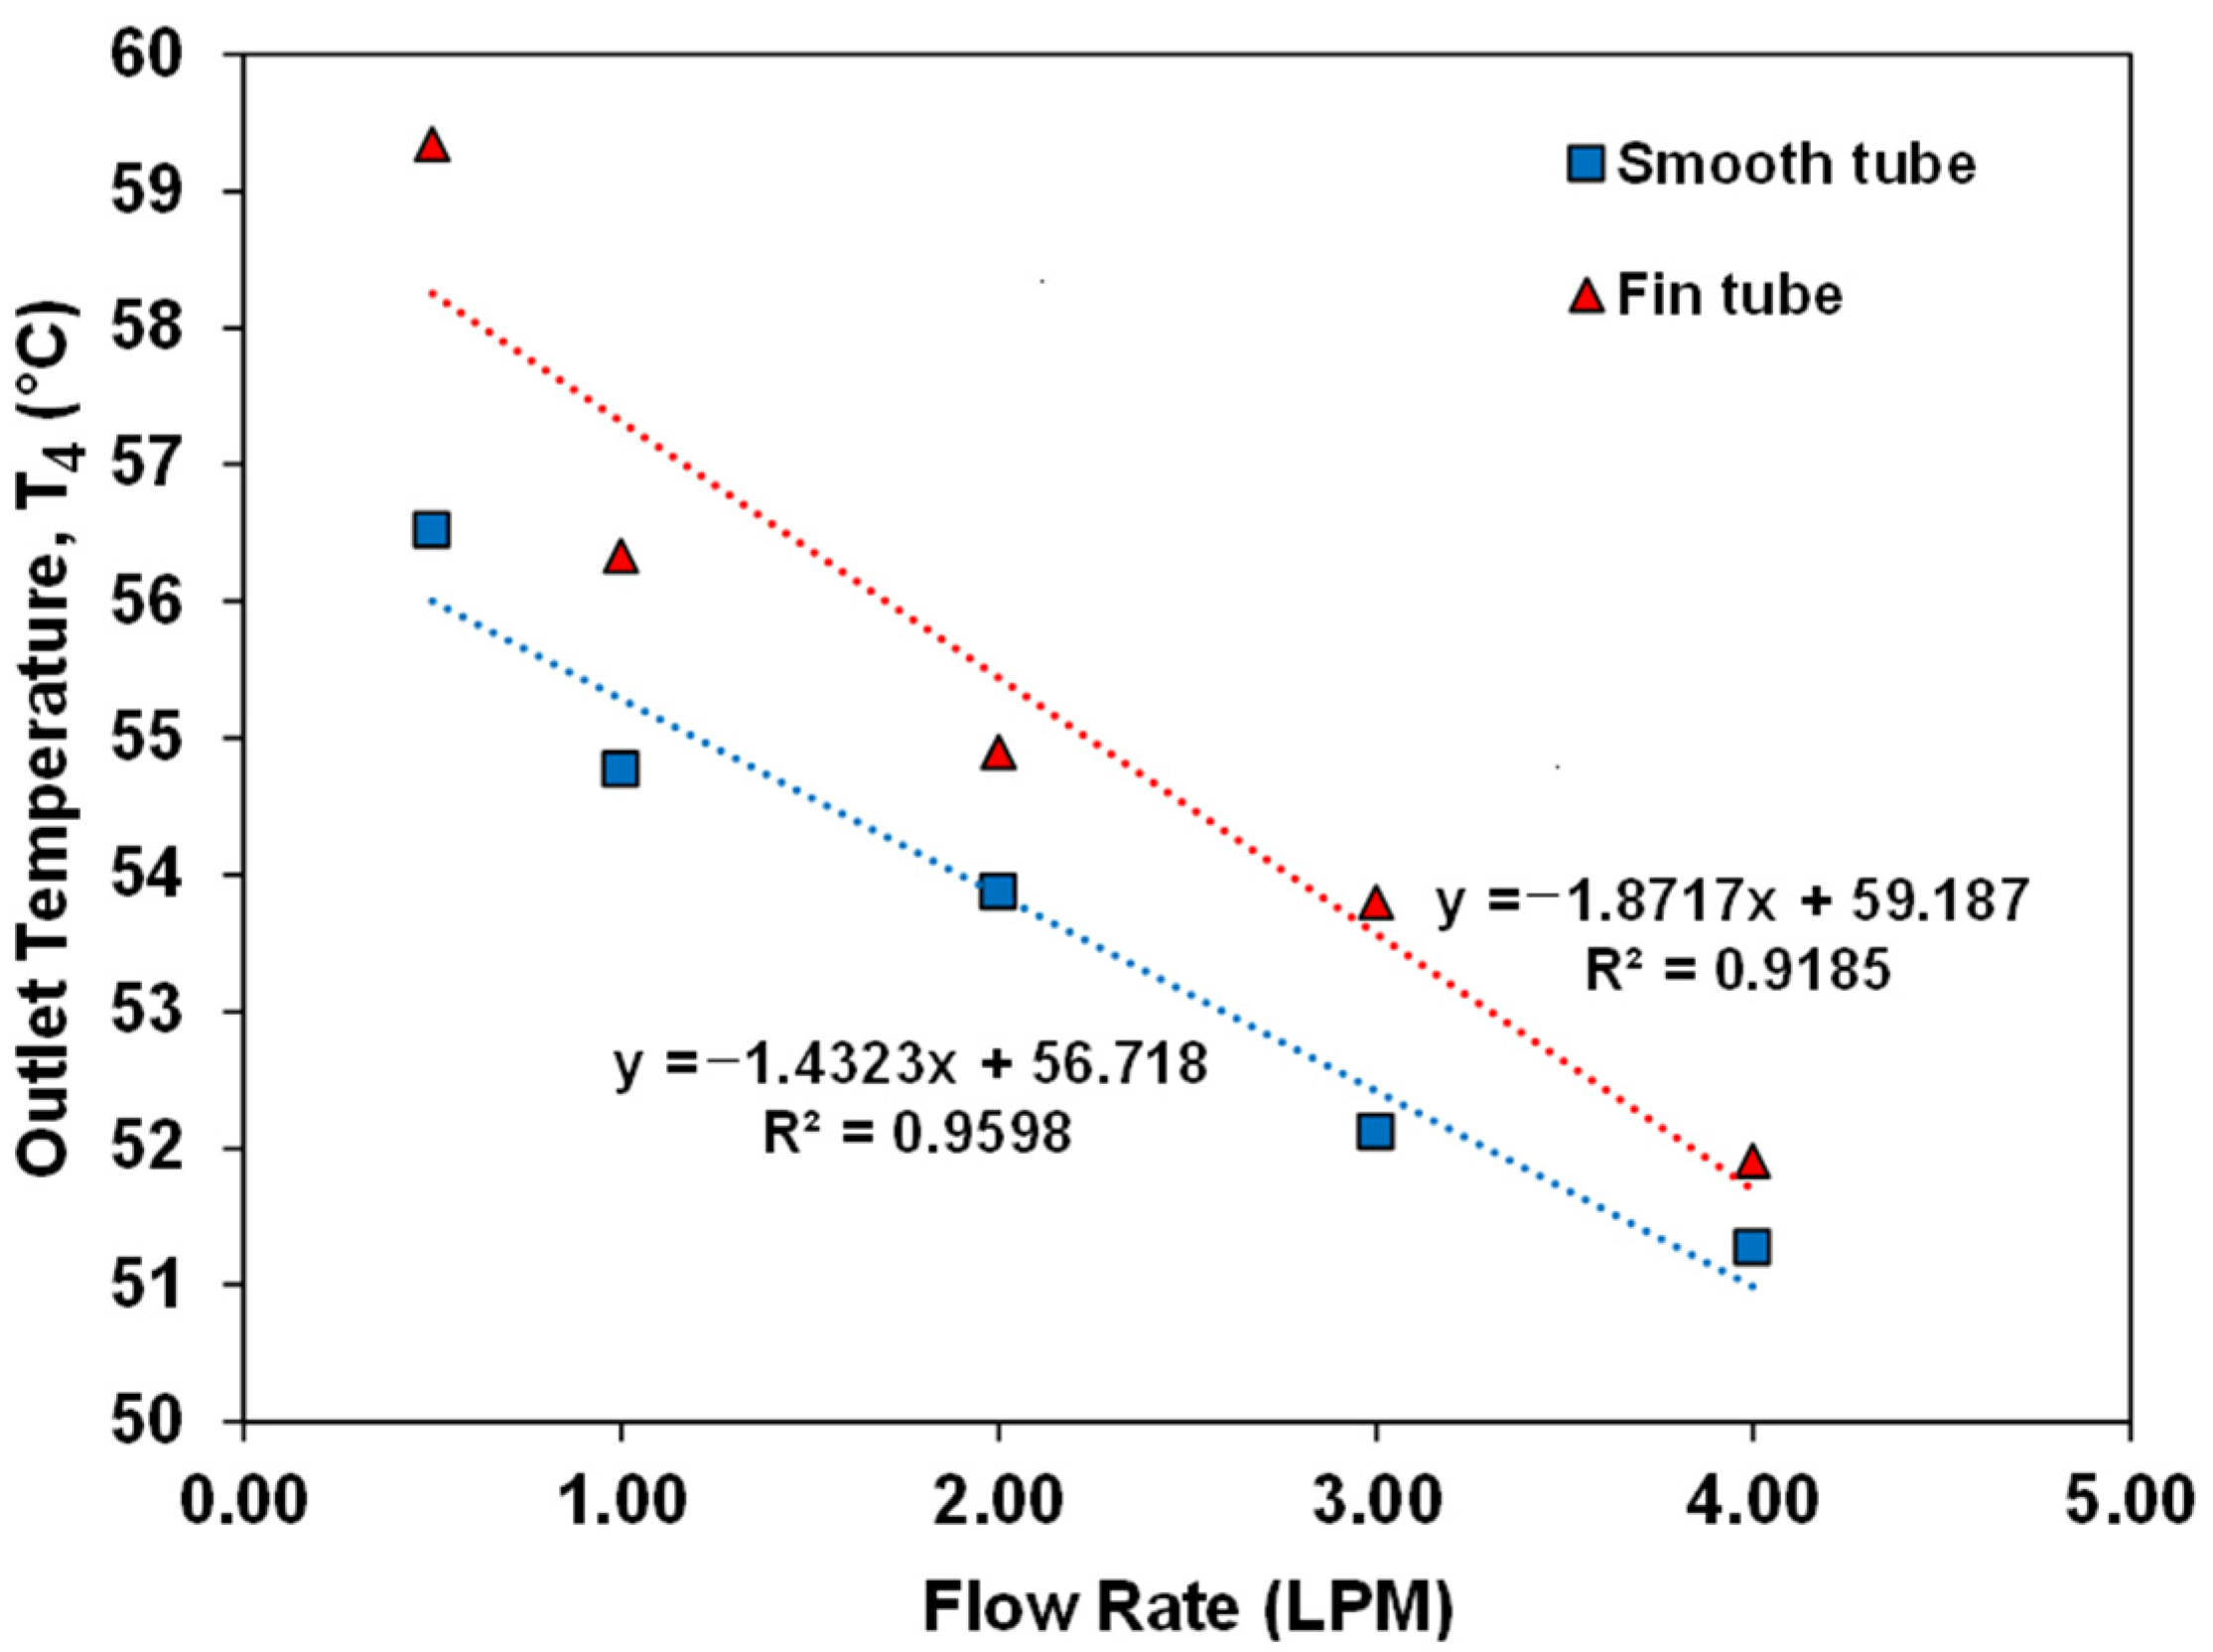
3.2. Outlet Water Temperature
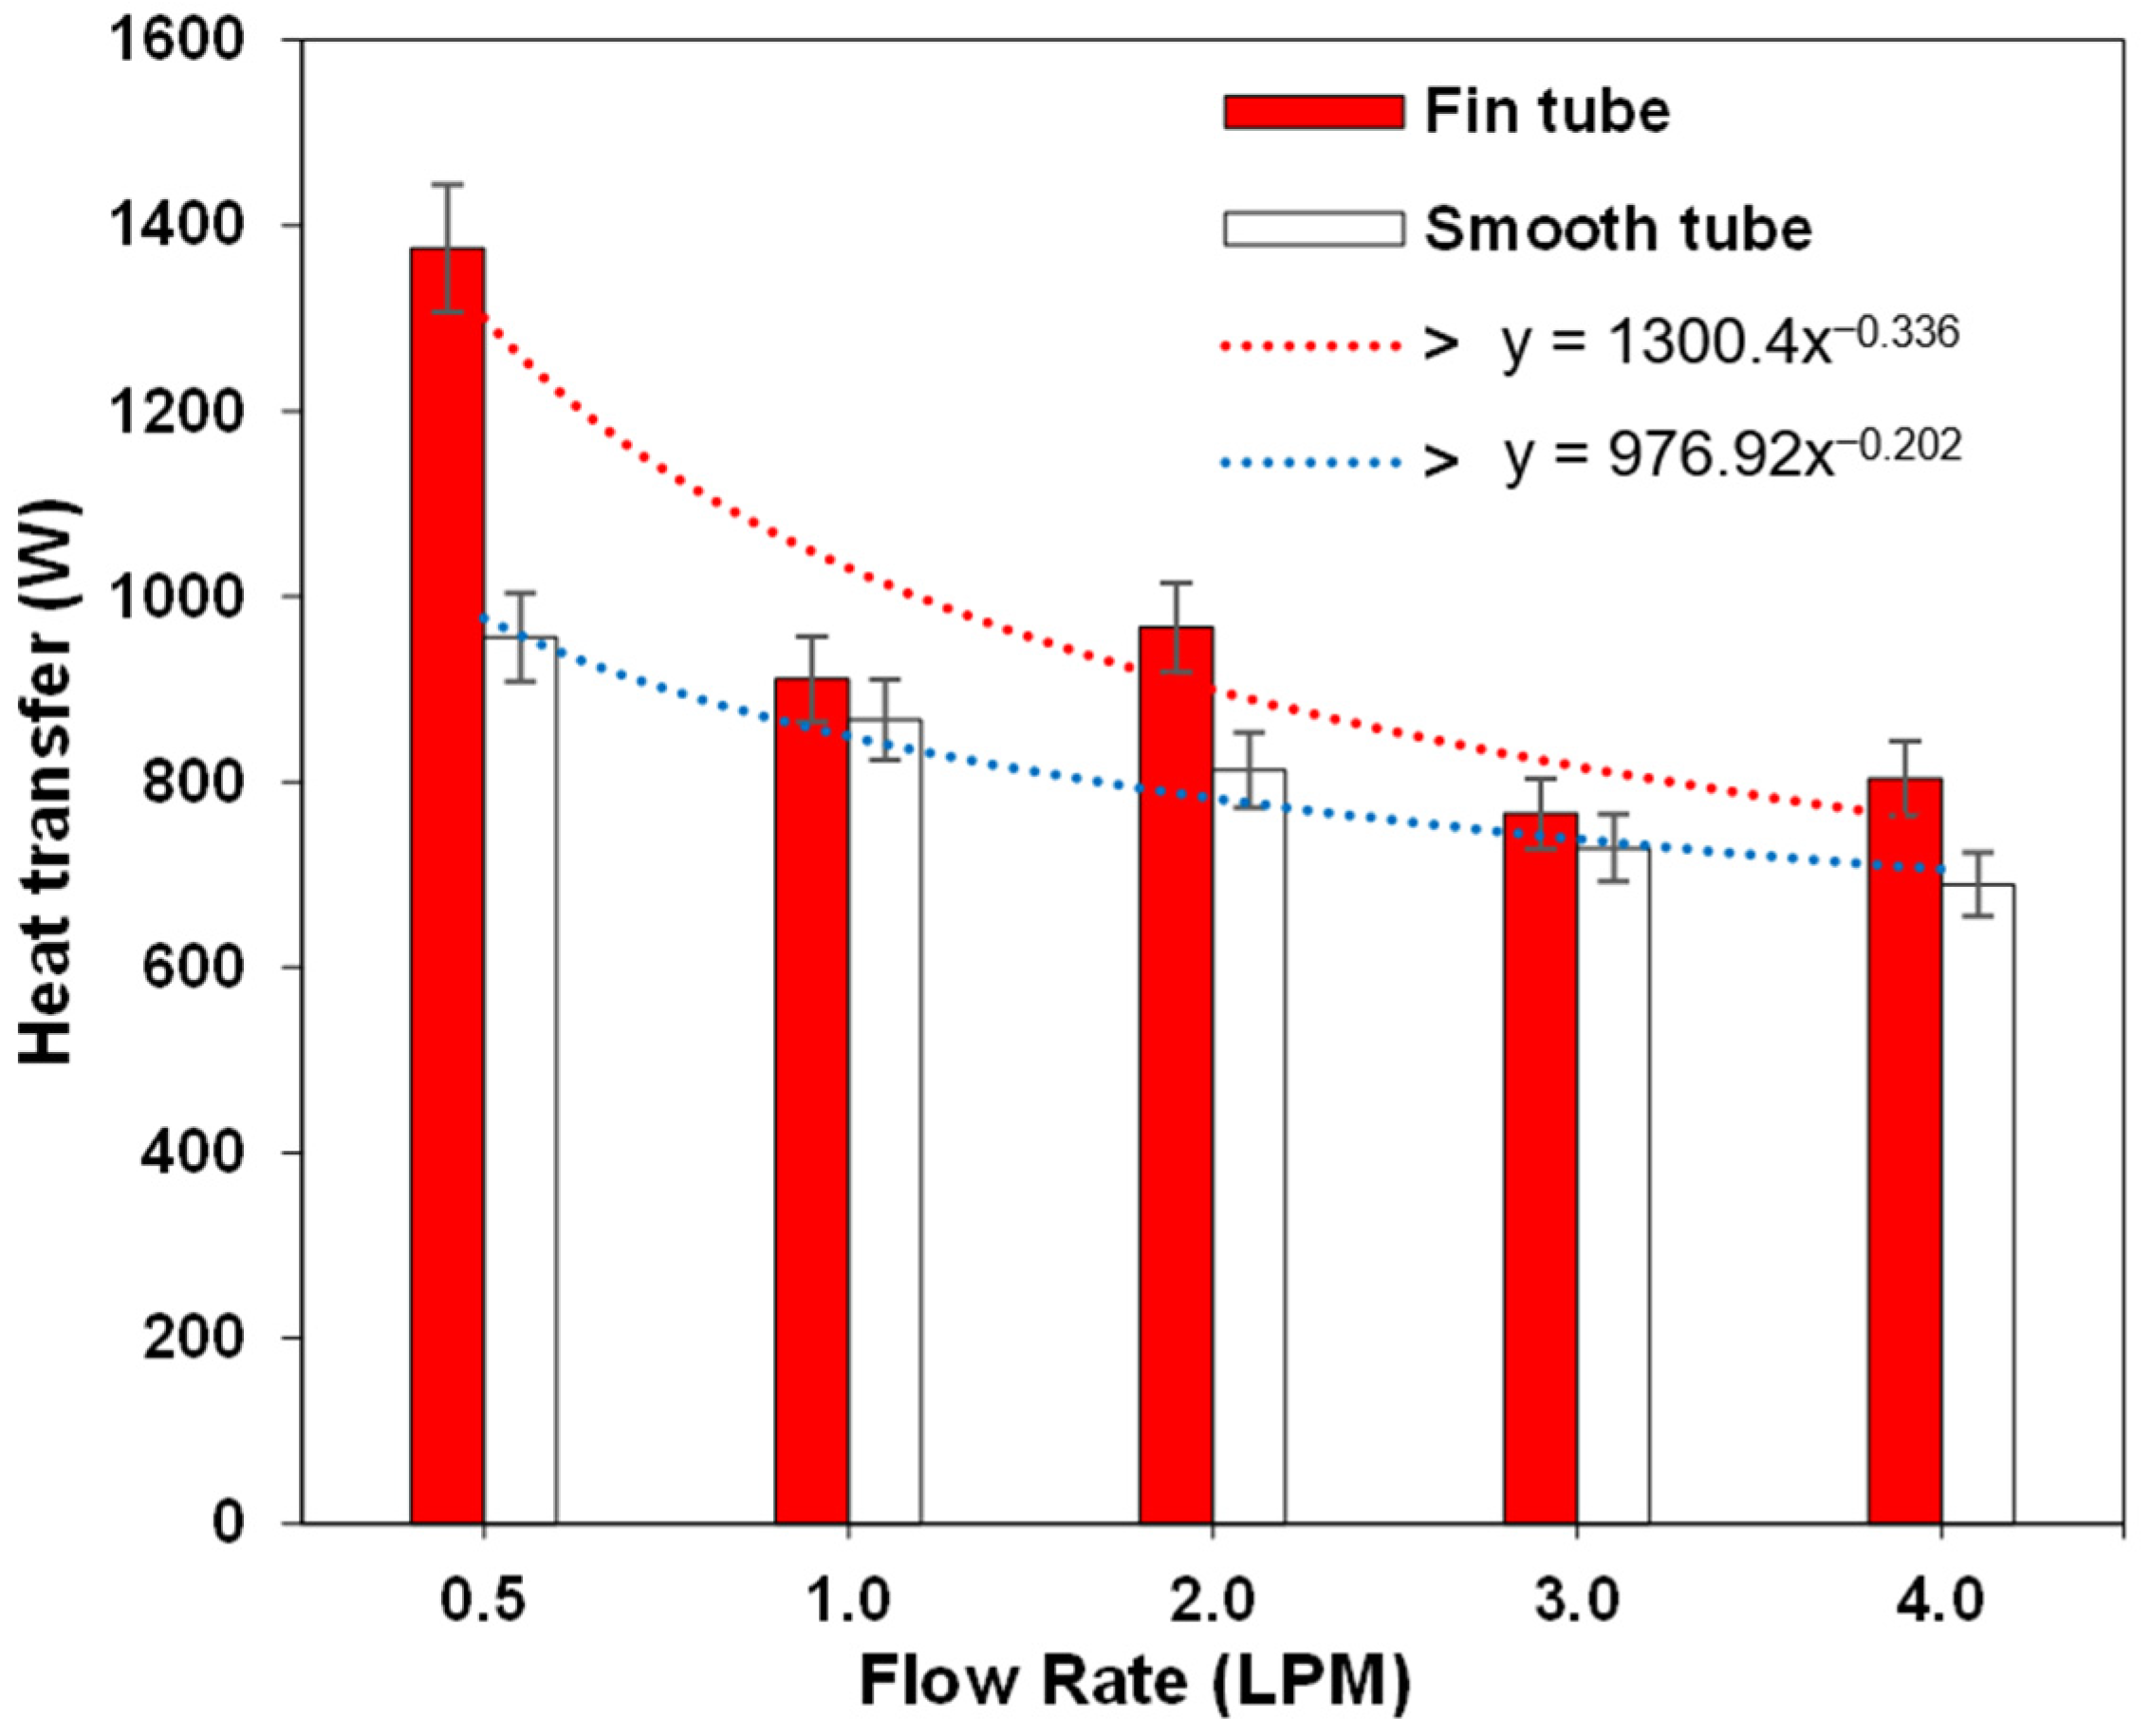
3.3. Useful Energy
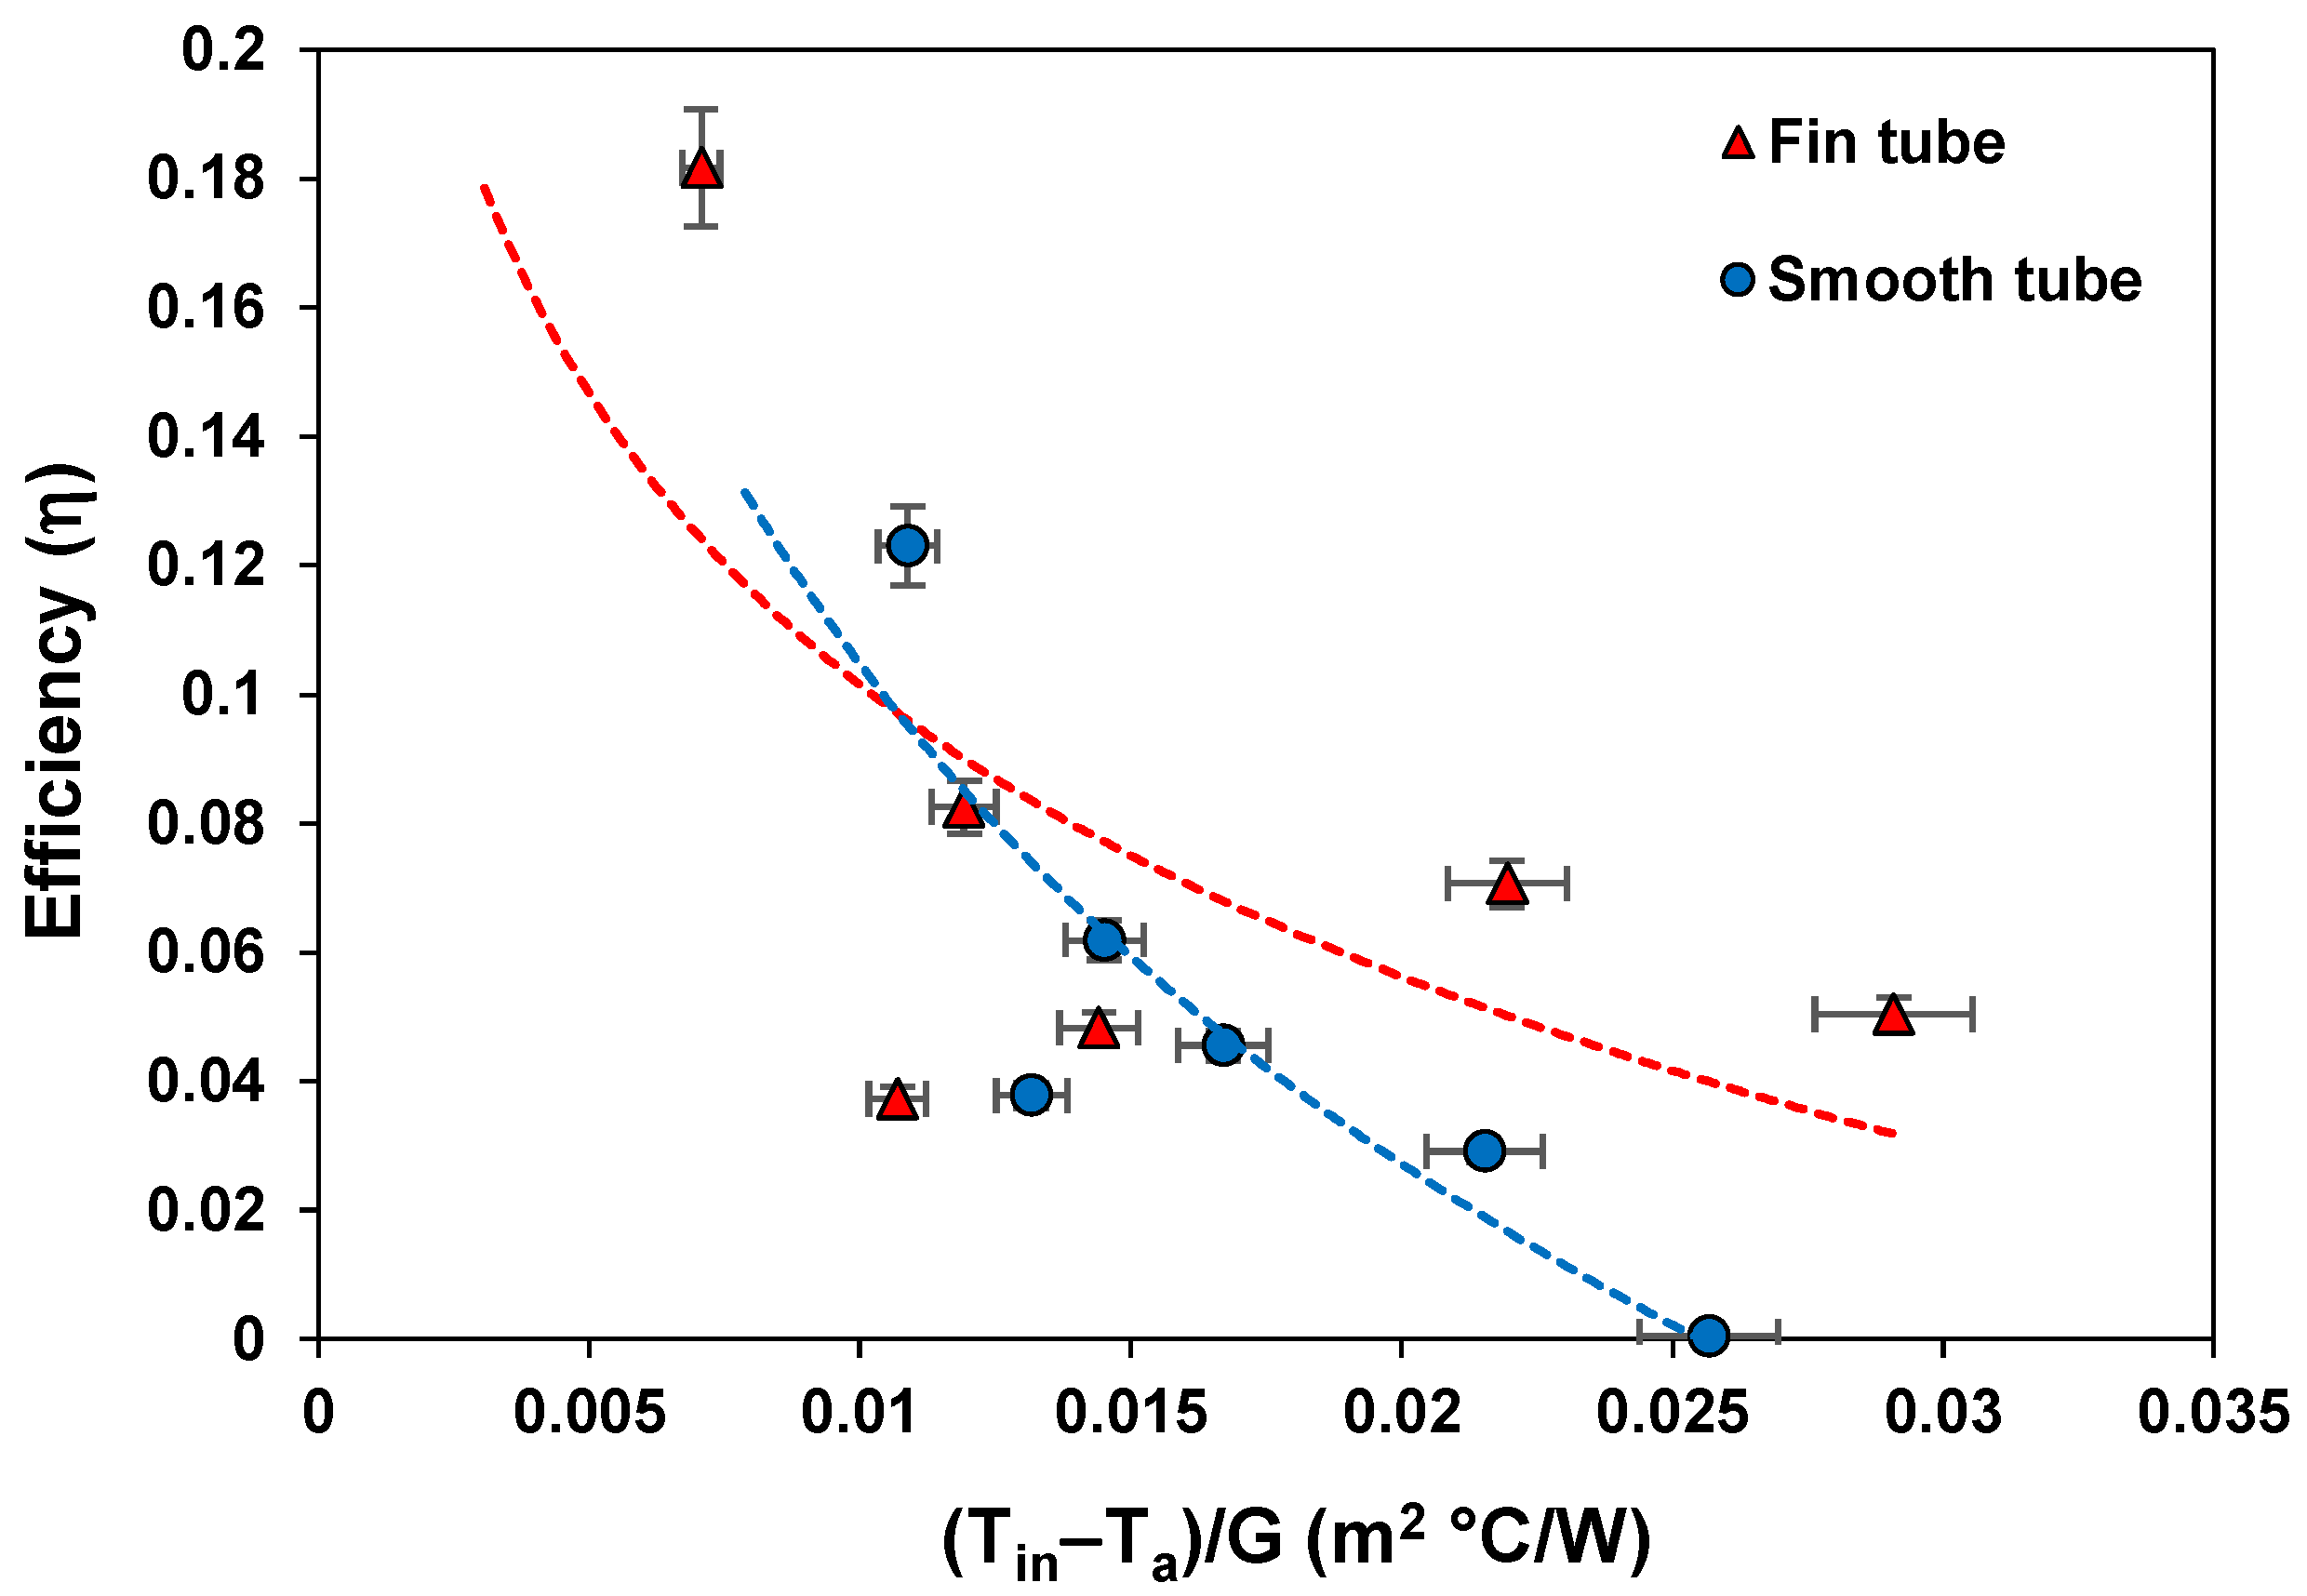
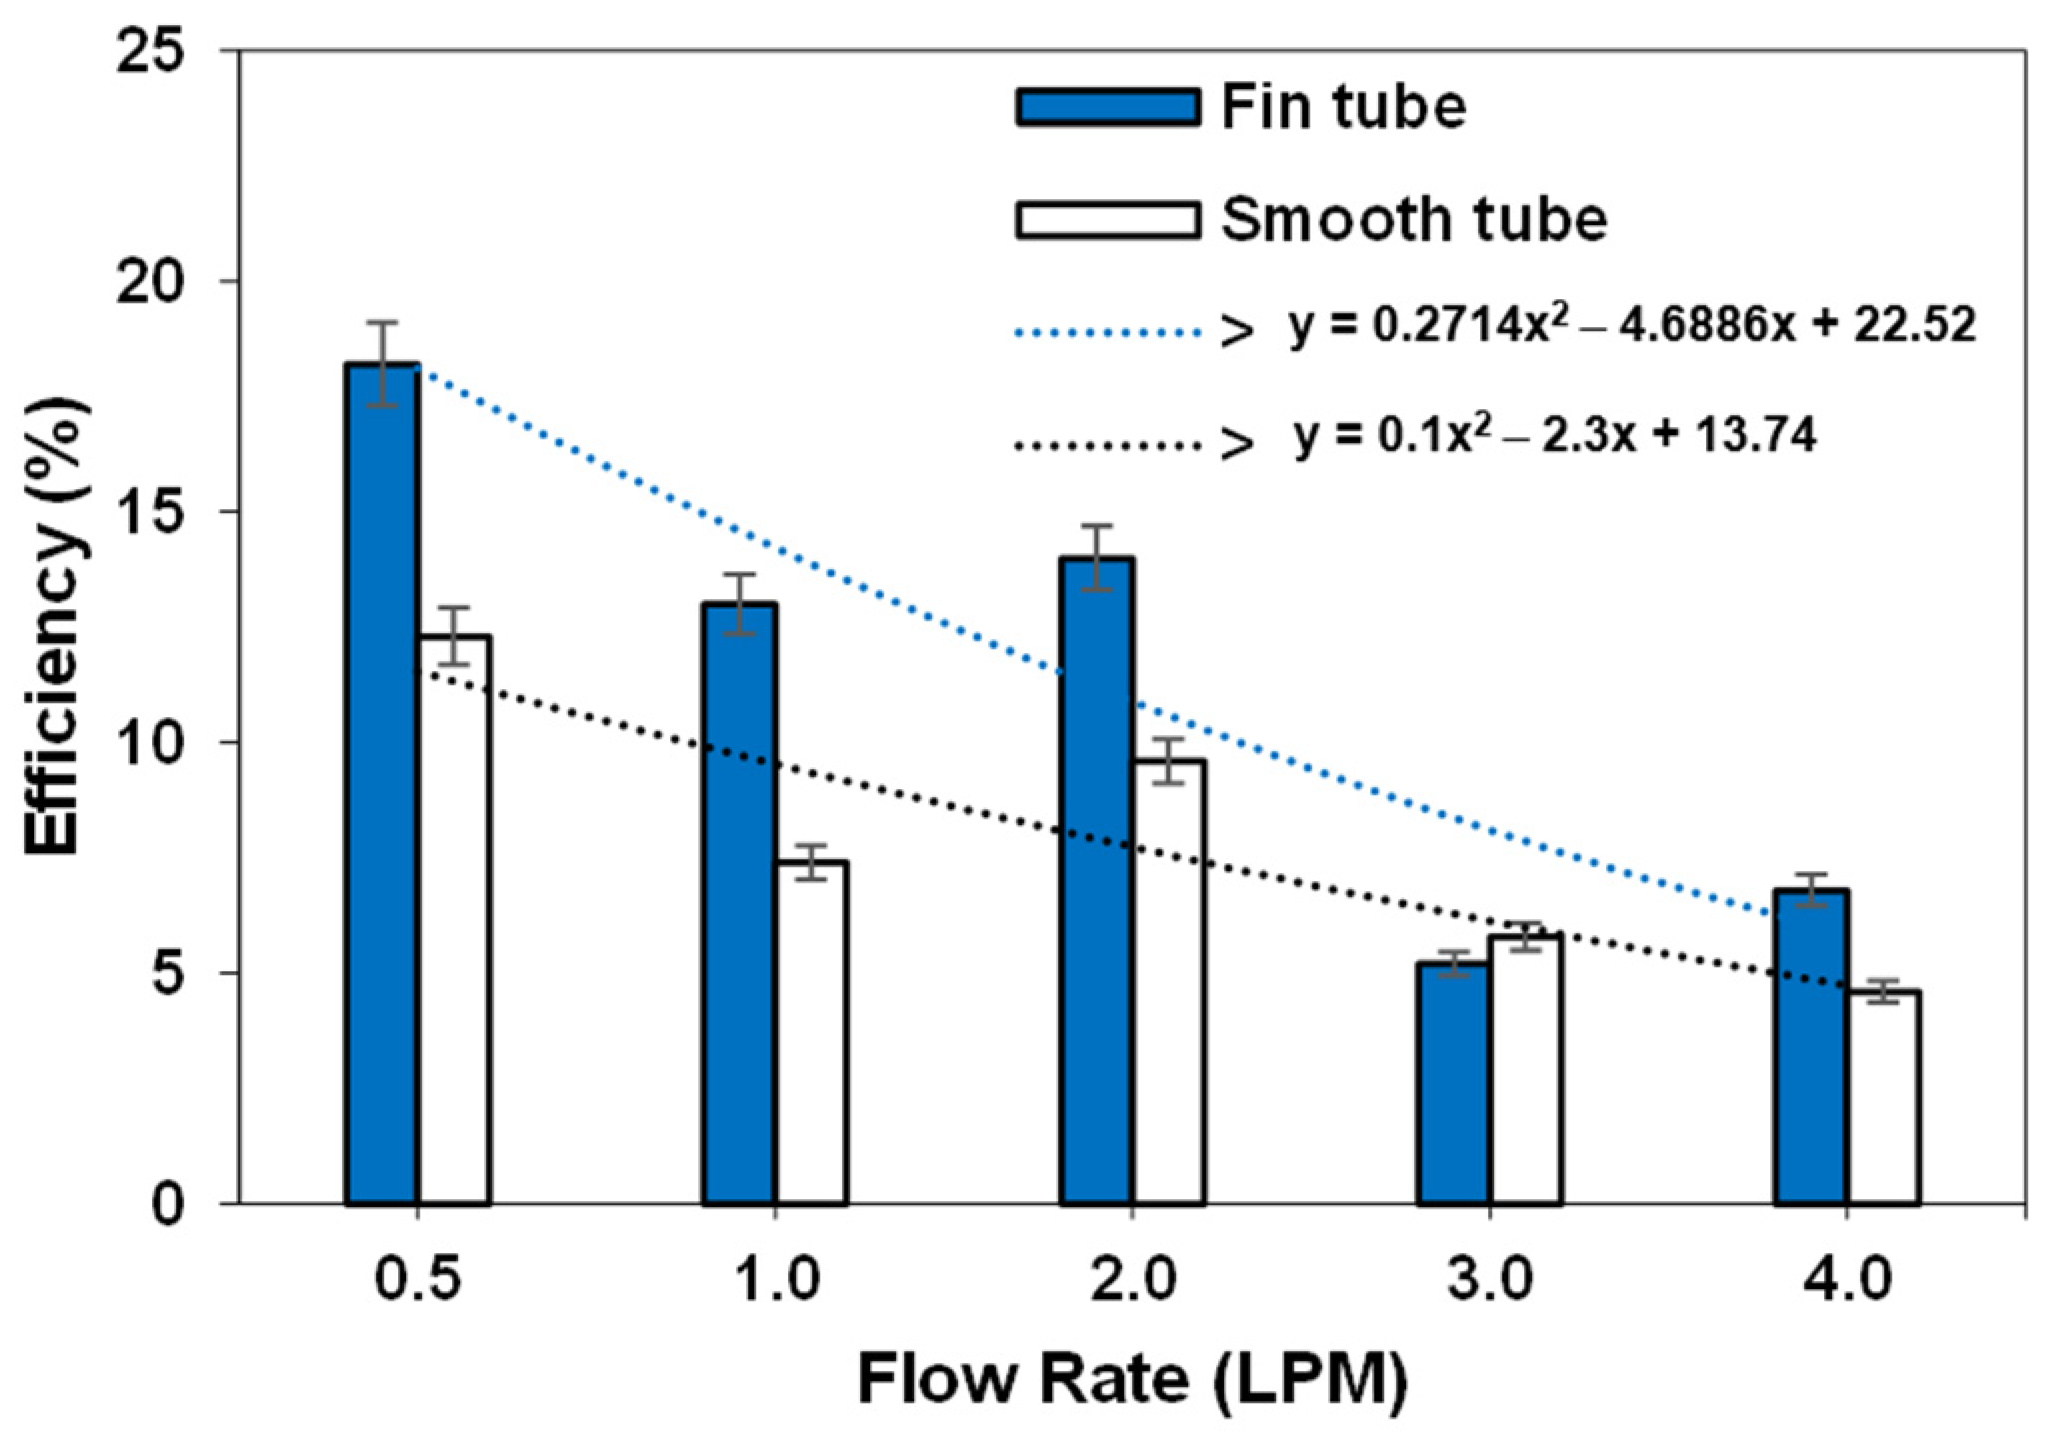
3.4. Efficiency
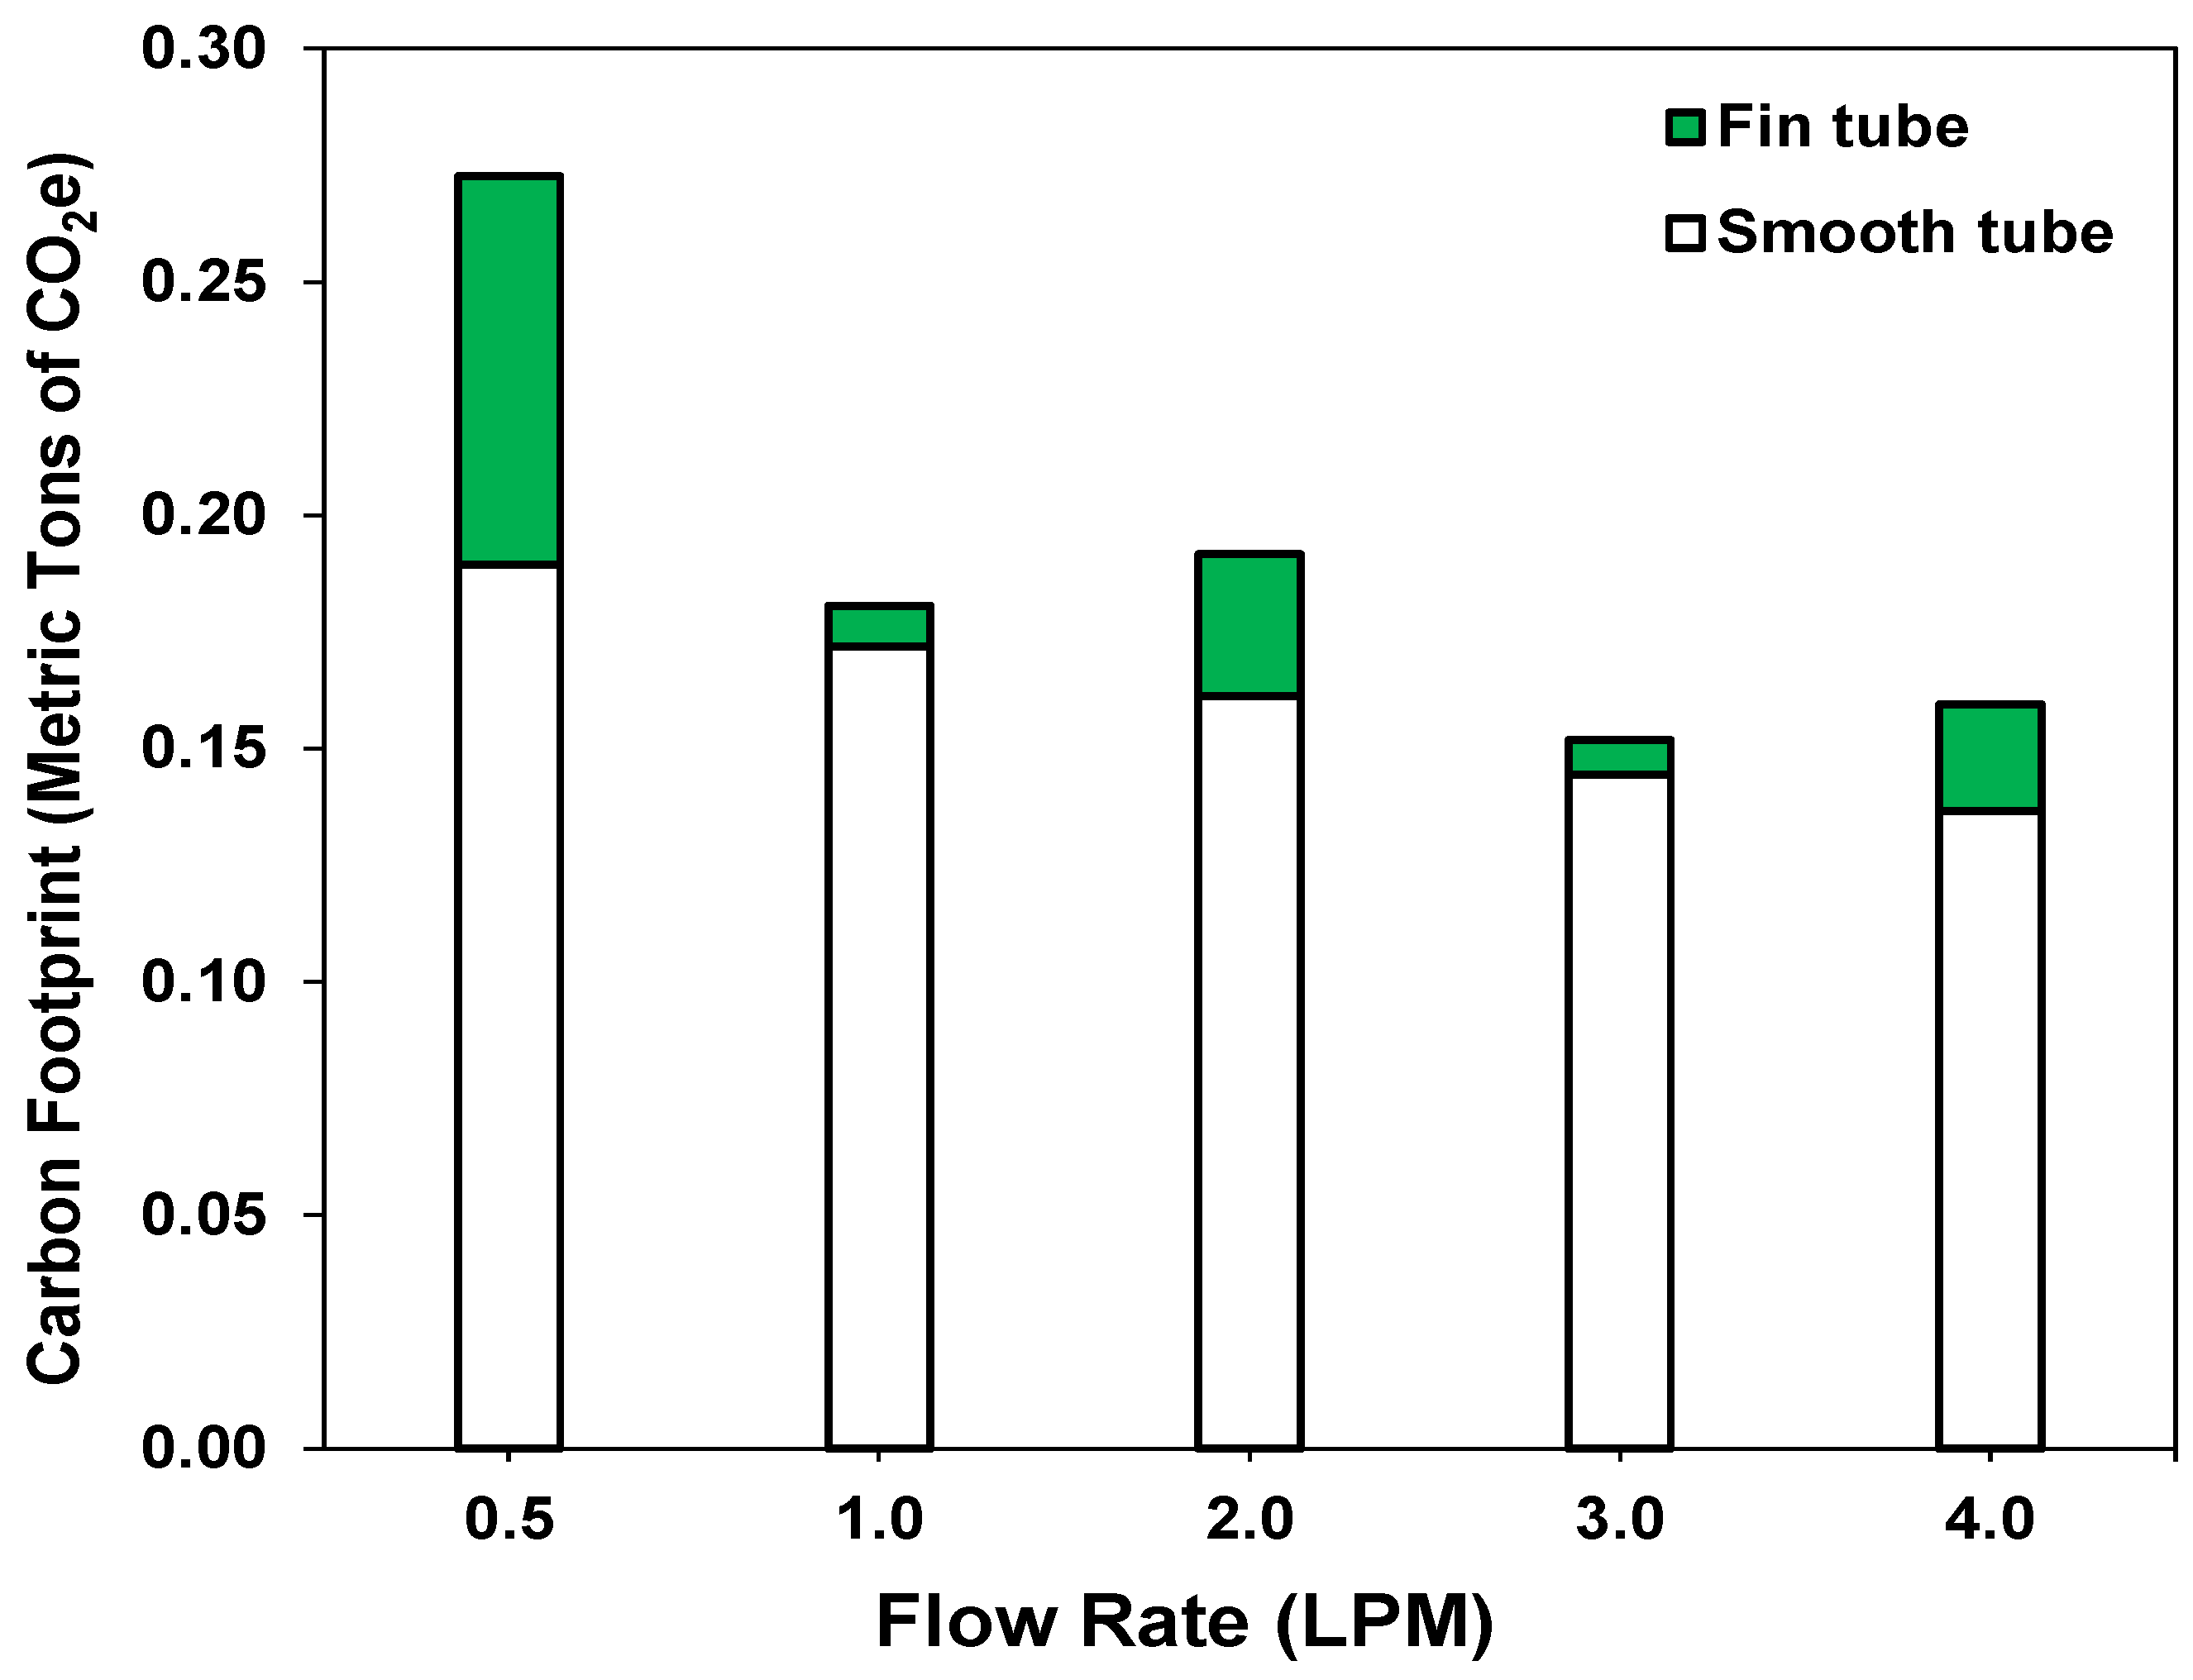
3.5. Environmental Impact Evaluation
3.6. Cost Analysis of the Solar Parabolic Trough System Projects
4. Conclusions
- The results show that the externally finned absorber tube demonstrated an improved thermal efficiency of up to 48% over and above that of the smooth absorber tube. This was attributed to the fact that the finned outer surface had more area for energy absorption.
- The externally finned absorber tube provided a higher fluid exit temperature than the smooth absorber tube at the same flow rate. With a flow rate of 0.5 L per minute, the maximum output temperature from the finned tube was 59.34 °C, which is 2.82 °C more than that of the smooth tube, representing a 4.75% increase.
- The results also show that, at the low fluid flow rate of 0.5 L per minute, the finned tubes achieved a heat transfer rate of 1375.55 W, which is about 44% more than that of the smooth tubes, with an efficiency of 18.2%, which is around 48% more than that of the smooth tubes.
- The research found that the experimental SPT system using finned tubes potentially avoided CO2 emissions to the amount of 0.2726 metric tons of CO2e per year, with the finned tubes outperforming the smooth tubes by about 44% at a flow rate of 0.5 L per minute.
- The main conclusion of this paper is that externally finned absorber tubes are an inexpensive and easy-to-manufacture method to significantly improve the thermal performance of SPT systems.
Author Contributions
Funding
Data Availability Statement
Acknowledgments
Conflicts of Interest
Nomenclature
| Aa | (m2) | Aperture area |
| Ar | (m2) | Receiver surface area |
| Ac | (m2) | Cross-sectional area of copper tube |
| Cp | (J/kg·K) | Specific heat capacity |
| CR | (-) | The geometric concentration ratio |
| D | (m) | Characteristic diameter dimension |
| Dgo | (m) | Outside diameter of glass envelope |
| Dgi | (m) | Inner glass cover diameter |
| Dci | (m) | Inside diameter of copper tube |
| Dco | (m) | Outside diameter of copper tube |
| E | (hrs) | Equation of time |
| FR | (-) | The factor of heat removal |
| f | (-) | Focus of parabolic |
| G | (W/m2) | Solar radiation |
| h | (W/m2K) | The heat transfer coefficient |
| k | (W/(m·K)) | Thermal conductivity |
| Re | (-) | Reynolds number |
| st | (-) | Local standard time |
| Ib | (W/m2) | The direct solar light intensity |
| Ieff | (W/m2) | The effective intensity of sunlight |
| L | (m) | Characteristic linear dimension |
| Lr | (m) | Receiver length |
| Long | (-) | Longitude |
| l | (-) | The latitudes on the Earth |
| (kg/s) | Mass flow rate of fluid flow | |
| m | (kg) | Mass of fluid |
| n | (day) | The year’s day |
| N | (-) | North |
| S | (-) | South |
| Q | (W) | Thermal power of fluid |
| Qwater | (W) | Daily energy gained from water |
| (W) | Solar energy on the trough aperture | |
| q | (W/m2) | Heat flux density |
| T | (°C) | Temperature |
| t | (s) | Time |
| UL | (W/m2K) | Overall heat loss coefficient |
| v | (m/s) | Flow speed of fluid |
| (m3/s) | Volumetric flow rate | |
| P | (-) | The position of a point on the Earth’s surface |
| x | (m) | The distance of the parabolic curve along the X axis |
| Yz | (-) | Accuracy of the devices |
| y | (m) | Curve length of the parabolic |
| W | (m) | The width of the parabolic collector |
| Special characters | ||
| w | (°) | The angle of each hour |
| d | (°) | The Sun’s declination angle |
| θ | (°) | The Sun’s incident angle |
| h | (-) | Overall efficiency |
| ho | (-) | Optical efficiency |
| r | (kg/m3) | Density of the fluid |
| α | Reflectance of reflector surface | |
| m | (kg/(m·s)) | Dynamic viscosity of the fluid |
| Subscripts | ||
| st | Longitude drags through the standard time | |
| s | Solar | |
| r | Receiver tube | |
| fm | Mean fluid temperature | |
| final | Final water temperature of system | |
| initial | Initial water temperature of system | |
| Loc | Longitude drags through the local time | |
| u | Useful | |
| 1–4 | Position temperature | |
| in | Inlet fluid temperature | |
| out | Outlet fluid temperature | |
| a | Ambient temperature | |
| g | Glass receiver tube | |
| t | Water tank temperature | |
| Abbreviations | ||
| AT | Absorber Tube | |
| ASHRAE | American Society of Heating, Refrigerating and Air-Conditioning Engineers | |
| CLFR | Compact linear Fresnel reflector | |
| HTF | The heat transfer fluid | |
| IRR | The internal rate of return | |
| LPM | Liters per minute | |
| NPV | The net present value | |
| PB | Payback period | |
| PDC | Parabolic dish collector | |
| SPT | Solar parabolic trough | |
| SPTC | Solar parabolic trough collector | |
| SWU | Srinakharinwirot University | |
| USD | The currency abbreviation for the U.S. dollar | |
| UTC | Coordinated universal time | |
Appendix A

References
- Balakrishnan, P.S.; Shabbir, M.F.; Siddiqi, A.; Wang, X. Current status and future prospects of renewable energy: A case study. Energy Sources Part A Recovery Util. Environ. Eff. 2020, 42, 2698–2703. [Google Scholar] [CrossRef]
- Bamisile, O.; Dagbasi, M.; Babatunde, A.; Ayodele, O. A review of renewable energy potential in Nigeria; solar power development over the years. Eng. Appl. Sci. Res. 2017, 44, 242–248. [Google Scholar]
- Garg, H. Solar Energy: Fundamentals and Applications; Tata McGraw-Hill Education: New York, NY, USA, 2000. [Google Scholar]
- Kabir, E.; Kumar, P.; Kumar, S.; Adelodun, A.A.; Kim, K.-H. Solar energy: Potential and future prospects. Renew. Sustain. Energy Rev. 2018, 82, 894–900. [Google Scholar] [CrossRef]
- Khan, B. Non-Conventional Energy Resources; Tata McGraw-Hill Education: New York, NY, USA, 2006. [Google Scholar]
- Rai, G. Non Conventional Energy Sources; Khanna Publishers: New Delhi, India, 1986. [Google Scholar]
- Krungkaew, S.; Kingphadung, K.; Kwonpongsagoon, S.; Mahayothee, B. Costs and benefits of using parabolic greenhouse solar dryers for dried herb products in Thailand. Geomate J. 2020, 18, 96–101. [Google Scholar] [CrossRef]
- Duffie, J.A.; Beckman, W.A.; Blair, N. Solar Engineering of Thermal Processes, Photovoltaics and Wind; John Wiley & Sons: Hoboken, NJ, USA, 2020. [Google Scholar]
- Badran, O. Study in industrial applications of solar energy and the range of its utilization in Jordan. Renew. Energy 2001, 24, 485–490. [Google Scholar] [CrossRef]
- Schiel, W.; Keck, T. Parabolic dish concentrating solar power systems. In Concentrating Solar Power Technology; Elsevier: Amsterdam, The Netherlands, 2021; pp. 311–355. [Google Scholar]
- Price, H.; Forristall, R.; Wendelin, T.; Lewandowski, A.; Moss, T.; Gummo, C. Field survey of parabolic trough receiver thermal performance. In Proceedings of the International Solar Energy Conference, Dresden, Germany, 4–8 September 2006; pp. 109–116. [Google Scholar]
- Romero, M.; Steinfeld, A. Concentrating solar thermal power and thermochemical fuels. Energy Environ. Sci. 2012, 5, 9234–9245. [Google Scholar] [CrossRef]
- Gong, J.-H.; Wang, J.; Lund, P.D.; Zhao, D.-D.; Hu, E.-Y.; Jin, W. Improving the performance of large-aperture parabolic trough solar concentrator using semi-circular absorber tube with external fin and flat-plate radiation shield. Renew. Energy 2020, 159, 1215–1223. [Google Scholar] [CrossRef]
- Gong, J.-H.; Wang, J.; Lund, P.D.; Zhao, D.-D.; Xu, J.-W.; Jin, Y.-H. Comparative study of heat transfer enhancement using different fins in semi-circular absorber tube for large-aperture trough solar concentrator. Renew. Energy 2021, 169, 1229–1241. [Google Scholar] [CrossRef]
- Shayan, M.E.; Najafi, G.; Ghasemzadeh, F. Advanced study of the parabolic trough collector using aluminum (III) oxide. Int. J. Smart Grid 2020, 4, 111–116. [Google Scholar]
- Bi, Y.; Qin, L.; Guo, J.; Li, H.; Zang, G. Performance analysis of solar air conditioning system based on the independent-developed solar parabolic trough collector. Energy 2020, 196, 117075. [Google Scholar] [CrossRef]
- Kumar, D.; Kumar, S. Analytical performance investigation of parabolic trough solar collector with computed optimum air gap. Int. J. Energy Environ. 2015, 6, 87. [Google Scholar]
- Aseri, T.K.; Sharma, C.; Kandpal, T.C. Estimation of capital costs and techno-economic appraisal of parabolic trough solar collector and solar power tower based CSP plants in India for different condenser cooling options. Renew. Energy 2021, 178, 344–362. [Google Scholar] [CrossRef]
- Praveenkumar, S.; Agyekum, E.B.; Kumar, A.; Ampah, J.D.; Afrane, S.; Amjad, F.; Velkin, V.I. Techno-economics and the identification of environmental barriers to the development of concentrated solar thermal power plants in India. Appl. Sci. 2022, 12, 10400. [Google Scholar] [CrossRef]
- Purohit, I.; Purohit, P. Techno-economic evaluation of concentrating solar power generation in India. Energy Policy 2010, 38, 3015–3029. [Google Scholar] [CrossRef]
- Tahir, S.; Ahmad, M.; Abd-ur-Rehman, H.M.; Shakir, S. Techno-economic assessment of concentrated solar thermal power generation and potential barriers in its deployment in Pakistan. J. Clean. Prod. 2021, 293, 126125. [Google Scholar] [CrossRef]
- Boretti, A. Cost and production of solar thermal and solar photovoltaics power plants in the United States. Renew. Energy Focus 2018, 26, 93–99. [Google Scholar] [CrossRef]
- Pressebox. The First Parabolic trough Plant Using Direct Steam Generation—Delivers Its Full 5 MW of Output to Thailand’s Power Network. Available online: https://www.pressebox.com/pressrelease/solarlite-gmbh-duckwitz/TSE-1-The-first-parabolic-trough-plant-using-direct-steam-generation-delivers-its-full-5-MW-of-output-to-Thailands-power-network/boxid/478604 (accessed on 3 April 2023).
- Fuqiang, W.; Qingzhi, L.; Huaizhi, H.; Jianyu, T. Parabolic trough receiver with corrugated tube for improving heat transfer and thermal deformation characteristics. Appl. Energy 2016, 164, 411–424. [Google Scholar] [CrossRef]
- Huang, Z.; Li, Z.-Y.; Yu, G.-L.; Tao, W.-Q. Numerical investigations on fully-developed mixed turbulent convection in dimpled parabolic trough receiver tubes. Appl. Therm. Eng. 2017, 114, 1287–1299. [Google Scholar] [CrossRef]
- Huang, Z.; Yu, G.; Li, Z.; Tao, W. Numerical study on heat transfer enhancement in a receiver tube of parabolic trough solar collector with dimples, protrusions and helical fins. Energy Procedia 2015, 69, 1306–1316. [Google Scholar] [CrossRef]
- Peng, H.; Li, M.; Hu, F.; Feng, S. Performance analysis of absorber tube in parabolic trough solar collector inserted with semi-annular and fin shape metal foam hybrid structure. Case Stud. Therm. Eng. 2021, 26, 101112. [Google Scholar] [CrossRef]
- Vengadesan, E.; Thameenansari, S.; Manikandan, E.J.; Senthil, R. Experimental study on heat transfer enhancement of parabolic trough solar collector using a rectangular channel receiver. J. Taiwan Inst. Chem. Eng. 2022, 135, 104361. [Google Scholar] [CrossRef]
- Zhao, Z.; Bai, F.; Zhang, X.; Wang, Z. Experimental study of pin finned receiver tubes for a parabolic trough solar air collector. Sol. Energy 2020, 207, 91–102. [Google Scholar] [CrossRef]
- Bellos, E.; Tzivanidis, C.; Tsimpoukis, D. Multi-criteria evaluation of parabolic trough collector with internally finned absorbers. Appl. Energy 2017, 205, 540–561. [Google Scholar] [CrossRef]
- Jathar, L.D.; Ganesan, S.; Shahapurkar, K.; Soudagar, M.E.M.; Mujtaba, M.; Anqi, A.E.; Farooq, M.; Khidmatgar, A.; Goodarzi, M.; Safaei, M.R. Effect of various factors and diverse approaches to enhance the performance of solar stills: A comprehensive review. J. Therm. Anal. Calorim. 2021, 147, 4491–4522. [Google Scholar] [CrossRef]
- Tayebi, R.; Akbarzadeh, S.; Valipour, M.S. Numerical investigation of efficiency enhancement in a direct absorption parabolic trough collector occupied by a porous medium and saturated by a nanofluid. Environ. Prog. Sustain. Energy 2019, 38, 727–740. [Google Scholar] [CrossRef]
- Atchuta, S.; Sakthivel, S.; Barshilia, H.C. Selective properties of high-temperature stable spinel absorber coatings for concentrated solar thermal application. Sol. Energy 2020, 199, 453–459. [Google Scholar] [CrossRef]
- Joly, M.; Antonetti, Y.; Python, M.; Gonzalez, M.; Gascou, T.; Scartezzini, J.-L.; Schüler, A. Novel black selective coating for tubular solar absorbers based on a sol–gel method. Sol. Energy 2013, 94, 233–239. [Google Scholar] [CrossRef]
- Kasaeian, A.; Daviran, S.; Azarian, R.D. Optical and thermal investigation of selective coatings for solar absorber tube. Int. J. Renew. Energy Res. 2016, 6, 15–20. [Google Scholar]
- Fedkin, M. Parabolic Dish CSP Technology. Available online: https://www.e-education.psu.edu/eme812/node/648 (accessed on 26 April 2022).
- Natarajan, S.K.; Thampi, V.; Shaw, R.; Kumar, V.S.; Nandu, R.; Jayan, V.; Rajagopalan, N.; Kandasamy, R.K. Experimental analysis of a two-axis tracking system for solar parabolic dish collector. Int. J. Energy Res. 2019, 43, 1012–1018. [Google Scholar] [CrossRef]
- Wang, K.; He, Y.-L.; Li, P.; Li, M.-J.; Tao, W.-Q. Multi-objective optimization of the solar absorptivity distribution inside a cavity solar receiver for solar power towers. Sol. Energy 2017, 158, 247–258. [Google Scholar] [CrossRef]
- Naphon, P. Experimental investigation the nanofluids heat transfer characteristics in horizontal spirally coiled tubes. Int. J. Heat Mass Transf. 2016, 93, 293–300. [Google Scholar] [CrossRef]
- Navakrishnan, S.; Vengadesan, E.; Senthil, R.; Dhanalakshmi, S. An experimental study on simultaneous electricity and heat production from solar PV with thermal energy storage. Energy Convers. Manag. 2021, 245, 114614. [Google Scholar] [CrossRef]
- Ghasemi, S.E.; Ranjbar, A.A. Numerical thermal study on effect of porous rings on performance of solar parabolic trough collector. Appl. Therm. Eng. 2017, 118, 807–816. [Google Scholar] [CrossRef]
- Reddy, K.; Kumar, K.R.; Ajay, C. Experimental investigation of porous disc enhanced receiver for solar parabolic trough collector. Renew. Energy 2015, 77, 308–319. [Google Scholar] [CrossRef]
- Zheng, Z.; Xu, Y.; He, Y. Thermal analysis of a solar parabolic trough receiver tube with porous insert optimized by coupling genetic algorithm and CFD. Sci. China Technol. Sci. 2016, 59, 1475–1485. [Google Scholar] [CrossRef]
- Mwesigye, A.; Bello-Ochende, T.; Meyer, J.P. Heat transfer and entropy generation in a parabolic trough receiver with wall-detached twisted tape inserts. Int. J. Therm. Sci. 2016, 99, 238–257. [Google Scholar] [CrossRef]
- Song, X.; Dong, G.; Gao, F.; Diao, X.; Zheng, L.; Zhou, F. A numerical study of parabolic trough receiver with nonuniform heat flux and helical screw-tape inserts. Energy 2014, 77, 771–782. [Google Scholar] [CrossRef]
- Zhu, X.; Zhu, L.; Zhao, J. Wavy-tape insert designed for managing highly concentrated solar energy on absorber tube of parabolic trough receiver. Energy 2017, 141, 1146–1155. [Google Scholar] [CrossRef]
- Chakraborty, O.; Roy, S.; Das, B.; Gupta, R. Effects of helical absorber tube on the energy and exergy analysis of parabolic solar trough collector–A computational analysis. Sustain. Energy Technol. Assess. 2021, 44, 101083. [Google Scholar] [CrossRef]
- Muñoz, J.; Abánades, A. Analysis of internal helically finned tubes for parabolic trough design by CFD tools. Appl. Energy 2011, 88, 4139–4149. [Google Scholar] [CrossRef]
- Valizade, M.; Heyhat, M.; Maerefat, M. Experimental study of the thermal behavior of direct absorption parabolic trough collector by applying copper metal foam as volumetric solar absorption. Renew. Energy 2020, 145, 261–269. [Google Scholar] [CrossRef]
- Guerraiche, D.; Bougriou, C.; Guerraiche, K.; Valenzuela, L.; Driss, Z. Experimental and numerical study of a solar collector using phase change material as heat storage. J. Energy Storage 2020, 27, 101133. [Google Scholar] [CrossRef]
- Kaloudis, E.; Papanicolaou, E.; Belessiotis, V. Numerical simulations of a parabolic trough solar collector with nanofluid using a two-phase model. Renew. Energy 2016, 97, 218–229. [Google Scholar] [CrossRef]
- Tripathy, A.K.; Ray, S.; Sahoo, S.S.; Chakrabarty, S. Structural analysis of absorber tube used in parabolic trough solar collector and effect of materials on its bending: A computational study. Sol. Energy 2018, 163, 471–485. [Google Scholar] [CrossRef]
- Abed, N.; Afgan, I.; Cioncolini, A.; Iacovides, H.; Nasser, A.; Mekhail, T. Thermal performance evaluation of various nanofluids with non-uniform heating for parabolic trough collectors. Case Stud. Therm. Eng. 2020, 22, 100769. [Google Scholar] [CrossRef]
- Subramani, J.; Sevvel, P.; Srinivasan, S. Influence of CNT coating on the efficiency of solar parabolic trough collector using AL2O3 nanofluids-a multiple regression approach. Mater. Today Proc. 2021, 45, 1857–1861. [Google Scholar] [CrossRef]
- Limboonruang, T.; Phunapai, N.; Oyinlola, M. Experimental investigation of a locally fabricated low-cost solar parabolic trough in Thailand. In Proceedings of the 16th International Conference on Heat Transfer (HEFAT-ATE 2022), Amsterdam, The Netherlands, 8–10 August 2022; pp. 432–437. [Google Scholar]
- Kalogirou, S.A. Solar Energy Engineering: Processes and Systems; Academic Press: Cambridge, MA, USA, 2013. [Google Scholar]
- Lüpfert, E.; Herrmann, U.; Price, H.; Zarza, E.; Kistner, R. Toward standard performance analysis for parabolic trough collector fields. In Proceedings of the SolarPACES Conference, Online, 7 September–1 October 2021. [Google Scholar]
- Zou, B.; Dong, J.; Yao, Y.; Jiang, Y. An experimental investigation on a small-sized parabolic trough solar collector for water heating in cold areas. Appl. Energy 2016, 163, 396–407. [Google Scholar] [CrossRef]
- Tzivanidis, C.; Bellos, E.; Korres, D.; Antonopoulos, K.; Mitsopoulos, G. Thermal and optical efficiency investigation of a parabolic trough collector. Case Stud. Therm. Eng. 2015, 6, 226–237. [Google Scholar] [CrossRef]
- Sookramoon, K. Design, constructand performance evaluation of a 2-stage parabolic through solar concentrator in PathumThani. Adv. Mater. Res. 2014, 931–932, 1291–1297. [Google Scholar] [CrossRef]
- Ayodele, T.; Mosetlhe, T.; Yusuff, A.; Ntombela, M. Optimal design of wind-powered hydrogen refuelling station for some selected cities of South Africa. Int. J. Hydrogen Energy 2021, 46, 24919–24930. [Google Scholar] [CrossRef]
- Brigham, E.F.; Houston, J.F. Fundamentals of Financial Management: Concise; Cengage Learning: Boston, MA, USA, 2021. [Google Scholar]
- Intaraburt, W.; Sangsanont, J.; Limpiyakorn, T.; Ruangrassamee, P.; Suttinon, P.; Suwannasilp, B.B. Feasibility Study of Water Reclamation Projects in Industrial Parks Incorporating Environmental Benefits: A Case Study in Chonburi, Thailand. Water 2022, 14, 1172. [Google Scholar] [CrossRef]
- Praveenkumar, S.; Gulakhmadov, A.; Agyekum, E.B.; Alwan, N.T.; Velkin, V.I.; Sharipov, P.; Safaraliev, M.; Chen, X. experimental study on performance enhancement of a photovoltaic module incorporated with CPU heat pipe—A 5E analysis. Sensors 2022, 22, 6367. [Google Scholar] [CrossRef] [PubMed]
- Janjai, S. A method for estimating direct normal solar irradiation from satellite data for a tropical environment. Sol. Energy 2010, 84, 1685–1695. [Google Scholar] [CrossRef]
- Janjai, S.; Laksanaboonsong, J.; Seesaard, T. Potential application of concentrating solar power systems for the generation of electricity in Thailand. Appl. Energy 2011, 88, 4960–4967. [Google Scholar] [CrossRef]
- Oyinlola, M.; Shire, G. Characterising micro-channel absorber plates for building integrated solar thermal collectors. Build. Serv. Eng. Res. Technol. 2019, 40, 13–29. [Google Scholar] [CrossRef]
- Oyinlola, M.A.; Shire, G.S.; Moss, R. Thermal analysis of a solar collector absorber plate with microchannels. Exp. Therm. Fluid Sci. 2015, 67, 102–109. [Google Scholar] [CrossRef]
- Ali, Z.; Zeeshan, A.; Bhatti, M.; Hobiny, A.; Saeed, T. Insight into the dynamics of Oldroyd-B fluid over an upper horizontal surface of a paraboloid of revolution subject to chemical reaction dependent on the first-order activation energy. Arab. J. Sci. Eng. 2021, 46, 6039–6048. [Google Scholar] [CrossRef]
- Amina, B.; Miloud, A.; Samir, L.; Abdelylah, B.; Solano, J. Heat transfer enhancement in a parabolic trough solar receiver using longitudinal fins and nanofluids. J. Therm. Sci. 2016, 25, 410–417. [Google Scholar] [CrossRef]
- Norouzi, A.M.; Siavashi, M.; Ahmadi, R.; Tahmasbi, M. Experimental study of a parabolic trough solar collector with rotating absorber tube. Renew. Energy 2021, 168, 734–749. [Google Scholar] [CrossRef]
- ANSI/ASHRAE Standard 93-2003; Method of Testing to Determine the Thermal Performance of Solar Collectors. American Society of Heating, Refrigeration and Air Conditioning Engineers: Atlanta, GA, USA, 2003.
- Arasu, A.V.; Sornakumar, T. Design, manufacture and testing of fiberglass reinforced parabola trough for parabolic trough solar collectors. Sol. Energy 2007, 81, 1273–1279. [Google Scholar] [CrossRef]
- Yousefi, T.; Veisy, F.; Shojaeizadeh, E.; Zinadini, S. An experimental investigation on the effect of MWCNT-H2O nanofluid on the efficiency of flat-plate solar collectors. Exp. Therm. Fluid Sci. 2012, 39, 207–212. [Google Scholar] [CrossRef]
- Yousefi, T.; Veysi, F.; Shojaeizadeh, E.; Zinadini, S. An experimental investigation on the effect of Al2O3–H2O nanofluid on the efficiency of flat-plate solar collectors. Renew. Energy 2012, 39, 293–298. [Google Scholar] [CrossRef]
- Zamzamian, A.; KeyanpourRad, M.; KianiNeyestani, M.; Jamal-Abad, M.T. An experimental study on the effect of Cu-synthesized/EG nanofluid on the efficiency of flat-plate solar collectors. Renew. Energy 2014, 71, 658–664. [Google Scholar] [CrossRef]
- Jamal-Abad, M.T.; Saedodin, S.; Aminy, M. Experimental investigation on a solar parabolic trough collector for absorber tube filled with porous media. Renew. Energy 2017, 107, 156–163. [Google Scholar] [CrossRef]
- Agency, I.E. Thailand Electricity Security Assessment; International Energy Agency: Paris, France, 2016. [Google Scholar]
- Choomkong, A.; Sirikunpitak, S.; Darnsawasdi, R.; Yordkayhun, S. A study of CO2 emission sources and sinks in Thailand. Energy Procedia 2017, 138, 452–457. [Google Scholar] [CrossRef]
- Thailand Greenhouse Gas Management Organization. Carbon Footprint for Organization: CFO, Corporate Carbon Footprint: CCF. Available online: http://thaicarbonlabel.tgo.or.th (accessed on 4 April 2023).
- Aroonsrimorakot, S.; Yuwaree, C.; Arunlertaree, C.; Hutajareorn, R.; Buadit, T. Carbon footprint of faculty of environment and resource studies, Mahidol University, Salaya Campus, Thailand. APCBEE Procedia 2013, 5, 175–180. [Google Scholar] [CrossRef]
- Arjharn, W.; Diloksumpun, S.; Ladpala, P.; Mahuchariyawong, J. Study of the Economy Cost of a Small Scale Biomass Power Plant for Rural Communities. Available online: https://kukr.lib.ku.ac.th/kukr_es/kukr (accessed on 4 April 2023).


| No. | Parameter | Characteristics |
|---|---|---|
| 1 | Parabola length (L) | 1520 mm |
| 2 | Parabola aperture (W) | 1200 mm |
| 3 | Focal distance (f) | 300 mm |
| 4 | Thickness (mean value) | 3 mm |
| 5 | Aperture area (Aa) | 2.09 m2 |
| 6 | Collector length (L) | 1.52 m |
| 7 | Concentration ratio (CR) | 8.13 |
| No. | Parameter | Volume/Type |
|---|---|---|
| 1 | Receiver material | copper |
| 2 | Receiver surface treatment | Heat-resistant black coating |
| 3 | Inner copper tube diameter (Dci) | 10 mm |
| 4 | Outer copper tube diameter (Dco) | 12.70 mm |
| 5 | Inner glass cover diameter (Dgi) | 33.50 mm |
| 6 | Outer glass cover diameter (Dgo) | 47 mm |
| 7 | Glass envelope transmissivity | 0.95 |
| 8 | Receiver length (Lr) | 1.52 m |
| 9 | Receiver surface area (Ar) | 0.23 m2 |
| No. | Parameter | Volume |
|---|---|---|
| 1 | Density (r) | 997 kg/m3 |
| 2 | Boiling point | 100 °C |
| 3 | Specific heat capacity (Cp) | 4180 J/(kg °C) |
| 4 | Dynamic viscosity (m) | 0.95 × 10⁻³ kg/m s |
| 5 | Thermal conductivity (k) | 0.60 W/(m °C) |
| Parameter | Relation | Units | Equation No. |
|---|---|---|---|
| Mean glass receiver tube temperature | °C | (10) | |
| The mean fluid temperature [28] | °C | (11) | |
| Solar energy on the trough aperture [59] | W | (12) | |
| Heat absorbed | W | (13) | |
| Daily energy gained by water [60] | kJ | (14) | |
| Overall efficiency | - | (15) | |
| Water velocity | m/s | (16) | |
| Reynolds number | - | (17) |
| Instrument | Units | Range | Accuracy (%) | Uncertainty (%) |
|---|---|---|---|---|
| Solar power meter | W/m2 | 0–2000 | ±5 | ±2.886 |
| Thermocouple type K | °C | −270 to 1260 | ±0.75 | ±0.433 |
| Flow meter | Liters per minute | 0.0 to 4.0 | ±1.6 | ±0.924 |
| Data logger acquisition | °C | - | <0.02 | ±0.011 |
| Flow Rate (Liters per Minute) | Maximum Water Temperature Smooth Tube (°C) | Maximum Water Temperature Finned Tube (°C) | Difference (°C) | Difference (%) |
|---|---|---|---|---|
| 0.5 | 56.52 | 59.34 | 2.82 | 4.75 |
| 1.0 | 54.77 | 56.33 | 1.56 | 2.77 |
| 2.0 | 53.87 | 54.90 | 1.03 | 1.88 |
| 3.0 | 52.12 | 53.80 | 1.68 | 3.12 |
| 4.0 | 51.27 | 51.91 | 0.64 | 1.23 |
| Case | Heat Transfer (W) | Maximum Efficiency (%) | Equation |
|---|---|---|---|
| Finned tube | 1375.55 | 18.20 | y = −0.065ln(x) − 0.1991 |
| Smooth tube | 955.65 | 12.30 | y = −0.112ln(x) − 0.4105 |
| Case | Energy (kWh/day) | Carbon Footprint (Metric Tons of CO2e/day) | Carbon Footprint (Metric Tons of CO2e/Year) | Rate Increase (%) |
|---|---|---|---|---|
| Finned tube | 1.376 | 0.0007 | 0.2726 | 43.92 |
| Smooth tube | 0.956 | 0.0005 | 0.1894 | - |
| Energy (kWh/day) | Annual Energy (kWh/year) | Initial Investment (USD) | Year Investor IRR Achieved (Year) | Interest Rate (%) [63] | Weighted Average Cost of Capital, WACC (%) [82] | Net Present Value, NPV (USD) | Internal Rate of Return, IRR (%) | Payback Period, PB (Year) |
|---|---|---|---|---|---|---|---|---|
| 1.376 | 502.24 | 10,526.32 | 20 | 6.75 | 8.31 | 988.87 | 9.57 | 8.77 |
Disclaimer/Publisher’s Note: The statements, opinions and data contained in all publications are solely those of the individual author(s) and contributor(s) and not of MDPI and/or the editor(s). MDPI and/or the editor(s) disclaim responsibility for any injury to people or property resulting from any ideas, methods, instructions or products referred to in the content. |
© 2023 by the authors. Licensee MDPI, Basel, Switzerland. This article is an open access article distributed under the terms and conditions of the Creative Commons Attribution (CC BY) license (https://creativecommons.org/licenses/by/4.0/).
Share and Cite
Limboonruang, T.; Oyinlola, M.; Harmanto, D.; Bunyawanichakul, P.; Phunapai, N. Optimizing Solar Parabolic Trough Receivers with External Fins: An Experimental Study on Enhancing Heat Transfer and Thermal Efficiency. Energies 2023, 16, 6520. https://doi.org/10.3390/en16186520
Limboonruang T, Oyinlola M, Harmanto D, Bunyawanichakul P, Phunapai N. Optimizing Solar Parabolic Trough Receivers with External Fins: An Experimental Study on Enhancing Heat Transfer and Thermal Efficiency. Energies. 2023; 16(18):6520. https://doi.org/10.3390/en16186520
Chicago/Turabian StyleLimboonruang, Teerapath, Muyiwa Oyinlola, Dani Harmanto, Pracha Bunyawanichakul, and Nittalin Phunapai. 2023. "Optimizing Solar Parabolic Trough Receivers with External Fins: An Experimental Study on Enhancing Heat Transfer and Thermal Efficiency" Energies 16, no. 18: 6520. https://doi.org/10.3390/en16186520
APA StyleLimboonruang, T., Oyinlola, M., Harmanto, D., Bunyawanichakul, P., & Phunapai, N. (2023). Optimizing Solar Parabolic Trough Receivers with External Fins: An Experimental Study on Enhancing Heat Transfer and Thermal Efficiency. Energies, 16(18), 6520. https://doi.org/10.3390/en16186520