Abstract
Among the energy targets of the Vietnamese government, solar energy is expected to become the main source of renewable energy in the future. Solar energy is moving forward, with Vietnam outstripping Thailand and becoming the country that installed the largest capacity of solar power generation in Southeast Asia, reaching 16,362 MW in new installations in December 2021. In this study, we have experimentally analyzed and designed a capacity of 47.5 MW grid-connected photovoltaic plant mounted on the floatation system at Da Mi hydropower reservoir in Binh Thuan province. This was selected to be utilized as the first effort to develop the first large-capacity floating solar power plant on a hydroelectric reservoir in Vietnam. A detailed examination of the electrical analysis, including DC to DC converters, AC inverters to the transmission network, and PV module connectivity configurations, are in scope. The present research has the potential to make a contribution to the design of the DC electrical part, the AC electrical part, and the layout PV modules—Inverter—Floatation system—Floating bridge of FPV plants which are less described in the former articles. The performance of the plant after the first 2 years of operation has confirmed that it has met the expectations and exceeded the investor’s target, with the power output of the first 2 years being higher than the design by 102.58% to 105.59% and no serious damage has occurred to the equipment from 1 June 2019 to 31 August 2021.
1. Introduction
The production of the electric energy industry always goes hand in hand with the development and application of science and technology. The exploitation of fossil energy sources needs to be integrated with renewable energy sources such as wind energy and solar energy to improve the efficiency of the energy system [1]. The consumption of natural resources (fossil or fissile) inevitably reduces reserves and compromises their availability for future generations [2]. The shift from traditional energy sources, such as coal power, oil-fired power, gas power, and nuclear power to renewable energy will help countries ensure energy security.
In the world context, climate change and environmental protection are issues of global concern, from social organizations and financial institutions to national governments. Approximately 58% of global emissions today come from developing countries [3]. Fossil fuels are the main source of energy traditionally used by all countries, as reported by the International Energy Agency (IEA) in 2015, noting that fossil fuels meet 80% of energy demand worldwide and are responsible for 90% of associated emissions in the form of CO2 [4].
On the basic commitments of the National Determined Contributions (NDC) at the 2015 United Nations Conference on Climate Change in Paris (Paris Agreement—COP21), all countries have a step-by-step roadmap to eliminate the power sources using fossil fuel, especially coal-fired power, as well as set targets for developing renewable energy instead. The Indonesian government has encouraged the citizens to use renewable energy and targeted 23% in 2025 and 31% in 2050, following Government Regulation No. 79 of 2014 [5]. The Republic of Korea has set a target of 30.8 GW of installed PV capacity by 2030 and 35% of renewable energy generation by 2040 [6]. The overall goal of Thailand’s national plans set 25% renewable resources of the total country’s consumption by 2030 [7].
Currently, there are two main types of solar power technologies: concentrated solar power (CSP) and photovoltaic system (PV). Grid-connected PV plants have become a global trend [8]. Studies on the response and efficiency of PV plants according to topographic parameters and weather conditions at the plant site [9,10] to know the effects of temperature, wind speed, and radiation intensity on the module efficiency. The PV system performance can be described by the specific energy yield and performance ratio (PR) [11].
In recent years, research for whole-grid-connected PV systems has been increasing. Extensive directional simulation studies on selecting the most suitable and economical equipment minimize the system losses during the power generation period according to the weather conditions of the installed area. For example, Yendoubé Lare et al. [10,12] show how to select the inverters and other components to get high power output and minimize losses using Matlab/Simulink software environments. Estifanos Abeje Sharew et al. [13] studied power quality in terms of harmonic distortion to determine the level of voltage and current harmonic distortion using ETAP software. Hassane Dahbi et al. [14] determined the efficiency of a 6 MW PV plant from the available database of AC power, solar radiation, ambient temperature, wind velocity, etc., in hot desert climate conditions.
Mohammed Amine Deriche et al. [15] evaluated four grid-connected PV systems based on the different PV module technologies under environmental conditions in the Saharan city of Ghardaia, Algeria. Two silicon technologies—monocrystalline silicon (m-Si) and multi-crystalline silicon (mc-Si)—and two types of thin film technologies—cadmium telluride (CdTe) and amorphous (a-Si). Henrik Zsiborács et al. [16] supposed that the most widely used PV technologies are the polycrystalline (p-Si), monocrystalline (m-Si), and amorphous silicon (a-Si) ones based on their market share of about 90% in 2019.
At the end of 2016, the worldwide floating photovoltaic (FPV) installed capacity was more than 94 MWp. Japan took 60% of the world’s installed capacity 56 MWp, followed by China (20 MWp), the United Kingdom (10 MWp), and the Republic of Korea (6 MWp) (NREL, Solar Asset Management, 2018) [7]. FPV is an emerging approach to deploying PV on water bodies (structure + floater). The overall global potential and the extensive experience gained more than 2 GWp installed and 510 plants up to 2020, representing a venue for expanding renewable electricity production worldwide [17].
FPV technology was first commissioned in Aichi, Japan, with a 20 MW capacity to facilitate research in solar generation on water surfaces. Since 2007, It is attracting global attention in utilizing the existing water surfaces to generate PV power, and their growth is tremendously increasing [18]. The efficiency of the FPV plant is 11% higher and reduces water evaporation by 70% [19]. Research revealed that FPV systems could decrease 25% of carbon emissions annually based on CO2 emitted from manufacturing till the installation of PV systems on site (Trapani and Millar 2013) [20].
The advantages of water-based PV (FPV) plants vs. land-based PV (Ground PV—GPV) plants, such as reduced land usage (very important), avoided competing with agricultural or green zones, and limited impact on landscape [6,17,21,22,23,24]. FPV plants reduced many impacts during allocation, such as deforestation (site accessing), bird mortality, erosion, runoff, and microclimate change are expected to have lower influences on the implementation of conventional PV facilities [21,22,25,26,27]. Another benefit pointed out in [6,21,23,25,26,28,29,30,31,32] is that FPV will generate more electricity than conventional PV due to the cooling effect provided by the vapor that interacts with the back of the PV modules in the reservoir. On the other hand, humidity, together with temperature, play a main role in determining the module’s degradation [21,33]. In addition, it has many other potential advantages [21]: radiation balance (less shading, less soiling), grid access (exploit the existing infrastructure) [6,23], the great potential combination of FPV with hydroelectric power (combine hydropower plants (HPP) with FPV as hydro-PV hybrid systems) [6,18,22,23,24,34,35], water quality (expect algae growth) [6,22,23,28], reduction of evaporation loss (water saving) [6,7,18,23,28,36], rich application scenarios (integrate aquaculture and fish farming potential) [7], and huge market potential (water body area suitable for FPV deployment is large). It is also easier and cheaper for cooling veil implementation and cleaning mechanisms (the proximity to water; however, this may be hindered in salt water) [23]. The main point is that the mooring of floating systems can be installed and removed in a reversible way, unlike the GPV foundations, which are far more intrusive and permanent [24,35].
Globally, hydropower plants still represent the largest share of renewable electricity generation, over 1170 GW of installed capacity, thereof 328 GW is hydro Run-of-River capacity, and the rest is hydro reservoirs (141 GW of which is hydro-pumped storage) [37]. The emerging FPV technology is the recent global attention due to its high efficiency [18]. In fact, approximately 25% of the electricity demand throughout the world can be supplied by covering just 1% of natural reservoir surfaces by FPV systems (in 2014) [38]. The FPV potential contributes significantly to the United States’ electric part. A total of 24,419 artificial water reservoirs (27% of the number and 12% of the area of artificial water reservoirs in the contiguous US) were identified as suitable for FPV generation. FPV systems covering 27% of the identified suitable water reservoirs could produce 10% of the current national generation [28]. Despite the positive trend towards the adaptation of PV energy, Pakistan still has not a functional FPV plant which would have been a more sustainable choice due to the solar irradiance levels and suitable water reservoirs [39]. A notable number of existing water reservoirs in Africa are non-powered [40].
Developments of large-scale floating solar plants in the near future may pave the way for offshore technology development [19]. Indian states are focusing on increasing the total installed capacity of the FPV system [18]. The majority of existing capacity and planted FPV growth is located in Asia, driven by land costs, land availability constraints, and a large prevalence of hydropower paired with reservoirs [41]. One solution that is currently developing in developed countries is FPV systems [26]. In the Philippines, FPV’s potential is 11 GW from 5.0% of its water surface [42]. The market potential of FPVs on dams and reservoirs in Indonesia reaches at least 3.9 GW [42]. The Electricity Generating Authority of Thailand plans to install 2.7 GW of FPV capacity via 16 solar plants on hydroelectric dams by 2037 [42]. FPV systems are likely to outperform PV systems on land or rooftops [21]. Vietnam has large surface areas of many hydroelectric reservoirs and nearly 7000 irrigation reservoirs which can also be used to install FPV plants. The strategy suggested consists in installing FPV power plants equal to the existing HPPs to decrease the hydro energy production during sunny hours and maintain the energy fed into the grid at an approximately constant level [24,35,43]. For Southeast Asian countries such as Thailand, Vietnam, and Indonesia, the decision to install FPVs would be based primarily on the economics of existing grid infrastructure and land scarcity [42]. That has been promoted by many researchers and agreed upon by the Vietnamese government. Vietnam plans to hold tenders for up to 400 MW of FPV in 2018 [42].
The primary purpose of the PFCS is to improve the water and power efficiency of irrigation reservoirs [27]. Both mechanical and electrical structures of these systems, many studies have been conducted on fixed-type FPV and tracking type FPV [6,7,23,44,45,46], integrated on grid [35,43] and off-grid FPV plants [46], small capacity FPV plants [36,37,41], large capacity FPV plants [35,43], especially the combination operation of hydropower with FPV plants [35,37,40,43,47] (estimate the global potential of FPV at 400 to 1000 GW and paired with hydropower at 4400 to 5700 GW [38,48]), were analyzed based on a technical point of view will help to predict and design the optimal FPV plant. Looking at the recent progress results provides a different view of the aspects from relevant publications, as shown in Table 1.

Table 1.
The recent progress results.
An FPV system comes from a combination of PV plant technology and floating technology [44]. The present study proposes a preliminary 47.5 MW FPV system on the water surface at the Da Mi hydropower reservoir connected to the national utility grid 110 kV in May 2019 and has been operating since then. The performance of the plant after the first 2 years of operation has confirmed that it has met the expectations and exceeded the investor’s target for the first 2 years. This selected to be utilized as the first effort to guide estimating the achievable energy capacity, generation (GWh/year), suitable area for deployment of a generation technology, performance ratio (PR) [18,33,34,49,59,60], topographic limitations, and environmental constraints. A detailed examination of the electrical analysis, including DC to DC converters, AC inverters to the transmission network, and PV modules connectivity configuration, are in scope. The present research has the potential to make a contribution to the design of the DC electrical part, AC electrical part, and layout of PV modules—Inverter—Floatation system—Floating bridge of FPV plants which are less described in the former articles.
2. Technical Analysis of the FPV System
2.1. Solar Radiation Data at the Plant Area
The best location is selected by comparing the available solar resources, nearby load, storage of land, and performance parameters [61]. Solar irradiance data can be obtained from various sources such as [16,18,35] obtained from NASA. For the FPV plant at Da Mi hydropower reservoir (at 10°33′42″ to 11°33′18″ North latitude and from 107°23′41″ to 108°52′42″ East longitude), meteo database has been chosen, and the data imported—latitude, longitude, altitude, and time zone are displayed. If monthly meteorological data are available, PVsyst performs a generation of hourly synthetic meteo data using Meteonorm 7.2 algorithm. This data is aggregated and interpolated from measurement stations combined with measured radiation data of satellites. Global horizontal irradiation recorded at the Da Mi area is about 1777 kWh/m2/year, equivalent to 4.87 kWh/m2/day, as shown in Figure 1.
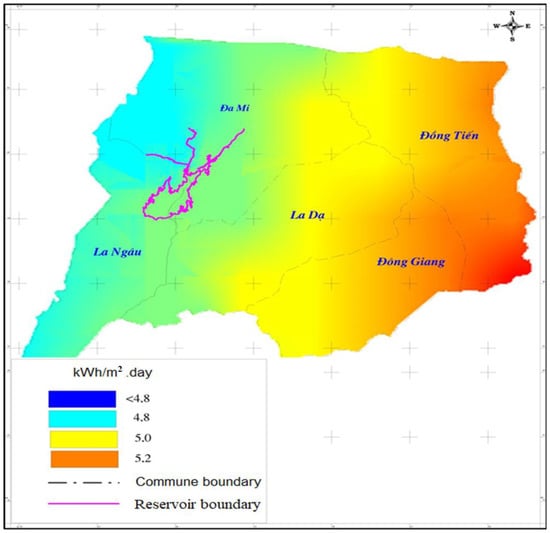
Figure 1.
GHI Map of average day recording at the plant area.
From NASA’s free public data source (website: https://eosweb.larc.nasa.gov/sse/, accessed on 13 April 2017), the global horizontal irradiation at the plant area is 1874 kWh/m2/year, equivalent to 5.13 kWh/m2/day.
From SolarGIS’s free available data source (at the website: http://solargis.com/, accessed on 13 April 2017), the global horizontal irradiation at the plant area is 1846 kWh/m2/year, equivalent to 5.06 kWh/m2/day.
Through research and evaluation, the article proposes to use data purchased from SolarGIS. This is a commercial database measured from satellites in a long time series. It is aggregated and calculated to produce a typical meteorological value of a typical year. The SolarGIS data source has been rated as the most reliable source by many independent research organizations.
Data purchased from a SolarGIS source includes:
- TS: Average hourly meteorological value, measured from 1 July 2006 to 28 February 2017;
- TMY P50: Typical meteorological value in the year of probability P50, calculated from the series 1 January 2007–31 December 2016;
- TMY P90: Typical meteorological value in the year of probability P90, calculated from the series 1 January 2007–31 December 2016;
- In which the data string includes:
- GTI: Global tilted irradiance (Wh/m2)—Tilted angle 12°, South-facing;
- GHI: Global horizontal irradiation (Wh/m2);
- DHI: Diffuse horizontal irradiation (Wh/m2);
- SE: The altitude angle (degrees);
- SA: Sun’s azimuth (degrees);
- WD: Wind direction (degrees);
- TEMP: Air temperature at 2 m (°C);
- WS: Wind speed at a height of 10 m (m/s).
Table 2 and Table 3 summarize the main results from the SolarGIS data source and monthly average GHI values of the data sources:

Table 2.
SolarGIS data source summary.

Table 3.
The monthly average GHI values of the data sources (kWh/m2).
With results from purchased SolarGIS data, the plant proposes to use typical meteorological value in the year of probability P50 to calculate the plant simulation. The calculation results of the PVsyst software will also give the results of the power output corresponding to the probability P90 for comparison.
2.2. The Grid-Connected FPV System
The direct grid-connected FPV plant consists of the components described as shown in Figure 2 below.
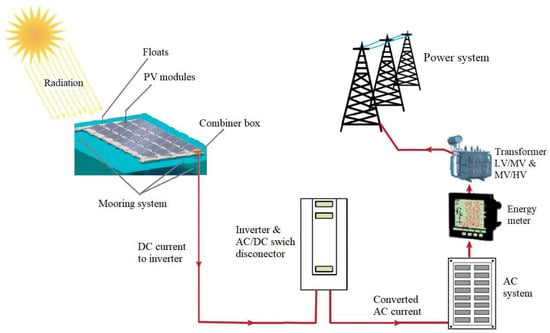
Figure 2.
Overview diagram of grid-connected FPV power plant.
In FPV technologies, besides the Electrical components, including inverters, power cables, and photovoltaic systems, there are also the floatation system, the structural system, and the mooring system [23]. A direct grid-connected FPV plant includes the systems described in Figure 2:
- Photovoltaic module (PV module): each photovoltaic module consists of many photovoltaic cells (PV cells); the PV modules will be connected in series (string or panel) and parallel (array or system) to achieve the required DC output power;
- Inverter: a powerful electronic device that converts DC current into AC current;
- Step-up transformers: depending on the capacity scale and regional utility grid conditions, the voltage can be changed appropriately (for example, 22 kV, 35 kV, 110 kV, 220 kV). High voltage levels will need two levels of transformers;
- Floatation system (pontoon or mounting system): with the solution of installing modules on the water, the rack system is replaced by a water-base floating system;
- Structural system: connecting the floatation system and supporting the PV panels;
- Mooring system: consists of mooring lines anchored to the anchoring blocks at the reservoir bottom and the above pontoon bridge system to ensure stability during operation, subsequent construction, and operation;
- Infrastructure for utility grid connection: the substation, including protection, metering, and controlling equipment.
2.2.1. PV Module
Silicone is a natural source of choice because it has a low production cost, stable efficiencies, is naturally abundant, and is nontoxic [62]. The solar cell efficiency is as follows [63]: GaAs Thin-Film convert 24.1–30.8%, monocrystalline silicone convert 12.5–15%, multi/polycrystalline silicone convert 11–15%. In general, PV converts 4–17% of solar radiation into electrical energy. The high irradiation intensity increases the module’s temperature and decreases the efficiency of the PV cell [12,38]. For silicon modules, a typical reduction of efficiency with temperature is 0.4–0.5%/°C [58,64]. The negative temperature coefficient is 0.45% per °C for crystalline and 0.2% per °C for amorphous silicon PV modules (Skoplaki and Palyvos 2009) [65]. Monocrystalline (c-Si) and polycrystalline (pc-Si) silicon cells decrease the efficiency by about 0.45% and 0.25% for c-Si and pc-Si, respectively [66]. Table 4 shows the average efficiency and negative temperature coefficient of current PV module technologies.

Table 4.
Efficiency characteristics of photovoltaic cells.
Capacity/efficiency: high efficiency means an increase in capacity per module, which leads to reduced construction-related costs and reduced space. For polycrystalline silicon panels, the PV efficiency range from 15 to 17%. Crystalline PV modules are used for annual performance degradation. For this research, it was set at 0.5%, which is the generally accepted rate [67,68].
PV module efficiency is compared between the electricity generated and the solar intensity incident, which is formulated according to [11,19] as follows:
where ηmodule is electrical module efficiency (%), Pmax is the power generated by the PV module (W), S is solar intensity incident in the PV module (W/m2), and APV is the surface of PV exposed by radiation (m2).
Simulation software like PVsyst, HelioScope, ANSYS, OrcaFlex, and CFD can be used in designing the layout, angle of tilt, plot size, designing of floatation system, anchoring and mooring lines, placement of inverters, plant capacity, the balance of the system, estimates of generations for the plant life, … [34]. PVSOL can also be used as a designing tool as well as a simulation tool [69]. The applied, comparative, and predictive studies for grid-connected solar power plants have used PVsyst software for technical analysis, selection of panels, inverters, and other components in the system, or designing PV systems [16,70,71,72,73] by many authors. The main simulation results are the electricity output in the year, the generating capacity, and the generation time used to design and evaluate the efficiency of the plant. Calculation results of different capacities modules are presented in Table 5 below by PVsyst software.

Table 5.
Calculation results compared with silicon modules.
The above calculation results show that with the same installed capacity when increasing the efficiency/capacity of the modules, the power output basically does not change (very small change under 0.5%); however, it can reduce the number of modules and factory ancillary components (floats, brackets, cables, combiner boxes, etc.).
Therefore, in order to improve the efficiency of the plant and reduce the area and the installation cost, the article recommends using the 72-cell type of silicon photovoltaic module with a capacity of not less than 330 Wp, a module efficiency of not less than 17%, with main parameters as shown in Table 6. This power and efficiency range is currently popular globally.

Table 6.
Main technical parameters of PV modules.
2.2.2. Matching PV Arrays and Inverters
Total Installed Capacity of Inverter
The selected modules have a rated capacity of 330 Wp, which is the power measured at standard conditions STC: radiation 1000 W/m2, module temperature 25 °C, AM ratio 1.5 [7,23,60]. However, in operating conditions, with radiation of about 1000 W/m2, the working temperature of the panels is usually much higher (the operating temperature of the module is usually 20–30 °C higher than the air temperature). The operating temperature of the module is calculated using Equation (2) [52,54,74]:
where Tmodule is the operating temperature of the PV module, Tamb is the ambient temperature, and NOCT is the nominal operating cell temperature, around 45 ± 2 °C (the module type dependent test temperature at an irradiance of 800 W/m2 with an ambient temperature of 20 °C), S is solar irradiation (W/m2).
The power loss of the module due to temperature is calculated using Equation (3) [64]
where Pmodule is the operating capacity of the module, Pmpp is the rated power of the module, Tmodule is the operating temperature of the module, and γ is the loss of PV module by temperature, with the polycrystalline silicon module usually 0.4 ÷ 0.5%/°C.
Using typical meteorological data in the year of probability TMY P50 to calculate, with the installed 47.5 MW plant, the maximum output capacity of the PV arrays is shown in Table 7.

Table 7.
Maximum output power of PV arrays in hours (MW).
The maximum output capacity of the PV arrays is approx. 41 MW, achieved between 11 a.m. ÷ 12 a.m. in February and March. This data is used as the basis for selecting the total inverter capacity of the plant.
Increasing the PV array/inverter ratio (which means reducing the installed capacity of the inverter) can lead to a reduction in the residual capacity, increasing the electrical capacity used for cooling and ventilation of the inverter as well as the surroundings, but can reduce the total investment of the plant. Therefore, the article recommends that the total selected inverter capacity is 42.5 MW. With this capacity, the plant ensures the transmission of the entire output capacity of the PV array to the grid.
Main Parameters of Inverter
PV inverters are divided into three categories, including a microinverter capacity of up to 275 W, string inverters that have a capacity of 100 kW, and central inverters beyond 100 kW [40], of which the second and the third models currently dominate the market [6] (Figure 3).

Figure 3.
Connection models of central inverter and string inverter.
The selection of inverter capacity depends on the power generated by the solar power plant and the requirement of reactive power to which the plant is connected. Due to the manufacturing characteristics, the inverter is coupled from many smaller units with a capacity of 500 kW or 600 kW to ensure the installation area conditions on the lake surface with a 0.6/22 kV transformer and 22 kV electrical cabinet; the article recommends the capacity of each inverter is 2500 kW, connected to 01 transformer and 22 kV distribution cabinet system with circuit breaker to protect against short circuit.
Through the above analysis, the article recommends choosing a central inverter type with the following main technical requirements in Table 8.

Table 8.
Main technical parameters of the inverter.
2.2.3. Calculation of Choosing Medium Voltage Transformer
Medium voltage transformers in PV power plants have the function of raising the output voltage of the inverter to a medium voltage level for direct grid connection or collecting for the high voltage transformer to upgrade to a higher voltage level.
The total capacity of the transformer is selected on the basis of the following:
- DC input power of the inverter;
- The required power factor of PV power is 0.95;
- Inverter efficiency is 0.985.
The total transformer capacity of 0.6/22 kV is determined using Equation (4):
The transformer is selected according to the inverter capacity and electrical connection diagram: the article recommends the capacity of the transformer combined with the inverter as follows:
- Connection diagram: 1 inverter connects 1 transformer; transformer capacity is 2500 kVA, a total of 17 transformers;
- Total capacity of transformers: 42.5 MVA.
- Rated high voltage 22 kV.
- Rated low voltage 600 Vac.
The main technical parameters of the selected medium voltage transformer are shown in Table 9.

Table 9.
Main technical parameters of the transformer.
3. FPV Plant Design
3.1. Installed Design for PV Modules
3.1.1. Module Tilt Angle
The common rule is confirmed by computing the optimal tilt angle is determined using Equation (5) [75]:
The PV plant mounted on a floatation system at the Da Mi hydropower reservoir is located at latitude 11.3° North. From PVsyst software, the optimal tilt angle is from 12–16°, the azimuth angle is south-facing (0°), and the global tilted irradiance is 1.818 kWh/m2/year, shown in Figure 4.
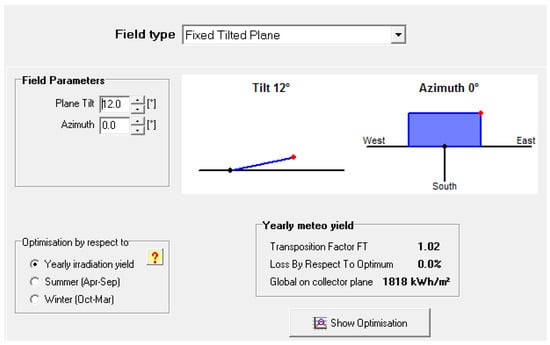
Figure 4.
Optimum tilt angle calculated from PVsyst software.
We chose a small tilt angle to reduce the loss of internal shading between the modules. In addition, choosing a small tilt angle reduces the impact of storm winds on the system structure, especially with the PV module mounted on a water base. Therefore, the tilted angle of the panel is selected to be 12°, and the direction is south-facing.
3.1.2. Install the Modules
The distance between rows is determined by the tilt angle of the module. Not only the shading effects but also those of the conductors must be taken into account to prevent the hot spot effect and to utilize the area [76]. Shading limits the angle and the optimal use of the area. When the sun angle is less than α, part of the module will be covered, causing losses. A prerequisite for choosing row spacing is no internal shading at the zenith (at noon) of the lowest solar day of the year (winter solstice, December 21), and that the system has an internal shading loss of less than 1% is reasonable.
Through calculation, the result of choosing the distance between the rows of modules is 0.5 m. The main parameters are shown in Figure 5:
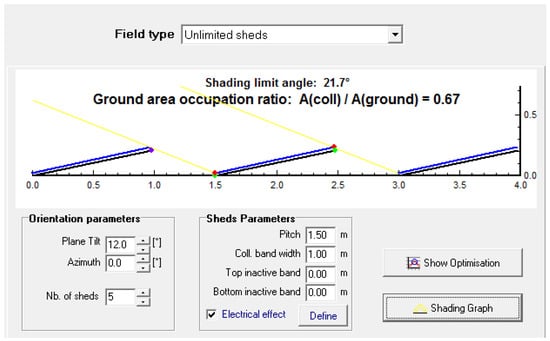
Figure 5.
Distance between module rows.
- Width of 1 row of rack: 1 m (equals to the width of 1 module);
- Pitch distance (between 2 lower edges of 2 adjacent module rows): 1.5 m;
- Tilt angle: 12°;
- Shading limit angle: 21.7°;
- Ground Coverage Ratio—GCR: 67%.
With the selected distance, the system met the condition of no shading at noon on December 2021, as shown in Figure 6, and the internal shading loss is 1%, as shown in Figure 7. In addition, the selected distance is also suitable for maintenance.
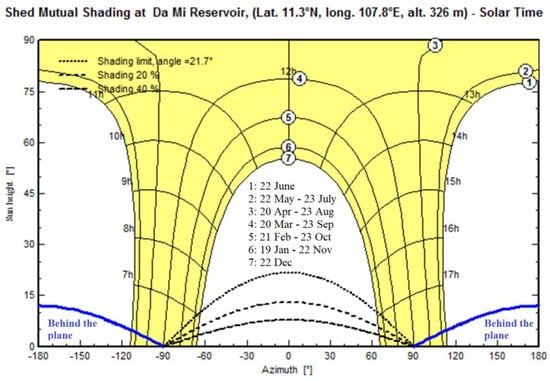
Figure 6.
Shading conditions on December 2021.
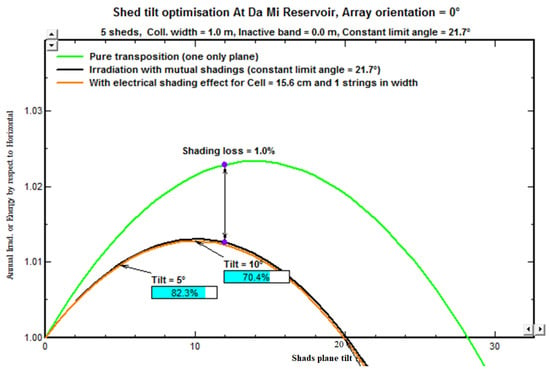
Figure 7.
Condition of shading loss.
3.2. DC Electrical Part Design
3.2.1. Minimum Number of Modules in Series
The minimum number of modules in a series is limited by the minimum operating voltage of the inverter (850 V). The minimum operating voltage of the module is determined at the point of the highest operating temperature of the module [77]. According to data purchased from Solargis, the highest air temperature in the plant area is 36.2 °C. Normally, the operating temperature of the module will be about 20–30 °C higher than the ambient temperature. The article uses 60 °C as the highest operating temperature of the module to design.
The minimum number of modules in a series can be computed using Equation (6):
3.2.2. Maximum Number of Modules in Series
The maximum number of modules in a series is limited by the maximum allowable voltage of the system (1500 V). The maximum open-circuit voltage of the module is determined at the lowest ambient temperature when the module is operating [26]. In the plant area, according to the results of typical annual meteorological data TMY P50 purchased from Solargis in the plant area, the minimum air temperature in the year is 12.8 °C and the minimum air temperature in the presence of irradiation is about 13.3 °C. The article uses the value 13 °C as the lowest operating temperature of the module.
The maximum number of modules in a series can be computed using Equation (7):
3.2.3. Maximum Number of Parallel PV Strings into an Inverter
The Maximum number of parallel PV strings in an inverter can be computed using Equation (8):
The maximum number of parallel PV entering an inverter is limited by the inverter’s maximum working current (). The working current of a string is equal to the operating current of a module ().
3.2.4. Calculation of PV Array/Inverter Capacity
In most modern inverters, when the DC input power is greater than the inverter’s power limit, the inverter will automatically shift the I/V operating point of the PV array (to a larger voltage) to keep it equal to the rated power. Therefore, designing the input power of the PV array to be larger than a part of the rated capacity of the inverter will not affect the operation and the lifetime of the inverter.
When designing PV/inverter ratio greater than 1, part of the capacity of the PV array cannot be transmitted to the grid because the inverter cuts. The PV array will not operate at its best at this time because the load does not receive all the electricity generated from the PV array, which will cause the PV array to be heated up a little. This portion of power is called overload loss. The loss of the generated power to the grid will be compensated for by reducing the number of installed inverters. Currently, in the world, the average PV/inverter ratio ranges from 1.1 to 1.4 [54,77].
Through calculation by PVsyst software, the total selected inverter capacity is 42.5 MW, so the PV/inverter ratio selected in Figure 8 shows:
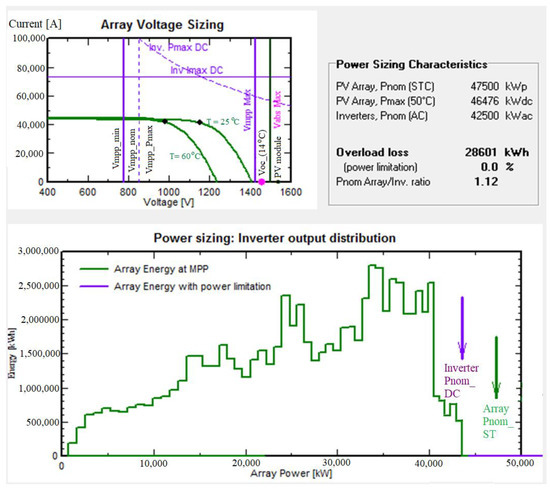
Figure 8.
PV/inverter ratio selection.
- Rated PV arrays capacity (STC): 47.5 MWp;
- Maximum PV arrays capacity (50 °C): 46,476 MW;
- Rated inverters capacity (AC): 42.5 MWac;
- PV/inverter ratio: 1.12;
- Overload loss ratio (total output): 0.0%.
The general design parameters of the PV arrays are in Table 10 as follows:

Table 10.
General design parameters of the PV arrays.
The design parameters of the PV arrays are shown in Table 10. The system consists of 17 inverters and 4978 PV strings; on average, each inverter will have 282.2 strings and 17 or 18 combiner boxes with 16 input conduits. So, the design option is chosen as follows:
- Inverter 1–6: each inverter includes 272 PV strings and 17 combiner boxes with 16 input conduits;
- Inverter 7–17: each inverter includes 288 PV strings and 18 combiner boxes with 16 input conduits;
3.3. AC Electrical Part Design
Connecting FPV may reduce the costs of transmission extensions, substations, and other infrastructure requirements, as well as decrease time [78,79,80]. The AC electrical part of the FPV plant at Da Mi reservoir includes equipment from the output of the inverter such as low voltage electrical equipment, 0.4/22 kV transformer, 22 kV distribution equipment, and the set includes circuit breakers, current transformers, measuring transformers, protective equipment, controlling, and monitoring on the general cabinet ….
The technological diagram of the AC electrical part design is expected to be configured as follows:
- Inverter station A:
- Including 7 inverters connected to 7 transformers 0.6/22 kV;
- The 22 kV distribution system has an electrical connection diagram of two busbars with segments, including seven routes to the 0.6/22 kV transformer, two routes to the 110 kV substation, and two segmentation compartments;
- Inverter station A:
- Including 10 inverters connected to 10 transformers 0.6/22 kV;
- The 22 kV distribution system has an electrical connection diagram of 2 busbars with segments, including 10 routes to 0.6/22 kV transformer, two routes to 110 kV substations, and two segmentation compartments.
Circuit breakers are equipped with electrical protection according to electrical equipment regulations, including protection for difference, overcurrent, overload, and synchro.
The converter cabinets are equipped with over-current, directional over-current, over-voltage, and under-voltage protections.
From the inverter connected to the 0.6/22 kV transformer, there will be protective devices, including a circuit breaker, isolator, overcurrent functions protection, over-voltage, under-voltage, and earth-fault …. All these devices are usually built into the inverter.
4. The Layout of PV Modules—Inverter—Floatation System—Floating Bridge System
4.1. Site Conditions
The water-based configuration of FPV systems can be classified according to different criteria [79], such as position in relation to the water surface: i.e., over (floating system) [18,32] or under (submerged); type of water: fresh (reservoir, river), wastewater [36], or salt (seawater) [80,81]; type of PV module: rigid or flexible [21,32,55,82]. An FPV plant can be set up on various water surfaces such as water tanks, artificial and natural reservoirs, water canals, hydro accumulation, sea surfaces, etc. [19]. It is necessary to combine PV plant technology and floating technology [33]. Da Mi hydropower reservoir was built in 1997 and put into operation in 2000, and the site conditions affect the design, construction, installation, and operation of solar power on the hydropower reservoir as follows:
- The maximum wind speed with a frequency of 2%: 11.3 m/s at an altitude of 3 m above the water surface;
- The reservoir is well-ventilated, without large trees or cliffs covering it;
- Reservoir surface area: 609.6 ha at normal water level rise;
- Farming activities on the reservoir: Yes;
- Type of water: River water, clean, unpolluted;
- Reservoir water depth: Average (59 m), Min (58 m), Max (62.5 m);
- Elevation of reservoir water level: Average (324 m), Min (323 m), Max (327.4 m), the water level fluctuation is small (max: 4.5 m); this is the main advantage that Da Mi hydropower reservoir was selected to research and propose to invest in the construction of an FPV plant.
4.2. The Layout of a PV Array and a Combiner Box
Each PV string will consist of 30 modules in series and located on the same row of structure, each row of structure spaced a distance of 0.5 m as an operating passage. The models in a series will be placed horizontally in succession, spaced 50 mm.
In addition, for the convenience of maintenance later, between two consecutive PV arrays horizontally East–West) there will also be a distance of 0.5–1 m to make the operating path and place the combiner boxes. Each combiner box contains 16 PV strings in parallel, and each PV string includes 30 PV modules in series in Figure 9.
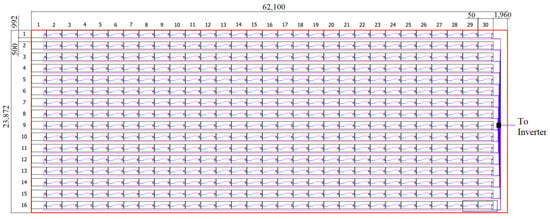
Figure 9.
The layout of a PV array with 16 PV strings.
4.3. The Layout of All PV Arrays and Inverter
The PV arrays will be arranged on the reservoir surface so that the distance to the inverter station is minimal. Therefore, it is necessary to pay attention to the location of the inverter station.
Through studying the topography of the Da Mi reservoir, there are two favorable locations to place the central inverter stations as follows (Figure 10):
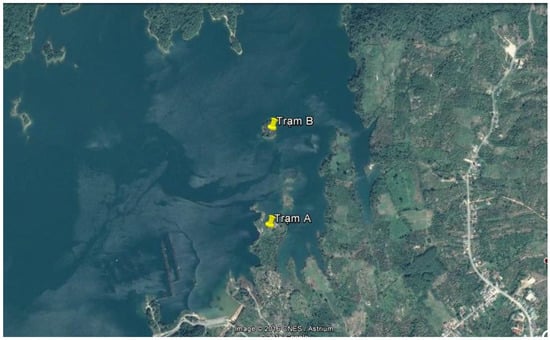
Figure 10.
The chosen locations to place central inverter stations A and B.
- The rocky snout protruding into the reservoir is located at the coordinates of 11.47° north latitude and 107.846° east longitude. This position has the lowest elevation of about 326 m, and the terrain is relatively favorable for leveling the ground; it is guaranteed to be above the max elevation of reservoir water level (327.4 m). This location was chosen to place inverter station A;
- The floating island in the middle of the reservoir is located at coordinates 11.253° North latitude, 107.846° East longitude. This floating island location is about 700 m from the inverter station A, with a peak elevation of 335 m. This location was chosen to place inverter station B; it is guaranteed to be higher than the max elevation of the reservoir water level.
After choosing the location of the central inverter stations as above, proceed to arrange the PV arrays around the two central inverter stations. To ensure the structure of the whole floatation system, it is necessary to divide the PV arrays to place the pontoon bridges alternately. The anchor system will be connected to the floating bridges to link the whole system.
In order to evenly distribute the inverters, some PV arrays located in the area of station A can be connected to station B. The results of the PV array arrangement of the whole plant are in Figure 11.
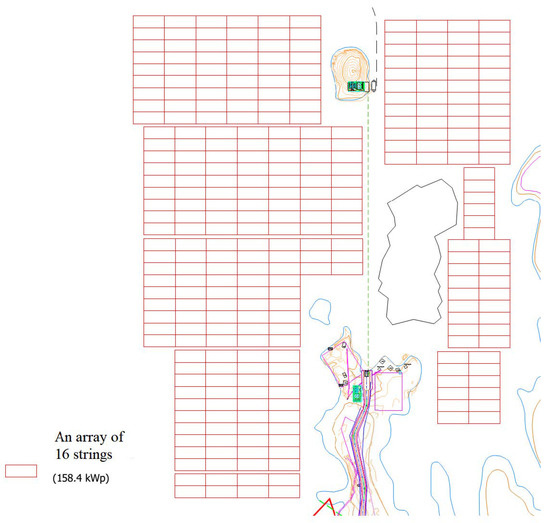
Figure 11.
The layout of all PV arrays.
Where:
- Area A: connected to inverter station A, with a total area of about 18.2 hectares for floating installation and an installed capacity of about 19 MWp. Inverter station A has an area of 13 × 30 m and will install seven inverters 2500 kVA and seven step-up transformers 2.5 MVA;
- Area B: connected to inverter station B, with a total area of about 27.3 hectares for floating installation and an installed capacity of about 28.5 MWp. Inverter station B has an area of 15 × 30 m and will install 10 inverters with 2500 kVA and 10 step-up transformers with 2.5 MVA.
4.4. The Layout of the Floatation System (Pontoon) and Structural System
The floatation system is the key element of the system. It has to ensure stability and buoyancy, and it is the basis of the FPV plant [27]. Floatation system: a floating body (structure + floater) that allows the installation of the PV modules and mooring system: can adjust to water level fluctuations while maintaining its position [6,44]. FPV systems are categorized as PV modules mounted on floatation tanks with (a) structures built with polymers and galvanized steel, then assembled to form a wide platform, or (b) structures built entirely from polymers [23]. Floatation systems are compared to two types of floats, namely prefabricated and assembled floats. Prefabricated floats with High-Density Polyethylene material (HDPE) shaped by die casting are shown in Figure 12.
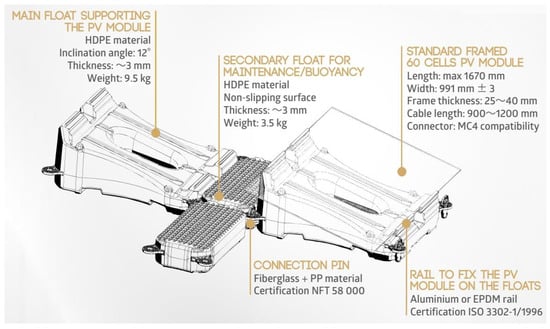
Figure 12.
Layout of a prefabricated float system.
Investment cost: by reference, this prefabricated float system costs about 0.28 USD/Wp. In addition, the cost of transportation and installation is about 10%. Besides the option of using prefabricated floats, the plan of using HDPE plastic floats and assembled steel floors is also calculated for comparison. The investment comparison results of the two options are shown in Table 11.

Table 11.
The investment comparison results of two floatation system options.
Floating platforms are 100% recyclable, using HDPE, which can reduce UV light and corrosion [19]. After extensive literature studies on the properties of polyolefins, HDPE [58] is found to be a better material for this purpose. The tensile strength was reduced from 23.22 MPa to 14.64 MPa after accelerated UV exposure. After 1000 h of exposure to accelerated weathering, the material still has the tendency to hold a constant load of 637.81 N without rupture, compared to the non-weathered sample (955.16 N) [83]. Realizing that the designed assembled float option has a much higher cost than the imported prefabricated float option, the prefabricated float option uses the float system of reliable manufacturers in the world, ensuring the structural strength and longevity of the whole plant. Therefore, it is recommended to choose the prefabricated float option.
4.5. The Layout of the Floating Bridge System
Due to the specificity of the FPV plant installed on the Da Mi hydropower reservoir with a large capacity, subject to the great impact of flows and waves, the float systems themselves cannot bear the force to hold the entire floating arrays. Therefore, it is necessary to design a floating bridge system to do the task of anchoring very large PV arrays to be stable against the effects of wave, wind, and flow (Figure 13).

Figure 13.
Representation of a pontoon bridge.
The floating bridge is a system of floats connected to each other to create passages for project managers and operators. The float structure is a shaped HDPE plastic material with a sheet size of 507 × 507 × 400 mm, a thickness of 3 mm with reinforced ribs, a permissible load of 95 kg/float, and a product life over 25 years. The width of the floating bridge is 3.0 m (the width of the passage section is 2.0 m. The width of the power cable corridor on both sides is 2 × 0.5 m = 1.0 m).
Da Mi FPV plant with an installed capacity of 47.5 MWp belongs to the energy industrial building class 1, including six PV mounting arrays (array A–F). The total number of modules is 143,940, overviewed in Figure 14. In addition, there are leading corridor pontoons, cable support pontoons, navigation pontoons, etc. The total water surface area is 50 hectares.
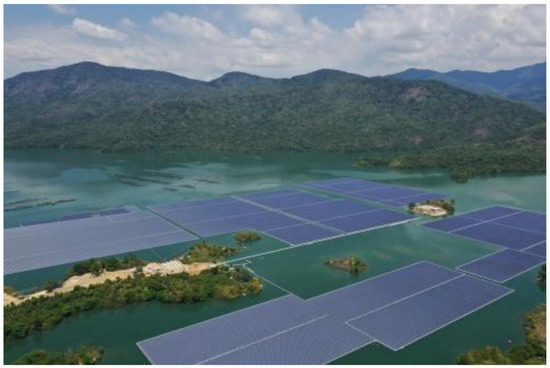
Figure 14.
The overview of Da Mi PV Plant.
5. Results
5.1. Simulation Results
Using PVsyst 6.61 software to simulate the plant is a specialized software commonly used in the world to design PV power plants. The simulation results are the electricity production in the year, the generating capacity, the generation time used to design the power system, and evaluate the efficiency of the plant. The plant’s declared input parameters include the following:
- Plant geographical location;
- Typical meteorological data (from SolarGIS source);
- Environment conditions: albedo, lowest ambient temperature, and highest operation temperature;
- Module installation configuration: tilt angle, azimuth, distance;
- System design: selection of panels, inverter for calculating the number of devices, capacity, and wiring;
- Declare loss values: temperature loss, AC and DC conductor loss, dirt, irradiation, PV quality, system difference, self-use, and attenuation factor;
- Declare shading based on a topographic map.
After conducting the simulation, the main results of the Da Mi PV power plant are shown in Table 12.

Table 12.
Plant simulation results.
5.2. Operation Results
FPV systems covering under 10% of Da Mi hydropower reservoir surface, the owner has not recorded any unusual phenomena of environmental impact in the plant area. The real electricity production after 2 years of operation is measured and summarized as follows:
- The real electricity production of the plant in the first year (from 1 June 2019 to 31 May 2020) reached 74.18 million kWh with a real PR of 83.40%, which is 4.19 million kWh higher than the design electricity production of 69.99 million kWh with design PR of 81.43%, equivalent to 105.95%;
- The real electricity production of the plant in the second year (from 1 June 2020 to 31 May 2021) reached 71,293 million kWh, about 1794 million kWh higher than the design, equivalent to 102.58%. However, the Da Mi FPV power plant had to cut out 2.94 million kWh of real electricity production due to an excess of the national power grid from November 2020 to 31 May 2021.
During the operation period until 31 August 2021, there has been no serious damage to the equipment.
6. Conclusions
According to solar irradiation data TMY P50 from SolarGIS source in the plant area, a preliminary 47.5 MW FPV system on the water surface at Da Mi hydropower reservoir connected to the national utility grid 110 kV in May 2019 was proposed, which examines the electrical analysis including total rated DC PV arrays capacity (STC) of 47.5 MWp total rated DC converters of 47,500 kW, 17 inverters (2500 kW per set), 17 transformers (2500 kVA per set) and 143,940 PV modules (72 cells—330 Wp per module) interconnection configuration.
The DC electrical part design consists of 17 inverters, 17 PV arrays, and 4978 PV strings. Thirty PV modules connected in series form a PV string, 16 PV strings connected in parallel form a PV array connected to a combiner box, and 17–18 combiner boxes connected to one inverter. On average, each inverter will have 282.2 strings and 17 or 18 combiner boxes with 16 input conduits. AC electrical part design consists of 17 transformers 0.6/22 kV connected to the 22 kV distribution system and has an electrical connection diagram of two busbars with segments by seven routes and two routes to the 110 kV substation.
The layout PV modules—Inverter—Floatation system—Floating bridge of the FPV plant is divided into area A connected to inverter station A and has a total area of approx. 18.2 hectares for floating installation with an installed capacity of about 19 MWp (inverter station A has an area of 13 × 30 m and will install seven inverters 2500 kVA and seven step-up transformers 2.5 MVA), and area B connected to inverter station B has a total area of about 27.3 hectares for the floating installation with an installed capacity about 28.5 MWp (inverter station B has an area of 15 × 30 m and will install 10 inverters 2500 kVA and 10 step-up transformers 2.5 MVA).
FPV systems covering under 10% of Da Mi hydropower reservoir surface could produce 74.18 million kWh with a real PR of 83.40% in the first year, which is 4.19 million kWh higher than the design electricity production 69.99 million kWh with a design PR of 81.43%, equivalent to 105.95%. In the second year, this FPV system could produce 71,293 million kWh, about 1794 million kWh higher than the design, equivalent to 102.58%. However, 2.94 million kWh of real electricity production had been cut out due to an excess of the national power grid in the second year.
These planning activities help decision-makers assess how hybrid systems could support through conservation of hydropower resources. This work contributes a systematic review of associated benefits and environmental constraints [22] and an assessment of technical potential developing a method to apply FPV-hydropower systems configuration assumptions.
Author Contributions
Conceptualization, T.-T.B.; methodology, N.-H.N.; software, B.-C.L. and L.-N.N.; validation, N.-H.N. and B.-C.L.; formal analysis, N.-H.N. and B.-C.L.; investigation, N.-H.N. and T.-T.B.; resources, N.-H.N. and T.-T.B.; data curation, N.-H.N. and L.-N.N.; writing—original draft preparation, N.-H.N. and B.-C.L.; writing—review and editing, N.-H.N. and L.-N.N.; visualization, N.-H.N. and B.-C.L.; supervision, N.-H.N., B.-C.L. and L.-N.N.; project administration, N.-H.N. and T.-T.B.; funding acquisition, N.-H.N. and T.-T.B. All authors have read and agreed to the published version of the manuscript.
Funding
This work was supported by Da Nhim—Ham Thuan—Da Mi Hydropower Joint Stock Company and Industrial University of Ho Chi Minh City, Ho Chi Minh 71408, Vietnam.
Data Availability Statement
All data generated or analyzed during this study are included in this published article.
Conflicts of Interest
The authors declare no conflict of interest.
References
- Sweeney, J.C. Climate Change. Int. Encycl. Hum. Geogr. 2009, 147–155. [Google Scholar] [CrossRef]
- Bemana Ngueouele, Y. Modélisation des Injections de Puissance d’un Système PV sur un Réseau Public; Institut International d’Ingénierie de l’Eau et de l’Environnement: Ouagadougou, Burkina Faso, 2012. [Google Scholar]
- Ali, S.; Taweekun, J.; Techato, K.; Waewsak, J.; Gyawali, S. GIS based site suitability assessment for wind and solar farms in Songkhla, Thailand. Renew. Energy 2019, 132, 1360–1372. [Google Scholar] [CrossRef]
- Pawar, S.; History, M. Harmonic analysis of high penetration PV system on distribution network. Int. J. Appl. Eng. Res. 2019, 6, 401–408. [Google Scholar]
- Setiawan, F.; Dewi, T.; Yusi, S. Sea Salt Deposition Effect on output and Efficiency Losses of the Photovoltaic System. A case study in Palembang, Indonesia. J. Phys. Conf. Ser. 2019, 1167, 012028. [Google Scholar] [CrossRef]
- Acharya, M.; Devraj, S. Floating Solar Photovoltaic (FSPV): A Third Pillar to Solar PV Sector? In TERI Discussion Paper ETC India Project; The Energy and Resources Institute: New Delhi, India, 2019; p. 68. [Google Scholar]
- Campana, P.E.; Wästhage, L.; Nookuea, W.; Tan, Y.; Yan, J. Optimization and assessment of floating and floating-tracking PV systems integrated in on- and off-grid hybrid energy systems. Sol. Energy 2019, 177, 782–795. [Google Scholar] [CrossRef]
- Malvoni, M.; Leggieri, A.; Maggiotto, G.; Congedo, P.M.; De Giorgi, M.G. Long term performance, losses and efficiency analysis of a 960 kWP photovoltaic system in the Mediterranean climate. Energy Convers. Manag. 2017, 145, 169–181. [Google Scholar] [CrossRef]
- Aoun, N.; Bouchouicha, K. Estimating daily global solar radiation by day of the year in Algeria. Eur. Phys. J. Plus. 2017, 132, 1–12. [Google Scholar] [CrossRef]
- Aoun, N.; Bouchouicha, K.; Bailek, N. Seasonal performance comparison of four electrical models of mono crystalline PV module operating in a harsh environment. IEEE J. Photovolt. 2019, 9, 1057–1063. [Google Scholar] [CrossRef]
- Do Sacramento, E.M.; Carvalho, P.C.M.; De Araújo, J.C.; Riffel, D.B.; Da Cruz Corrêa, R.M.; Neto, J.S.P. Scenarios for use of floating photovoltaic plants in Brazilian reservoirs. IET Renew. Power Gener. 2015, 9, 1019–1024. [Google Scholar] [CrossRef]
- Tahri, F.; Tahri, A.; Oozeki, T. Performance evaluation of grid connected photovoltaic systems based on two photovoltaic module technologies under tropical climate conditions. Energy Convers. Manag. 2018, 165, 244–252. [Google Scholar] [CrossRef]
- Malvoni, M.; Kumar, N.M.; Chopra, S.S.; Hatziargyriou, N. Performance and degradation assessment of large-scale gridconnected solar photovoltaic power plant in tropical semi-arid environment of India. Sol. Energy 2020, 203, 101–113. [Google Scholar] [CrossRef]
- Lare, Y.; Sagna, K.; Razak Ali-Tagba, A. Optimal Design and Performance Analysis of a Grid Connected Photovoltaic System in Togo. Am. J. Energy Res. 2021, 9, 56–74. [Google Scholar] [CrossRef]
- IEC 61724; Photovoltaic System Performance Monitoring—Guidelines for Measurement, Data Exchange and Analysis. 1st ed. International Electrotechnical Commission: London, UK, 1998.
- Kumary, S.V.S.; Oo, V.A.A.M.T.; Shafiullah, G.M.; Stojcevski, A. Modelling and Power Quality Analysis of a Grid-Connected Solar PV System. In Proceedings of the Australasian Universities Power Engineering Conference (AUPEC), Perth, Australia, 28 September–1 October 2014. [Google Scholar]
- Piana, V.; Kahl, A.; Saviozzi, C.; Schumann, R. Floating PV in mountain artificial lakes: A checklist for site assessment. Renew. Energy Environ. Sustain. 2021, 6, 4. [Google Scholar] [CrossRef]
- Nagananthini, R.; Nagavinothini, R. Investigation on floating photovoltaic covering system in rural Indian reservoir to minimize evaporation loss. Int. J. Sustain. Energy 2021, 40, 781–805. [Google Scholar] [CrossRef]
- Sahu, A.; Yadav, N.; Sudhakar, K. Floating photovoltaic power plant: A review. Renew. Sustain. Energy Rev. 2016, 66, 815–824. [Google Scholar] [CrossRef]
- Trapani, K.; Millar, D.L. Proposing Offshore Photovoltaic (PV) Technology to the Energy mix of the Maltese Islands. Energy Convers. Manag. 2013, 67, 18–26. [Google Scholar] [CrossRef]
- Liu, H.; Krishna, V.; Lun Leung, J.; Reindl, T.; Zhao, L. Field experience and performance analysis of floating PV technologies in the tropics. Prog. Photovolt. Res. Appl. 2018, 26, 957–967. [Google Scholar] [CrossRef]
- Nguyen, N.-H.; Le, B.-C.; Bui, T.-T. Benefit Analysis of Grid-Connected Floating Photovoltaic System on the Hydropower Reservoir. Appl. Sci. 2023, 13, 2948. [Google Scholar] [CrossRef]
- Perez, M.; Perez, R.; Ferguson, C.R.; Schlemmer, J. Deploying effectively dispatchable PV on reservoirs: Comparing floating PV to other renewable technologies. Sol. Energy 2018, 174, 837–847. [Google Scholar] [CrossRef]
- Cazzaniga, R.; Rosa-Clot, M.; Rosa-Clot, P.; Tina, G.M. Integration of PV floating with hydroelectric power plants. Heliyon 2019, 5, e01918. [Google Scholar] [CrossRef]
- Pimentel Da Silva, G.D.; Branco, D.A.C. Is floating photovoltaic better than conventional photovoltaic? Assessing environmental impacts. Impact Assess. Proj. Apprais. 2018, 36, 390–400. [Google Scholar] [CrossRef]
- Junianto, B.; Dewi, T.; Sitompul, C.R. Development and Feasibility Analysis of Floating Solar Panel Application in Palembang, South Sumatra Development and Feasibility Analysis of Floating Solar Panel Application in Palembang, South Sumatra. J. Phys. Conf. Ser. 2020, 1500, 012016. [Google Scholar] [CrossRef]
- Ferrer-Gisbert, C.; Ferrán-Gozálvez, J.J.; Redón-Santafé, M.; Ferrer-Gisbert, P.; Sánchez-Romero, F.J.; Torregrosa-Soler, J.B. A new photovoltaic floating cover system for water reservoirs. Renew. Energy 2013, 60, 63–70. [Google Scholar] [CrossRef]
- Spencer, R.S.; Macknick, J.; Aznar, A.; Warren, A.; Reese, M.O. Floating Photovoltaic Systems: Assessing the Technical Potential of Photovoltaic Systems on Man-Made Water Bodies in the Continental United States. Environ. Sci. Technol. 2019, 53, 1680–1689. [Google Scholar] [CrossRef]
- Yadav, N.; Gupta, M.; Sudhakar, K. Energy assessment of floating photovoltaic system. In Proceedings of the 2016 International Conference on Electrical Power and Energy Systems (ICEPES), Bhopal, India, 14–16 December 2016; pp. 264–269. [Google Scholar]
- Sasmanto, A.A.; Dewi, T. Eligibility Study on Floating Solar Panel Installation over Brackish Water in Sungsang, South Sumatra. EMIT Int. J. Eng. Technol. 2020, 8, 240–255. [Google Scholar] [CrossRef]
- Dörenkämper, M.; Wahed, A.; Kumar, A.; de Jong, M.; Kroon, J.; Reindl, T. The cooling effect of floating PV in two different climate zones: A comparison of field test data from The Netherlands and Singapore. Sol. Energy 2021, 214, 239–247. [Google Scholar] [CrossRef]
- Azmi, M.S.M.; Othman, M.Y.H.; Ruslan, M.H.H.; Sopian, K.; Majid, Z.A.A. Study on electrical power output of floating photovoltaic and conventional photovoltaic. AIP Conf. Proc. 2013, 1571, 95–101. [Google Scholar]
- Lake, J.; Paš, S.; Akšamovíc, A.; Avdakovíc, S. Floating Solar Plants on Artificial Accumulations—Example of Jablanica Lake. In Proceedings of the 2018 IEEE International Energy Conference (ENERGYCON), Limassol, Cyprus, 3–7 June 2018. [Google Scholar]
- Ravichandran, N.; Ravichandran, N.; Panneerselvam, B. Performance analysis of a floating photovoltaic covering system in an Indian reservoir. Clean Energy 2021, 5, 208–228. [Google Scholar] [CrossRef]
- Silvério, N.M.; Barros, R.M.; Tiago Filho, G.L.; Redón-Santafé, M.; Santos, I.F.S.d.; Valério, V.E.d.M. Use of floating PV plants for coordinated operation with hydropower plants: Case study of the hydroelectric plants of the São Francisco River basin. Energy Convers. Manag. 2018, 171, 339–349. [Google Scholar] [CrossRef]
- Rosa-Clot, M.; Tina, G.M.; Nizetic, S. Floating photovoltaic plants and wastewater basins: An Australian project. Energy Procedia 2017, 134, 664–674. [Google Scholar] [CrossRef]
- Farfan, J.; Breyer, C. Combining Floating Solar Photovoltaic Power Plants and Hydropower Reservoirs: Virtual Battery of Power Great Global Potential Combining Floating Solar Photovoltaic Plants and the 15th International Symposium on District Heatin. Energy Procedia 2018, 155, 403–411. [Google Scholar] [CrossRef]
- Tina, G.; Cazzaniga, R.; Rosa-Clot, M.; Rosa-Clot, P. Geographic and technical floating photovoltaic potential. Therm. Sci. 2018, 22, 831–841. [Google Scholar] [CrossRef]
- Muhammad, A.; Muhammad, U.; Abid, Z. Potential of floating photovoltaic technology in Pakistan. Sustain. Energy Technol. Assess. 2021, 43, 100976. [Google Scholar] [CrossRef]
- Kougias, I.; Bódis, K.; Jäger-Waldau, A.; Monforti-Ferrario, F.; Szabõ, S. Exploiting existing dams for solar PV system installations. Prog. Photovolt. Res. Appl. 2016, 24, 229–239. [Google Scholar] [CrossRef]
- Cox, M. The State of Floating Solar: Bigger Projects, Climbing Capacity, GreenTech Media, New Markets; Wood Mackenzie: London, UK, 2019. [Google Scholar]
- Solar, W.; Generation, P. Volts from the Blue—Is Combined Floating Solar and Hydro the Energy Solution for ASEAN? Land-Scarce ASEAN Countries Are Perfectly Positioned to Benefit from Cost-Competitive Waterborne Solar Power Generation; IEEFA: Lakewood, OH, USA, 2020; pp. 1–24. [Google Scholar]
- Stiubiener, U.; Carneiro da Silva, T.; Trigoso, F.B.M.; Benedito, R.d.S.; Teixeira, J.C. PV power generation on hydro dam’s reservoirs in Brazil: A way to improve operational flexibility. Renew. Energy 2020, 150, 765–776. [Google Scholar] [CrossRef]
- Choi, Y.-K.; Lee, N.-H.; Lee, A.-K.; Kim, K.-J. A study on major design elements of tracking-type floating photovoltaic systems. Int. J. Smart Grid Clean Energy 2014, 3, 70–74. [Google Scholar] [CrossRef]
- Kim, S.-H.; Lee, Y.-G.; Seo, S.-H.; Joo, H.-J.; Yoon, S.-J. Structural Design and Installation of Tracking-type Floating PV Generation System. Compos. Res. 2014, 27, 59–65. [Google Scholar] [CrossRef]
- Lee, A.-K.; Shin, G.-W.; Hong, S.-T.; Choi, Y.-K. A study on development of ICT convergence technology for tracking-type floating photovoltaic systems. Int. J. Smart Grid Clean Energy 2013, 3, 80–87. [Google Scholar] [CrossRef]
- Bhardwaj, B.; Bhardwaj, N. Hydrokinetic-Solar Hybrid Floating Renewable Energy Generation System to Explore Hydro and Solar Power Potential Worldwide. In Proceedings of the 2nd International Conference on Large-Scale Grid Integration of Renewable Energy in India, New Delhi, India, 4–6 September 2019; pp. 4–8. [Google Scholar]
- World Bank Group; ESMAP; SERIS. Where Sun Meets Water (Vol.1): Floating Solar Handbook for Practitioners; World Bank Group; Energy Sector Management Assistance Program (ESMAP); Solar Energy Research Institute of Singapore (SERIS): Washington, DC, USA, 2019. [Google Scholar]
- Kumar, M.; Kumar, A. Experimental validation of performance and degradation study of canal-top photovoltaic system. Appl. Energy 2019, 243, 102–118. [Google Scholar] [CrossRef]
- Abdelal, Q.; Floating, P.V. An assessment of water quality and evaporation reduction in semi-arid regions. Int. J. Low-Carbon Technol. 2021, 16, 732–739. [Google Scholar] [CrossRef]
- Taye, B.Z.; Nebey, A.H.; Workineh, T.G. Design of floating solar PV system for typical household on Debre Mariam Island. Cogent Eng. 2020, 7, 1829275. [Google Scholar] [CrossRef]
- Durkovíc, V.; Durišíc, Ž. Analysis of the potential for use of floating PV power plant on the skadar lake for electricity supply of aluminium plant in Montenegro. Energies 2017, 10, 1505. [Google Scholar] [CrossRef]
- Sukarso, A.P.; Kim, K.N. Cooling effect on the floating solar PV: Performance and economic analysis on the case of west Java province in Indonesia. Energies 2020, 13, 2126. [Google Scholar] [CrossRef]
- Pringle, A.M.; Handler, R.M.; Pearce, J.M. Aquavoltaics: Synergies for dual use of water area for solar photovoltaic electricity generation and aquaculture. Renew. Sustain. Energy Rev. 2017, 80, 572–584. [Google Scholar] [CrossRef]
- Cazzaniga, R.; Cicu, M.; Rosa-Clot, M.; Rosa-Clot, P.; Tina, G.M.; Ventura, C. Floating photovoltaic plants: Performance analysis and design solutions. Renew. Sustain. Energy Rev. 2018, 81, 1730–1741. [Google Scholar] [CrossRef]
- Haas, J.; Khalighi, J.; Fuente, A.D.; Gerbersdorf, S.U.; Nowak, W.; Chen, P. Floating photovoltaic plants: Ecological impacts versus hydropower operation flexibility. Energy Convers. Manag. 2020, 206, 112414. [Google Scholar] [CrossRef]
- Vreeburg, J. Potential impact of fl oating solar panels on water quality in reservoirs; pathogens and leaching. Water Pract. Technol. 2020, 15, 807–811. [Google Scholar]
- Chico Hermanu, B.A.; Santoso, B.; Suyitno, W.; Rian, F.X. Design of 1 MWp floating solar photovoltaic (FSPV) power plant in Indonesia. AIP Conf. Proc. 2019, 2097, 030013. [Google Scholar]
- Redón Santafé, M.; Torregrosa Soler, J.B.; Sánchez Romero, F.J.; Ferrer Gisbert, P.S.; Ferrán Gozálvez, J.J.; Ferrer Gisbert, C.M. Theoretical and experimental analysis of a floating photovoltaic cover for water irrigation reservoirs. Energy 2014, 67, 246–255. [Google Scholar] [CrossRef]
- Sharma, G.S.; Mahela, O.P.; Hussien, M.G.; Khan, B.; Padmanaban, S.; Shafik, M.B.; Elbarbary, Z.M.S. Performance Evaluation of a MW-Size Grid-Connected Solar Photovoltaic Plant Considering the Impact of Tilt Angle. Sustainability 2022, 14, 1444. [Google Scholar] [CrossRef]
- Zubair, M.; Bilal Awan, A.; Ghuffar, S.; Butt, A.D.; Farhan, M. Analysis and Selection Criteria of Lakes and Dams of Pakistan for Floating Photovoltaic Capabilities. J. Sol. Energy Eng. 2020, 142, 1–11. [Google Scholar] [CrossRef]
- Razykov, T.M.; Ferekides, C.S.; Morel, D.; Stefanakos, E.; Ullal, H.S.; Upadhyaya, H.M. Solar photovoltaic electricity: Current status and future prospects. Sol. Energy 2011, 85, 1580–1608. [Google Scholar] [CrossRef]
- Green, M.A.; Emery, K.; Hishikawa, Y.; Warta, W.; Dunlop, E.D. Solar cell efficiency tables (version 39). Prog. Photovolt. Res. Appl. 2012, 20, 12–20. [Google Scholar] [CrossRef]
- Masters, G. The solar resource. In Renewable and Efficient Electric Power Systems, 1st ed.; John Wiley & Sons: Hoboken, NJ, USA, 2004. [Google Scholar]
- Skoplaki, E.; Palyvos, J.A. On the temperature dependence of photovoltaic module electrical performance: A review of efficiency/power correlations. Sol. Energy 2009, 83, 614–624. [Google Scholar] [CrossRef]
- Kalogirou, S.A.A.; Tripanagnostopoulos, Y. Hybrid PV/T solar systems for domestic hot water and electricity production. Energy Convers. Manag. 2006, 47, 3368–3382. [Google Scholar] [CrossRef]
- Zsiborács, H.; Pályi, B.; Pintér, G.; Popp, J.; Balogh, P.; Gabnai, Z.; Pető, K.; Farkas, I.; Baranyai, N.H.; Bai, A. Technical-economic study of cooled crystalline solar modules. Sol. Energy 2016, 140, 227–235. [Google Scholar] [CrossRef]
- Jordan, D.C.; Kurtz, S.R. Photovoltaic Degradation Rates—An Analytical Review. Prog. Photovoltaic. Res. Appl. 2013, 21, 12–29. [Google Scholar] [CrossRef]
- Sharma, R.; Gidwani, L. Grid connected solar PV system design and calculation by using PV*SOL premium simulation tool for campus hostels of RTU Kota. In Proceedings of the 2017 International Conference on Circuit, Power and Computing Technologies (ICCPCT), Kollam, India, 20–21 April 2017; pp. 1–4. [Google Scholar] [CrossRef]
- Ahmed, O.A.; Habeeb, W.H.; Mahmood, D.Y.; Jalal, K.A.; Sayed, H.K. Design and Performance Analysis of 250 kW Grid-Connected Photovoltaic System in Iraqi Environment Using PVsyst Software. Indones. J. Electr. Eng. Inform. 2019, 7, 415–421. [Google Scholar]
- Chandel, S.S.; Sharma, V. Performance analysis of a 190 kWp grid interactive solar photovoltaic power plant in India. Energy 2013, 55, 476–485. [Google Scholar]
- Kandasamy, C.P.; Prabu, P.; Niruba, K. Solar potential assessment using PVSYST software. In Proceedings of the 2013 International Conference on Green Computing, Communication and Conservation of Energy (ICGCE), Chennai, India, 12–14 December 2013; pp. 667–672. [Google Scholar]
- Labed, S.; Lorenzo, E. The impact of solar radiation variability and data Discrepancies on the design of PV systems. Renew. Energy 2004, 29, 1007–1022. [Google Scholar] [CrossRef]
- Trapani, K.; Millar, D.L. The thin flm flexible floating PV (T3F-PV) array: The concept and development of the prototype. Renew Energy 2014, 71, 43–50. [Google Scholar] [CrossRef]
- Antonio Luque, S.H. Handbook of Photovoltaic Science and Engineering; John Wiley & Sons: Hoboken, NJ, USA, 2003. [Google Scholar]
- Zsiborács, H.; Baranyai, N.H.; Vincze, A.; Pintér, G. An Economic Analysis of the Shading Effects of Transmission Lines on Photovoltaic Power Plant Investment Decisions: A Case Study. Sensors 2021, 21, 4973. [Google Scholar] [CrossRef] [PubMed]
- The German Energy Society. Planning and Installing Photovoltaic System—A Guide for Installers, Architets and Engineers, 2nd ed.; Routledge: London, UK, 2008. [Google Scholar]
- Teixeira, L.E.; Caux, J.; Beluco, A.; Bertoldo, I.; Louzada, J.A.S.; Eifler, R.C. Feasibility study of a hydro PV hybrid system operating at a dam for water supply in southern Brazil. J. Power Energy Eng. 2015, 3, 70. [Google Scholar] [CrossRef]
- Solomin, E.; Sirotkin, E.; Cuce, E.; Selvanathan, S.P.; Kumarasamy, S. Hybrid Floating Solar Plant Designs: A Review. Energies 2021, 14, 2751. [Google Scholar] [CrossRef]
- Karpouzoglou, T.; Vlaswinkel, B.; Van Der Molen, J. Effects of large-scale floating (solar photovoltaic) platforms on hydrodynamics and primary production in a coastal sea from a water column model. Ocean Sci. 2020, 16, 195–208. [Google Scholar] [CrossRef]
- Nazir, C.P. Coastal power plant: A hybrid solar-hydro renewable energy technology. Clean Energy 2018, 2, 102–111. [Google Scholar] [CrossRef]
- Mayville, P.; Vijay, N.; Pearce, J.M. Distributed manufacturing of after market flexible floating photovoltaic modules. Sustain. Energy Technol. Assess. 2020, 42, 100830. [Google Scholar] [CrossRef]
- Sahu, A.K.; Sudhakar, K. Effect of UV exposure on bimodal HDPE floats for floating solar application. J. Mater. Res. Technol. 2019, 8, 147–156. [Google Scholar] [CrossRef]
Disclaimer/Publisher’s Note: The statements, opinions and data contained in all publications are solely those of the individual author(s) and contributor(s) and not of MDPI and/or the editor(s). MDPI and/or the editor(s) disclaim responsibility for any injury to people or property resulting from any ideas, methods, instructions or products referred to in the content. |
© 2023 by the authors. Licensee MDPI, Basel, Switzerland. This article is an open access article distributed under the terms and conditions of the Creative Commons Attribution (CC BY) license (https://creativecommons.org/licenses/by/4.0/).