Article

Process Optimization and Biomethane Recovery from Anaerobic Digestion of Agro-Industry Wastes

by
Harjinder Kaur
1,† and
Raghava R. Kommalapati
1,2,*
1
Center for Energy & Environmental Sustainability, Prairie View A&M University, Prairie View, TX 77446, USA
2
Department of Civil & Environmental Engineering, Prairie View A&M University, Prairie View, TX 77446, USA
*
Author to whom correspondence should be addressed.
Current Address: Office of the Agriculture Commissioner, San Joaquin County, Stockton, CA 95206, USA.
Energies 2023, 16(18), 6484; https://doi.org/10.3390/en16186484
Submission received: 30 June 2023 / Revised: 24 August 2023 / Accepted: 4 September 2023 / Published: 8 September 2023
(This article belongs to the Special Issue Energy and Environmental Sustainability 2023)

Abstract

:
Among the sustainable initiatives for renewable energy technologies, anaerobic digestion (AD) is a potential contender to replace fossil fuels. The anaerobic co-digestions of goat manure (GM) with sorghum (SG), cotton gin trash (CGT), and food waste (FW) having different mixing ratios, volumes, temperatures, and additives were optimized in single and two-stage bioreactors. The biochemical methane potential assays (having different mixing ratios of double and triple substrates) were run in 250 mL serum bottles in triplicates. The best-yielding ratio was up-scaled to fabricated 2 L bioreactors. The biodegradability, biomethane recovery, and process efficacy are discussed. The co-digestion of GM with SG in a 70:30 ratio yielded the highest biomethane of 239.3 ± 15.6 mL/gvs, and it was further up-scaled to a two-stage temperature-phased process supplemented with an anaerobic medium and fly ash (FA) in fabricated 2 L bioreactors. This system yielded the highest biomethane of 266.0 mL/gvs, having an anaerobic biodegradability of 67.3% in 70:30 GM:SG co-digestion supplemented with an anaerobic medium. The BMP of the FA-amended treatment may be lower because of its high Ca concentration of 205.74 ± 3.6. The liquid fraction of the effluents can be applied as N and P fertigation. The Ca concentration was found to be 24.3, 25.1, and 6.3 g/kg in GM and GM:SG (TS) and SG solid fractions, respectively, whereas K was found to be 26.6, 10.8, and 7.4 g/kg. The carbon to nitrogen ratio of solid fraction varied between 2.0 and 24.8 for return to the soils to enhance its quality. This study involving feedstock acquisition, characterization, and their anaerobic digestion optimization provides comprehensive information and may assist small farmers operating on-farm anaerobic digesters.

1. Introduction

The CO2 originating from the burning of fossil fuels is one of the leading greenhouse gas (GHG) contributors to the atmosphere, leading to an increase of 51% in 2022 over its preindustrial levels [1].
Other than CO2, another potent GHG resulting from anthropogenic activities being contributed at elevated levels is methane (CH4). Having a way higher global warming potential (GWP) is a cause of concern as well. The environmental origins of CH4 are mainly agriculture, uncontrolled decomposition of animal manures in lagoons, ruminant gestation, food waste in landfills, paddy fields, and leakage from natural gas plants, etc. [2]. Apart from releasing the toxic gases contributing to global warming, accidental release (overflowing in flooded conditions) of manures pollutes freshwater sources such as rivers and lakes, leading to eutrophication. There are estimates of an annual contribution of CO2 equivalent to 42 coal-fired power plants from food loss and waste in the US [3]. The organic waste-associated sites, especially landfills contributing CH4 via uncontrolled decomposition, have a high potential for mitigation and contribute to the global renewable energy reserves utilizing fermentation technologies [2,4].
Anaerobic digestion (AD) is a popular technique known for treating organic wastes and generating renewable sources of energy through biohythane (typically comprising 10–15% H2, 50–55% CH4 and 30–40% CO2) [5] for fossil fuel replacement.
The AD is a biochemical process consisting of four distinct phases. The first phase is hydrolysis, in which complex organic matter is broken down into simple organic compounds. The second phase is called acidogenesis, which involves the conversion of simple organic and amino acids to volatile fatty acids, H2, and CO2. The third phase is acetogenesis, in which volatile fatty acids are converted to CH3COOH, and finally, methanogenesis, in which methane (CH4) is produced using the end products of previous stages [6,7]. As a microbial-mediated process, the composition of the resultant gaseous mixture depends upon various factors, including biomass characteristics, the rate at which organic compounds are introduced, soluble metabolic products, single or double-stage AD, pretreatment method of the substrate, additives, and inoculum [5,8]. The biochemical methane potential (BMP) assays where the whole process is carried out in the same reactor or separated into two reactors are termed single and two-stage AD, respectively [9,10,11,12]. Though still at the lab scale, the two-stage AD (TSAD) systems are characterized by higher biomethane production, and a scale-up to industrial-scale plants will be highly beneficial to meet the ever-increasing natural gas demand [12,13]. Lower process temperatures favor higher microbial diversity, whereas the higher temperatures enhance the degree of substrate degradation and biogas production up to 60 °C [14]. Pasteris et al. [13] report higher biomethane production of 434 mL/gvs compared to 308 mL/gvs in a single-stage process. The carbon to nitrogen (C/N) ratio is another important feedstock characteristic affecting process stability and continuity during AD [9]. Swine and cow manures are reported to have C/N ratios between 9.3 and 12.1 and 25, respectively, whereas GM has a C/N of 15.7 lying in between these manures [15,16,17].
According to Rajendran et al. [18], the biomass for AD can be categorized into fast, medium, or slowly degradable depending upon the origin and varies in pH, thus requiring different process parameters to create optimum environmental conditions for acetogenic and methanogenic bacteria. The acetogenic and methanogenic microbial populations thrive at 6.6–7.6 and 7.5–8.5 pH conditions, respectively [19]. In TSAD, where acetogenic and methanogenic phases occur in different reactors, the pH is maintained for each population: 5.3 and 7.5 for the first and second stages, respectively. The major mechanisms for pH adjustment are process control and chemical methods. Process pH control is the main approach in TSAD for acidic feedstocks where the effluents from the second stage are re-circulated to the first stage recirculation [8,11,20]. The process temperature, another important parameter, varied between 14 and 70 and 14 and 55 °C in acidification and methanogenic reactors, respectively, among several reported studies [18].
Animal manures, such as goat manure (GM), and biomasses of agricultural origins, such as cotton (Gossypium hirsutum, G. barbadense) gin trash (CGT), have a high concentration of non-biodegradable lignocellulosic ingredients [17] considered slow-degrading feedstocks, while biofuel crops such as sorghum (Sorghum bicolor) or sweet sorghum anaerobically degrades at a moderate rate [16,18,21]. Sorghum is a C4 bioenergy crop plant with an extensive root system and wide adaptability; the juice from its stalks on fermentation serves as an ethanol source, while bagasse and other non-economical leftovers have been investigated for their BMPs [22,23,24]. Ginning one bale of cotton yields about 37–147 Kg of CGT, a byproduct of the cotton industry. It is mainly composed of clean lint, hulls, stem, grass, seed, motes, and small leave [25] and is abundantly available in cotton-growing regions of the U.S., such as Texas. Food waste (FW) is another ever-increasing waste stream being investigated/incorporated into renewable energy technologies owing to its overgrowing increase in waste streams and challenges in sustainable management [4,26]. Fly ash (FA), which is a byproduct of coal-based electricity plants, has several metal oxides enhancing microbial, especially methanogenic populations, thus enhancing the biomethane yield during AD [27].
The CO2 from raw biogas can be converted to succinic acid [28]. The bio-solids left after the AD process may be of high bio-fertilizer value or medium-chain fatty acids, depending upon the organic wastes and other digester components [28,29]. The separated liquid and solid fractions of effluents are usually processed for chemical precipitation, such as struvite (MgNH4PO4·6H2O) and utilization as compost, respectively [30,31]. The world’s soils have been in carbon debt since 12,000 years of human land use [32]; digestate application has been reported to improve soil properties depending upon its initial properties [33].
Co-digestion of lignocellulosic materials and animal manures has been reported to enhance the BMP outcome [34,35].
According to the United States Energy Independence and Security Act [36], there is a need to reduce GHS emissions by 9% by 2030, with a target of an approximate annual usage of 36 billion gallons of renewable fuels [36]. Finding a sustainable management solution for GM via AD may particularly assist the developing countries in the temperate regions inhabiting significant goat populations to lower fossil fuel usage and minimize GHG emissions [37]. This research aimed to improve the performance of digesters (and make them economically more viable) running at goat CFAOs by incorporating other agro-wastes, i.e., CGT, FW, and SG, having higher theoretical BMP than feedstocks.
The objectives of this study were to investigate the BMP and biodegradability of GM:SG and GM:CGT:FW co-digestions at different mixing ratios (compared with the mono-digestion of each substrate) and volumes in single and two-stage AD processes of conventional microbials. The process was simulated utilizing first-order and modified Gompertz equations. The digestate left after the AD was evaluated for its bio-fertilizer quality and suitability for release to the environment by determining the composition of liquid and solid fractions separately.

2. Materials and Methods

2.1. Substrate and Inoculum
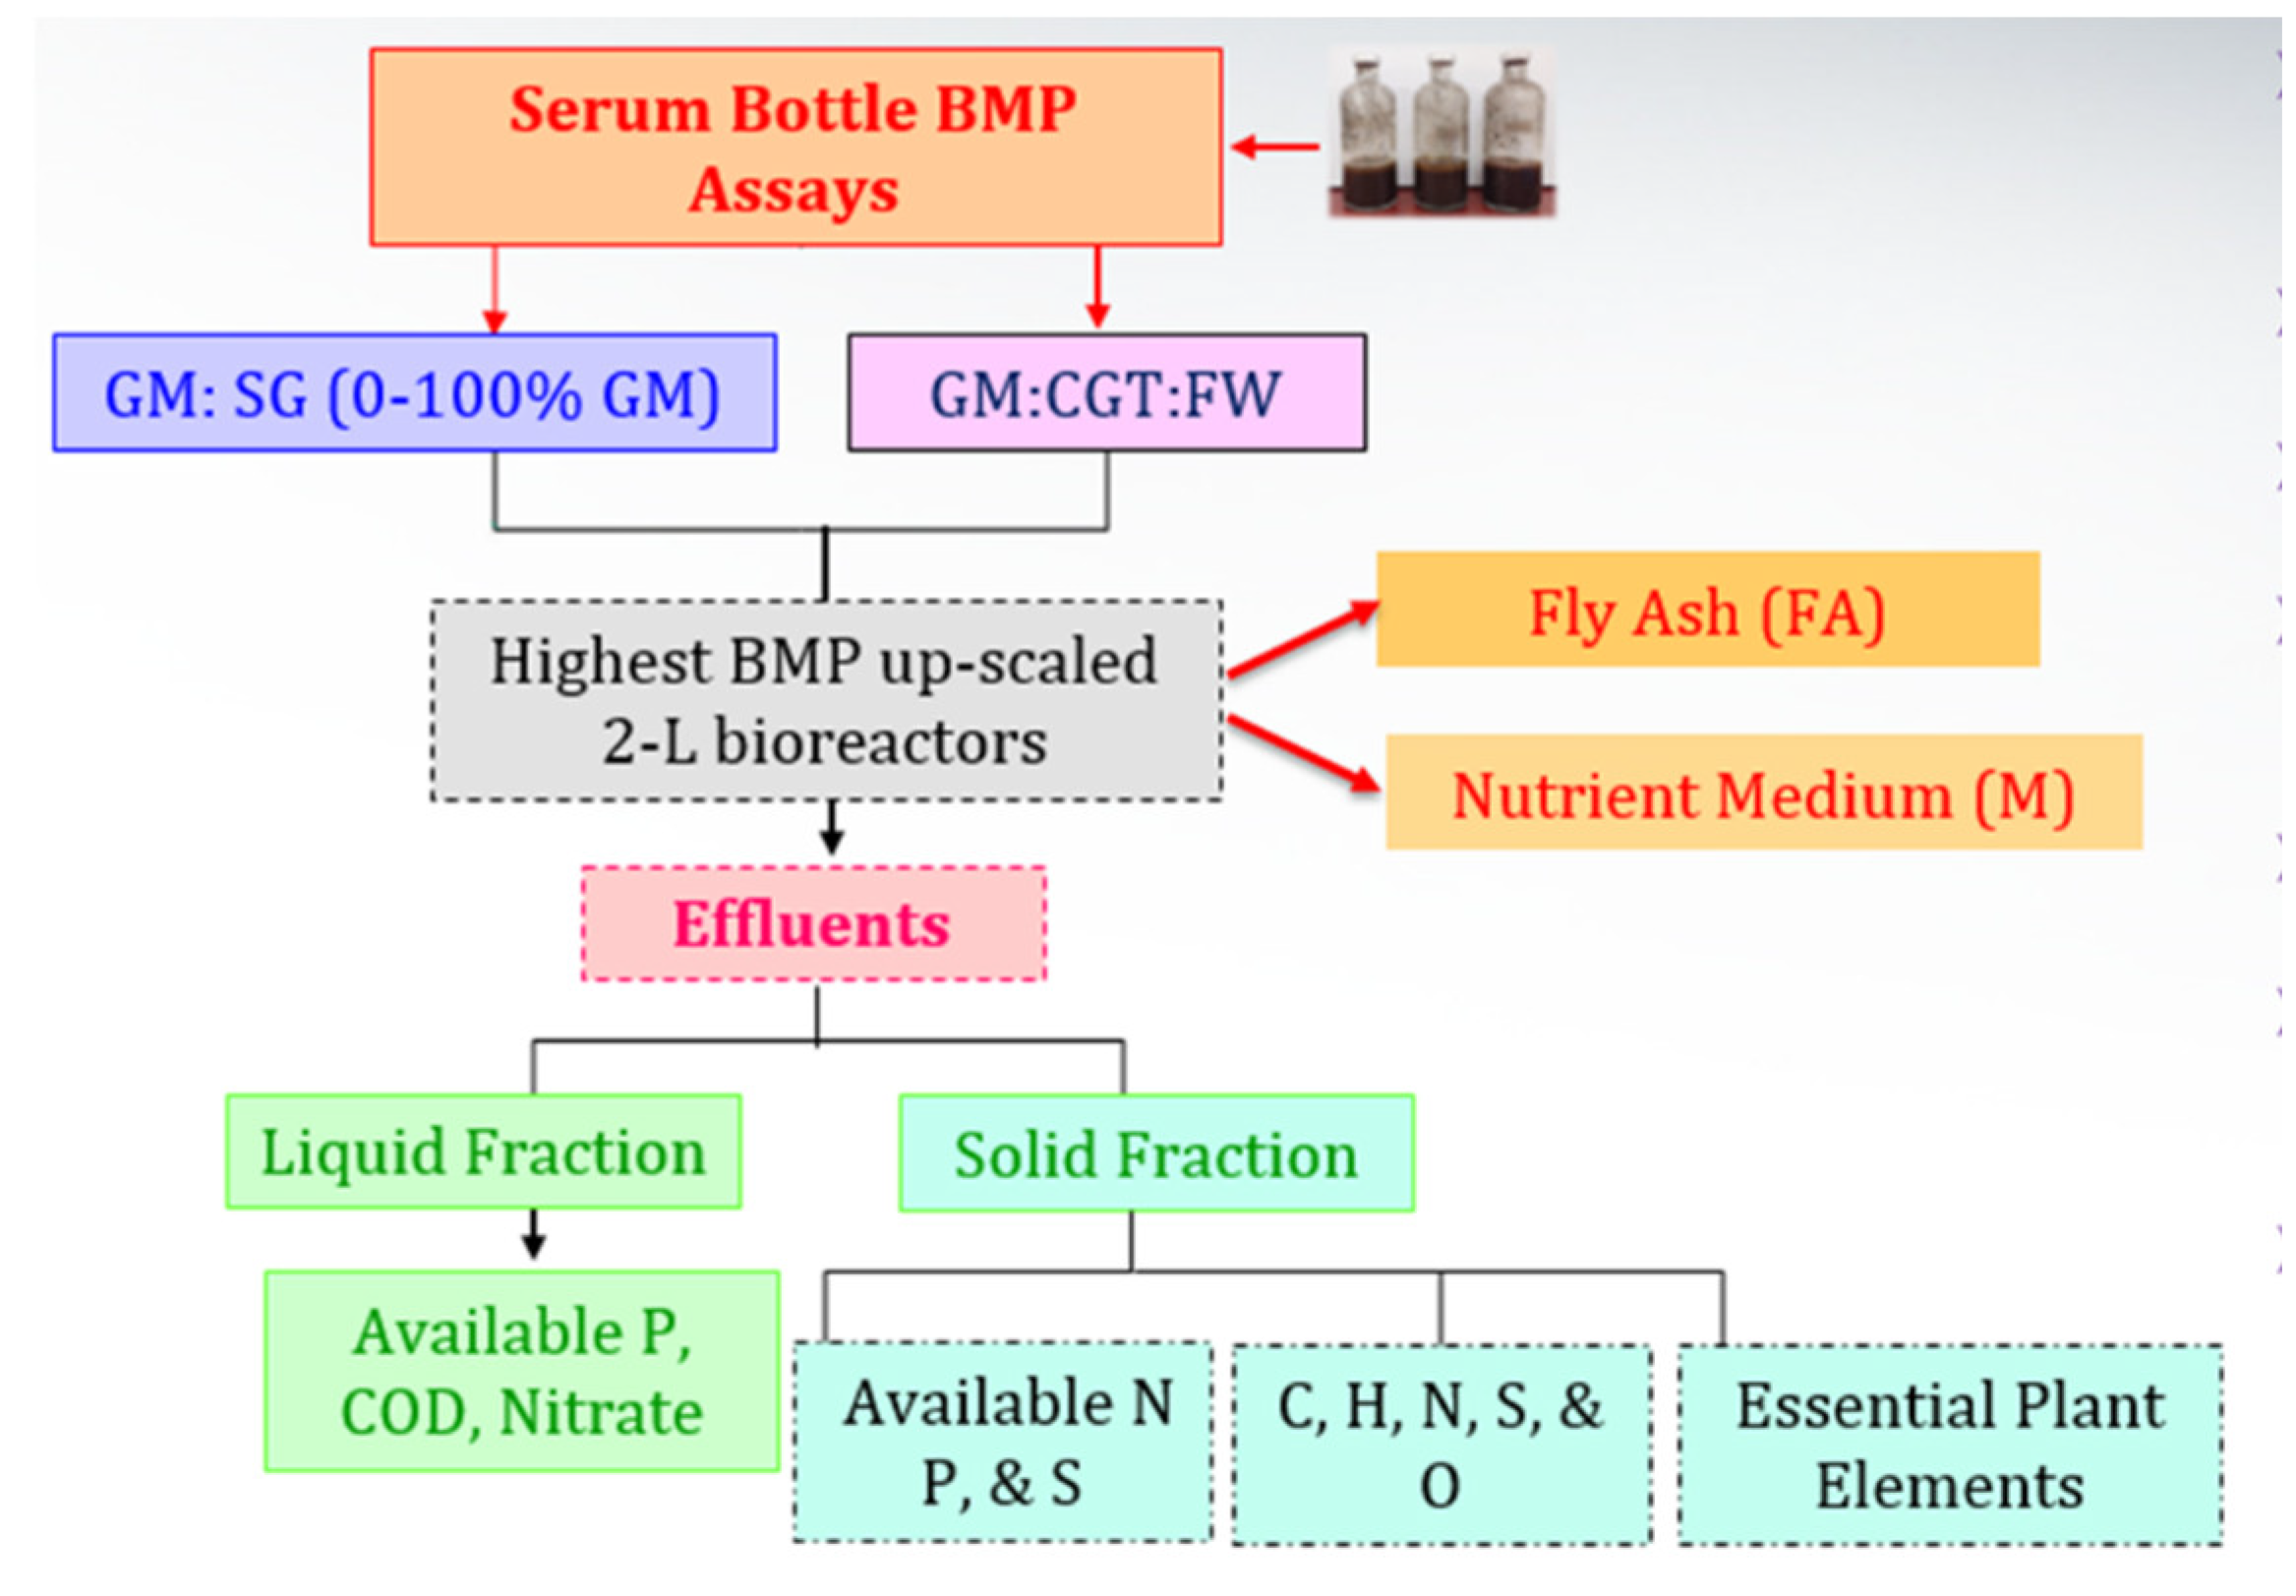
Goat manure was collected from the International Goat Research Center, Prairie View A&M University (PVAMU). To soften more recalcitrant carbon fractions [4], it was thermally treated at 80 °C, passed through a Willy mill, sieved (2 mm), and stored at 4 °C. The CGT was collected from a local cotton gin (5354 Steel Store Rd, Bryan, TX 77807, USA). The FW was collected from a student dining facility at PVAMU. The stalks of SG and leftovers after grain harvest were collected from ongoing research trials of cultivar Onyx at Texas A&M University (College Station, TX, USA). The stalks were dried at 60 °C, passed through a Willy mill, sieved (2 mm), and stored at 4 °C.
The class C fly ash (FA) was collected from the W.A. Parish Plant (Thompsons, TX, USA). The well-mixed samples in triplicates were characterized for volatile solids (VS) by method 2540 [38] using a Lindberg Blue M electric furnace (Fisher Scientific, Pittsburgh, PA, USA). The A Flash 2000 elemental analyzer (Elementar Americas Inc., Ronkonkoma, NY, USA) was utilized to determine the C, H, N, and S contents of feedstocks. The fresh inoculum obtained from the Prairie View municipal wastewater treatment plant (operating at mesophilic temperature) was de-gassed [39,40] for a week and stored at 4 °C.

2.2. BMP Assays

The co-digestions of GM with SG, CGT, and FW were carried on in 250 mL serum bottles (Fisher Scientific, Pittsburgh, PA, USA) for 62 d and further scaled up in 2 L bioreactors (Fisher Scientific, Pittsburgh, PA, USA) (Figure 1).
The serum bottle assays were conducted in triplicates, as described in previous studies [17,40,41,42,43,44], at an organic loading rate (OLR) of 10% total solids (TS; 0–100% GM in GM:SG co-digestions) and an inoculum-to-substrate (IRS) of 2.0 (Table 1). Briefly, the GM:CGT treatment had 68.6 and 18.2 g GM while GM:SG had 60.0 and 26.8 g (80 g TS, having moisture percentages of 6.7 ± 0.1, 12.0 ± 0, and 10.5 ± 0.3 in GM, CGT, and SG, respectively). The blank bioreactors contained all ingredients except the substrate. The working volume of 100 mL in each bioreactor was achieved by adding deionized water (DI-H2O). The NaHCO3 amount added to each GM:SG co-digestion according to SG weight (0.5 g NaHCO3/g of sorghum TS) was adapted from a study by Thomas et al. [45].
To determine the BMP, several combinations for triple digestion were adapted from the best-yielding ratios of GM:CGT (C/N; 19.8) and GM:FW (C/N; 19.2) in previous studies [17,46]. The triple substrate co-digestions 70:10:20, 70:20:10, 60:30:10, 60:20:20, and 50:25:25 further varied the C/N ratios to 19.7, 21.2, 22.8, 23.1, and 21.6. All of the co-digestions had triple feedstocks with mixing ratios of GM:CGT:FW; 70:10:20, 70:20:10, 60:30:10, 60:20:20, and 50:25:25 that did not require any alkalinity adjustments due to the substrate mixture (of three feedstocks) enhanced buffering capacity. The bioreactors were purged with N2 gas (99.9% purity) for five minutes, sealed with straight-plug stoppers, and secured using aluminum crimp seals (Fisher Scientific, Pittsburgh, PA) for biomethane sampling and maintaining the anaerobic conditions, respectively.
The bioreactors were incubated at 36 ± 1 °C, and biomethane was measured via the liquid displacement method using alkaline DI-H2O (pH adjusted to 10.30 with 2 M NaOH). The serum bottles were manually shaken [40] before the daily gas measurements. Experiments were considered complete when the total biomethane production during three consecutive days was less than 1% of the previously accumulated [40].
For two-stage AD, the BMP assays (GM:SG)-TS were conducted in bioreactors fabricated from 2 L Pyrex reagent bottles with a total volume of 800 mL and OLRs of 10% TS, of co-digestions GM:SG (70:30, highest yielding ratio). The bioreactors having sorghum feedstock received 13.4 g sodium bicarbonate (5% TS basis) to adjust alkalinity. The de-gassed inoculum was added to maintain an ISR of 2:1. The amount of anaerobic medium to enhance microbial multiplication was added in the same volume as that of inoculum in all experiments, as described in previous studies [17,46]. The total volume of 800 mL was achieved with DI-H2O. To obtain a concentration of 187.5 mg/L, 150 mg FA was added to the final bioreactor working volume of 800 mL. The bioreactors were purged with nitrogen (99% purity) for 5 min and sealed. The reactors were incubated at 36 °C for 7 days, after which the temperature was raised to 55 °C [11]. The biogas was collected with the plastic fuel shut-off valves of 6 mm diameter, assembled to the side neck of the 2 L flask, with the liquid displacement method. Hydraulic retention time (HRT) for first and second-stage reactors was adapted from the findings of Holl et al. [11], who stated that the HRT varies between 0.12 to 38 and 0.27 to 45 days for the first and second stages, respectively. For the second stage reactor, 140 mL of de-gassed inoculum and anaerobic medium in equal proportions were purged and incubated at 55 °C for two weeks. Between 8 and 9 days, the contents of the first reactor were transferred to it, purged, sealed, and again incubated at 55 °C. The biomethane measurements were recorded daily for 48 days. The procedure was partially adapted from as described by Tena et al. [47], and the duration was decided from the technical digestion time (T8090; time to obtain 80 to 90% of the total BMP of a substrate) of GM:SG co-digestion from serum bottle assays.

2.3. Effluent Evaluation

The effluents were separated into liquid and solid fractions to analyze their suitability as biofertilizers (Figure 1) and other metals for sustainable release in the environment. The solid fraction of the effluents of each treatment was dried under a hood and ground with pestle mortar to obtain uniform-size particles of about 2 mm. The samples were sent to the Cooperative Agricultural Research Center, PVAMU, to analyze major and micronutrients needed for plant growth and development. The analysis was obtained with inductively coupled plasma-optical emission spectroscopy (ICP-OES), ion chromatography, and an elemental analyzer. For the ICP-OES analysis, approximately 0.25 g of a dry plant sample was digested in a mixture of 7 mL of 70% HNO3 and 2 mL of 30% H2O2 in duplicate using Ethos-Up microwave digestion. Post digestion, DI-H2O was added to make up the final volume of 50 mL. Working standards were prepared from 1000 ppm single-element stock solutions of Al, B, Ca, Cr, Cu, Fe, K, Mg, Mn, P, Na, Ni, and Zn at concentrations of 0, 0.5, 1, 5, and 10 ppm in Lu (2.0 ppm) stabilized with 1.0% HNO3. A standard blank containing Lu (2.0 ppm) was also prepared. Individual stock standards of Al, B, Ca, Cr, Cu, Fe, K, Mg, Mn, P, Na, Ni, Zn, and Lu (Internal Standard; 1000 ppm) were ICP grade. Samples were fed (in triplicates from each replicate) to an Agilent 5100 SVDV ICP-OES system with Ar as the carrier gas. The relative contents of plant-available nitrate, phosphate, and sulfate ions in the solid fraction were determined as described by Cataldi et al. [48].

2.4. Theoretical Maximum Methane Yield

From the chemical formula of the GM (C295.8H603.0O351.0N12.6S1.7), the theoretical maximum biomethane yield (TMY; 292.1 mL/gvs) was calculated by using Boyle’s equation [49] below (Equation (1)). This equation is a modified version of the original Buswell–Muller’s [50], incorporating N and S to obtain NH3 and SO2 fractions.
C a H b O c N d S e + a b 4 c 2 + 3 d 4 + e 2 H 2 O a 2 + b 8 c 4 3 d 8 e 4 C H 4 + a 2 b 4 + c 4 + 3 d 8 + e 4 C O 2 + d N H 3 + e H 2 S
T M Y = 22.4 × 1000 × a 2 + b 8 c 4 3 d 8 e 4 12 a + b + 16 c + 14 d + 32 e
where a = 295.0, b = 610.0, c = 352.0, d = 12.6, and e = 1.7.

2.5. Biodegradability

The biodegradability (BD) of a substrate refers to the portion of its volatile content that is transformed into biomethane during AD. It was determined from the cumulative experimental and theoretical biomethane yields (EMY and TMY) employing Equation (3) as described by Li et al. [51]. The BD of each co-digestion was calculated using a cumulative biomethane yield (EMY) from their EMY and TMYs employing Equation (3) as described by Li et al. [51].
B D   % = E M Y c o T M Y 1 × X 1 + + T M Y 2 × X 2 + × 100
EMYco represents EMY of the co-digestion, TMY₁, and TMY2 theoretical BMPs of GM and CGT mono-digestions, while X₁ and X2 represent the volatile solid fractions of substrates in the co-digestions, respectively.

2.6. Modeling Methane Production Kinetics

The AD process or bacterial growth in the bioreactors can be described by fitting the modified Gompertz equation developed by Lay et al. [52,53] and first-order Equations (4) and (5) as described below:
P t = P 0 × e x p e x p R m e P 0 λ t + 1
P(t) = The accumulated methane (mL/gvs) at digestion time t (d)
P0= Biochemical methane potential (mL/gvs) of a substrate
Rm = Maximum daily rate of biomethane production (mL/gvs)
λ = lag phase (days), minimum time to produce biomethane
e = Mathematical constant 2.718
P ( t ) = P o 1 e k d t
where P t is the cumulative methane yield (mL/gvs) at time t (d), P o is the BMP of the substrates (mL/gvs), K is the first-order degradation rate constant, and the methane production rate constant (per d).
The model fit was evaluated by calculating the relative root-mean-square error (rRMSE), as described by Kafle et al. [16], utilizing Equation (6), as described previously [17,46].
r R M S E = 1 m   j = 1 m d j Y j 2 1 2
where m is the number of data pairs, j is jth values, Y is the measured biomethane (mL/gvs), and d is the deviation between measured and predicted biomethane values.

2.7. Data Analysis

The experimental data were processed in Microsoft Excel 2013 (Microsoft, USA). The biomethane volume was converted to dry gas volume at STP by multiplying it with a dry biomethane factor of 0.838, as described by Richards et al. [54]. The blank value was subtracted from treatments to neutralize the inoculum.

3. Result

3.1. Properties of Goat Manure, Cotton Gin Trash, Food Waste, and Sorghum

The major component of FA is Ca (205.7 ± 3.6 mg/g), as also reported by [55]. The optimum C/N ratio for biogas production reportedly varies between 15–25 [52,53]. Some studies reported the optimum value of the C/N ratio for AD to be in the range of 20 to 35 [54,55,56]. The C/N of SG was 38.5 ± 1.8, in agreement with the previous study [13]. The C/N ratios of GM and CGT, SG and FW were 17.1, 36.6, 38.5, and 21.1 (Table 1), respectively, hence in the optimum range to support AD. These data values for other feedstocks (Table 2) confirm that these agro-wastes and inoculum are suitable for AD [8]. However, SG is a high C/N ratio crop and has low alkalinity below the optimum range of 2500–5000 mg CaCO3/L for AD [57], which required alkalinity adjustment with NaHCO3 [8].

3.2. Daily and Cumulative Biomethane Production and Biodegradabilities

The peak daily biomethane values (from the highest yielding feedstock ratios) of 10.3 ± 3.6, 9.8 ± 1.6, and 15.5 ± 2.0 mL/gvs were observed in single-stage GM:SG.
GM:CGT:FW co-digestions were in single-stage serum bottle bioreactors and two-stage GM:SG co-digestion, respectively (Figure 2a,c,e). There was an initial lag phase of about 5 to 10 days before attaining higher biogas yields in all co-digestions. The same substrate mixtures of GM:SG, GM:CGT:FW, and GM:SG-M (TS) yielded 239.6 ± 15.6, 217.6 ± 5.4, and 266.0 ± 0 mL/gvs after 62 (single-stage serum bottles) and 48 (two-stage bioreactor) days, respectively (Table 3 and Figure 2b,d,e). Thomas et al. [45] reported the biomethane potential of SG in the range of 200 ± 5 NmLCH4/gTS and 259 ± 12 NmLCH4/gTS. However, in this study, the FA (100 ppm) amended stage 2 anaerobic process with 70% GM and 30% SG yielded lower biomethane (Figure 2f) than the anaerobic medium adapted from Moody et al. [58]. Lauzurique et al. [59] stated that 25 ppm FA enhanced methane production while 100 ppm inhibited it by 20%. It may be due to the imbalance of trace elements or calcium (Figure 3) by adding FA [60].
Among the serum bottle trials, the highest BMP of 239.3 mL/gvs was observed in 70% GM co-digestion; hence, it was upscaled to two-stage mesophilic–thermophilic anaerobic co-digestion. A higher BMP of 266.0 mL/gvs was observed in a conventional anaerobic medium (M) compared to FA treatment (Table 3). A lower BMP in FA-amended TS bioreactors may be due to high calcium [61], as depicted in Figure 3. There is conflicting information on the applicability of the two-stage AD process in municipal wastewater sludge treatment plants, with the single-stage being more efficient by some researchers while others contradicted it under different experimental conditions [62,63]. Pasteris et al. [13] revealed a higher biomethane production of 434 mL/gvs from sorghum silage in a two-stage than 308 mL/gvs, a single-stage process. The difference in observed and reported values may be due to SG pretreatment. The heat treatment up to 34 °C before refrigeration maintains membrane integrity while at higher temperatures, improves hydrolysis due to the softening of plant cell walls [64,65]. Other than the temperature and anaerobic filters, the higher sample weight may have contributed to the biomethane augmentation in 2 L bioreactors. The T90 of the highest-yielding co-digestion ratios in this study was 42, 44, and 45 days for GM:SG (70:30), GM:CGT:FW (7:1:2) in serum bottles, and two-stage GM:SG co-digestions, respectively.
Zhang et al. [66] reported a biomethane yield of 221.9 mL/gvs from 55 days of GM AD under mesophilic conditions. Kafle and Chen [16] reported a BMP of 159 ± 9.0 mL/gvs and a T80–90 of 31–37 d for GM mono-digestion. The co-digestions of GM with WS, RS, and CS improve the biomethane over GM mono-digestion by improving the C/N ratio [43].
The BD of GM mono-digestions was 58.5 to 60.3%, while the highest value of 67.3% among all co-digestions was observed in 70% GM in a two-stage co-digestion with SG in mesophilic–thermophilic temperature conditions. As stated previously, CGT in the current BMP assays has a high lignin content of 32.7% [17,41,42], which is one of the most recalcitrant components of plant and animal-based agro-wastes and negatively correlated to their BMP [21,51].

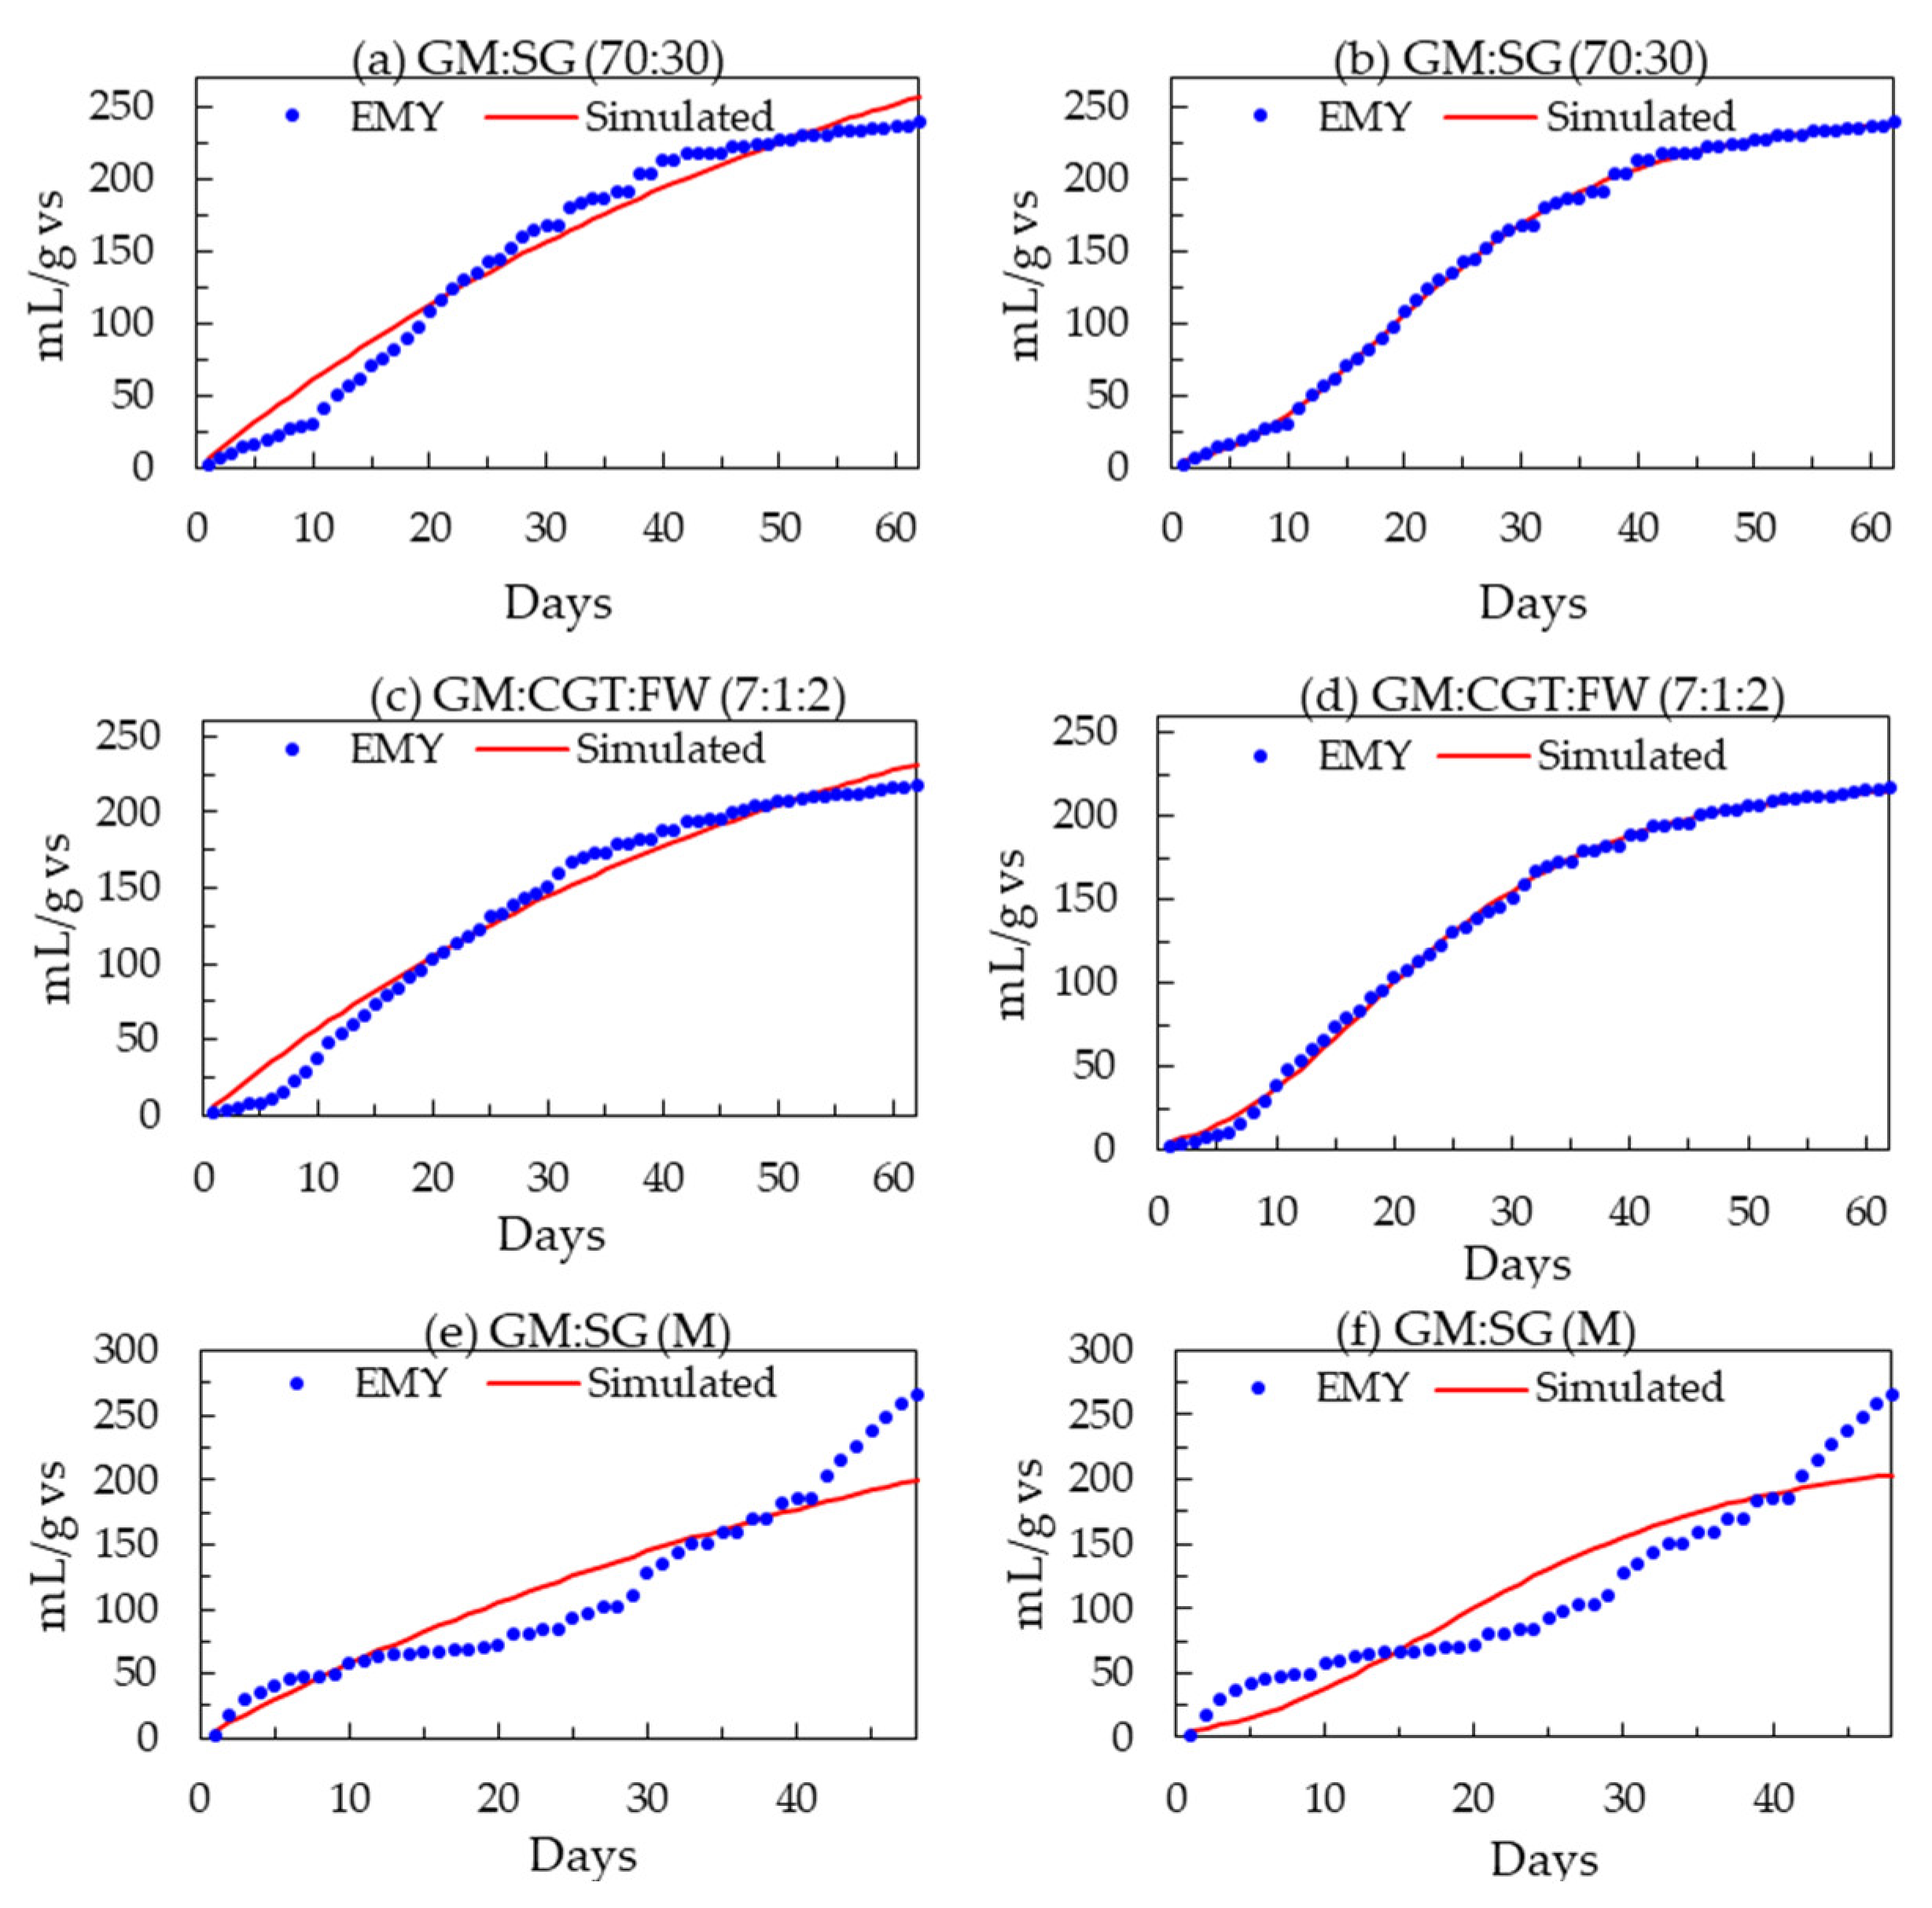
3.3. Modeling Biomethane Production

Mathematical models are crucial in optimizing the processes and assessing the performance of the digester. In this research, the AD process was optimized and evaluated by the non-dynamic white-box model, Boyle’s (Equation (1)), and modified Gompertz equations (Equation (3)). The models were validated by calculating the coefficient of determination (R2) and relative root-mean-square errors (rRMSE). The predicted biomethane values were similar to experimental values in the single-stage AD process, while the variation was a little higher in two-stage AD (Figure 4). The experimental and simulated (first-order and modified Gompertz models) biomethane yields from the highest-yielding treatments from three different experiments are presented in Figure 4. The daily rates of biomethane production (Rm) and lag phases were in the same range as observed during the BMP assays. The high R2 values of 0.992–0.990 (corroborated by less than 1 rRMSE value) prove that both equations fit very well [17,46] with the cumulative data and hence the AD of feedstocks in this research.
The R2 value of 0.943 was observed for the data simulated by the first-order equation against the GM co-digestion with 30% SG.

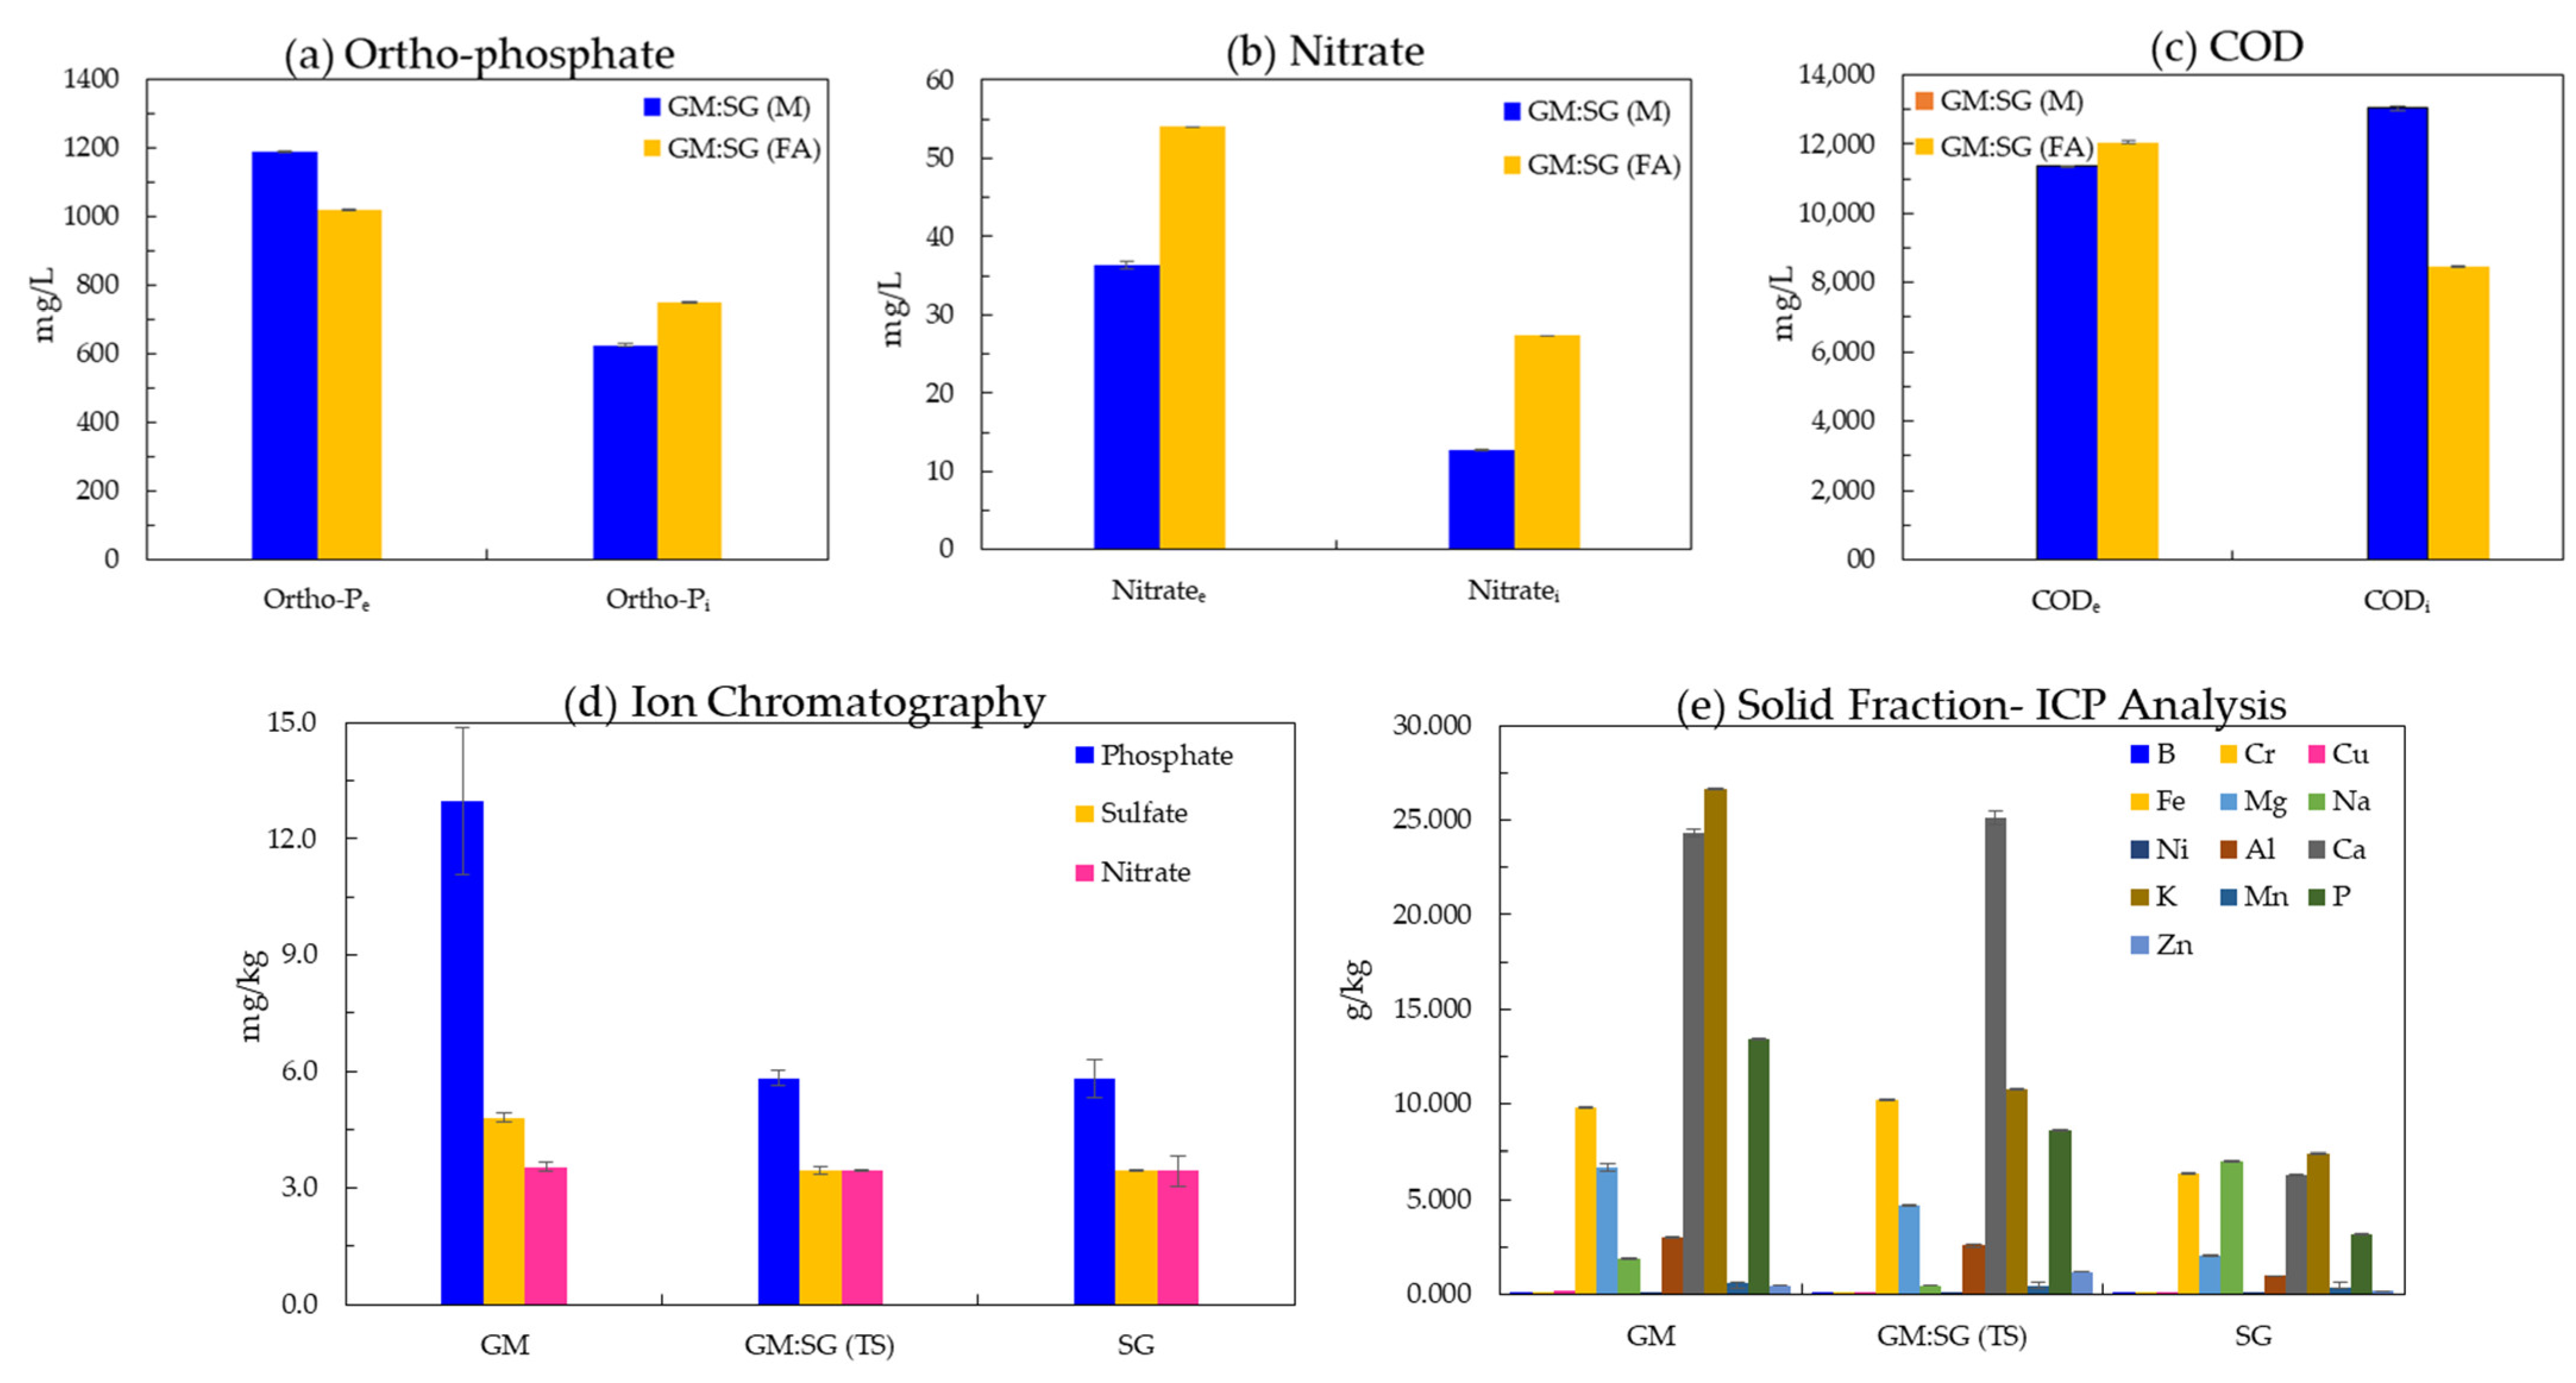
3.4. Effluent Evaluation as Biofertilzers

The nitrate and orthophosphate concentrations in the liquid fraction of digester influents and effluents of the highest-yielding treatment, 70% GM (30% SG in a two-stage co-digestion), reveal that the AD of the feedstocks increased the concentration of soluble (plant-available) forms of these essential plant macronutrients (Figure 5a,b). A higher nitrate concentration of 54.0 ± 0 mg/L was observed in FA treatment, whereas orthophosphate was higher (1190.0 ± 2.8) in the liquid fraction of anaerobic medium-supplemented effluents. The COD removal was higher in effluents left by the FA (1136.5 ± 21.9 mg/L)-treated GM:SG (TS) co-digestion during the AD process than M (1205.0 ± 63.9 mg/L).
The liquid, once separated, may also be processed to precipitate excessive nitrogen and phosphorus in the form of struvite precipitation [30], which can be used as a fertilizer. Zhang et al. [66] reported that 99–99.8% phosphate is removed at 7.9 mM of added Mg. Struvite precipitated with an additional supply of 50 mL (2 M) MgCl2 per L of GM:SG (M) liquid fraction having unknown initial Mg and at 8.6 pH in this study.
From the ICP-OES-derived data values, the dominant elements in the solid fraction were Ca and K. The Ca concentration was found to be 24.3, 25.1, and 6.3 g/kg in GM, GM:SG (TS), and SG solid fractions, respectively, whereas K was found to be 26.6, 10.8, and 7.4 g/kg (Figure 5e). Heavy metals such as B, Cr, Cu, Ni, and Mn and metalloid B were detected in negligible amounts (Figure 2e). These data signify that a solid fraction of soil release can be safely released without heavy metal toxicity concerns [67].
The availability of nutrients depends upon the pH after soil application. It may not be impacted even with lower soluble forms of nutrients in effluents [29]. In acidic solutions, orthophosphates form complexes with Fe and Al ions, while under alkaline conditions, the formation of calcium and magnesium phosphates plays a major role in reducing water-soluble forms in digestates.
The observed C/N ratios (Figure 6) of anaerobic digestates varied between 2 and 24.8, similar to previous reports [68]. Human land use has resulted in the depletion of world soils, including carbon loss [32]; returning a solid fraction of the digestate to the soil is a winning strategy.
The solid fraction application to soils improves aggregate stability, long-lasting increase in the organic pool, microbial carbon use efficacy, and increase in the soluble C and N forms in the fine-textured soils. However, the application of solid fractions to coarse-textured soils leads to the loss of carbon [36].

4. Conclusions

The process performance was optimized and evaluated utilizing suitable models. The highest experimental biomethane yield in GM:SG (70:30) in a two-stage process indicates better process conditions. Anaerobic medium-supplemented bioreactors yielded higher biomethane than FA. The AD can also be simulated by the most prominent models. The subsequent analysis of separated liquid and solid effluent fractions reveals their suitability for biofertilizer applications due to readily available N, P, and S forms and negligible amounts of heavy metals. Although struvite-like precipitates were observed, identification is still needed. Tremendous research aimed at energy recovery has been performed to date. However, no previous studies have determined the BMP of GM:CGT:FW and GM:SG co-digestions in different mixing ratios with varied process parameters and their effluent evaluations. Utilizing the adjusted alkalinity and other experimental parameters, the 70:30 GM:SG co-digestions in this study can be further upgraded to an automated pilot scale or even an industrial scale two-stage process. The incorporation of FA into the anaerobic digestion systems is not recommended. The liquid fraction can be applied to plants as phosphate fertigation. The solid fraction can be applied to crops as Ca and K sources, and it can also enhance the build-up of carbon content in degraded fine-textured soils. However, the influence of effluents on soil properties and plants needs to be investigated.

Author Contributions

Conceptualization, R.R.K.; methodology, H.K. and R.R.K.; resources, R.R.K.; data curation, H.K.; writing—original draft preparation, H.K.; writing—review and editing, H.K. and R.R.K.; visualization, H.K.; supervision, R.R.K.; project administration, R.R.K.; funding acquisition, R.R.K. All authors have read and agreed to the published version of the manuscript.

Funding

This work was supported by the USDA-CBG program grant (Award No. 2018-38821-27750), and partial support was provided by the NSF CREST Center for Energy and Environmental Sustainability (CEES) at Prairie View A&M University (NSF Award # 1914692), Prairie View, Texas.

Conflicts of Interest

The authors declare no conflict of interest. The funders had no role in the design of the study, in the collection, analyses, or interpretation of data, in the writing of the manuscript, or in the decision to publish the results.

References

  1. GCP—Carbon Budget. Available online: https://www.globalcarbonproject.org/carbonbudget/ (accessed on 1 September 2023).
  2. Maasakkers, J.D.; Varon, D.J.; Elfarsdóttir, A.; McKeever, J.; Jervis, D.; Mahapatra, G.; Pandey, S.; Lorente, A.; Borsdorff, T.; Foorthuis, L.R.; et al. Using satellites to uncover large methane emissions from landfills. Sci. Adv. 2022, 8, 9683. [Google Scholar] [CrossRef] [PubMed]
  3. USEPA. From Farm to Kitchen: The Environmental Impacts of U.S. Food Waste. 2021. Available online: https://www.epa.gov/system/files/documents/2021-11/from-farm-to-kitchen-the-environmental-impacts-of-u.s.-food-waste_508-tagged.pdf (accessed on 8 May 2023).
  4. Raj, T.; Chandrasekhar, K.; Morya, R.; Kumar Pandey, A.; Jung, J.H.; Kumar, D.; Singhania, R.R.; Kim, S.H. Critical challenges and technological breakthroughs in food waste hydrolysis and detoxification for fuels and chemicals production. Bioresour. Technol. 2022, 360, 127512. [Google Scholar] [CrossRef] [PubMed]
  5. Shanmugam, S.; Sekar, M.; Sivaramakrishnan, R.; Raj, T.; Ong, E.S.; Rabbani, A.H.; Rene, E.R.; Mathimani, T.; Brindhadevi, K.; Pugazhendhi, A. Pretreatment of second and third generation feedstock for enhanced biohythane production: Challenges, recent trends and perspectives. Int. J. Hydrogen Energy 2021, 46, 11252–11268. [Google Scholar] [CrossRef]
  6. Meegoda, J.N.; Li, B.; Patel, K.; Wang, L.B. A review of the processes, parameters, and optimization of anaerobic digestion. Int. J. Environ. Res. Public Health 2018, 15, 2224. [Google Scholar] [CrossRef]
  7. Husain, A. Mathematical models of the kinetics of anaerobic digestion—A selected review. Biomass Bioenergy 1998, 14, 561–571. [Google Scholar] [CrossRef]
  8. Raposo, F.; Fernández-Cegrí, V.; De la Rubia, M.A.; Borja, R.; Béline, F.; Cavinato, C.; Demirer, G.; Fernández, B.; Fernández-Polanco, M.; Frigon, J.C.; et al. Biochemical methane potential (BMP) of solid organic substrates: Evaluation of anaerobic biodegradability using data from an international interlaboratory study. J. Chem. Technol. Biotechnol. 2011, 86, 1088–1098. [Google Scholar] [CrossRef]
  9. Akobi, C.; Yeo, H.; Hafez, H.; Nakhla, G. Single-stage and two-stage anaerobic digestion of extruded lignocellulosic biomass. Appl. Energy 2016, 184, 548–559. [Google Scholar] [CrossRef]
  10. Krakat, N.; Demirel, B.; Anjum, R.; Dietz, D. Methods of ammonia removal in anaerobic digestion: A review. Water Sci. Technol. 2017, 76, 1925–1938. [Google Scholar] [CrossRef]
  11. Holl, E.; Steinbrenner, J.; Merkle, W.; Krümpel, J.; Lansing, S.; Baier, U.; Oechsner, H.; Lemmer, A. Two-stage anaerobic digestion: State of technology and perspective roles in future energy systems. Bioresour. Technol. 2022, 360, 127633. [Google Scholar] [CrossRef]
  12. Srisowmeya, G.; Chakravarthy, M.; Nandhini Devi, G. Critical considerations in two-stage anaerobic digestion of food waste—A review. Renew. Sustain. Energy Rev. 2020, 119, 109587. [Google Scholar] [CrossRef]
  13. Pasteris, A.M.; Heiermann, M.; Theuerl, S.; Plogsties, V.; Jost, C.; Prochnow, A.; Herrmann, C. Multi-advantageous sorghum as feedstock for biogas production: A comparison between single-stage and two-stage anaerobic digestion systems. J. Clean. Prod. 2022, 358, 131985. [Google Scholar] [CrossRef]
  14. Zielonka, S.; Lemmer, A.; Oechsner, H.; Jungbluth, T. Energy balance of a two-phase anaerobic digestion process for energy crops. Eng. Life Sci. 2010, 10, 515–519. [Google Scholar] [CrossRef]
  15. Wi, J.; Lee, S.; Ahn, H. Influence of Dairy Manure as Inoculum Source on Anaerobic Digestion of Swine Manure. Bioengineering 2023, 10, 432. [Google Scholar] [CrossRef]
  16. Kafle, G.K.; Chen, L. Comparison on batch anaerobic digestion of five different livestock manures and prediction of biochemical methane potential (BMP) using different statistical models. Waste Manag. 2016, 48, 492–502. [Google Scholar] [CrossRef] [PubMed]
  17. Kaur, H.; Kommalapati, R.R. Optimizing anaerobic co-digestion of goat manure and cotton gin trash using biochemical methane potential (BMP) test and mathematical modeling. SN Appl. Sci. 2021, 3, 724. [Google Scholar] [CrossRef]
  18. Rajendran, K.; Aslanzadeh, S.; Taherzadeh, M.J. Household Biogas Digesters—A Review. Energies 2012, 5, 2911–2942. [Google Scholar] [CrossRef]
  19. Weiland, P. Biogas production: Current state and perspectives. Appl. Microbiol. Biotechnol. 2009, 85, 849–860. [Google Scholar] [CrossRef] [PubMed]
  20. Wu, L.J.; Kobayashi, T.; Li, Y.Y.; Xu, K.Q. Comparison of single-stage and temperature-phased two-stage anaerobic digestion of oily food waste. Energy Convers. Manag. 2015, 106, 1174–1182. [Google Scholar] [CrossRef]
  21. Triolo, J.M.; Sommer, S.G.; Møller, H.B.; Weisbjerg, M.R.; Jiang, X.Y. A new algorithm to characterize biodegradability of biomass during anaerobic digestion: Influence of lignin concentration on methane production potential. Bioresour. Technol. 2011, 102, 9395–9402. [Google Scholar] [CrossRef]
  22. Regassa, T.H.; Wortmann, C.S. Sweet sorghum as a bioenergy crop: Literature review. Biomass Bioenergy 2014, 64, 348–355. [Google Scholar] [CrossRef]
  23. Garuti, M.; Mantovi, P.; Soldano, M.; Immovilli, A.; Ruozzi, F.; Fermoso, F.G.; Rodriguez, A.J.; Fabbri, C. Towards sustainable energy-crop cultivation: Feasibility of biomethane production using a double-cropping system with various sorghum phenotypes. Biofuels Bioprod. Biorefin. 2020, 14, 553–565. [Google Scholar] [CrossRef]
  24. Dareioti, M.A.; Kornaros, M. Anaerobic mesophilic co-digestion of ensiled sorghum, cheese whey and liquid cow manure in a two-stage CSTR system: Effect of hydraulic retention time. Bioresour. Technol. 2015, 175, 553–562. [Google Scholar] [CrossRef] [PubMed]
  25. Agblevor, F.A.; Cundiff, J.S.; Mingle, C.; Li, W. Storage and characterization of cotton gin waste for ethanol production. Resour. Conserv. Recycl. 2006, 46, 198–216. [Google Scholar] [CrossRef]
  26. Dalke, R.; Demro, D.; Khalid, Y.; Wu, H.; Urgun-Demirtas, M. Current status of anaerobic digestion of food waste in the United States. Renew. Sustain. Energy Rev. 2021, 151, 111554. [Google Scholar] [CrossRef]
  27. Lauzurique, Y.; Montalvo, S.; Salazar, R.; García, V.; Huiliñir, C. Fly ash from coal combustion as improver of anaerobic digestion: A review. J. Environ. Chem. Eng. 2021, 9, 106422. [Google Scholar] [CrossRef]
  28. Naresh Kumar, A.; Sarkar, O.; Chandrasekhar, K.; Raj, T.; Narisetty, V.; Mohan, S.V.; Pandey, A.; Varjani, S.; Kumar, S.; Sharma, P.; et al. Upgrading the value of anaerobic fermentation via renewable chemicals production: A sustainable integration for circular bioeconomy. Sci. Total Environ. 2022, 806, 150312. [Google Scholar] [CrossRef]
  29. Möller, K.; Müller, T. Effects of anaerobic digestion on digestate nutrient availability and crop growth: A review. Eng. Life Sci. 2012, 12, 242–257. [Google Scholar] [CrossRef]
  30. Campos, J.L.; Crutchik, D.; Franchi, Ó.; Pavissich, J.P.; Belmonte, M.; Pedrouso, A.; Mosquera-Corral, A.; Val del Río, Á. Nitrogen and Phosphorus Recovery from Anaerobically Pretreated Agro-Food Wastes: A Review. Front. Sustain. Food Syst. 2019, 2, 91. [Google Scholar] [CrossRef]
  31. Czekała, W.; Nowak, M.; Piechota, G. Sustainable management and recycling of anaerobic digestate solid fraction by composting: A review. Bioresour. Technol. 2023, 375, 128813. [Google Scholar] [CrossRef]
  32. Sanderman, J.; Hengl, T.; Fiske, G.J. Soil carbon debt of 12,000 years of human land use. Proc. Natl. Acad. Sci. USA 2017, 114, 9575–9580. [Google Scholar] [CrossRef]
  33. Badagliacca, G.; Petrovičovà, B.; Pathan, S.I.; Roccotelli, A.; Romeo, M.; Monti, M.; Gelsomino, A. Use of solid anaerobic digestate and no-tillage practice for restoring the fertility status of two Mediterranean orchard soils with contrasting properties. Agric. Ecosyst. Environ. 2020, 300, 107010. [Google Scholar] [CrossRef]
  34. Macias-Corral, M.; Samani, Z.; Hanson, A.; Smith, G.; Funk, P.; Yu, H.; Longworth, J. Anaerobic digestion of municipal solid waste and agricultural waste and the effect of co-digestion with dairy cow manure. Bioresour. Technol. 2008, 99, 8288–8293. [Google Scholar] [CrossRef]
  35. Hartmann, H.; Ahring, B.K. Anaerobic digestion of the organic fraction of municipal solid waste: Influence of co-digestion with manure. Water Res. 2005, 39, 1543–1552. [Google Scholar] [CrossRef] [PubMed]
  36. DOE Alternative Fuels Data Center: Energy Independence and Security Act of 2007. Available online: https://afdc.energy.gov/laws/eisa.html (accessed on 23 August 2023).
  37. FAO Goats|Livestock Systems|Food and Agriculture Organization of the United Nations. Available online: https://www.fao.org/livestock-systems/global-distributions/goats/en/ (accessed on 22 August 2023).
  38. APHA. Standard Methods for the Examination of Water and Wastewater, 20th ed.; American Public Health Association: Washington, DC, USA, 2005. [Google Scholar]
  39. Angelidaki, I.; Alves, M.; Bolzonella, D.; Borzacconi, L.; Campos, J.L.; Guwy, A.J.; Kalyuzhnyi, S.; Jenicek, P.; Van Lier, J.B. Defining the biomethane potential (BMP) of solid organic wastes and energy crops: A proposed protocol for batch assays. Water Sci. Technol. 2009, 59, 927–934. [Google Scholar] [CrossRef] [PubMed]
  40. Holliger, C.; Alves, M.; Andrade, D.; Angelidaki, I.; Astals, S.; Baier, U.; Bougrier, C.; Buffière, P.; Carballa, M.; De Wilde, V.; et al. Towards a standardization of biomethane potential tests. Water Sci. Technol. 2016, 74, 2515–2522. [Google Scholar] [CrossRef] [PubMed]
  41. Kaur, H.; Kommalapati, R.R. Biochemical Methane Potential and Kinetic Parameters of Goat Manure at Various Inoculum to Substrate Ratios. Sustainability 2021, 13, 12806. [Google Scholar] [CrossRef]
  42. Kaur, H.; Kommalapati, R.R. Effect of Inoculum Concentration and Pretreatment on Biomethane Recovery from Cotton Gin Trash. J. Agric. Sci. 2021, 13, 15. [Google Scholar] [CrossRef]
  43. Zhang, T.; Liu, L.; Song, Z.; Ren, G.; Feng, Y.; Han, X.; Yang, G. Biogas production by co-digestion of goat manure with three crop residues. PLoS ONE 2013, 8, e66845. [Google Scholar] [CrossRef]
  44. Hafner, S.D.; de Laclos, H.F.; Koch, K.; Holliger, C. Improving Inter-Laboratory Reproducibility in Measurement of Biochemical Methane Potential (BMP). Water 2020, 12, 1752. [Google Scholar] [CrossRef]
  45. Thomas, H.L.; Pot, D.; Latrille, E.; Trouche, G.; Bonnal, L.; Bastianelli, D.; Carrère, H. Sorghum Biomethane Potential Varies with the Genotype and the Cultivation Site. Waste Biomass Valoriz. 2019, 10, 783–788. [Google Scholar] [CrossRef]
  46. Orangun, A.; Kaur, H.; Kommalapati, R.R. Batch Anaerobic Co-Digestion and Biochemical Methane Potential Analysis of Goat Manure and Food Waste. Energies 2021, 14, 1952. [Google Scholar] [CrossRef]
  47. Tena, M.; Perez, M.; Fuel, R.S. Effect of hydraulic retention time on the methanogenic step of a two-stage anaerobic digestion system from sewage sludge and wine vinasse: Microbial and Kinetic Evaluation. Fuel 2021, 296, 120674. [Google Scholar] [CrossRef]
  48. Cataldi, T.R.I.; Margiotta, G.; Del Fiore, A.; Bufo, S.A. Ionic content in plant extracts determined by ion chromatography with conductivity detection. Phytochem. Anal. 2003, 14, 176–183. [Google Scholar] [CrossRef] [PubMed]
  49. Boyle, W.C. Energy Recovery from Sanitary Landfills—A Review; Pergamon Press: New York, NY, USA, 1977. [Google Scholar] [CrossRef]
  50. Buswell, A.M.; Mueller, H.F. Mechanism of methane fermentation. Ind. Eng. Chem. 1952, 44, 550–552. [Google Scholar] [CrossRef]
  51. Li, W.; Siddhu, M.A.H.; Amin, F.R.; He, Y.; Zhang, R.; Liu, G.; Chen, C. Methane production through anaerobic co-digestion of sheep dung and waste paper. Energy Convers. Manag. 2018, 156, 279–287. [Google Scholar] [CrossRef]
  52. Lay, J.-J.; Li, Y.-Y.; Noike, T. Effect of moisture content and chemical nature on methane fermentation characteristics of municipal solid wastes. Doboku Gakkai Ronbunshu 1996, 552, 101–108. [Google Scholar] [CrossRef]
  53. Lay, J.-J.; Li, Y.-Y.; Tatsuya, N. Influences of pH and moisture content on the methane production in high-solids sludge digestion. Water Res. 1997, 31, 1518–1524. [Google Scholar] [CrossRef]
  54. Richards, B.K.; Cummings, R.J.; White, T.E.; Jewell, W.J. Methods for kinetic analysis of methane fermentation in high solids biomass digesters. Biomass Bioenergy 1991, 1, 65–73. [Google Scholar] [CrossRef]
  55. Myllymäki, P.; Pesonen, J.; Romar, H.; Hu, T.; Tynjälä, P.; Lassi, U. The use of Ca-and Mg-rich fly ash as a chemical precipitant in the simultaneous removal of nitrogen and phosphorus—Recycling and reuse. Recycling 2019, 4, 14. [Google Scholar] [CrossRef]
  56. Siddiqui, Z.; Horan, N.J.; Anaman, K. Optimisation of C:N ratio for co-digested processed industrial food waste and sewage sludge using the BMP test. Int. J. Chem. React. Eng. 2011, 9, 1–9. [Google Scholar] [CrossRef]
  57. Raposo, F.; De La Rubia, M.A.; Fernández-Cegrí, V.; Borja, R. Anaerobic digestion of solid organic substrates in batch mode: An overview relating to methane yields and experimental procedures. Renew. Sustain. Energy Rev. 2012, 16, 861–877. [Google Scholar] [CrossRef]
  58. Moody, L.; Burns, R.; Wu-haan, W.; Spajic, R. Use of biochemical methane potential (BMP) assays for predicting and enhancing anaerobic digester performance. In Proceedings of the 44th Croatian and the 4th International Symposium on Agriculture, Opatija, Croatia, 16–20 February 2009. [Google Scholar]
  59. Lauzurique, Y.; Fermoso, F.G.; Sánchez, N.; Castillo, A.; Valdés, N.; Tello, M.; Salazar, R.; García, V.; Huiliñir, C. Effect of the addition of fly ash on the specific methane production and microbial communities in the anaerobic digestion of real winery wastewater. J. Chem. Technol. Biotechnol. 2021, 96, 2882–2890. [Google Scholar] [CrossRef]
  60. Maharaj, B.C.; Mattei, M.R.; Frunzo, L.; van Hullebusch, E.D.; Esposito, G. ADM1 based mathematical model of trace element precipitation/dissolution in anaerobic digestion processes. Bioresour. Technol. 2018, 267, 666–676. [Google Scholar] [CrossRef] [PubMed]
  61. Kugelman, J.I.; Perry, L.M. Cation toxicity and stimulation in anaerobic waste treatment. Water Pollut. Control Fed. 1965, 37, 97–116. [Google Scholar]
  62. Nabaterega, R.; Kumar, V.; Khoei, S.; Eskicioglu, C. A review on two-stage anaerobic digestion options for optimizing municipal wastewater sludge treatment process. J. Environ. Chem. Eng. 2021, 9, 105502. [Google Scholar] [CrossRef]
  63. Wang, Q.; Liang, Y.; Zhao, P.; Li, Q.X.; Guo, S.; Chen, C. Potential and optimization of two-phase anaerobic digestion of oil refinery waste activated sludge and microbial community study. Sci. Rep. 2016, 6, 38245. [Google Scholar] [CrossRef]
  64. Noah, S.B.; Jacob, H.; Pinto, R.; Lurie, S. Cell Wall Changes and Partial Prevention of Fruit Softening in Prestorage Heat Treated ‘Anna’ Apples. J. Sci. Food Agric. 1996, 72, 231–234. [Google Scholar]
  65. Li, X.; Li, L.; Zheng, M.; Fu, G.; Lar, J.S. Anaerobic co-digestion of cattle manure with corn stover pretreated by sodium hydroxide for efficient biogas production. Energy Fuels 2009, 23, 4635–4639. [Google Scholar] [CrossRef]
  66. Zhang, Z.; Li, B.; Briechle, M.G.; Wicaksana, F.; Yu, W.; Young, B. Effect of acetic acid on struvite precipitation: An exploration of product purity, morphology and reaction kinetics using central composite design. Chemosphere 2021, 285, 131486. [Google Scholar] [CrossRef]
  67. Wang, L.; Rinklebe, J.; Tack, F.M.G.; Hou, D. A review of green remediation strategies for heavy metal contaminated soil. Soil Use Manag. 2021, 37, 936–963. [Google Scholar] [CrossRef]
  68. Nkoa, R. Agricultural benefits and environmental risks of soil fertilization with anaerobic digestates: A review. Agron. Sustain. Dev. 2014, 34, 473–492. [Google Scholar] [CrossRef]
Figure 1. Experimental overview.
Energies 16 06484 g001
Figure 2. (af) Daily and cumulative biomethane yield (mL/gvs). Each dot on the charts represents the mean of three values. Error bars represent SD over the mean values.
Energies 16 06484 g002
Figure 3. The composition of fly ash (FA). Error bars represent SD ± means.
Energies 16 06484 g003
Figure 4. (af) Experimental and modified first-order and modified Gompertz models predicted biomethane yields (mL/gvs) of the highest-yielding treatments.
Energies 16 06484 g004
Figure 5. The concentration (ppm, mean of duplicate values) of orthophosphate, nitrate and COD (ac) in liquid influent (i) and effluent (e) fractions; the essential plant macro and micronutrients (mean of triplicates ± SD, respectively) in solid fractions (d,e).
Energies 16 06484 g005
Figure 6. Carbon to nitrogen ratios (means of triplicate values) of bioreactor influent (I) and effluents (E).
Energies 16 06484 g006
Table 1. Experimental parameters.
ParameterGM:SGGM:CGT:FWGM:SG (TS)
Digester volume (mL)2502502000
Working volume (mL)100100800
OLR a (%Total solids)101010
BMP Duration (d) b626248
Gas measurementLiquid displacement--
Headspace (mL)1501501200
BufferBicarbonateBicarbonate-
Data (STP)mL/gvsmL/gvsmL/gvs
a Organic loading rate; b Biochemical methane potential duration (days).
Table 2. Goat manure (GM), sorghum (SG), cotton gin trash (CGT), food waste (FW), and inoculum characteristics.
ParameterGMSGCGTFWInoculum
Moisture (%)6.7 ± 0.110.5 ± 0.312.0 ± 015.9 ± 0.298.0 ± 0.1
TS a (%)93.3 ± 0.189.5 ± 0.387.7 ± 0.484.1 ± 0.22.0 ± 0.1
VS b (%)71.5 ± 0.283.2 ± 0.278.9 ± 0.880.8 ± 0.42.2 ± 0.2
Ash (%)20.0 ± 06.5 ± 09.3 ± 03.4 ± 0.10
N (%-TS)2.4 ± 0.31.2 ± 0.11.3 ± 02.2 ± 0.1-
C (%-TS)41.0 ± 0.546.2 ± 0.247.3 ± 1.246.5 ± 0.5-
H (%-TS)6.4 ± 0.26.6 ± 0.14.5 ± 00-
O (%-TS)49.8 ± 0.645.8 ± 0.346.6 ± 1.551.2 ± 0-
S (%-TS)0.4 ± 00.2 ± 00.2 ± 00.2 ± 0-
C/N17.0 ± 2.538.5 ± 1.836.3 ± 0.921.2 ± 1.1-
Elemental FormulaC341.9H639.967O311.5N16.8S1.2C385.1H659.9O286.1N8.7S0.6C390.0H450.0O290.8N21.2S0.6C3.2H0O3.2N1.6S0.06-
TMY c (mL/gvs)372.9448.2451.0305.4-
Alkalinity d (mg/L)973.0 ± 32.5509.0 ± 01642.5 ± 99.770.3 ± 1.8
a Total solids; b volatile solids; c theoretical biomethane potential; d CaCO3 mg/L. Each value is a mean ± SD from triplicates.
Table 3. Theoretical (TMY) and experimental (EMY) biomethane potential, biodegradability (BD), and goat manure (GM) and cotton gin trash (CGT), food waste (FW) and sorghum (SG) anaerobic digestions.
Co-DigestionTMY a
(mL/gvs)
EMY b
(mL/gvs)
BD c
(%)
GM:SG
100:0372.9218.1 ± 14.258.5
70:30395.6239.3 ± 15.660.5
GM:CGT:FW
100:0:0372.9224.7 ± 19.960.3
70:10:20367.2217.6 ± 5.459.3
GM:SG (TS) d
Anaerobic Medium (M)395.6266.067.3
Fly Ash (FA)395.6149.837.9
a Theoretical biomethane potential; b experimental biomethane potential; c biodegradability; d 70:30 (two-stage). The TMY and BDs were obtained from mean values. The EMYs of single-stage (GM:SG and GM:CGT:FW) are mean ± SD of triplicates.
Disclaimer/Publisher’s Note: The statements, opinions and data contained in all publications are solely those of the individual author(s) and contributor(s) and not of MDPI and/or the editor(s). MDPI and/or the editor(s) disclaim responsibility for any injury to people or property resulting from any ideas, methods, instructions or products referred to in the content.

