Abstract
In an era of increasing environmental challenges, the transition to a low-carbon economy is an essential step for the manufacturing and industrial sectors. The quality of business processes plays a key role in the transition to a zero-carbon economy. The objective of the paper was, thus, to analyze the break-even point in core and supporting business processes using the proposed linear model based on regression analysis. The aim was to identify the impact of qualitative processes in the pre-production, production, and post-production phases on reaching the break-even point and how these processes affect profits in engineering companies operating in low-carbon sectors. The results suggest that supporting quality processes would generate the highest profit. Investing in improving the quality of core and supporting business processes has a twofold impact, as it improves the bottom line of enterprises through enhancing their reputation as socially responsible businesses. Corporate reputation based on corporate social responsibility in a low-carbon economy represents a valuable intangible asset that helps industrial companies to develop a sustainable and thriving low-carbon business ecosystem.
1. Introduction
At a time when sustainability is playing an increasingly important role at a global level, the transition to a low-carbon economy becomes an indispensable necessity for industrial companies. This transformation requires changes in practices and technologies in order to significantly reduce their carbon footprint. Given that most business activities of companies consume natural resources during their production processes, the low-carbon economy represents a new model of economic development transforming social and industrial consumption [1].
In the era of transition to a low-carbon economy, especially in the European Union, we are witnessing intensive activities aimed at adapting to the new inevitable framework of socio-economic development [2]. The European Union has set an ambitious goal to become the first carbon-neutral continent by 2050 [3], which represents a challenging process of transforming economies toward achieving net-zero emissions within a few decades. This transition requires significant investment [4] and advances in low-carbon technologies. Low-carbon innovation is becoming a key policy for national development in the context of the transition to a low-carbon economy [5]. The application of stringent environmental regulations and standards at global, national, and regional levels aims to minimize negative environmental impacts and reduce greenhouse gas emissions. Improving the process quality in industrial plants and minimizing energy losses are the key factors that help companies to achieve these low-carbon goals. Optimization and improvement of production processes enable using energy, raw materials, and human capital efficiently, which leads to a more economical (higher-quality) use of production resources and active involvement in low-carbon production.
Quality is a holistic concept that evolves and changes over time. Today, process quality assessment concerns not only meeting performance standards, but also compliance with environmental aspects throughout the production process. According to Lagrosen [6], environmental quality management in industrial companies is a new and innovative approach to quality management, guided by the principles of sustainable development.
In the era of Quality 4.0, customer expectations for quality at low cost have increased. This phenomenon prompts companies to look for the point at which a trade-off must be made between increasing quality and reducing costs. The given trade-off has contributed to the development of the cost of quality (CoQ) approach [7]. The use of price alone to indicate the perceived value to the customer is not reliable enough, as price is influenced by various aspects in the market, such as competition, inflation, or the product life cycle. Tracking the constant change in value allows businesses to innovate the production process in order to achieve the expected value of a product or service for customers. According to Daunorienė and Staniskiene [8], the added value that is created during quality improvement activities can be considered a tool of market share control, the aim of which is to gain economic benefits of the company.
Any significant attempt to improve quality in the new economic environment should consider the total cost of achieving quality [9]. The goal of continuous improvement programs is no longer just to meet customer expectations [10] but also to meet the requirements of environmental management, information security management, and others. CoQ programs should be tailored for each organization so that they are integrated into the strategy, organizational structure, and accounting system of a particular company. Companies should not use any borrowed models as they may only work for other businesses [11], and poor quality can even endanger human lives in some industries [12].
In a low-carbon economy, where it is crucial to reduce the environmental footprint, quality business processes have a significant impact on creating added value and building a positive corporate image. A growing number of consumers are considering social responsibility and sustainability aspects when making their purchasing decisions [13]. Industrial companies that have implemented low-carbon solutions into their production processes produce high-quality and environmentally friendly products and services, which enables them to earn the trust of society and build a reputation as reliable providers of both high-quality and sustainable products. With an increasing number of satisfied customers sharing their positive experience and recommending the company to other customers, industrial companies in the low-carbon economy have excellent opportunities to expand their customer base (B2C) and discover new business opportunities (B2B).
In the context of process improvement in industrial companies, quality helps companies to achieve better results in terms of environmental responsibility, thus contributing to the creation of added value and enhancing their reputation. Previous research in the field of low-carbon economy has focused on analyzing the ethical aspects of quality related to the manifestation of corporate social and environmental responsibility [14], on analyzing the coordinated development of a low-carbon economic system and regional environmental problems [15], and on identifying differences in the progress of EU countries in terms of lower energy consumption and lower pollution [3].
Previous research on process quality showed that a reduction in process cost, which is necessary for achieving quality in industries, can only be ensured if it is clearly defined and measured [11]. Follow-up research on the relationship between cost of quality and value added has focused on the effectiveness of quality inspection [16], auditor skills and experience during a value-added quality audit [17], assessing quality costs from the perspective of value-added chain [8], analyzing cost of quality in the supply chain [18], and the impact of the value on quality improvement, or the perceived customer value [19]. The aforementioned research does not include the interfaces between cost of quality in core and supporting processes and their impact on value creation. Therefore, the aim of the presented research is to identify the impact of the business (core and supporting) process quality on the creation of added value in industrial companies based in the Czech Republic in the context of a low-carbon economy.
1.1. Low-Carbon Economy and Reputation of Industrial Companies
1.1.1. Low-Carbon Economy of Industrial Companies
A low-carbon economy stimulates and encourages economic and ecological development while focusing on innovative energy use and easing the burden of nature conservation. This strategy involves protecting global economies and improving the quality of human lives [3], while relying on sustainable and responsible production and consumption. Consumers are increasingly favoring low-carbon approaches [20], which indicates a growing awareness of environmental issues and demand for green solutions. This trend is sparking a lively academic and business interest in social low-carbon transformation [21] aimed at changing production practices for the sake of green industry. A sustainable approach to business represents a modern concept of continuous innovation, open collaboration with stakeholders, and active participation of the community [22].
Although the industrial sector is the main source of carbon emissions, it also paves the way for national green development [23]. About 140 developing countries support low-emission technologies, pursuing environmental goals to ensure sustainable development [24]. However, the flipside is quite obvious. The Czech Republic produces half of its energy from coal [25], thus seriously hindering the low-carbon practices of local industries. Small and medium-sized enterprises should also reduce their carbon production, although their share is smaller than in large enterprises and the public sector [26].
The increased interest in a low-carbon economy [27] makes many countries think about sustainable development [28]. Companies involved in the low-carbon economy often invest in modern and green technologies to achieve higher effectiveness and quality. These efforts involve advanced control systems, automation, and the use of renewable energy resources to achieve excellence in manufacturing processes and products. Renewable energies are essential in the fierce competition in global markets to make efficient use of scarce supplies [29].
As many companies show no interest in corporate social responsibility [30], government officials must impose measures to stimulate and motivate ecological behavior in the industrial sector [31].
These stimuli and motivation tools should involve national calls and grant subsidies to support low-carbon innovations [32], inducing firms to implement new self-regulation technologies to combat pollution in manufacturing processes. In addition to the effective use of natural resources, enterprises should be responsible for their protection to ensure sustainable development and low-carbon production [30]. Governments and international environmental organizations are actively pursuing policies to support producers of low-carbon products, thereby promoting consumer awareness of environmental protection [20]. Some countries even subsidize industrial producers using renewable energy resources to encourage households to buy their products. The initiatives involve promoting the purchase of low-carbon electric cars, biomass boilers, or photovoltaic panels. In addition to promoting low-carbon production, these measures aim to engage customers in sustainable lifestyle and responsible consumption.
1.1.2. Reputation of Socially Responsible Industrial Companies
In the transition to a low-carbon economy, customers and other market actors expect businesses to play a proactive role in the combat against climate change and environmental protection. Therefore, it is essential for industrial companies to build and maintain a good reputation of social responsibility for low-carbon production. As part of the implementation of a corporate social responsibility strategy, it is important to disclose environmental, social, and governance information in a proactive and transparent manner, which serves as evidence of the company’s commitment to society and provides an opportunity for the company to be perceived as a trusted partner by stakeholders [33]. At the same time, it is important for companies to communicate their low-carbon goals and achievements through appropriate marketing and communication strategies.
Reputation as an intangible asset [34] of industrial companies seeking to achieve carbon neutrality is influenced by several stakeholders, including customers, investors, suppliers, business partners, the professional community, NGOs, and regulators. According to Jiang [5], a reputation as a carbon neutral business is the key to successfully selecting the right partners during alliance building and business-to-business (B2B) relationships. This responsible behavior is attractive to partners who also emphasize social responsibility and share similar values and goals. In addition, such behavior helps a company to gain a more advantageous competitive position in the regulatory environment. According to Haas et al. [4], the transition to low-carbon corporate management is accompanied by uncertainty, which hinders investment. The precision of companies’ and investors’ decisions during periods of uncertainty is crucial, as delayed investment during this period will slow down structural changes, and wrong decisions may seriously jeopardize the existence of businesses. Good-quality analysis enables businesses to make the right decisions supporting a successful transition to low-carbon production.
The reputation of industrial companies in the low-carbon economy can also be transferred to their brand and products. In the B2C sector, consumer demand for sustainable products continues to grow as stakeholders favor companies focused on customer and environmental care. Effective resolution of customer issues and complaints (including complaint management and addressing issues related to poor quality) is an important part of good business processes. A company that has well-defined processes to manage complaints and responds quickly to customer issues demonstrates that it cares and is able to adapt to change. Consumers who are satisfied with a company’s products and services are more likely to provide positive reviews and recommendation to other customers. This approach helps to win loyal customers and reinforces the competitive advantage and reputation of a socially responsible company that customers and stakeholders wish to maintain long-term relationships with.
According to Hampton et al. [26], a paradigm shift is needed in business support relating to environmental aspects. Therefore, the next section dives deeply into business process quality as it is an important factor that helps to achieve carbon neutrality of industrial companies.
1.2. Business Process Quality and Added Value Creation
In the 21st century, when demands on quality at low cost are getting more intense every day [7], the elimination of business activities that do not generate value is considered an important factor for the success of the corporate sector. The value of products is transformed into tangible attributes, such as quality (aesthetic appeal, reliability, and sustainability) embedded in the product (at lower cost and shorter time) in order to generate more added value for the customer [19].
All activities of a company aimed at creating products and services are based on business processes. It is the processes that add value. Through value-creating activities, businesses seek to reduce costs while achieving a higher selling price with a greater margin [35]. Although many SME managers do not see the value stream as a direct tool for achieving profitability and sustainability, they still use it in their decision-making, management, and regulatory processes [36].
Knowledge of the processes that create value enables companies to increase product value added, process output, and customer satisfaction [37], or identify the business activities that contribute most to the quality of a finished product. As the investment directed toward quality can be evaluated by cost of quality analysis [38], these findings link the cost of quality to the concept of value added, which defines the relationship between business processes and the products made [37]. According to Hamrol, Kujawińska, and Bożek [16], value added represents the difference between the cost of quality (CQ) incurred within a production process with QI and the cost incurred without it.
There is no uniform agreement in the literature concerning the definition of the cost of quality [38]. The genesis of cost of quality has shown that, in scientific studies, cost of quality is usually seen as the total sum of the cost of conformance and non-conformance quality [8]. Furthermore, authors divide them into good-quality costs (investments in preventive measures, such as implementation of quality standards, planning, management, quality control and evaluation) and poor-quality costs (resulting from non-conformance, or internal and external errors) [39]. Inaccurate cost estimation can lead to the development of inappropriate quality programs [40]. Researchers and practitioners have developed several models proposed to measure the cost of quality: the PAF model, the PQC model, the process cost model, the ABC model, and the opportunity cost model [11].
The universal distribution of quality costs according to the PAF model includes the following: (a) internal failure costs, (b) external failure costs, (c) prevention costs, and (d) evaluation costs. The PAF model has several shortcomings despite its general acceptance and widespread use for quality costing purposes. According to Xiaobing et al. [41], each company has a number of preventive measures that are part of quality assurance but may not be included in the quality report. Another shortcoming is the absence of accounting for intangible cost of quality that cannot be easily determined in financial terms such as ‘loss of customer goodwill’.
According to Hamrol, Kujawińska, and Bożek [16], value added represents the difference between the cost of quality (CQ) incurred in the production process with QI and the cost incurred without it. Applying CoQ models according to the internal needs of each company allows businesses to identify, analyze, and minimize the total costs associated with the quality assurance of business process quality and product quality assurance. Despite the advantages of tracking quality costs, research by Glogovac and Filipovic [42] showed that 72% of the surveyed companies still do not apply any of the management of quality cost analysis models. A similar situation is in the case of the allocation of business activities based on the generation of added value.
Research investigating the impact of quality costs on the direction and intensity of value added from a value chain perspective [8] used multiple linear regression analysis to determine the relationships between value-added quality costs and non-value-added quality costs. The research results show that increasing the cost of value-added quality is affected by both the reduction in non-value-added quality cost and the reduction in defective product cost. Tracking these two values allows determining the trend of the value-added indicator. In terms of the value chain, the cost of quality can be described as (1) the cost of quality in the value-added chain intended to guarantee the implementation of defined characteristics during the product transformation process, and (2) the failure of the value-added chain related to the cost of quality non-conformance.
1.3. Integrated Methods of Quality and Reputation Assessment in the Context of Carbon Economy
An integrated approach to quality and reputation assessment identifies factors combining objective and subjective elements of quality that contribute to achieving carbon neutrality in the industrial sector. Objective quality quantifies objective criteria and standards, including accuracy, reliability, dimensions, performance, and other measurable parameters. The concept reflects facts and data for validation and quantification, including standards, norms, accurate measurements, quantitative data, and statistical methods. Objective assessment must be fair, reliable, and valid. In contrast, the subjective quality of business processes involves opinions, emotions, preferences, personal experiences [32], customers, employees, or managers. Subjective quality reflects the impressions of managers at all levels. Decisions on quality issues discussed at company meetings may give rise to different views of the quality among the managers of production, maintenance, quality assessment, logistics, and other workers. Annex A1 reports on the model ‘Integrated methods of the quality and reputation assessment in terms of the low-carbon economy’, which includes the optimization of production processes into subjective and objective quality in the transition to carbon neutrality. If successful, the company earns a reputation as a socially responsible firm in the industrial sector. Different producers’ and customers’ opinions on quality costs (objective and subjective) [19] have made experts and scholars develop various CoQ measurement models. Yet, SMEs apply none of them [42]. The business sector needs streamlined methods to implement QM principles that are not time-consuming and are easy to follow. It is not possible to objectively measure the process quality when monitoring quality costs concerning the product price, as it depends on various external, often negative, factors, including the pandemic, armed conflicts, and customer ecological concerns. We can examine how customers see the business process quality by monitoring the costs of the process quality and its added value. It is also an opportunity for the top management to incorporate practical quality programs into the corporate strategy in the pre-production stage. The following two research questions have, thus, been formulated:
Research question Q1: Where is the break-even point of marginal quality costs in core business processes?
Research question Q2: Where is the break-even point of marginal quality costs in supporting business processes?
Hypothesis 1 (H1).
It is assumed that the core business processes generate higher added value in the production phase than in the pre-production and post-production phase.
Hypothesis 2 (H2).
It is assumed that the core business processes generate higher added value than supporting business processes.
Using regression analysis, the authors examine how the proposed model determines the quality break-even point in a specific model mechanical engineering enterprise with an implemented strategy of low-carbon economy.
2. Materials and Methods
2.1. Methods
The main method of data collection used in the research was a questionnaire survey method, which enabled direct data collection from the selected subjects. The questionnaires were aimed at obtaining data from companies for the year 2022. For the purposes of the analysis of the quantitative research data, a model for statistical data processing was proposed on the basis of the regression analysis method. Regression analysis is a statistical method used for the analysis and modeling of relationship between variables. This method was selected due to the fact that it enables analyzing the effect of independent variables on the dependent variable and predict the values of the dependent variable on the basis of the values of the independent variables [43].
2.2. Materials
The research sample comprised companies operating in a specific industry, obtained using a purposive sampling method. The research sample included entities whose main activities were classified in categories 25 and 28 according to the CZ-NACE classification of economic activities. The selected industry was engineering, which represents an important part of the industrial economy of the Czech Republic. This industry was also selected due to the fact that it is one of the leading sectors of industry [44] and generates a high added value [45]. In the context of low-carbon economy and with regard to the current environmental issues, the engineering sector is key for manufacturing energy-efficient machinery for other industrial sectors [46]. The data extraction for the purposes of quantitative research was based on combining data from the Czech Statistical Office concerning the selection of enterprises and a custom-created dataset with the data on the costs of quality of core and supporting processes. Data on selected companies are presented in Table 1 below.

Table 1.
Extraction criteria.
After selecting suitable enterprises (Table 1), the current data were obtained from the Czech Statistical Offices following the selected criteria (company size, generated annual profit, number of employees, etc.) as of 30 January 2023, when the statistical data for the year 2022 were completed. Subsequently, on the basis of the obtained data describing the basic characteristics of the research sample, the method of purposeful questioning was used to address 132 selected companies operating in the engineering sector. After removing incomplete information obtained within the questionnaire survey, a reliable dataset containing data on 53 enterprises was created, which included the classification of these companies by size category (small, medium-sized, and large enterprises). The dataset was subjected to analysis, through which valuable data were obtained from the selected entities, and the accuracy and timeliness of the information were ensured with the aim of providing a solid background for further analysis and research.
2.3. Process of Research and Definition of Main Variables
The research was divided into six phases: selection of suitable companies, conduction of the questionnaire survey in the selected companies, creation of own dataset for the purposes of the research, analysis of the basic characteristic of the research sample, design and testing of the created regression model, and analysis of the break-even point of the value-creation processes. A detailed description of the whole process is visualized in Figure 1.
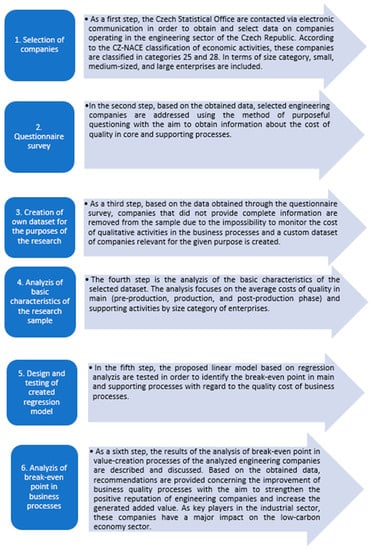
Figure 1.
Research phases.
Definition of main variables. Within the fifth phase called ‘Design and testing of the proposed regression model’, the main variables were defined. This enabled implementing a two-level access and, thus, obtaining detailed information about the relationships between variables in the analyzed companies, namely between the break-even point and the amount of the generated profit per employee.
Step 1. As a first step of the analysis, comparable prices per employee were determined in the analyzed companies.
Step 2. In the second step, a linear model was created, examining the dependence between profit and various factors: the scope of business activities, size category, cost in the pre-production phase, cost in the production phase, cost in the post-production phase, and cost of supporting activities. The creation of the model enabled identifying the impact of these factors on profit generation. The adjusted R-squared of the selected model is very high considering the variability of the process. The other diagnostic tools did not show any inconsistencies in the model, either. Therefore, the model could be considered sufficiently explanatory:
where is the value added per employee, represents the profit for subject, represents the pre-production phase main activities, represents the production phase main activities, represents the post-production phase main activities, represents the supporting activities, are the regression coefficients, and ne is the number of employees.
Step 3. Subsequently, the proposed model for calculating the added value was subjected to a robustness test. A datum of each of businesses was dropped from the dataset to test the model’s ability to respond to errors and identify which parameters were critical and required additional checking.
According to the proposed procedure in Figure 1, it was possible to follow the defined research questions and hypotheses. The proposed model provided a more complex and interconnected view of the relationships and links between the variables, specifically between the break-even point and the amount of the profit generated per employee in main and supporting processes.
3. Results and Discussion
A defined methodology was used for quantitative research analysis of the break-even point in core business and supporting business processes in terms of quality. First, the average cost of quality in core and supporting processes by size category of the selected companies was analyzed. Figure 2 shows graphical representations of the average cost of quality.
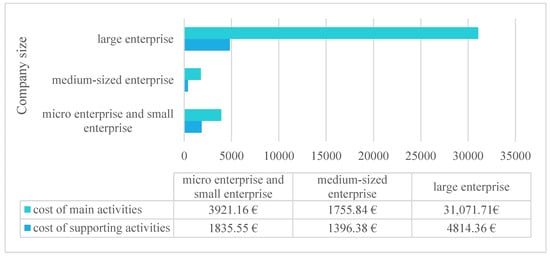
Figure 2.
Average cost of quality in core business and supporting business activities by company size.
As shown in Figure 2, the costs of core activities exceeded the costs of supporting activities in the analyzed businesses of all size categories. At the same time, costs of supporting activities were high in large companies over the period under review. Figure 1 also shows that the average cost of quality in micro and small enterprises was twice as high as in medium-sized enterprises. Large companies often have higher costs of supporting activities because they are usually more complex and extensive than smaller businesses. In addition, there may be more regulatory requirements for large companies to comply with, which requires high compliance and implementation costs. The investments in these activities would be quite high as they may require employment of skilled and qualified workers, the purchase of expensive software and hardware tools, payment for third party services, etc. Large businesses also often perform more extensive and complex operations that require administration and higher investment in supporting activities. In addition, the analysis of the average cost of quality showed that the average cost of quality in micro and small enterprises was two times higher than in medium-sized enterprises. This may be due to the fact that small enterprises do not have the same financial resources as large enterprises and, therefore, cannot spend that much on quality improvement. In addition, micro and small enterprises may be more dependent on manual labor, which may increase the cost of quality, as they depend on the skills and qualification of their workers.
Figure 3 shows in more detail the cost of quality in core business processes by enterprise size.

Figure 3.
Cost of quality assurance of core business processes by enterprise size.
The analysis of the cost of quality shown in Figure 3 confirmed that, in the enterprises of all three size categories, the most expensive investments in quality were made by the business sector during the production phase while, on the contrary, the lowest expenditure was noted in the post-production phase. The costs incurred by small and medium-sized enterprises were not significantly different, but it can be seen that micro and small enterprises invested more in quality in the period under review. The reason may be that quality costs in core business processes do not often increase proportionally with the size of the enterprise because the quality of a product or service may be of the same importance in small enterprises. Moreover, small and medium-sized enterprises often use similar processes and technologies as large enterprises, which means that they have similar costs of production processes. In some cases, it may even be more profitable for SMEs to invest in the quality of products or services to differentiate themselves from competitors and attract loyal customers. In addition, SMEs also face the same or similar regulatory requirements and quality criteria as large enterprises, which can increase the cost of quality of products or services. However, it should be noted that the cost of quality may be higher for micro-enterprises due to their limited resources. Even if they use similar processes as medium-sized enterprises, they may not have sufficient resources to achieve the level of quality similar to their larger competitors.
Analysis of the research dataset identified the costs incurred by companies operating in the engineering industry in 2022 for quality assurance in core business and supporting business processes. The next section focuses on testing of the proposed model for calculating the break-even point in core business and supporting business processes.
Analysis of the Break-Even Point in Core Business and Supporting Business Processes
The results in Table 2 and Table 3 show a significant dependence on costs in the production, post-production, and support phases. The costs of the pre-production phase were negligible; therefore, the subsequent analysis should be treated with caution. However, the other results were supported by the sufficient significance of costs in the profitability model.
Table 2.
Regression analysis residual values.
Table 3.
Regression analysis coefficients.
As seen in Table 2 and Table 3, in the third step, the quadratic dependence of profitability on individual costs is presented. All other costs were always set to the average value in the charts given in Figure 4a–d. In the charts, the X-axis shows the cost per employee and the respective activity, with the domain of the chart set to cover all available data. The Y-axis shows the predicted value of profit for given costs and activity and the average cost for other activities.
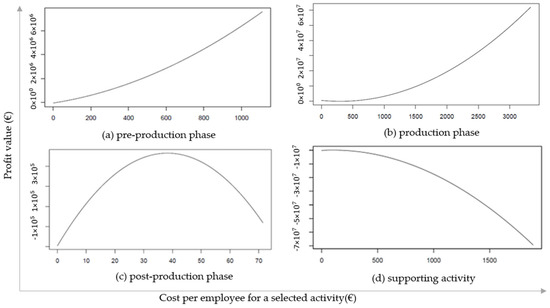
Figure 4.
Costs of the core business and supporting business processes: (a) pre-production phase (main activity); (b) production phase (main activity); (c) post-production phase (main activity); (d) supporting activity.
Following the cost analysis per employee and relevant activity presented in Figure 4, in the fourth step, the proposed added value calculation model successfully passed the robustness test. On the basis of the performed robustness test, the average absolute deviation of the model parameter, with the exclusion of one data point and using all the data, is presented below expressed as a percentage:
On the basis of the analysis, it was found that the parameter estimates were characterized by high robustness, but the third parameter, which represents the quadratic term of the pre-production stage, was identified as the least robust. In the analysis, correlation with p-values of individual variables was detected. The p-value of the variable reached a value of 0.73, which marked it as the significantly least important in the entire dataset. For the other parameters of the production and post-production phase of the main processes, as well as the parameter of the supporting processes, the test result confirmed the robustness of the given model.
Endogeneity. As part of the model testing, all variables were thoroughly checked. In the analysis, all phases of production were included, which excluded the possibility that the source of endogeneity was the non-inclusion of some variables. At the same time, given that profit was formed only after the realization of individual investments in production included in the model, simultaneity in relation to profit as a source of endogeneity was also unlikely. Therefore, the profit could not retroactively influence the previous investments. Given that our data were measured without errors, we can assume that our model did not have endogeneity problems, such as in the models of the relationship between CFP (corporate financial performance) and CSP (corporate social responsibility). Therefore, on the basis of the verification of the model and the observed results from Figure 4a–d, we answered the established 2 research question and 2 hypotheses:
Research question 1. Where is the break-even point in core business processes in terms of marginal cost of quality?
The pre-production phase (Figure 4a) did not show a break-even point and did not highly affect profit. This is due to the fact that this activity did not involve the direct production of a final product or the delivery of a service, but rather was focused on the preparation, planning, and organization of the production process, which is essential for successful production. As a rule, pre-production represents a small part of a company’s overall cost budget; thus, even if extensive resources are invested in this process, changes in the overall financial balance may not be visible. In addition, if pre-production improvements are made gradually and continuously, they may be distributed over time and, therefore, may not lead to an immediate break-even point. Moreover, pre-production improvements may have more far-reaching consequences in the future, for example, improved product quality or higher production efficiency, which may only become apparent at later production phases. In general, a break-even point usually occurs where a major factor influencing process performance changes or where there are significant obstacles to the continuation of the current trend. The pre-production process does not typically meet these conditions; hence, a break-even point may not occur here.
The production phase (Figure 4b) did not show a break-even point, either. It can thus be concluded that the cost of production activity per employee increases with the profit earned. This result can be explained by the fact that production changes or changes in the cost of production may not affect the overall profit. There are cases where the production process is so efficient that production costs remain stable, and profits will increase with the increasing output. In such cases, break-even point is not reached, and the company may continuously improve its business results without significant changes in the production process. However, in practice, most production processes show a break-even point as higher production output usually involves higher costs and revenues.
The post-production phase (Figure 4c) showed a break-even point of EUR 38 per employee. The break-even point in the post-production activity is influenced by various factors such as labor costs, raw materials and supplies, energy costs, tax burdens, inflation, and market competition. Post-production may show a break-even point because the cost of production may increase as the volume of production and sales increase. If sales revenue increases faster than the cost of production, the company’s profit grows as well. In such a situation, the break-even point in the post-production phase can be elevated because the company can afford to invest more in the post-production phase to improve it. This may lead to improvement in product quality or increase in production efficiency, which could increase profits even more.
Research question 2. Where is the break-even point in supporting business processes in terms of marginal cost of quality?
Supporting activity (Figure 4d) were analyzed based on the research question 2 The cost of supporting activities showed a break-even point at EUR 95 per employee. The break-even point in supporting business processes occurs when the growth in sales revenue exceeds the growth in supporting activity costs. This means that the faster sales grow, the smaller the volume of sales is needed to cover support costs and the faster the break-even point is reached. On the other hand, if the costs of supporting activities grow faster than sales, it may have a negative impact on the break-even point, and the company will have to implement a higher volume of sales to cover these costs and make a profit.
On the basis of the results of the quantitative research, it can be concluded that the proposed model can be considered explanatory and meaningful when looking for a break-even point and calculating the amount of profit per employee generated in core business and supporting business processes in the engineering sector.
Furthermore, the results confirmed the well-known fact that large enterprises spend the highest costs on the quality of the production phase for several reasons. First, large enterprises usually produce a high volume of goods, which requires investment in automation and technology advance. These technologies usually involve quality control, which can be more expensive due to the need to invest in special equipment and software. Second, large enterprises often produce goods that need to meet high quality and safety standards to be competitive in the market. This may require investments in quality certification, training and certification of employees, or the development of new processes in order to meet the stringent standards. Lastly, large companies may be responsible for quality assurance throughout their supply chain, which can be challenging and costly. They need to make sure that contractors and subcontractors deliver high-quality raw materials and components to ensure the quality of the final product. All these factors may incur higher costs of quality in the production phase for large companies. However, these costs are often necessary to remain competitive in the market and protect the company’s brand and reputation.
The research conducted did not confirm the hypothesis 1 stating that, in the production phase, core business processes generate higher added value compared to the pre-production and post-production phase. There are several factors contributing to this finding:
Complexity of processes. Core business processes can be more complex and difficult to manage in the production phase, which may impact the resulting added value. In contrast, processes in the pre-production and post-production phases can be optimized in order to achieve greater efficiency.
Synergy and coordination. Collaboration between various phases can lead to synergy and improvements that could compensate for the differences in the generation of added value.
Unforeseen influence of other variables. Factors or variables whose existence has not been considered or expected may also influence the relationship between the core business activities and added value in various phases.
These factors suggest that the relationship between processes and added value may be much more complex than previously expected. These factors need to be taken into account in the interpretation of the results and in further research in this field.
The hypothesis 2 stating that core business processes generate higher added value than supporting processes was not confirmed. This could be explained by the fact that, in the context of quality management, the importance of supporting processes was underestimated. It can be assumed that, within previous research, supporting processes were not paid sufficient attention in terms of the overall added value in the context of quality management. Given that quality (control and prevention) activities are usually part of supporting processes, these processes may play a key role in ensuring the optimal functioning of core processes. As a result, they can contribute to the overall value of the business.
4. Conclusions
At this stage, implications for theoretical development and practical implications of the presented study were identified, which can help to expand the knowledge base on the importance of business process quality for generating added value and improving the reputation of companies in low-carbon sectors of economy.
In general, the connection of an integrated approach and the perception of objective and subjective quality and reputation represent new and promising perspectives on the importance of business process quality in a low-carbon transformation era. This holistic approach allows focusing on and managing business processes more efficiently with regard to their environmental impact and social responsibility, providing an opportunity for scientists and industry to achieve sustainable development and create value not only for businesses but also for the society as a whole.
4.1. Theoretical Implications
The importance of corporate process quality in low-carbon economy lies in their ability to generate added value and improve a company’s reputation. Actively monitoring and improving both subjective and objective quality enables companies to better understand and satisfy customer demand, establish permanent partnership, and strengthen their position in the market. Improvement of business processes as a key component of objective quality is based on measurable data, analytical methods, and a systematic approach to identifying and correcting deficiencies. Achieving high standards of objective quality contributes to maintaining a good reputation of companies.
Since quality is a dynamic concept that changes and evolves over time, it is now becoming clear that the assessment of process quality includes maintaining performance standards, as well as considering environmental aspects throughout the production process. Therefore, the research goal of this paper was to analyze the impact of the quality of the core and supporting business processes on the creation of added value in industrial engineering companies operating in the low-carbon economy in the Czech Republic.
The proposed linear model was used to analyze the break-even point in core and supporting business processes. Specifically, the analysis was focused on determining how the core business processes in the pre-production, production, and post-production phases and the supporting qualitative processes show a break-even point and influence achieving profit.
According to the analysis of endogeneity, it was found that the profit did not have a direct impact on the analyzed variables of individual phases in the analyzed period, as it was generated only after the completion of the entire production process. Therefore, it was possible to consider the profit (generated added value) as the result of the investment in the improvement of processes from the previous year.
The highest profit was generated by supporting qualitative processes. This can be explained by the fact that the optimization and improvement of these supporting qualitative processes have a direct positive impact on the efficiency and effectiveness of core processes. Therefore, it is important to pay attention and invest in improving both core and supporting processes, as their qualitative improvement can have a significant impact on the performance of companies and the achievement of higher profits.
It was also shown that investments in process improvement, which often include the introduction of sustainable and environmentally responsible solutions, are linked to CSR (corporate social responsibility) and to CFP (corporate financial performance). These solutions may mean higher costs in the short term; however, in the long term, they can bring savings while increasing the value and reputation of the brand in the eyes of consumers and shareholders. The implementation of these solutions supports responsible business, which creates a more optimal working environment, minimizes the environmental impact, and contributes to the long-term sustainability of the company.
The results of this research indicate that an integrated approach to improving the quality of business processes allows companies to generate higher added value in the main and supporting processes, which positively affects the relationship among corporate social responsibility, the quality of business processes, and its financial performance.
4.2. Implications for Practice
The proposed theoretical model of the integrated approach to perceiving quality and reputation in the context of low-carbon economy (Appendix A Figure A1) may have practical applications for entrepreneurs and managers of industrial engineering companies in decision-making processes and implementation of measures to improve the quality of processes aimed at enhancing the reputation of the companies. If companies focus on improving the quality of their processes, this can have a positive impact on the environment and society as a whole. On the basis of the findings, the following can be concluded:
- Quality of business processes represents a complex concept that encompasses the compliance with performance standards, as well as considering environmental aspects of low-carbon nature throughout the production process.
- If a company achieves a high level of objective and subjective quality, it is often perceived by customers as reliable and professional, which significantly contributes to improving its reputation.
- Consistent and continuous pursuit of high standards in production processes (improvement of processes) is a key factor for achieving the high level of objective quality.
- In the transition to low-carbon economy, a paradigm shift related to the environmental aspect of corporate processes is necessary for industrial companies that try to achieve carbon neutrality.
For companies operating in industrial sectors and seeking to reduce their carbon footprint by means of improving core and supporting business processes, the following recommendations can be made:
- Process evaluation and analysis of qualitative activities. A thorough evaluation and analysis of core and supporting business processes are recommended, as well as the identification of the areas where delays, quality defects, or inefficiencies are occurring. It is recommended to set clear goals and expected outcomes of process improvement and to focus on measurable indicators to assess the progress and success of the measures implemented.
- Optimization of workflow. It is recommended to analyze and optimize workflow in business processes, periodically determining whether the process flow is efficient and removing obstacles that disrupt the workflow. Moreover, companies should ensure appropriate employee qualification and training in the area of environmental sustainability and the importance of improving business processes. Employees should be motivated and involved in initiatives aimed at improving the environmental performance of the company.
- Implementation of energy efficient measures. Companies should explore the possibilities to reduce energy consumption within their processes. These possibilities can include the use of energy-efficient devices and technologies, effective energy management, and the use of renewable energy sources.
- Engagement in social and environmental activities. Companies engaged in social and environmental initiatives generate added value not only for customers but also business partners, the community, and the environment.
4.3. Limitations and Future Directions
Research limitations. One of the major limitations of this research consisted of the lack of detailed tracking of the costs of quality in relation to value creating processes in companies. In addition, there were concerns of the respondents regarding the reputational risk that companies could face when providing the required data on the cost of quality. Overall, it can be stated that quantitative research aimed at reaching a large dataset of companies in terms of quality is very time-consuming due to the specificities of the issue. In such research, however, it is necessary to consider the protection and anonymity of sensitive information in order to minimize the reputational risk for companies engaged in research.
One of the other limitations of the given research is the finding that there may be a delayed effect of the quality of business processes on the profit. Thus, the profit (or created added value) in the current phase can be the result of the previous activities of the company.
Potential for further research. In view of the identified limitations, it is advisable to focus further research on expanding the geographical coverage of the research sample and the comparison with other industries. Moreover, further research could focus on the long-term monitoring of industrial companies and the identification of best practices in improving the quality of corporate processes aimed at the transition to a low-carbon economy and enhancing the company´s reputation as a responsible and committed actor toward social responsibility.
These research activities could build on the presented work and contribute to the ambitious goal of the EU to become the first carbon-neutral continent by 2050.
Author Contributions
Conceptualization, J.S.; methodology, J.S. and Y.K.; software, J.S.; validation, J.S. and Y.K.; formal analysis, Y.K.; investigation, Y.K.; resources, Y.K.; data curation, J.S. and Y.K.; writing—original draft preparation, Y.K.; writing—review and editing, J.S.; visualization, Y.K.; supervision, J.S.; project administration, J.S.; funding acquisition, J.S. All authors have read and agreed to the published version of the manuscript.
Funding
This article is one of the partial outputs of the currently solved research grant IVS no. IVSUPS2302 funded by the Institute of Technology and Business in Ceske Budejovice.
Data Availability Statement
Not applicable.
Conflicts of Interest
The authors declare no conflict of interest.
Appendix A
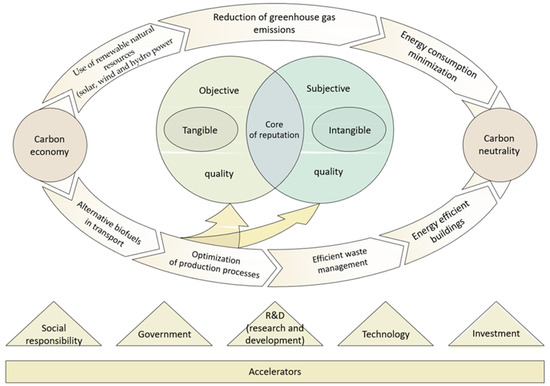
Figure A1.
Integrated approach to the perception of quality and reputation in a low-carbon economy.
References
- Guan, Z.; Zhao, Y.; Wang, X. Design pragmatic method to low-carbon economy visualisation in enterprise systems based on big data. Enterp. Inf. Syst. 2022, 16, 1334–1357. [Google Scholar] [CrossRef]
- Kowalska, K.; Szyja, P. Eco-innovations in Network Relationships of Enterprises for a Low-carbon Economy. In Proceedings of the Hradec Economic Days, Hradec Kralove, Czech Republic, 2–3 April 2020. [Google Scholar]
- Turjak, S.; Kristek, I. Transition towards low carbon economy in the European union and cee countries. In Proceedings of the 11th International Odyssey Conference on Economics and Business, Zagreb, Croatia, 16–20 June 2020. [Google Scholar]
- Haas, C.; Jahns, H.; Kempa, K.; Moslener, U. Deep uncertainty and the transition to a low-carbon economy. Energy Res. Soc. Sci. 2023, 100, 103060. [Google Scholar] [CrossRef]
- Jiang, Y.; Asante, D.; Ampaw, E.M.; Zheng, Y. The effects of simmelian ties on innovation of low-carbon technology: A study of top managers’ environmental awareness and stakeholder pressure in China. Environ. Sci. Pollut. Res. 2023, 30, 6716–6729. [Google Scholar] [CrossRef]
- Lagrosen, S. Quality management and environment: Exploring the connections. Int. J. Qual. Reliab. Manag. 2007, 24, 333–346. [Google Scholar] [CrossRef]
- Farooq, M.A.; Kirchain, R.; Novoa, H.; Araujo, A. Cost of quality: Evaluating cost-quality trade-offs for inspection strategies of manufacturing processes. Int. J. Prod. Econ. 2017, 188, 156–166. [Google Scholar] [CrossRef]
- Daunoriene, A.; Staniskiene, E. The Quality Costs Assessment in the Aspect of Value Added Chain. Qual. Innov. Prosper. 2016, 20, 119–144. [Google Scholar] [CrossRef]
- Zhang, Q.; Pan, Q. Discussion on value-added cost management model. In Proceedings of the International Forum of Knowledge as a Service, Xiamen, China, 12–14 April 2010. [Google Scholar]
- Schiffauerova, A.; Thomson, V. A review of research on cost of quality models and best practices. Int. J. Qual. Reliab. Manag. 2006, 23, 647–669. [Google Scholar] [CrossRef]
- Tsai, W.H.; Hsu, W. A novel hybrid model based on DEMATEL and ANP for selecting cost of quality model development. Total Qual. Manag. Bus. Excell. 2010, 21, 439–456. [Google Scholar] [CrossRef]
- Kostiuk, Y. Influence of Quality on Manufacturing Processes in Enterprises from the Perspective of Generating Value Added. J. Financ. Bank. Rev. 2022, 6, 1–17. [Google Scholar] [CrossRef]
- Pollák, F.; Markovič, P.; Vavrek, R.; Konečný, M. Return to the New Normal: Empirical Analysis of Changes in E-Consumer Behavior during the COVID-19 Pandemic. Behav. Sci. 2022, 12, 85. [Google Scholar] [CrossRef]
- Wikaningrum, T.; Ghozali, I.; Nurcholis, L.; Widodo; Nugroho, M. Strategic Partnership: How Important for Reputation of Small and Medium Enterprise? Qual.-Access Success 2020, 21, 35–39. [Google Scholar]
- Liu, X.; Ma, L. Sustainable Development of Business Economy Based on Big Data Algorithm under the Background of Low-Carbon Economy. Sustainability 2023, 15, 5840. [Google Scholar] [CrossRef]
- Hamrol, A.; Kujawińska, A.; Bozek, M. Quality inspection planning within a multistage manufacturing process based on the added value criterion. Int. J. Adv. Manuf. Technol. 2020, 108, 1399–1412. [Google Scholar] [CrossRef]
- Dereli, T.; Baykasoglu, A.; Das, G.S. Fuzzy quality-team formation for value added auditing: A case study. J. Eng. Technol. Manag. 2007, 24, 366–394. [Google Scholar] [CrossRef]
- Ramudhin, A.; Alzaman, C.; Bulgak, A.A. Incorporating the cost of quality in supply chain design. J. Qual. Maint. Eng. 2008, 14, 71–86. [Google Scholar] [CrossRef]
- Setijono, D.; Dahlgaard, J.J. The value of quality improvements. Int. J. Qual. Reliab. Manag. 2008, 25, 292–312. [Google Scholar] [CrossRef]
- Xu, C.; Jing, Y.; Shen, B.; Zhou, Y.; Zhao, Q.Q. Cost-sharing contract design between manufacturer and dealership considering the customer low-carbon preferences. Expert Syst. Appl. 2023, 213, 118877. [Google Scholar] [CrossRef]
- Zhu, Y.; Zhang, J.; Duan, C. How does green finance affect the low-carbon economy? Capital allocation, green technology innovation and industry structure perspectives. Econ. Res. 2023, 36, 2110138. [Google Scholar] [CrossRef]
- Soviar, J.; Holubcik, M.; Vodak, J.; Rechtorik, M.; Pollak, F. The Presentation of Automotive Brands in the On-Line Environment—The Perspective of KIA, Peugeot, Toyota and VW in the Slovak Republic. Sustainability 2019, 11, 2132. [Google Scholar] [CrossRef]
- Yang, Z.; Lu, J.P. Development and characteristics of industrial ecological economy under the background of low carbon economy. J. Environ. Prot. Ecol. 2020, 21, 2422–2430. [Google Scholar]
- OECD. Accelerating the Development and Diffusion of Low-Emissions Innovations. Available online: https://www.oecd.org/sd-roundtable/papersandpublications/Accelerating%20the%20development%20and%20diffusion%20of%20low-emissions%20innovations.pdf (accessed on 12 May 2022).
- Dzikuc, L.; Dzikuc, M. The Analysis of Low-carbon Development of Czech Republic Economy. In Proceedings of the Hradec Economic days, Hradec Kralove, Czech Republic, 2–3 April 2020. [Google Scholar]
- Hampton, S.; Blundel, R.; Wahga, A.; Fawcett, T.; Shaw, C. Transforming small and medium-sized enterprises to address the climate emergency: The case for values-based engagement. Corp. Soc. Responsib. Environ. Manag. 2022, 29, 1424–1439. [Google Scholar] [CrossRef]
- Wang, J.; Zhou, Y.; Cooke, F.L. Low-carbon economy and policy implications: A systematic review and bibliometric analysis. Environ. Sci. Pollut. Res. 2022, 29, 65432–65451. [Google Scholar] [CrossRef] [PubMed]
- Liu, P.; Qin, Y.; Luo, Y.; Wang, X.; Guo, X. Structure of low-carbon economy spatial correlation network in urban agglomeration. J. Clean. Prod. 2023, 394, 136359. [Google Scholar] [CrossRef]
- Pollak, F.; Vodak, J.; Soviar, J.; Markovic, P.; Lentini, G.; Mazzeschi, V.; Lue, A. Promotion of Electric Mobility in the European Union—Overview of Project PROMETEUS from the Perspective of Cohesion through Synergistic Cooperation on the Example of the Catching-Up Region. Sustainability 2021, 13, 1545. [Google Scholar] [CrossRef]
- Gong, Z.; Guo, K.; He, X. Corporate Social Responsibility Based on Radial Basis Function Neural Network Evaluation Model of Low-Carbon Circular Economy Coupled Development. Complexity 2021, 2021, 11. [Google Scholar] [CrossRef]
- Pollak, F.; Markovic, P.; Majduchova, H. Reputation of Electric Vehicles in the Environment of Carbon Reduction and Accelerated Digitization. Energies 2023, 16, 3836. [Google Scholar] [CrossRef]
- Zhang, J.; Lyu, Y.; Li, Y.; Geng, Y. Digital economy: An innovation driving factor for low-carbon development. Environ. Impact Assess. Rev. 2022, 96, 106821. [Google Scholar] [CrossRef]
- Odriozola, M.D.; Baraibar-Diez, E. Is Corporate Reputation Associated with Quality of CSR Reporting? Evidence from Spain. Corp. Soc. Responsib. Environ. Manag. 2017, 24, 121–132. [Google Scholar] [CrossRef]
- Vilagi, R.; Konecny, M.; Ruschak, M. Impact of selected financial indicators on a company’s reputation. Entrep. Sustain. Issues 2022, 10, 408–417. [Google Scholar] [CrossRef]
- Strakova, J.; Rajiani, I.; Partlova, P.; Vachal, J.; Dobrovic, J. Use of the Value Chain in the Process of Generating a Sustainable Business Strategy on the Example of Manufacturing and Industrial Enterprises in the Czech Republic. Sustainability 2020, 12, 1520. [Google Scholar] [CrossRef]
- Strakova, J.; Koraus, A.; Vachal, J.; Pollak, F.; Cernak, F.; Talir, M.; Kollmann, J. Sustainable Development Economics of Enterprises in the Services Sector Based on Effective Management of Value Streams. Sustainability 2021, 13, 8978. [Google Scholar] [CrossRef]
- Omachonu, V.K.; Suthummanon, S.; Einspruch, N.G. The relationship between quality and quality cost for a manufacturing company. Int. J. Qual. Reliab. Manag. 2004, 21, 277–290. [Google Scholar] [CrossRef]
- ASQ Quality management Division. Principles of Quality Costs: Financial Measures for Strategic Implementation of Quality Management, 4th ed.; Wood, D.C., Ed.; Quality Press: Milwaukee, WI, USA, 2013; 240p. [Google Scholar]
- Pajic, V.; Kilibarda, M. Cost of quality in distribution logistics. In Proceedings of the 4th Logistics International Conference, Belgrade, Serbia, 23–25 May 2019. [Google Scholar]
- Khataie, A.H.; Bulgak, A.A. A cost of quality decision support model for lean manufacturing: Activity-based costing application. Int. J. Qual. Reliab. Manag. 2013, 30, 751–764. [Google Scholar] [CrossRef]
- Xiaobing, L.; Fajing, C.; Qiunan, M.; Ruilin, P. Research on the model of quality cost in CIMS environment. In Proceedings of the International Seminar on Business and Information Management, Wuhan, China, 19 December 2008. [Google Scholar]
- Glogovac, M.; Filipovic, J. Quality costs in practice and an analysis of the factors affecting quality cost management. Total Qual. Manag. Bus. Excell. 2017, 29, 1521–1544. [Google Scholar] [CrossRef]
- Phillips, T.R.F.; Heaney, C.E.; Benmoufok, E.; Li, Q.; Hua, L.; Porter, A.E.; Chung, K.F.; Pain, C.C. Multi-Output Regression with Generative Adversarial Networks (MOR-GANs). Appl. Sci. 2022, 12, 9209. [Google Scholar] [CrossRef]
- Hamrol, A.; Gawlik, J.; Sładek, J. Mechanical engineering in industry 4.0. Manag. Prod. Eng. Rev. 2019, 10, 14–28. [Google Scholar]
- Licite, L.; Sebins, A. Challenges for the mechanical engineering and metalworking industry in Latvia. In Proceedings of the Economic Science for Rural Development 2018, Jeldava, Latvia, 9–11 May 2018. [Google Scholar]
- Štefko, R.; Vašaničová, P.; Jenčová, S.; Pachura, A. Management and Economic Sustainability of the Slovak Industrial Companies with Medium Energy Intensity. Energies 2021, 14, 267. [Google Scholar] [CrossRef]
Disclaimer/Publisher’s Note: The statements, opinions and data contained in all publications are solely those of the individual author(s) and contributor(s) and not of MDPI and/or the editor(s). MDPI and/or the editor(s) disclaim responsibility for any injury to people or property resulting from any ideas, methods, instructions or products referred to in the content. |
© 2023 by the authors. Licensee MDPI, Basel, Switzerland. This article is an open access article distributed under the terms and conditions of the Creative Commons Attribution (CC BY) license (https://creativecommons.org/licenses/by/4.0/).