Article

Study on Malfunction of OCR Due to Penetration of DER into Power Distribution System with SFCL

Department of Electrical Engineering, Soongsil University, 369, Sangdo-ro, Dongjak-gu, Seoul 156-743, Republic of Korea
*
Author to whom correspondence should be addressed.
Energies 2023, 16(17), 6137; https://doi.org/10.3390/en16176137
Submission received: 19 December 2022 / Revised: 18 January 2023 / Accepted: 24 January 2023 / Published: 23 August 2023

Abstract

:
Due to the demand for eco-friendly energy, distributed energy resources (DERs) using renewable energy have increased. The increase in DER has caused the power system to become more complex and caused problems in the protection system. Typical problems include an increase in fault current and a problem that causes malfunction of the overcurrent relay (OCR). If the fault current increases and exceeds the capacity of the existing protection devices, it may lead to a large blackout. The most effective way to limit the fault current is to install a superconducting current limiter (SFCL). The installation of SFCL and system penetration of DER both affect OCR operating characteristics. In this paper, a simulated power distribution system is constructed and OCR malfunctions caused by DER penetration and SFCL installation are analyzed.

1. Introduction

A policy to use decarbonized energy to cope with the problem of climate change is adopted. Accordingly, electricity-related companies are on the trend of reducing the proportion of existing power generation sources and increasing the proportion of distributed energy resources (DERs). Usually, DERs are located in a location rich in renewable resources, not around loads or power generation. Therefore, when the DERs are connected to the power distribution system, they cannot be connected to a desired location [1,2,3,4]. The operations of the existing installed over-current relays (OCRs) are affected according to the penetration positions of the DERs. A schematic diagram of a simulated power distribution system showing two cases among cases in which malfunction of OCRs may occur in a power distribution system penetrated with DERs is shown in Figure 1. The red line shown in the figure means the fault current generated by the main power source, and the yellow line means the fault current generated by the DER.
In Figure 1a, the OCR installed on the right feeder is set to operate at a low fault current. At this time, if a fault occurs, the fault current flows in the reverse direction, and the sensitively set OCR malfunctions due to this fault current. The malfunction of OCR in this case is called sympathetic tripping. In the fault situation in Figure 1b, CB12 operates as a main and CB11 operates as a backup. However, due to the penetration of DER, the fault current of CB12 operating as main increases and the fault current of CB11 operating as backup decreases. As a result, DER penetration increases the operating time of CB12 and decreases the operating time of CB11, increasing the coordination time interval (CTI) between the main protective relay and the backup protective relay. The malfunction of OCR in this case is called protection blinding of the backup relay [5,6,7,8].
If the fault current increases and exceeds the capacity of the existing equipment, the possibility of a large-scale blackout occurs. In addition, a section in which the fault current increases due to the increased penetration of the DER occurs, so a solution for this is needed. It has been announced through previous studies that a superconducting fault current limiter (SFCL) is a very effective solution to the fault current problem [9,10,11]. The SFCL has the advantage that it does not cause any loss because the resistance is zero within the normal condition. Additionally, SFCL has the advantage of limiting the fault current within 1/4 cycle but has the disadvantage of high maintenance cost. The fault current is limited by using a trigger-type SFCL that can improve the cost problem.
In this paper, a simulated power distribution system was designed for fault simulation to analyze the malfunction of the OCR caused by the penetration of DER. In addition, changes in OCR operation according to the application of SFCL were also analyzed. In previous studies, the trip time delay problem of OCR due to the installation of SFCL was analyzed. To solve this problem, a correction method using the voltage component of SFCL and a method using SFCL impedance correction have been proposed. However, the correction for the fault current contributed by the DER is not perfect [12,13]. In this paper, fault simulation was performed to analyze the type of fault current contributed by DER and its effect on OCR operation. All modeling and simulations used an electromagnetic transient analysis software power system called computer-aided design (PSCAD)/electromagnetic transient design and control (EMTDC). DER, OCR, and SFCL were modeled and applied to the simulated power distribution system using the PSCAD/EMTDC software (ver. 3.0) and a fault simulation was conducted and analyzed. An analysis was performed on two cases of OCR malfunctions that occurred depending on the penetration location of DER and the location where the fault occurred.

2. Modeling for The Fault Simulation

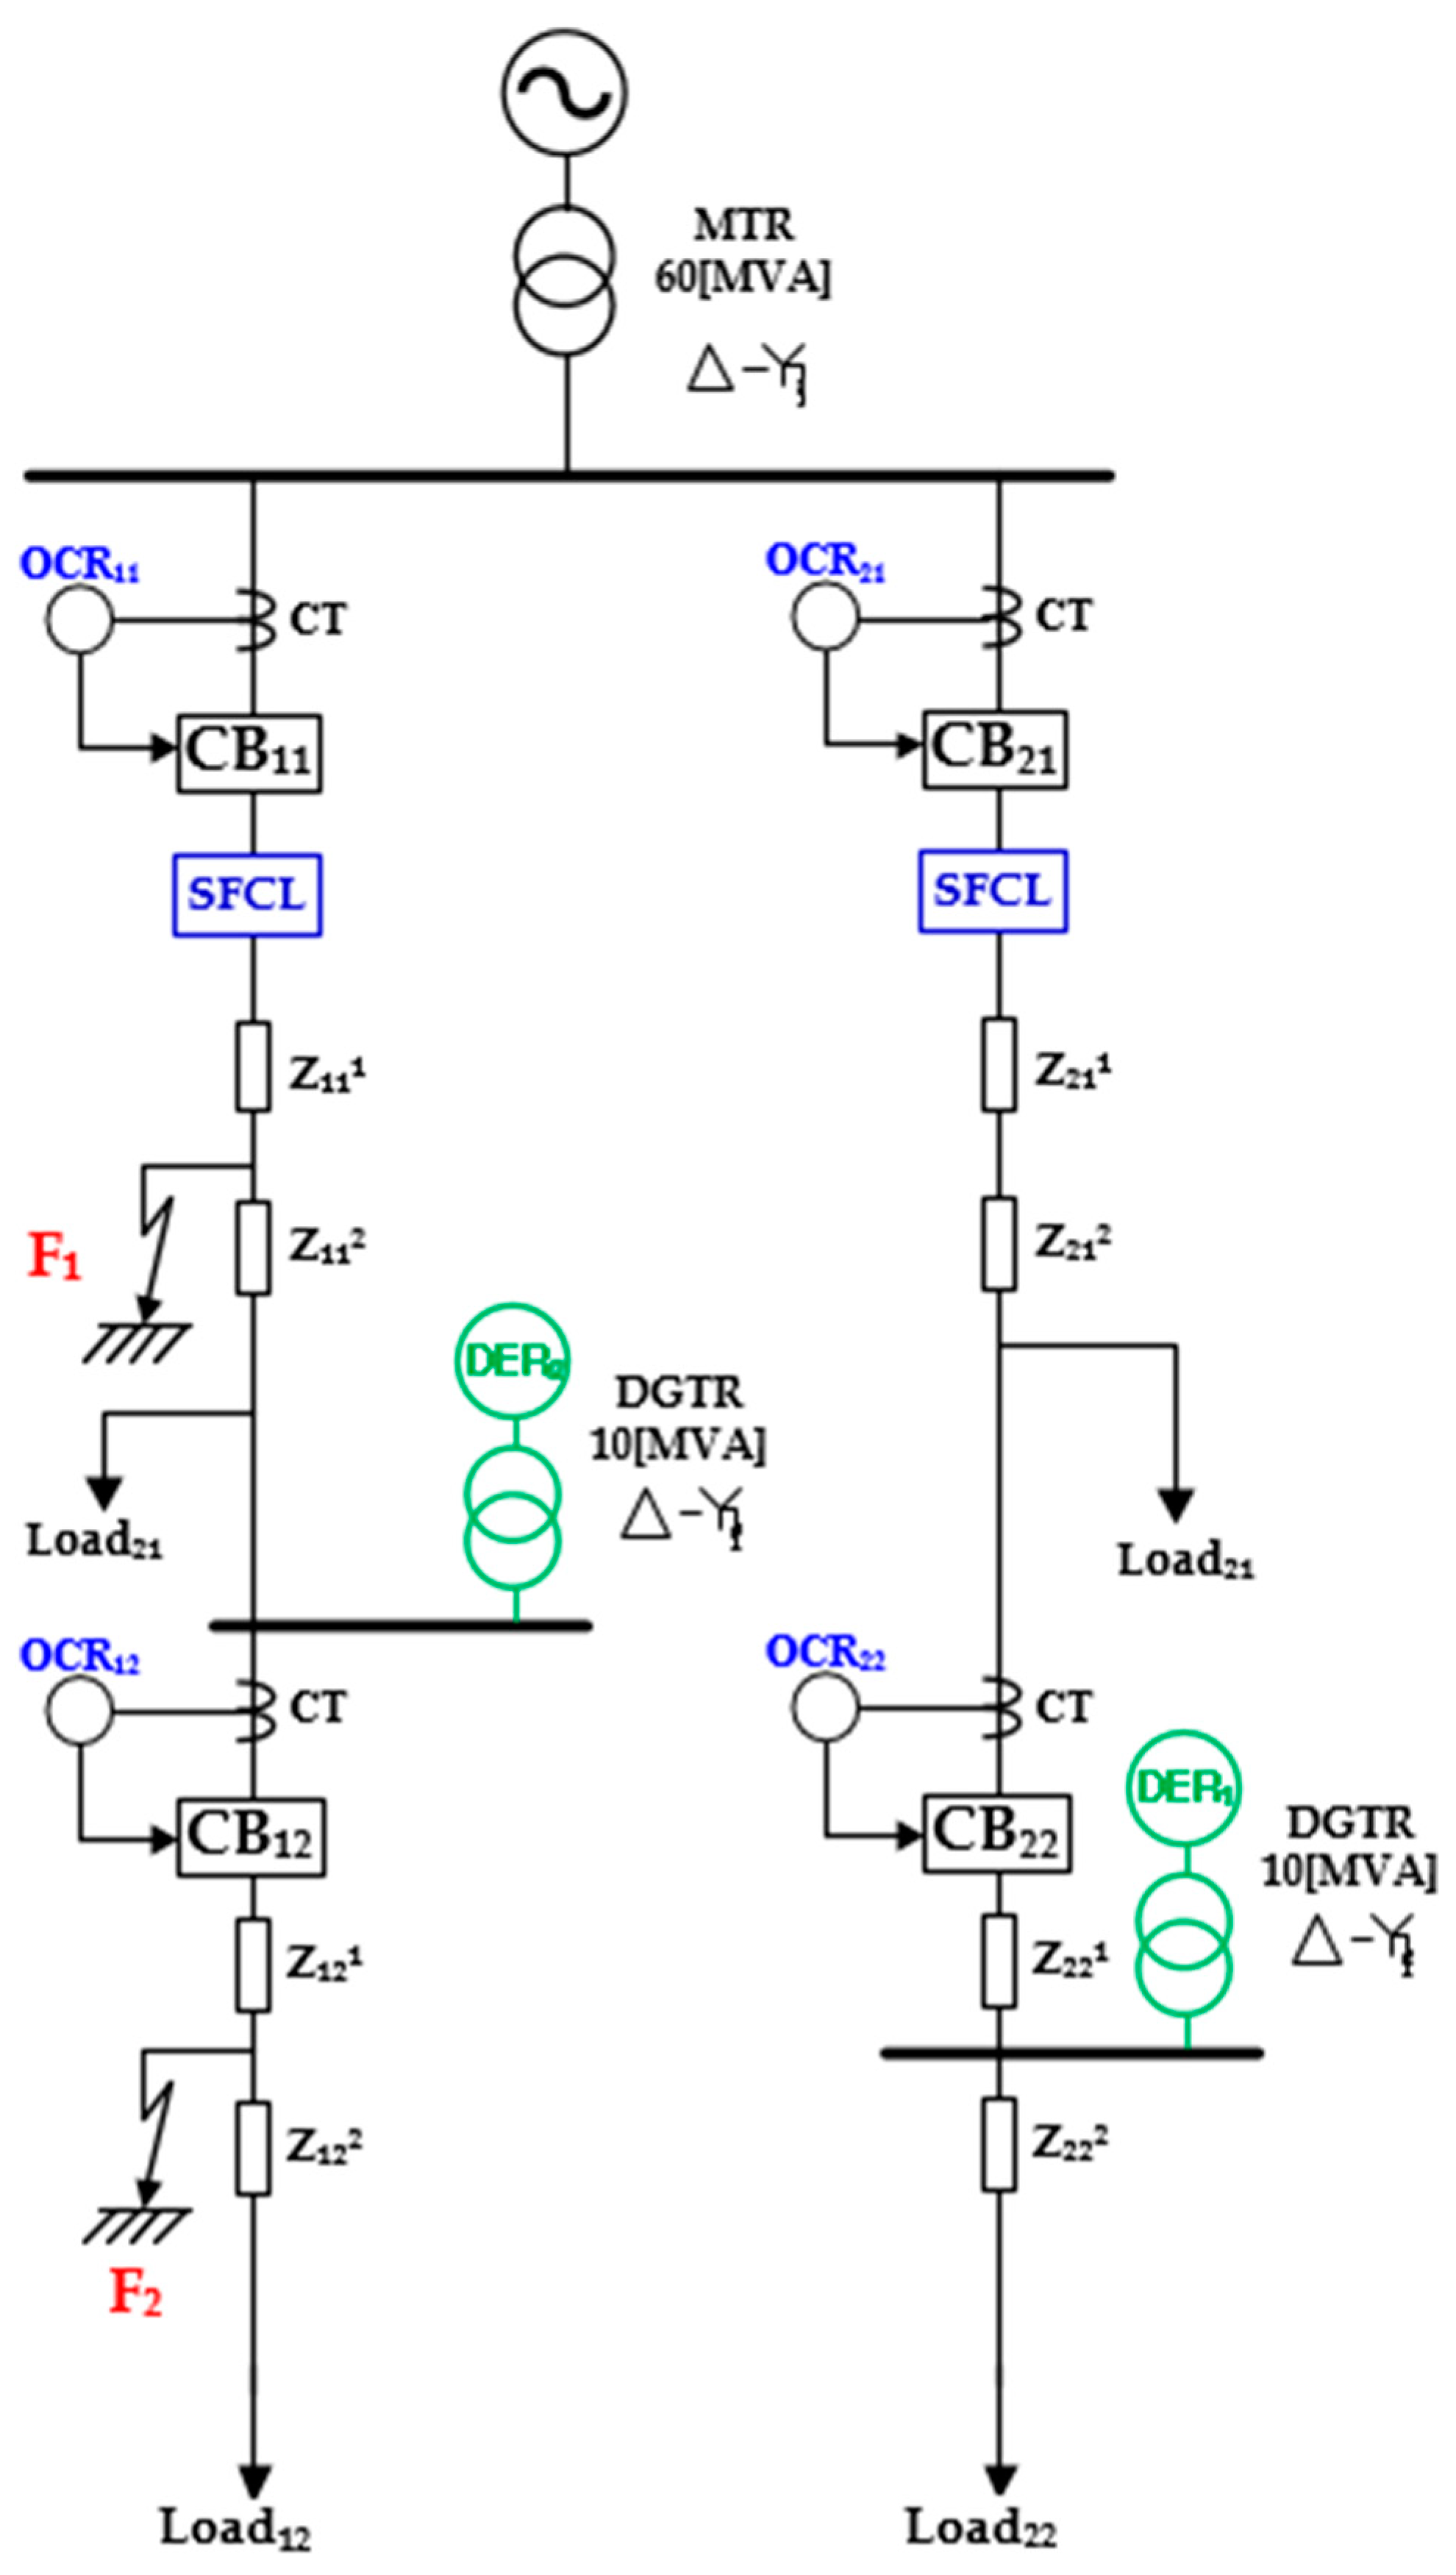
2.1. Simulated Power Distribution System Modeling

In this paper, malfunction situations of OCR according to DER penetration are analyzed. The simulated power distribution system in which SFCL and DER are connected is composed as shown in Figure 2. Sympathetic tripping of OCR during F1 fault and DER1 penetration is analyzed, and protection blinding is analyzed during F2 fault and DER2 penetration. The simulated power distribution system consists of one main power source and two feeder lines. The left feeder line is 10 km in total, and 5 MW of load is connected at every 5 km point. In addition, a circuit breaker and SFCL are installed at the feeder inlet. The right feeder line has the same configuration as the left feeder line. The first fault point F1 on the left feeder is 2.5 km away from the bus line, and the penetration location of DER1 on the right feeder is 5.5 km away from the bus line. The second fault point F2 on the left feeder is 7.5 km away from the bus line, and the penetration location of DER2 on the left feeder is 5 km away from the bus line. Faults that occurred in the simulation are triple line to ground (TLG) permanent faults. Parameters of simulated power distribution system were listed in Table 1.
For reference, the most frequently occurring fault is the single line-to-ground (SLG) fault. However, the SLG fault has a relatively small fault current and has a small impact on other protection devices. On the other hand, in the case of TLG, the frequency of occurrence is small, but the fault current is very large and the effect on other protection devices is also very large. In this paper, in order to identify the problem due to the fault, the problem caused by the occurrence of the TLG fault was analyzed.

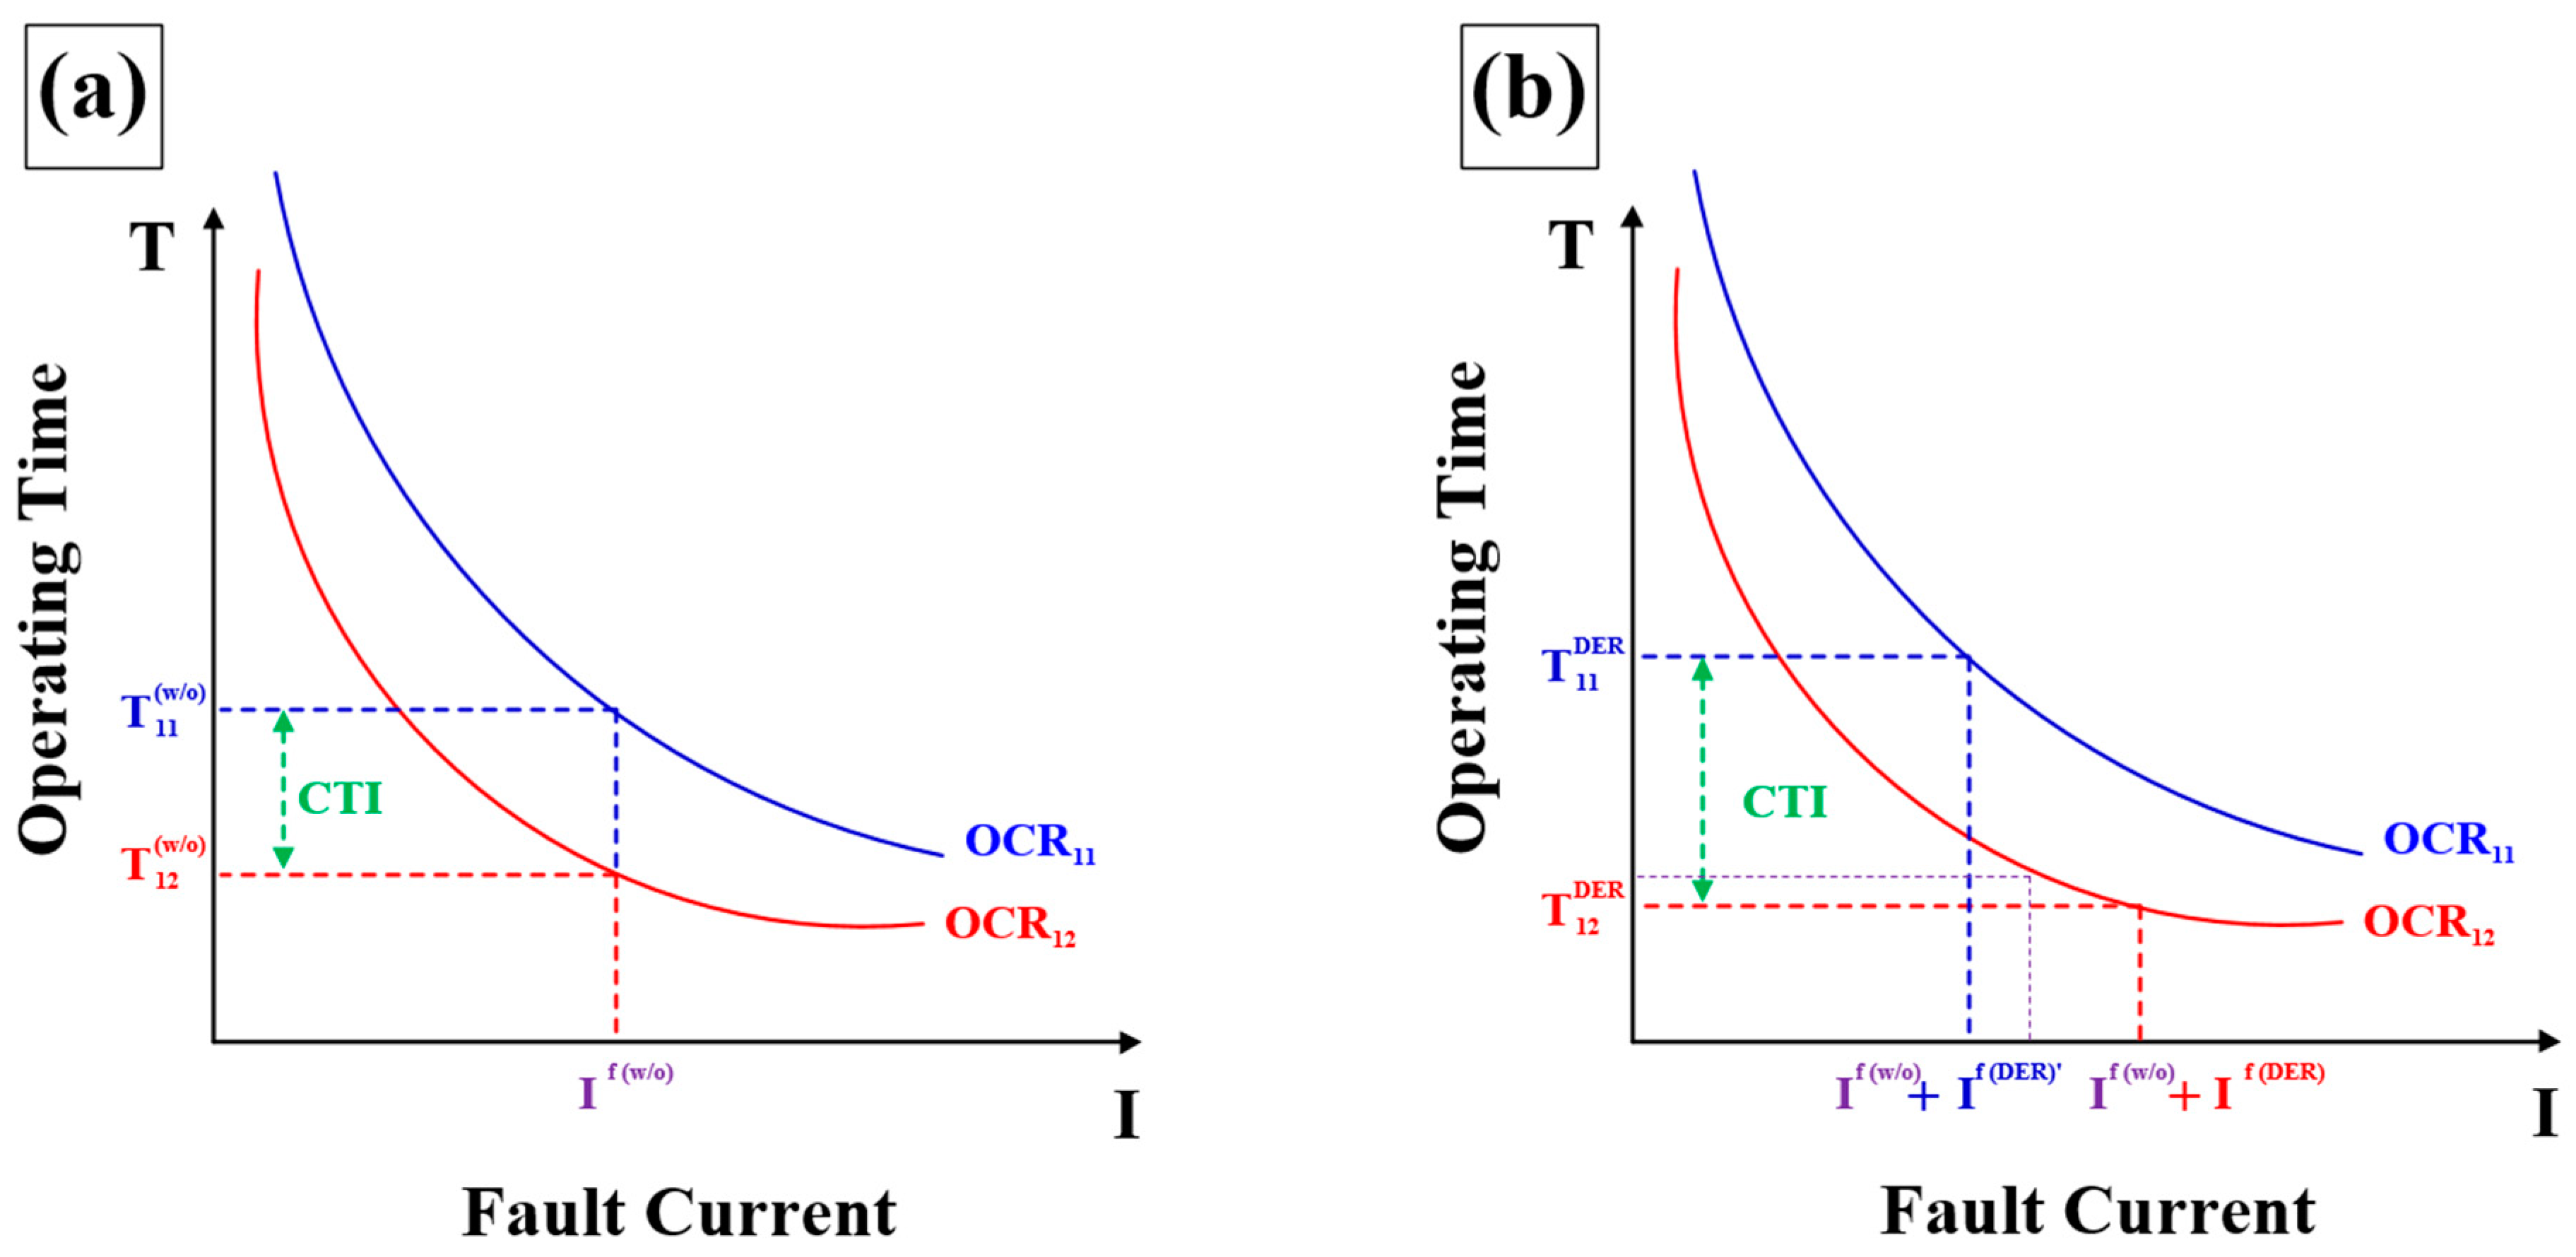
2.2. OCR’s Characteristic Equation Modeling

The OCR measures the current flowing through the circuit breaker (CB) through the current transformer (CT) and converts it into a symmetrical component and then uses the positive component as a relay element. The configuration diagram of CB, CT, and OCR applied to the simulation is shown in Figure 2. In addition, the OCR has inverse characteristics, and the characteristic equation is expressed as Equations (1) and (2). Additionally, the characteristic equation parameters applied to OCR for each section are shown in Table 2.
T t r i p = T D ( A M p 1 + B )
M = I f I p i c k u p
here, TD indicates a time dial, A, B and p are constants, and M indicates an operation indicator value. Additionally, If indicates line current, and Ipickup is the pickup current.
Using the time-current curve of OCR constructed as described above, the effect of DER penetration was briefly analyzed. The time-current curves of the sympathetic tripping case are shown in Figure 3. In the case where DER is not penetrated, it is shown in Figure 3a. When a fault occurs, CB11 operates, but CB22 does not operate, and the fault current flowing through CB22 is reduced rather than the usual state. However, as shown in Figure 3b, when DER is penetrated, the fault current contributed by the DER is added in addition to the existing fault current in each OCR. As a result, the sensitively set OCR of CB22 trips and malfunctions, resulting in sympathetic tripping, and the operating time of CB11 is also faster than before. As a result, unnecessary disconnection occurs in the load after CB22.
On the other hand, the time-current curves of the protection blinding case are shown in Figure 4. In Figure 4a, when DER is not penetrated, almost the same fault current flows in CB12 and CB11. Since CB12 is tripped, the fault current no longer flows, and the accumulation operation of CB11 operating as a backup also stops. If CB12 malfunctions and does not operate, CB12 operates as a backup to cut off the fault current. However, as shown in Figure 4b, when DER is penetrated, the fault current contributed to the DER and affects the existing OCR operation. CB12, which operates as the main, increases the total fault current due to the fault current component contributed by the DER, so the operation time is shortened. On the other hand, in CB11 operating as a backup, the total fault current is reduced due to the fault current contributed by the DER, so the operation time is delayed.

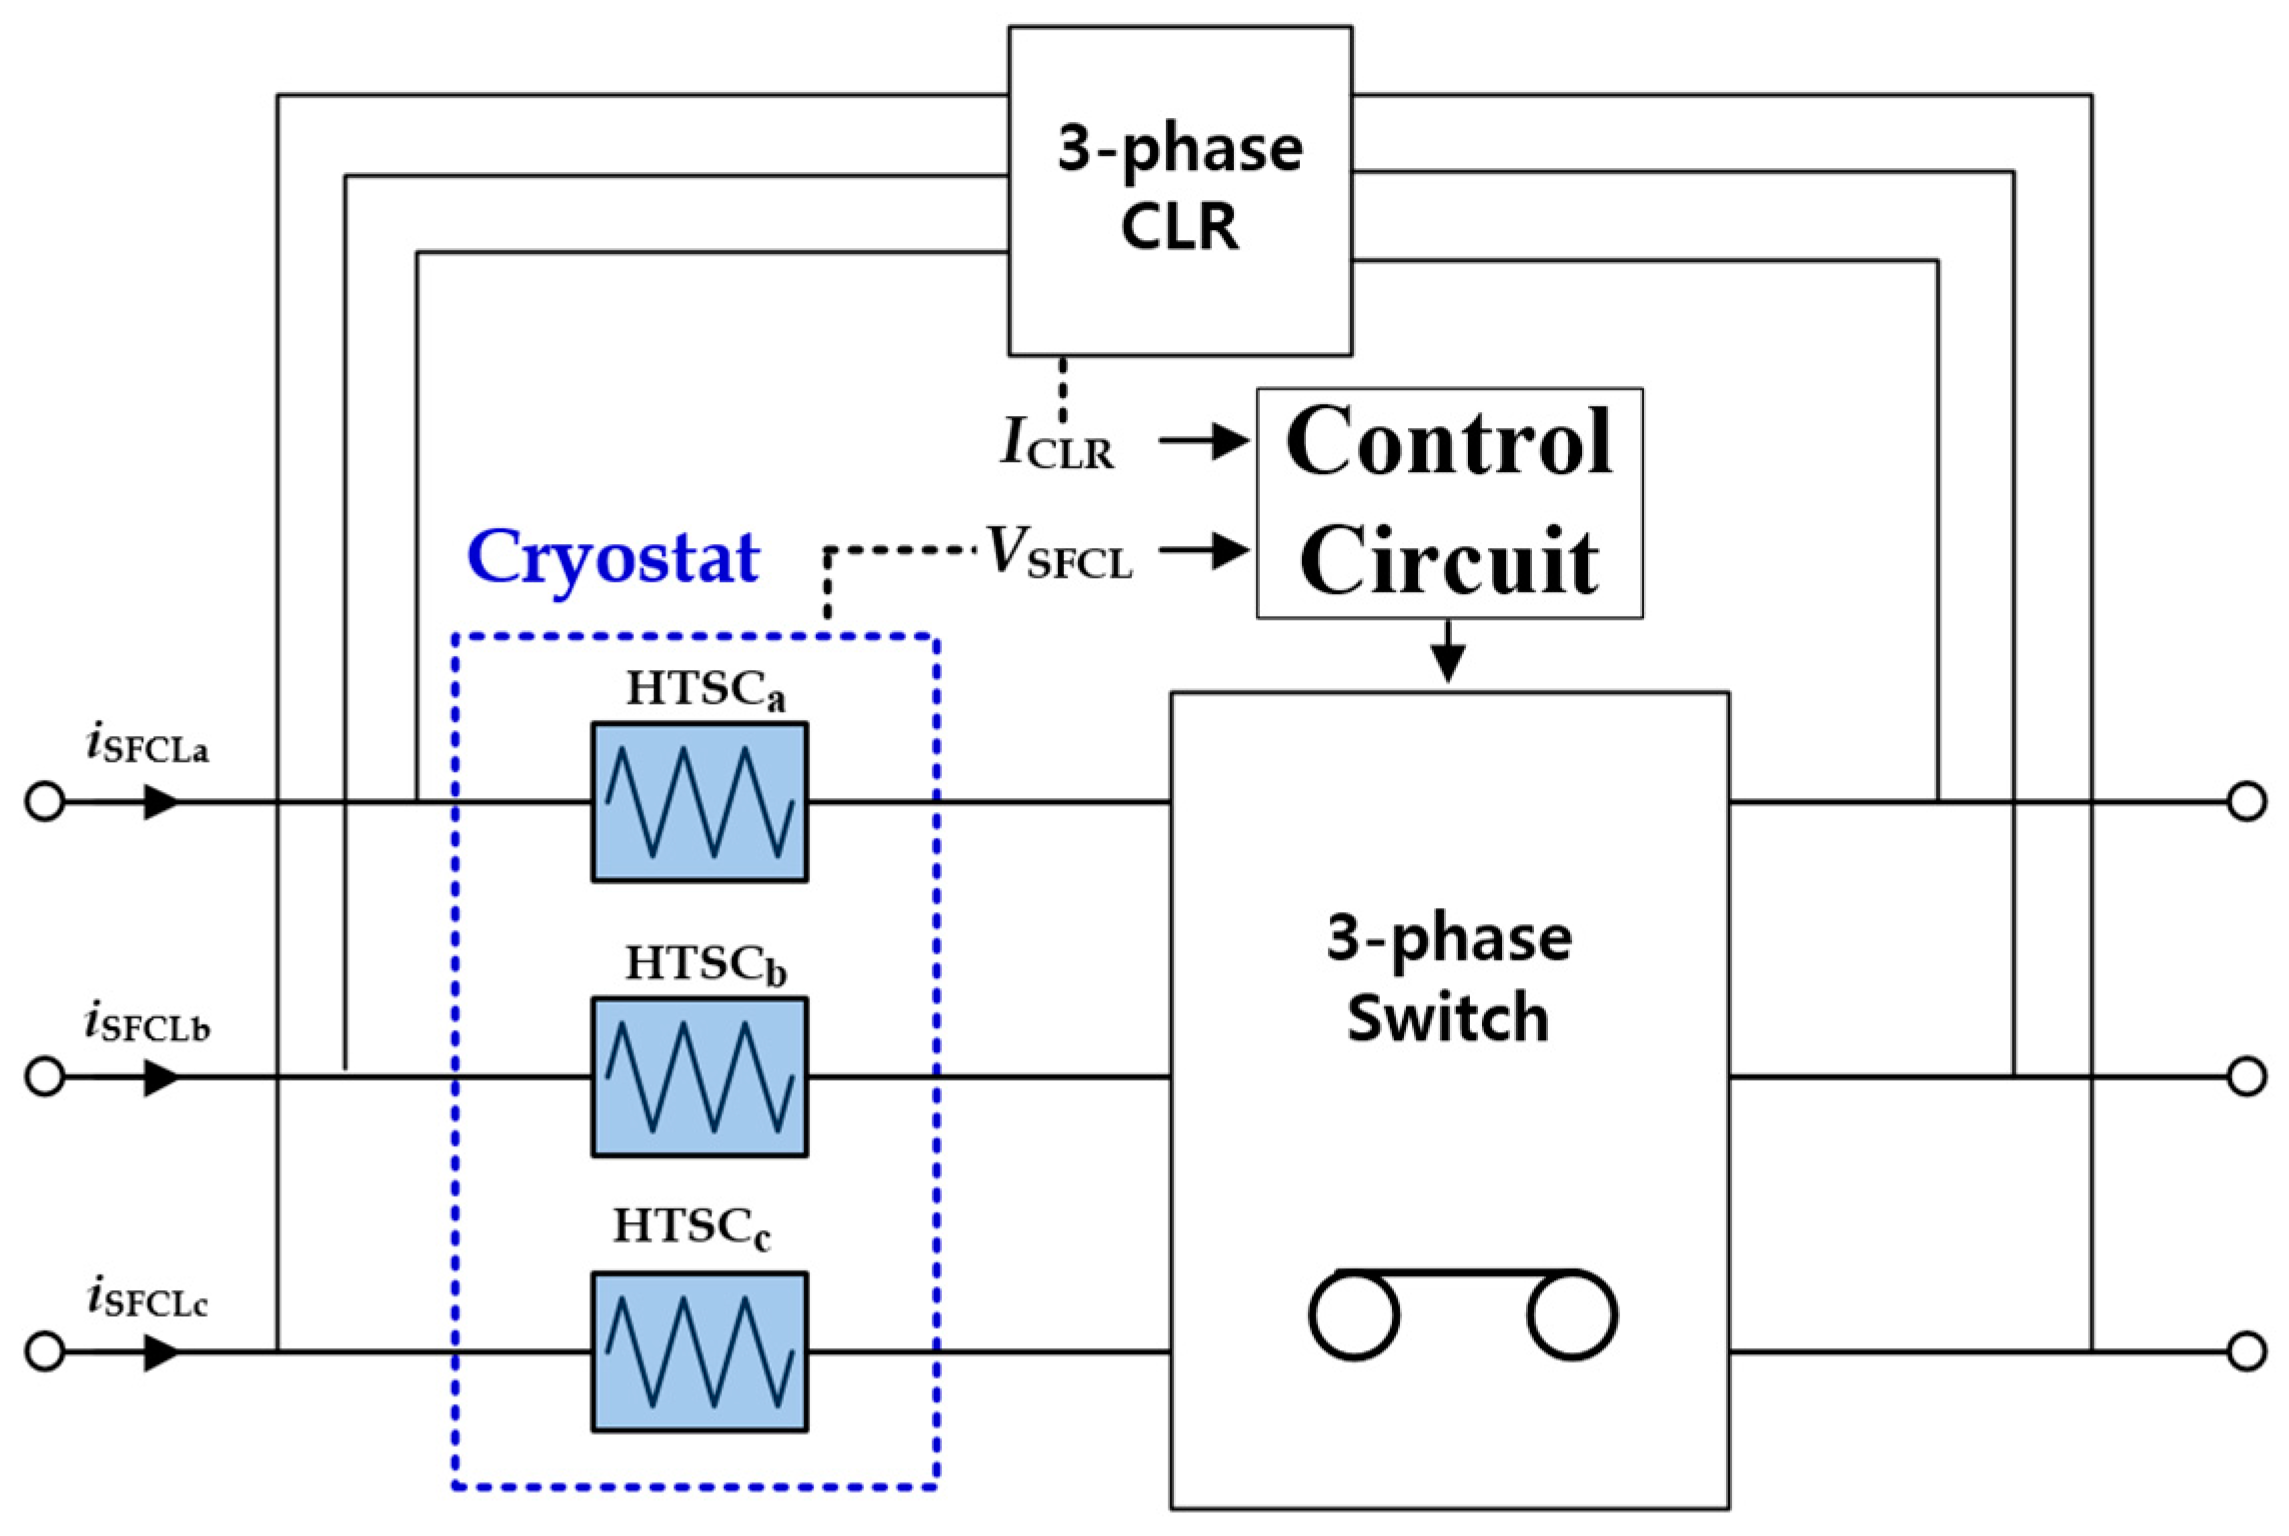
2.3. Trigger-Type SFCL Modeling

SFCL is one of the effective solutions to limit fault current. The advantage of SFCL is that it quickly limits the fault current within 1/4 cycle, and the normal loss is zero because the impedance is normally zero. In addition, there are various types of SFCL studied, so that the type can be selected according to the characteristics. In this paper, the trigger-type SFCL was selected as the SFCL to be modeled. The typical characteristic of trigger-type SFCL is economical. The High-TC superconductor (HTSC) included in the trigger-type SFCL is just used to detect a fault, and when a fault is detected and the set value (Vset) is exceeded, the switch (SW) is opened and the current is bypassed to the current limiting reactor (CLR). In addition, when the fault is removed and the current flowing through the CLR decreases below a certain value, the SW is closed and the SFCL state is reset. Trigger-type SFCL is economical compared to other types of SFCL by reducing the burden of expensive HTSC and increasing the burden of cheap CLR through this mechanism. The configuration diagram of trigger-type SFCL is shown in Figure 5 and related detailed parameters are shown in Table 3.

3. Simulation Results

The operation of the OCR was analyzed when faults occurred at the indicated fault location (F) and DER penetrates at the indicated connecting location through the simulated power distribution system constructed as shown in Figure 2. In the first scenario, the adjacent line OCR’s sympathetic tripping due to the TLG fault occurring at fault location F1 in the simulated power distribution system penetrated by DER1 is analyzed. In the second scenario, the protection blinding of the backup OCR due to the TLG fault occurring at fault location F2 in the simulated power distribution system penetrated by DER2 is analyzed. In addition, in each fault simulation, four cases are analyzed depending on whether SFCL and DER are installed to analyze the effect on SFCL installation and DER penetration. In addition, four cases are analyzed for each fault simulation to analyze the impact on SFCL installation and DER penetration as follows:
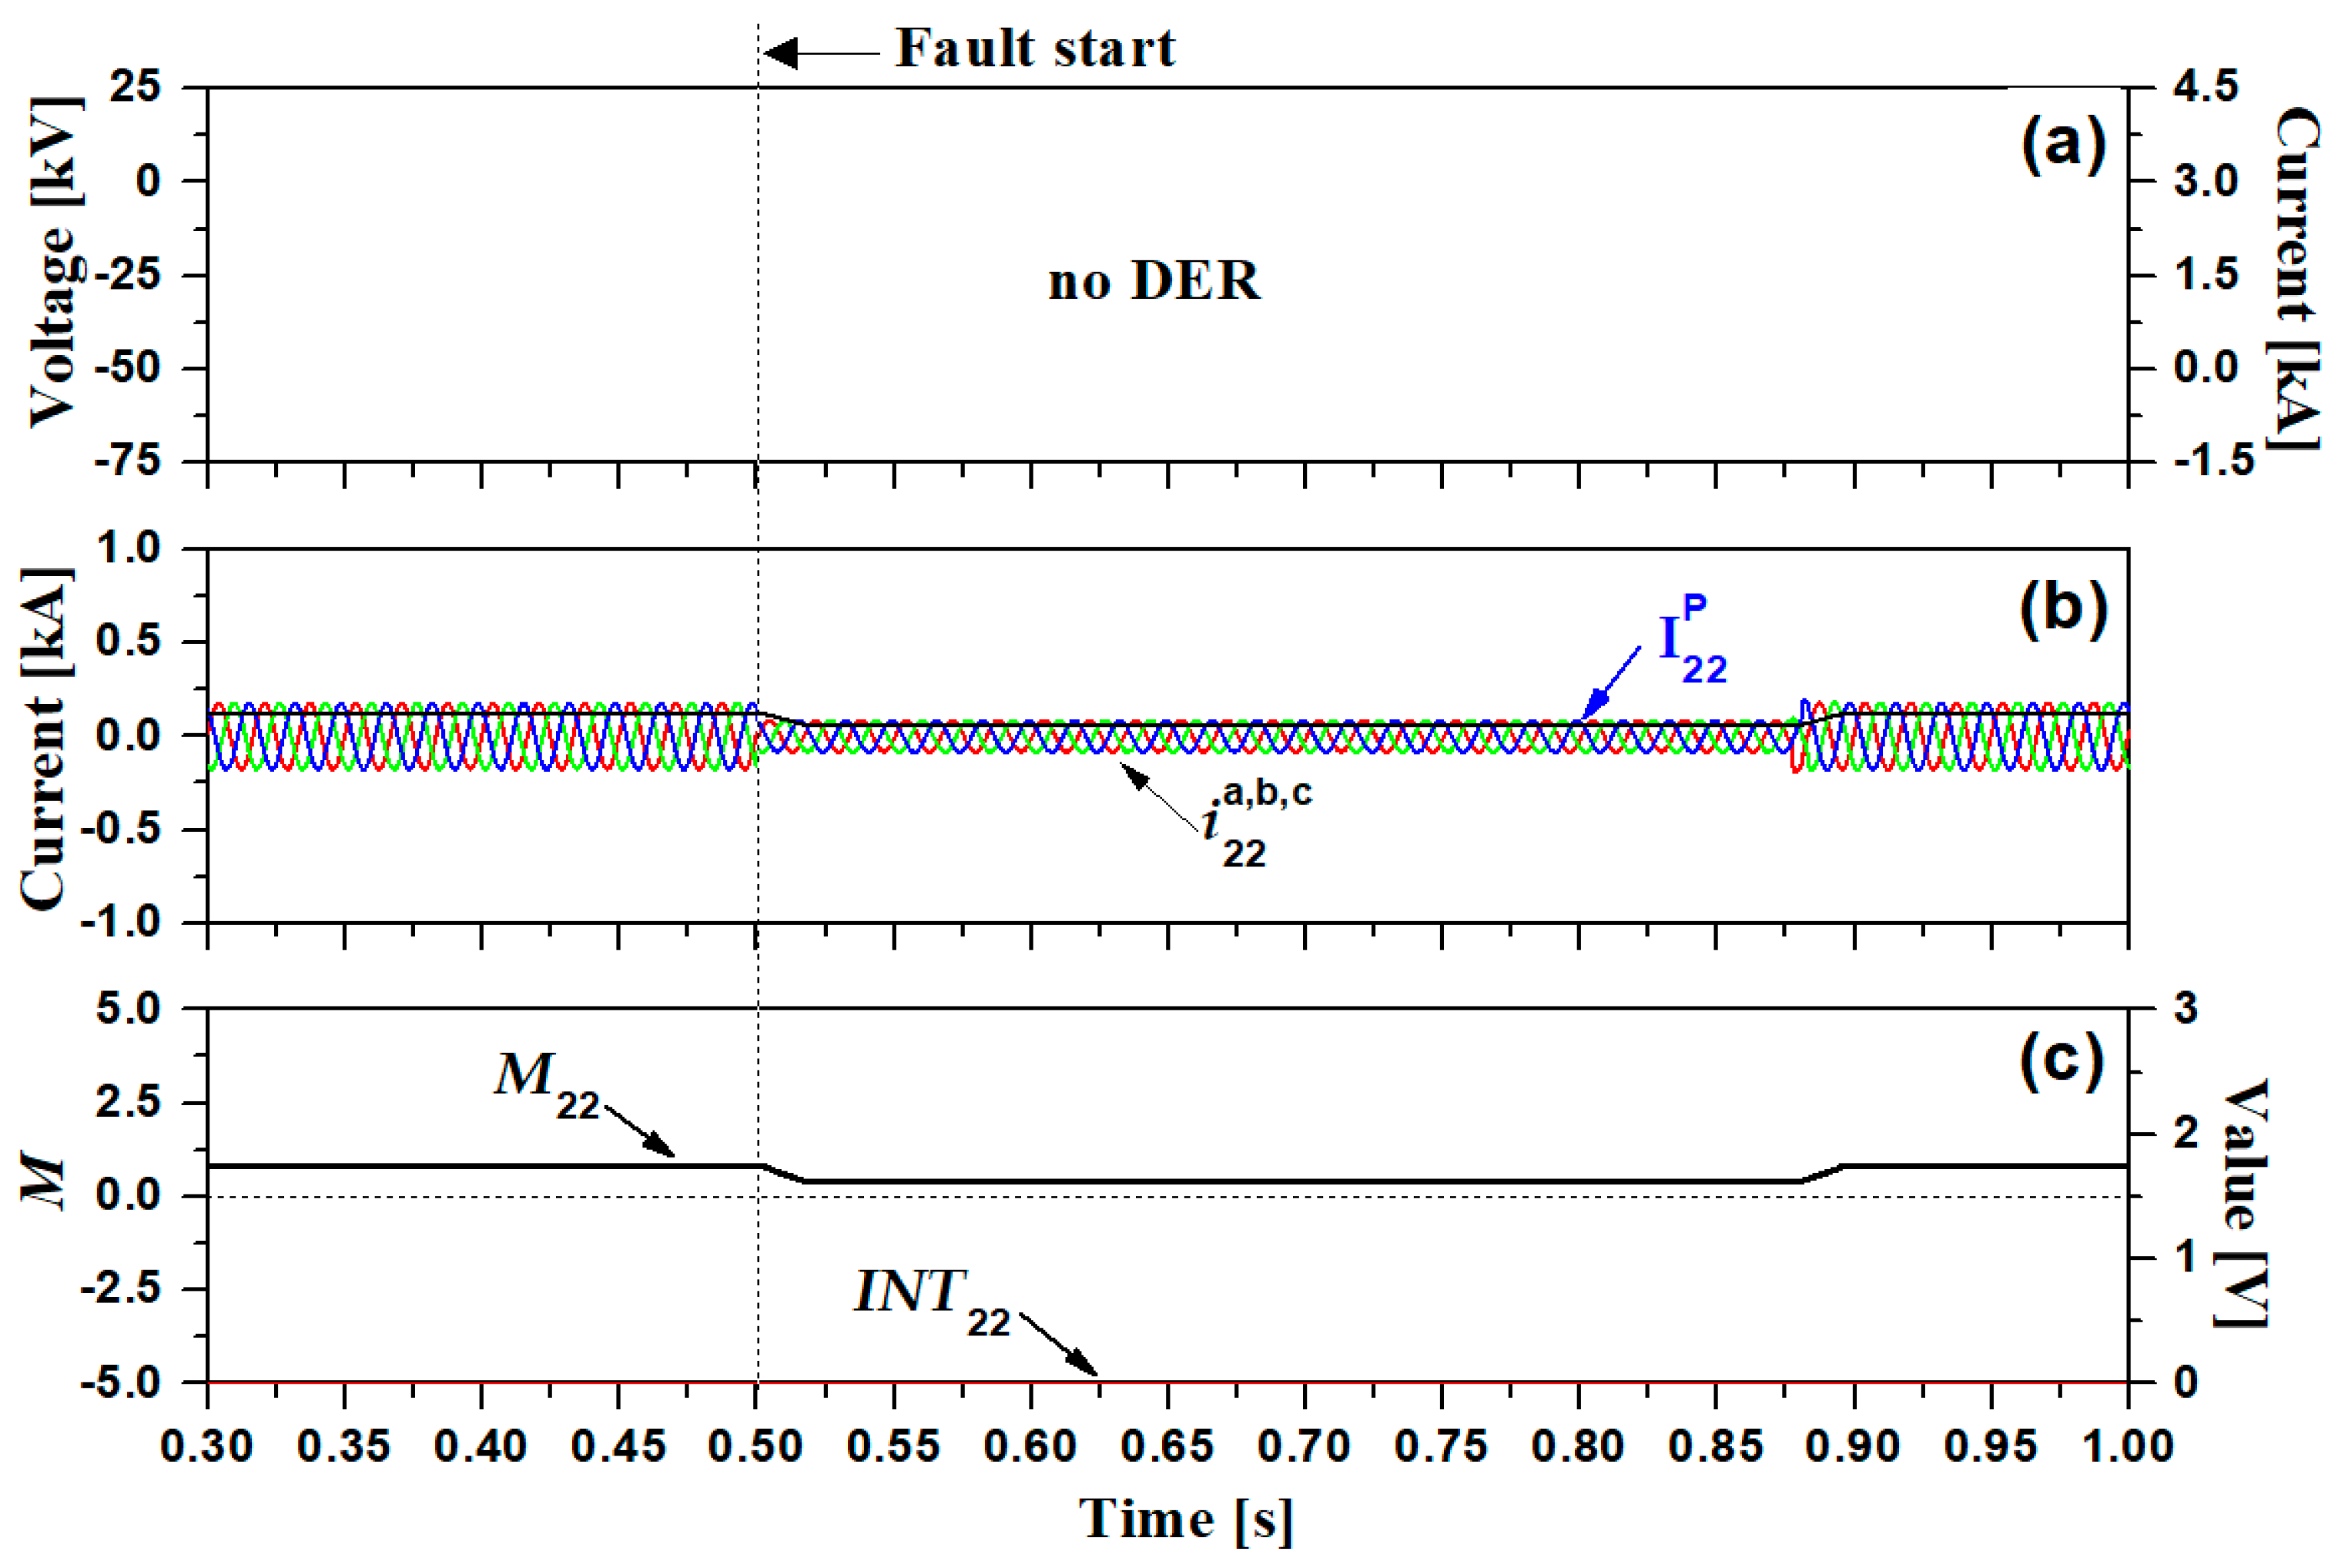
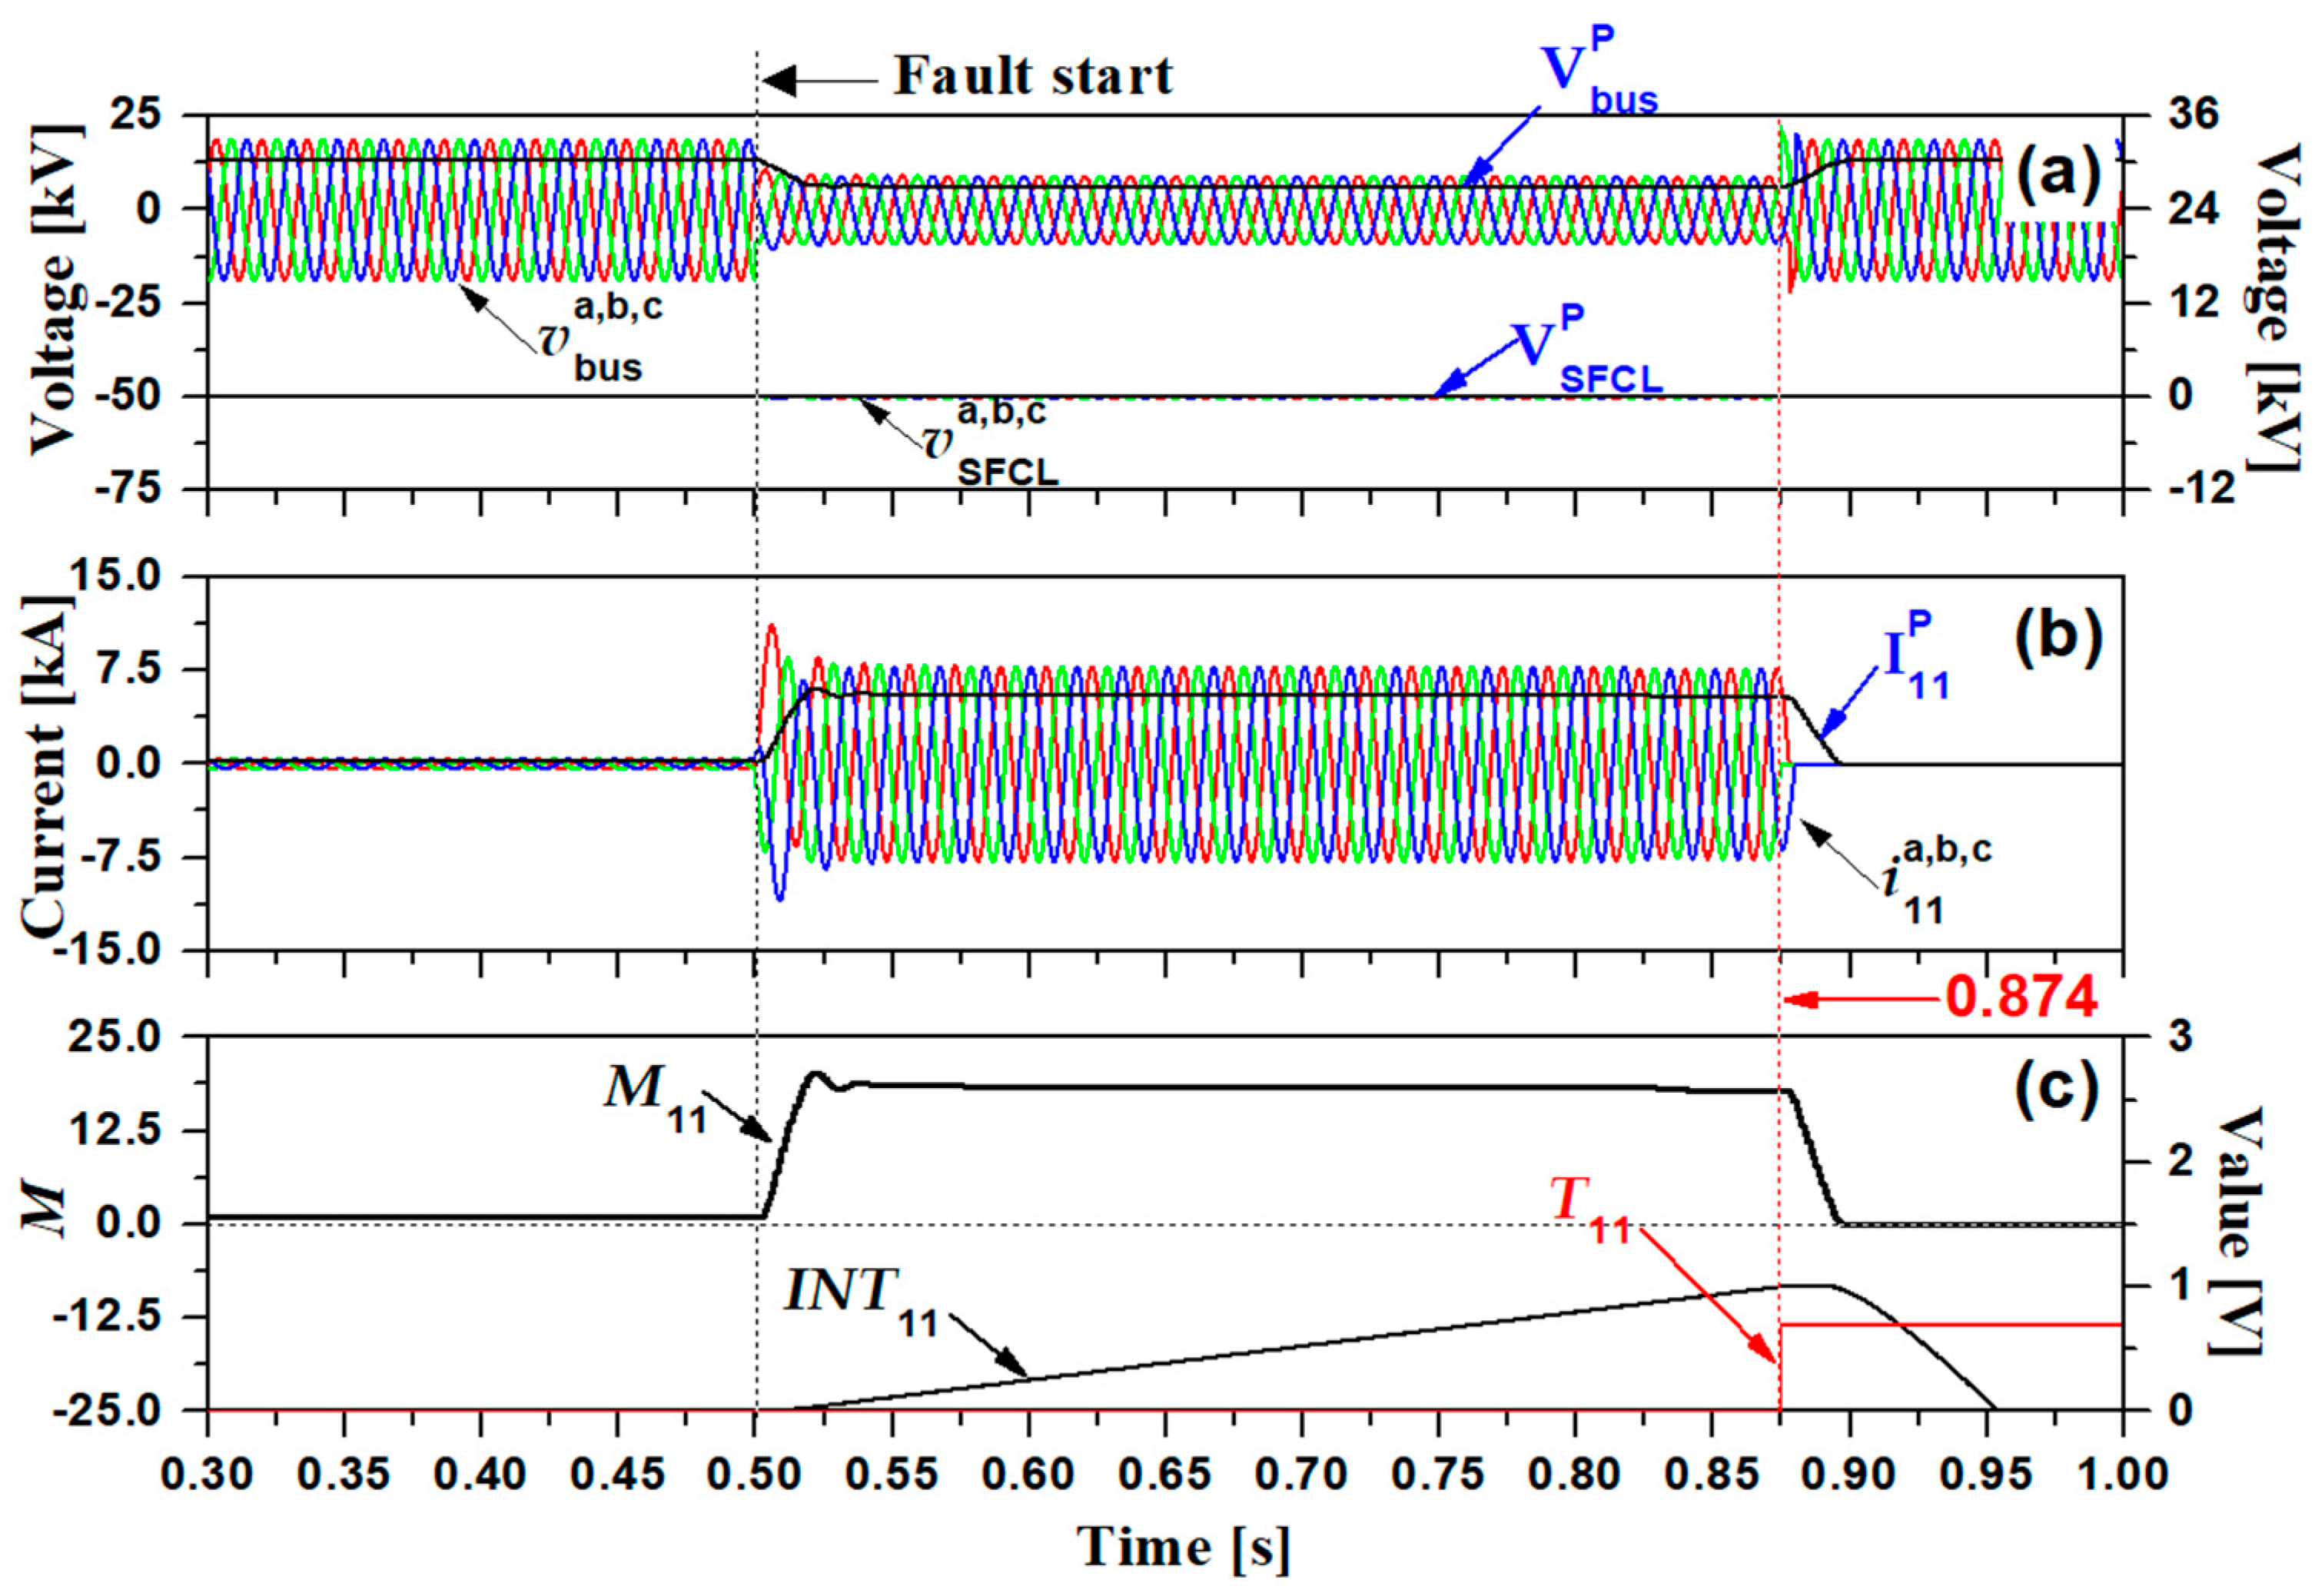
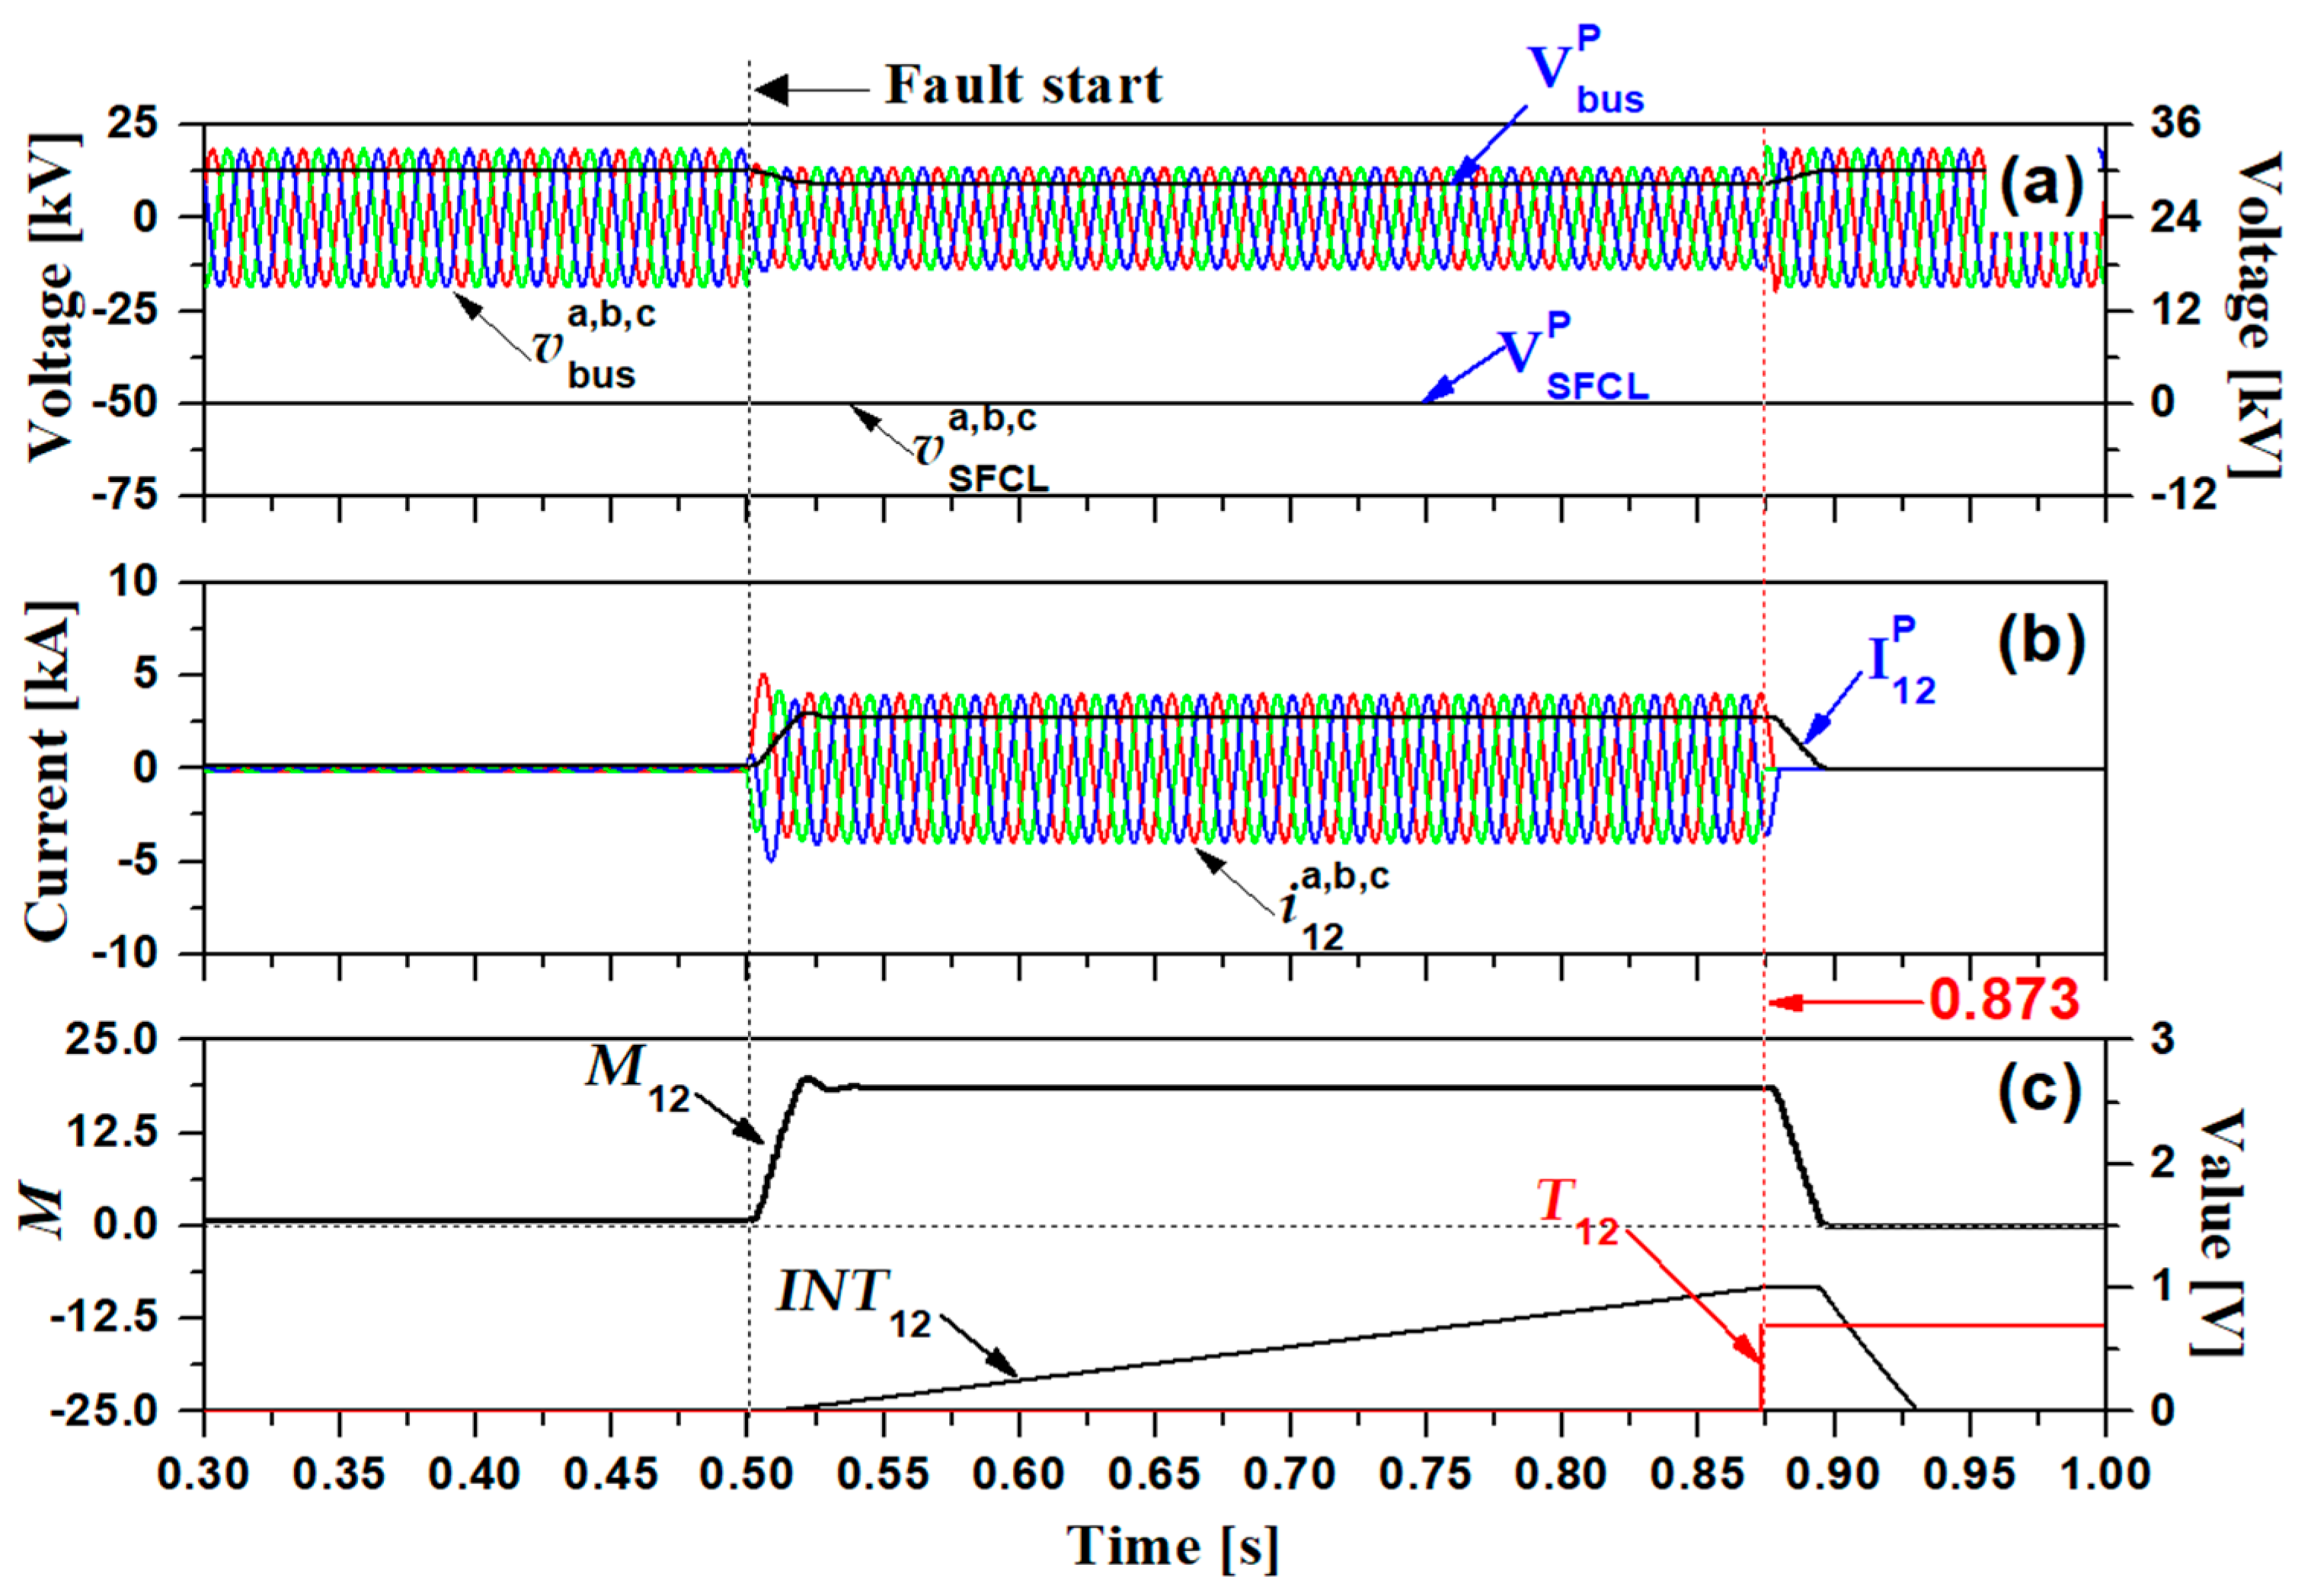
  • Case 1: fault simulation without DER and SFCL
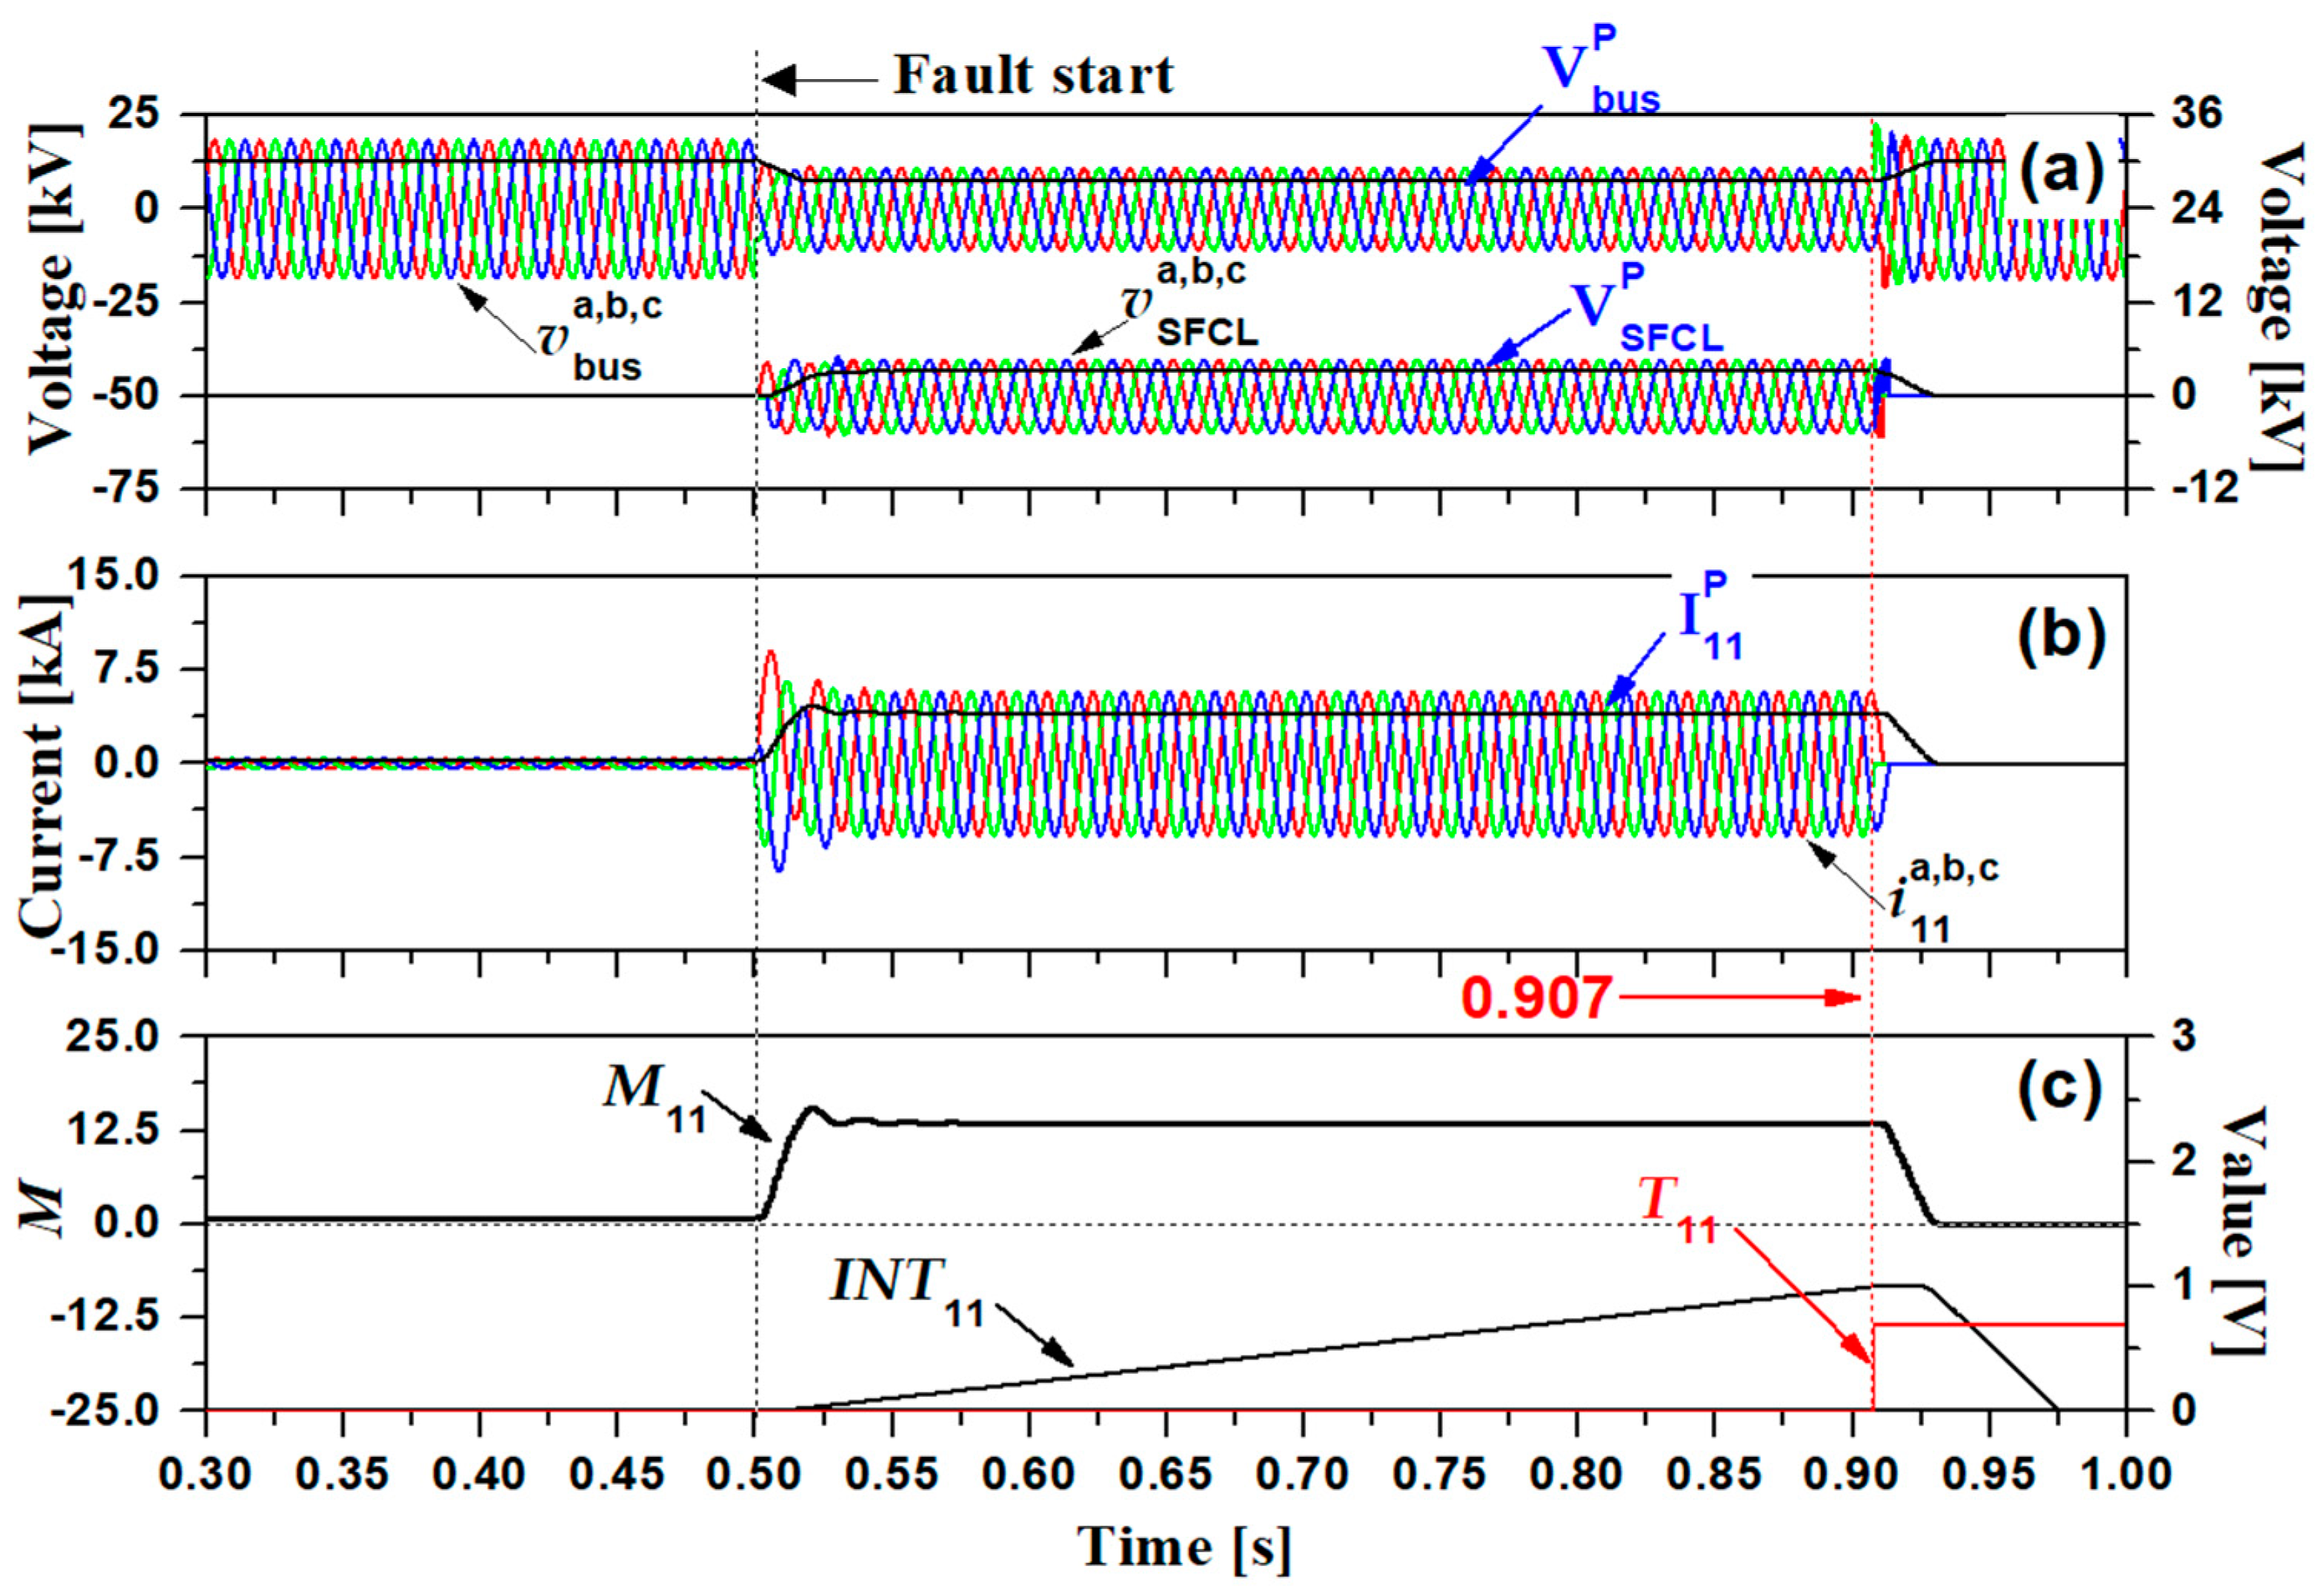
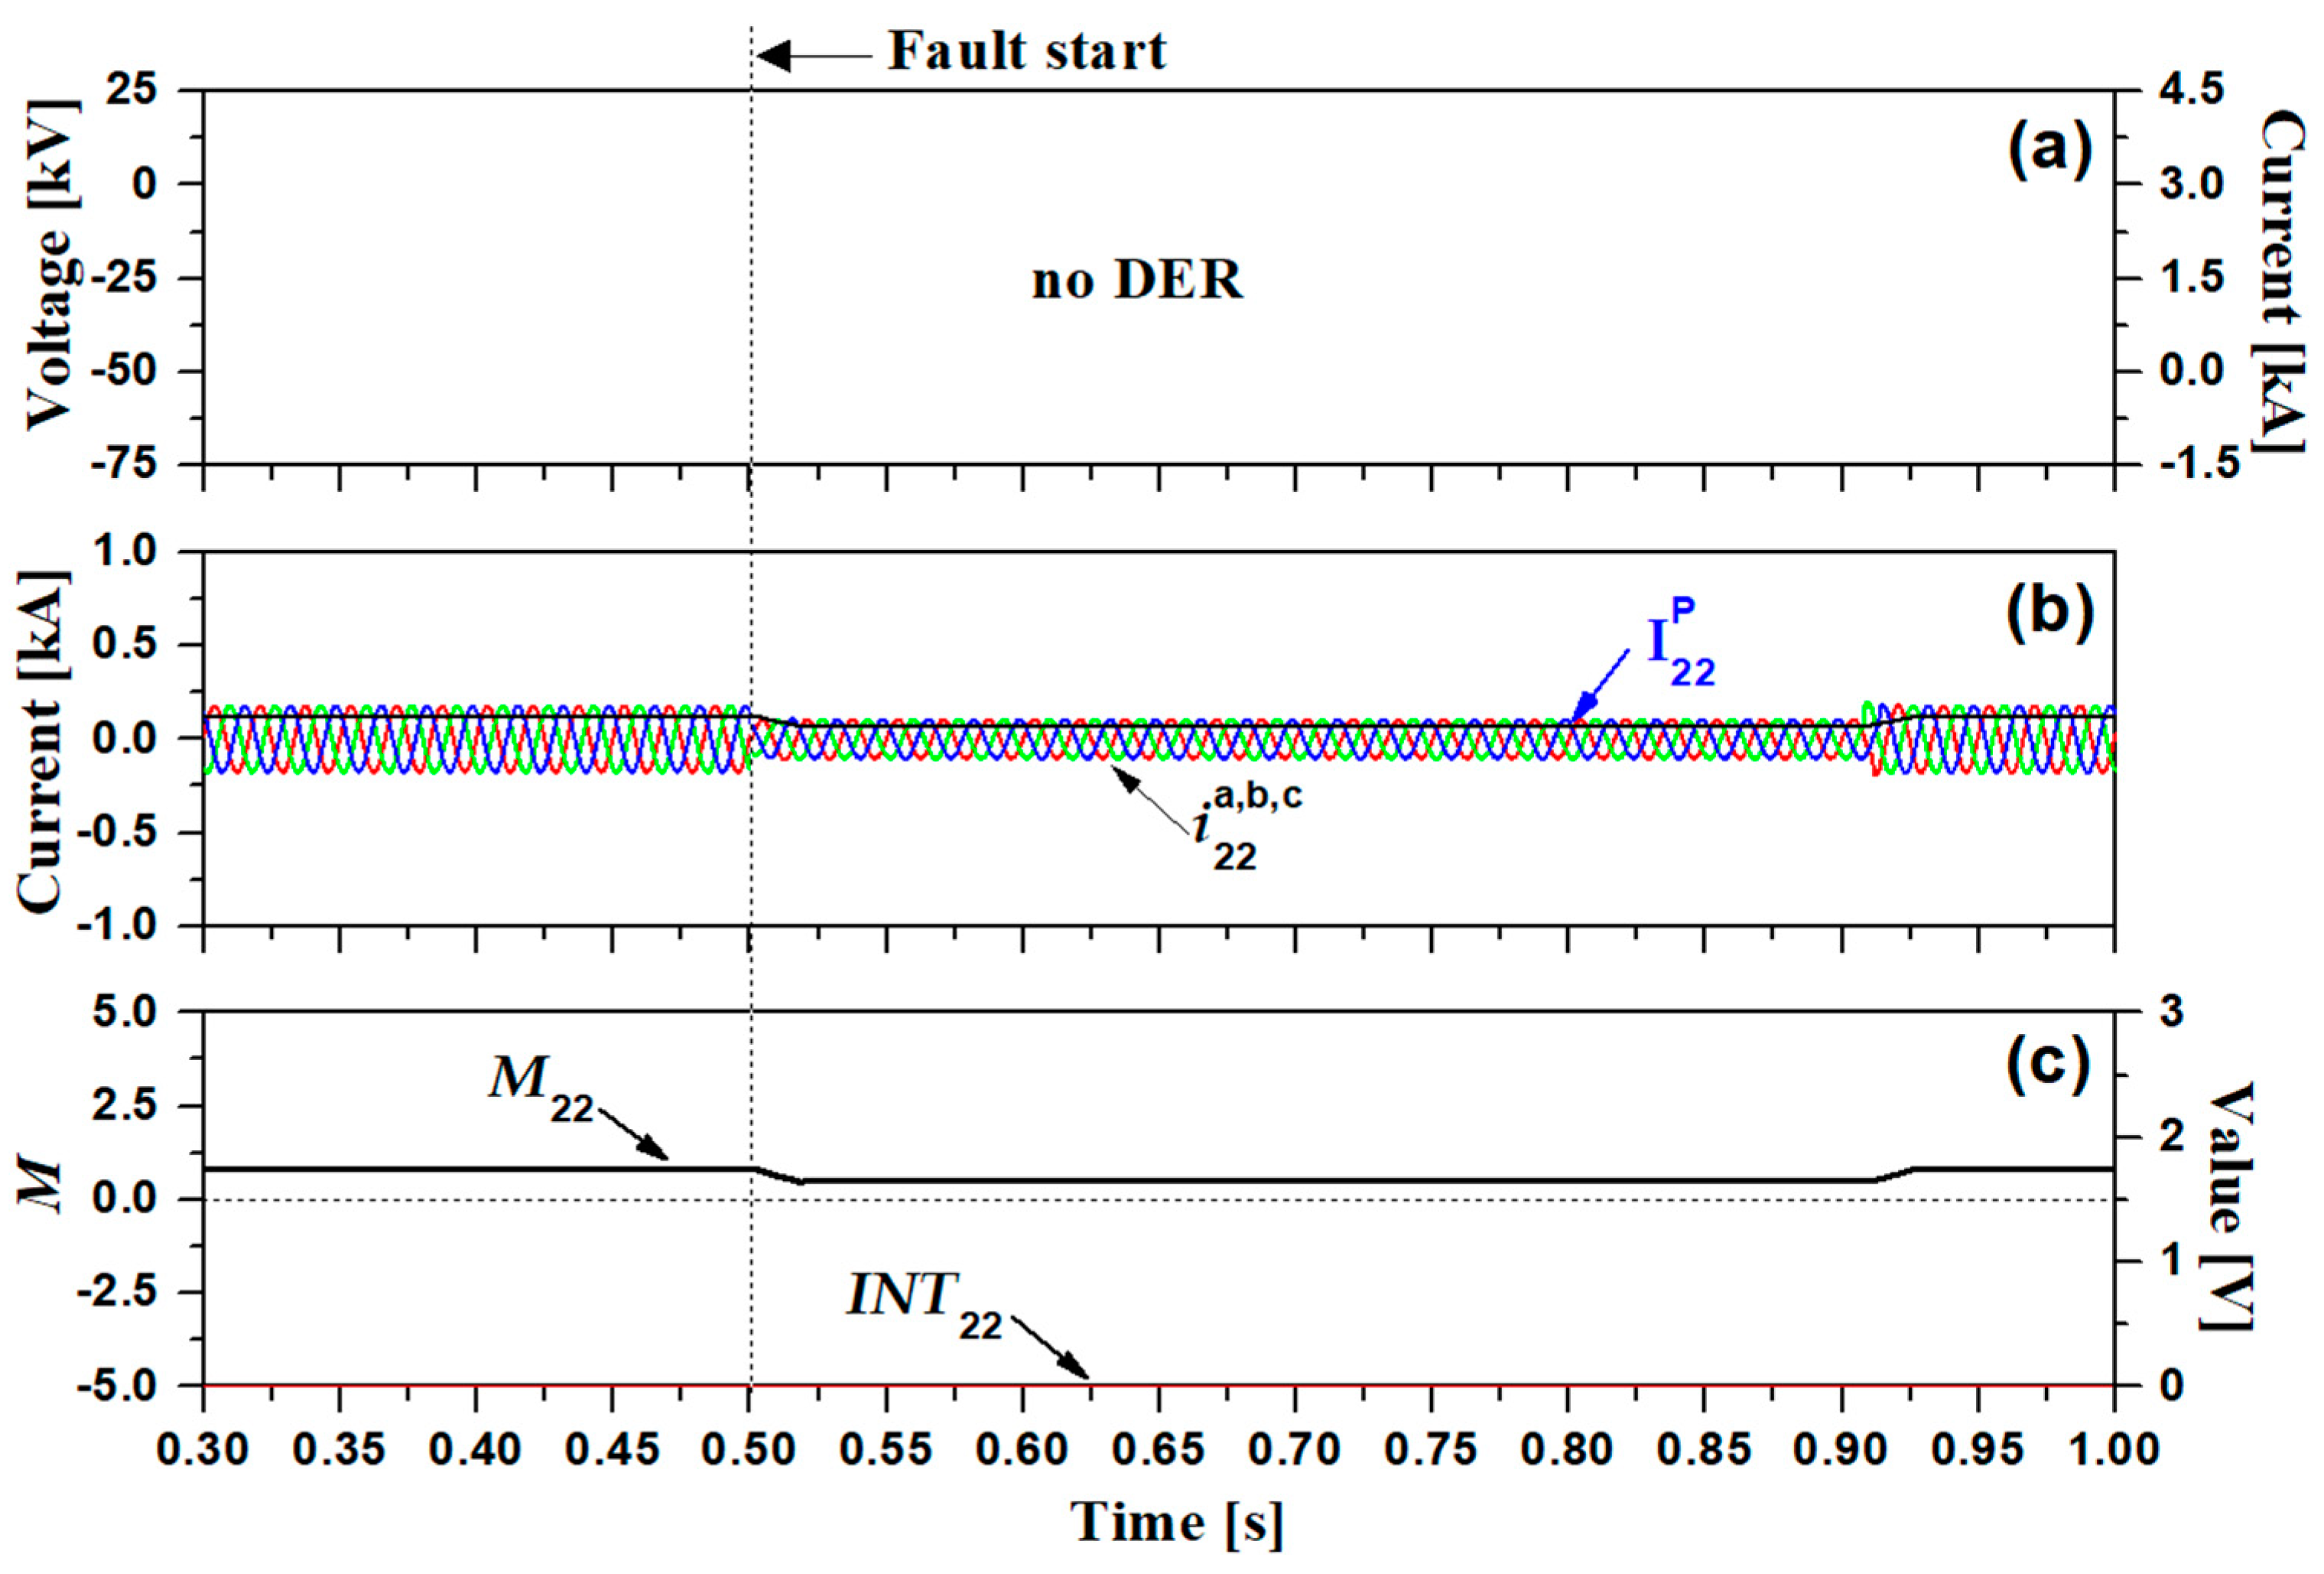
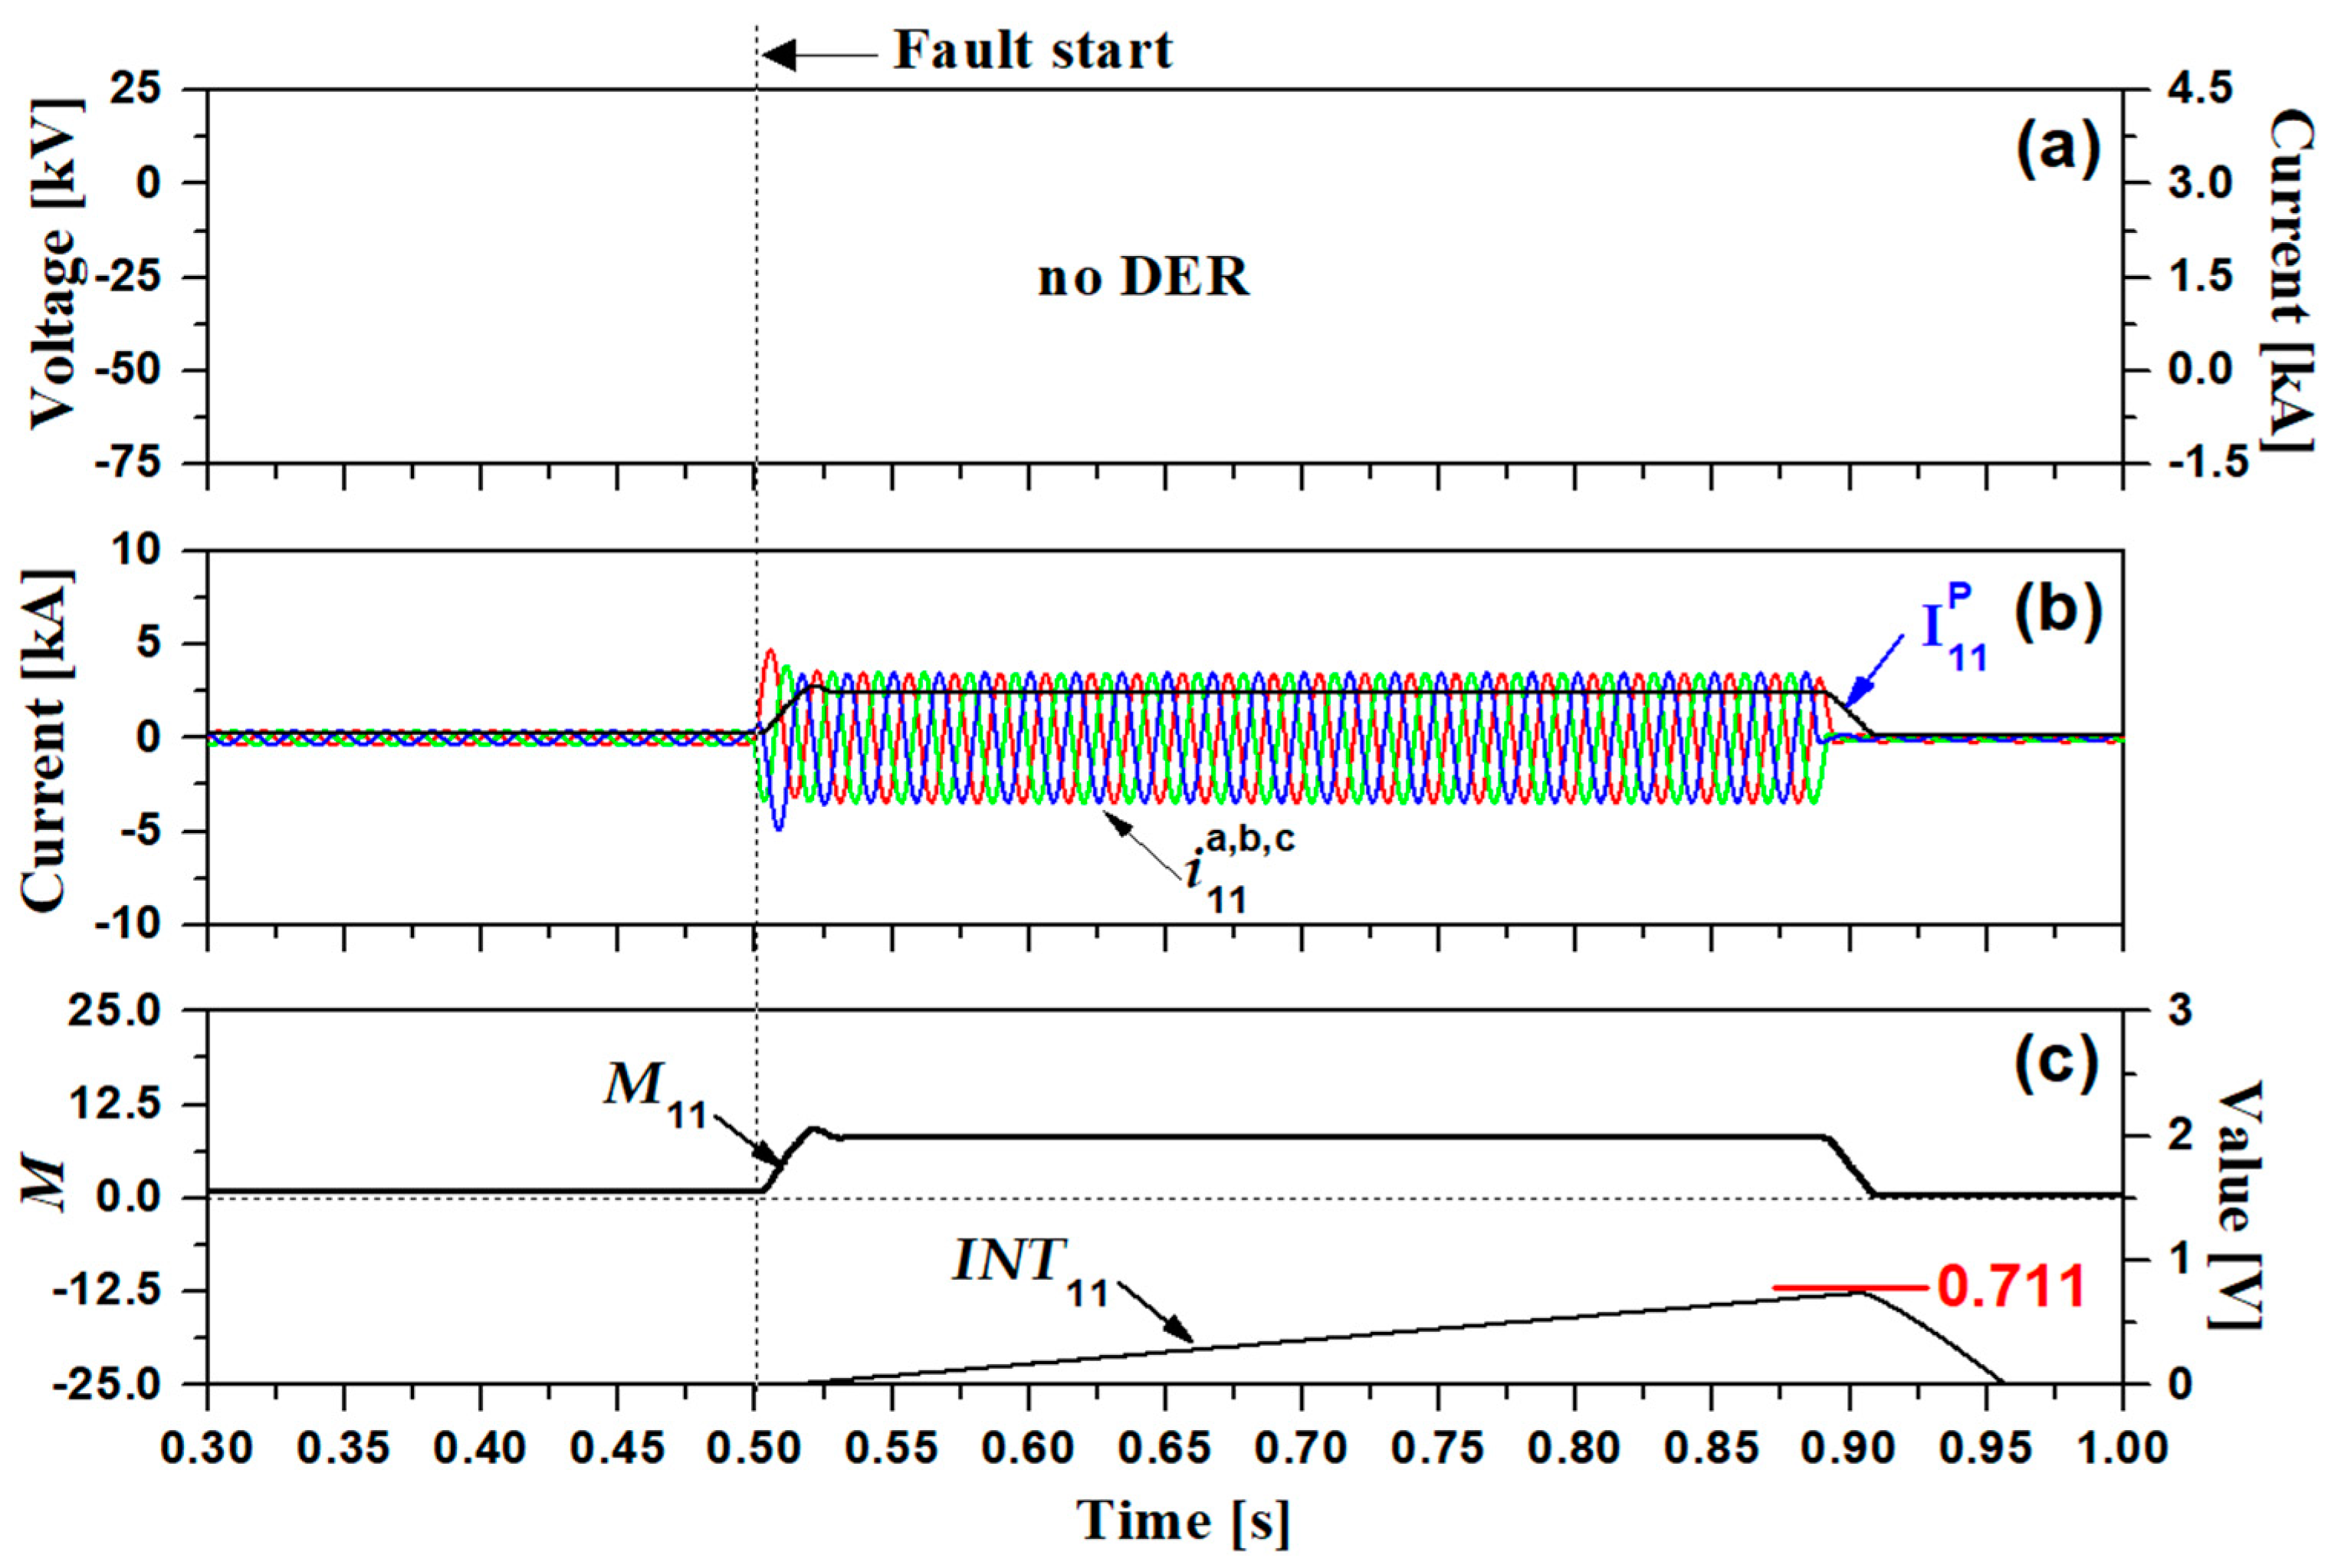
  • Case 2: fault simulation without DER with SFCL
  • Case 3: fault simulation with DER without SFCL
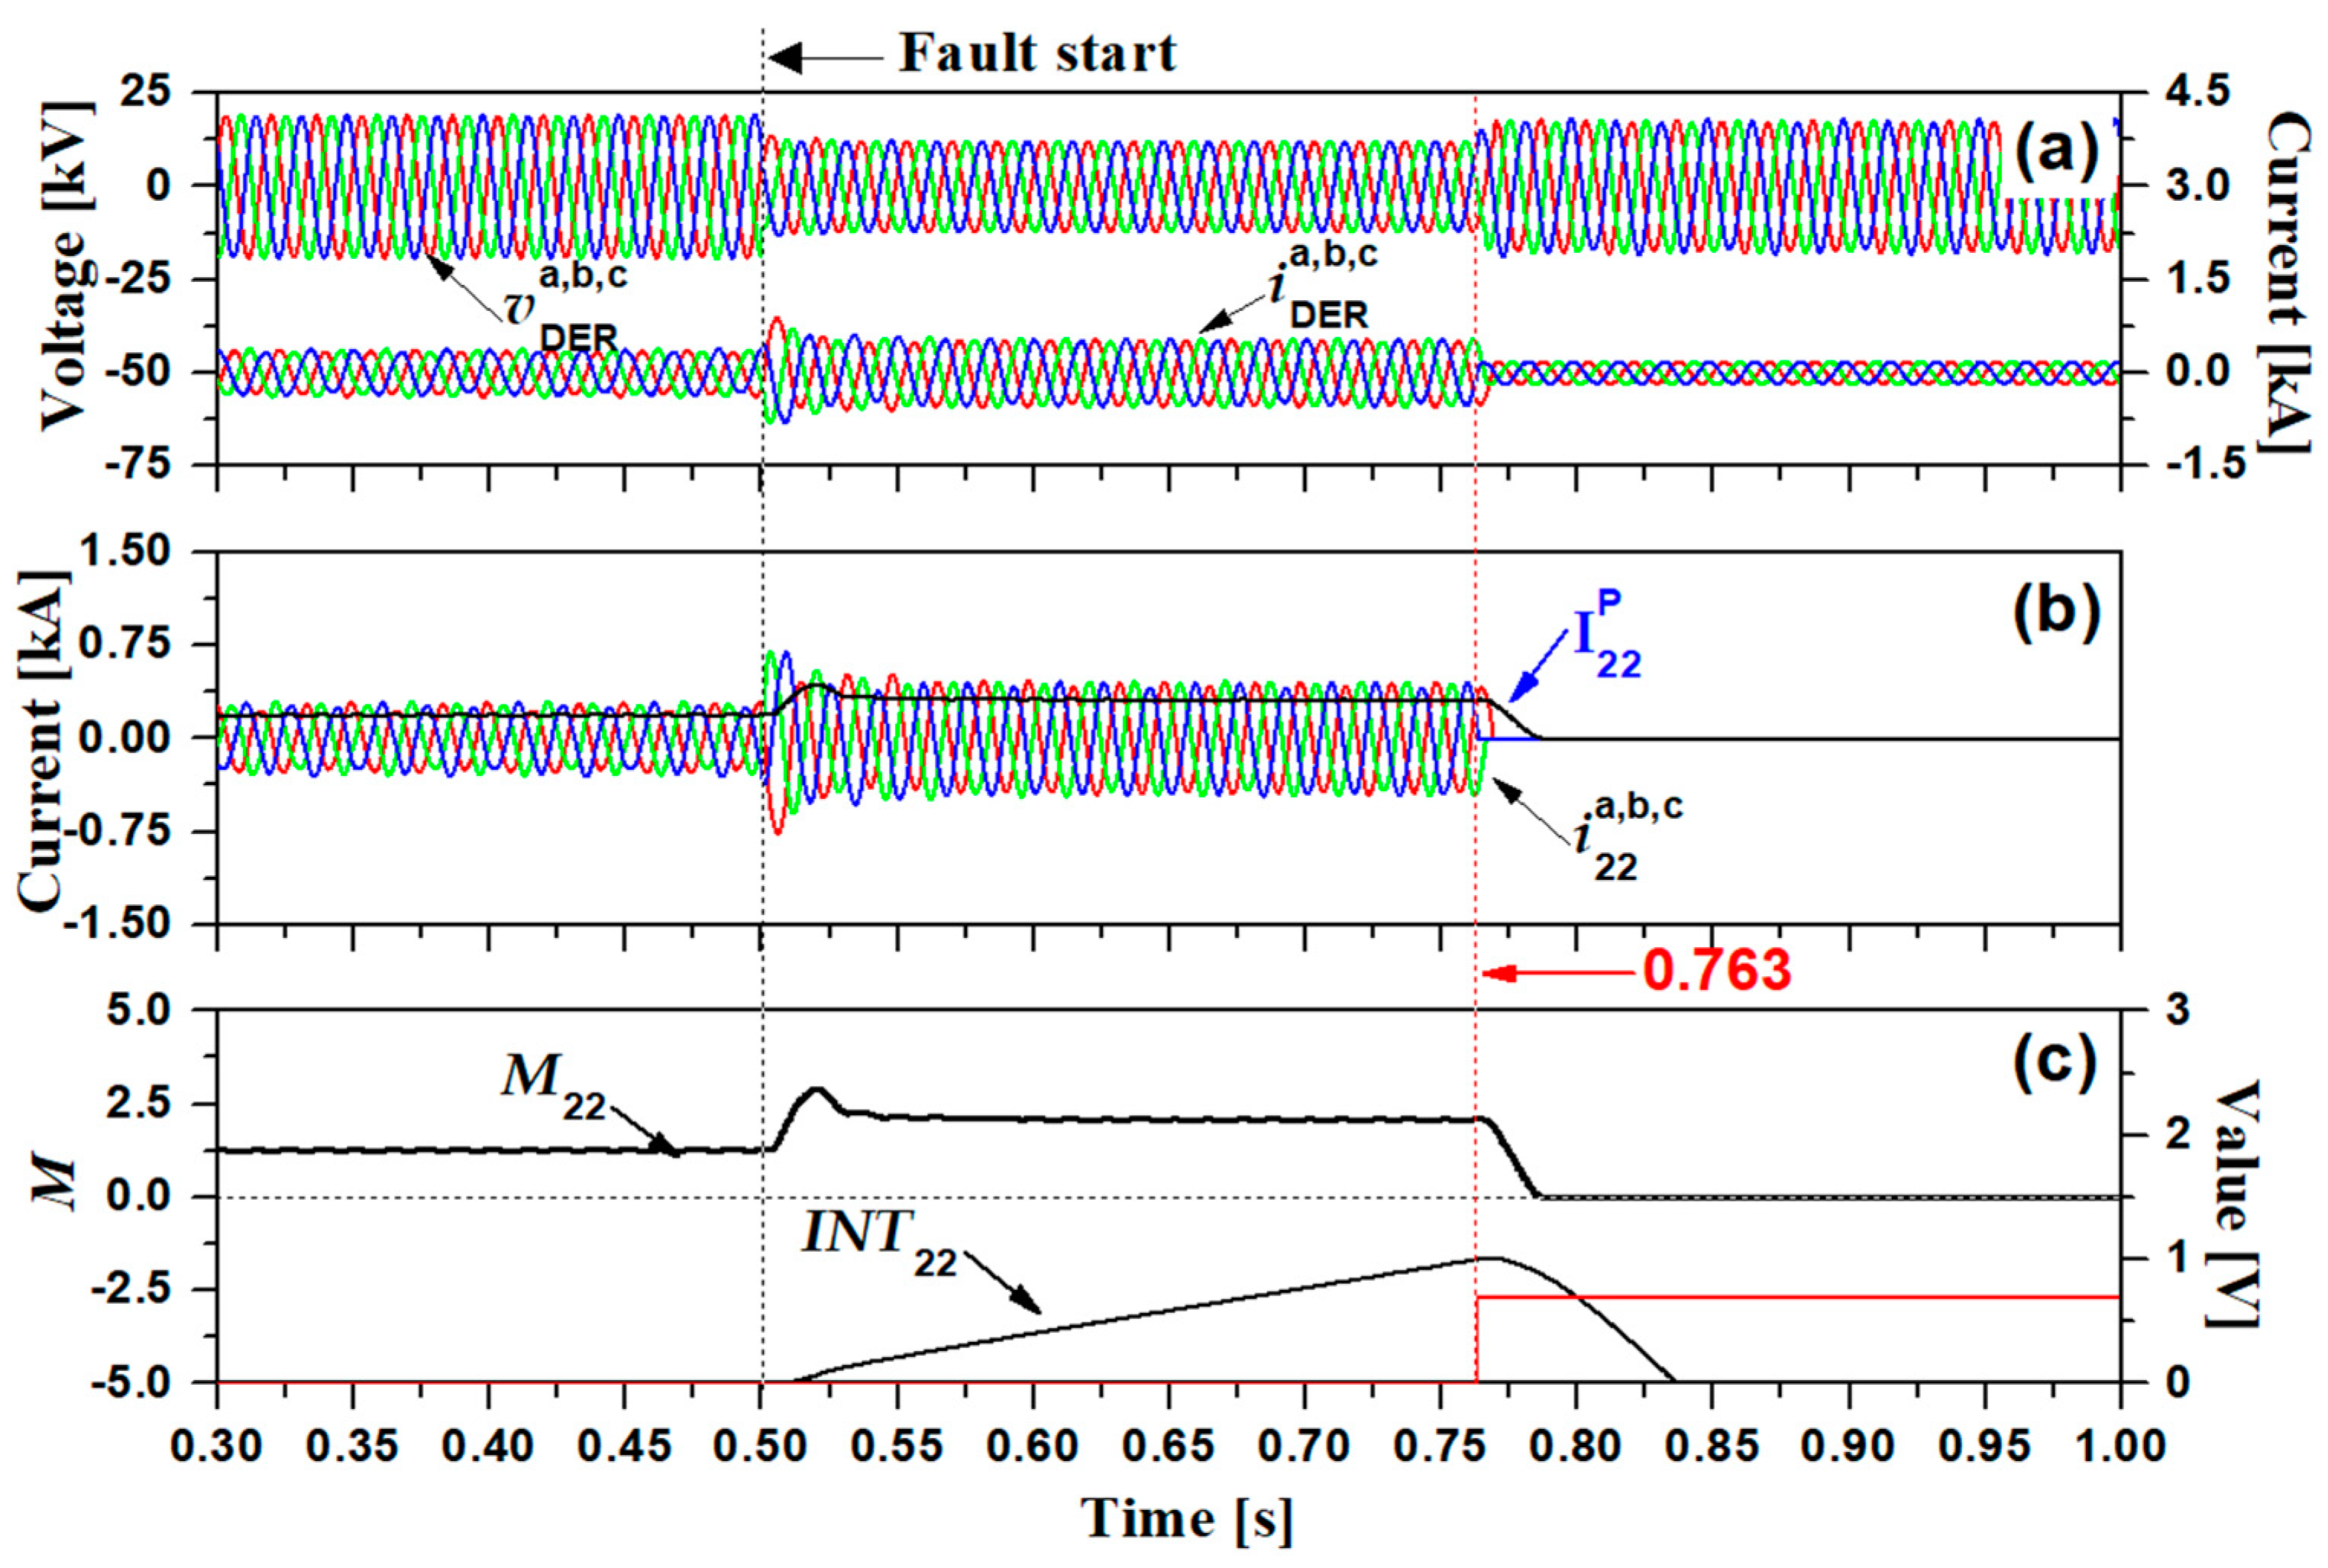
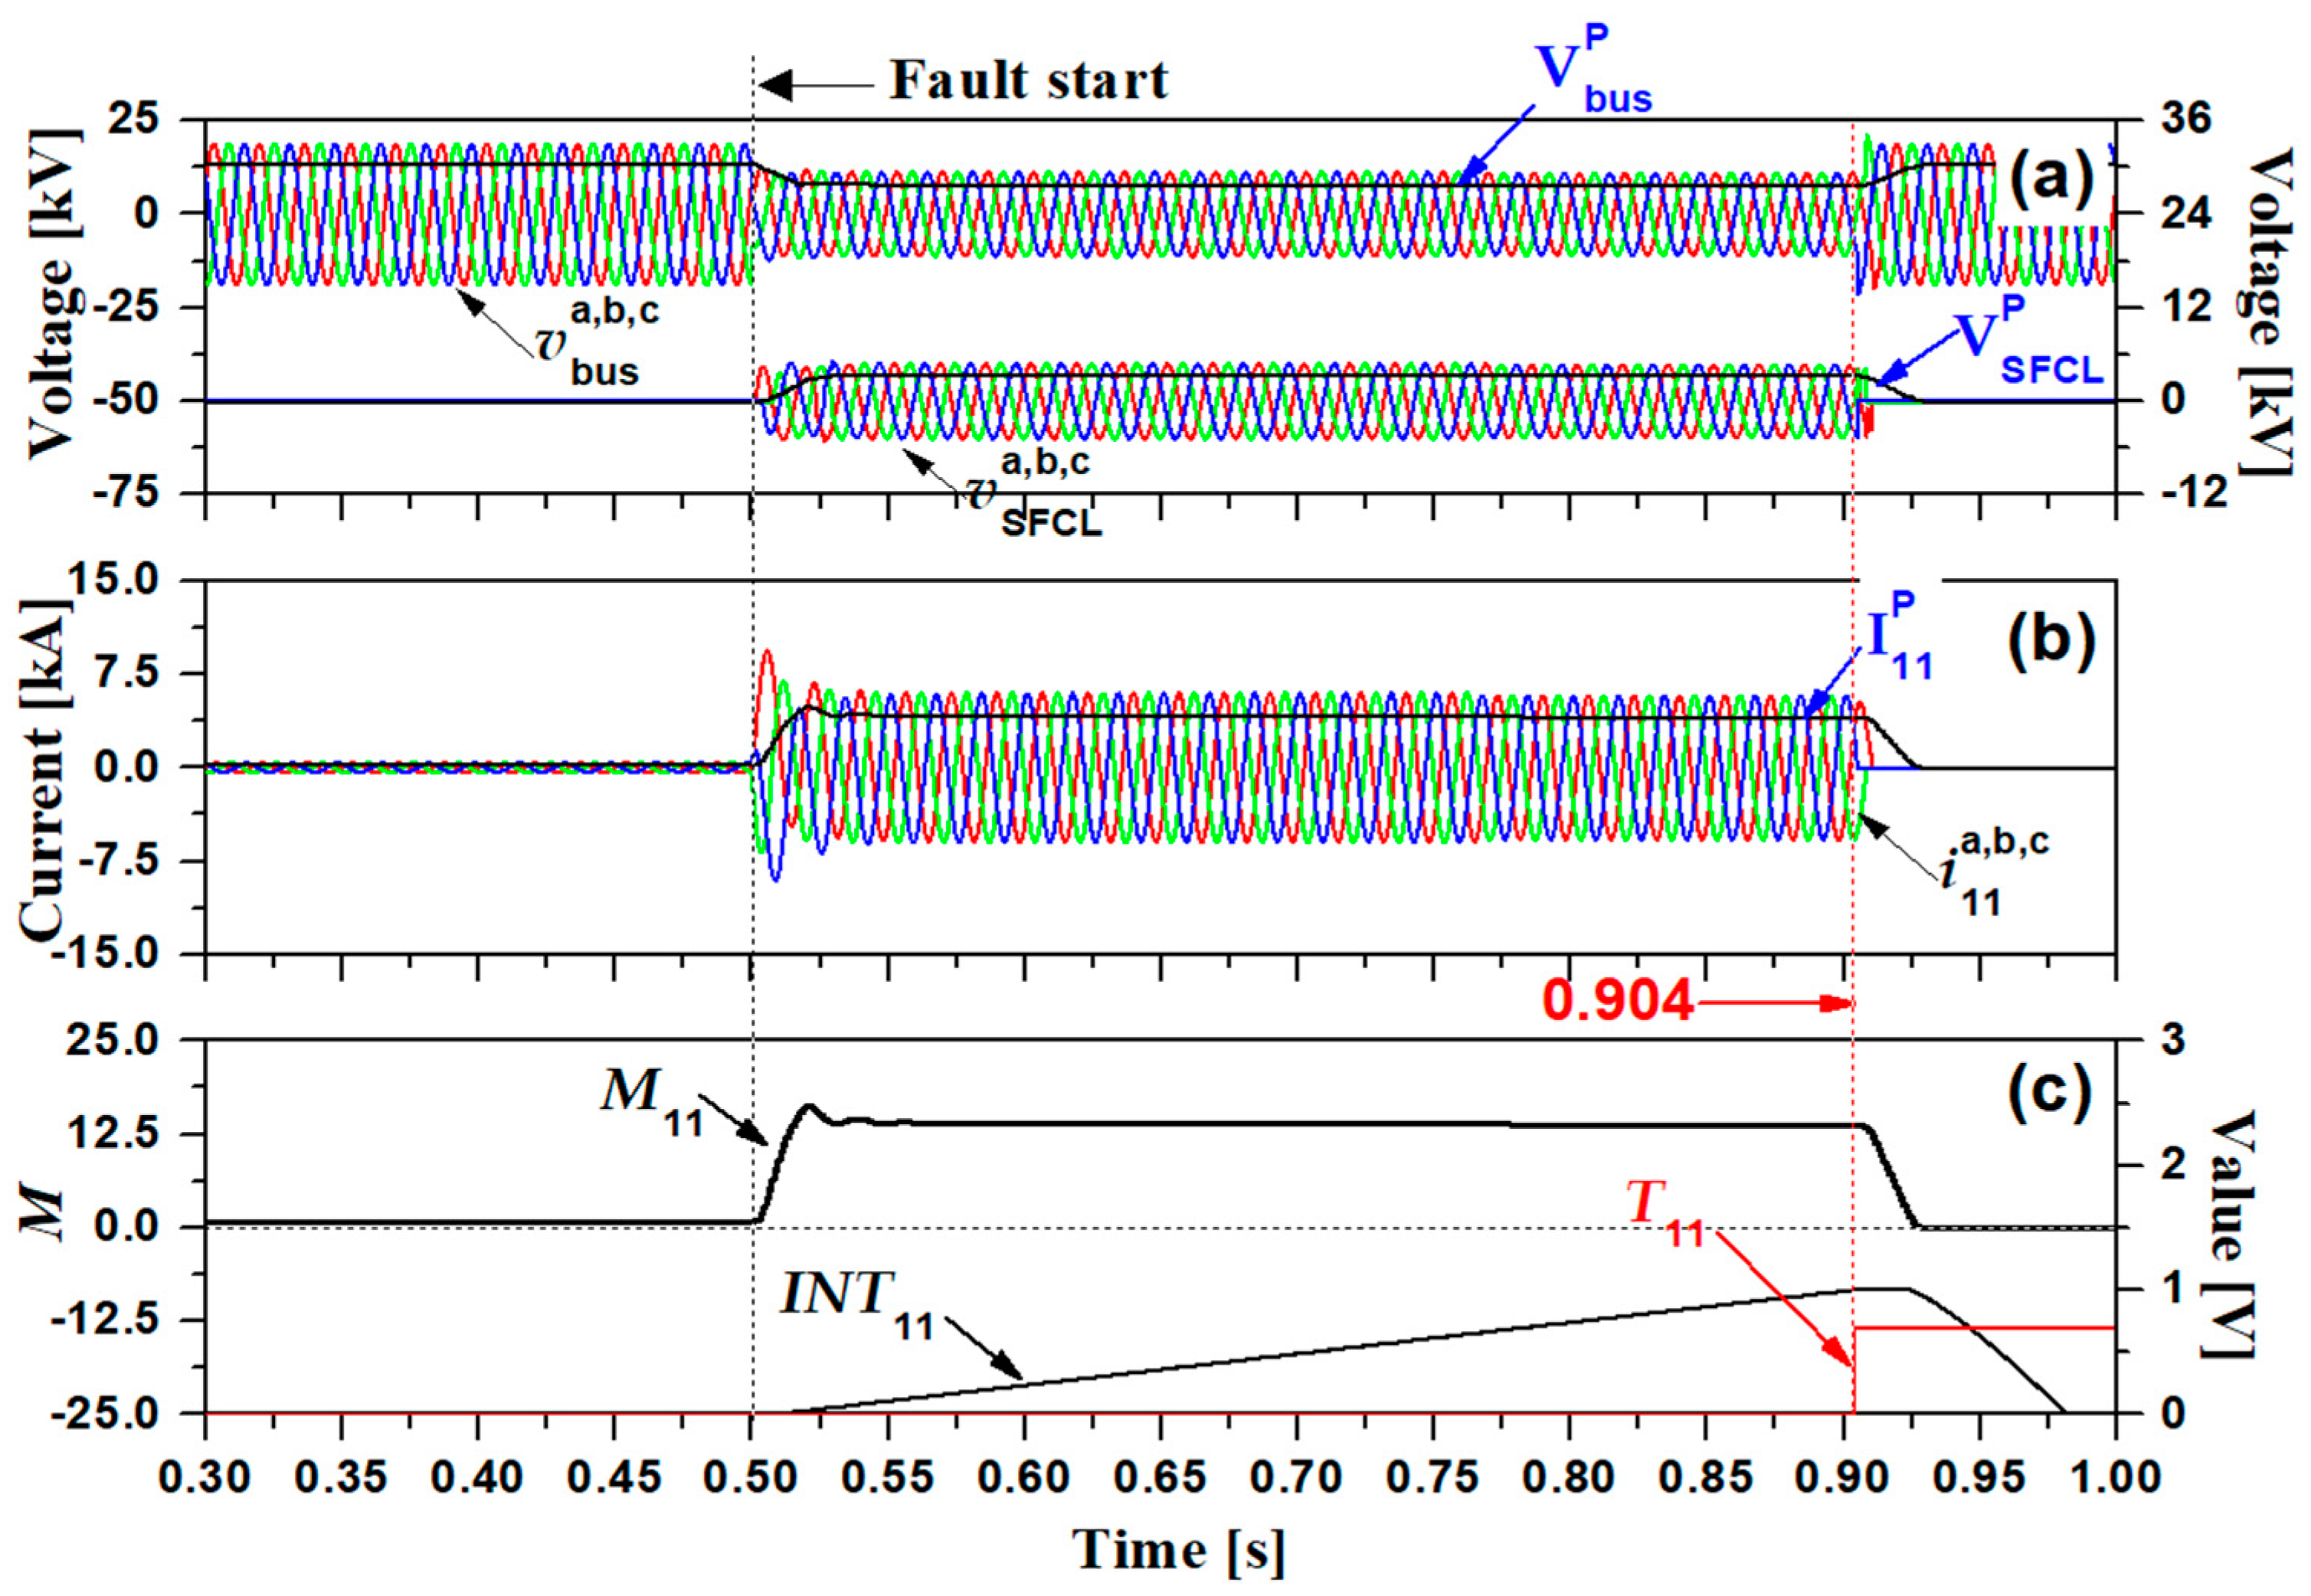
  • Case 4: fault simulation with DER and SFCL
For all simulated cases, TLG permanent failure occurs in 0.5 s. The fault current flows from the main source and the DER due to a fault occurrence. SFCLs installed in a simulated power distribution system limits these fault currents. In the first scenario, due to the fault current contributed by DER and OCR22 of CB22 set to a low setting value, the possibility of malfunction of CB22 occurs.

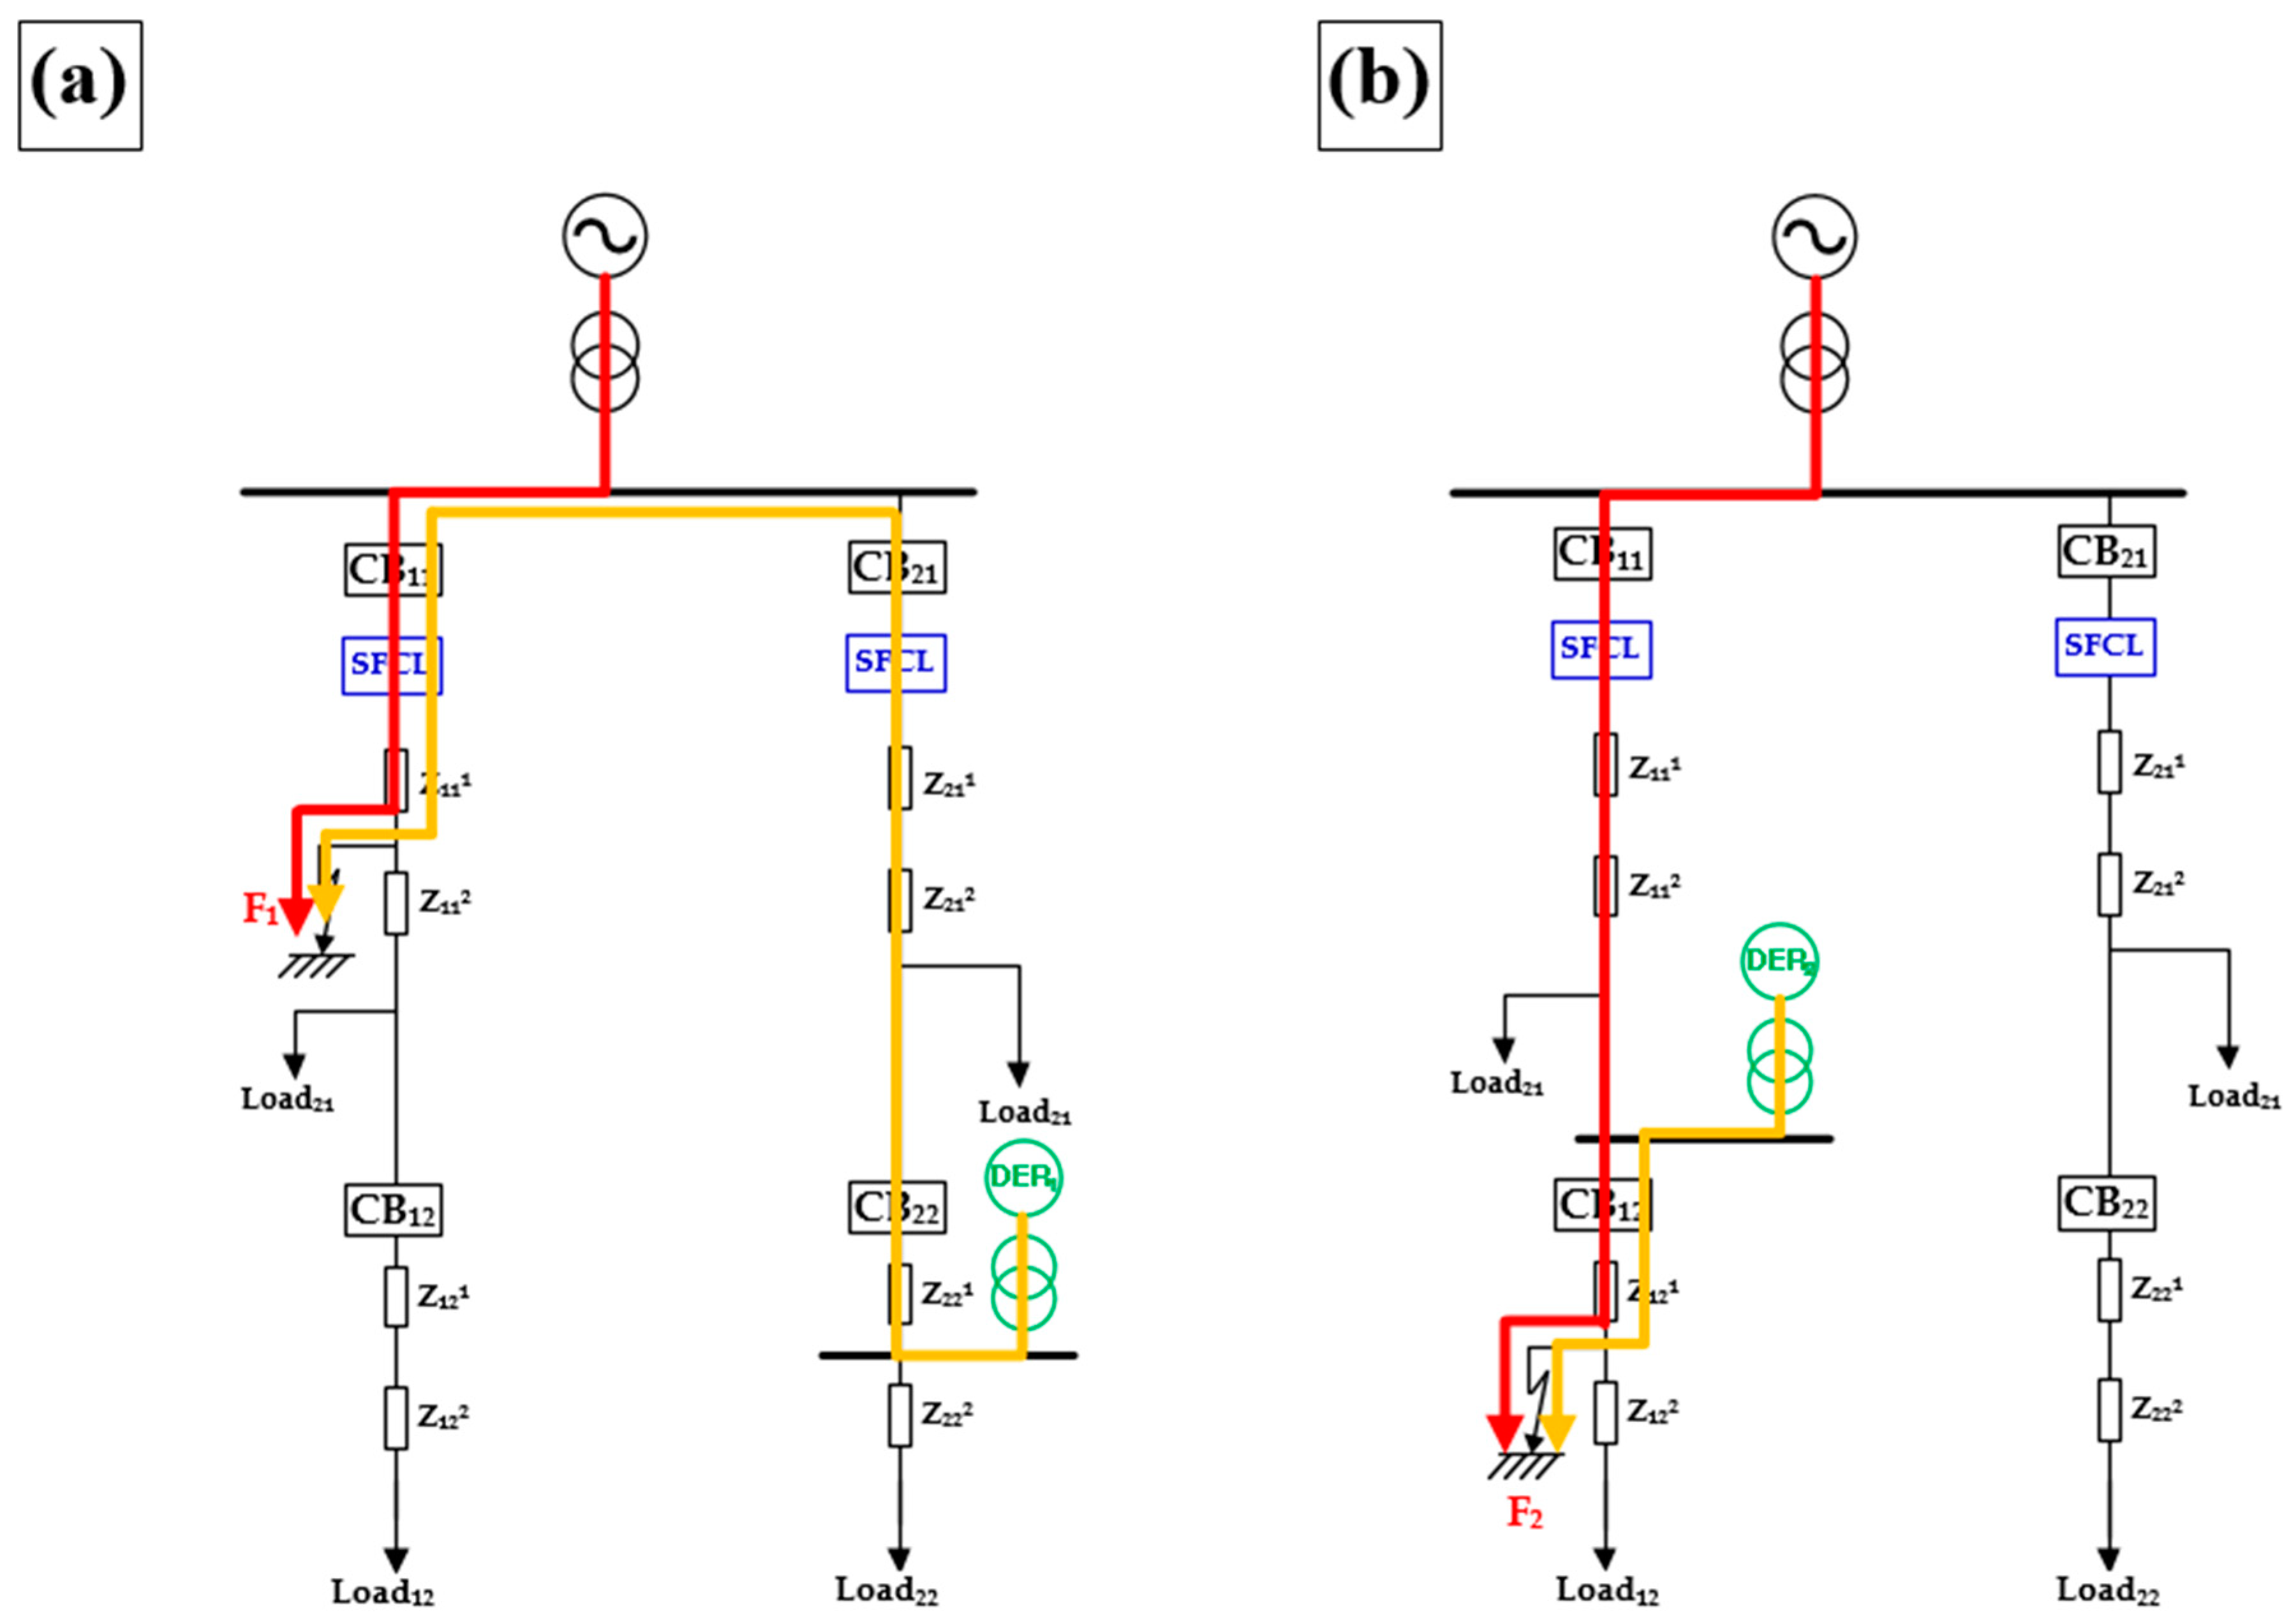
3.1. Fault Simulations of Sympathetic Tripping Case

Simulation result waveforms without DER and SFCL (Case 1) are shown in Figure 6 and Figure 7. It will be compared with the next results when SFCL and DER are linked. In Figure 6, as the fault occurred at 0.5 s, the fault current greatly increased and the bus voltage decreased, and OCR11 gradually accumulated and tripped at 0.877 s. After 0.877 s, it is confirmed that the circuit breaker operates, and the fault is removed. Additionally, it can be seen that the bus voltage is slightly higher than the normal level, and the current flowing through the OCR11 is 0. In Figure 7, since no DER was penetrated, no DER-related resulting waveforms are present. In addition, the current measured by OCR22 is rather reduced at the time of the fault and is restored to the normal level when the fault is removed. Accordingly, OCR22 is not accumulated because it does not exceed the threshold value.
Simulation result waveforms without DER with SFCL (Case 2) are shown in Figure 8 and Figure 9. In Figure 8, when the fault current greatly increases, the SFCL operates to limit the fault current. Compared to Case 1, the fault current and bus voltage drop are reduced. However, the reduced fault current causes a delay in the OCR’s tripping time. The OCR22, which tripped at 0.877 s without SFCL, tripped at 0.907 s. In Figure 9, as SFCL was added, there was no significant change compared to the result in Figure 7.
Simulation result waveforms with DER without SFCL (Case 3) are shown in Figure 10 and Figure 11. In Figure 10, as a fault occurred, a large fault current occurred and a bus voltage drop occurred. Compared to Figure 6, the fault current is almost the same and the bus voltage drop is almost the same too. Since the magnitude of the fault current is almost the same as before, the operating time of the OCR11 was also 0.874 s, almost the same as in Case 1. In Figure 11, the voltage and current on the high-voltage side of the TRDER due to DER penetration were confirmed. In the case of DER voltage, it can be confirmed that a voltage drop occurs with the occurrence of a fault, and in the case of the DER current, although it increases with the occurrence of a fault, the size of the fault current is only about 1.5 times the normal current. However, in OCR22, which is set very sensitively, INT values accumulate due to fault current and trip in 0.818 s. OCR22 operated faster than OCR11, resulting in malfunction and sympathetic tripping.
Simulation result waveforms with DER and SFCL (Case 4) are shown in Figure 12 and Figure 13. In Figure 12, SFCL operates as the current increases. Compared to Figure 8, there is a difference of about 3 ms in the trip time of OCR11, but it can be seen that there is little effect of DER penetration. In Figure 13, the DER voltage drops and fault currents are reduced compared to Figure 11 due to the effect of SFCL. However, a peculiarity occurs. Despite the installation of SFCL, the operation time of OCR22 is 55 ms faster compared to the operation time of 0.818 s in Figure 11. This is because the peak value of the fault current flowing through OCR22 decreased, but the converged value of the fault current after the peak converged to a higher value when the SFCL was installed.

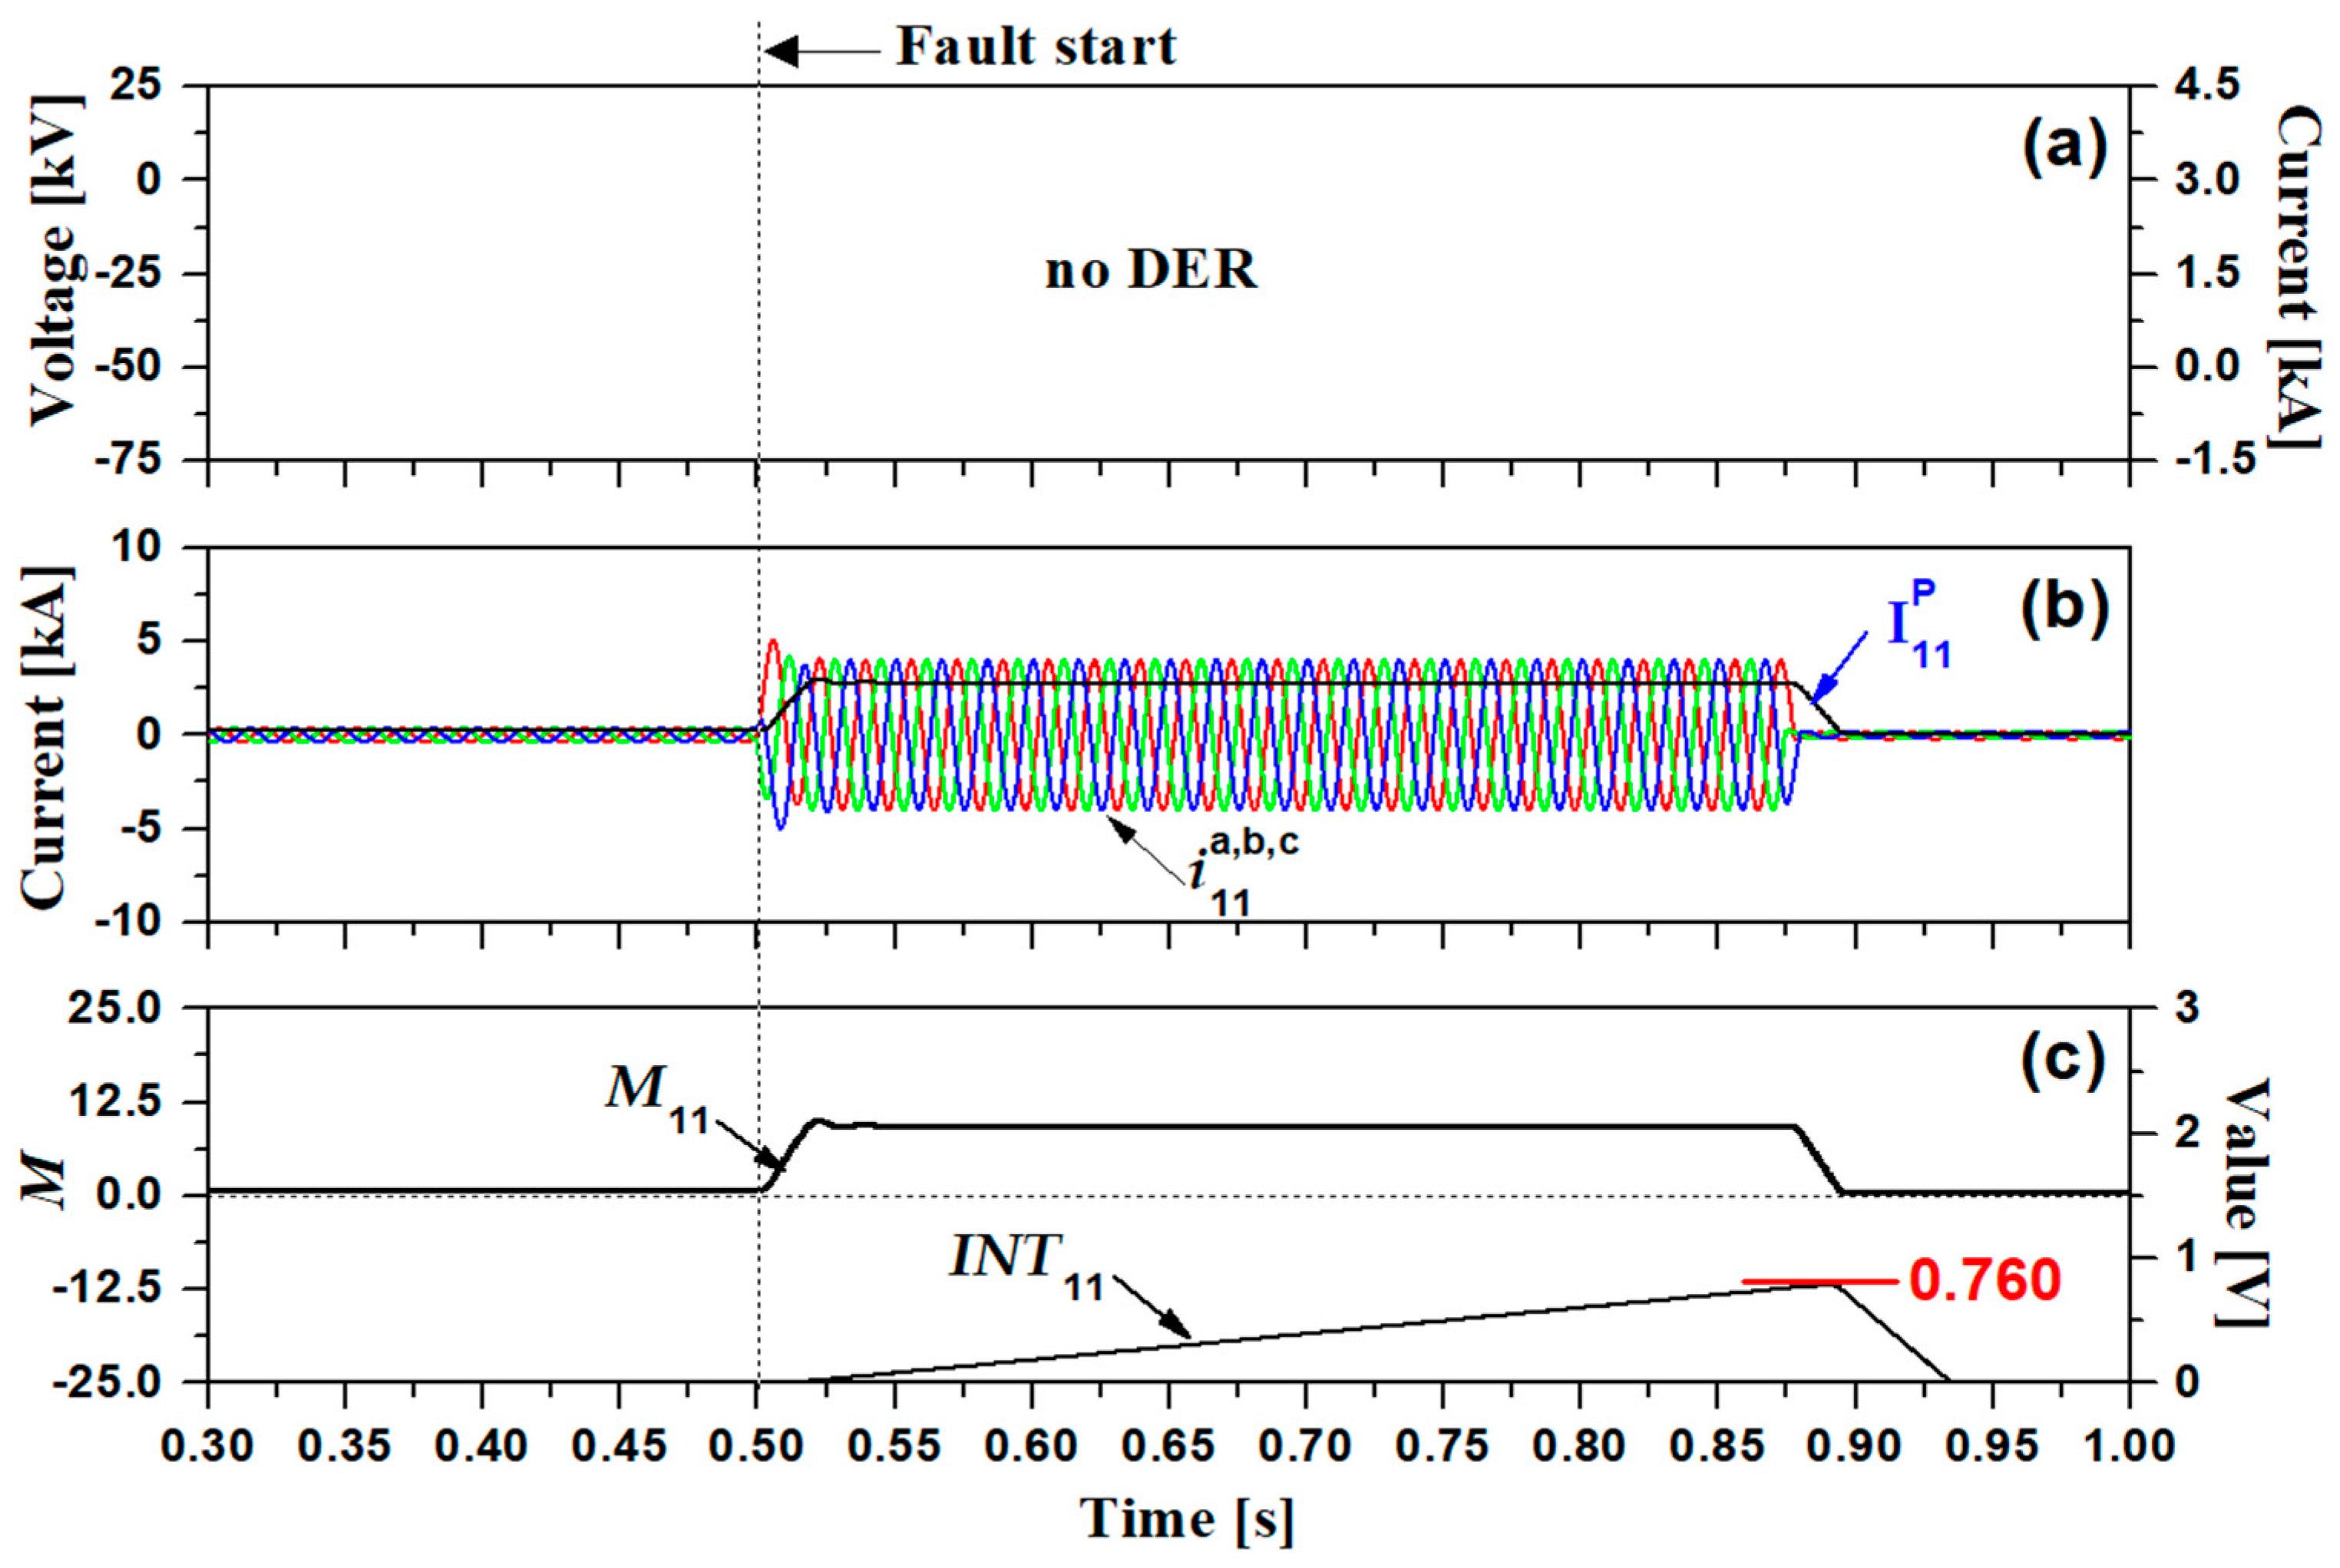
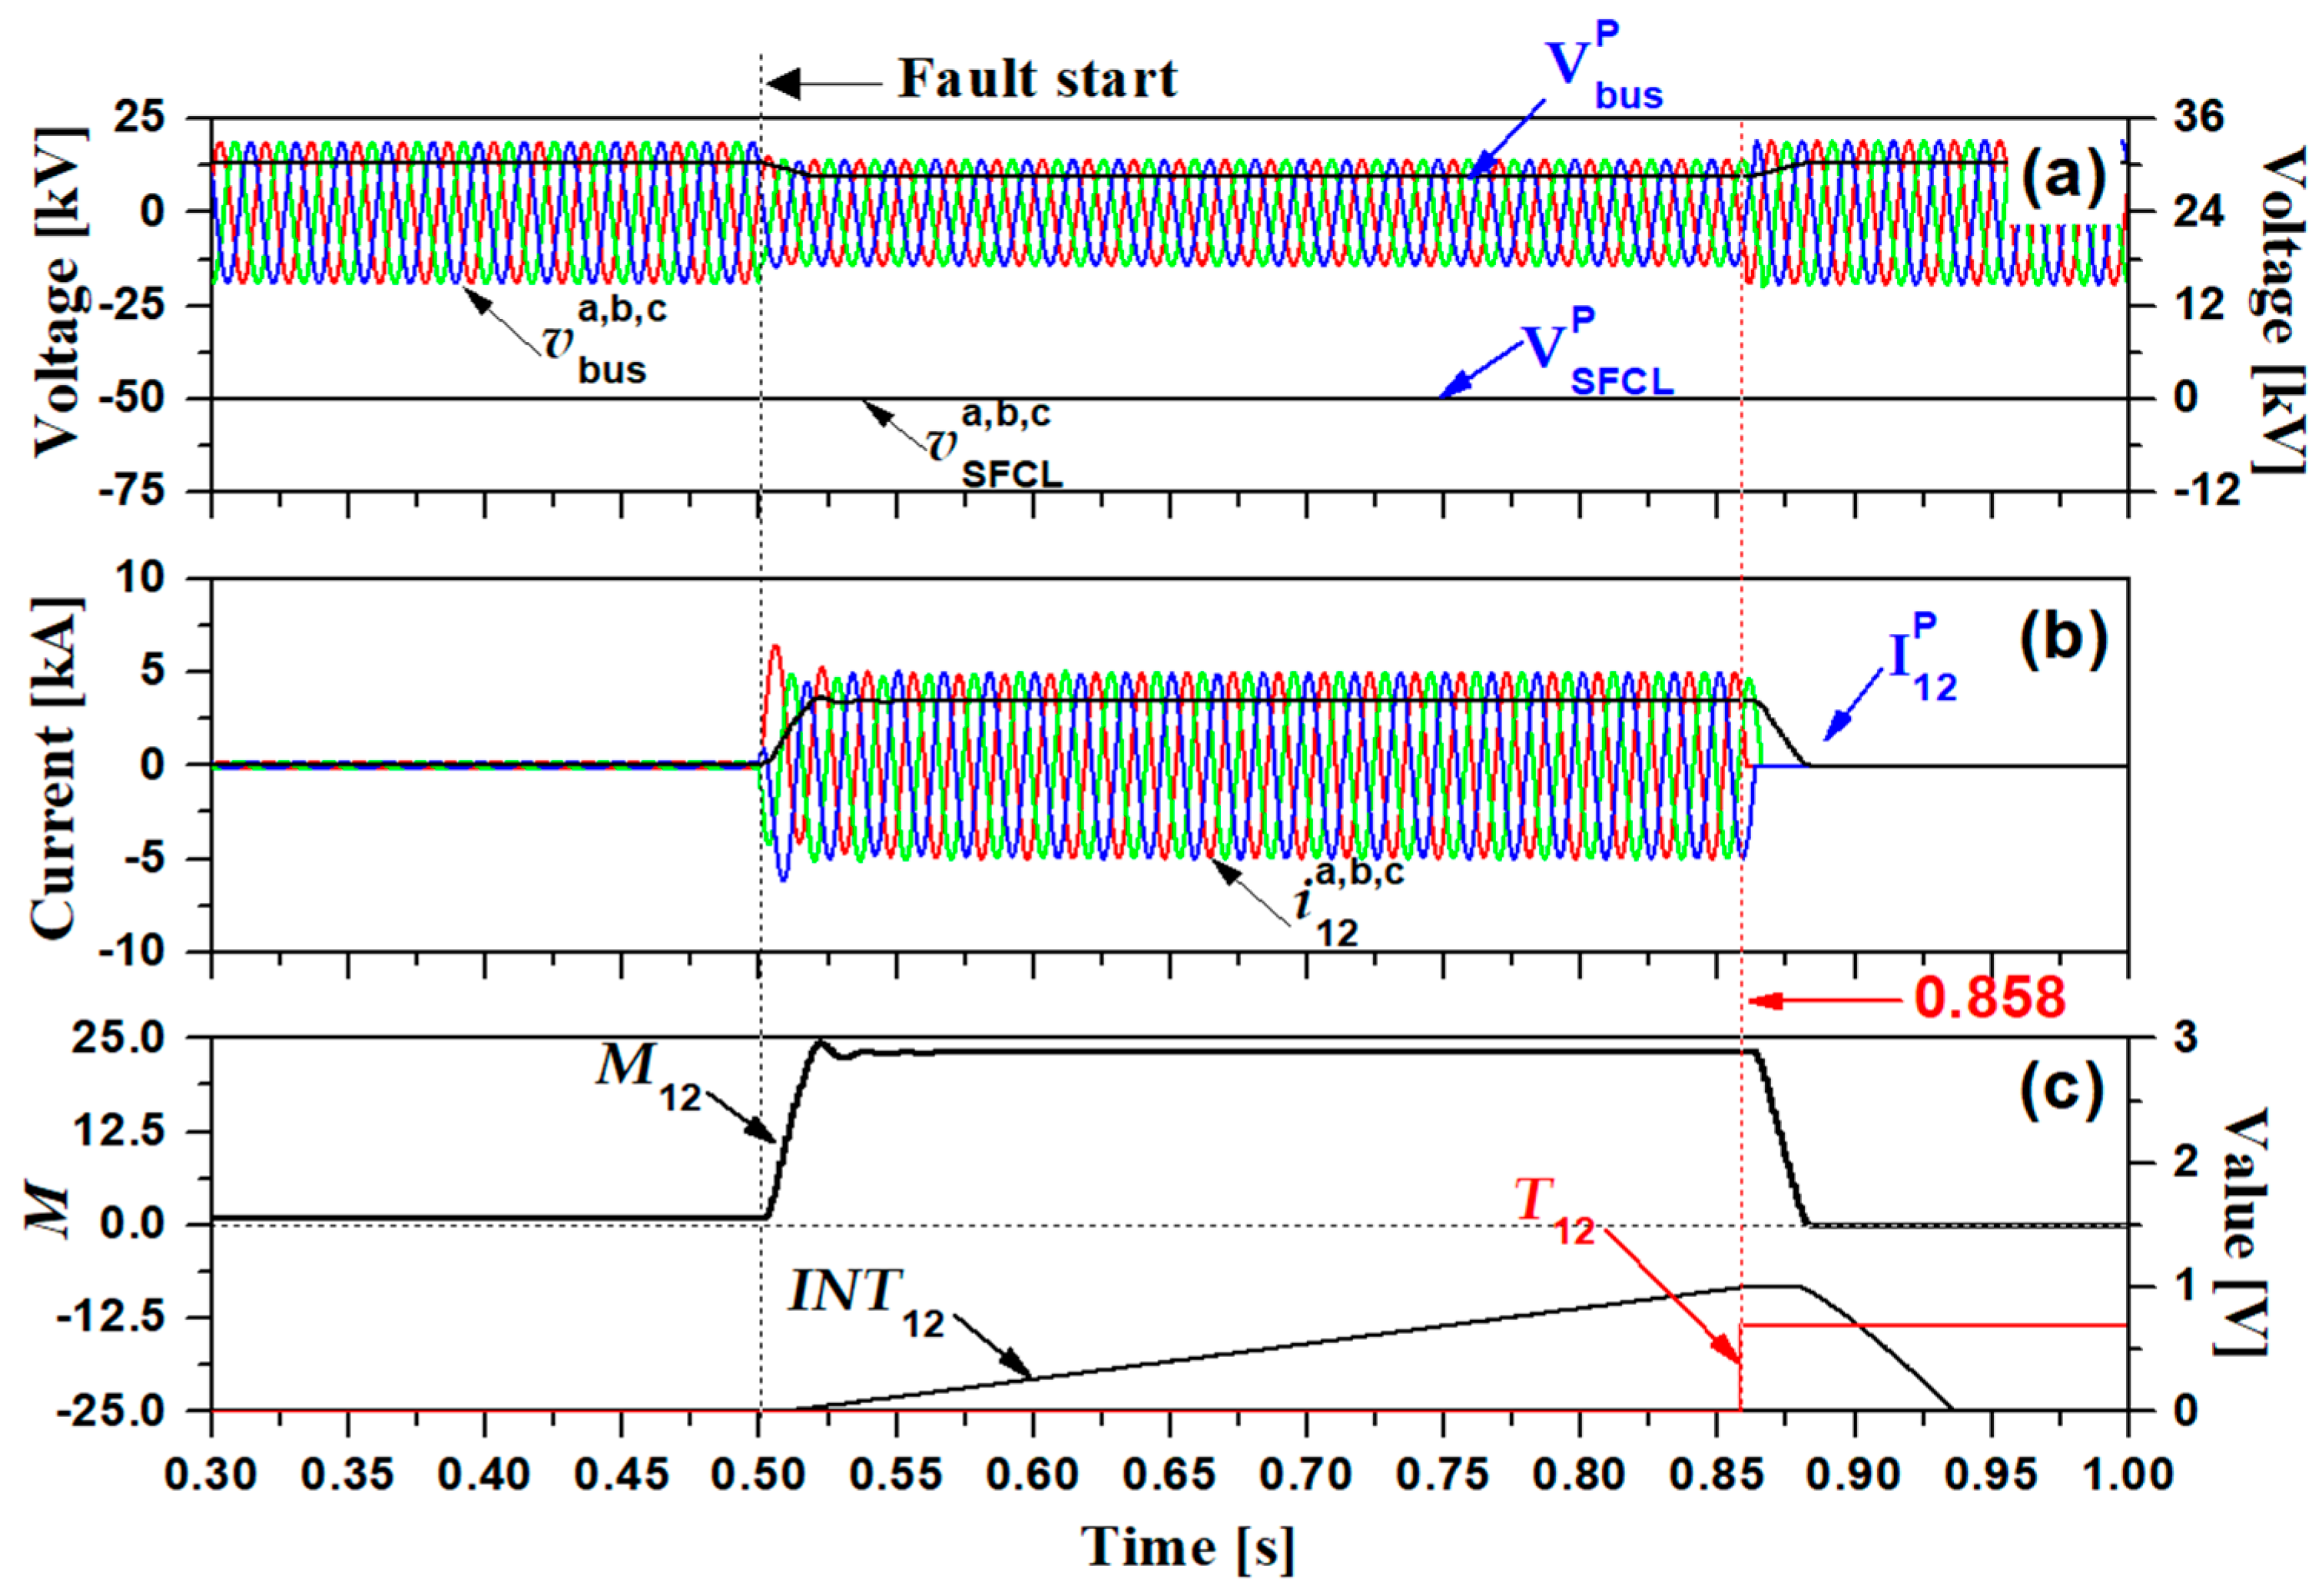
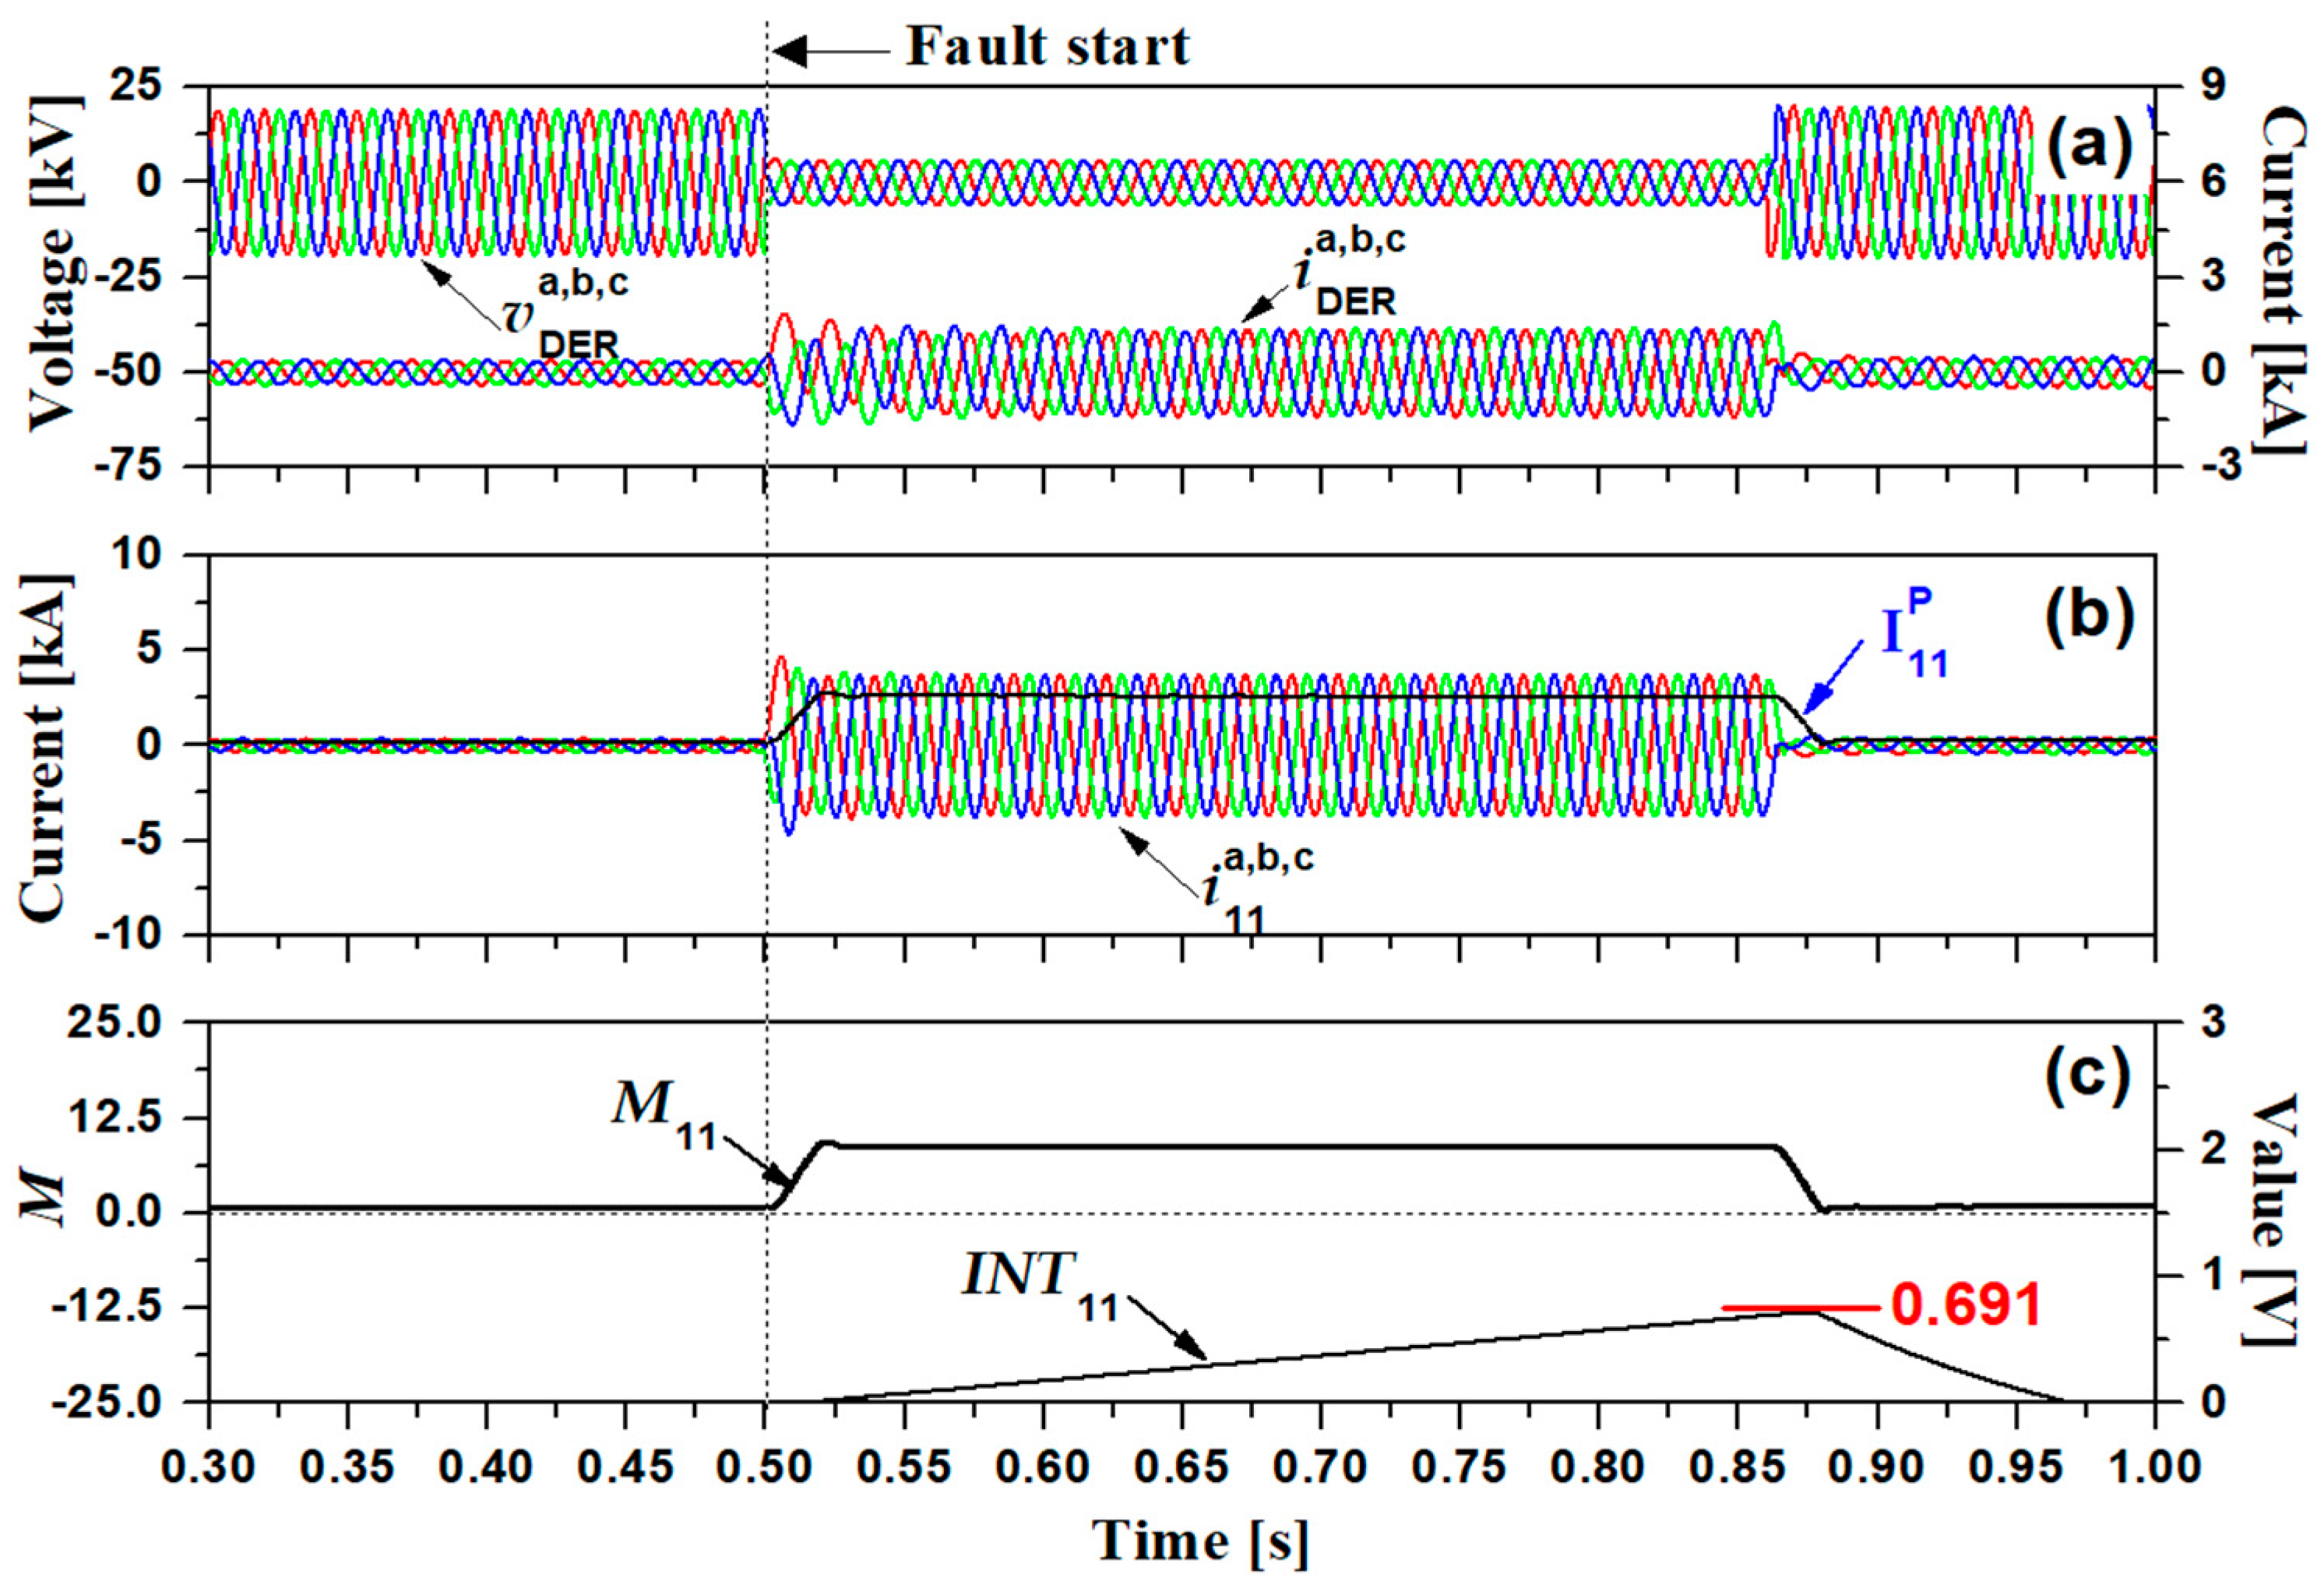
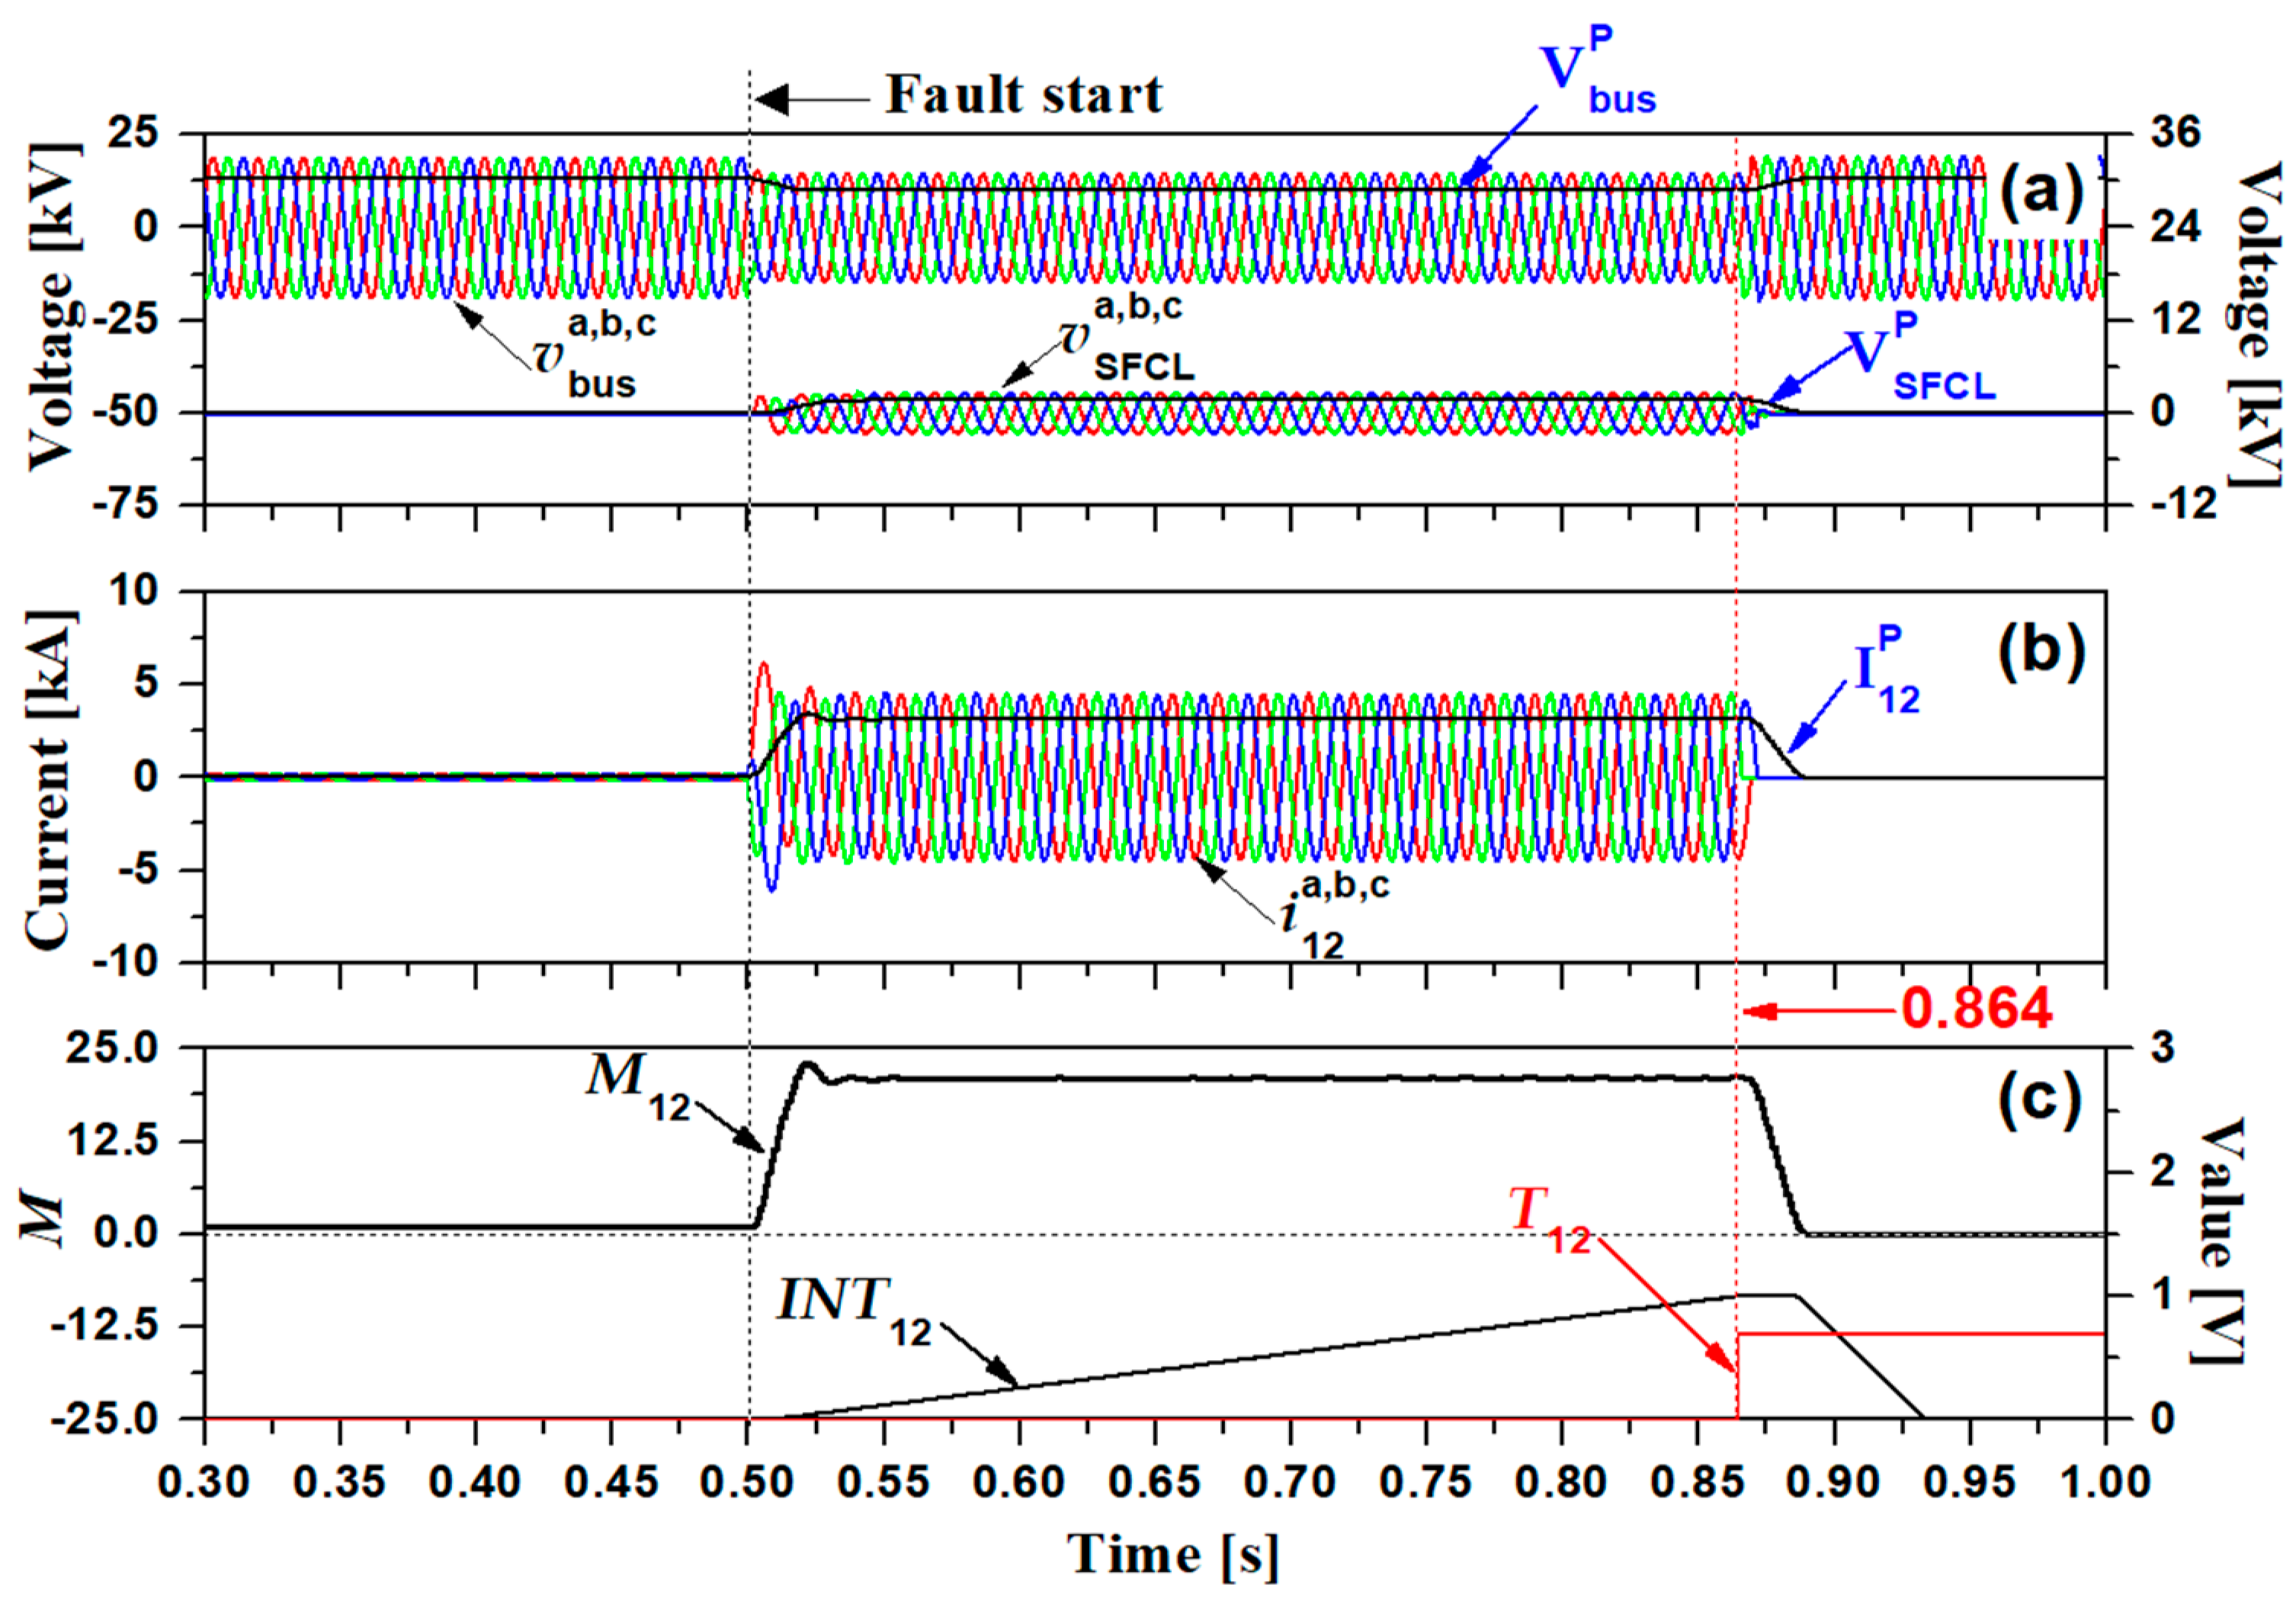
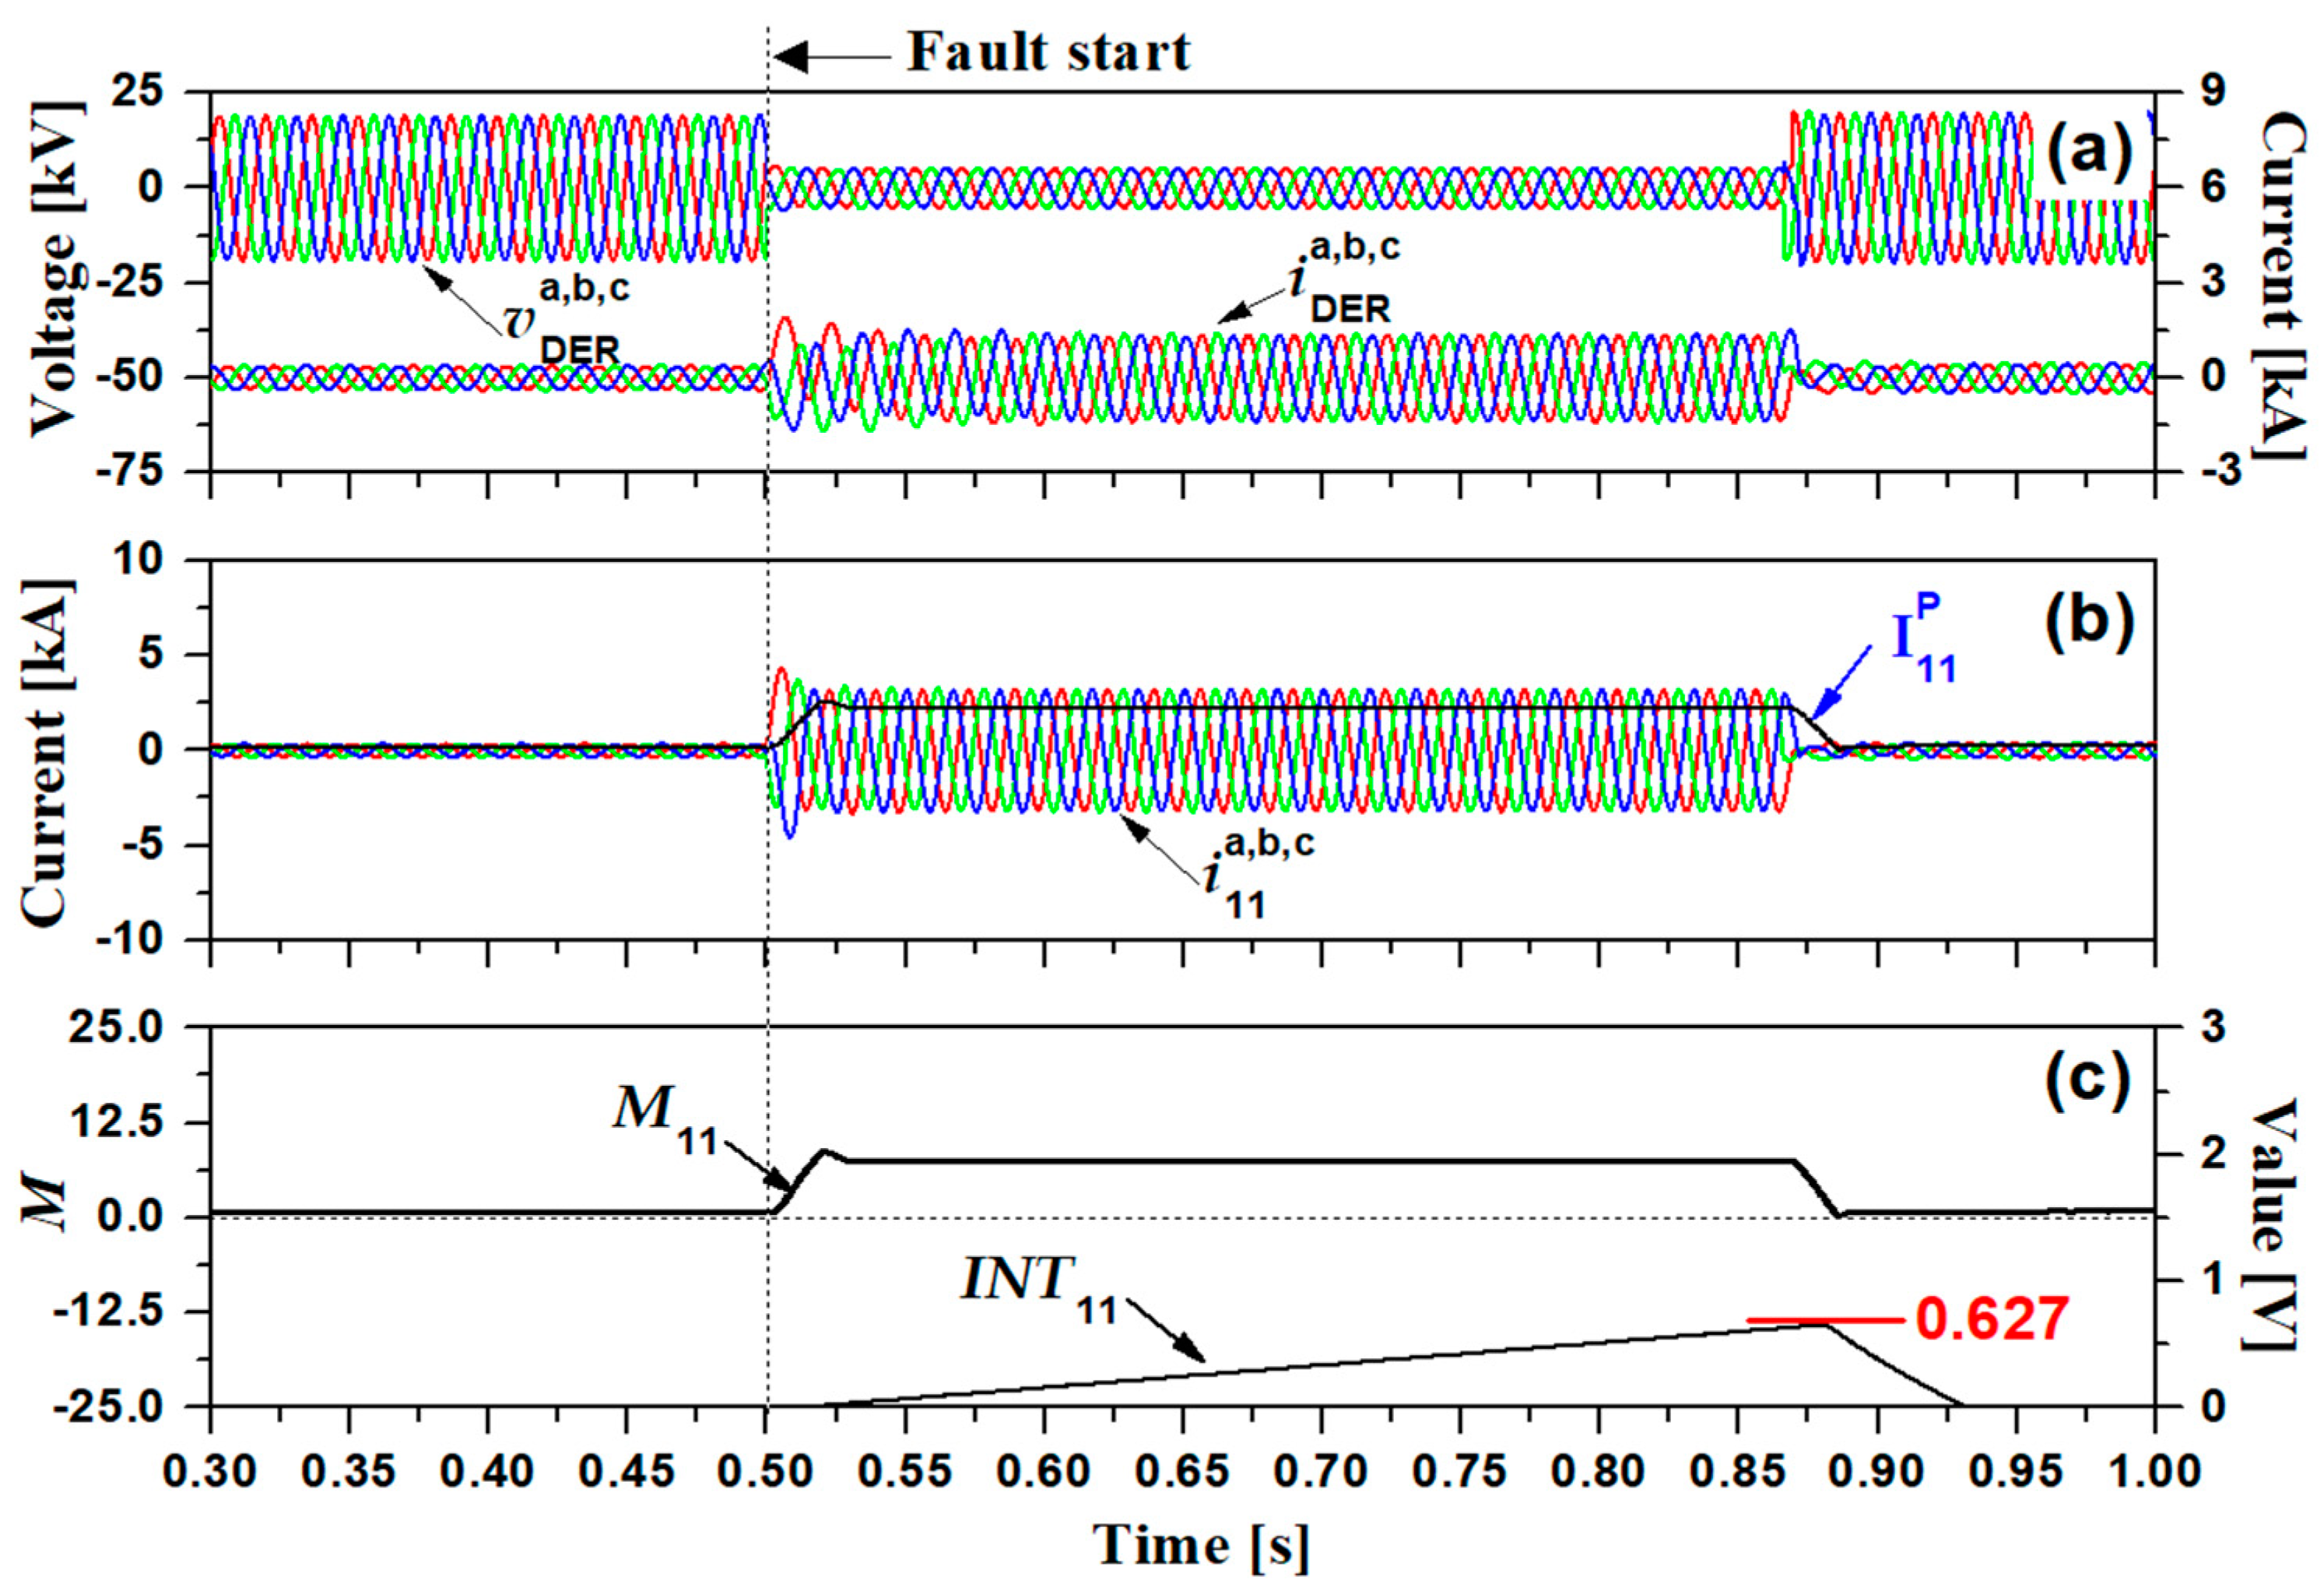
3.2. Fault Simulations of Protection Blinding Case

Simulation result waveforms without DER and SFCL (Case 1) are shown in Figure 14 and Figure 15. The resulting waveform of Case 1 is compared with the rest of the cases. In Figure 14, the bus voltage, SFCL voltage, the current flowing through the main protection relay OCR12, and related relay signals are displayed. As a fault occurs, it can be confirmed that the fault current greatly increases and the bus voltage drop occurs. Additionally, it can be seen that OCR12 starts to accumulate and trips at 0.873 s. In Figure 15, the voltage and current of DER, the current of the backup protection relay OCR11, and related relay signals are displayed. Since the DER is not penetrated, there is no resulting waveform, and as a fault occurs, a fault current of almost the same magnitude as the current flowing through OCR12 flows in OCR11. Additionally, the signal of OCR11, which acts as a backup, accumulates and decreases again at 0.873 s when the fault is removed. If OCR12 does not operate, the accumulated value of OCR11 accumulates to one and trips as a backup to prevent further damage. The integration signal of INT11 is proportional to the operating time and accumulated up to 0.760 in this case.
Simulation result waveforms without DER with SFCL (Case 2) are shown in Figure 16 and Figure 17. In Figure 16, the bus voltage drops and fault currents are reduced compared to Figure 14, as SFCL operates. In addition, OCR12 trips at 0.886 s, and the trip is delayed by 13 ms compared to the results shown in Figure 14. Similarly, in Figure 17, the fault current flowing through OCR11 decreased, and the accumulated INT signal accumulated to a maximum of 0.711. As SFCL operated, the operation time of OCR was delayed and INT slowly accumulated.
Simulation result waveforms with DER without SFCL (Case 3) are shown in Figure 18 and Figure 19. In Figure 18, the fault current flowing through OCR12 increased due to the influence of DER penetration. Accordingly, OCR12 operated in 0.858 s and operated 14 ms faster compared to the result in Figure 14. In Figure 19, the DER voltage has a large voltage drop due to the occurrence of a fault, and the DER current is about twice as large as the normal current. Accordingly, OCR11 accumulated up to 0.691 and decreased compared to 0.760, which is the result of Figure 15.
Simulation result waveforms with DER and SFCL (Case 4) are shown in Figure 20 and Figure 21. In Figure 20, the fault current flowing through OCR12 increased with DER penetration but was limited to some extent by the effect of SFCL. Accordingly, the operation time of OCR12 was 0.864 s. In Figure 21, the peak integration signal value of OCR11 is 0.627, and the INT11 decreased due to the effect of SFCL and also decreased due to the effect of DER penetration, recording the smallest value among all cases.

3.3. Discussion

The results of the sympathetic tripping case from fault simulation were summarized in Table 4. In Case 1 where DER was not penetrated and SFCL was not installed, only OCR11 operated at 0.877 s when a fault occurred. In Case 2 where SFCL was installed in the same situation as Case 1, only OCR11 operated in 0.907 s, and the trip time was delayed by 0.030 s according to the operation of SFCL. In Case 3 where DER was penetrated in the same situation as in Case 1, OCR11 operated in 0.874 s, and the fault current increased due to DER penetration, resulting in a faster trip time. However, due to the fault current contributed by the DER, the sensitively set OCR22 operated in 0.818 s and the sympathetic tripping of the OCR22, installed on the line where the fault did not occur, occurred. In Case 4, where SFCL was installed in the same situation as Case 3, OCR11 operated in 0.904 s, and the fault current was reduced and the trip time was delayed due to the influence of SFCL. Although the fault current was reduced by the operation of SFCL, OCR22 operated in 0.763 s and its trip time became faster compared to Case 3. This is because the peak value of the fault current contributed by the DER became smaller due to the operation of SFCL, but the magnitude of the fault current after the transient component of the fault current became larger compared to Case 3.
The results of the protection blinding case from fault simulation were summarized in Table 5. In the fault simulation to analyze the protection blinding case, the effects of DER penetration and SFCL installation were analyzed using the CTI between OCR12 which operates as a main protector and OCR11 which operates as a backup protection. In Case 1 where DER was not penetrated and SFCL was not installed, OCR12 operated in 0.873 s when a fault occurred, and the INT value of OCR11 operation as a backup at this time was 0.760. In Case 2 where SFCL was installed under the same circumstances as Case 1, OCR12 operated in 0.866 s, and the fault current was reduced due to the influence of SFCL thereby delaying its trip time. At the same time, the INT value of OCR11 operation as a backup is 0.711, and its INT value also decreased due to the influence of SFCL. In the case of Case 3 where DER penetrated in the same situation as Case 1, OCR12 operated in 0.858 s, and its trip time was faster compared to Case 1 due to the fault current contributed by DER. However, the INT value of OCR11 decreased compared to Case 1. As the operating time of OCR12 became faster and the INT value of OCR11 decreased, the CTI between the main and backup OCRs increased more. In Case 4, where SFCL was installed in the same situation as Case 3, OCR12 operated at 0.864 s, and at the same time, the INT value of OCR11 was 0.627. It was confirmed that the operation of OCR12 slowed down with the installation of SFCL and speeded up with the penetration of DER. On the other hand, it was confirmed that the INT value of OCR11 decreased even with the installation of SFCL and also with the penetration of DER.

4. Conclusions

In this paper, modeling was performed for each element of the simulated power distribution system, DER, trigger-type SFCL, OCR, and total system. In addition, fault simulation was performed according to the fault location and DER penetration location in the configured simulated power distribution system. According to the location of the failure and the location of the DER penetration, the failure simulation of the OCR malfunction situation of the sympathetic tripping case and the protection blinding case was performed. In addition, the effect of the linkage of SFCL was also analyzed. Through the fault simulation, how the DER current contributes to the fault current was analyzed. Additionally, an analysis of the trip delay caused by SFCL to OCR independently of the DER current was also performed.
In the sympathetic tripping case, the OCR of the line is irrelevant to the fault malfunction due to the fault current generated by the DER. A feature of this time is that the fault current generated in the DER was input to the OCR in the reverse direction. Additionally, in the protection blinding case, the fault current contributed by the DER increased the fault current of the main protection relay, decreased the fault current of the backup protection relay, and increased the CTI between the two protection relays. As a future study, research on improving the correction method of OCR by reflecting the characteristics of the DER current and the characteristics of SFCL analyzed in this paper will be conducted.

Author Contributions

Writing and methodology, M.-K.P.; Supervision, review and editing, S.-H.L. All authors have read and agreed to the published version of the manuscript.

Funding

This work was supported by the National Research Foundation of Korea (NRF) grant funded by the Korean government (MOE) (No. 2020R1F1A1077206) and was also supported by project for Collabo R&D between Industry, University, and Research Institute funded by Korea Ministry of SMEs and Startups in 2023 (RS-2023-00226455).

Conflicts of Interest

The authors declare no conflict of interest.

References

  1. Faisal, M.; Hannan, M.A.; Ker, P.J.; Hussain, A.; Mansor, M.B.; Blaabjerg, F. Review of energy storage system technologies in microgrid applications: Issues and challenges. IEEE Access 2018, 6, 35143–35164. [Google Scholar] [CrossRef]
  2. Raj, N.T.; Iniyan, S.; Goic, R. A review of renewable energy based cogeneration technologies. Renew. Sustain. Energy Rev. 2011, 15, 3640–3648. [Google Scholar] [CrossRef]
  3. Shah, K.K.; Mundada, A.S.; Pearce, J.M. Performance of US hybrid distributed energy systems: Solar photovoltaic, battery and combined heat and power. Energy Convers. Manag. 2015, 105, 71–80. [Google Scholar] [CrossRef]
  4. Brenna, M.; Foiadelli, F.; Longo, M.; Abegaz, T.D. Integration and Optimization of Renewables and Storages for Rural Electrification. Sustainability 2016, 8, 982. [Google Scholar] [CrossRef]
  5. Zayandehroodi, H.; Mohamed, A.; Shareef, H.; Mohammadjafari, M. A Comprehensive review of protection coordination methods in power distribution systems in the presence of DG. Prz. Elektrotechniczny 2011, 87, 142–148. [Google Scholar]
  6. Shahzad, U.; Kahrobaee, S.; Asgarpoor, S. Protection of Distributed Generation: Challenges and Solutions. Energy Power Eng. 2017, 9, 614. [Google Scholar] [CrossRef]
  7. Papaspiliotopoulos, V.A.; Kleftakis, V.A.; Kotsampopoulos, P.C.; Korres, G.N.; Hatziargyriou, N.D. Hardware-in-the-loop simulation for protection blinding and sympathetic tripping in distribution grids with high penetration of distributed generation. In Proceedings of the MedPower, Athens, Greece, 2–5 November 2014. [Google Scholar]
  8. Maki, K.; Repo, S.; Jarventausta, P. Protection coordination to meet the requirements of blinding problems caused by distributed generation. WSEAS Trans. Circuits Syst. 2005, 4, 674. [Google Scholar]
  9. Lim, S.-H.; Lim, S.-T. Current Limiting and Recovery Characteristics of a Trigger-Type SFCL Using Double Quench. IEEE Trans. Appl. Supercond. 2018, 28, 17572499. [Google Scholar] [CrossRef]
  10. Lim, S.-H.; Han, T.-H.; Cho, Y.-S.; Choi, H.-S.; Han, B.-S.; Lee, S.-W. Quench characteristics of HTSC elements in integrated three-phase flux-lock type SFCL according to ground-fault types. Phys. C Supercond. Appl. 2007, 463, 1198–1203. [Google Scholar] [CrossRef]
  11. Hyun, O.-B.; Park, K.-B.; Sim, J.; Kim, H.-R.; Yim, S.-W.; Oh, I.-S. Introduction of a Hybrid SFCL in KEPCO Grid and Local Points at Issue. IEEE Trans. Appl. Supercond. 2009, 19, 1946–1949. [Google Scholar] [CrossRef]
  12. Lim, S.-H.; Park, M.-K. Analysis on Protection Coordination of OCRs Using Voltage Components for the Application of SFCL in a Power Distribution System with DG. IEEE Trans. Appl. Supercond. 2021, 31, 20994711. [Google Scholar] [CrossRef]
  13. Choi, S.-J.; Lim, S.H. Enhancement on the Fault Ride through Capability of Power Distribution Systems Linked by Distributed Generation due to the Impedance of Superconducting Fault Current Limiters. Energies 2019, 12, 4810. [Google Scholar] [CrossRef]
Figure 1. Schematic diagram of a simulated power distribution system. (a) Sympathetic tripping of adjacent line OCR; (b) Protection blinding of backup OCR.
Energies 16 06137 g001
Figure 2. Configuration of the power distribution system for fault simulation with SFCL and DER.
Energies 16 06137 g002
Figure 3. Example of time-current curve (sympathetic tripping case). (a) without DER; (b) with DER.
Energies 16 06137 g003
Figure 4. Example of time-current curve (protection blinding case). (a) without DER; (b) with DER.
Energies 16 06137 g004
Figure 5. Configuration diagram of trigger-type superconducting fault current limiter (SFCL).
Energies 16 06137 g005
Figure 6. Fault simulation result waveforms without DER and SFCL (Case 1): (a) bus voltage (Vbus) and SFCL voltage (VSFCL) waveforms; (b) fault line current waveforms (I11); (c) current index values (M11), integration signal (INT11) and trip time signal (T11) waveforms.
Energies 16 06137 g006
Figure 7. Fault simulation result waveforms without DER and SFCL (Case 1): (a) DER voltage (VDER) and DER current (IDER) waveforms; (b) adjacent line current waveforms (I22); (c) current index values (M22), integration signal (INT22) and trip time signal (T22) waveforms.
Energies 16 06137 g007
Figure 8. Fault simulation result waveforms without DER with SFCL (Case 2): (a) bus voltage (Vbus) and SFCL voltage (VSFCL) waveforms; (b) fault line current waveforms (I11); (c) current index values (M11), integration signal (INT11) and trip time signal (T11) waveforms.
Energies 16 06137 g008
Figure 9. Fault simulation result waveforms without DER with SFCL (Case 2): (a) DER voltage (VDER) and DER current (IDER) waveforms; (b) adjacent line current waveforms (I22); (c) current index values (M22), integration signal (INT22) and trip time signal (T22) waveforms.
Energies 16 06137 g009
Figure 10. Fault simulation result waveforms with DER without SFCL (Case 3): (a) bus voltage (Vbus) and SFCL voltage (VSFCL) waveforms; (b) fault line current waveforms (I11); (c) current index values (M11), integration signal (INT11) and trip time signal (T11) waveforms.
Energies 16 06137 g010
Figure 11. Fault simulation result waveforms with DER without SFCL (Case 3): (a) DER voltage (VDER) and DER current (IDER) waveforms; (b) adjacent line current waveforms (I22); (c) current index values (M22), integration signal (INT22) and trip time signal (T22) waveforms.
Energies 16 06137 g011
Figure 12. Fault simulation result waveforms with DER and SFCL (Case 4): (a) bus voltage (Vbus) and SFCL voltage (VSFCL) waveforms; (b) fault line current waveforms (I11); (c) current index values (M11), integration signal (INT11) and trip time signal (T11) waveforms.
Energies 16 06137 g012
Figure 13. Fault simulation result waveforms with DER and SFCL (Case 4): (a) DER voltage (VDER) and DER current (IDER) waveforms; (b) adjacent line current waveforms (I22); (c) current index values (M22), integration signal (INT22) and trip time signal (T22) waveforms.
Energies 16 06137 g013
Figure 14. Fault simulation result waveforms without DER and SFCL (Case 1): (a) bus voltage (Vbus) and SFCL voltage (VSFCL) waveforms; (b) main OCR current waveforms (I12); (c) current index values (M12), integration signal (INT12) and trip time signal (T12) waveforms.
Energies 16 06137 g014
Figure 15. Fault simulation result waveforms without DER and SFCL (Case 1): (a) DER voltage (VDER) and DER current (IDER) waveforms; (b) backup OCR current waveforms (I11); (c) current index values (M11) and integration signal (INT11) waveforms.
Energies 16 06137 g015
Figure 16. Fault simulation result waveforms without DER with SFCL (Case 2): (a) bus voltage (Vbus) and SFCL voltage (VSFCL) waveforms; (b) main OCR current waveforms (I12); (c) current index values (M12), integration signal (INT12) and trip time signal (T12) waveforms.
Energies 16 06137 g016
Figure 17. Fault simulation result waveforms without DER with SFCL (Case 2): (a) DER voltage (VDER) and DER current (IDER) waveforms; (b) backup OCR current waveforms (I11); (c) current index values (M11) and integration signal (INT11) waveforms.
Energies 16 06137 g017
Figure 18. Fault simulation result waveforms with DER without SFCL (Case 3): (a) bus voltage (Vbus) and SFCL voltage (VSFCL) waveforms; (b) main OCR current waveforms (I12); (c) current index values (M12), integration signal (INT12) and trip time signal (T12) waveforms.
Energies 16 06137 g018
Figure 19. Fault simulation result waveforms with DER without SFCL (Case 3): (a) DER voltage (VDER) and DER current (IDER) waveforms; (b) backup OCR current waveforms (I11); (c) current index values (M11) and integration signal (INT11) waveforms.
Energies 16 06137 g019
Figure 20. Fault simulation result waveforms with DER and SFCL (Case 4): (a) bus voltage (Vbus) and SFCL voltage (VSFCL) waveforms; (b) main OCR current waveforms (I12); (c) current index values (M12), integration signal (INT12) and trip time signal (T12) waveforms.
Energies 16 06137 g020
Figure 21. Fault simulation result waveforms with DER and SFCL (Case 4): (a) DER voltage (VDER) and DER current (IDER) waveforms; (b) backup OCR current waveforms (I11); (c) current index values (M11) and integration signal (INT11) waveforms.
Energies 16 06137 g021
Table 1. Parameters of simulated power distribution system.
IndexValueUnit
Source & TransformerVoltage (main)154
j1.0
kV
%
Leakage Reactance (main)
Capacity (TRmain)60
154/22.9
MVA
kV
Transformer Ratio (TRmain)
Active power (PDER)4MW
Capacity (TRDER)10
4/22.9
MVA
kV
Transformer Ratio (TRDER)
Distribution LineLine Impedance (Z1)3.86 + j7.42%Ω/km
Line Impedance (Z0)9.87 + j22.68%Ω/km
Line Length (Z11, Z12, Z21, Z22) 5km
LoadLoad (Load11, Load12,
Load21, Load22)
5MW
Power factor (Load11,
Load12, Load21, Load22)
0.95-
Table 2. Parameters of OCR.
IndexValueUnit
CB11TD0.3-
Ipickup0.3kA
CB12TD0.3-
Ipickup0.15kA
CB22TD0.02-
Ipickup0.15kA
CommonA39.85-
B1.084-
p1.95-
Table 3. Parameters of trigger-type superconducting fault current limiter (SFCL).
IndexValueUnit
HTSC & CLRConvergence resistance (Rn)2Ω
Critical current (IC)1.5kA
Current limiting reactor (CLR)j0.8Ω
SWVset1kV
Ireset0.5kA
Table 4. Results of sympathetic tripping case fault simulation.
Trip Time of OCR11Trip Time of OCR22Note
Case10.877 [s]-
Case20.907 [s]-
Case30.874 [s]0.818 [s]OCR22′s sympathetic tripping
Case40.904 [s]0.763 [s]OCR22′s sympathetic tripping
Table 5. Results of protection blinding case fault simulation.
Trip Time of OCR12INT Value of OCR11Note
Case10.873 [s]0.760-
Case20.886 [s]0.711Delayed trip time of OCR12, Decreased INT value of OCR11
Case30.858 [s]0.691Faster trip time of OCR12,
Decreased INT value of OCR11
Case40.864 [s]0.627Faster trip time of OCR12,
Decreased INT value of OCR11
Disclaimer/Publisher’s Note: The statements, opinions and data contained in all publications are solely those of the individual author(s) and contributor(s) and not of MDPI and/or the editor(s). MDPI and/or the editor(s) disclaim responsibility for any injury to people or property resulting from any ideas, methods, instructions or products referred to in the content.

