Article

Energy-Saving Scenarios of an Existing Swimming Pool with the Use of Simple In Situ Measurement

by
Katarzyna Ratajczak
1,*,
Edward Szczechowiak
1 and
Aneta Pobudkowska
2
1
Institute of Environmental Engineering and Building Installations, Faculty of Environmental Engineering and Energy, Poznan University of Technology, 60-965 Poznan, Poland
2
Department of Physical Chemistry, Faculty of Chemistry, Warsaw University of Technology, 00-661 Warszawa, Poland
*
Author to whom correspondence should be addressed.
Energies 2023, 16(16), 5886; https://doi.org/10.3390/en16165886
Submission received: 30 June 2023 / Revised: 30 July 2023 / Accepted: 7 August 2023 / Published: 9 August 2023
(This article belongs to the Section G: Energy and Buildings)

Abstract

:
Swimming is a good form of physical activity that keeps swimmers fit and healthy. In countries with cold climates, swimming is allowed only indoors. Since adequate water and air parameters must be ensured in these buildings, they are very energy-consuming. In new buildings, modern solutions can be used, thanks to which technologically advanced energy-saving systems can be used. Unfortunately, in existing buildings, it is not always possible to make technical changes, or they are associated with high financial expenses. In this article, a method of in situ measurement of selected air parameters is proposed, on the basis of which it is possible to suggest scenarios for changes in the control of air technology and parameters in order to achieve energy savings. The easy measurement method was applied in a typical swimming pool building, and energy-saving measurements were taken on the first day to obtain a baseline. Seven scenarios were analyzed that would lead to a reduction in energy consumption without the introduction of new elements into the facility. The main task was to find a solution that ensured adequate thermal comfort in the building. Significant energy savings were achieved in each scenario: 6–47% compared to measured energy consumption. To improve the energy efficiency of swimming pools, especially in the current energy crisis related to the economic and political situation, all methods for reducing the energy demand are desirable. The proposed assessment method will allow for energy-consuming elements and allow for changes in the use of equipment in the swimming pool building. However, the main objective is to maintain the thermal comfort of swimming pool users, as no savings can be achieved at the expense of worsening the feeling of building users.

1. Introduction

1.1. Characteristic of Swimming Pools

Swimming is a popular form of physical activity and allows people to stay fit, which has an impact on health and well-being. This form of recreation is used by children, adolescents, and adults (including seniors). Pools can be used recreationally, individually, or in the form of organized lessons and activities such as aqua aerobics or Zumba. Each form of activity in the pool brings health benefits [1]. In countries with warm climates, there are many outdoor facilities in which the main focus should be on the proper preparation of swimming pool water. However, in countries with a temperate and cold climate, swimming can only be practiced indoors. Then, it is important to ensure a proper environment in the pool.
Regardless of the type of pool, the most important component is the basin filled with water. Depending on the type of activity in the pool, the water must be properly prepared in terms of thermal and sanitary conditions. It is necessary to ensure a proper water temperature, which should be higher for children and seniors and lower for competitive swimmers and during competitions. In addition, the sanitary parameters of the water in swimming pools are also important, which will ensure safety against pathogens. Water filtration and disinfection are important here [2]. Therefore, the quality of pool water is affected by the type of elements of water technology used, the parameters required by law in various countries, as well as the experience of the people operating a given pool [3]. In water quality assessment processes, it is also important to pay attention to the formation of DBP (disinfection byproducts of swimming pool water), which are present in the water and volatilizing in the air [2,4,5] or pharmaceuticals and personal care products [6,7,8,9]. The formation of DBP, in turn, is associated with pre-swim hygiene [10,11,12,13,14].
To make swimming pool users feel comfortable while staying in the pool, in addition to the appropriate water temperature, appropriate parameters of the air environment surrounding the water are also important. The air temperature should be correlated with the water temperature. According to studies on evaporation from swimming pools, the air temperature should be 1 to 2 K higher than the water temperature [15,16]. This should ensure that evaporation is at a reasonably low level, which has a significant impact on the heat consumption to heat water and air. Furthermore, it provides comfortable conditions for people who come out of the pool wet [17,18]. The second important parameter is relative humidity, which should be maintained at such a level as to limit the evaporation of water from the pool, not causing the condensation of moisture on the surface of the glazed external partitions and not causing a feeling of stuffiness for people [17]. Furthermore, given that the by-products of swimming pool water disinfection are volatile and therefore present in the air, attention should also be paid to the method of removing these compounds from the air, which is influenced by the method of air distribution in indoor swimming pool halls [4,19,20]. The feeling is also influenced by the configuration of the air inlets and exhausts and the entire ventilation system [21,22]. This means that it is important to maintain the balance between water and air, which affects the technology of water and air preparation and, as a result, the consumption of heat and electricity.

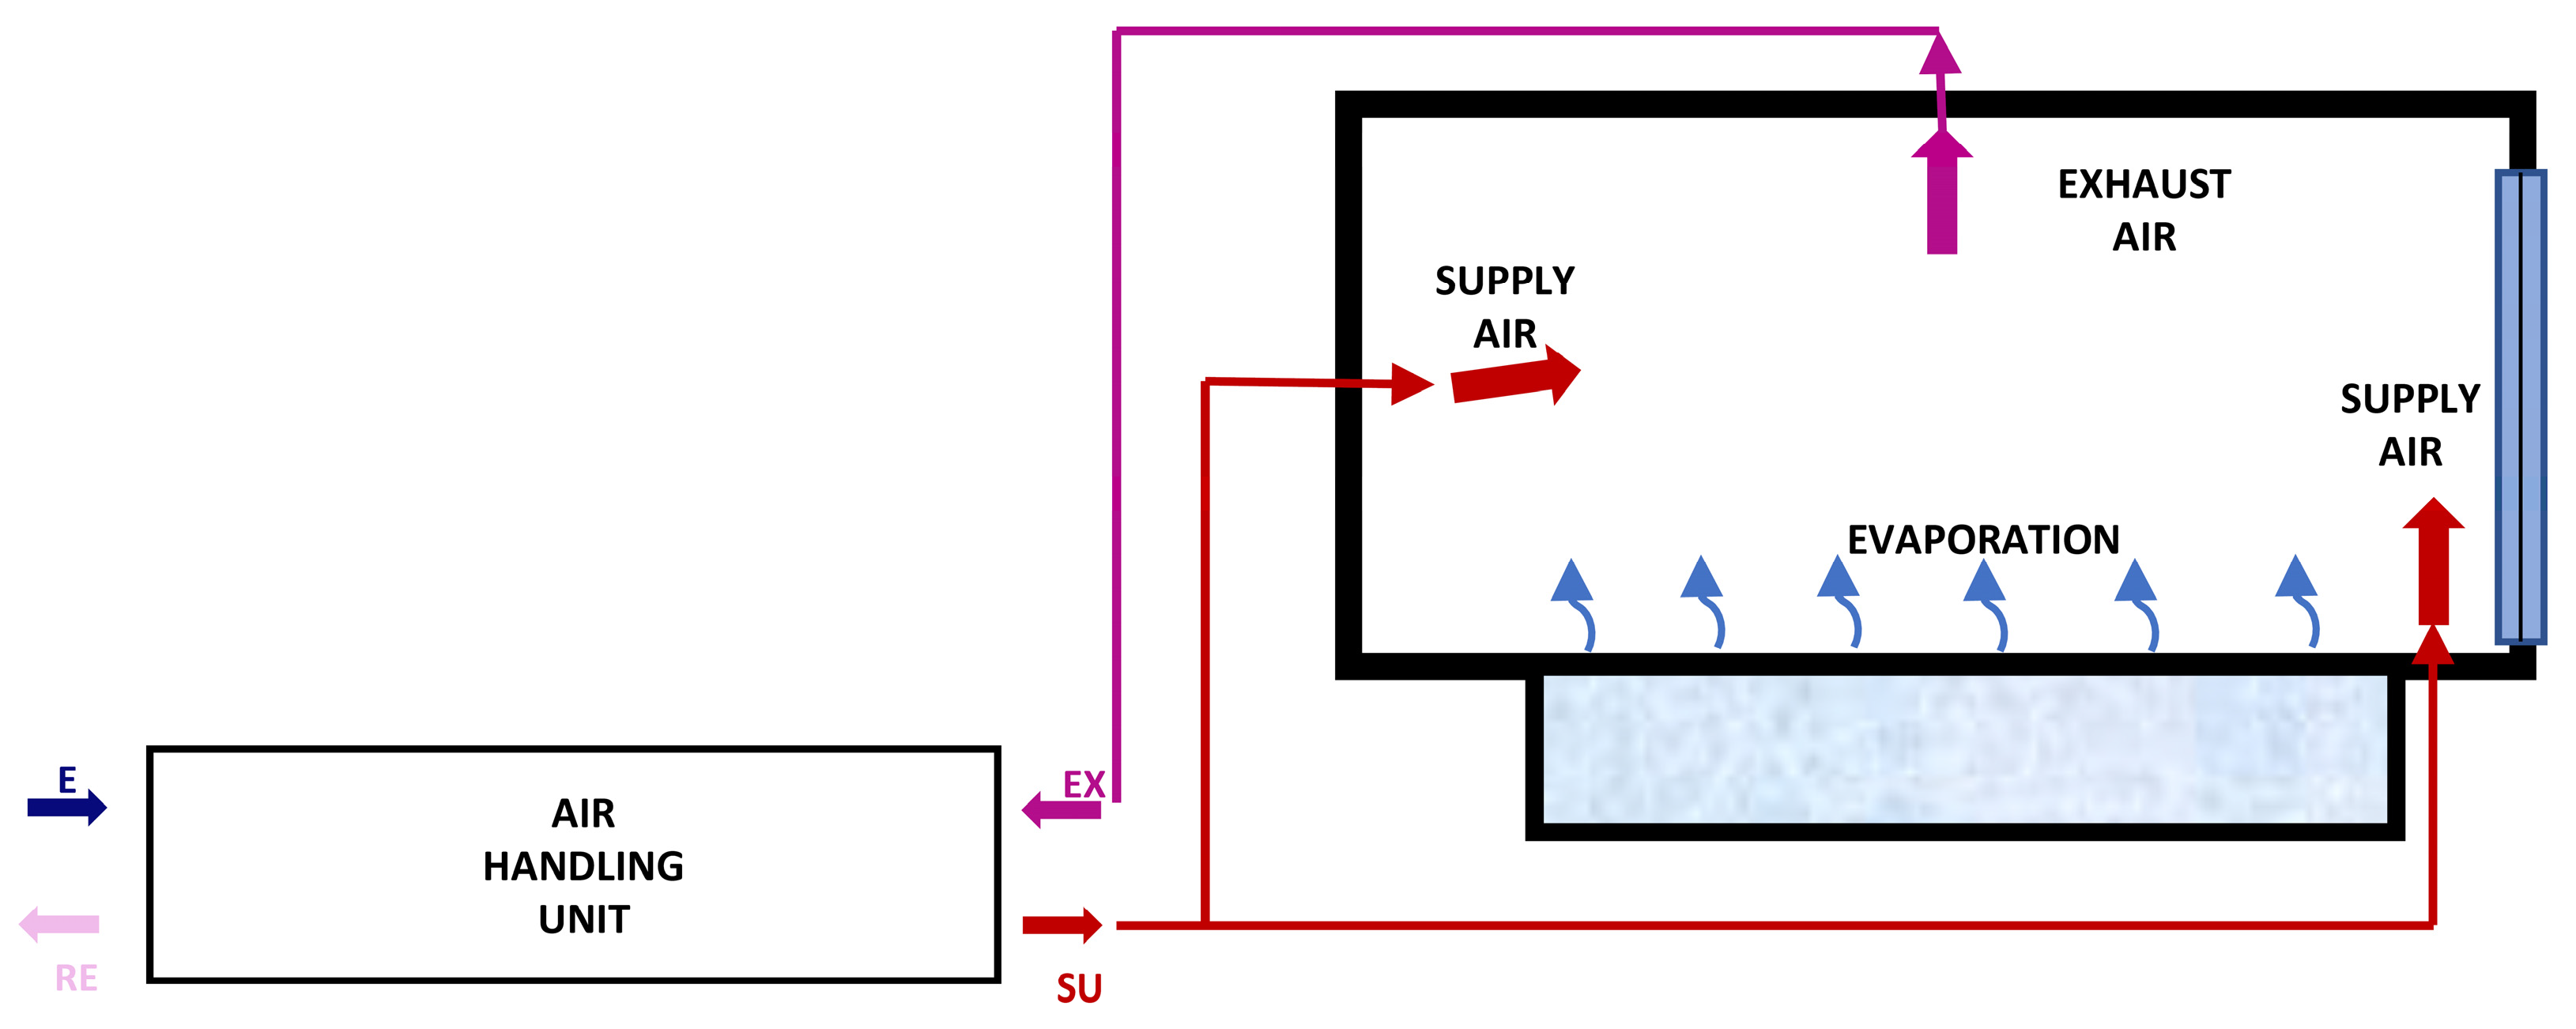
1.2. Ventilation Air Preparation

The heating of ventilation air, which is pumped into the swimming pool, requires a lot of heat and electricity, because this process is continuous [19,23]. The ventilation system fulfills two functions: collecting the moisture gains that evaporate from the water surface, which is necessary to maintain a constant relative humidity in the pool, and ensuring the appropriate air temperature, which is related to covering the penetration losses through the pool partitions. Transmission losses can also be partly covered by the heating system—for example, in the form of underfloor heating, but in most cases, there is only the air heating system. In such a case, the air handling unit maintains the temperature and removes moisture [24].
In the operation of pool facilities, air preparation processes are set to maintain the air temperature and relative humidity in the pool, and the measurement of these parameters is carried out in the exhaust air [19]. The amount of heat that must be supplied to the system to maintain the appropriate air parameters in the swimming pool is affected by the architecture of the facility, the partitions of the quality of the building, and the external climatic conditions. This is similar to other buildings [25]. Heat losses are a function of the thermal insulation of partitions. The amount of energy supplied to cover them is related to the difference in temperature between the temperature maintained in the room and the temperature outside. Because the temperature in the pool is much higher than that in typical buildings, these losses are high; therefore, pools consume a lot of energy to ensure thermal comfort inside, according to previously discussed data [19].

1.3. Possibilities of Reducing Energy Consumption in Indoor Swimming Pools

Due to the fact that ventilation is primarily responsible for the energy consumption of buildings [26], it is worth looking for savings in this area, in which numerous studies are conducted [27]. In the scientific studies described in the literature, there are several possibilities for reducing the consumption of heat and electricity in indoor swimming pools. Several interesting solutions would allow for energy savings in the pool facility. One of the ways to save energy in swimming pool facilities is the use of high-efficiency air preparation systems. The available solutions include the use of air handling units for heat recovery in the form of an open absorption heat pump [28], the use of cross-heat exchangers [19,29], the use of double condensers [19,30], the use of double air recirculation with a heat pump [15,22,23], and the introduction of a ground exchanger for heat recovery in the ventilation system [31]. An example of such an exchanger is a multipipe air ground heat exchanger, the use of which will result in greater energy efficiency than using single-pipe heat exchangers, as suggested in the article [32]. Research suggests that a passive heating system should be used [33], but it must be well designed. One of the solutions is solar thermal collectors [34]. Heat from other buildings can also be used [35] or analyses that take into account the conditions in the field of heat sources in a given country [23]. For heating, a solar-assisted heat pump system is proposed [36]. Good energy results are also obtained by using a heat pump to dehumidify the air [15]. Automatic control is also indicated as a method of achieving energy savings [37,38], and the combination of control and pool cover may be even more beneficial [38]. The use of monitoring systems can help control energy consumption in the building while controlling the parameters of thermal comfort and occupant satisfaction [39]. An interesting solution is the proposed control algorithm that takes into account that the sun’s rays can directly heat pool water [40]. Lowering the temperature of the water is one of the easiest changes that can potentially save energy. When the water temperature is increased by 1 K, the savings may reach 7.4% [41]. The water temperature should be lower than the air temperature. To save energy for heating the air, temperature variations can be used throughout the year [15,42]. However, lowering the water temperature too much can make people reluctant to go to the pool.
Research on thermal comfort in swimming pool facilities shows that the air temperature is, in many cases, lower than the water temperature, which can cause increased evaporation and discomfort [42]. Studies show that the water temperature should be higher for comfort, although this may result in increased energy consumption. Raising the air temperature above the water temperature should be beneficial from the point of view of swimmers, but it may worsen the comfort of non-swimmers [42]. However, this is advantageous in terms of reducing evaporation. Here, a suitable solution may be the decentralization of the ventilation system, ensuring suitable conditions for various groups of users [19].
Good conditions for maintaining thermal comfort are currently provided by ceiling panels, which, as a type of surface heating, can be operated as a low parameter (beneficial from the energy efficiency point of view). Studies of panels with a corrugated surface area and thus increased thermal performance were presented, for example, in [43,44], or with phase change materials in [45], but the possibility of their use in swimming pool facilities to reduce energy consumption has not yet been analyzed.
A strategy that allows for a reduction in electricity consumption is the decrease in ventilation efficiency at night, justified by a lower level of water evaporation when the pool is not used. A variable proportion of outside air can provide better regulation of air parameters within the pool and, at the same time, ensure lower energy consumption [19,22].
All the described possibilities for reducing energy consumption in swimming pools can be divided into those that are possible in a new facility or at the design stage and those that can be used at the operating stage of existing facilities without changing the technology. The research described below will focus only on solutions that do not require changes in systems that require financial outlays. The introduction of existing modern devices, complicated control algorithms, additional renewable energy sources in buildings, and changes in the distribution of air in the pool would require large financial outlays, which, very often, pool operators cannot afford.

1.4. In Situ Measurements for Improving the Energy Performance of Swimming Pools—Research Goal

In the literature, there are suggestions that changes introduced to functioning swimming pool facilities should be made to increase the energy efficiency and reduce costs [46]. The authors noted that it is necessary to prepare a strategy for each facility individually because the pools differ significantly from each other. Other authors also indicate the need to evaluate the existing state of pools [47], and others [35] indicate that savings can be sought by evaluating and optimizing swimming pool HVAC systems. Since there is no single solution that will allow for energy savings, a method of in situ measurements and simple simulations will be proposed for the selected facility in order to find the appropriate strategy for introducing changes. It is a new approach that can improve the thermal comfort in the pool without increasing the energy demand.
Research will focus on existing swimming pool facilities, where it is difficult or even impossible to change existing pool water technology or the preparation of ventilation air. Modern models can be used to design new pool buildings [41]. However, there are many existing buildings where technology may be outdated and inefficient in terms of energy [46]. In this case, the improvement of efficiency is possible only by assessing the existing state, identifying existing problems based on the knowledge of the actual state, and proposing the most favorable change scenario. The research proposed a simple methodology of in situ measurements for indoor swimming pools, due to which it is possible to determine the baseline state and then propose scenarios of changes, mainly in the control of the air preparation system. Seven variants of possible changes were proposed, and calculation formulas for performing simple simulations were given.
The test building is a typical swimming pool facility located in Poland, equipped with a typical ventilation unit. The thermal comfort assessment, energy usage, and change scenarios will be performed. The energy savings associated with corrective actions will be calculated for a typical day during transition periods. According to the general procedure of in situ research discussed, it will be possible to carry out similar measurements and propose changes in other facilities. Research focuses on ensuring thermal comfort parameters, temperature, and relative humidity in the swimming pool while ensuring low energy consumption. It should be remembered that proposed changes that lead to energy savings must not be associated with the deterioration of air and water quality and user dissatisfaction. This approach is a novelty because, usually, either thermal comfort or energy consumption are not analyzed together. It is usually assumed that the conditions in the pool are appropriate. However, a preliminary baseline check was proposed, and the introduced changes take into account this condition.

2. Materials and Methods
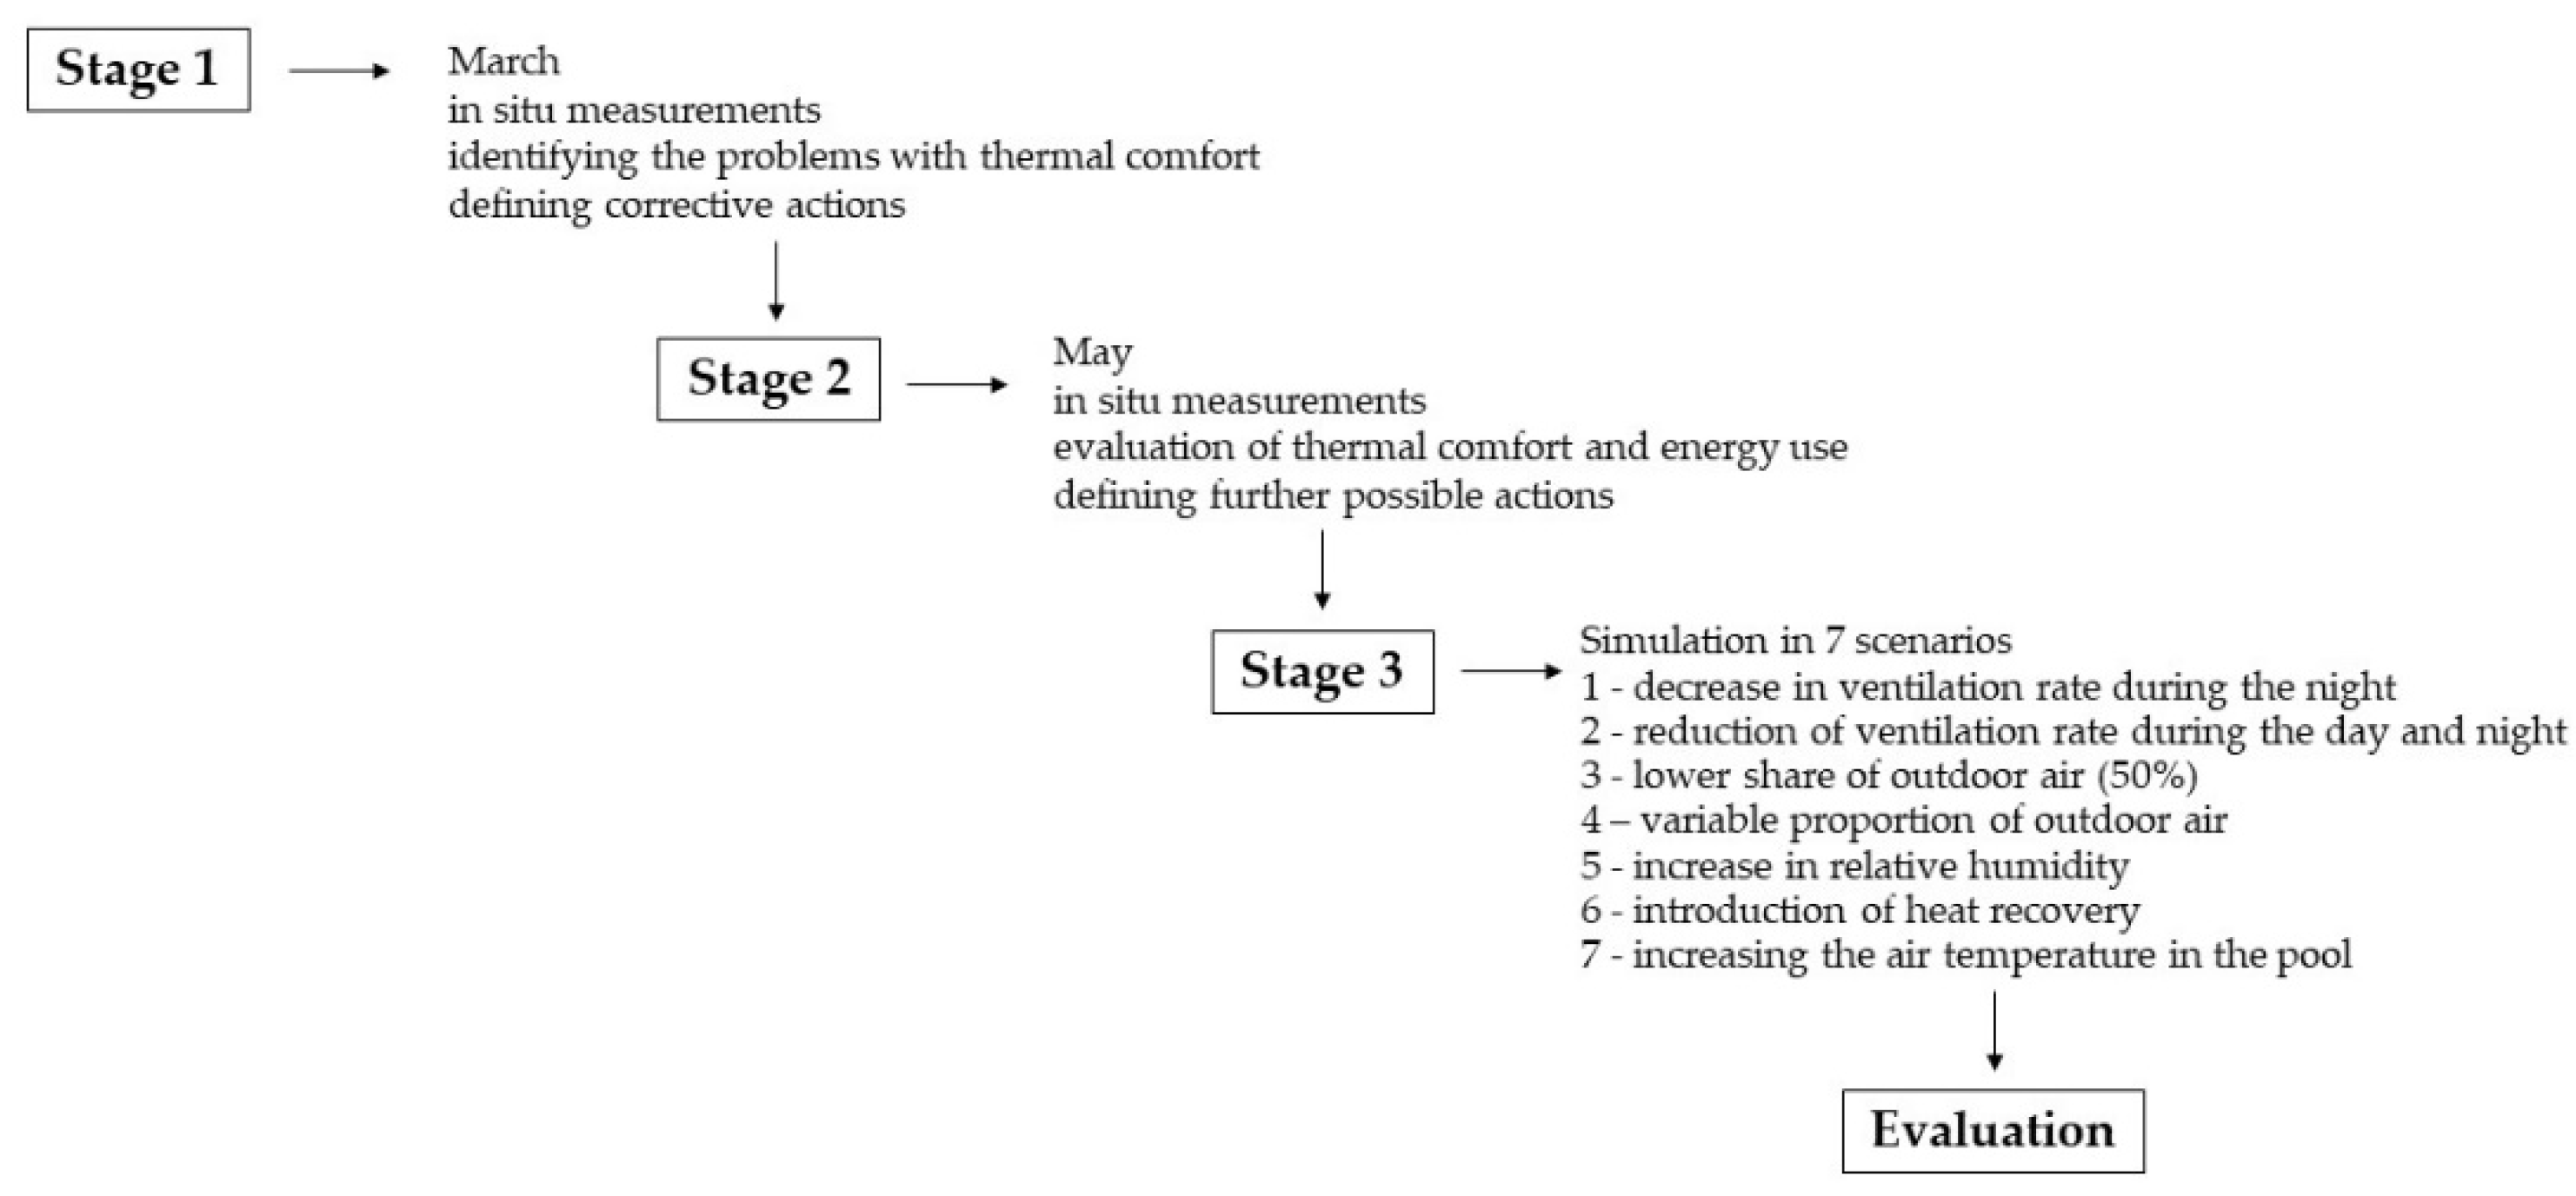
2.1. Research Plan

To show the purpose of performing in situ measurements and the possibility of using their results to improve swimming pools, the research plan was divided into five parts. In the first part, the method for performing in situ measurements in two ranges will be presented: basic (measurement only in the swimming pool) and advanced (use of additional sensors in the air handling unit). Then, the results of the measurements carried out in the real facility will be presented, the effects of the changes introduced will be checked, and simulations will be carried out using scenarios aimed at reducing the energy used to ensure comfortable thermal conditions for the users. The scope of research includes the following.
(1)
Presentation of the method of in situ measurements in a functioning swimming pool facility,
(2)
Stage 1—performing in situ measurements and identifying the possibility of introducing changes in the analyzed facility,
(3)
Stage 2—checking the effects of the introduced changes and possible further diagnostics,
(4)
Stage 3—proposing scenarios aimed at reducing the energy used to ensure comfortable conditions along with a quantitative assessment of effects;
(5)
Define the conclusions.

2.2. Research Principles

2.2.1. General Principles

The proposed method for evaluating the functioning of a swimming pool must be simple and easy to carry out. It was assumed that this is sufficient to carry out short measurements that are able to last an hour. The purpose of this is to enable such tests to be carried out even by the facility’s staff, without the need to install sensors, read their values, or conduct complex analyses of the results obtained.
In the basic version of the in situ measurement method, selected parameters of water and air should be measured so that it is possible to compare them to the parameters recommended for swimming pool facilities and identify problems in the field of non-compliance with these requirements. Based on simple measurements and comparisons to the guidelines (Table 1), it is possible to determine corrective actions. The aim is to present simple solutions that can be implemented even in older swimming pool facilities where control systems are not very advanced.
For each pool, the tests must be designed individually. Pool facilities vary and are often unique. The conditions of each of them must be taken into account. Detailed rules for the location of sensors and the possibility of their introduction to the facility will be presented in the description of the analyzed building.

2.2.2. Measurement Equipment

Indoor environment sensors with remote reading and recording were used for measurements. TS1 type temperature and relative humidity sensors with an ATMega 88 PA processor and an FM FSK 868 MHz radio link were used. The measurement range in the humidity measurement range is 0–100%, with an accuracy of ±2%, and in the temperature range of −40 to +125 °C, with a measurement accuracy of 0.1 °C. Janitz UMG 604 devices were used to measure the power consumption of the control panel. The analyzer continuously measures power consumption continuously. The measured parameters are the electricity consumption in kWh.

2.3. Measurement and Simulation Periods

2.3.1. Measurement Period for In Situ Tests

The measurement period for the in situ tests was 1 h. In the analyzed facility, swimmers change every hour, and it takes a while for the AHU to react to the change in demand. 12:00 was selected for the midweek day, when the pool is used by approximately 25 people. It is the hour with swimming lessons during which the school rents the property.
For the night period without users, 22:00 was selected. As a rule, at 21:00, there is no swimmer. The facility closes at 23:00 after cleaning. An hour was selected after the facility was closed to users.
The measurements were carried out in two stages:
Stage 1: 23/03; daytime 12:00–13:00; nighttime 22:00–23:00.
Stage 2: 25/05; daytime 12:00–13:00; nighttime 22:00–23:00.

2.3.2. Measurement Period for the Simulation

To assess the applied heat demand reduction scenarios, a period of one working week was selected. However, it was assumed that the use of the pool was the same as for the measurement hour analyzed. Therefore, a constant evaporation of water was assumed, which is related to the intensity of swimming and the number of people swimming.

2.4. Equations Used for the Analysis

The symbols in the equations refer to the designations in the air handling unit diagram shown in Figure 1. External air (E) (navy) flows through the heat exchanger, by which the air is heated (HE) (blue). The next level of heat recovery is mixing outdoor air with air exhaust (MIX). As a result of mixing, the relative humidity and temperature of the supplied air can be regulated. Another device is the heater, which heats the air to the required supply air temperature (SU) (red) to cover the losses of air drying and through the building envelope. The heater must be supplied with heat from an external source. Air returning from the pool (EX) has different parameters (pink).

2.4.1. Equations Used for the Calculations in Stage 1 and Stage 2

The sensors used for the temperature measurements record the value t and relative humidity φ in points E (external air), SU (supply air), and EX (exhaust air) according to Figure 1, as well as inside the pool (I). Determining the moisture content in the air based on these two parameters is carried out using Equation (1), taking into account the additional constants whose values are given below the equation [48].
x = 0.62198 · φ · 610.7 · 10 t a 0 + a 1 · t + a 2 · t 2 100,000 φ · 610.7 · 10 t a 0 + a 1 · t + a 2 · t 2   k g k g
where
a 0 = 31.6885 ; a 1 = 0.130755 ; a 2 = 2.92309 · 10 5 for 50   < t 0   ,
a 0 = 31.6866 ; a 1 = 0.130986 ; a 2 = 2.52493 · 10 5 for 0   < t 140   .
In preliminary measurements, based on the results obtained, parameters characterizing the operation of the ventilation will be calculated. The parameter characterizing the efficiency of air drying by the ventilation system is the difference in moisture content x in the exhaust air x E X and in the supply air x S U (Equation (2)).
x = x E X x S U k g k g
The value of Δx(EXSU) is compared with the reference value Δx = 4–6 g/kg [19]. Lower values indicate an incomplete use of the supply air stream, which may suggest that the stream is too large.
Based on the difference in moisture content and the volume of the ventilation air stream V ˙   m 3 h and air density ρ   k g m 3 , it is also possible to determine the amount of received moisture gains from the evaporation of pool water (Equation (3)).
m ˙ e v a p = V ˙ 3600 · x · ρ k g s
Calculations should be carried out for the day and night periods.
With the moisture content in external air x E , in exhaust air x E X , and after the mixing chamber x M I X , the share of external air in the supply air stream can also be determined (Equation (4)).
α = x M I X x E X x E x E X
If the AHU operates with variable external air, then the controlling criterion for the proportion of external air is to maintain a constant value of Δx(EXSU) = 4–6 g/kg. In this case, the value of Δx(EXSU) resulting from the measurements can be calculated from the formula (Equation (2)) and the share of external air from the formula (Equation (4)).
The efficiency of the recuperator for heat recovery during measurements can be determined from Formula (5) when supply and exhaust air flows are equal; however, this requires an additional measurement of the temperature after the heat exchanger tHR in the air handling unit:
ƞ = t H R t E t E X t E
The amount of heat necessary to supply the heater throughout the day is calculated on the basis of the following equation:
Q H , 0 = V ˙ 3600 · c p · ρ · t S U t M I X   k W
In the case of calculations when a heat exchanger is used, the air temperature behind the exchanger t H E will be determined using Equation (7), assuming the value of heat recovery efficiency η and the temperature of the outdoor air t E and exhaust air t E X .
t H E = t E + ƞ · t E X t E  

2.4.2. Stage 3—Scenarios

The proposed scenarios include simulation calculations of air parameters at various locations of the air handling unit and the amount of energy used to prepare the air to the required parameters. The external air will be measured and the moisture content will be determined according to Equation (2). The air temperature and moisture content and enthalpy in the mixing chamber will be calculated using Equations (8)−(10).
h M I X = · h H E + 1 α · h E X  
x M I X = · x E + 1 α · x E X  
t M I X = h M I X 2500.8 · x M I X 1.006 + 1.86 · x M I X  
Since the moisture content of the air in the pool is influenced by the amount of evaporation, the size of the air stream, and the moisture content in the supply air in selected scenarios, this value should be calculated using Equation (11).
x E X = x S U + m ˙ e v a p V ˙ · ρ   k g k g
It can be assumed that XMIX = XSU and XHE = XE. In selected scenarios, a specific value of the moisture content in the air will be assumed to assess the impact of corrective actions on thermal comfort in the pool. It will be necessary to calculate the air density of the air using Equation (12).
ρ = 100,000 · 1 x 461.5 · t + 273.15 · x + 0.62198   k g m 3  
The temperature and relative humidity of the exhaust air (EX) and supply air (SU) will be set to maintain the specified air parameters in the pool. In each scenario, fixed and variable values determined according to the proposed equations will be specified.

2.5. Using the Results to Improve Comfort in Pool Scenarios

Scenarios for improving the energy performance for the analyzed facility will be presented after discussing the test results in Stages 1 and 2 and will be proposed based on the presented results.

2.6. A Detailed Research Plan in the Test Facility

The proposed in situ test procedure is designed to be simple and easy to carry out, so the test plan presented in Table 2 was adopted and presented in Figure 2.

2.7. Simulations in Seven Scenarios

Simulations will be performed after assessing the results of the Stage 2 corrective actions. The results are discussed in Section 4.2. The assumptions for the simulations and the equations used are presented below. The setup for the simulation is as follows.
(1)
Decrease in the ventilation rate during the night by 15%—impact on electricity consumption and amount of heat (Scenario 1),
(2)
Reduction in the ventilation rate during the day and night, by 33% during the day and by another 15% at night (Scenario 2),
(3)
Introduction of a lower share of outdoor air (50%)—Impact on heat demand (Scenario 3),
(4)
Introducing a variable proportion of outdoor air to ensure the regulation of the moisture content in the supply air, which will result in constant relative humidity in the pool (Scenario 4),
(5)
Increase in relative humidity in the swimming pool and a variable proportion of outside air (Scenario 5)
(6)
Induction of heat recovery in the treatment of ventilation air, with assumed heat recovery at a relatively low level (50%)—Impact on the demand for heat to heat the air (Scenario 6),
(7)
Increasing the air temperature in the pool—Impact on the amount of heat supplied to the heater (Scenario 7).
The parameters of the variables in each scenario are listed in Table 3.
The heater baseline for the heater, together with the results of the measurement of the outdoor air parameters for the day analyzed, are presented in Table 4. The time adopted for the analyses in Stage 2 is indicated in bold. The results for each scenario will indicate the hour for which the results were obtained from the measurements to better present the results of the change introduced in a given scenario and to reference the measured values.
In each scenario, the calculation of the heat demand will be performed according to the same method, assuming similar assumptions. The variables will refer to the parameters specified in each scenario. The savings achieved in the amount of heat will be evaluated in relation to the value of 1424 kWh/day (Table 3).
The electricity consumption of the air handling unit with a ventilation rate of 13,400 m3/h was 12.5 kW. On the day analyzed, this gives 300 kWh/day, which, assuming continuous operation of the facility, amounts to 30.017 kWh/year. In each scenario where a change in the ventilation rate is applied, the amount of electricity consumed by the fans will be calculated, and the resulting savings will be related to these two values.

2.8. Simulations in Seven Scenarios and Assumptions

Simulations were carried out for a period of one day. External air was measured during the period from 6:00 a.m. to 6:00 a.m. the next day. In each scenario, the temperature of the supply air was assumed to be constant at 27 °C. This will allow for a better assessment of the impact of individual changes introduced to the operation of the ventilation system. The constant temperature of the air in the pool, which was set by the controller, was also assumed. The share of outside air, according to the results of the in situ measurement in Stage 2, is α = 70%, unless the scenario assumes a variable share of outside air.
The amount of heat was summed up for the entire analyzed day, and the amount of electricity was recalculated in relation to the day and the year.

2.8.1. Scenario 1

The scenario concerns the introduction of a reduced supply of air during the night. During the day, that is, between 6:00 and 21:00, the airflow was set as measured in Stage 2: 13,400 m3/h, and from 22:00, the air handling unit switches to night mode, with 15% reduced capacity. The assumptions and calculation formulas are listed in Table 5.

2.8.2. Scenario 2

The scenario concerns the introduction of a reduced air flow to the supply during the day and at night. This is dictated by the low relative humidity identified in the in situ testing in Stage 2. The assumptions and calculation formulas are listed in Table 6.

2.8.3. Scenario 3

The scenario concerns the introduction of a reduced share of external air. The share will decrease from 70% to 50%. The assumptions and calculation formulas are listed in Table 7.

2.8.4. Scenario 4

Scenario 4 concerns the introduction of a reduced share of external air. The share of external air will be variable based on the assumption that the RH in the pool should be constant at the level measured in Stage 2—47%. The moisture content in the exhaust and supply air is constant and depends on the evaporation rate. External air is introduced into the air handling unit at the share that allows for achieving the fixed value of the moisture content. The assumptions and calculation formulas are listed in Table 8.

2.8.5. Scenario 5

Scenario 5 is basically the same as Scenario 4, but with an increase in the relative humidity in the pool. It was decided that, to ensure thermal comfort, the relative humidity in the pool should be set at 55%. The assumptions and calculation formulas are listed in Table 9.

2.8.6. Scenario 6

Since the in situ measurements in Stage 2 did not identify the airflow through the heat exchanger, the calculations in Scenario 6 assumed that the heat recovery was operating normally. An efficiency of 50% was assumed. The assumptions and calculation formulas are listed in Table 10.

2.8.7. Scenario 7

The scenario refers to an increase in the indoor air temperature during the day and night. It is important to ensure comfortable parameters for people who use the pool. The measured temperature was definitely low (26 °C). The temperature assumed in the scenario will be 29 °C and 1 °C higher than the temperature of the water in the pool. It should be ensured that a higher air temperature in the pool is associated with the need to increase the air temperature. The assumed supply temperature was higher than the temperature maintained at 1 °C. The assumptions and calculation formulas are listed in Table 11.

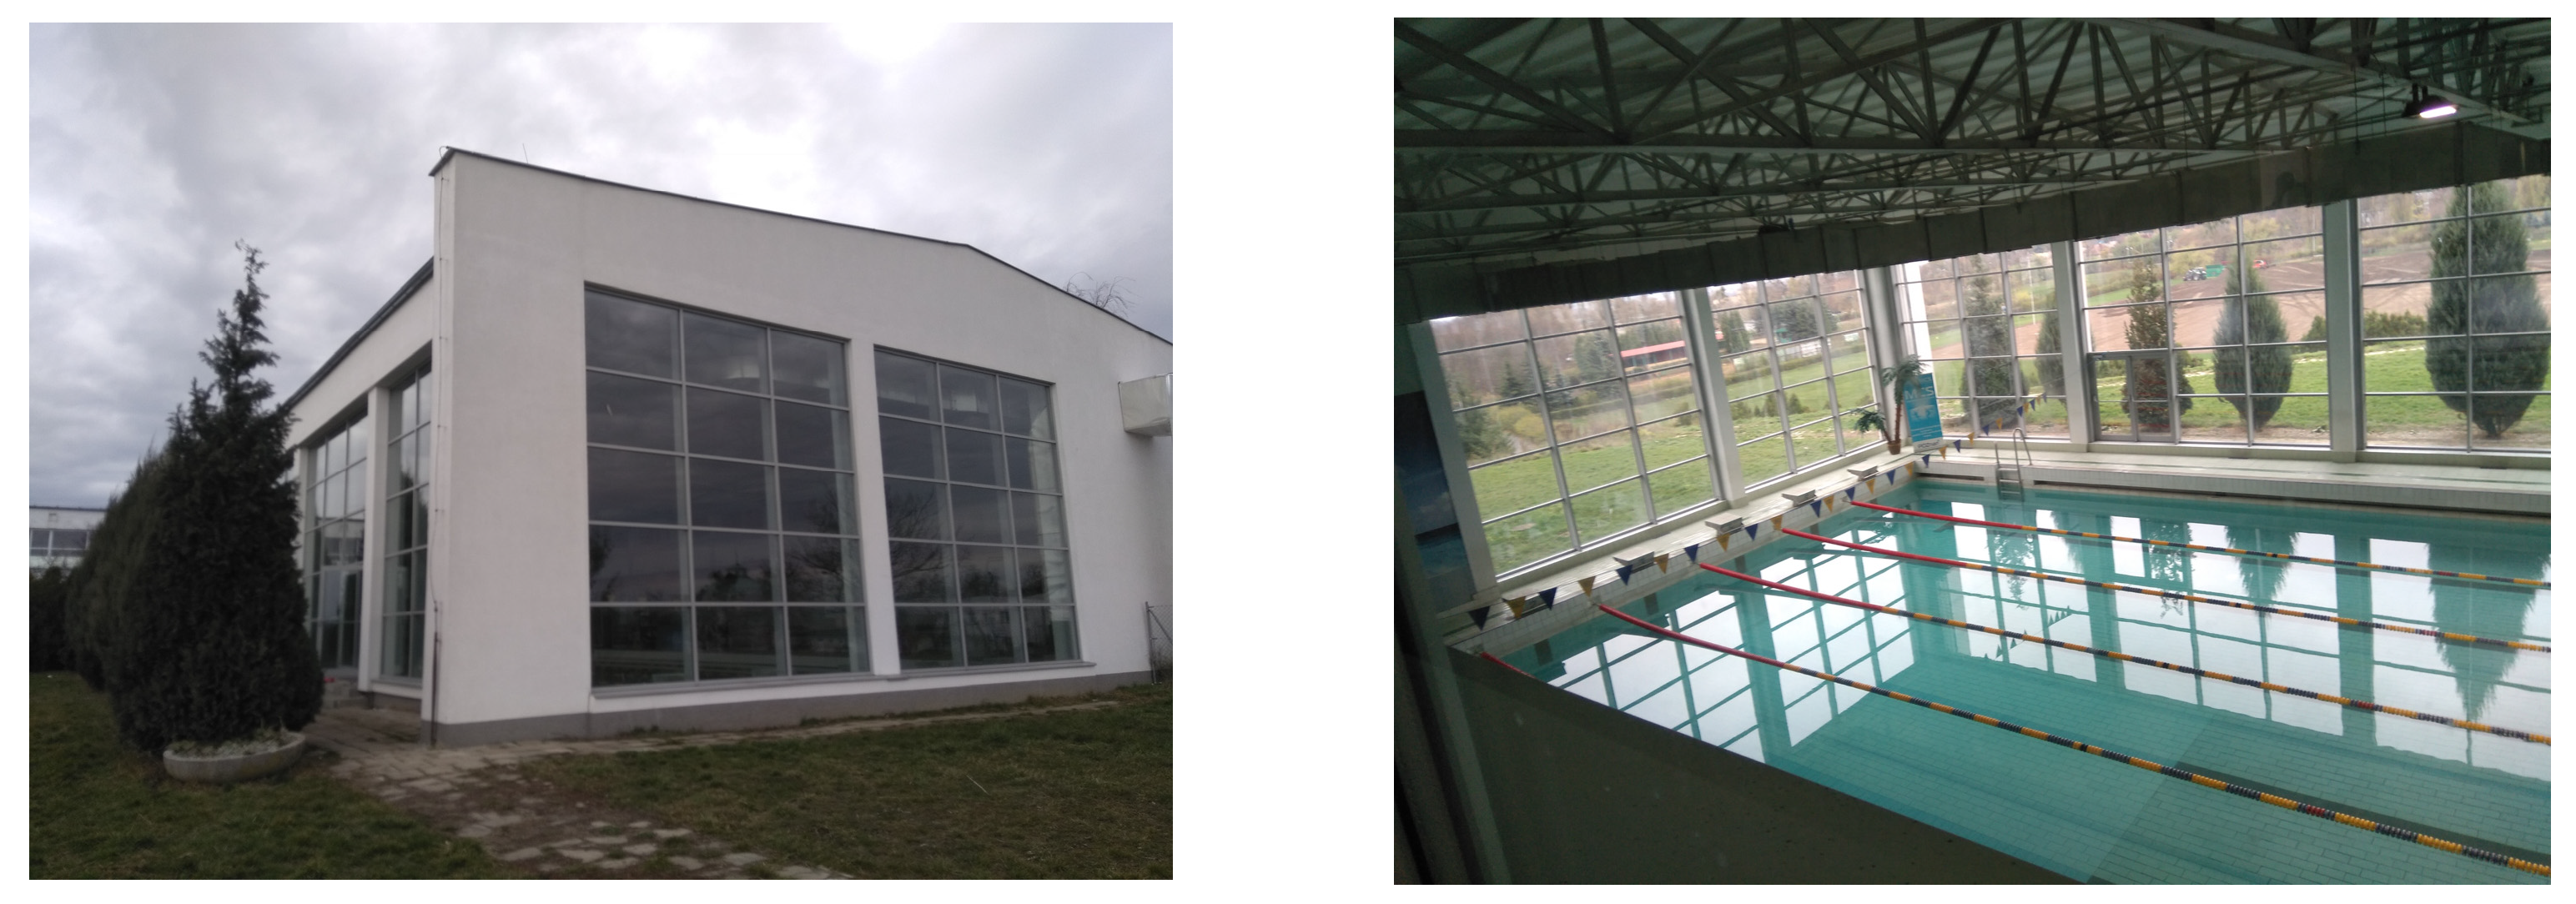
3. Tested Swimming Pool Facility

In situ measurements and simulations of activities aimed at improving the energy performance of the facility while ensuring thermal comfort will be carried out for a typical swimming pool facility located in Poland. The photo of the object is shown in Figure 3.
The facility has a swimming pool with six 25 m lanes. The surface of the water is 312.5 m2. Two exterior walls are completely glazed, and the other walls are internal walls. The building is old, and the windows were replaced 10 years ago. The installation of mechanical ventilation has the function of removing moisture and heating the swimming pool. The air supply is located along the glass walls and along the inner wall in the middle of the room height. The air exhaust is located below the roof above the swimming pool. The ventilation unit is located outside the building. The scheme of the system and the device in the air handling unit is shown in Figure 4.
The pool is open from 6:00 to 22:00 during the week and from 12:00 to 17:00 on weekends. During the week, the main users are students of a primary school with a sports profile. Training and swimming lessons are held from 6:00 to 17:00. In the afternoon, private swimming lessons can be used in the pool by individuals. Changes in users take place every 45 min and are marked by the lifeguards in the pool logbook. On weekdays, the number of users is 350–450 people, from 1 to 35 people at a time. The average number is 22 people.
The air parameters in the pool were measured during the 3 weeks preceding the Stage 1 tests. The average air temperature in the pool was 24.8 ± 0.3 °C. This suggests constant temperature conditions in the pool. The relative humidity of the air was 47.5 ± 7.6%. Higher values occurred during the period of use of the swimming pool (during the opening hours). Lower values, however, occurred at night, when there were no swimmers.

4. Results

4.1. Stage 1—Results

Table 12 summarizes the measurement results for the cold period of the year (March) for one hour when the pool is in use and one hour after it is closed.
Stage 1 results analysis:
(1)
The obtained results of short measurements for day and night correspond to the values measured in the period preceding the tests. This suggests that such measured conditions prevail in the analyzed facility.
(2)
The air temperature in the pool is too low. To ensure appropriate thermal comfort, the air temperature should be higher than the water temperature. In the current state, users may experience thermal discomfort.
(3)
The relative humidity of the air in the pool is at an acceptable level. However, it could be higher. The lower the relative humidity, the faster the evaporation of water from the surface of the bodies of people leaving the pool. This can cause thermal discomfort.
(4)
The amount of evaporation is lower in the absence of users, i.e., during the night. Therefore, the ventilation rate can be reduced during the night. The relative humidity measured at night is significantly lower than that during the day, which is associated with the use of a constant ventilation rate. There is no risk that the air flow reduction will result in exceeding the relative humidity limit.
Recommendations for corrective actions:
(1)
Increase the temperature of the indoor air, which is the value set in the ventilation system in the tested facility.
(2)
Increase the relative humidity of the air in the pool; because it is not possible to set a higher relative humidity, this will be accomplished indirectly by reducing the ventilation rate. Reducing the air rate will cause the relative humidity to increase with the same use of the pool (the same moisture gains) and with a reduced flow of supply air.

4.2. Stage 2—Results

After it was recommended to reduce the ventilation rate and increase the air temperature in the swimming pool, the measurements were repeated. The same day of the week was chosen to check the conditions with more or less the same use of the pool. The results are summarized in Table 13. Measurements were supplemented with the measurements inside the air handling unit; the air parameters behind the mixing chamber were measured to assess the share of outside air in the supply air stream. In addition, the difference is presented in relation to the results obtained two months earlier. A positive value means that the given parameter has increased the value, and a negative measurement results; after the implementation of corrective actions, it has decreased.
Stage 2 results analysis:
(1)
The air temperature in the pool increased by 1.7 °C during the day and by about 1.1 °C at night. However, the air temperature in the pool is still low and reaches 26 °C, with the water temperature equal to 28 °C. Users may still experience thermal discomfort.
(2)
The ventilation rate was reduced by more than 2000 m3/h. Ventilation continues to operate at a constant but reduced air flow throughout the day and night. The controller in the air handling unit does not allow for entering the work schedule in day and night mode. Reducing the air flow reduces the electrical consumption of the fan drive. The power consumption of the air handling unit was 800 W/h. If the reduced air flow was maintained throughout the year, the electricity consumption would be reduced by 7000 kWh, which could bring significant savings in the electricity bills.
(3)
The reduction in the ventilation rate along with the increase in air temperature in the swimming pool did not cause changes in the evaporation rate. A slightly higher amount of moisture gain was measured during the night. During the period of use, the amount of evaporation was slightly lower. However, it could have been influenced by the number of swimmers, which was one person less in Stage 2.
(4)
At the same time, the relative humidity in the swimming pool decreased during the day and at night. The purpose of lowering the air flow was to obtain a higher relative humidity. An increase in the relative humidity could not be achieved, which may cause thermal discomfort.
(5)
Due to the measurement inside the air handling unit, it was determined that the share of outside air in the supply air flows is 70%. The air handling unit did not change during the testing period, so the share of outdoor air in March was also 70%. As a rule, in the colder period, the proportion of outside air can be lower by up to 30%, especially when the outside air contains little moisture. Therefore, it is assumed that savings in heat consumption can be achieved by reducing the share of outdoor air. It may also be the reason for the low relative humidity in the pool. This is because there is little possibility of controlling the moisture content in the supply air if the external air flow rate is set constant.
(6)
The cross-flow exchanger for heat recovery was found to not work. Calculated on the basis of the value of moisture content in the exhaust air, the outside air, and the air behind the mixing chamber, the share of outside air allows for concluding that the air in the AHU flows through the bypass. The use of bypass in winter allows the exchanger to be protected against frosting. Due to the lack of the automatic control of the AHU, the adjustment of the bypass damper was not taken into account during service. Including a heat exchanger in the operation of the AHU would allow for significant savings.
Based on the measurements carried out, the results obtained, and their analysis in terms of the possibility of introducing certain changes in the analyzed facility, it is proposed to conduct further analyses in the scope of the possibility of improving thermal comfort and energy consumption in the tested facility. Since the introduced changes in Stage 2 did not bring the expected results and their introduction would require constant control and manual changes of settings, the assessment of the results for the proposed further changes will be carried out by performing calculations and simulations.

4.3. Simulation Results—Thermal Comfort

In situ measurements have identified too low of a relative humidity in the pool, which causes discomfort for swimmers, especially after leaving the water. In three scenarios (1, 2, 5), changes were proposed to improve thermal comfort in terms of relative humidity. In Scenario 1, the supply air stream was reduced by 15% compared to the air stream measured in Stage 2 of the in situ measurements. During the day, the stream remained unchanged. Scenario 2 introduced a reduced flow of air supplied during the day (−33%) and during the night (for another 15%). Scenario 5 assumes that, in the pool, relative humidity must be maintained at a higher level than the measured one, at 55% during the period of use. This is the recommended value of Table 1.
Figure 5 shows the simulation results of these three scenarios.
Due to the reduction in air flow during the night in Scenario 1, a higher relative humidity was obtained during the night. During the day, compared to the measured variant, there were no changes in this regard. The relative humidity ranged from 45% to 51%. Reducing the ventilation rate results in improved thermal comfort.
Scenario 5 assumes that the relative humidity is kept much higher than the measured one and is, at the same time, within the recommended values. In this situation, the swimmers will feel comfortable. In Scenario 2, a similar effect was obtained by reducing the air flow throughout the day. The average relative humidity in Scenario 2 is 52.8%, and in Scenario 5, it is 56.5%. In both cases, the internal environment was obtained to ensure user comfort.
The second parameter that affects the comfort feeling is the temperature of the water and the temperature of the air. In the facility analyzed, the water temperature was measured in two stages and the temperature was assessed as appropriate for the purpose of the swimming pool. The value of 28 °C is maintained. Variants 1–6 did not take into account changes in the temperature of indoor air in the swimming pool to focus on individual variants of changes. The established air temperature in the swimming pool was assumed to be 26 °C. In Scenario 7, it was decided to increase the maintained temperature to 29 °C. This resulted in the need to recalculate the heat demand. The temperature of the air supplied and the temperature of the air in the mixing chamber (before the heater) increased. The results of the change in the air temperature in the pool regarding the consumption of heat necessary to supply are shown in Figure 6.
Ensuring a higher air temperature in the pool is associated with the need to incur the higher financial outlays necessary to heat the ventilation air. It was calculated that, for the day analyzed, this difference is 16% (discussed in the next section). This value will not be recalculated on an annual basis because the actual demand for heat is affected by the external climate. This variant was intended to show that the introduction of a comfort temperature will not be associated with significantly higher costs. At the same time, it should be noted that, to keep the relative humidity at a comfortable level, the ventilation rate must be reduced, as discussed in the results presented in Figure 5. Reducing the ventilation rate will lead to a reduction in electricity costs. When considering the changes that are necessary to introduce in the facility, several scenarios should be taken into account at the same time in order to realistically assess the profitability of investing in changes. Table 14 presents a comparison of the results obtained in seven variants in terms of the thermal comfort and baseline.
The proposed corrective action scenarios allowed for the improvement of the air parameters in the pool. All measurements carried out in March and May showed that the air temperature and relative humidity are lower than the recommendations regarding comfort parameters. By performing seven simulations, it was shown that it is possible to improve this state. This can be achieved by changing the temperature and relative humidity settings or by lowering the ventilation rate, changing the damper settings in the air handling unit, or scheduling ventilation operations according to the use. In the analyzed facility, it is possible to increase indoor air (Scenario 7), but the staff may be concerned about the increase in costs. In terms of relative humidity, the best result was obtained in options 2, 3, and 5. The decision to introduce specific changes should be based on the results obtained in terms of heat demand and electricity consumption.

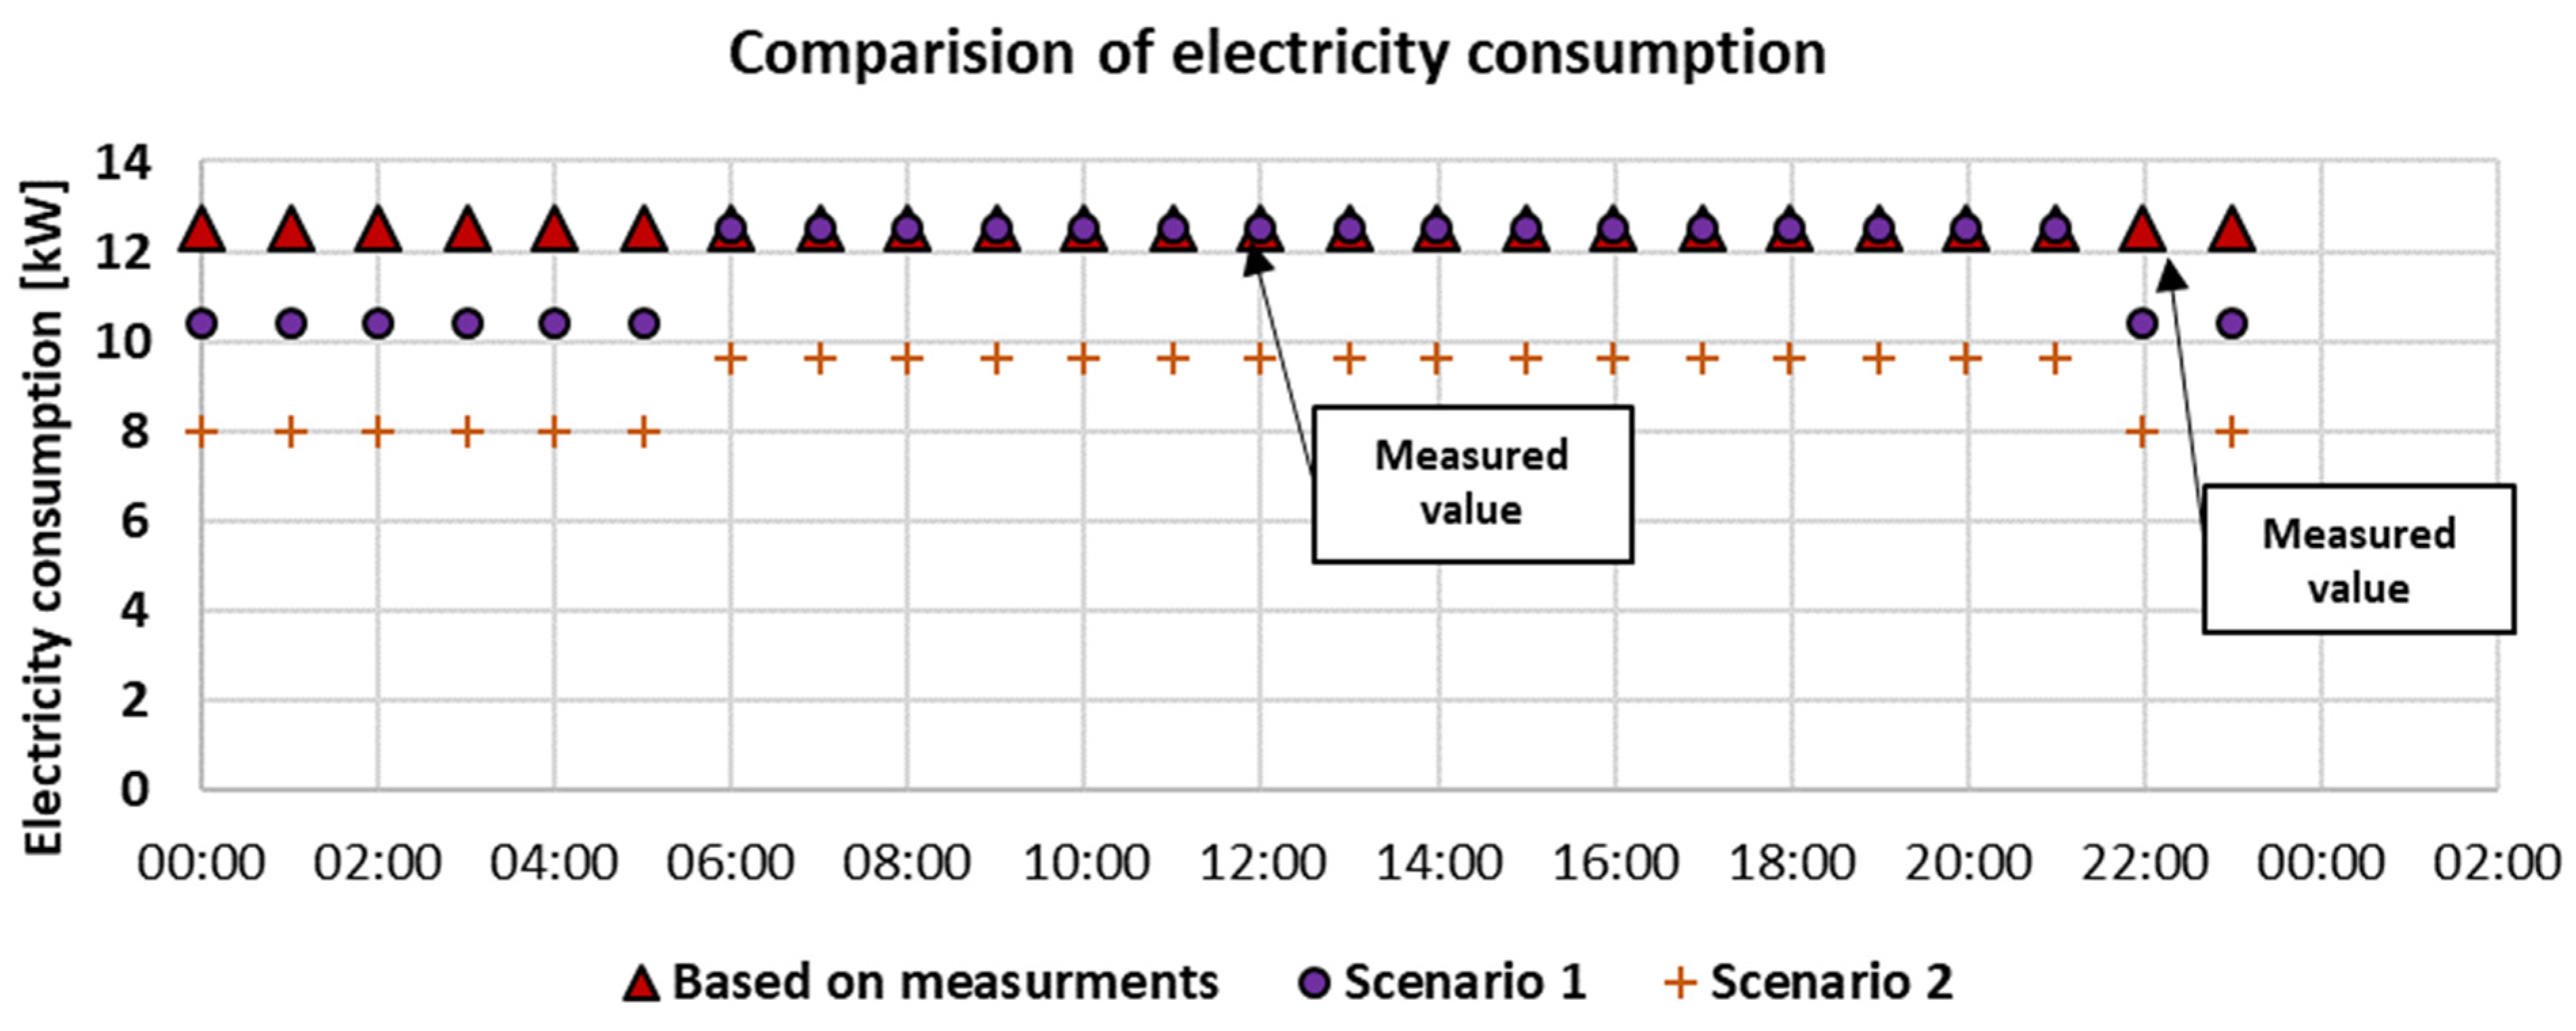
4.4. Simulation Results—Electricity Consumption

The changes introduced in the operation of the air handling unit in terms of electricity consumption apply to scenarios in which the ventilation rate has changed. For comparison, baseline values will be adopted: the constant ventilation efficiency throughout the day and the results of Scenarios 1 and 2, in which the ventilation rate was reduced. Figure 7 presents the values of the electricity consumption for each hour of the day analyzed.
In the baseline situation, measured while maintaining a constant ventilation rate at the level of 13,400 m3/h, the electricity consumption was 300 kWh/day, that is, assuming the continuous operation of ventilation throughout the year, 109,500 kWh/year. Reducing the ventilation rate only during the night, by only 20%, resulted in a reduction in electricity consumption from 284.2 kWh/day and on an annual basis to 103.076 kWh/year, that is, savings of less than 6%.
As in Scenario 1, it was seen that the air flow could be further lowered due to the fact that the relative humidity in the pool did not exceed the maximum value of 60%; in Scenario 2, it was proposed to reduce the ventilation rate during the day by 33% (to the level of 10,500 m3/h) and to do so during the night by another 15% (8900 m3/h). These changes have significantly reduced the electricity consumption for the purpose of pumping air. The daily demand for electricity was 217.6 kWh/day, and the annual demand was 79.424 kWh/year. The savings amounted to almost 27.5% per year. Today, when electricity prices are high, achieving savings in electricity consumption is crucial to maintaining the proper operation of the facility. At the same time, when looking for solutions to save money, maintaining comfortable conditions for users must be a priority. In Scenario 2, despite the reduction in efficiency, achieving energy savings of 27%, a comfortable relative humidity range of 50–60% was obtained at the same time, which will result in greater satisfaction for swimmers.

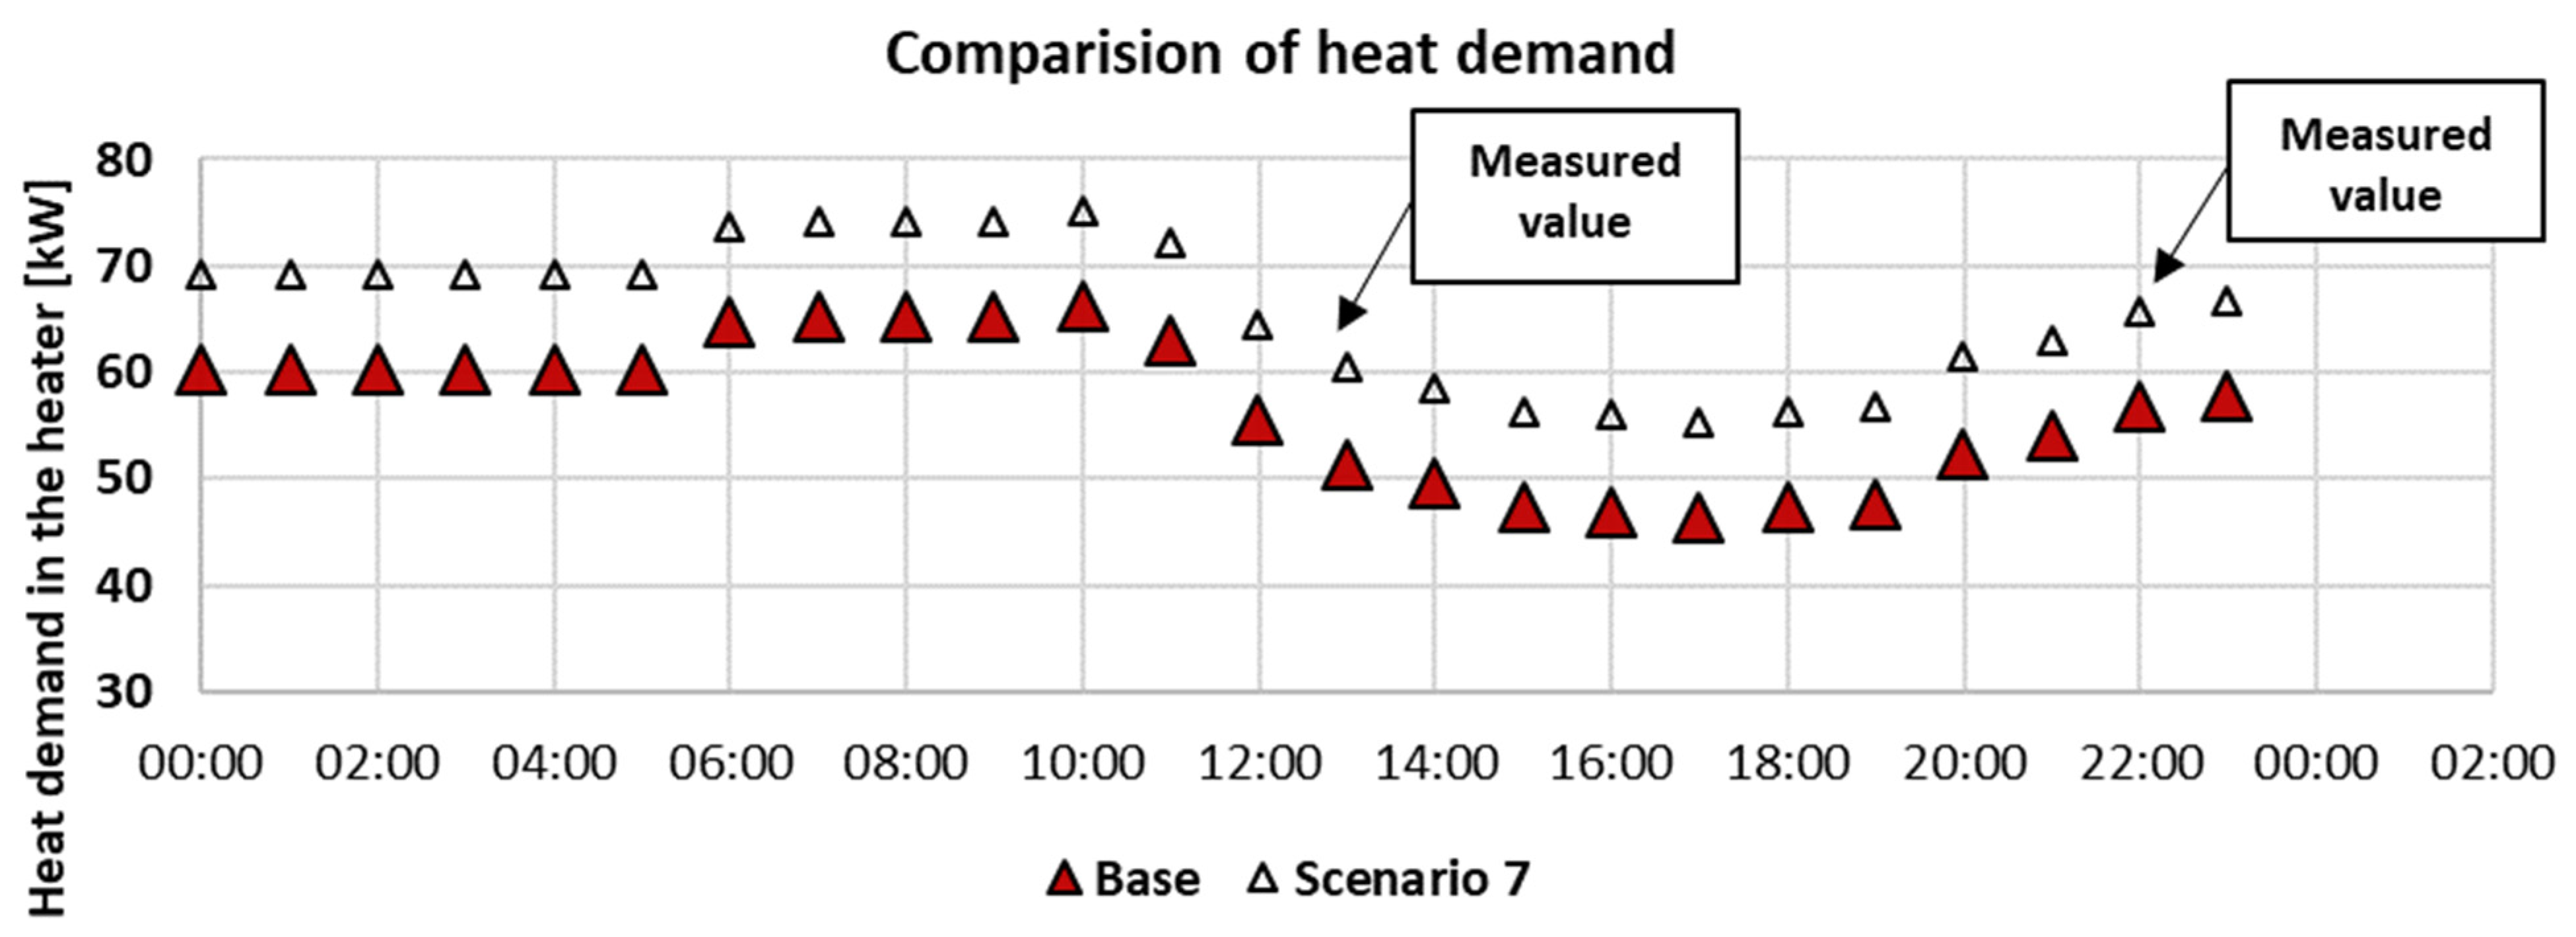
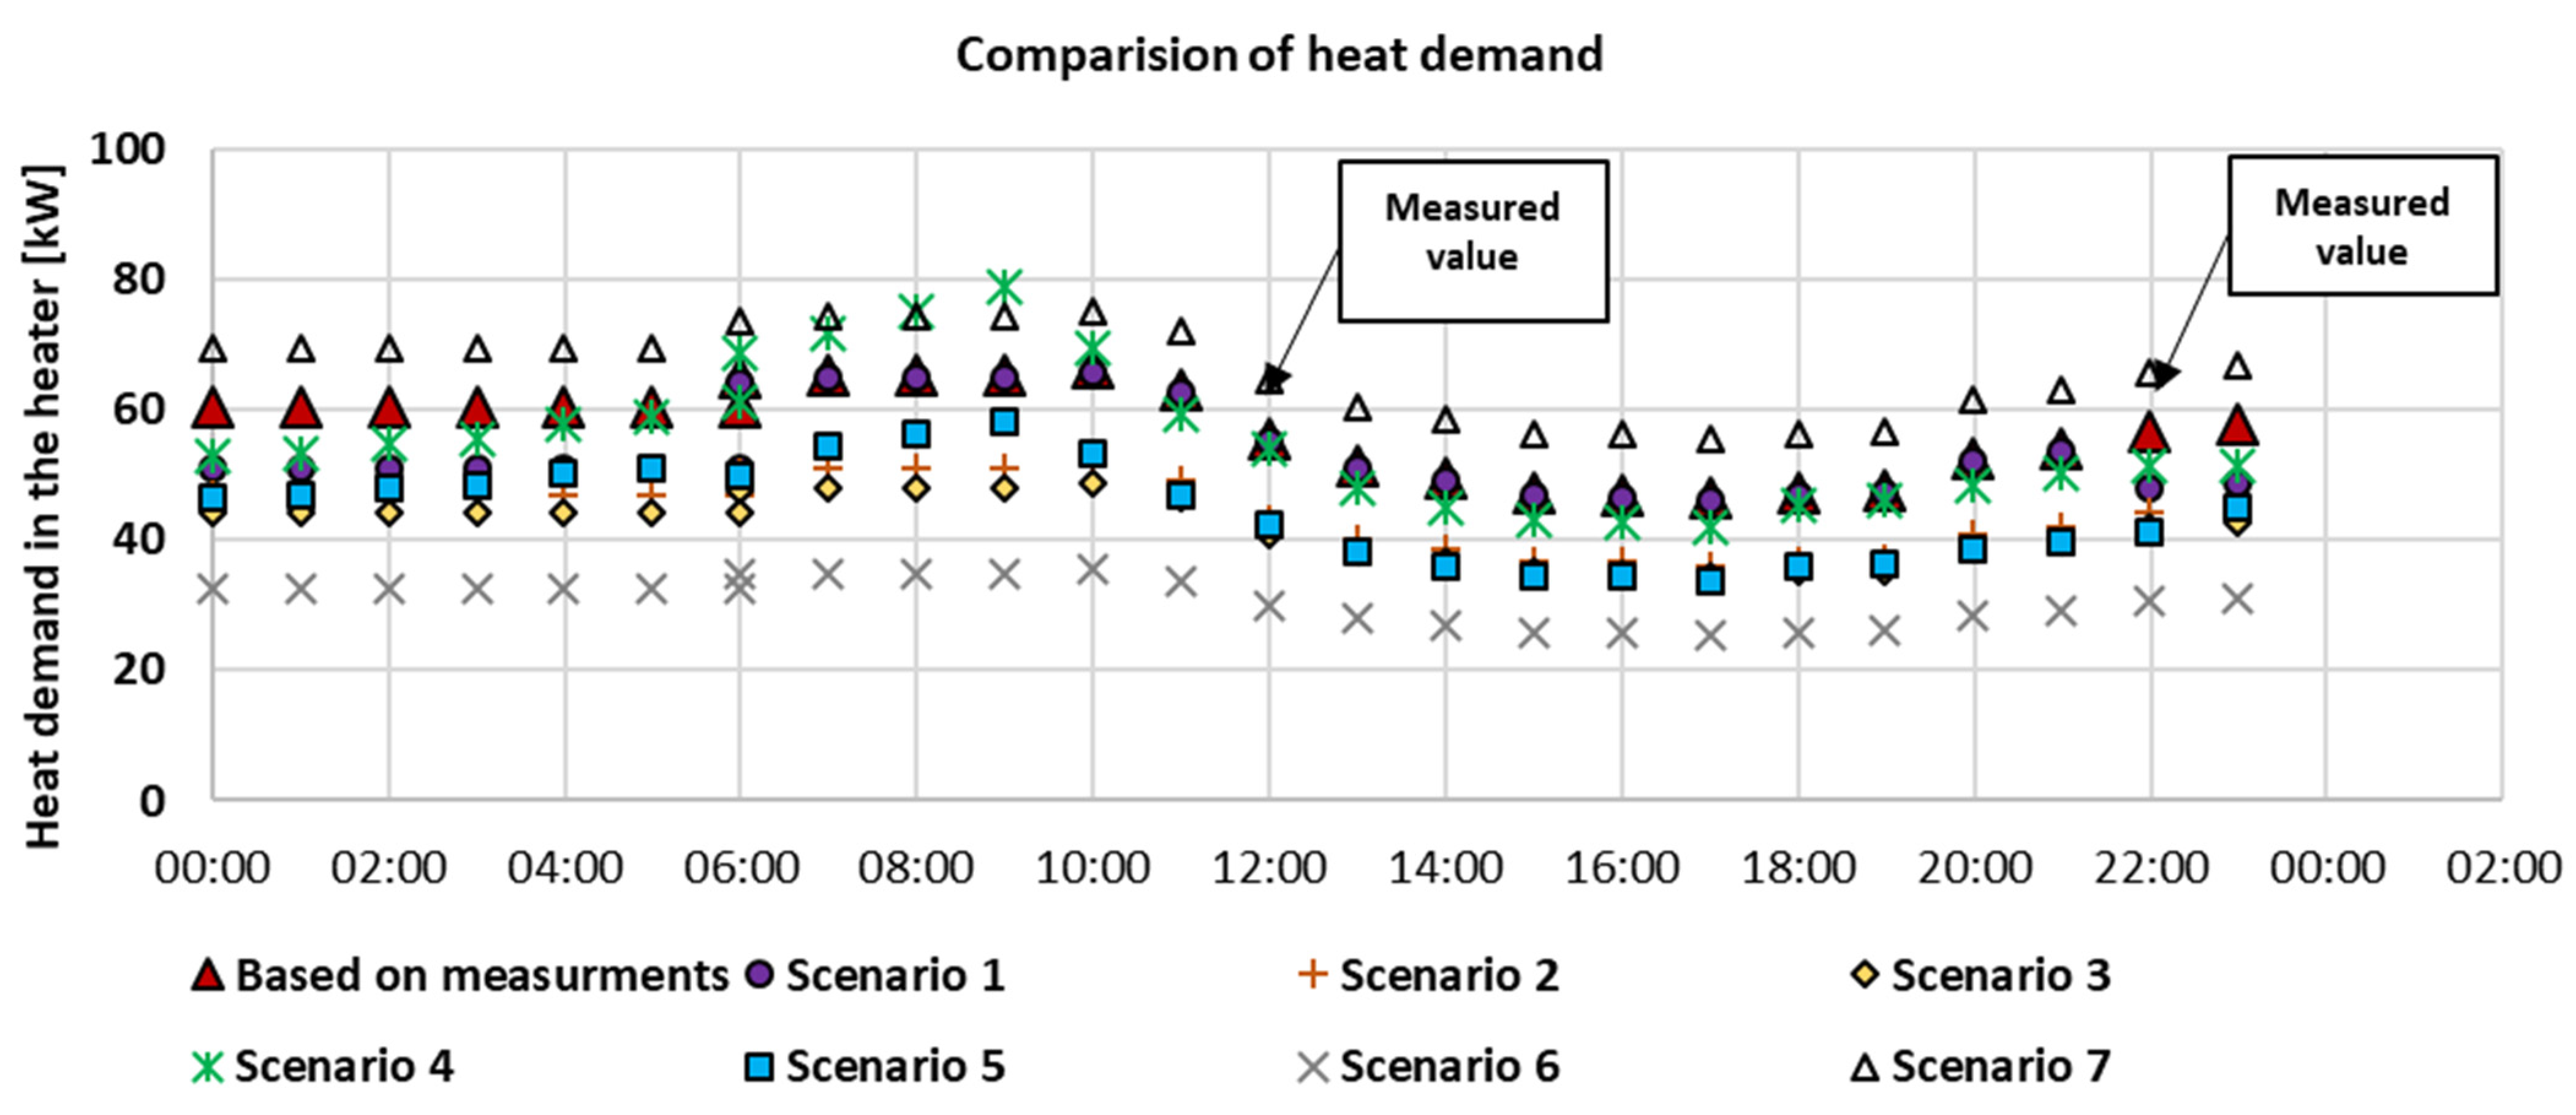
4.5. Simulation Results—Heat Demand

When proposing changes to the air handling unit, it is necessary to take into account, in addition to thermal comfort, the need to provide heat to ensure these conditions. The changes made in each scenario result in different heat demand values in the simulations. The results of the simulation for seven scenarios and the baseline situation are presented in Table 15. The difference obtained in relation to the baseline variant was marked. The results are also presented in Figure 8.
The highest daily heat demand to heat the ventilation air was obtained in Scenario 7, in which the temperature of the supply air was the highest. Due to this change, it was possible to obtain a higher and more comfortable air temperature in the swimming pool. When the temperature is maintained, it will always result in the need to supply more heat to the system, which increases operating costs. However, other simulations have shown that there are solutions for reducing the heat demand. Among these solutions, the largest demand reduction was obtained by including a heat exchanger section in the air treatment process (Scenario 6). Due to in situ measurements, the heat recovery section was identified to be in use. Changing the damper setting in the air handling unit will allow for significant savings. On the day analyzed, it was estimated that the amount of heat supplied to the heater would decrease by 46%. Significant savings in heat demand were also obtained when the share of outside air was changed. The proportion of outside air was reduced from 70% to 50%, which is a commonly used value. The heat demand was reduced by 26%. However, this change did not significantly affect the thermal comfort in the pool. This change was obtained by simulating variable proportions of outside air selected to maintain the relative humidity inside at 55%. Due to this change, the right relative humidity value was obtained, ensuring a comfortable experience for users, while reducing the need for heat by 24%. The reduction in heat demand was also obtained in Scenario 2 by 22%. The change in heat demand was associated with a decrease in the ventilation rate during the day and night compared to the baseline by 33% and 42%, respectively. This is a very promising variant because the change in the ventilation rate also reduces the electricity consumption.

4.6. Summary of the Results

Analyzing all the aggregated results, it can be seen that by introducing various changes in the operation of the ventilation system in the swimming pool, it is possible to ensure comfortable parameters, which may be associated with the need to provide more heat. The analyses carried out clearly showed that it is worth analyzing the state of air parameters in the swimming pool and conducting simple analyses simulating the impact of changes made in the control system on improving the conditions of thermal comfort while assessing the impact of these changes on the demand for heat and electricity. When changes are made, an increase in the demand for energy may be achieved, but when one introduces another, this demand may be reduced.
Scenarios of corrective actions for any analyzed pool should be selected individually, but it can be said that, in the case of swimming pools, where problems with high maintenance costs and with maintaining appropriate environmental conditions are noticeable, short-term and simple measurements can be made, thanks to which the problem can be diagnosed and a number of solutions that will improve the existing condition can be proposed. Simulations and their results have shown that even simple measurements and simulations adapted to existing conditions can find solutions that ensure comfort and reduce energy consumption in the building at the same time.

5. Limitations and Further Research

5.1. Limitations

The research was carried out in a functioning swimming pool facility, which means that the results take into account the specific use of this facility. However, the results are valuable because they show certain dependencies between the thermal comfort parameters and the operation of the ventilation system. The research was intended to cover a short period of time so that it would be possible and technically feasible to perform it. Two versions of in situ measurements were taken into account: the basic version, in which the measurement of air parameters only in the swimming pool is conducted, and the more advanced version, requiring the installation of sensors inside the ventilation unit, which is not always possible. The control panel that operated in the analyzed facility is a control panel with limited control capabilities; hence, it is not possible to verify in practice the results obtained by carrying out simulations for seven scenarios. It should be noted that, in many swimming pool facilities, there are older types of air handling units. When measurements and the results of measured hours in the simulations are used, the simulation results are real and coincide with the measurement results.
Reducing the amount of fresh air can affect the air quality in swimming pools. Air quality in relation to the NCl3 concentration is the subject of many studies [49,50,51,52], mainly in countries where water treatment is different from that in Poland. In the country analyzed, the concentration of free and combined chlorine is low, which is confirmed by research [3,5,11]; therefore, reducing the ventilation rate, especially at night, should not have a negative impact on air quality. But this should be the subject of further research.

5.2. Further Research

The research described in the article should continue to take measurements in a larger number of facilities. The purpose of these studies was not to test the procedure in many facilities but to present a measurement methodology that is easy to apply. As noted, each swimming pool facility is different, so the research conducted in other facilities will be unique and will allow for finding solutions for specific situations and case studies. Analyses should be supplemented with measurements of the CO2 concentration as a marker of ventilation [53] or other chemical compounds present in swimming pool facilities such as THM and NCl3—with these markers, associated with the presence of swimmers in the pool, even more advanced methods of controlling the operation of ventilation units than the day/night schedule could be proposed. The important topic is microbiological risks [54]. However, this requires more complex research.
Further research may also include measurements related to swimming pool water technology, the optimization of water heating, water circulation, and other processes related to the need to supply heat and electricity.

6. Conclusions and Summary

In modern facilities, where the operation of HVAC devices is controlled by advanced automation systems, it is possible to directly and easily control the parameters of thermal comfort and energy consumption. For such facilities, it is possible to use the proposed scenarios in a simple way and directly check the results. The proposed scenarios are ideas for improving the operation of the existing pool facility to maintain energy consumption at a reasonable level while ensuring the appropriate comfort parameters. Older-type facilities require a separate approach because it is important to reduce energy and provide better conditions in those buildings. Not every pool facility can afford to invest in system changes, and simple but effective solutions should be sought. Thanks to the short-term in situ measurements carried out in the analyzed facility, it was possible to diagnose the reasons for the high energy consumption: the air handling unit operated in the mode without heat recovery and with a constant, too high ventilation rate. Solutions have been proposed in several variants that, while improving user comfort, will not significantly increase the facility’s operating costs. Due to the nature of the facility and the maintenance provided, it was not possible to implement all scenarios. However, the measurements made and the inclusion of their results in the simulations allow us to conclude that the analyses and simulations performed can be treated as measurement-validated.
The general conclusions from the conducted analyses are as follows:
(1)
Conducting in situ measurements, even in a very limited scope, allows for determining actions that can lead to an improvement in thermal comfort in a room while reducing energy consumption.
(2)
Due to the reduction in the ventilation rate during the night, the electricity consumption was reduced. Assuming a reduction in the ventilation rate of 33% during the day and 45% at night compared to the base variant, 27% of the electric energy needed for the operation of ventilation was saved per year.
(3)
The use of the scheduling of the operation of the air handling unit, even in such a limited scope as variable performance during the day and night, can bring significant money savings, which is very valuable nowadays.
(4)
Due to the reduced evaporation from the pool during the night, associated with the absence of disturbances of the water, it is possible to reduce the ventilation rate at night in all swimming pool facilities.
(5)
Conducting more advanced in situ measurements allows for identifying faults in the controller settings. As a result of the measurements, it was established that air in the analyzed air handling unit does not flow through the heat exchanger but through a bypass. The introduction of an exchanger for heat recovery into air treatment by moving the throttle in the air handling unit would make it possible to achieve savings in the amount of heat at the level of 46% compared to the base situation.
(6)
The use of a variable proportion of outside air allows us to ensure comfortable relative humidity in the swimming pool room. At the same time, the use of a smaller share of outside air in winter allows for savings in the amount of heat supplied to the day AHU by 22%. Due to this, you can reduce costs without compromising thermal comfort in the room.
(7)
Increasing the temperature of the air in the swimming pool to a level that guarantees comfortable conditions is associated with an increase in the demand for heat in the analyzed facility by 26%.

Summary

In older pools, where the technical equipment is not the latest, there are often problems with thermal comfort or too-high energy consumption. In this case, it is often challenging to apply advanced control recommendations. Recommendations regarding the modernization of technical systems that would bring the best results involve the need to incur high investment costs. The conducted analyses respond to the need to introduce changes in such facilities. It was proposed to carry out short in situ measurements, evaluate the obtained results, and perform simple simulations, due to which it will be possible to improve thermal comfort and reduce energy consumption.
The use of several of the change scenarios allows for obtaining appropriate parameters of the indoor air in the pool and, at the same time, reducing energy consumption. It is recommended to use a variable ventilation rate during the day and at night, reduce the ventilation rate to a level that allows for maintaining the relative humidity at 55%, and increase the air temperature in the pool. This approach will make users feel comfortable, and the pool manager will not feel a change in operating costs and may achieve savings. Such conclusions were obtained by performing short-term measurements that are possible in every swimming pool facility.
Equipping air handling units with modern controllers, thanks to which it will be possible to introduce a work schedule, control the share of external air, and better program set points, will allow for savings and ensure thermal comfort. It is an investment worth considering, as shown by the measurements and simulations carried out. Equipping the AHU with temperature and relative humidity sensors to measure the parameters of the supply air, exhaust air, air in the mixing chamber and behind the heat recovery exchanger, and outside air would allow for proposing the most beneficial control algorithm for a given swimming pool facility. Such an algorithm could be developed after analyzing the measurements from the sensors. It could also be changed for different uses and seasons.

Author Contributions

Conceptualization: K.R.; Methodology: K.R.; Validation: K.R. and E.S.; Formal analysis: K.R and E.S.; Investigation: K.R.; Data curation: K.R. and A.P.; Writing—original draft preparation: K.R. and E.S.; Writing—review and editing: K.R., E.S., and A.P.; Visualization: K.R.; Project administration: A.P.; Funding acquisition: K.R. and A.P. All authors have read and agreed to the published version of the manuscript.

Funding

This research was funded by the Polish Ministry of Higher Education (01/13/SBAD/0981) and by the Polish National Center of Research and Development (POIR.01.01.01-00-0460/16-01). The research is the result of collaboration between Poznan Univesrity of Technology and Warsaw University of Technology ((PP) RU00022459) and was carried out based on the results of the project: “Intelligent HVAC OPTIMIZER as a function of the potential for THM creation in indoor pools (OHT)—a new method of electricity and heat management that adjusts ventilation, heating and cooling control (HVAC) to carcinogenic chlorogenic hydrocarbon concentrations such as trihalomethanes (THM) and their removal from indoor pools”, implemented by the Virtual Power Plant company and financed under Measure 1.1. “Research and Development projects of enterprises”, Sub-measure 1.1.1.: “Industrial research and development carried out by enterprises”, and the Intelligent Development Operational Program 2014–2020 and co-financed by the European Regional Development Fund for the Polish National Center of Research and Development.

Conflicts of Interest

The authors declare no conflict of interest.

References

  1. Chase, N.L.; Sui, X.; Blair, S.N. Comparison of the Health Aspects of Swimming With Other Types of Physical Activity and Sedentary Lifestyle Habits. Int. J. Aquat. Res. Educ. 2008, 2, 7. [Google Scholar] [CrossRef] [Green Version]
  2. Yang, L.; Chen, X.; She, Q.; Cao, G.; Liu, Y.; Chang, V.W.C.; Tang, C.Y. Regulation, formation, exposure, and treatment of disinfection by-products (DBPs) in swimming pool waters: A critical review. Environ. Int. 2018, 121, 1039–1057. [Google Scholar] [CrossRef]
  3. Wyczarska-Kokot, J.; Lempart-Rapacewicz, A.; Dudziak, M.; Łaskawiec, E. Impact of swimming pool water treatment system factors on the content of selected disinfection by-products. Environ. Monit. Assess. 2020, 192, 722. [Google Scholar] [CrossRef]
  4. Ratajczak, K.; Piotrowska, A. Disinfection By-Products in Swimming Pool Water and Possibilities of Limiting Their Impact on Health of Swimmers. Geomat. Environ. Eng. 2019, 13, 71–92. [Google Scholar] [CrossRef]
  5. Wyczarska-Kokot, J.; Lempart-Rapacewicz, A.; Dudziak, M. Analysis of Free and Combined Chlorine Concentrations in Swimming Pool Water and an Attempt to Determine a Reliable Water Sampling Point. Water 2020, 12, 311. [Google Scholar] [CrossRef] [Green Version]
  6. Weng, S.; Sun, P.; Ben, W.; Huang, C.H.; Lee, L.T.; Blatchley, E.R., III. The Presence of Pharmaceuticals and Personal Care Products in Swimming Pools. Environ. Sci. Technol. Lett. 2014, 1, 495–498. [Google Scholar] [CrossRef]
  7. Lempart, A.; Kudlek, E.; Dudziak, M. Determination of Micropollutants in Water Samples from Swimming Pool Systems. Water 2018, 8, 1083. [Google Scholar] [CrossRef] [Green Version]
  8. Lempart, A.; Kudlek, E.; Lempart, M.; Dudziak, M. The Presence of Compounds from the Personal Care Products Group in Swimming Pool Water. J. Ecol. Eng. 2018, 19, 29–37. [Google Scholar]
  9. Lempart, A.; Kudlek, E.; Dudziak, M. Concentration profiles of Personal Care Products in swimming pools. E3S Web Conf. 2018, 44, 00095. [Google Scholar] [CrossRef] [Green Version]
  10. Natnael, T. Health-related behaviors and associated factors among swimming pool users in Kombolcha Town, Northeastern Ethiopia. Front. Public Health 2022, 10, 985335. [Google Scholar] [CrossRef]
  11. Ratajczak, K.; Pobudkowska, A. Pilot Test on Pre-Swim Hygiene as a Factor Limiting Trihalomethane Precursors in Pool Water by Reducing Organic Matter in an Operational Facility. Int. J. Environ. Res. Public Health 2020, 17, 7547. [Google Scholar] [CrossRef]
  12. Keuten, M.G.A.; Schets, F.M.; Schijven, J.F.; Verberk, J.Q.J.C.; Van Dijk, J.C. Definition and quantification of initial anthropogenic pollutant release in swimming pools. Water Res. 2012, 46, 3682–3692. [Google Scholar] [CrossRef]
  13. Young, I.; Robillard, P.; Loeffler, P.; Sekercioglu, F. Determinants of bather hygiene in public swimming pools: A mixed-methods analysis of online discussion comments. J. Water Health 2022, 20, 877–887. [Google Scholar] [CrossRef]
  14. Low, A.; Heacock, H. The evaluation of factors affecting the pre-swim shower behaviors of pool patrons. BCIT Environ. Public Health J. 2018. [Google Scholar] [CrossRef]
  15. Sun, P.; Wu, J.Y.; Wang, R.Z.; Xu, Y.X. Analysis of indoor environmental conditions and heat pump energy supply systems in indoor swimming pools. Energy Build. 2011, 43, 1071–1080. [Google Scholar] [CrossRef]
  16. Rzeźnik, I. Study on water evaporation rate from indoor swimming pools. E3S Web Conf. 2017, 22, 00150. [Google Scholar] [CrossRef] [Green Version]
  17. Asdrubali, F. A scale model to evaluate water evaporation from indoor swimming pools. Energy Build. 2009, 41, 311–319. [Google Scholar] [CrossRef]
  18. Zolfaghari, S.A.R.; Hoshmand, S.M.; Foadaddini, A.; Ebrahimi Naghani, P. Modeling mutual effects of evaporation, thermal sensation and concentration of chlorine contaminant in an indoor swimming pool. Modares Mech. Eng. 2016, 16, 179–188. Available online: https://mme.modares.ac.ir/article-15-10822-en.html (accessed on 11 January 2023).
  19. Ratajczak, K.; Szczechowiak, E. Energy consumption decreasing strategy for indoor swimming pools—Decentralized Ventilation system with a heat pump. Energy Build. 2020, 206, 109574. [Google Scholar] [CrossRef]
  20. Lévesque, B.; Vézina, L.; Gauvin, D.; Leroux, P. Investigation of Air Quality Problems in an Indoor Swimming Pool: A Case Study. Ann. Occup. Hyg. 2015, 59, 1085–1089. [Google Scholar] [CrossRef] [Green Version]
  21. Lebon, M.; Fellouah, H.; Galanis, N.; Limane, A.; Guerfala, N. Numerical analysis and field measurements of the airflow patterns and thermal comfort in an indoor swimming pool: A case study. Energy Effic. 2017, 10, 527–548. [Google Scholar] [CrossRef]
  22. Ciuman, P.; Kaczmarczyk, J. Numerical Analysis of the Energy Consumption of Ventilation Processes in the School Swimming Pool. Energies 2021, 14, 1023. [Google Scholar] [CrossRef]
  23. Ratajczak, K.; Szczechowiak, E. The Use of a Heat Pump in a Ventilation Unit as an Economical and Ecological Source of Heat for the Ventilation System of an Indoor Swimming Pool Facility. Energies 2020, 13, 6695. [Google Scholar] [CrossRef]
  24. Li, Y.; Nord, N.; Huang, G.; Li, X. Swimming pool heating technology: A state-of-the-art review. Build. Simul. 2021, 14, 421–440. [Google Scholar] [CrossRef]
  25. Ratajczak, K.; Bandurski, K.; Płóciennik, A. Incorporating an atrium as a HAVC element for energy consumption reduction and thermal comfort improvement in a Polish climate. Energy Build. 2022, 277, 112592. [Google Scholar] [CrossRef]
  26. Sinacka, J.; Ratajczak, K. Analysis of selected input data impact on energy demand in office building—Case study. MATEC Web Conf. 2018, 222, 01015. [Google Scholar] [CrossRef] [Green Version]
  27. Amanowicz, Ł.; Ratajczak, K.; Dudkiewicz, E. Recent Advancements in Ventilation Systems Used to Decrease Energy Consumption in Buildings—Literature Review. Energies 2023, 16, 1853. [Google Scholar] [CrossRef]
  28. Westerlund, L.; Dahl, J. Use of an open absorption heat-pump for energy conservation in a public swimming-pool. Appl. Energy 1994, 49, 275–300. [Google Scholar] [CrossRef]
  29. Lazzarin, R.M.; Longo, G.A. Comparison of heat recovery systems in public indoor swimming pools. Appl. Therm. Eng. 1996, 16, 561–570. [Google Scholar] [CrossRef]
  30. Lee, W.-S.; Kung, C.-K. Optimization of heat pump system in indoor swimming pool using particle swarm algorithm. Appl. Therm. Eng. 2008, 28, 1647–1653. [Google Scholar] [CrossRef]
  31. Pietkun-Greber, I.; Suszanowicz, D. The consequences of the inappropriate use of ventilation systems operating in indoor swimming pool conditions—Analysis. E3S Web Conf. 2018, 45, 00064. [Google Scholar] [CrossRef] [Green Version]
  32. Amanowicz, Ł.; Wojtkowiak, J. Comparison of Single- and Multipipe Earth-to-Air Heat Exchangers in Terms of Energy Gains and Electricity Consumption: A Case Study for the Temperate Climate of Central Europe. Energies 2021, 14, 8217. [Google Scholar] [CrossRef]
  33. Katsaprakakis, D.A. Comparison of swimming pools alternative passive and active heating systems based on renewable energy sources in Southern Europe. Energy 2015, 81, 738–753. [Google Scholar] [CrossRef]
  34. Calise, F.; Figaj, R.D.; Vanoli, L. Energy and Economic Analysis of Energy Savings Measures in a Swimming Pool Centre by Means of Dynamic Simulations. Energies 2018, 11, 2182. [Google Scholar] [CrossRef] [Green Version]
  35. Yuan, X.; Chen, Z.; Liang, Y.; Pan, Y.; Jokisalo, J.; Kosonen, R. Heating energy-saving potentials in HVAC system of swimming halls: A review. Build. Environ. 2021, 205, 108189. [Google Scholar] [CrossRef]
  36. Chow, T.T.; Bai, Y.; Fong, K.F.; Lin, Z. Analysis of a solar assisted heat pump system for indoor swimming pool water and space heating. Appl. Energy 2012, 100, 309–317. [Google Scholar] [CrossRef]
  37. Ribeiro, E.M.; Jorge, H.M.; Quintela, D.A. An approach to optimised control of HVAC systems in indoor swimming pools. Int. J. Sustain. Energy 2016, 35, 378–395. [Google Scholar] [CrossRef]
  38. Mahmoudi, R.; Aliasghary, M.; Mokarram, M. Design and fabrication of an intelligent management and control system to optimize energy consumption in indoor swimming pools. Energy Effic. 2021, 14, 55. [Google Scholar] [CrossRef]
  39. Revel, G.M.; Arnesano, M. Measuring overall thermal comfort to balance energy use in sports facilities. Measurement 2014, 55, 382–393. [Google Scholar] [CrossRef]
  40. Delgado Marín, J.P.; Vera García, F.; García Cascales, J.R. Use of a predictive control to improve the energy efficiency in indoor swimming pools using solar thermal energy. Sol. Energy 2019, 179, 380–390. [Google Scholar] [CrossRef]
  41. Delgado Marín, J.P.; Garcia-Cascales, J.R. Dynamic simulation model and empirical validation for estimating thermal energy demand in indoor swimming pools. Energy Effic. 2020, 13, 955–970. [Google Scholar] [CrossRef]
  42. Rajagopalan, P.; Jamei, E. Thermal comfort of multiple user groups in indoor aquatic centres. Energy Build. 2015, 105, 129–138. [Google Scholar] [CrossRef]
  43. Wojtkowiak, J.; Amanowicz, Ł.; Mróz, T. A new type of cooling ceiling panel with corrugated surface—Experimental investigation. Int. J. Energy Res. 2019, 43, 7275–7286. [Google Scholar] [CrossRef]
  44. Wojtkowiak, J.; Amanowicz, Ł. Effect of surface corrugation on cooling capacity of ceiling panel. Therm. Sci. Eng. Prog. 2020, 19, 100572. [Google Scholar] [CrossRef]
  45. Sinacka, J.; Szczechowiak, E. An Experimental Study of a Thermally Activated Ceiling Containing Phase Change Material for Different Cooling Load Profiles. Energies 2021, 14, 7363. [Google Scholar] [CrossRef]
  46. Trianti-Stourna, E.; Spyropoulou, K.; Theofylaktos, C.; Droutsa, K.; Balaras, C.A.; Santamouris, M.; Asimakopoulos, D.N.; Asimakopoulos, D.; Papanikolaou, N. Energy conservation strategies for sports centers: Part B. Swimming pools. Energy Build. 1998, 27, 123–135. [Google Scholar] [CrossRef]
  47. Gabriel, M.F.; Felgueiras, F.; Mourão, Z.; Fernandes, E.O. Assessment of the air quality in 20 public indoor swimming pools located in the Northern Region of Portugal. Environ. Int. 2019, 133, 105274. [Google Scholar] [CrossRef]
  48. Szczechowiak, E. Analityczne obliczanie parametrów powietrza wilgotnego. Chłodnictwo 1985, 8, 7–11. [Google Scholar]
  49. Afifi, M.Z.; Blatchley, E.R., III. Seasonal dynamics of water and air chemistry in an indoor chlorinated swimming pool. Water Res. 2015, 68, 771–783. [Google Scholar] [CrossRef]
  50. Weng, S.C.; Weaver, W.A.; Zare Afifi, M.; Blatchley, T.N.; Cramer, J.S.; Chen, J.; Blatchley, E.R., III. Dynamics of gas-phase trichloramine (NCl3) in chlorinated, indoor swimming pool facilities. Indoor Air 2011, 21, 391–399. [Google Scholar] [CrossRef]
  51. Schmalz, C.; Wunderlich, H.G.; Heinze, R.; Frimmel, F.H.; Zwiener, C.; Grummt, T. Application of an optimized system for the well-defined exposure of human lung cells to trichloramine and indoor pool air. J. Water Health 2011, 9, 586–596. [Google Scholar] [CrossRef] [PubMed] [Green Version]
  52. Proulx, H.; Hallé, S. A numerical study of the impacts of outdoor air intake and air changes per hour on the trichloramine concentrations in a swimming pool enclosure. Front. Built Environ. 2022, 8, 957973. [Google Scholar] [CrossRef]
  53. Cichowicz, R.; Sabiniak, H.; Wielgosińsk, G. The Influence of a Ventilation on the Level of Carbon Dioxide in a Classroom at a Higher University/Wpływ Wentylacji Na Poziom Ditlenku Węgla W Pomieszczeniu Uczelni Wyższej. Ecol. Chem. Eng. S 2015, 22, 61–71. [Google Scholar] [CrossRef] [Green Version]
  54. Lisik, K.; Cichowicz, R. Microbiological Risk in Rooms with Mechanical Ventilation. J. Ecol. Eng. 2022, 23, 164–171. [Google Scholar] [CrossRef]
Figure 1. Air handling unit (a) and air conditioning scheme (b).
Energies 16 05886 g001
Figure 2. Scheme of the research plan.
Energies 16 05886 g002
Figure 3. Photo of the test facility.
Energies 16 05886 g003
Figure 4. Schematic of air distribution in the analyzed swimming pool (diagram of the ventilation unit, Figure 1).
Energies 16 05886 g004
Figure 5. Comparison of relative humidity in the pool in three scenarios.
Energies 16 05886 g005
Figure 6. Comparison of heat demand in two scenarios; Scenario 7 with temperature in the pool ensuring thermal comfort.
Energies 16 05886 g006
Figure 7. Comparison of electricity consumption in three scenarios.
Energies 16 05886 g007
Figure 8. Comparison of heat demand in seven scenarios with the measured value.
Energies 16 05886 g008
Table 1. Guidelines for comfortable conditions in general-purpose swimming pools [19].
TemperatureIndoor AirPool Water
Regular pool30 °C28 °C
Relative humidity50–60%
Table 2. Research plan for the test facility.
MeasurementsMeasurement PeriodResultsEvaluationConclusionsRecommendations
Stage 1
March
Minimum—measurements only in the swimming pool1 h during the day (12:00)
1 h after closing (22:00)
Averaging valuesParameters recommended as comfortable according to Table 1Evaluation of the possibility of improving the measured state Definition of specific corrective actions
Measured parametersSupplied air—tSU, RHSU/Exhaust air—tEX, RHEX/External air—tE, RHE/Air stream/Number of swimmers/Electricity consumption of air handling unit
Calculated parametersThe power of the heater (Equation (6))
Implementation of corrective actions based on the recommendations from Stage 1
Checking after a longer period of the operation of the facility in new conditions
Stage 2
May
Minimum: measurements only in the swimming pool. If possible, supplement the measurements with the values measured in the air handling unit1 h during the day (12:00)
1 h after closing (22:00)
Averaging valuesParameters recommended as comfortable according to Table 1 and the assessment of the improvement of parameters according to the recommendationsEvaluation of the achieved improvement in terms of comfort and energy consumption. Definition of further possible actions—definition of scenariosPerform a simulation in order to select the most advantageous operation for the analyzed facility (Section 4.3)
Measured parametersSupplied air—tSU, RHSU/Exhaust air—tEX, RHEX/External air—tE, RHE/Air stream/Number of swimmers/Electricity consumption of air handling unit
Additionally: inside the AHU after mixing—tMIX, RHMIX
Calculated parametersThe power of the heater (Equation (6))
Stage 3
Simulations
Calculations of parameters in the air handling unit 1 dayAverage values for each hour, labeling the values measured in Step 2 for the two selected hoursBased on the difference in energy consumption from baseline and thermal comfort ratingEvaluation of the results for each scenario and selection of the solution for which the energy consumption will be the lowestFurther recommendations for conclusions
Conclusion
Table 3. Characteristics of the parameter changes in each of the scenarios.
Characteristics of the Changes
in Parameters
Baseline
(From the Results of Stage 2)
Scenario
1234567
Air stream daytimeVSU,DAY
[m3/h]
13,40013,40010,90013,40013,40013,40013,40013,400
Air stream nighttimeVSU,NIGHT
[m3/h]
13,40011,400890013,40013,40013,40013,40013,400
External air shareαEX
[%]
70707050Variable707070
Relative humidityRH
[%]
≈45%≈45%≈55%≈55%≈45%55%≈50%≈45%
Supply air temperaturetSU
[°C]
2727272727272730
Heat exchange efficiencyη
[%]
000000500
CharacteristicV = 13,400 m3/h
αEX = 70%
RH = 40%
η = 0%
tSU = 27 °C
VSU,NIGHT
= 11,400 m3/h
(−15%)
V SU,DAY
= 10,900 m3/h
(−33%)
V SU,NIGHT
= 8900 m3/h
(−42%)
αEX
= 50%
(−20%)
αEX
= variable
RH = 55%
(+15%)
η = 50%tSU = 30 °C
(+3 °C)
Table 4. The results of measurements of external air parameters for the analyzed day and the base power of the heater.
HourTemperatureRelative
Humidity
Moisture
Content
Heat
Demand
Equation (6)
HourTemperatureRelative
Humidity
Moisture
Content
Heat
Demand
Equation (6)
tEXRHEXxEXQH,0tEXRHEXxEXQH,0
[°C][%][kg/kg][kW/h][°C][%][kg/kg][kW/h]
DaytimeNighttime
06:007780.004864.722:009.5490.0035956.8
07:006.8780.0047665.323:009.2500.0035957.7
08:006.8820.0050165.300:008.4510.0034760.2
09:006.8860.0052665.301:008.4520.0035460.2
10:006.5750.0044966.202:008.4550.0037460.2
11:007.5600.0038463.103:008.4560.0038160.2
12:009.9540.0040755.5804:008.4600.0040860.2
13:0011.2460.0037851.405:008.4620.0042260.2
14:0011.8420.0035949.506:008.4650.0044360.2
15:0012.5400.0035847.3
16:0012.6400.003646.9
17:0012.8390.0035646.3
18:0012.5440.0039447.3
19:0012.4450.00447.6
20:0010.9460.003752.3
21:0010.4480.0037453.9
Heat demand 1424 kWh/day
Table 5. Assumptions and calculation data for Scenario 1.
Analyzed
Point
TemperatureRelative
Humidity
Moisture
Content
Share in
the Air Stream
Other
External Air (E)Table 4Table 4Table 4α = 70%
Exhaust Air (EX)26 °CEquation (12)Equation (11)(1 − α) = 30%Evaporation during the day 64.0 kg/h
Evaporation at night 53.1 kg/h
Supply Air (SU)27 °Cnot applicablexSU = xMIXnot applicableDuring the day 13,400 m3/h
At night 11,390 m3/h
Air in Mixing Chamber (MIX)Equation (10)not applicableEquation (9)not applicable
Table 6. Assumptions and calculation data for Scenario 2.
Analyzed
Point
TemperatureRelative
Humidity
Moisture
Content
Share in
the Air Stream
Other
External Air (E)Table 4Table 4Table 4α = 70%
Exhaust Air (EX)26 °CEquation (12)Equation (11)(1 − α) = 30%Evaporation during the day 64.0 kg/h
Evaporation at night 53.1 kg/h
Supply Air (SU)27 °Cnot applicablexSU = xMIXnot applicableDuring the day 10,500 m3/h
At night 8920 m3/h
Air in Mixing Chamber (MIX)Equation (10)not applicableEquation (9)not applicable
Table 7. Assumptions and calculation data for Scenario 3.
Analyzed
Point
TemperatureRelative
Humidity
Moisture
Content
Share in
the Air Stream
Other
External Air (E)Table 4Table 4Table 4α = 50%
Exhaust Air (EX)26 °CEquation (12)Equation (11)(1 − α) = 50%Evaporation during the day 64.0 kg/h
Evaporation at night 53.1 kg/h
Supply Air (SU)27 °Cnot applicablexSU = xMIXnot applicableDuring the day 13,400 m3/h
At night 13,400 m3/h
Air in Mixing Chamber (MIX)Equation (10)not applicableEquation (9)not applicable
Table 8. Assumptions and calculation data for Scenario 4.
Analyzed
Point
TemperatureRelative
Humidity
Moisture
Content
Share in
the Air Stream
Other
External Air (E)Table 4Table 4Table 4Variable,
Equation (4)
Exhaust Air (EX)26 °C47%xEX = 9.88 kg/kg(1 − α)Evaporation during the day 64.0 kg/h
Evaporation at night 53.1 kg/h
Supply Air (SU)27 °Cnot applicablexSU = 5.92 kg/kgnot applicableDuring the day 13,400 m3/h
At night 13,400 m3/h
Air in Mixing Chamber (MIX)Equation (10)not applicablexMIX = xSUnot applicable
Table 9. Assumptions and calculation data for Scenario 5.
Analyzed
Point
TemperatureRelative
Humidity
Moisture
Content
Share in
the Air Stream
Other
External Air (E)Table 4Table 4Table 4variable,
Equation (4)
Exhaust Air (EX)26 °C55%xEX = 11.7 kg/kg(1 − α)Evaporation during the day 64.0 kg/h
Evaporation at night 53.1 kg/h
Supply Air (SU)27 °Cnot applicablexSU = 7.7 kg/kgnot applicableDuring the day 13,400 m3/h
At night 13,400 m3/h
Air in Mixing Chamber (MIX)Equation (10)not applicablexMIX = xSUnot applicable
Table 10. Assumptions and calculation data for Scenario 6.
Analyzed
Point
TemperatureRelative
Humidity
Moisture
Content
Share in
the Air Stream
Other
External Air (E)Table 4Table 4Table 4α = 70%
Exhaust Air (EX)26 °CEquation (12)Equation (11)(1 − α) = 30%Evaporation during the day 64.0 kg/h
Evaporation at night 53.1 kg/h
Heat Exchanger (EX)Equation (7)not applicablexHE = xEnot applicableHeat exchange efficiency
η = 50%
Supply Air (SU)27 °Cnot applicablexSU = xMIXnot applicableDuring the day 13,400 m3/h
At night 13,400 m3/h
Air in Mixing Chamber (MIX)Equation (10)not applicableEquation (9)not applicable
Table 11. Assumptions and calculation data for Scenario 7.
Analyzed
Point
TemperatureRelative
Humidity
Moisture
Content
Share in
the Air Stream
Other
External Air (E)Table 4Table 4Table 4α = 70%
Exhaust Air (EX)29 °CEquation (12)Equation (11)(1 − α) = 30%Evaporation during the day 64.0 kg/h
Evaporation at night 53.1 kg/h
Supply Air (SU)30 °Cnot applicablexSU = xMIXnot applicableDuring the day 13,400 m3/h
At night 13,400 m3/h
Air in Mixing Chamber (MIX)Equation (10)not applicableEquation (9)not applicable
Table 12. Measurement results from Stage 1—Winter period for selected hours.
ParametersDaytime 12:00Nighttime 22:00
Temperature [°C]Relative
Humidity [%]
Moisture Content [kg/kg]
Equation (1)
Temperature [°C]Relative
Humidity [%]
Moisture Content [kg/kg]
Equation (1)
Supply Air23.728.60.005225.624.40.0049
Exhaust Air24.351.00.009724.443.60.0089
Pool24.550.00.009624.646.00.0089
Outdoor7.755.00.00364.967.00.0036
Water Temperature [°C]2828
Number of Swimmers190
Air Flow [m3/h]15,47515,530
Δx = xSUxEX [kg/kg] Equation (2)0.00450.0033
Evaporation [kg/h] Equation (3)8362.1
Evaporation Rate [kg/h/m2]0.2660.199
Table 13. Stage 2 measurement results after the implementation of corrective actions.
ParametersDaytime 12:00DifferenceNighttime 22:00Difference
Temperature [°C]Relative Humidity [%]Moisture Content [kg/kg]Temperature [°C]Relative Humidity [%]Temperature [°C]Relative Humidity [%]Moisture Content [kg/kg]Temperature [°C]Relative Humidity [%]
Supply Air25.9280.00582.2 28220.5152.4
Exhaust Air25.946.70.00981.6 25.9410.8521.5
Pool Air26.243.50.009221.7−1025.739.80.00821.1−5
Outdoor Air9.9550.004142.2 9.5510.00374.6
In AHU Mixing Chamber 15.254.40.00582 13.8530.0052
Swimmers24 0
Water Temperature [°C]27.8 0.2 27.8 0.2
Air Flow [m3/h]13,417−205813,312−2218
External Air Share [%]70.0
Δx [kg/kg] 0.003980 0.003370
Evaporation rate [kg/h]64.1 −18.953 −14
Evaporation rate [kg/h/m2]0.205 −0.06 0.17 0.02
Table 14. Comparison of thermal comfort parameters in a swimming pool in seven scenarios.
ScenarioBaselineScenario
1234567
CharacteristicVSU = 13,400 m3/h
αEX = 70%
RH = 40%
η = 0%
tSU = 27 °C
VSU,NIGHT
= 11,400 m3/h
(−15%)
VSU,DAY
= 10,900 m3/h
(−33%)
VSU,NIGHT
= 8900 m3/h
(−42%)
αEX = 50%
(−20%)
αEX
= variable
RH = 55%
(+15%)
η = 50%tSU = 30 °C
(+3 °C)
Average relative humidity [%]46.646.653.956.546.656.552.446.6
Average temperature [°C]2626262626262629
Table 15. Heat demand in seven scenarios of proposed changes for the day analyzed.
BaselineScenario
1234567
VSU = 13,400 m3/h
αEX = 70%
RH = 40%
η = 0%
tSU = 27 °C
VSU,NIGHT
= 11,400 m3/h
(−15%)
VSU,DAY
= 10,900 m3/h
(−33%)
VSU,NIGHT
= 8900 m3/h
(−42%)
αEX = 50%
(−20%)
αEX
= variable
RH = 55%
(+15%)
η = 50%tSU = 30 °C
(+3 °C)
Heat demand [kWh/day]1424133411081049139210857691580
Difference [%]−6%−22%−26%−2%−24%−46%+16%
Disclaimer/Publisher’s Note: The statements, opinions and data contained in all publications are solely those of the individual author(s) and contributor(s) and not of MDPI and/or the editor(s). MDPI and/or the editor(s) disclaim responsibility for any injury to people or property resulting from any ideas, methods, instructions or products referred to in the content.

