Abstract
Electrical distribution companies have been investing in modernizing their structures, especially operation automation. The integration of information technologies and communications makes fast power restoration during fault events, providing better profit to companies and a more reliable and safe distribution network for customers. A self-healing strategy can be implemented for protection and control devices to work cooperatively, achieving the global purpose of automatic distribution system restoration. Thus, this work proposes a methodology for short-circuit fault detection, isolation of the faulted section, and restoration of downstream sections using neighbor feeders. The protection devices use standardized IEC and ANSI/IEEE functions to sensitize faults in the system and to promote adequate isolation, allowing the consequent restorative process. A genetic algorithm optimizes the devices’ parameters used in the protection scheme, making fastest the isolation process and ensuring the protection system coordination and selectivity. Results obtained using Simulink® allows for verifying the proposed methodology’s behavior and efficiency.
1. Introduction
The modernization of distribution networks presents promising solutions to the current structure, allowing better control of the whole system and increasing quality and efficiency. The management of energy consumption, automation and communication techniques are very useful tools for distribution utilities and their customers since their optimization increases continuity and reliability indices [1].
Traditional distribution networks are usually meshed but operate using radial topology to simplify and reduce investment costs with the protection system. In contrast, the smart grid allows bidirectional power flow and uses information technology to ensure an automated and efficient distribution system operation, presenting a quick response to several conditions and events [2]. This technological advance provides a self-healing capacity to the distribution network, being able to detect and solve fault events by using sensors, actuators and intelligent control distributed throughout the grid.
Faults in the distribution system promote protection system operation to isolate the faulted equipment and minimize the de-energized area. In this case, loads upstream the faulted feeder section remain connected, while downstream sections lose power. Thus, service restoration is an essential procedure to increase reliability indexes. Changes in the distribution system topology, load transference to neighbor feeders, and islanded operation of distributed energy resources (DER) with part of distribution network loads are techniques usually implemented for service restoration [3].
DER integration may lead to bidirectional power flow, causing protection system misoperation. Blinding of protection occurs when the fault current that sensitizes the relay changes. Consequently, a backup relay may trip as primary protection. False tripping can also happen if a relay detects a current greater than its pickup current due to a downstream distributed generation (DG) connection. Adaptive protection schemes may overcome these problems.
Several works have proposed different self-healing strategies to increase power system reliability. However, most of them include only service restoration, assuming proper operation of the protection system for fault isolation [4,5,6]. Some works consider the whole restoration process into two parts: (1) normal operation before the fault; and (2) service restoration after the fault isolation process.
In [7], a two-stage self-healing strategy using a multiagent system is employed, where a fuzzy inference system determines the control procedures. Despite the method’s efficiency, a control system using standardized functions is closer to the methods employed by distribution utilities, allowing a more friendly transition than the fuzzy controller.
An adaptive protection scheme is proposed in [8], where the authors optimize the parameters of overcurrent relays (OCRs) using a modified particle swarm optimization (PSO) and a linear technique to obtain feasible initial solutions. PSO is a powerful tool for optimizing continuous variables. However, its performance is reduced when optimizing discrete variables. The problem considers only normal inverse curves from the international electrotechnical commission (IEC) standard, simplifying the problem. The technique is applied using different network topologies, and the parameters are stored for future application. When the central controller detects changes in the distribution network topology, the controller chooses the appropriate setting group to ensure coordination and selectivity.
Self-healing strategies also employ a communication scheme between protection and control devices and the distribution management system in the control room [9]. This technique requires more expensive equipment and has this additional communication step for network operation.
Therefore, in contrast to other works, this paper proposes a self-healing strategy using intelligent electronic devices (IEDs) and standardized IEC and ANSI/IEEE functions to sensitize faults in the system and promote adequate fault isolation. The protection and control devices operate locally to ensure fault isolation and service restoration, avoiding the unnecessary use of communication channel and human intervention; in addition to reducing the investment cost by using only passive protection devices. The proposed adaptive protection scheme supports DER over the power grid, as in most modern distribution networks. This strategy avoids miscoordination due to reverse power flow during changes in the distribution network topology, such as after load transference to neighbor feeders, ensuring the robustness of the protection system.
2. Protection System Coordination
The operating times of OCRs are generally calculated according to IEC 60255 or IEEE C37.112-2018 [10,11]. Both standards present five types of current curves (TCC), as shown in Table 1. The trip time of OCRs depends on the TCC, time dial (TD), fault current, and the relay pick-up current (1). The TCC for IEEE and IEC standards are normal inverse (NI), very inverse (VI), extremely inverse (EI), long-time inverse (LI), and short-time inverse (SI). These TCCs depend on factors , , and .

Table 1.
IEC and ANSI/IEEE Standard Curves.
The pick-current determines the OCR’s sensibility. The smaller , the shorter the trip time. Likewise, the TD increases or decreases the operating time while the TCC changes the time-current curve.
2.1. Protection and Control Scheme
The protection system coordination is achieved by ensuring the coordination and selectivity between each pair of protection devices. The upstream OCR from the pair is also called backup relay or protected device, while the other one is the primary protection or protective device.
Figure 1 shows a test system with four OCRs and one automatic switch (AS). Symbols for relays and ASs filled in black indicate closed switches. Otherwise, the switch is open. Three fault examples are considered to describe the problem and the proposed protection scheme. Initially, Case 1, assumes a fault in a bus within R3 protected section. In this case, R3 must trip first concerning R2, including a coordination time between them to avoid miscoordination, as given in (2). This coordination is performed between R1 and R2, as well. Maximum and minimum short-circuit currents should be considered in (2) to ensure selectivity in such an interval. This coordination scheme ensures the proper protection system operation for the radial network presented in Figure 1a.
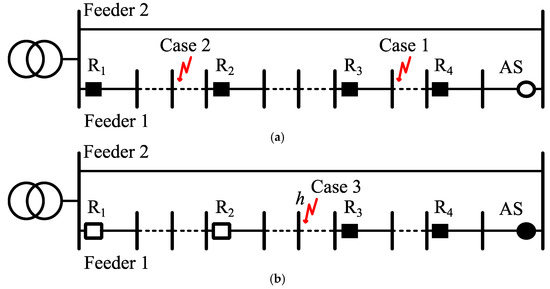
Figure 1.
Example system: (a) normal topology; (b) new topology after load transference of downstream sections.
Now, assume that a fault occurs inside the feeder section protected by R1 (Case 2), and R4 has an undervoltage relay (UVR), ANSI 27. Thus, R1 trips, isolating the system. Meanwhile, R4 detects undervoltage and trips, closing the AS. Subsequently, the restorative process transfers the loads downstream of the fault to the neighboring feeder 2, as shown in Figure 1b. In this case, the protection system must remain operating properly to ensure network security until the maintenance team fixes the problem. However, the current set of parameters may not ensure coordination and selectivity. For a fault in the protected zone of R3 considering the new topology (Case 3), the relay R4 may trip first than R3 using the current set of parameters for direct power flow, implying miscoordination. Therefore, a new set of parameters for reverse power flow can overcome this problem.
After load transference, as shown in Figure 1b, coordination is ensured using (3). Thus, the protection system must store different sets of parameters to ensure coordination and selectivity for each distribution network topology. The example system includes a case with load transference to Feeder 2. However, this scheme can also be extended for DG units.
The self-healing strategy employing overcurrent and undervoltage relays can overcome the dependency of the system operator, changing the network topology during service restoration, providing autonomous operation, faster response, and a higher reliability level.
Figure 2 shows a system example and a logic diagram based on the proposed method. The first relay is composed only by function ANSI 51. RS is the remote signal, allowing the system operator to change the switch status manually or through the supervisory application. Relays along the distribution network also have a directional unit, ANSI 67, allowing overcurrent sensibilization using different parameters for both direct and reverse power flow. The relay close to the neighbor feeder has a tie switch normally open, in addition to overcurrent and undervoltage relays, ANSI 51 and 27, respectively.
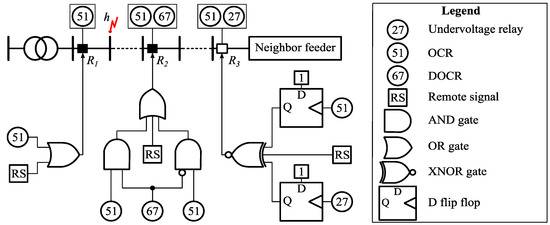
Figure 2.
System example and logic diagram of the proposed method for an example of distribution system.
For a fault in , within the section protected by R1, such relay trips and disconnect downstream loads. Meanwhile, undervoltage in downstream sections promotes tripping of R3, closing the tie switch and supplying the area by the neighbor feeder. Then, R2 operates using parameters for reverse power flow, tripping and disconnecting the faulted area. Thus, the protection and control system ensure the autonomous protection system and service restoration.
2.2. Problem Formulation
The objective function minimizes the sum of OCRs’ tripping times while ensuring coordination and selectivity.
The objective function can also include in the same formulation both tripping times and penalizations of coordination constraints, as given in (4). is the number of possible topologies, where the controller must have a set of parameters for each condition. is the number of relays, and the tripping time of the i-th relay for topology , subject to the minimum allowed operating time constraint (5). the set of pairs to assess coordination for both phase and neutral OCR units, and is the penalty whenever the selectivity and coordination constraints are exceeded, such as (6) and (7). The set of factors weight the relevance of each penalty function.
In (6) and (7), protected and protective devices are represented by and , respectively, for every topology from . The coordination time ensures a safety margin between tripping times.
The objective function is subject to constraints (8) to (10), representing the limits for the pickup current, TD, and TCC. Bottom and top bars represent, respectively, the minimum and maximum limits.
3. Protection System Optimization
Optimization of nonlinear combinatorial problems is a difficult task to solve, and there is no guarantee of finding the optimal global solution. Several tools allow optimizing these problems [12]. In this work, the optimization of OCRs’ parameters is performed using a genetic algorithm (GA) since it is a well-known tool for solving optimization problems, as the proposed one, presenting good solutions with low processing times.
3.1. Genetic Algorithm
GA is based on Darwin’s theory of natural evolution, where the offspring from a pair of individuals (parents) is a combination of its characteristics, promoting several changes in the population throughout generations. Thus, individuals with the best genes survive, spreading their characteristics to the following generations [13].
An individual or chromosome is a coded candidate solution composed of all considered OCR parameters, while a population is a set of these individuals [14]. Each gene of a chromone represents a parameter of the OCRs belonging to the protection system. Thus, such a codification includes integers and real numbers. Figure 3 shows an example of the individual’s codification, including relays’ parameters for every topology.
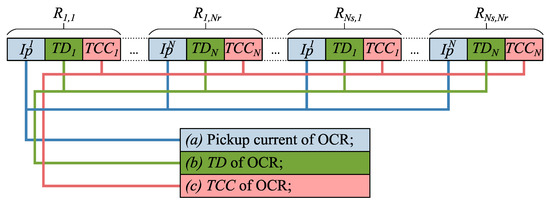
Figure 3.
Proposal’s codification.
GA starts by generating a randomly controlled initial population, where the parameters values are signed according to constraints (8) to (10). These individuals are evaluated using (4), and fitness is stored as the incumbent solution. Meanwhile, the best solutions from the current population are stored to fill a small part of the new population and ensure elitism with a low impact on population diversity.
Posteriorly, genetic operators are applied in the current population, creating their offspring. The tournament selection finds two winners from a small set of random individuals from the current population. These parents are selected for crossover, creating a new pair of individuals for the new population based on the exchange of genes between them. This process repeats until filling the new population.
The crossover operator combines two chromosomes using multi-point crossover, that is, exchange information between both individuals in a few parts of the whole chromosome according to the number of points. The example in Figure 4 shows a crossover operation using three points.
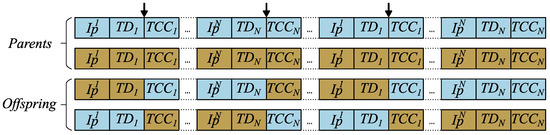
Figure 4.
Three-point crossover.
The subsequent genetic operator is the mutation, which is responsible for improving population diversity. In this step, the genes of some individuals are arbitrarily modified within limits imposed by (8) to (10). Both crossover and mutation operators are reactive, changing their probabilities according to the population diversity [15], as respectively given in (11) and (12) where is the number of similar solutions in generation , is the population size, and and represent maximum and minimum values for crossover and mutation rates. Thus, the lower the diversity the higher the crossover rate. In contrast, the higher the diversity, the lower the mutation rate.
Therefore, this process repeats until it reaches the stop criteria. The number of generations generally is the stop criterion, but the GA can also stop the process if the best solution does not change after a predefined number of iterations.
3.2. Initial Solution
An initial solution created randomly within limits imposed by (8) to (10) is easily infeasible because the coordination problem has a very large infeasible region in the search space. Thus, implementing a heuristic can overcome this difficulty and provide good initial solutions for the proposed GA.
Usually, the protection system has one or more devices with less dependency on the others concerning coordination and selectivity. For example, in Figure 5, R3 or R4 can have the minimum allowed tripping time because there is no downstream protection device. On the other hand, R3 and R4 must coordinate with R2, which must coordinate with R1, which is the most dependent device. Thus, the protection devices can be numbered in sequence, from the far-end relay to the slack bus, according to their downstream dependency level (DDL).
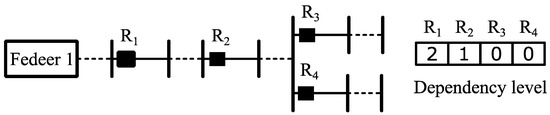
Figure 5.
Classification system for the proposed heuristic.
Figure 5 shows an example system, including numbered relays according to their coordination dependency, and Figure 6 shows a flowchart of the proposed heuristic. Relays numbered zero have no coordination dependency with downstream relays. The parameters of such devices are defined firstly by the heuristic method. In the initial step, a is chosen based on the sequence presented in Table 1, is defined as , and is defined as . Then, the operating time is calculated. While the tripping time is higher than , is decreased, and the process repeats until it reaches the minimum operating time or if . In this case, the is changed, and the process repeats, storing the best setup.
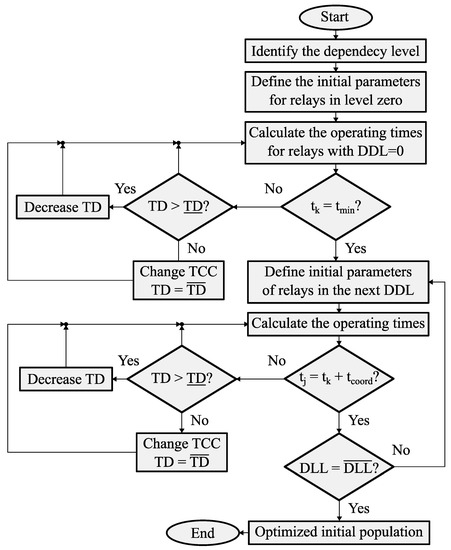
Figure 6.
Heuristic flowchart.
Taking the example in Figure 5, after defining the parameters of relays and , the heuristic starts optimizing OCR parameters from the other DDLs in ascending order. In these cases, preference must be given to choosing the TCC depending on the parameters of the downstream device. Thus, this process repeats until optimizing all protection devices parameters.
After the heuristic optimization process, the GA starts using the optimized initial population performing the classic genetic operators until it reaches the stop criteria.
4. Numerical Results and Discussion
The assessment of the proposed methodology uses MATLAB Simulink© environment for simulating the operation of a distribution network, where the optimized parameters achieved using GA are applied in the protection system. Simulations are performed under a real 363-bus system [16] with main buses shown in Figure 7. The simulated system includes five switches (SW) and a tie switch (TS), all equipped with OCRs. Switches 3, 4, and 5 include a directional relay in case of topology change by using load transference to the neighbor feeder. Thus, in such a situation, the OCRs’ parameters change for appropriate protection system operation. TS includes an UVR, ensuring a quick load transference during the fault event.
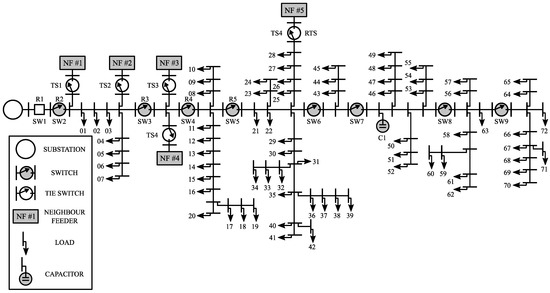
Figure 7.
363-bus test system.
Figure 8 shows a compact representation of the test system in MATLAB environment. Loads are clustered on the main section buses to simplify the system in Simulink. Numerical results include two cases: a two-phase fault between R2 and R3 and a solid single-phase fault between R5 and RTS. Table 2 shows the details of each fault simulation.
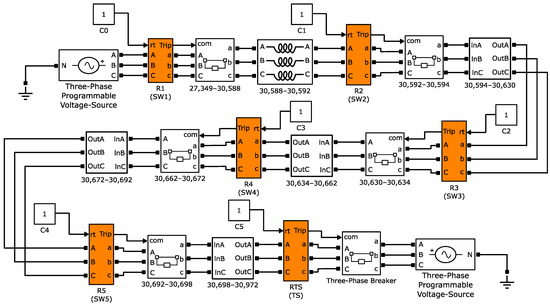
Figure 8.
363-bus test system in MATLAB Simulink ©.
Table 2.
Fault Details.
Figure 9 shows UVR and DOCRs block diagrams. DOCRs’ diagram is extended, showing OCR and directional unit schemes. The voltage seen by the UVR is compared to the pickup voltage, defined as 0.5 pu. Then the counter starts, and the protection trips after one cycle. Directional units only allow DOCR operation if the angle phase is outside the range between 10 and 170 degrees [17]. If the current is in forward flow (FF), the directional unit sends a true signal to the DOCR, allowing only the OCR used for direct flow (DF) to operate. Otherwise, the directional unit sends a false signal, blocking the OCR_DF operation and allowing the OCR used for reverse flow (RF) to operate. OCRs will trip if the current seen by the relay surpasses the pickup current, where the tripping time is calculated as in (1).
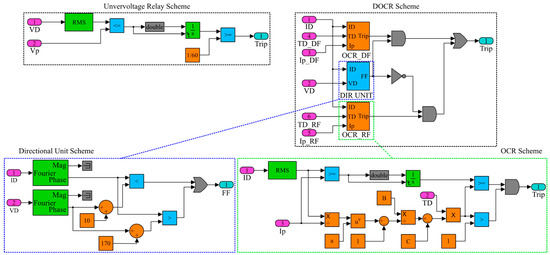
Figure 9.
Block diagrams of Undervoltage relays, DOCRs, ORCs, and directional units in MATLAB Simulink ©.
4.1. Optimized Parameters
The optimization problem for coordination depends on the previous specification of GA parameters, coordination times and limits concerning the protection parameter intervals, as shown in Table 3. Table 4 shows the optimized parameters after the GA execution, including tripping times for each relay when sensitizing as primary or backup protection and tripping times for time-delayed instantaneous operation (ANSI 50TD). R5 has no dependency on coordination with downstream protection devices for DF. Likewise, R3 has no dependency concerning RF. For this reason, both relays have the minimum allowed tripping times.
Table 3.
GA Parameters and Limits.
Table 4.
OCRs Parameters.
Weighting factors and are defined as 10 and 30, respectively. The best solution presents an objective function of 3.198 s. Most coordination between pairs has restrictions (6) and (7) active, highlighting the good quality of the solution found since the operation times have the lowest possible values.
4.2. Protection System Coordination
Based on the optimized parameters found by the proposed GA, a set of coordinograms is shown to evaluate whether the protection system operates properly.
Figure 10 shows a coordinogram for relays considering parameters of direct power flow, except the first relay since R1 and R2 differ only by the TMS. The coordination time interval between pairs is highlighted in the figure. Three TCCs were used by the solver for direct power flow parametrization, presenting different time-current behavior for each of them.
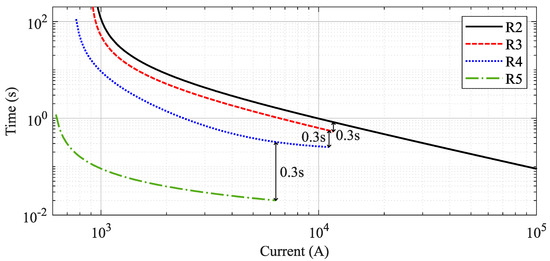
Figure 10.
Coordinogram for relays considering parameters of direct power flow.
A coordinogram of relays considering parameters of reverse power flow is shown in Figure 11. The coordination time intervals are close to the limits imposed by constraint (6), which depends on factor , previously defined by the user. Only the coordination between RTS and R5 presents a greater coordination time interval, with 0.301 s.
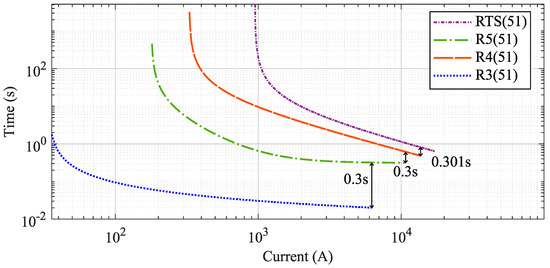
Figure 11.
Coordinogram for relays considering parameters of reverse power flow.
For both direct and reverse flow, the far-end relay presents lower tripping times since the DDL is zero. Other time-current curves present lower tripping times mainly because of the coordination time interval between pairs.
4.3. Case 1: Fault between R2 and R3
The protection system performance is assessed by simulating a two-phase fault for phases A and B at bus 30630. The short-circuit starts after ten cycles of normal operation. Figure 12 shows the voltage profile, current flows, and trip signal for relay R2. Likewise, Figure 13 and Figure 14 show the power flow and trip signal for relays R3 and RTS, respectively.
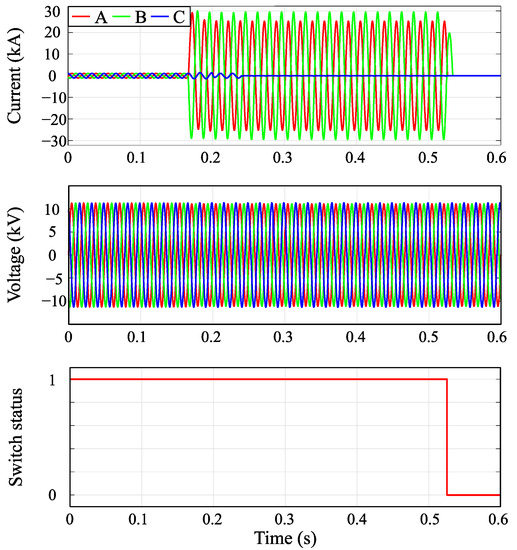
Figure 12.
Power flow and switch status of R2 for a two-phase fault at bus 30630 (Case 1).
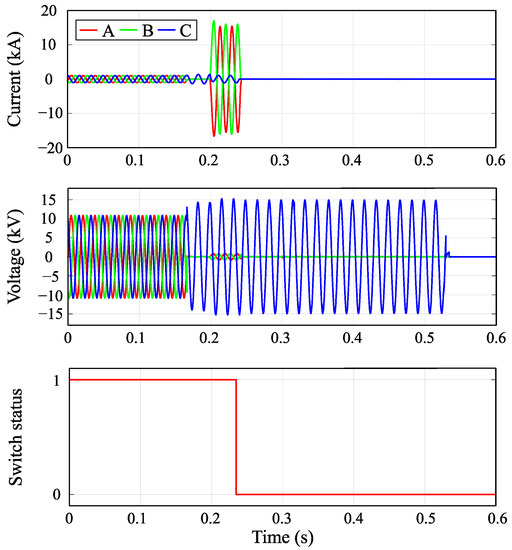
Figure 13.
Power flow and switch status of R3 for a two-phase fault at bus 30630 (Case 1).
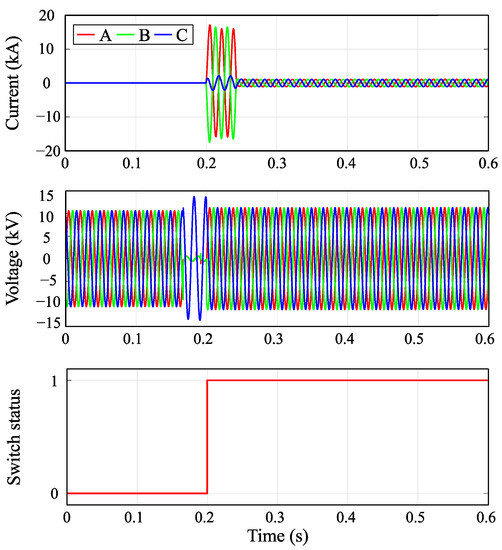
Figure 14.
Power flow and switch status of RTS for a two-phase fault at bus 30630.
The R2 branch experiences high currents during the short-circuit condition, and the voltage presents a smooth decrease, as shown in Figure 12. Meanwhile, R3 also faces high currents and has almost no voltage in the short-circuited phases because such a device is located downstream of the fault.
The relay near the neighbor feeder, RTS, is also facing high currents and voltage drops. Then, the undervoltage relay of RTS trips first in 0.1996 s, changing the status from zero (open) to one (closed) and connecting another feeder in the distribution network. Thus, R3 and the downstream section present a better voltage level because of the new source. R3 is now experiencing reverse power flow with high short-circuit currents. Then, its directional unit trips in 0.2325 s, 0.0119 s slower than the tripping time estimated by the GA plus the tripping time of RTS. Then, R2 trips in 0.5254 s, mitigating the fault. Loads upstream R2 remain connected to the main feeder, and loads downstream R3 are now supplied by the neighbor feeder. Therefore, only loads between R2 and R3 are disconnected until a maintenance crew fixes the problem.
Results present a quick response for the proposed self-healing strategy, where the entire process lasted 0.2065 considering the beginning of the fault until the last relay operation. The undervoltage relay trip highlights the importance of its inclusion in the proposed protection scheme, as shown in Figure 2. Using only the OCRs may cause delays in the protection system response.
4.4. Case 2: Fault between R5 and RTS
The second test includes a single-phase fault at bus 30,698 (A phase), between R5 and RTS, also starting ten cycles after normal network operation. Figure 15 and Figure 16 show the power flow and switch status for relays R5 and RTS.
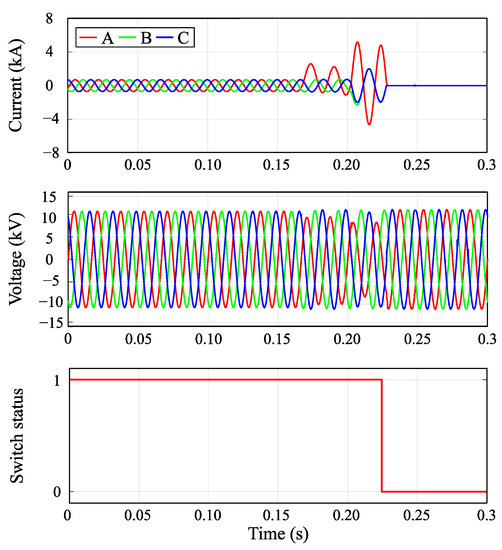
Figure 15.
Power flow and switch status of R5 for a single-phase fault at bus 30,698.
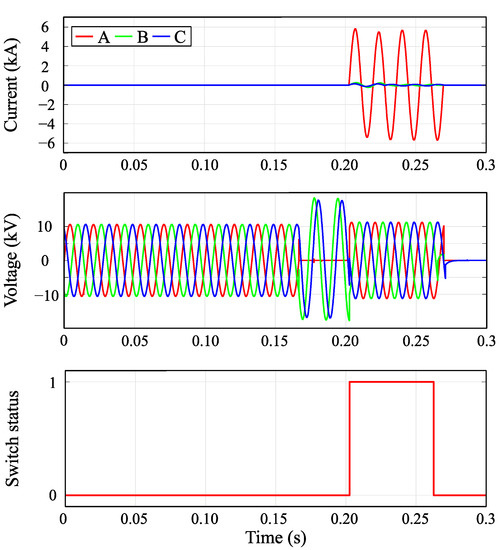
Figure 16.
Power flow and switch status of RTS for a single-phase fault at bus 30698.
At the beginning of the fault, the voltage on phase A decreases drastically while the current rises. Voltages on phases B and C rise as a consequence of the fault condition. The RTS trips in 0.2026 s because of the undervoltage in phase A. Then the currents rise since there are two sources feeding the fault. After one cycle of the RTS switch opening, R5 trips in 0.2222 s, isolating the upstream network.
A fault between the R5 and RTS protections makes load transfer impossible, as there is no other alternative to isolating the fault than by opening both protections. Therefore, the RTS must be opened again to mitigate the fault. Indeed, after around six cycles, the RTS trips in 0.3077 s, changing the switch status again to open. Then, only loads downstream R5 will be disconnected until the maintenance crew fix the problem.
Case 2 is the only situation where RTS cannot promote restoration to the neighbor feeder. Despite the double trip of the RTS in this case, the self-healing strategy promotes quick response for most fault conditions in the test system, increasing the reliability and energy quality.
5. Conclusions
The self-healing strategy proposed in this work provides a quick response for fault events, promoting autonomous fault isolation and load restoration. The proposed technique for optimizing relays’ parameters improves the protection system operation as well. The difference between the operation times estimated by the proposed method and observed by MATLAB Simulink© is small, making it a useful tool for applications in real systems. The proposed self-healing scheme considers only passive and low-cost protective devices, combining investment cost and performance advantages. Coordination and selectivity between protections minimize the faulted sections and increase the continuity of energy services through load transference to neighbor feeders. Future works could include more protection devices for redundancy, ensuring the proper protection system operation. Furthermore, including complementary techniques for detecting incipient faults improves the practical applicability of the proposed methodology, being another potential contribution to future work.
Author Contributions
Conceptualization, C.R., J.B.L. and C.E.M.P.; methodology, C.R., C.E.M.P. and J.B.L.; software, C.R., C.E.M.P. and J.B.L.; validation, C.R. and C.E.M.P.; investigation, C.R. and J.B.L.; writing—original draft preparation, C.R.; writing—review and editing, J.B.L.; supervision, J.B.L. All authors have read and agreed to the published version of the manuscript.
Funding
This paper was possible thanks to the scholarship granted from the Brazilian Federal Agency for Support and Evaluation of Graduate Education (CAPES)—Finance code 001, and the São Paulo Research Foundation (FAPESP), grants 2015/21972-6 and 2019/07436-5.
Data Availability Statement
The data that support the findings of this study are openly available in Laboratory of Electrical Power System Planning—LAPSEE at www.feis.unesp.br/Home/departamentos/engenhariaeletrica/lapsee807/home/distribution_network_363_lines.rar (accessed on 30 April 2023). Such information can also be found in reference [16].
Acknowledgments
We sincerely thank Jose Roberto Sanches Mantovani for reviewing our manuscript and providing constructive feedback to improve it. Also, this work was supported by the Laboratory of Electrical Power System Planning—LAPSEE at Sao Paulo State University—UNESP/FEIS.
Conflicts of Interest
The authors declare no conflict of interest.
References
- Muqeet, H.A.; Liaqat, R.; Jamil, M.; Khan, A.A. A State-of-the-Art Review of Smart Energy Systems and Their Management in a Smart Grid Environment. Energies 2023, 16, 472. [Google Scholar] [CrossRef]
- Chen, B.; Wang, J.; Lu, X.; Chen, C.; Zhao, S. Networked Microgrids for Grid Resilience, Robustness, and Efficiency: A Review. IEEE Trans. Smart Grid 2021, 12, 18–32. [Google Scholar] [CrossRef]
- Khan, M.W.; Wang, J.; Ma, M.; Xiong, L.; Li, P.; Wu, F. Optimal energy management and control aspects of distributed microgrid using multi-agent systems. Sustain. Cities Soc. 2019, 44, 855–870. [Google Scholar] [CrossRef]
- Li, W.; Li, Y.; Chen, C.; Tan, Y.; Cao, Y.; Zhang, M.; Peng, Y.; Chen, S. A Full Decentralized Multi-Agent Service Restoration for Distribution Network with DGs. IEEE Trans. Smart Grid 2020, 11, 1100–1111. [Google Scholar] [CrossRef]
- Torres, B.S.; Ferreira, L.R.; Aoki, A.R. Distributed intelligent system for self-healing in smart grids. IEEE Trans. Power Deliv. 2018, 33, 2394–2403. [Google Scholar] [CrossRef]
- Zhao, H.; Lu, Z.; He, L.; Guo, X.; Li, X.; Xiao, H. Two-stage multi-fault emergency rush repair and restoration robust strategy in distribution networks. Electr. Power Syst. Res. 2020, 184, 106335. [Google Scholar] [CrossRef]
- Leite, J.B.; Mantovani, J.R.S. Development of a Self-Healing Strategy with Multiagent Systems for Distribution Networks. IEEE Trans. Smart Grid 2017, 8, 2198–2206. [Google Scholar] [CrossRef]
- Atteya, A.I.; Zonkoly, A.M.E.; Ashour, H.A. Optimal relay coordination of an adaptive protection scheme using modified PSO algorithm. In Proceedings of the 2017 19th International Middle-East Power Systems Conference, MEPCON 2017—Proceedings, Cairo, Egypt, 19–21 December 2017; Volume 2018, pp. 689–694. [Google Scholar] [CrossRef]
- Arefifar, S.A.; Alam, M.S.; Hamadi, A. A Review on Self-healing in Modern Power Distribution Systems. J. Mod. Power Syst. Clean Energy 2023, 1–16. [Google Scholar]
- Standard C37.112; Standard for Inverse—Time Characteristics Equations for Overcurrent Relays. IEEE: New York, NY, USA, 2018.
- Standard 60255-151; Measuring Relays and Protection Equipment—Part 151: Functional Requirements for Over/Under Current Protection. IEC: Dublin, Ireland, 2009.
- Malik, H.; Iqbal, A.; Joshi, P.; Agrawal, S.; Bakhsh, F.I. (Eds.) Metaheuristic and Evolutionary Computation: Algorithms and Applications; Springer: Singapore, 2021; Volume 916. [Google Scholar] [CrossRef]
- Kramer, O. Genetic Algorithms; Springer: Berlin/Heidelberg, Germany, 2017; pp. 11–19. [Google Scholar] [CrossRef]
- Marcolino, M.H.; Leite, J.B.; Mantovani, J.R.S. Optimal Coordination of Overcurrent Directional and Distance Relays in Meshed Networks Using Genetic Algorithm. IEEE Lat. Am. Trans. 2015, 13, 2975–2982. [Google Scholar] [CrossRef]
- Reiz, C.; Leite, J.B. Optimal Coordination of Protection Devices in Distribution Networks with Distributed Energy Resources and Microgrids. IEEE Access 2022, 10, 99584–99594. [Google Scholar] [CrossRef]
- Laboratory of Electrical Power System Planning—LAPSEE, “Distribution Test System—363 Buses”. 2015. Available online: http://www.feis.unesp.br/Home/departamentos/engenhariaeletrica/lapsee807/home/distribution_network_363_lines.rar (accessed on 27 March 2023).
- Kezunovic, M.; Ren, J.; Lotfifard, S. Design, Modeling and Evaluation of Protective Relays for Power Systems; Springer International Publishing: Cham, Switzerland, 2016. [Google Scholar] [CrossRef]
Disclaimer/Publisher’s Note: The statements, opinions and data contained in all publications are solely those of the individual author(s) and contributor(s) and not of MDPI and/or the editor(s). MDPI and/or the editor(s) disclaim responsibility for any injury to people or property resulting from any ideas, methods, instructions or products referred to in the content. |
© 2023 by the authors. Licensee MDPI, Basel, Switzerland. This article is an open access article distributed under the terms and conditions of the Creative Commons Attribution (CC BY) license (https://creativecommons.org/licenses/by/4.0/).