1. Introduction
Smart Micro-Grids (MGs) are key enablers for the introduction and increased penetration of Distributed Energy Resources (DERs). Standard grid control strategies devised for the one-directional energy flows of classical power systems must be complemented by additional distributed control intelligence for the management of not wholly predictable bi-directional flows. Additionally, the capability of autonomous (islanded) operation that is intrinsic with the MG paradigm, with its clustering of generators, loads, and Battery Energy Storage Systems (BESSs), potentially improves the overall gird efficiency and resilience, and is considered a key component of the development of Smart Cities [
1].
University campuses are natural candidates as living labs for the application of the MG paradigm, with a favorable combination of size, energy footprint, and dynamic environment and mindset [
2,
3,
4,
5]. Published works have described the introduction of campus energy management systems [
6], multi-layered modeling for smart grid development [
7], the implementation of smart grid concepts for increased grid reliability [
8], the development of campus digital twins for real-time operation and planning purposes [
9], and the integration of electric vehicle (EV) charging stations [
10]. The University of Parma South Campus (UPSC) hosts four departments and 10 research centers, as well as recreational and sports facilities, cafeterias, etc., accessed by some 10,000 people on a normal day of a teaching semester. The installation of 805 kW
p of photovoltaic (PV) power generation and ten charging stations for electric vehicles (EVs) is the first step of a planned transition toward a true MG, with the deployment of further PV generation, BESSs, and the installation of a smart metering network to monitor and control the energy flows (electrical and thermal). The lack of a smart metering network clearly poses limitations to the current status of our modeling effort, mostly in terms of accuracy in the description of generation and load profiles; however, the main focus of this paper is the description of the modeling framework, not the detailed analysis of our specific campus energy footprint. As more and more data will be made available by the deployment of a metering network, they will be easily and seamlessly inserted into the existing model. The electric MG will also be increasingly integrated with the thermal grid [
11,
12].
Grid modeling is naturally a necessary step of this development, to analyze the current energy production and consumption patterns, and to plan future choices. Detailed modeling of the key elements of the energy infrastructure and of the MG as a whole is a necessary step in this process: first, as a design and planning tool, and in the second stage, as the backbone of the MG control system. This paper describes a MATLAB-based campus MG model, and its use to investigate the effect and cost of introducing additional PV generation and BESS capacity. In particular, we present a library of models for the components of a campus MG, expanding on a previous publication [
13] in a few directions: (i) a detailed model of the heat-pump-based heating/cooling system of campus buildings, coupling the dynamic thermal model with the electric grid model; this kind of comprehensive energy grid modeling will likely gain importance in the near future as the concept of integrated energy districts and their modeling becomes more common; (ii) outdoor lighting load modeling; (iii) active power/frequency (P-f) droop characteristics for the estimation of MG frequency variations in islanded mode. It is worth pointing out that, at the present stage, the model is not intended to serve MG control purposes [
14,
15] or stability analysis; rather, it aims to give a physical description of the main components of the electric MG as a guide to development planning. What the model in its current stage can perform is basically a load flow analysis, which in this paper is limited to the analysis of active and reactive power flows in a grid featuring slack nodes (specified voltage amplitude and phase, e.g., the PCC), generator buses (specified active power and voltage magnitude, e.g., the PV plants), and load buses (specified active and reactive power, e.g., all blocks representing buildings and loads); steady-state contingency analysis is within the possibilities of our modeling framework, but has not yet been considered. Protection aspects [
16] will also be the subject of future work.
The modeling framework described in this paper represents a computationally lean tool for steady-state daily-to-yearly electrical, economical, and environmental analysis of an MG, featuring physical descriptions of electric lines and transformers. Another novel feature of this work is the integration of electrical and thermal models (applied to a building with heating and cooling provided by a heat pump), which, in the further steps of our work will be extended to the whole campus grid, to develop a complete energy district model.
The paper is organized as follows:
Section 2 describes the modeling approach, while
Section 3 deals with the MG model and its components;
Section 4 shows how the model can be used to study different PV-BESS capacity combinations, and a comparison between modeled and measured PV energy production is described in
Section 5. A few considerations about the inclusion of P-f droops are then given in
Section 6; finally,
Section 7 draws some conclusions and outlines future developments.
2. Modeling Approach
The UPSC MG model is built in MATLAB-Simulink (Simscape Electrical Specialized Power environment). Since our main goal is studying the evolution of the actual campus grid towards a true MG, we want to estimate the economic and environmental sustainability of the development over extended periods of time. This calls for significant simplifications to keep the computational load within acceptable bounds; we therefore adopted a discrete-time three-phase constant-frequency phasor-domain simulation [
17] (a few considerations about the inclusion of frequency variations are given in
Section 5).
The national power grid (NPG), which is currently the main source of energy for the UPSC, and is connected at the Point of Common Coupling (PCC), is represented as an ideal voltage generator. The MG features a tree-like structure with loops serving buildings of recent construction and for emergency and backup purposes. All the nodes of the tree are equipped with a transformation cabinet. Medium- (15 kV) to low-voltage (400 V) transformers are described by the Simscape
Three phase transformer (Three windings) block. At the medium voltage level the carriers have no neutral reference line, unlike at the low voltage level. Cables are modelled using the
Distributed Parameters Line block, with per-unit-length values of resistance, inductance, and capacitance taken from the real UPSC case. Detailed information about the actual size of the UPSC grid are resumed in
Table 1. End-side utilities consist of buildings or building compounds. The model, which includes classrooms, scientific laboratories, offices, sport facilities, and cafeterias, is schematically shown in
Figure 1, while
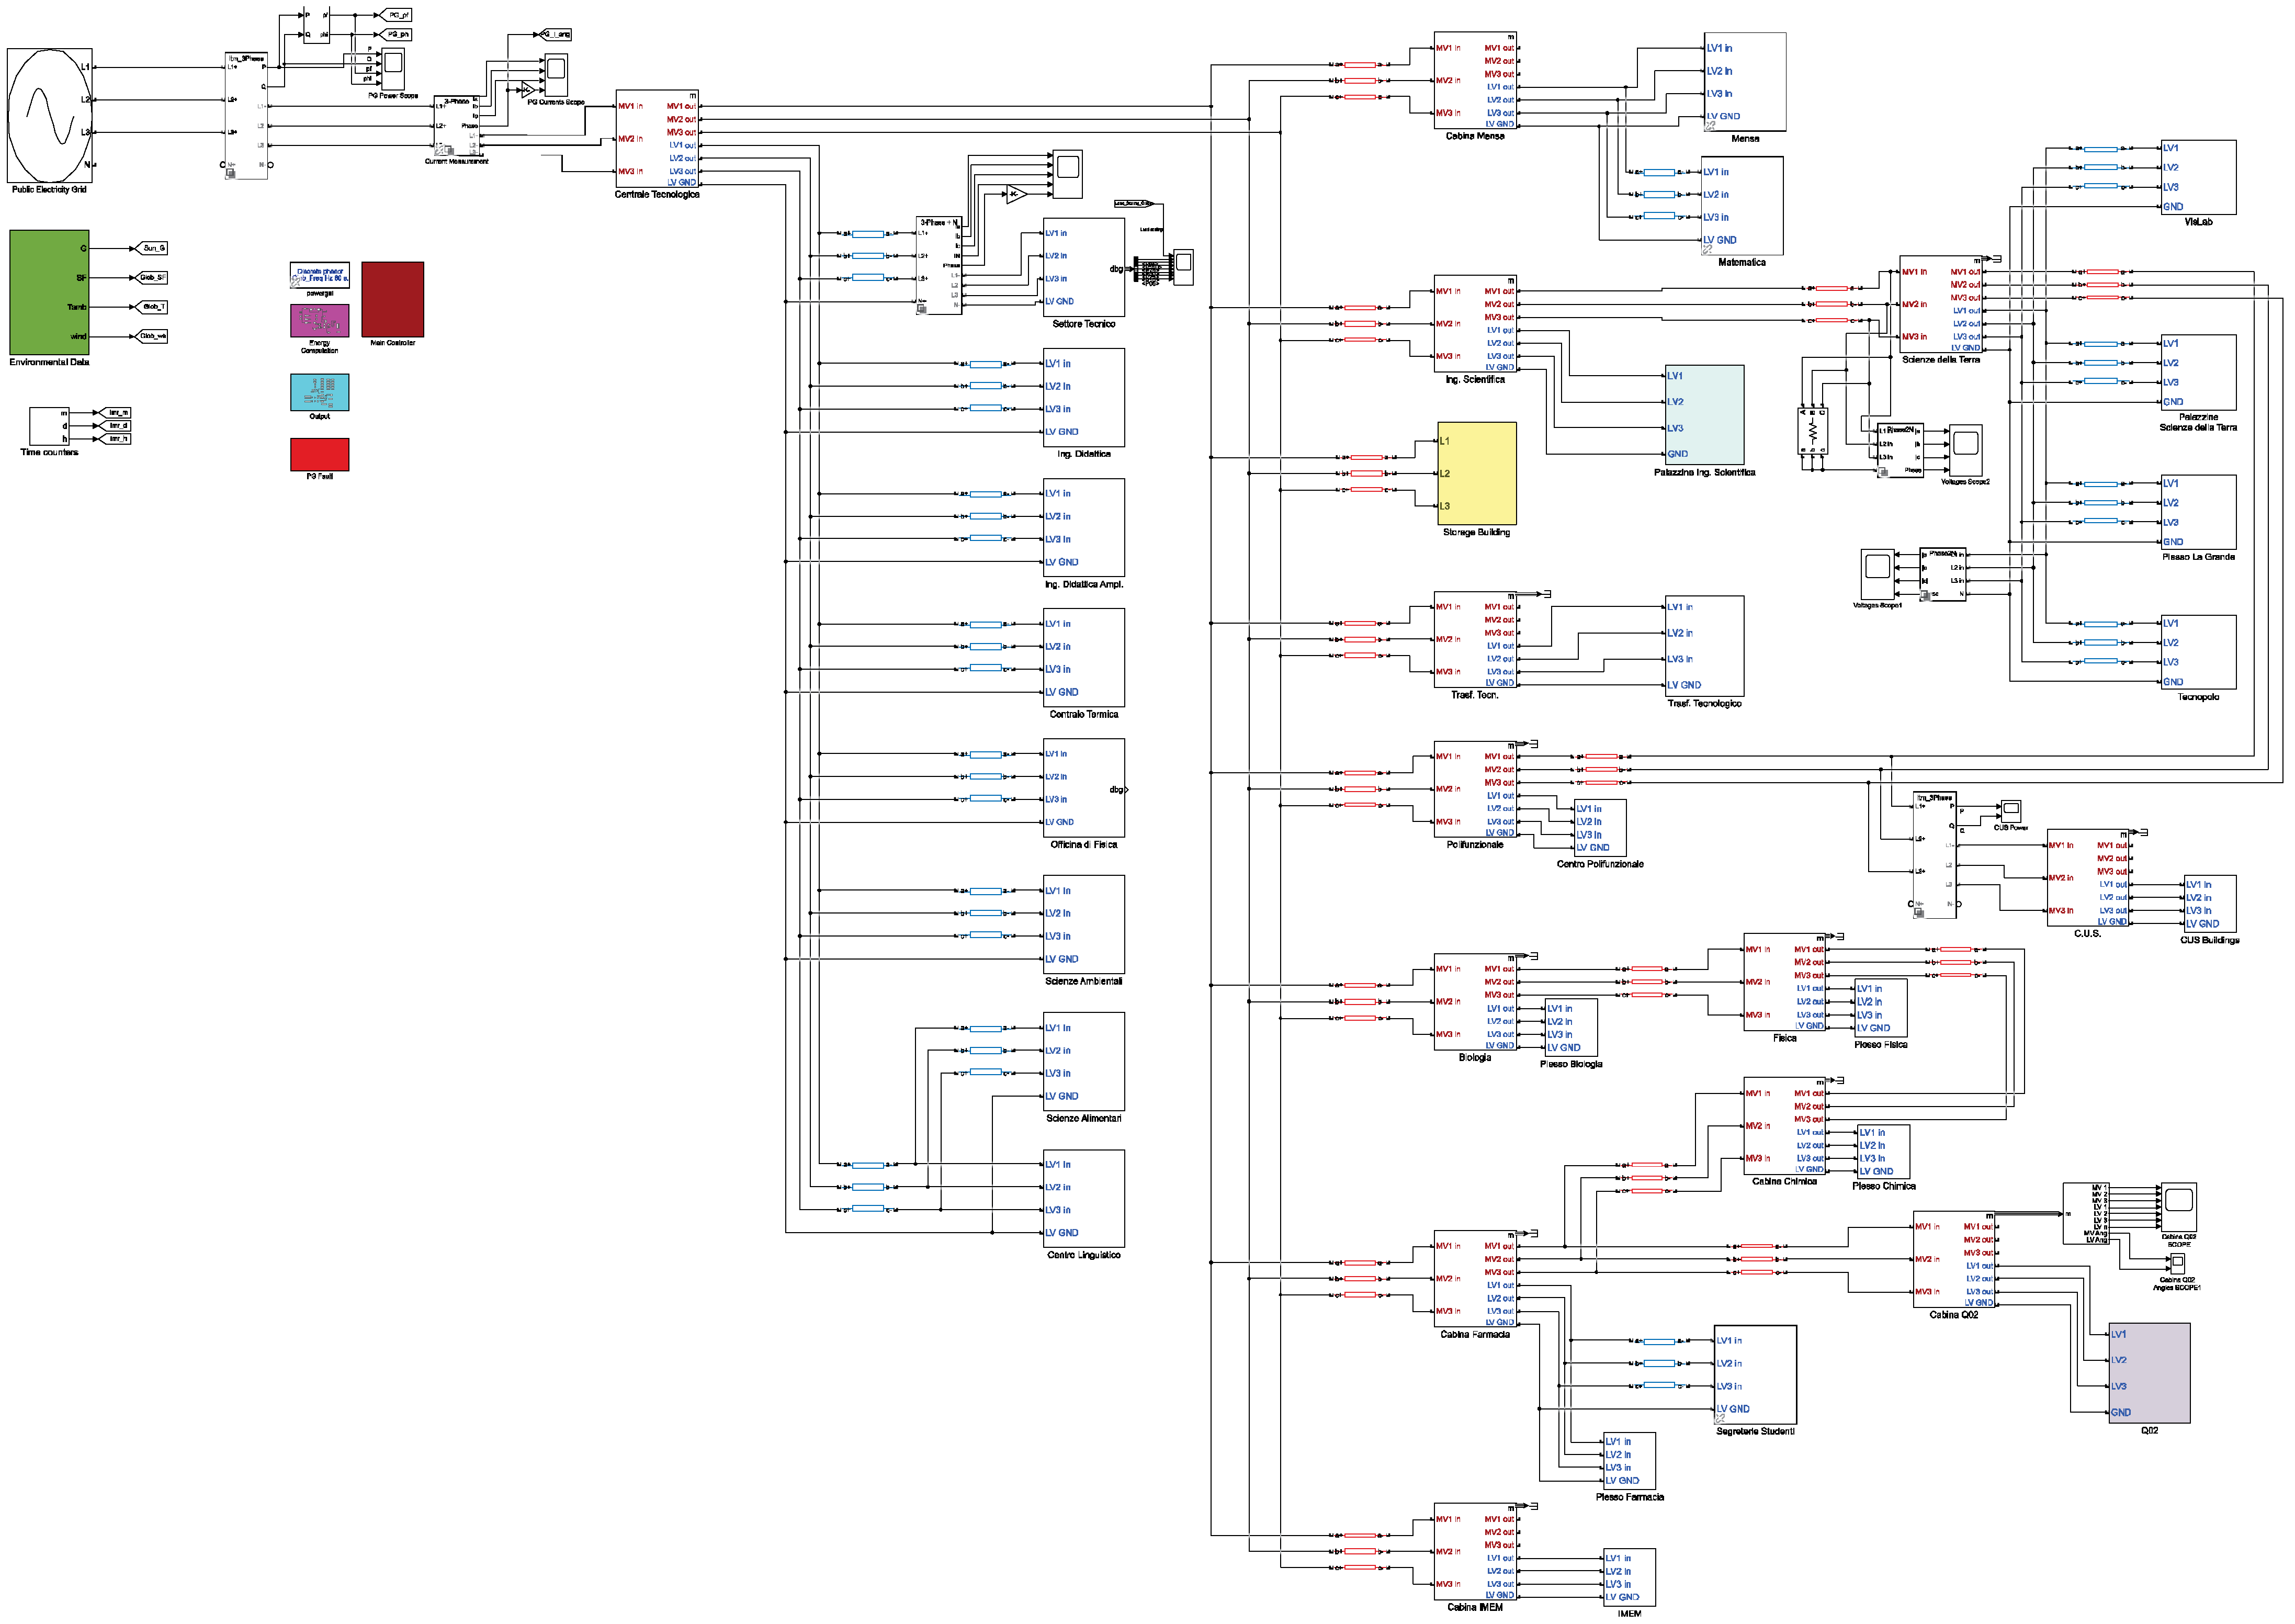
Figure 2 offers a global view of the model in the Simulink graphical environment.
3. The Campus Micro-Grid Model
In this section we describe the MATLAB/Simulink models of the components of the MG. Loads include generic campus buildings, a detailed model of a building heating/cooling system, and outdoor lighting loads. Loads are modeled as current sinks, with active power absorption profiles described in the next section; reactive power absorption is considered based on a constant load angle that characterizes the individual loads. Generation is currently limited to PV, and storage to battery banks; a battery-like model is also used for the EV charging stations.
3.1. Generic Building Modeling
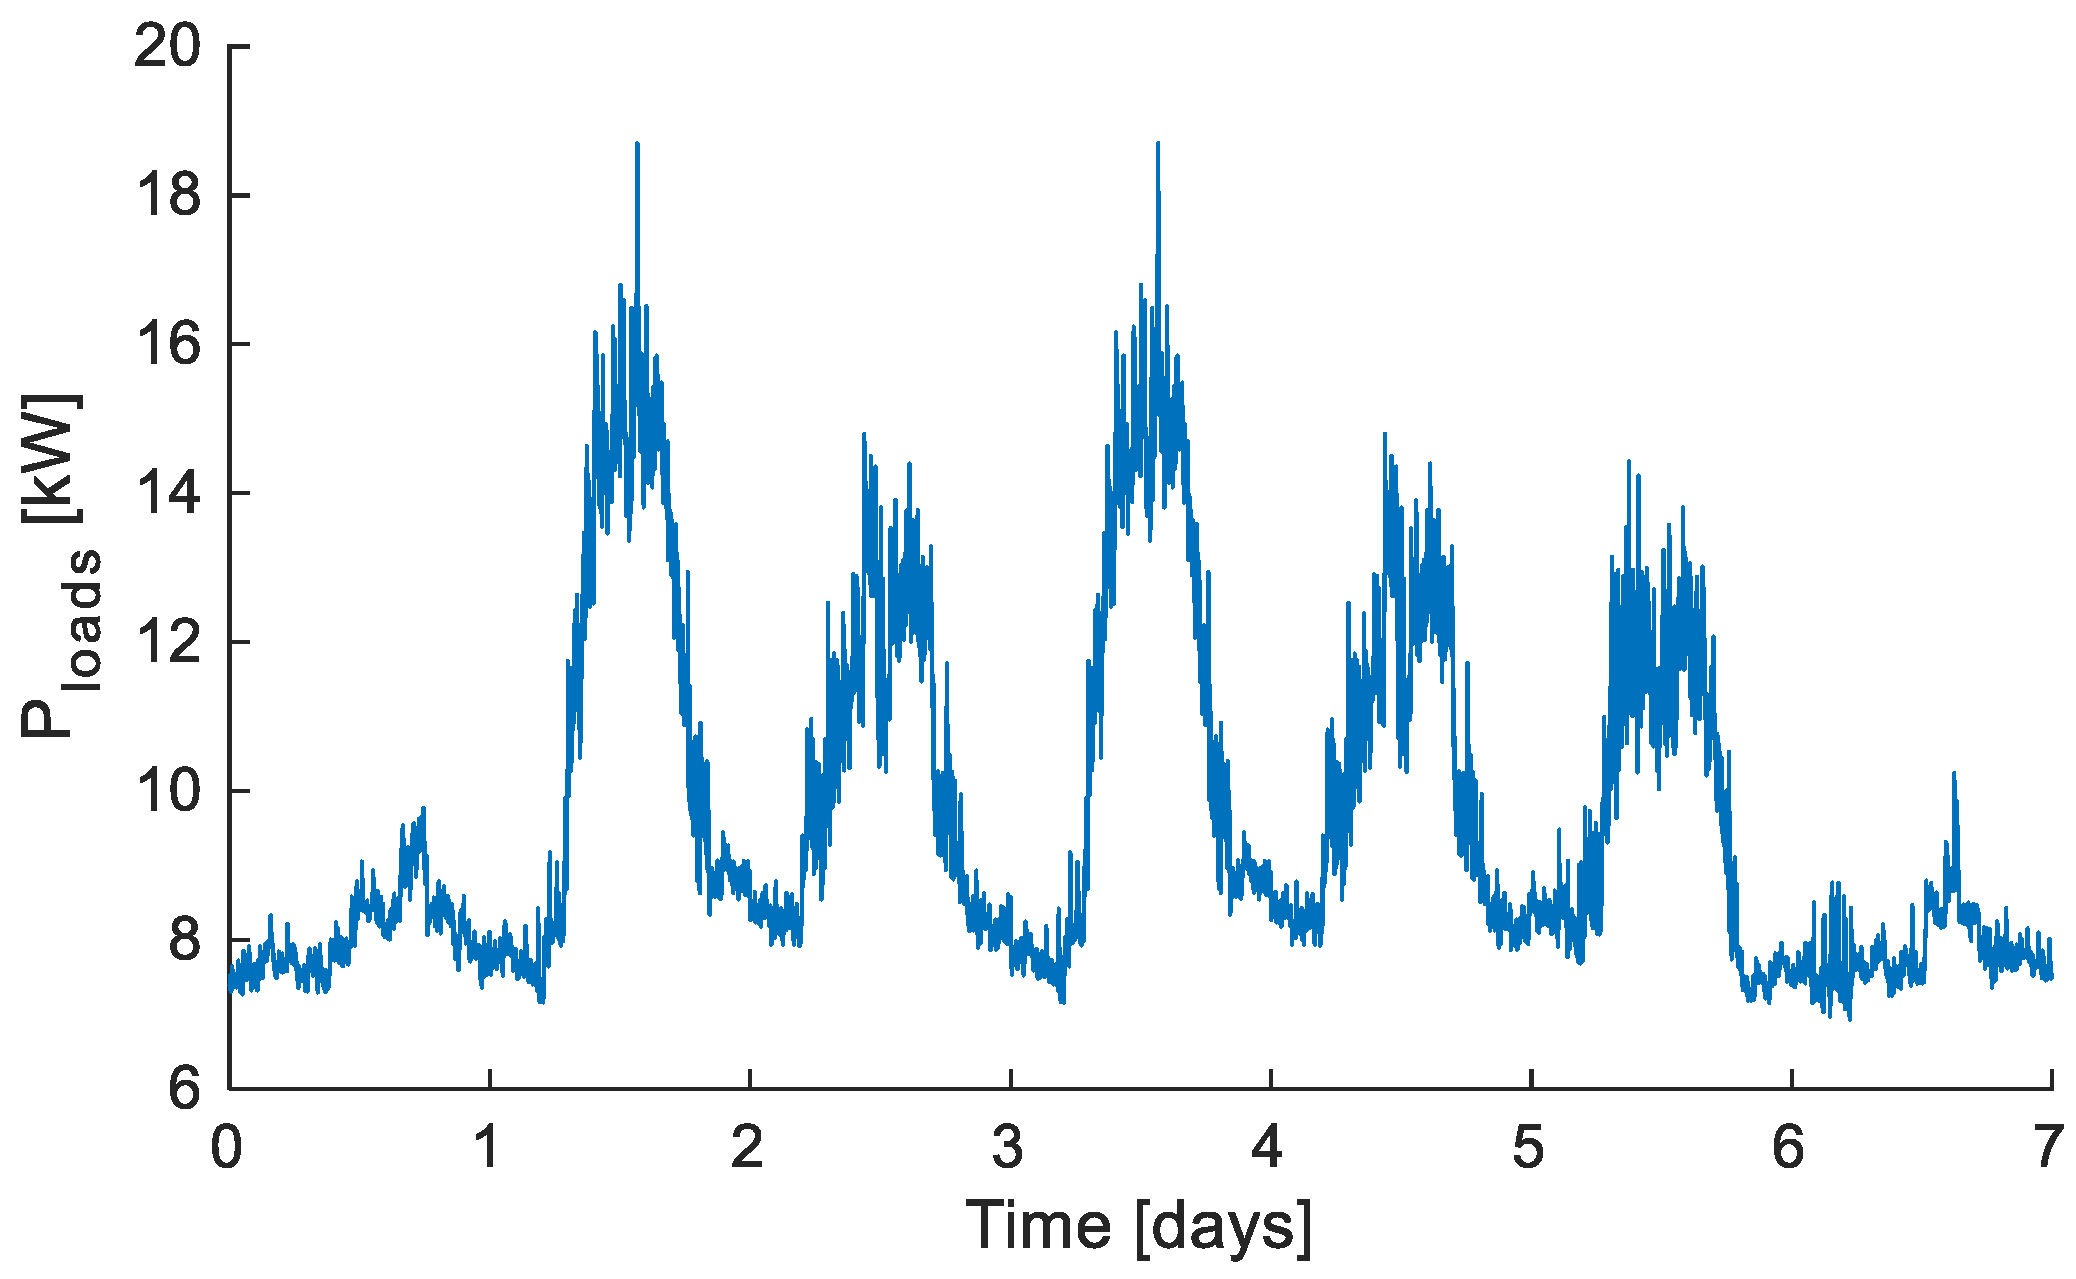
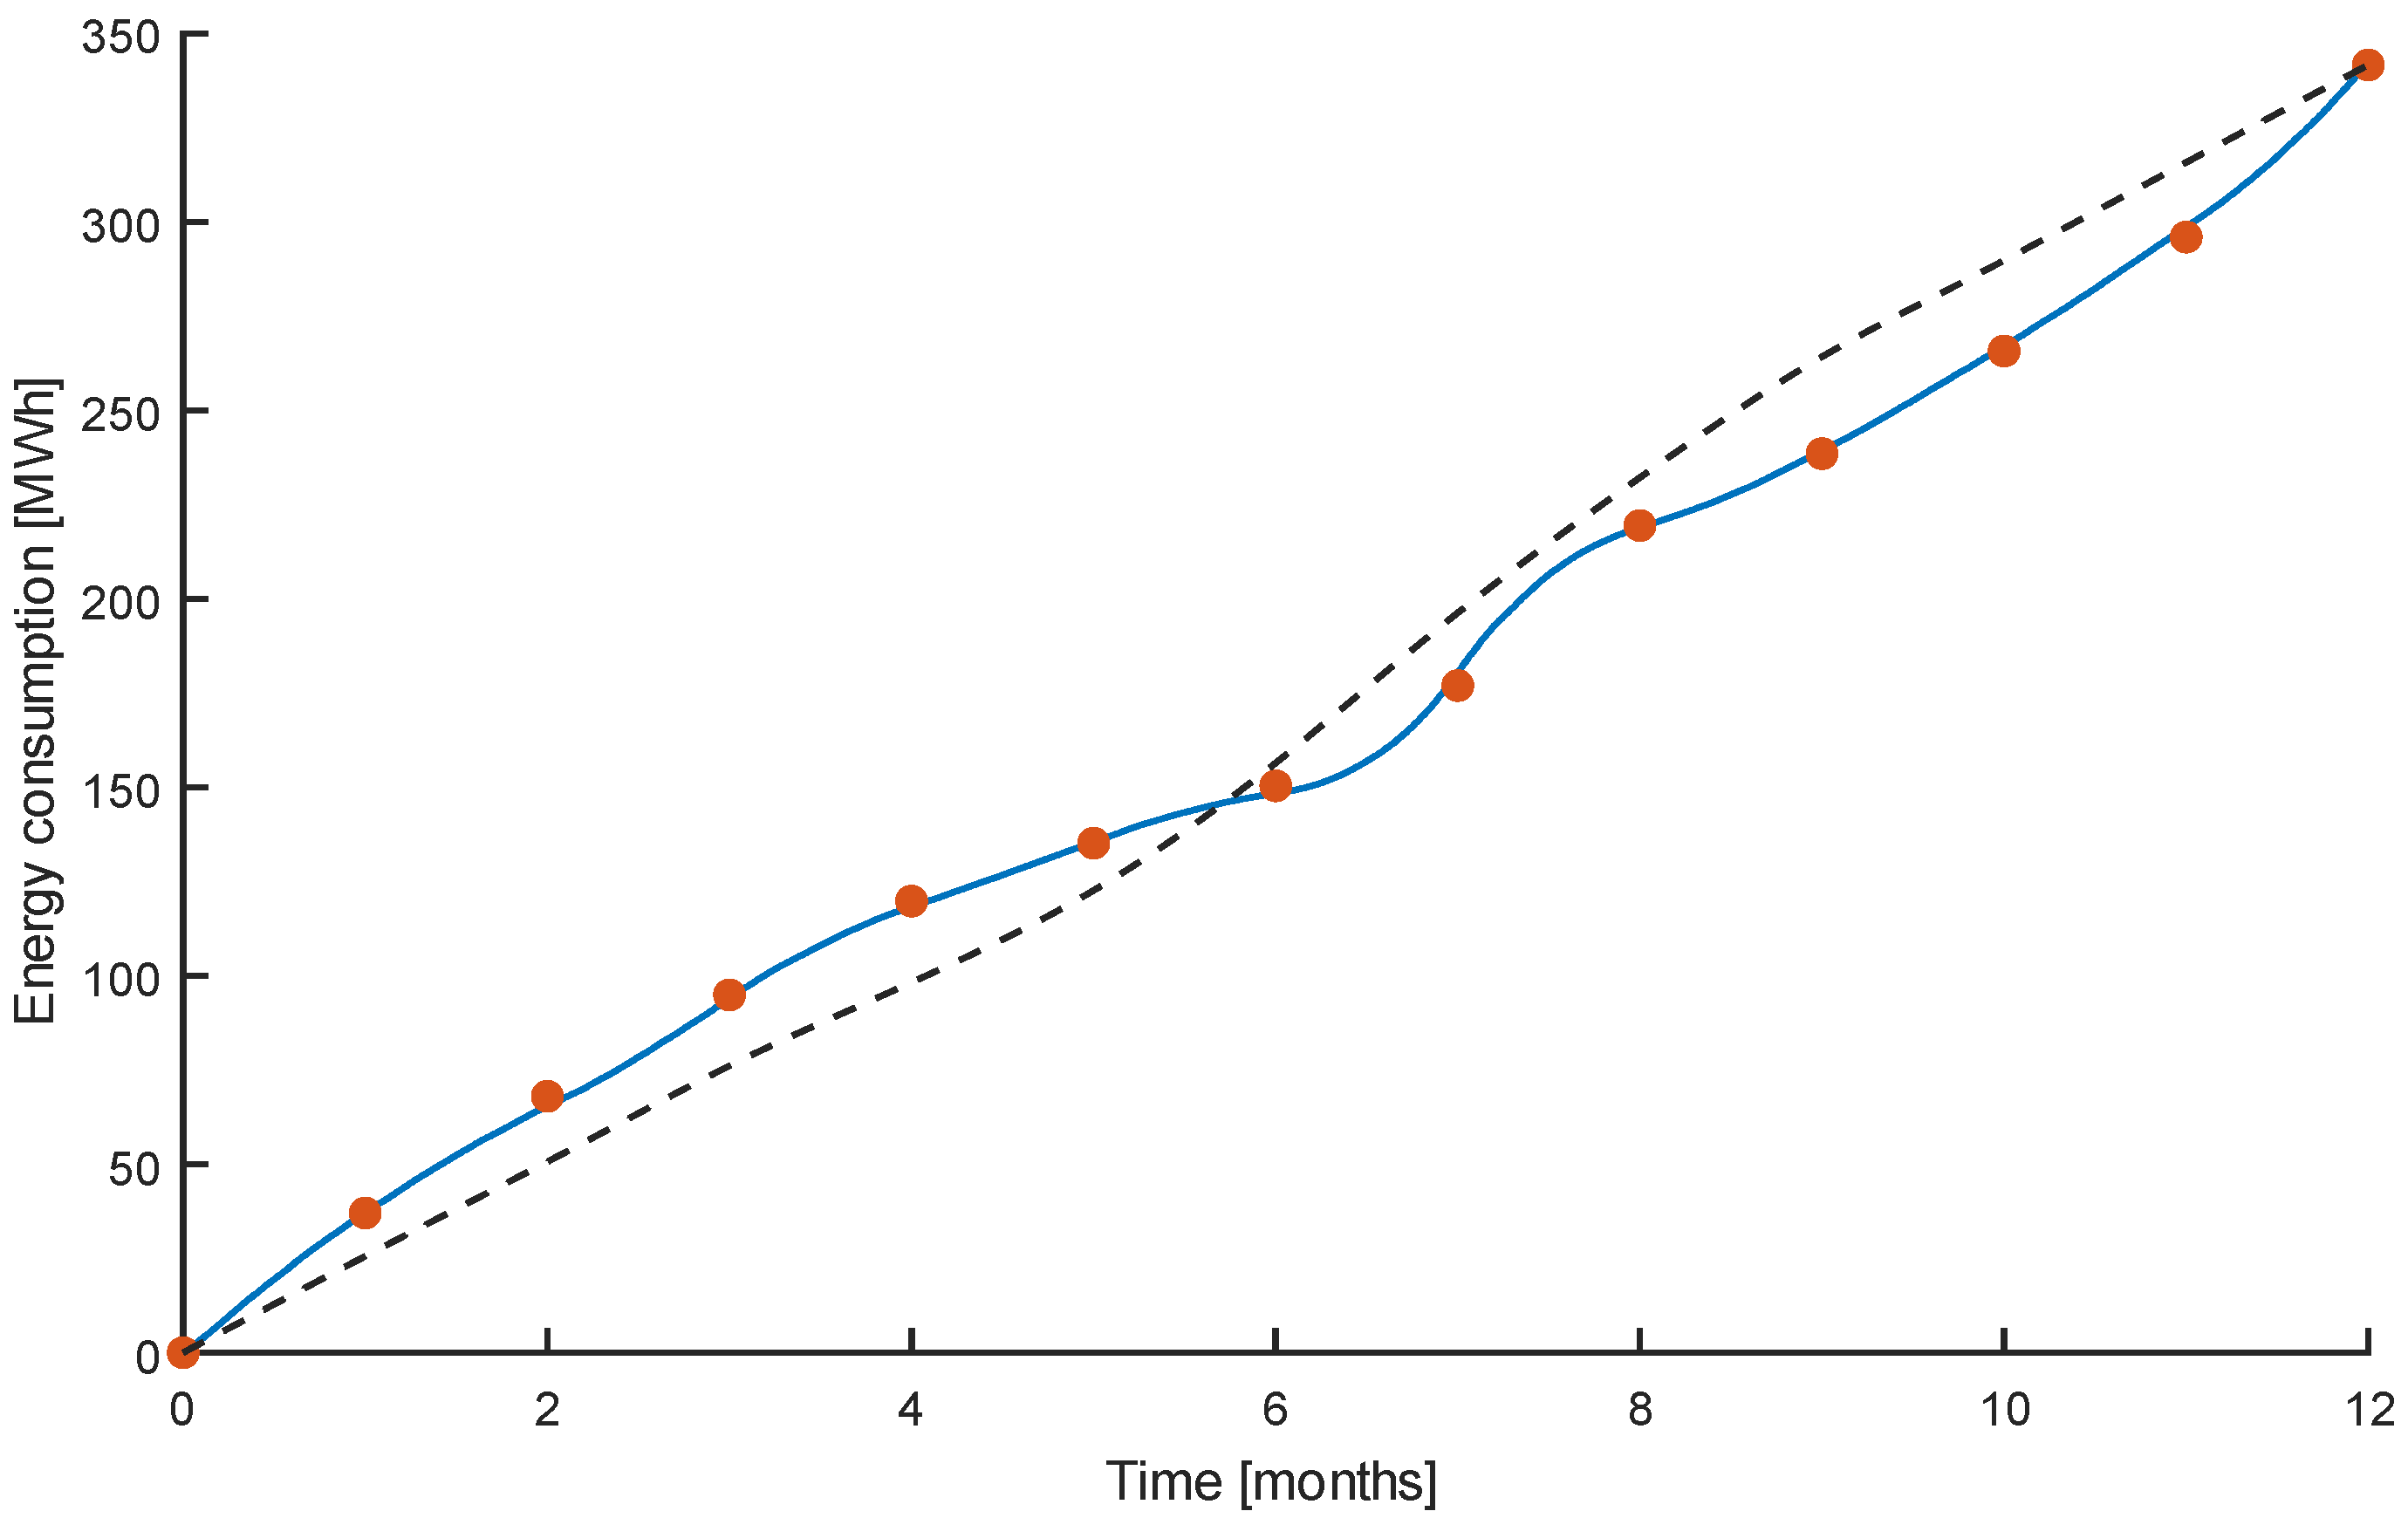
The modeling of loads (buildings) is based on weekly power consumption profiles. Since the planned smart metering network is still largely undeployed, we could only rely on data obtained from legacy meters recording the monthly consumption of selected buildings, as well as data on the whole UPSC consumption. Thus, to build our load profiles, we scaled the available measured profiles according to the individual building area and attendance. In particular, we measured the weekly consumption profile of a representative building in (1) winter (average of a few weeks from December to February), (2) spring (end of April) (
Figure 3), and (3) early summer (mid-June). These sample profiles were then scaled according to the monthly energy consumption of the whole campus (
Figure 4);
Figure 5 shows the yearly profile for the sample building, resulting from the measured data of
Figure 3, scaled on the basis of the overall consumption of
Figure 4.
This approach can be seen as a limitation of the current status of our model, but it is worth pointing out that (i) the paper is chiefly about the modeling framework, not the quantitative analysis of the campus energy behavior; as more and more data will be made available by the deployment of a metering network, they will be easily and seamlessly inserted into the existing model; (ii) in our specific case—and unlike the situation in other countries—the time signatures of operation, hence of power consumption, are rather similar for teaching, research, and administration facilities, so that the approach we used is not believed to result in gross distortions to the general picture.
The same approach has been applied to other sample buildings in order to obtain more realistic power profiles. The imprint of the typical power profile has been obtained by performing a 1-week-long manual measurement campaign on different UPSC facilities, then the profile has been scaled over the entire year. In
Figure 6, we show a couple of examples regarding (a) a teaching facility hosting large classrooms and (b) a building hosting both offices and small teaching classrooms.
For some facilities, additional data about monthly energy consumption are available. In this case, we generated a fictitious daily power consumption profile and we scaled it over the whole year in order to match, month by month, the measured energy consumption.
Here, we illustrate an example considering the UPSC sport facility.
Figure 7 shows the monthly measured energy consumption, while
Figure 8 gives the yearly power profile based on the data of
Figure 7 and the assumed fictitious daily consumption profile. Finally, in
Figure 9 we compare the yearly energy consumption profile obtained integrating the power dataset of
Figure 8 (blue solid line) with the measured one based on the data of
Figure 7 (dots). The dashed line in
Figure 9 shows, for the sake of comparison, the energy consumption profile of the same facility obtained by downscaling the whole UPSC consumption profile, as was done and described above for the buildings where no measured data are available. The substantial agreement between the solid and the dashed lines confirms that our scaling approach to produce fictitious data wherever actual measured data are not available does not lead to gross distortions of the picture.
3.2. Building Heating/Cooling System Modeling
The integration of thermal and electrical energy aspects in a single model has not received much attention in the literature. This will likely have to change due to the increasing diffusion of heat pump systems, often fed by rooftop PV. This subsection shows an example of a combined electrical/thermal model. The UPSC building we modeled (Vislab in
Figure 1) is one of the most recently built on the campus. Unlike the others, it is equipped with its own heat pump heating/cooling system.
Once more, detailed experimental data will be available only after the deployment of a metering network that is still in the planning phase. The actual data will help the refinement and tuning of the model described in this subsection.
In order to reduce the model complexity, we lumped all the rooms into a single
Building Air Thermal Mass; likewise, roof, walls, and windows are each represented by a single thermal mass.
Figure 10 shows the Simulink implementation: the thermal masses describing roof, walls, and windows are coupled on one side with the indoor air thermal mass, on the other with the external atmosphere. Heat conduction and convection coefficients are input parameters regulating the heat flow on either side. The outdoor air temperature comes from a measured dataset.
The heating or cooling action performed by the fan coil units is modeled by means of a controlled
Thermal Power Source that transfers heat from the convector coil to the indoor air mass according to the control signal
Fan Coil Thermal Power. The convector coil is a pipe wherein flows the thermal fluid coming from the heat pump, with a thermal mass representing its thermal capacitance. The
Fan Coil Thermal Power is computed on the basis of the fan running state (on/off, speed) and the heat exchange efficiency of the fan coil. The fan is activated by a hysteresis thermostat featuring four different temperature set-points, as shown in
Table 2, depending on the season (summer cooling, winter heating, or midseason off-state) and working hours, (
normal operation during working hours and days,
quiet operation otherwise: the
quiet mode is meant as a compromise between energy saving and the need to keep temperature fluctuations within acceptable bounds).
When the fan coil is active, its speed depends on the difference between the room temperature and the thermostat set-point. The fan state (on/off, speed) is combined with the fan heat exchange efficiency characteristics to yield the Fan Coil Thermal Power.
A detailed description of the algorithm governing the operation of the fan coil unit model is beyond the scope of this work and will be the subject of a specific publication.
We coupled the building subsystem model (
Figure 10) with the heat pump unit subsystem model (
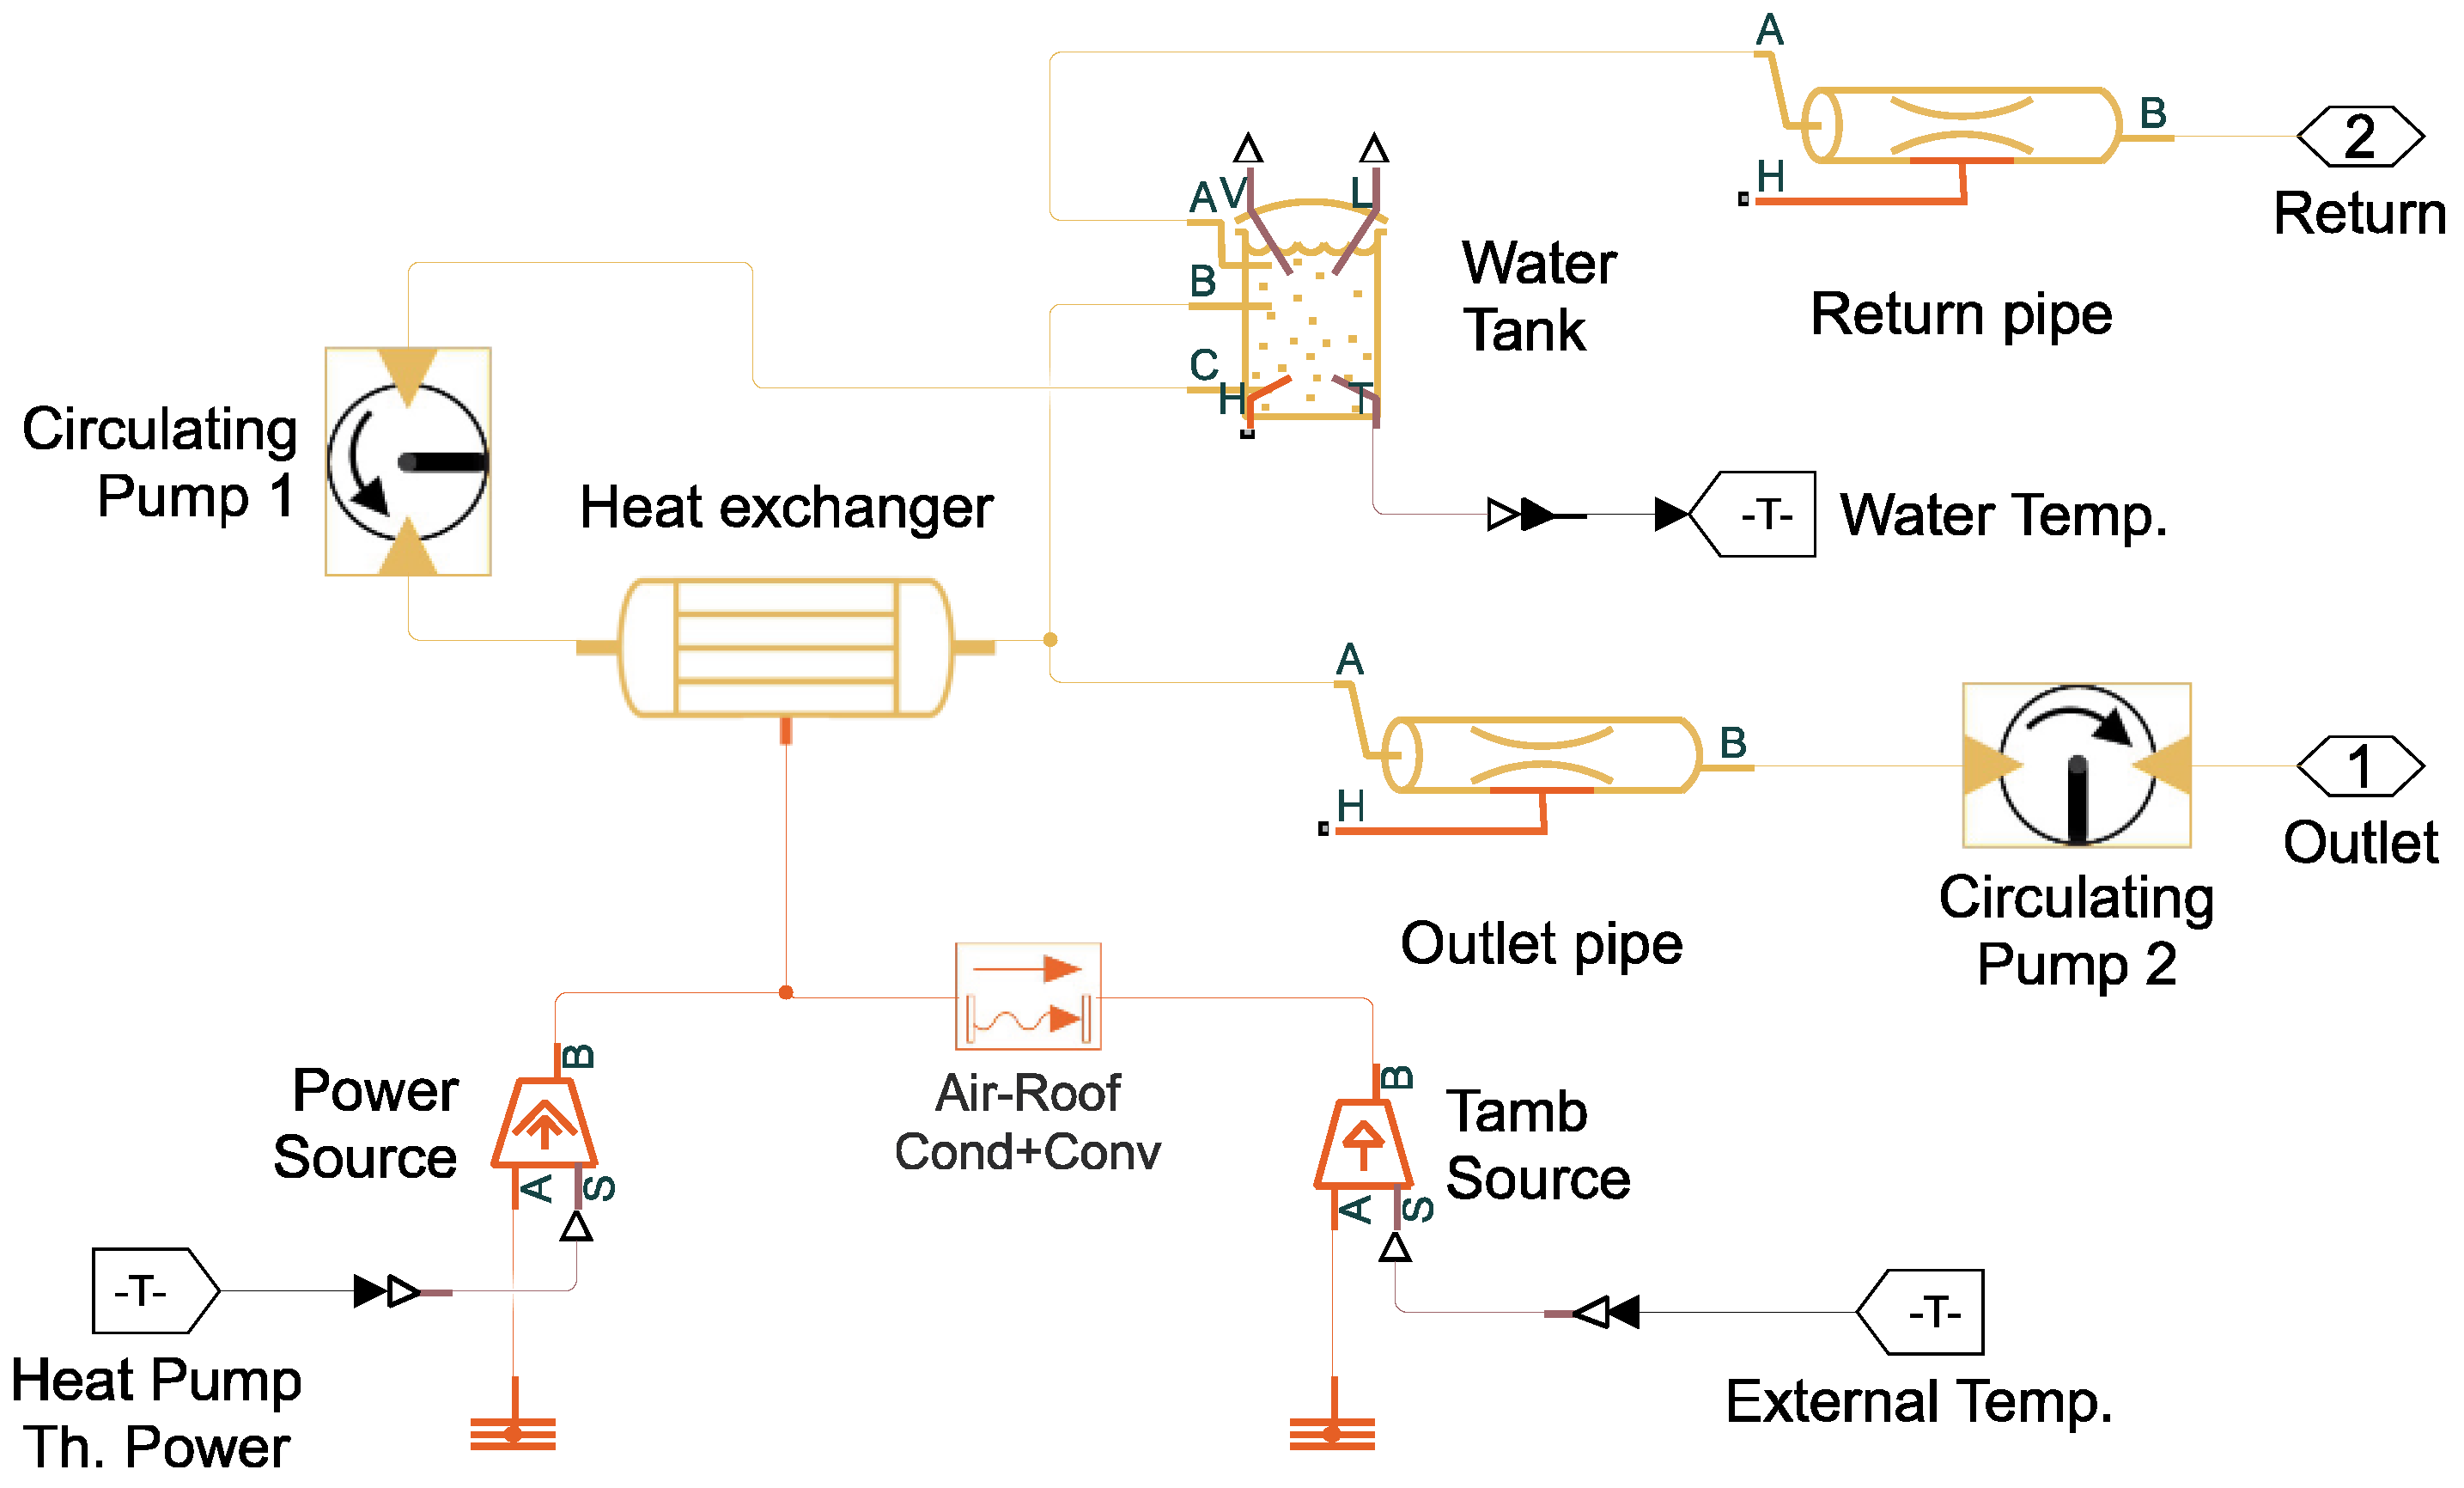
Figure 11), which features
a pair of pipes implementing a lumped model of the thermal liquid circuit;
a water tank, which is the thermal storage of the system;
two recirculation pumps;
a heat exchanger, whereby the thermal power generated by the heat pump is transferred to the liquid coolant;
a controlled thermal power source connected to the heat exchanger, representing the thermal pump heating action;
a temperature source for outdoor temperature reference.
The implementation of
Figure 11 consists of two thermal liquid circuits, each with its own
Circulating Pump. The
Circulating Pump 1 pumps water from the tank through a heat exchanger where the water is heated up or cooled down by the heat pump (
Power Source), before flowing back into the tank. The heat exchanger is also coupled with the ambient temperature (
Tamb Source) to emulate the system thermal losses. The second circuit, driven by the
Circulating Pump 2, pumps water from the tank through the pipeline that supplies the fan coil unit. The amount of thermal power provided to the water by the heat pump is proportional to the difference between the water temperature set-point and the actual value of the temperature of the liquid in the tank. The control logic uses different temperature set-point ranges depending on the time of the day and on the working days’ calendar.
The time dependence of the electric power consumption of the heating/cooling system, displayed in
Figure 12 for a sample week in January, shows the daily early morning peaks due to the heating pump restoring the liquid to the normal conditions after night-time rest, and the intra-day oscillations due to the on–off and step speed regulation of the fan coil units. The total electric energy consumption for the air conditioning is about 12 MWh during the first part of the year (heating mode), 3 MWh during the summer period (cooling mode), and 8 MWh during the final part of the year (heating mode), with a global annual consumption of about 23 MWh.
3.3. Outdoor Lighting Modeling
Outdoor lighting is generally estimated to contribute about 15% of the whole urban electric energy consumption [
18]. We modeled two outdoor lighting subsystems, one for street lighting, one for the areas surrounding the campus buildings.
The street lighting subsystem allows for simple calculations starting from a given set of parameters:
illumination level in lux (luminous flux per unit area);
coefficient of utilization the value of which (close to 0.3) depends on the lamp fixture (fixture type, mounting height, length of the mast arm, etc.);
maintenance factor (generally close to 0.9);
width of the roadway , in meters [m];
distance between the luminaries , in meters [m];
length of the street , in meters [m].
It is possible to obtain the average light radiation flux
in Lumen, applying the following formula [
19]:
then, we estimate the required lamp power in Watt by using the empirical formula (obtained from interpolation of data [
19] coming from various lamp sizes):
Finally, we compute the number of lamps (
) required to cover the entire street length, and the total nominal power (
) of the street lighting subsystem:
This nominal (maximum) power is used as a reference value for a scheduling algorithm that accounts for both the natural light level and the time of the day or night, turning lights on when natural light falls below the set threshold (with an appropriate hysteresis value). The illumination level is then regulated by the daily dimming profile in
Figure 13. For better physical emulation of the electrical behavior, we estimate the reactive power absorbed by the lamp drivers, considering that the power factor is close to one when the dimming level is 100% and it decreases to 0.8 ÷ 0.85 for the lowest dimming levels.
As for the illumination of the outdoor areas surrounding the campus buildings, the mask parameters in input to the block are the following:
nominal power of each lighting element (lamp);
equivalent perimeter of the building (considering only the areas actually illuminated);
type of lamp (LED or halogen).
The total lamp power is estimated starting from data of a specific installation around a reference building. We use the same scheduling and dimming profile as for street lighting.
The UPSC grid model features five street lighting subsystems (four main streets plus one for parking areas) for a total nominal power of about 11 kW. For the building external lighting, we instantiate a subsystem for each building, with nominal powers ranging from <1 kW to >8 kW, depending on the length of the illuminated perimeter; the total nominal power is 56 kW.
3.4. Photovoltaic Plant Modeling
The current installed PV power capacity of the UPSC is 805 kW
p; details on the various installations can be found in [
13].
Figure 14 shows the block modeling PV plants, with modules arranged in series (N
s) and parallel (N
p); the Maximum Power Point Tracking (MPPT) controller operates with perturb and observe. The PV cells are described by a temperature-dependent 1-diode equation; the cell temperature is computed by a static thermal model, the inputs of which are the air temperature and wind speed profiles. The MPPT controller observes the voltage set-point and current output of the two most recent simulation time steps and computes the optimum operating point on a virtual current-voltage characteristics. As shown in
Figure 14, the output power calculated solving the module and controller equations (
P_out) is injected into the grid (at nodes L1, L2, L3) by three current generators, each with a complex set-point given by the complex power divided by the grid voltage. The active and reactive components of the injected power are computed by the
PQ controller subsystem. The
Q_set input is the reactive power exchanged with the NPG. The controller computes the value of the output reactive power
Q that minimizes
Q_set. The maximum
Q that can be injected (or absorbed) is defined by cosφ = 0.9 (typical for PV inverters). The
P output is computed from the DC power (
P_out) and the reactive power.
If the MG has to operate in island mode, the PV production and the battery storage must be sized in such a way as to keep service disruption and load shedding within acceptable limits. In a scenario like this, the PV plant production may exceed the load demand in the sunniest months of the year, in which case, if the BESS is fully charged, the PV production has to be curtailed. For this reason, the MPPT controller features a derating mode, activated by a central supervision unit. When in derating mode, the controller shifts the operating point from the MPP according to the derating value, thus matching the generated power with the load demand.
The solar irradiance data used to compute the PV energy production, and the temperature and wind speed data, are taken from the ARPAE database [
20] (see [
13] for additional details).
3.5. BESS Modeling
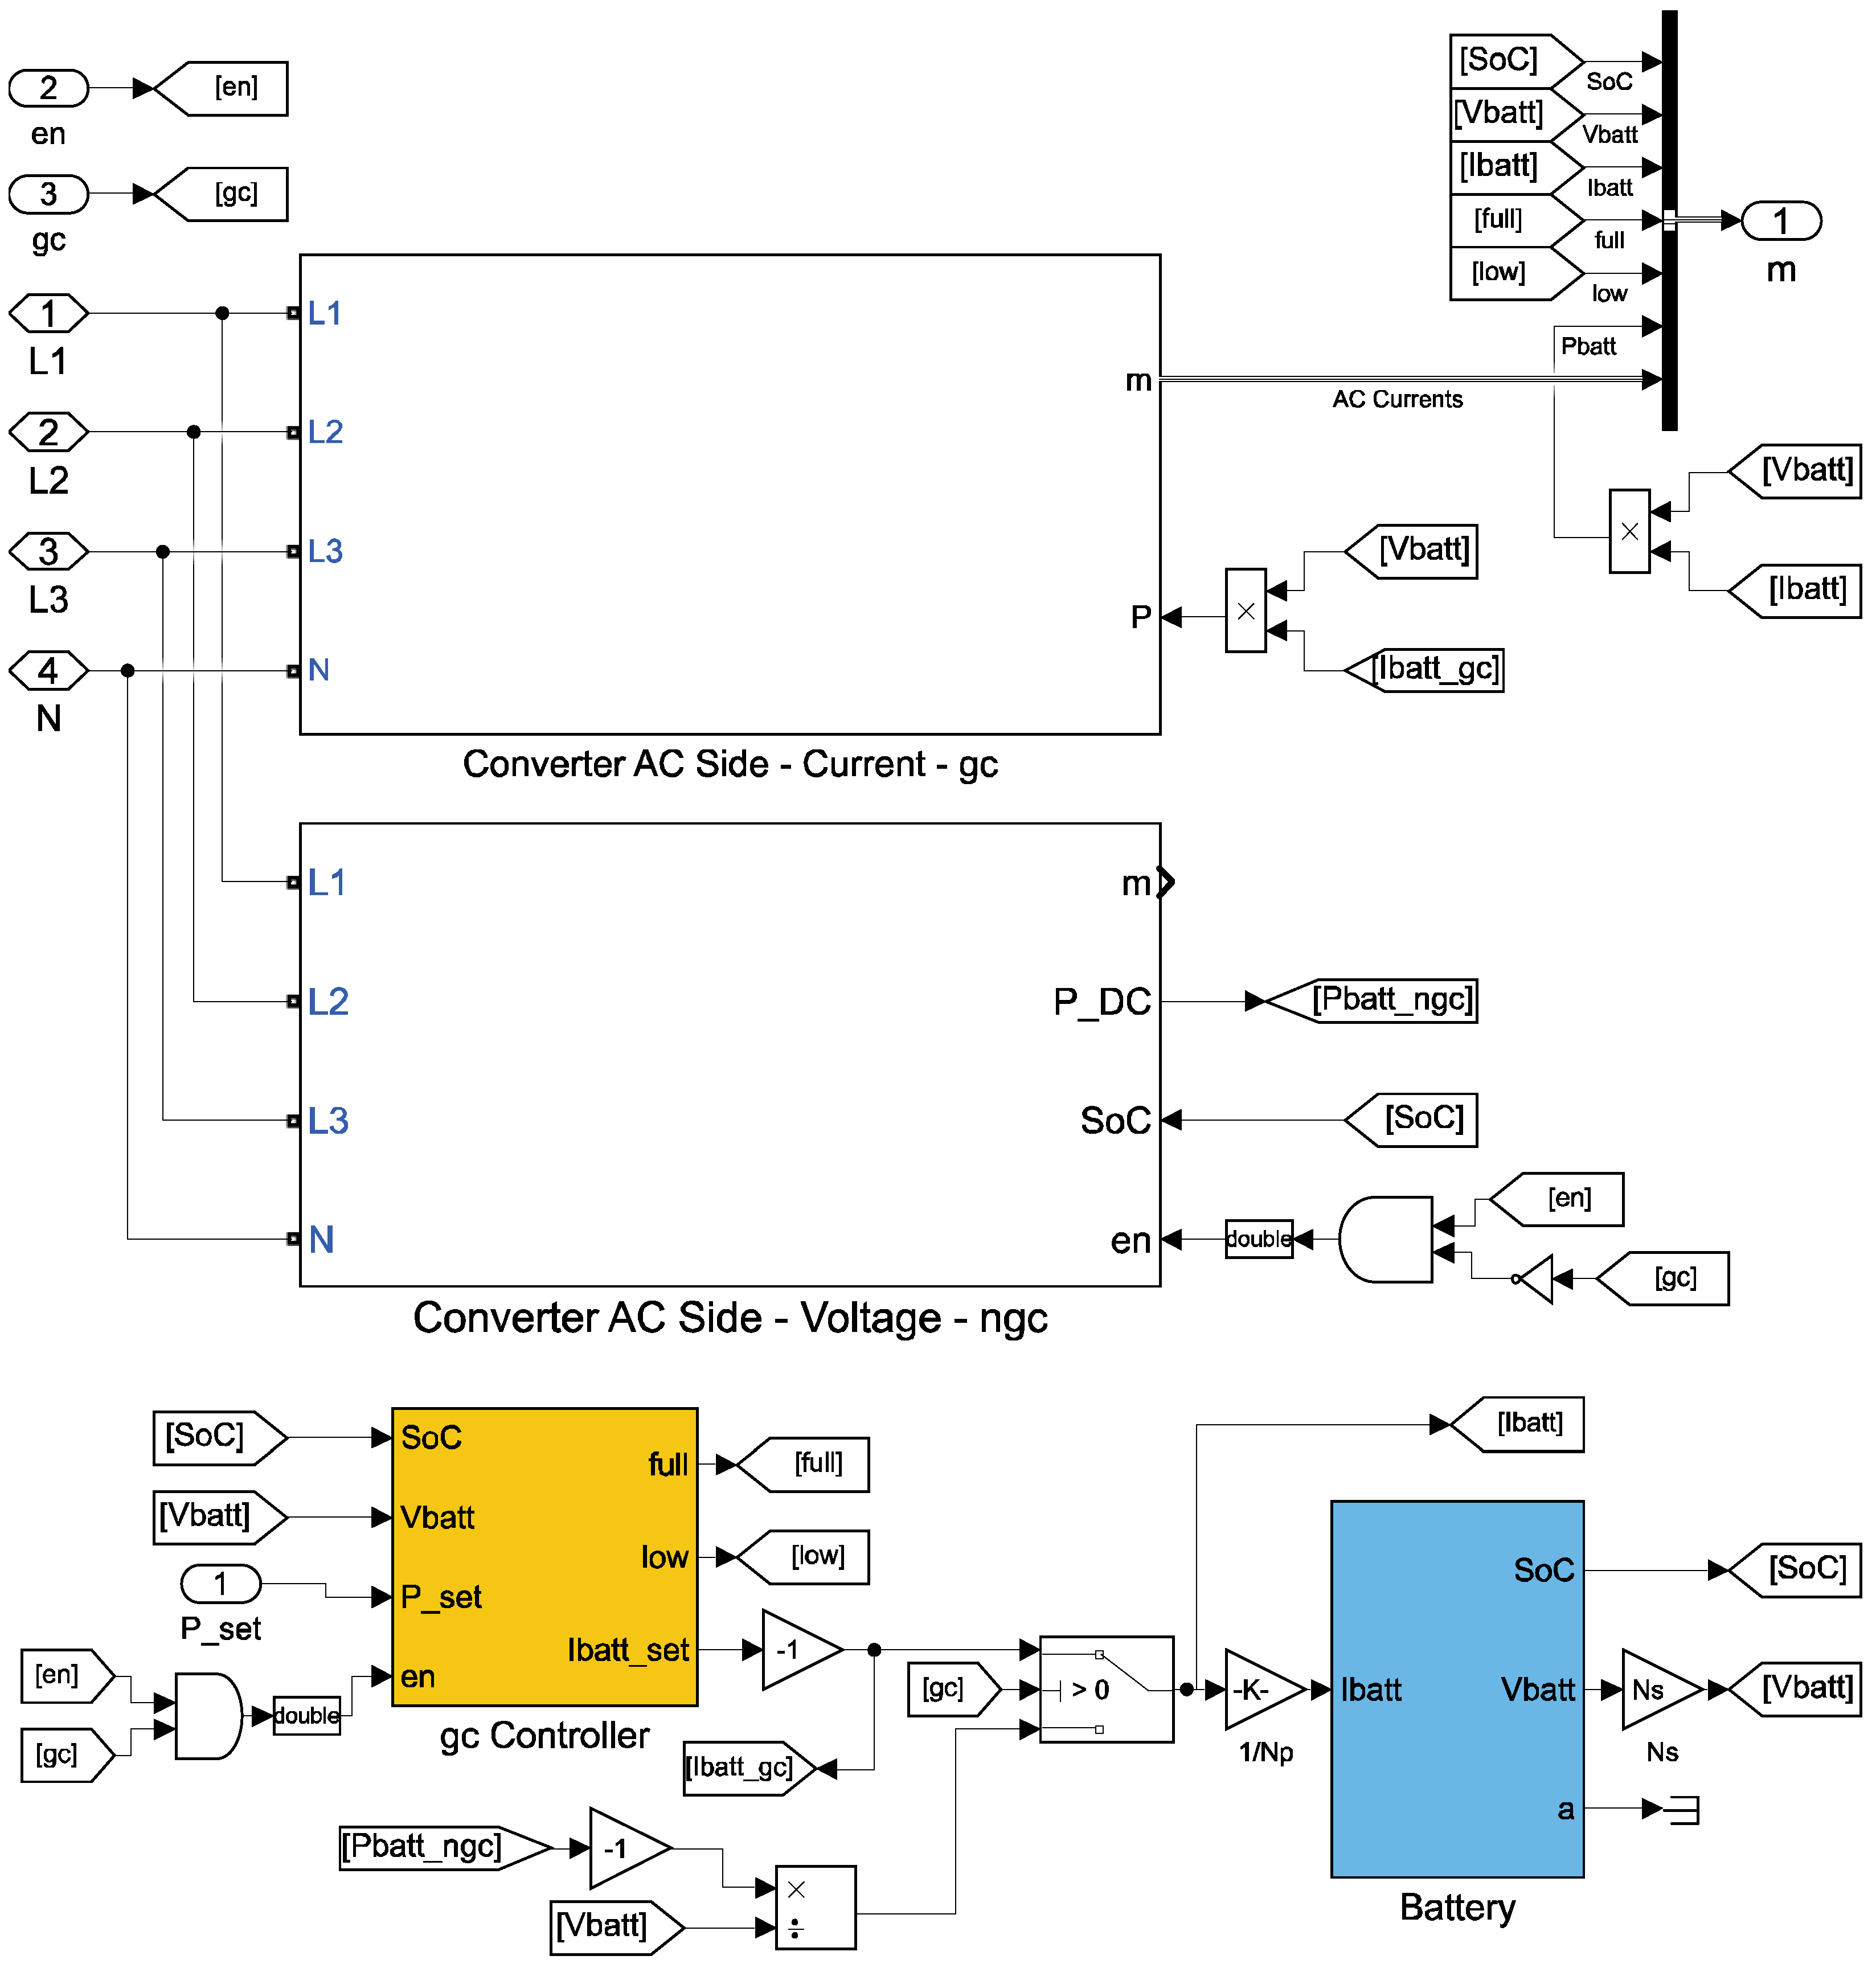
Figure 15 shows the BESS model, made of four sub-systems: (1) the interface with the NPG via the PCC (
Converter AC Side-gc) for normal grid-connected operation; (2) the interface with the UPSC MG for islanded operation (
Converter AC Side-ngc); (3) the charge/discharge controller (
gc Controller); (4) the
Battery block. Systems (3) and (4) are described by mathematical blocks and equations, while (1) and (2) are high-level descriptions of DC/AC and DC/AC converters.
When in grid-connected mode, three current generators provide the interface with the national power gird (much like the PV interface of
Figure 14). Power (injected or absorbed) is computed by the
gc Controller. Conversion efficiencies (assumed constant for simplicity) are considered in the model, and can be set by the user based on the specific equipment used. The integral
gc Controller determines the set-point for the battery current, which, multiplied by output voltage, yields the power set-point for the AC/DC or DC/AC interface converter (plus/minus the conversion losses). The
gc Controller is coordinated by A central control unit provides the
gc Controller with the power set-point (
P_set). The power output (positive during discharge, negative in the charging phase) and the converter and battery maximum ratings determine the charge/discharge rates. The battery output saturates when the demand exceeds the maximum rated output power. The central control unit sets the
P_set signal so as to minimize the energy bought from the NPG by storing the PV energy excess in the BESS.
When the MG disconnects from the NPG (e.g., during faults) and works in island mode, the model activates the
Converter AC Side-ngc interface shown in
Figure 16, with its three-phase amplitude-controlled AC voltage source. The
Vadjust subsystem computes the output voltage amplitude depending on the instantaneous state-of-charge (SoC): the nominal output voltage corresponds with 50% SoC, while the voltage is increased or decreased relative to this nominal value when the SoC goes above or below 50%, respectively: the SoCs of different BESSs are therefore automatically equalized. The voltage/SoC slope is constant as long as the SoC is in the 22–90% range, but is steeper for SoC < 22% and SoC > 90% to prevent overcharge and over-discharge. In islanded mode, when the SoC has reached the full value (90%), the central control unit sends a derating value to the PV MPPT controllers, based on the SoC and its slope.
The battery cell model (
Figure 17) is based on that of Tremblay-Dessaint [
21]. The SoC is calculated by integrating the cell current over time; the SoC in turn determines the output voltage based on an empirical equation featuring parameters extracted from the discharge curve: the output voltage at fully-charged cell (
); the output voltage and depth of discharge (DoD) at the end of the exponential zone (
,
); the output voltage and DoD at the end of the nominal zone (
,
); the model parameters also include the internal equivalent series resistance and the battery dynamic response time (measurements indicate a common value around 30 s [
21]), used to compute a filtered current time profile (
i*) simulating the dynamic behavior. Reactive power compensation is modeled in the same way as in the PV subsystem.
3.6. EV Charging Station Modeling
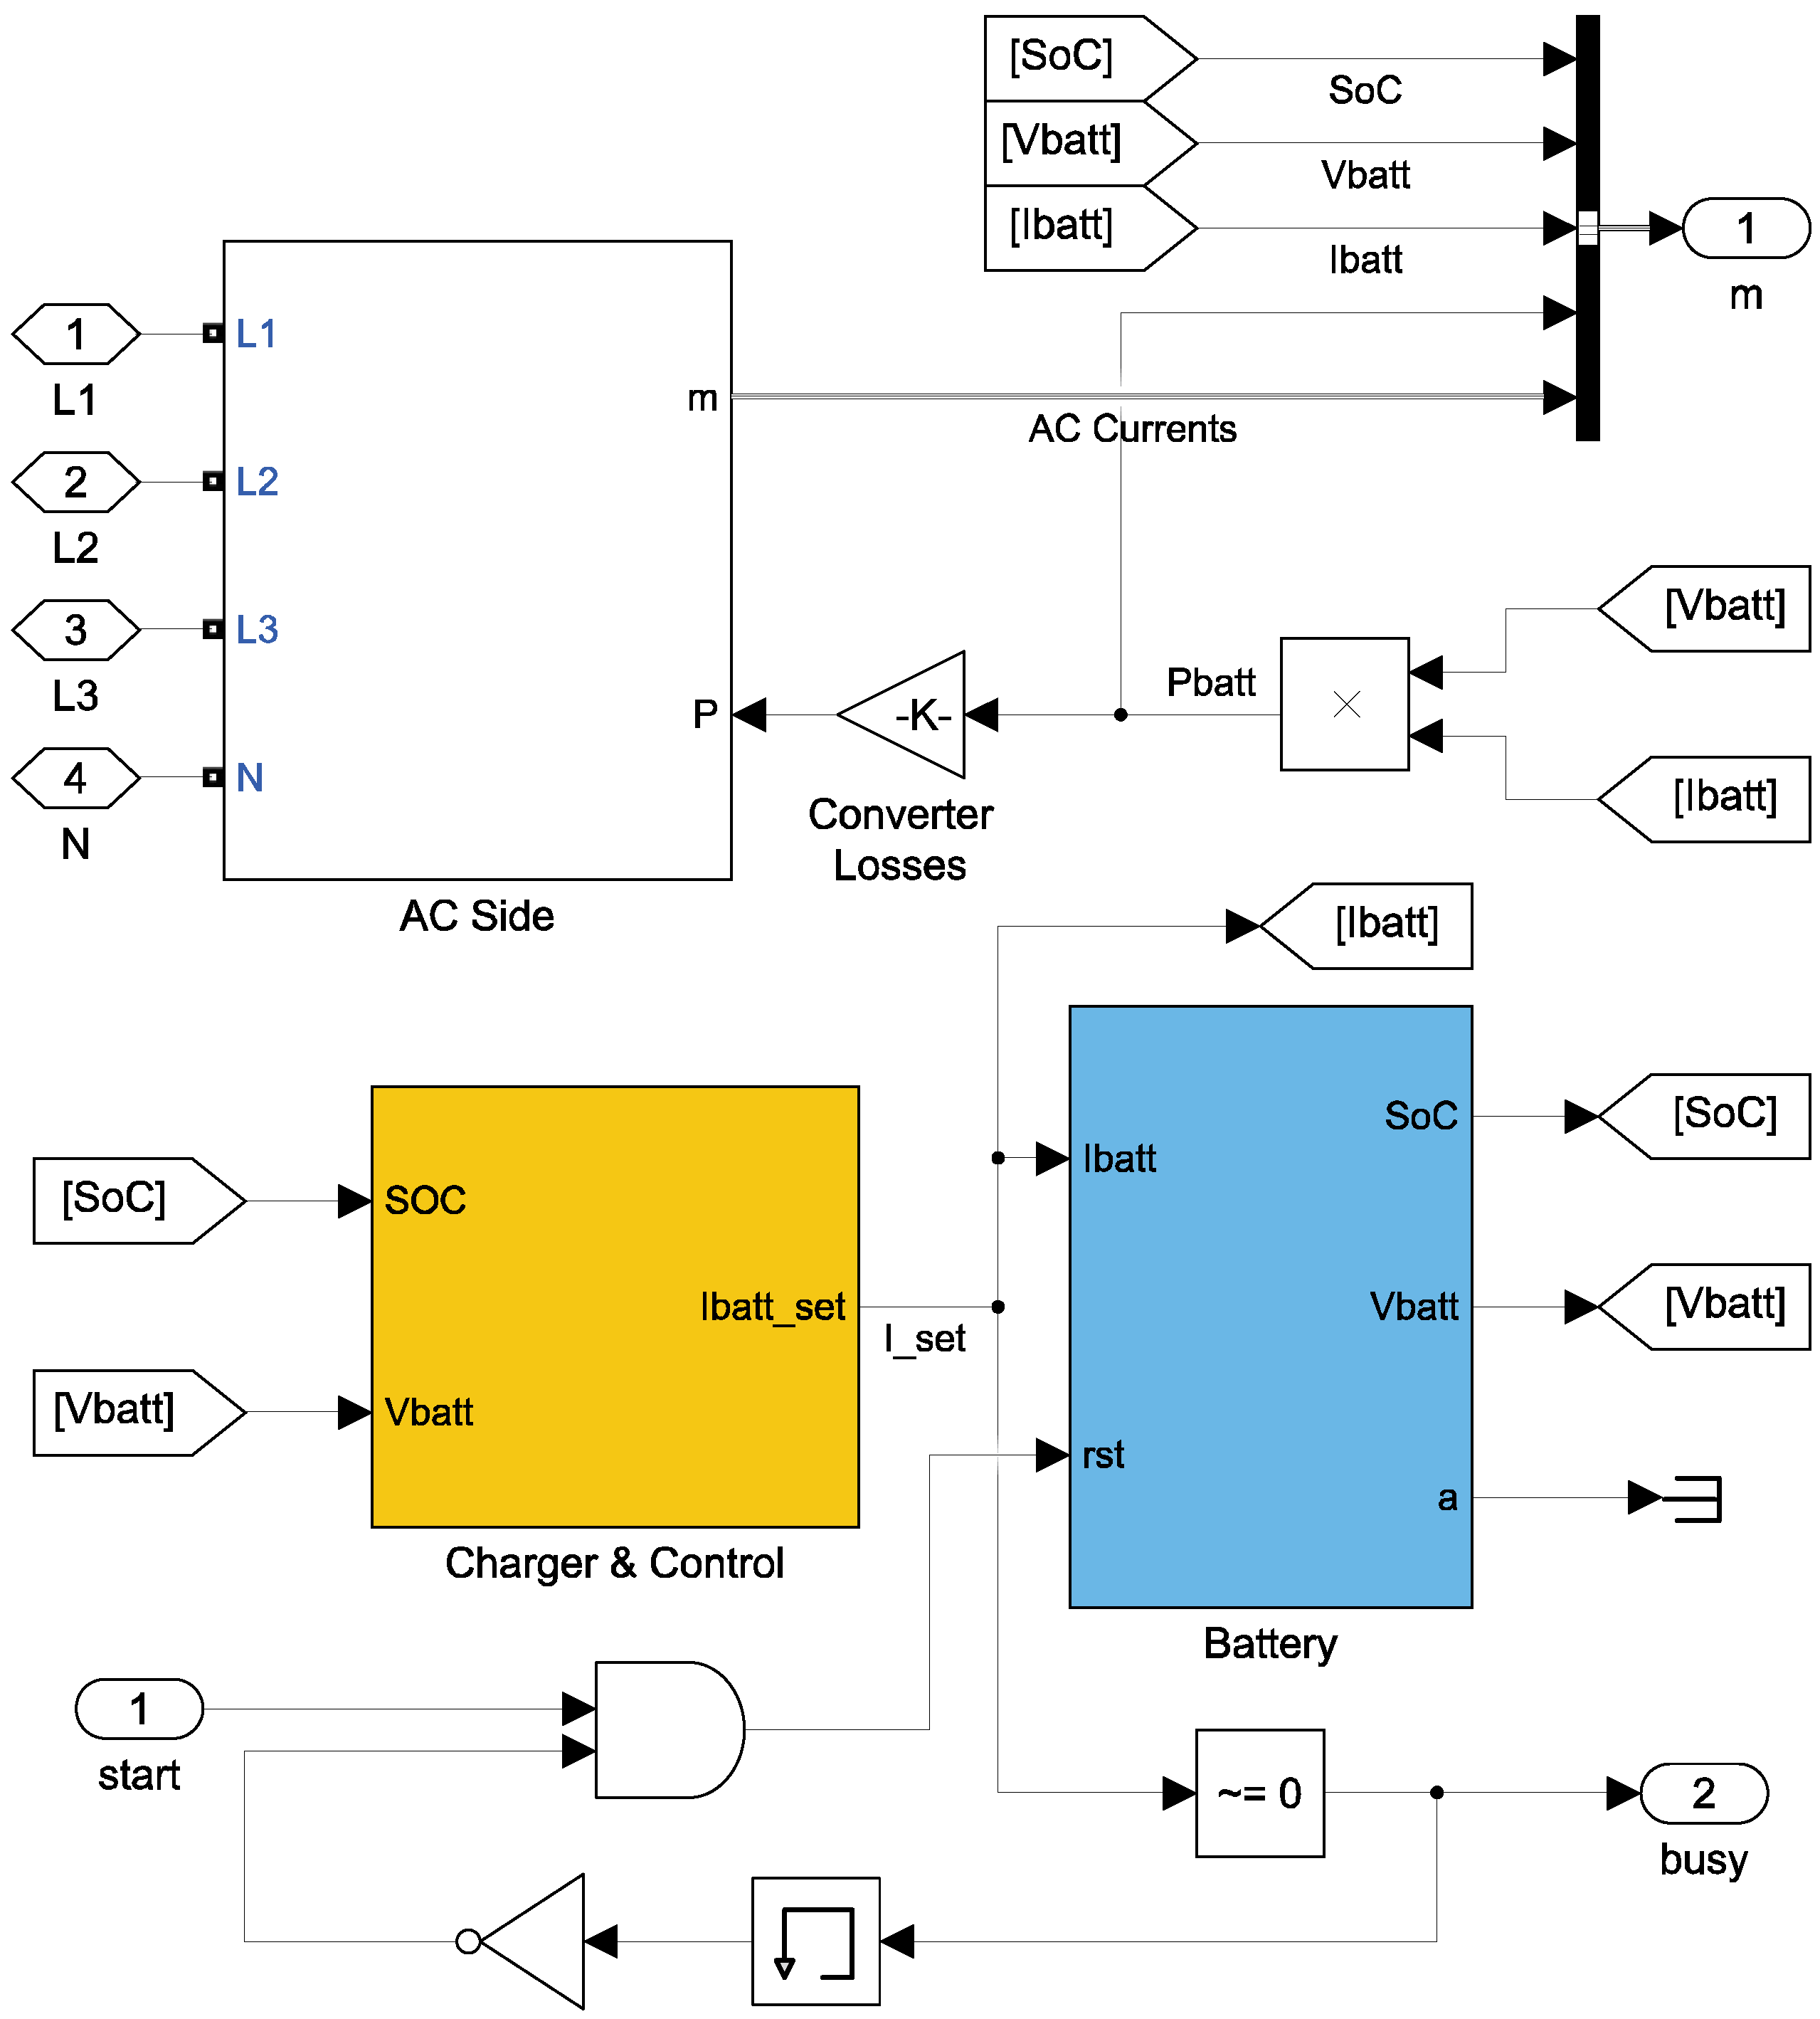
The battery cell model is also used to simulate the ten EV charging stations. No field data are available yet from EV chargers, so we generated synthetic data assuming a reasonable rate of random activation (during working hours). A station model (
Figure 18) features a charge controller, the AC grid interface, and a battery. When a vehicle sends a charge request and triggers the start signal, if the station is not busy charging a previous vehicle, the SoC is reset and the vehicle battery is charged up to full SoC. The
Charger & Control block controls the charging process, following a constant current/constant voltage (CC/CV) algorithm.
4. Simulation Results
For overall planning purposes, economic as well as environmental aspects must be considered.
Costs and benefits are computed using the following parameters (see
Table 3):
cost of energy bought from the power grid ();
revenue from energy sold to the grid ();
capital cost (installation and maintenance) for PV plants (20-year depreciation time) ();
capital cost (installation and maintenance cost) for the BESS (10-year depreciation time) ().
The total cost
at the end of the year is computed as:
with:
: power coming from the power grid ();
: power (absolute value) injected into the NPG ();
: total PV installation size expressed in ;
: total installed BESS capacity in ;
: duration of the simulation time window in .
To evaluate the effects on the environmental impact, we consider the CO
2 emission corresponding with the energy bought from the NPG, using a CO
2 emission rate (
) taken from real-time data [
22] (
for Northern Italy). The total emitted CO
2 is
Table 3.
Prices and costs considered in the model for economic estimates.
Table 3.
Prices and costs considered in the model for economic estimates.
| | 1 | 2 |
|---|
| | | |
We compared three UPSC MG scenarios: (i) no PV, no BESS; (ii) 3 MWp installed PV, no BESS; (iii) 3 MWp PV, 4.5 MWh installed BESS. We considered three 1-week windows in the months of April, June, and November. The PV installation size assumes complete covering of the available rooftop surface and approximately matches the peak load demand. The BESS is sized in such a way as to span the entire SoC dynamics.
Figure 19 describes the April week case. The power exchanged with the grid (positive when bought, negative when sold) is shown in
Figure 19a. The solid red line illustrates the case where neither PV nor BESS have been installed and the load demand is wholly supplied by the NPG. When PV is available (blue dotted line), it completely covers the daytime load demand; the energy surplus is sold to the NPG (negative power). At night-time, loads are supplied by the NPG. When the BESS is also available, the black dot-dashed line shows that the energy injected into the NPG is minimized, the excess PV production being stored in the BESS.
Figure 19b shows the power exchanged with the BESS: positive when supplying loads (discharging), negative when storing energy (charging).
Figure 19c shows the SoC.
Table 4 gives the economic (capital cost and running costs) and CO
2 impact of the UPSC grid over 3 weeks in different times of the year. The simulations show that large economic benefit stems from the deployment of PV generation; not so the installation of BESS capacity. The savings offered by the PV plants are estimated to be in the 16–51% range, with a reduction in CO
2 emissions between 16 and 42%, depending on weather conditions. On the other hand, the additional installation of a BESS does not pay off, with losses in the 13–29% range with respect to the PV-only case. However, the BESS yields 4–19% CO
2 reduction. We also performed year-long simulations, summarized in
Table 5, for the years 2014, 2015, 2016, and 2020. The year 2020 has been included as an example of a crisis year in which consumption profiles were significantly distorted by the COVID-19 lockdown. For the months of complete lockdown (March to May) the standard load profile was replaced by the baseload (no peaks due to the daily activity of users), while in the following months, the consumption has been progressively upscaled to approach the normal scenario (50% to 75% for June–August, 75% to 100% for September–December). Year-long simulations confirm the lack of economic motivation for the installation of a BESS (8–9% loss with respect to the PV-only case), although energy storage capabilities yield a further reduction in CO
2 emissions of 5–6% (not surprisingly, the reduced power demand of the COVID-19 year 2020 makes BESS even less convenient). It is expected that decreasing costs will improve the economic outlook for BESS installations in the years to come [
24]; for example, a recent NREL survey [
25] forecasts a 14–36% cost reduction in the next 5 years.
Table 6 shows a comparison of our 2016 simulated data with the results obtained with the commercial tool HOMER Pro [
26]. There is substantial agreement between the two tools, with discrepancies in the range of a few % that can easily be attributed to features that are lacking in the HOMER Pro model: (i) the electrical models for transmission line and conversion stations (transformers); (ii) the possibility to model the interaction between heat and electric energy in the VisLab building (
Section 3.2); (iii) the possibility to model a large number of loads with independent consumption profiles (only two load profiles can be considered).
An additional set of year-long simulations allowed us to evaluate the effect of reactive power compensation in the PV and BESS subsystems.
Table 7 shows the results for 2014, 2015, 2016, and 2020, considering a typical power-factor limit of 0.9.
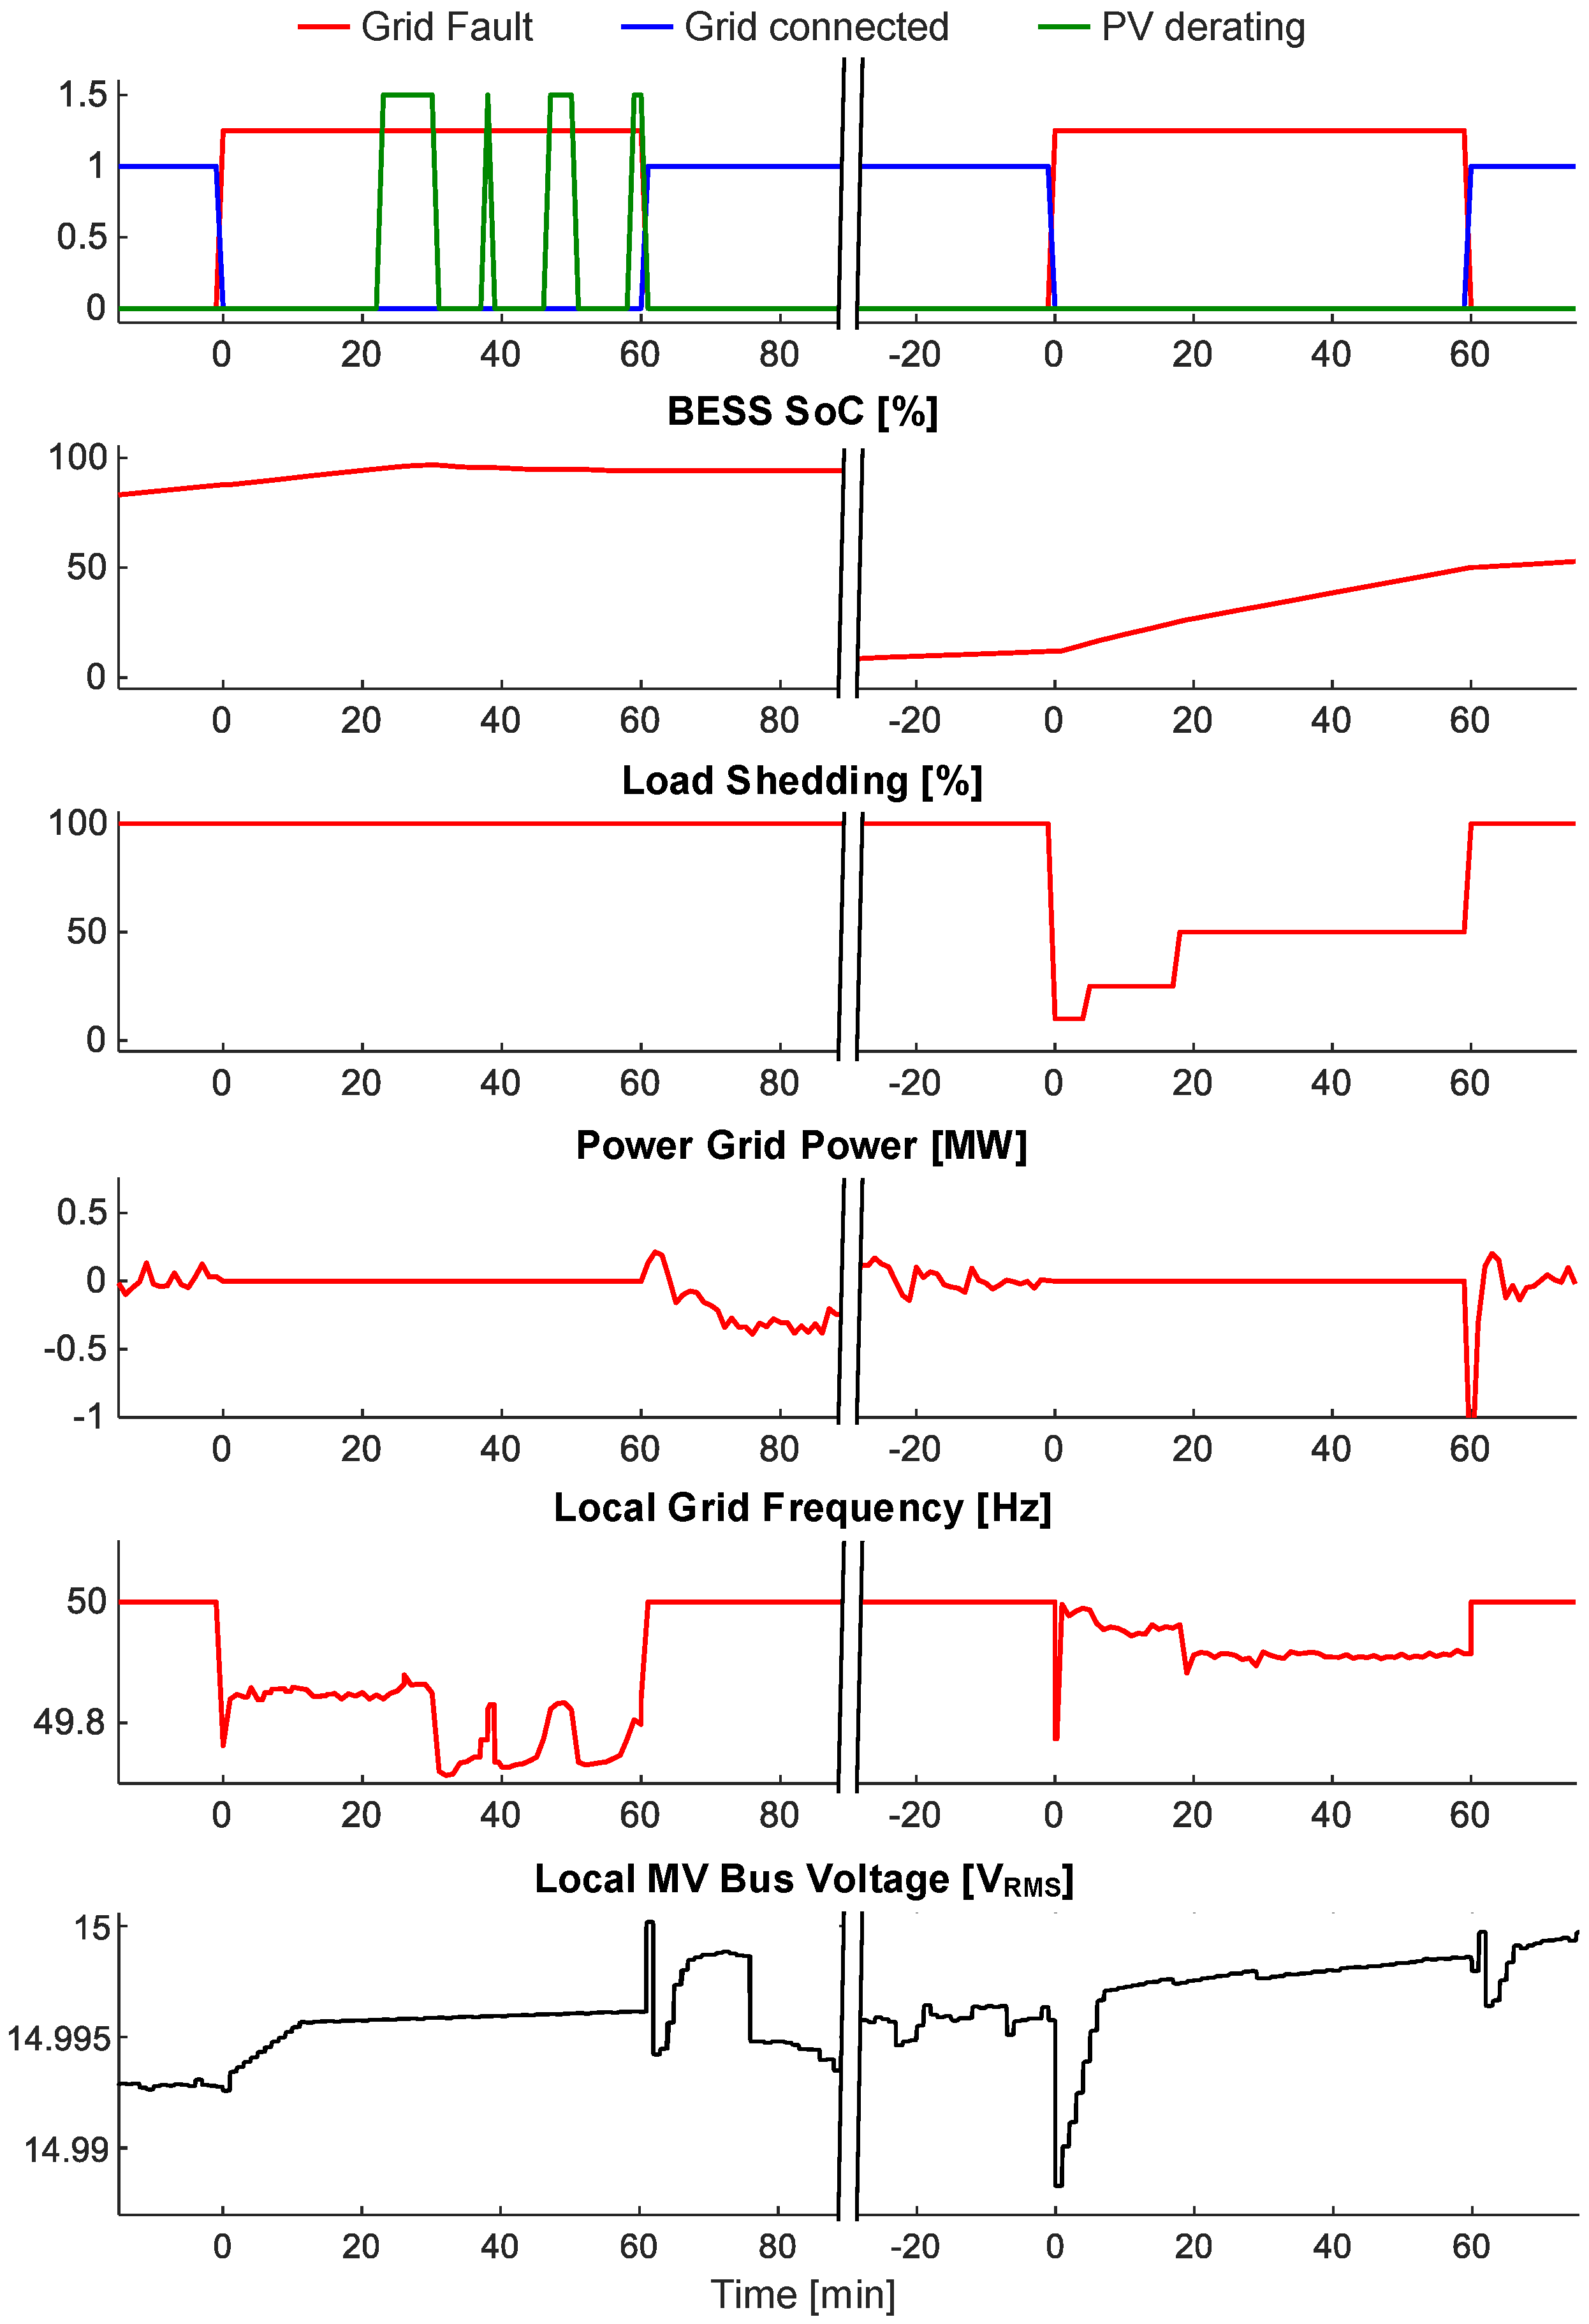
Figure 20 shows an example of the MG behavior in islanded mode following an NPG fault. Upon detecting an undervoltage (<85% of the nominal voltage) or overvoltage (>110% of the nominal voltage), the main controller activates a Grid fault signal that disconnects the UPSC grid from the NPG (Grid connected mode signal going low); the BESS then starts working as an AC voltage source.
The example of
Figure 20 shows two contingencies. The first one happens at a time when the solar irradiance is high, the PV output exceeds the load demand, and the BESS is fully charged (SoC > 90%). As shown in
Figure 20 (Power Grid Power chart), just before the fault the exchange between the campus grid and the NPG is nearly zero due to high PV production. When the fault happens (red trace in the top chart), the grid is disconnected, and about 20 min later the PV plants are put in derating mode (green trace in the top chart) since the BESS is fully-charged and cannot absorb the excess of local energy production. When the second fault happens (red trace in the top chart), the SoC of the BESS is below 12.5%, so 90% of the loads are disconnected (Load Shedding chart), in order to guarantee servicing high-priority loads. After a few minutes, thanks to PV production, the BESS SoC starts rising (BESS SoC chart), and the load shedding action moves to lower priority classes, resulting first in 25% (after 5 min) and then 50% (after 20 min) of the loads restored to operation.
Providing the UPSC microgrid with the capability of operating in islanded mode for extended periods of time (several hours and up) will require the commissioning of dispatchable power plants (like CHP). A hydrogen production plant and a methane conversion plant are planned to be deployed in the near future, and the corresponding models will be included in our framework.
6. Droop Characteristics
When the UPSC grid is in islanded mode, the MG frequency is not fixed by the NPG. As discussed in
Section 2, in order to achieve fast simulations over long time intervals, our approach is based on a phasor simulation solver, which considers the frequency constant. This makes it impossible to consider a frequency control loop with primary and secondary control such as should be implemented in the real microgrid [
27]. However, we implemented a simple mathematical estimation of the islanded MG frequency based on the typical characteristics of a power/frequency (
P/
f) droop control [
27,
28,
29]:
where
is the power supplied to the local grid by the
i-th unit and
is its reference value;
is the nominal frequency (no load conditions);
is the output frequency;
is the P/f droop.
Two different droop characteristics are implemented for the PV plants and for the BESS, respectively, to emulate the following scenarios: (i) as long as the load demand is lower than (or equal to) the total available PV power, frequency regulation is performed by the PV units; (ii) when the load demand cannot be satisfied by the PV plants, regulation is taken over by the BESS. In the latter case, frequency regulation considers both the power delivered by the storage system and its SoC.
In
Figure 23 (left) we show the PV droop curve, where
is the nominal frequency (50 Hz in Europe) and
is the value when PV units are at full-load condition;
is the maximum possible frequency variation when regulation is performed by the PV units.
Figure 23 (right) shows the BESS droop. When the SoC increases the system is allowed to deliver more power. When the BESS takes control of the regulation, the MG frequency varies from
(end of the PV units’ regulation region) to
(minimum frequency allowed).
The bottom trace in
Figure 20 shows the frequency estimation for islanded mode under the two contingencies described in
Section 4. In the first fault, frequency is regulated by the PV droop in the derating mode intervals, and by the BESS in the remaining intervals. In the second fault, the PV production is greater than the load demand (the BESS is recharging); therefore, the PV inverters take charge of the frequency regulation.
7. Conclusions and Future Work
We presented a library of models for the simulation of a university campus microgrid in Simulink/MATLAB. The aim of the tool is to allow computationally lean simulations on widely varying time scales and evaluating electrical, economic, and environmental performance as renewable energy (PV) and BESS penetration increase. The library includes PV generation, BESS storage, loads (campus buildings and outdoor lighting), EV charging stations, and interconnections. We also developed a detailed model of a heat-pump-based heating/cooling system coupling the dynamic thermal model with the electric model, with a comprehensive modeling approach likely to gain importance in the future as the concept of integrated energy districts becomes commonplace.
We presented results of (i) week-long simulations under three different seasonal conditions, and (ii) year-long simulations for the estimation of the overall economic and environmental impacts. We also described islanded-mode operation under contingency conditions.
Future work will include (a) progressive integration of experimental field data coming from the planned smart metering network, (b) the modeling of small-size dispatchable energy sources—such as CHP generator plants—that will have to complement the PV production for energy self-sufficiency of the campus MG, and (c) the integration of the electric grid model with that of the heating/cooling network into a single comprehensive energy district simulation tool.

