

Research on the Design of Carbon-Neutralized Building in Rural China: A Case Study of “Impression of Yucun”

Abstract
:1. Introduction
2. Materials and Methods
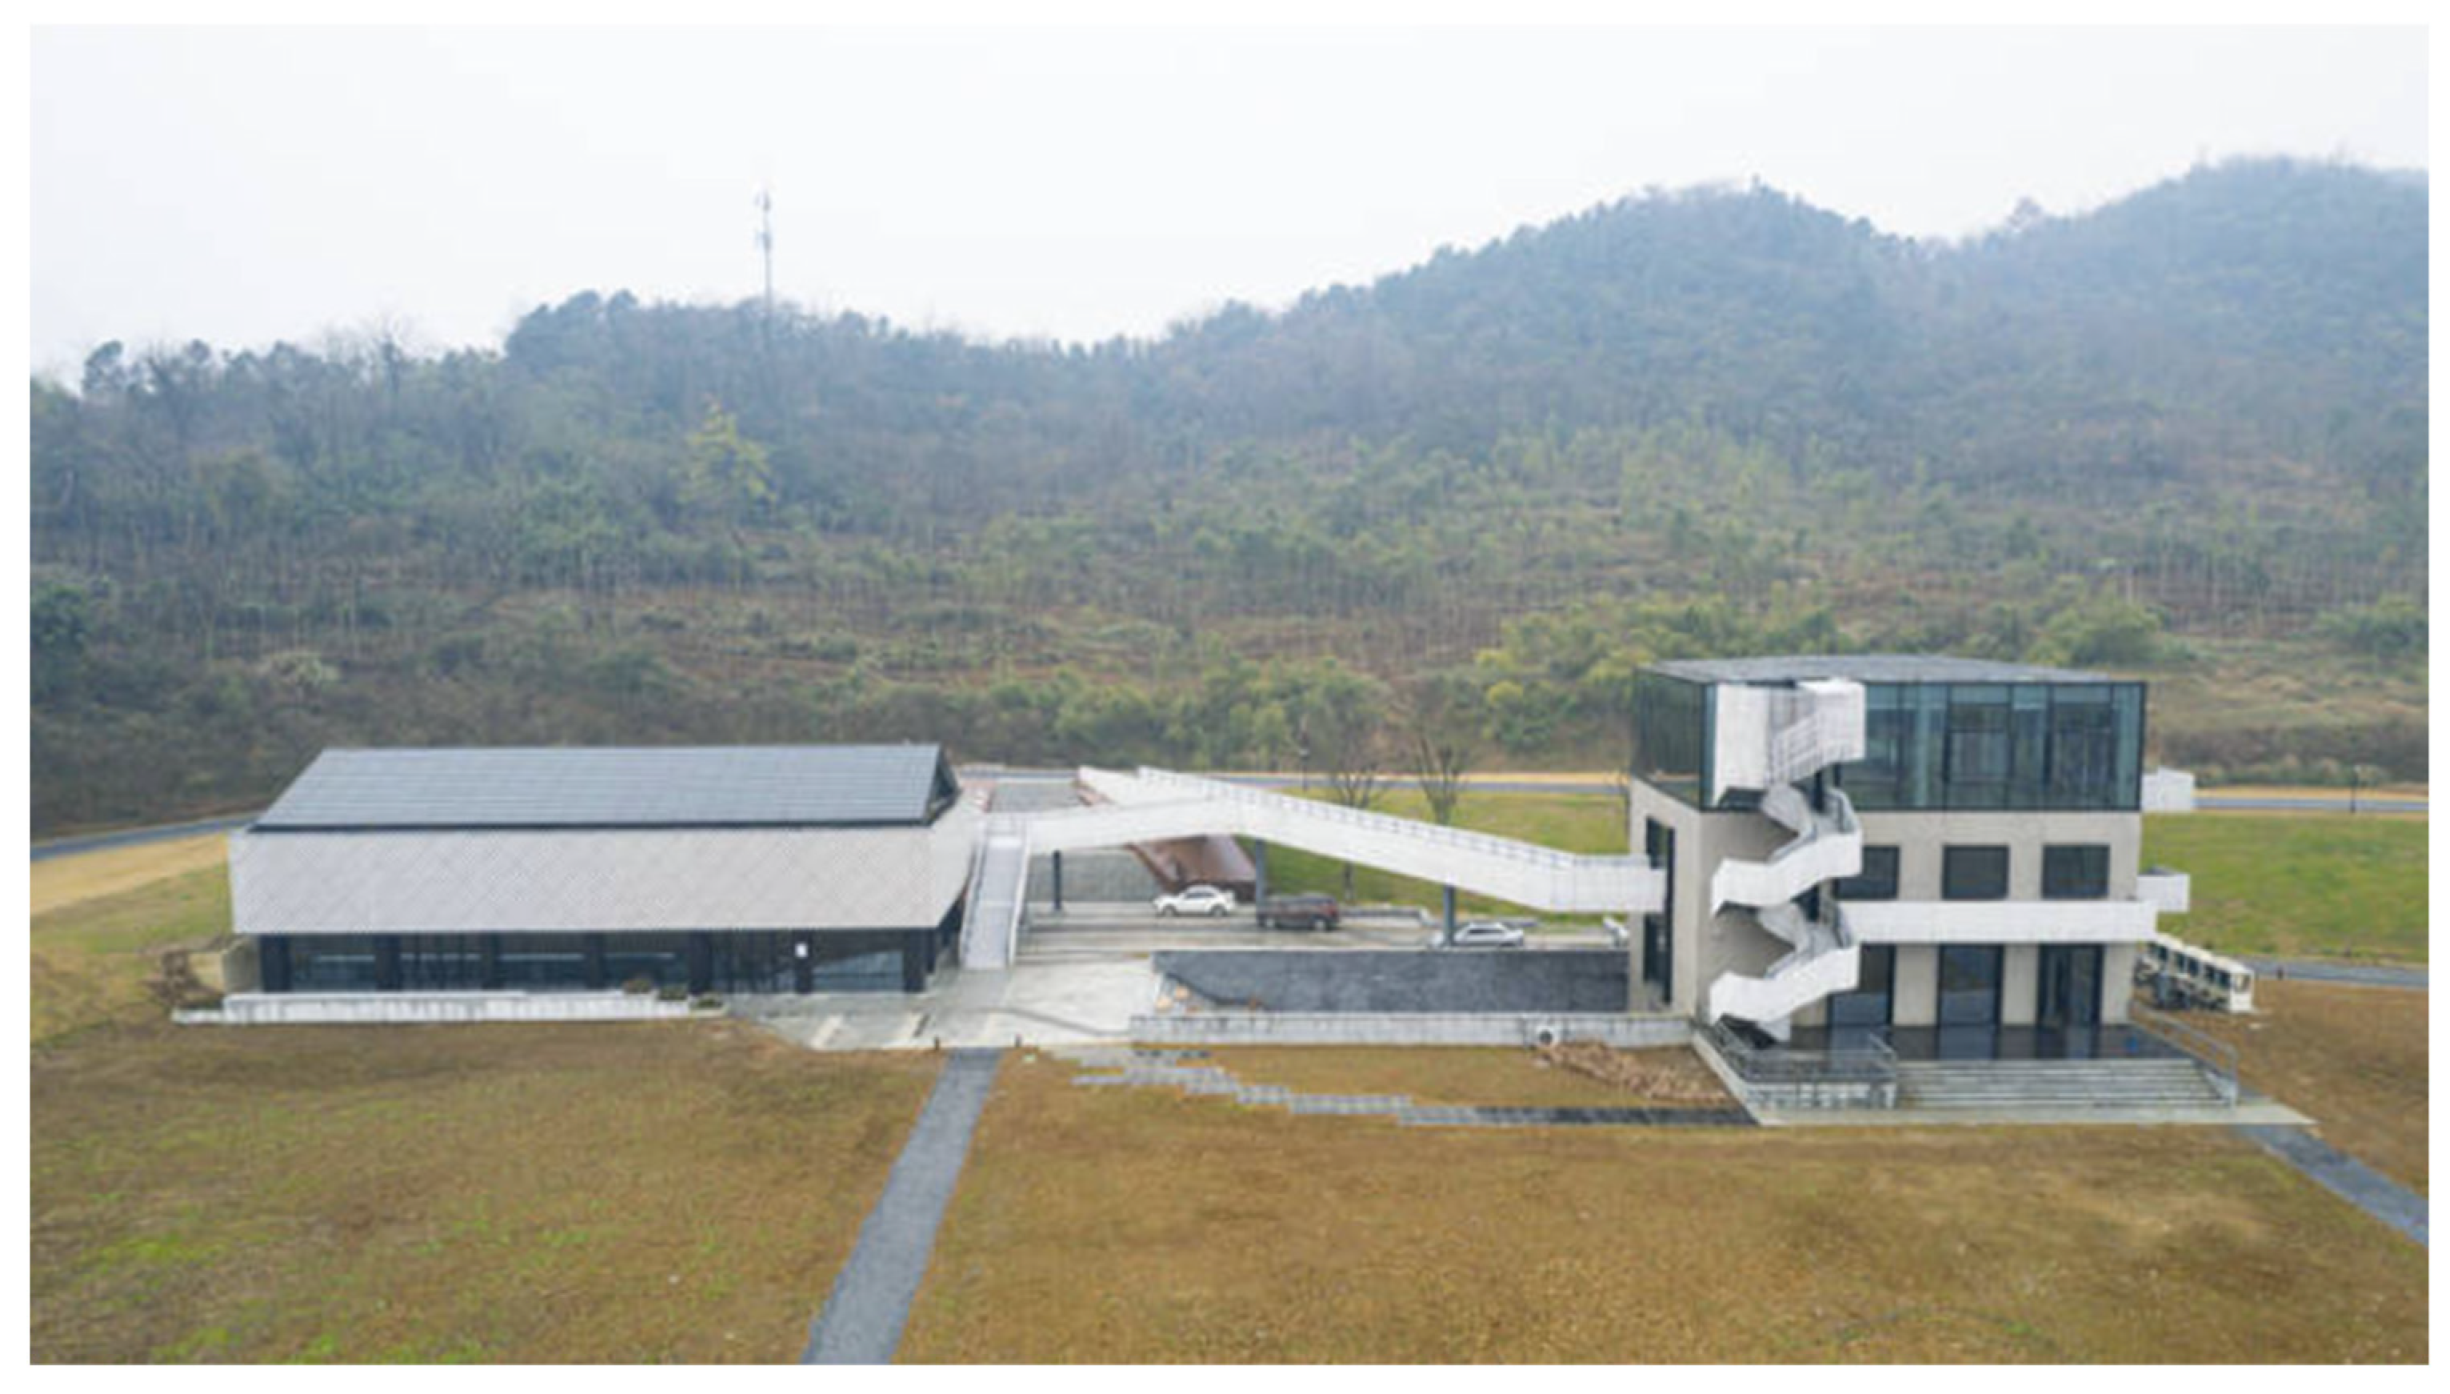
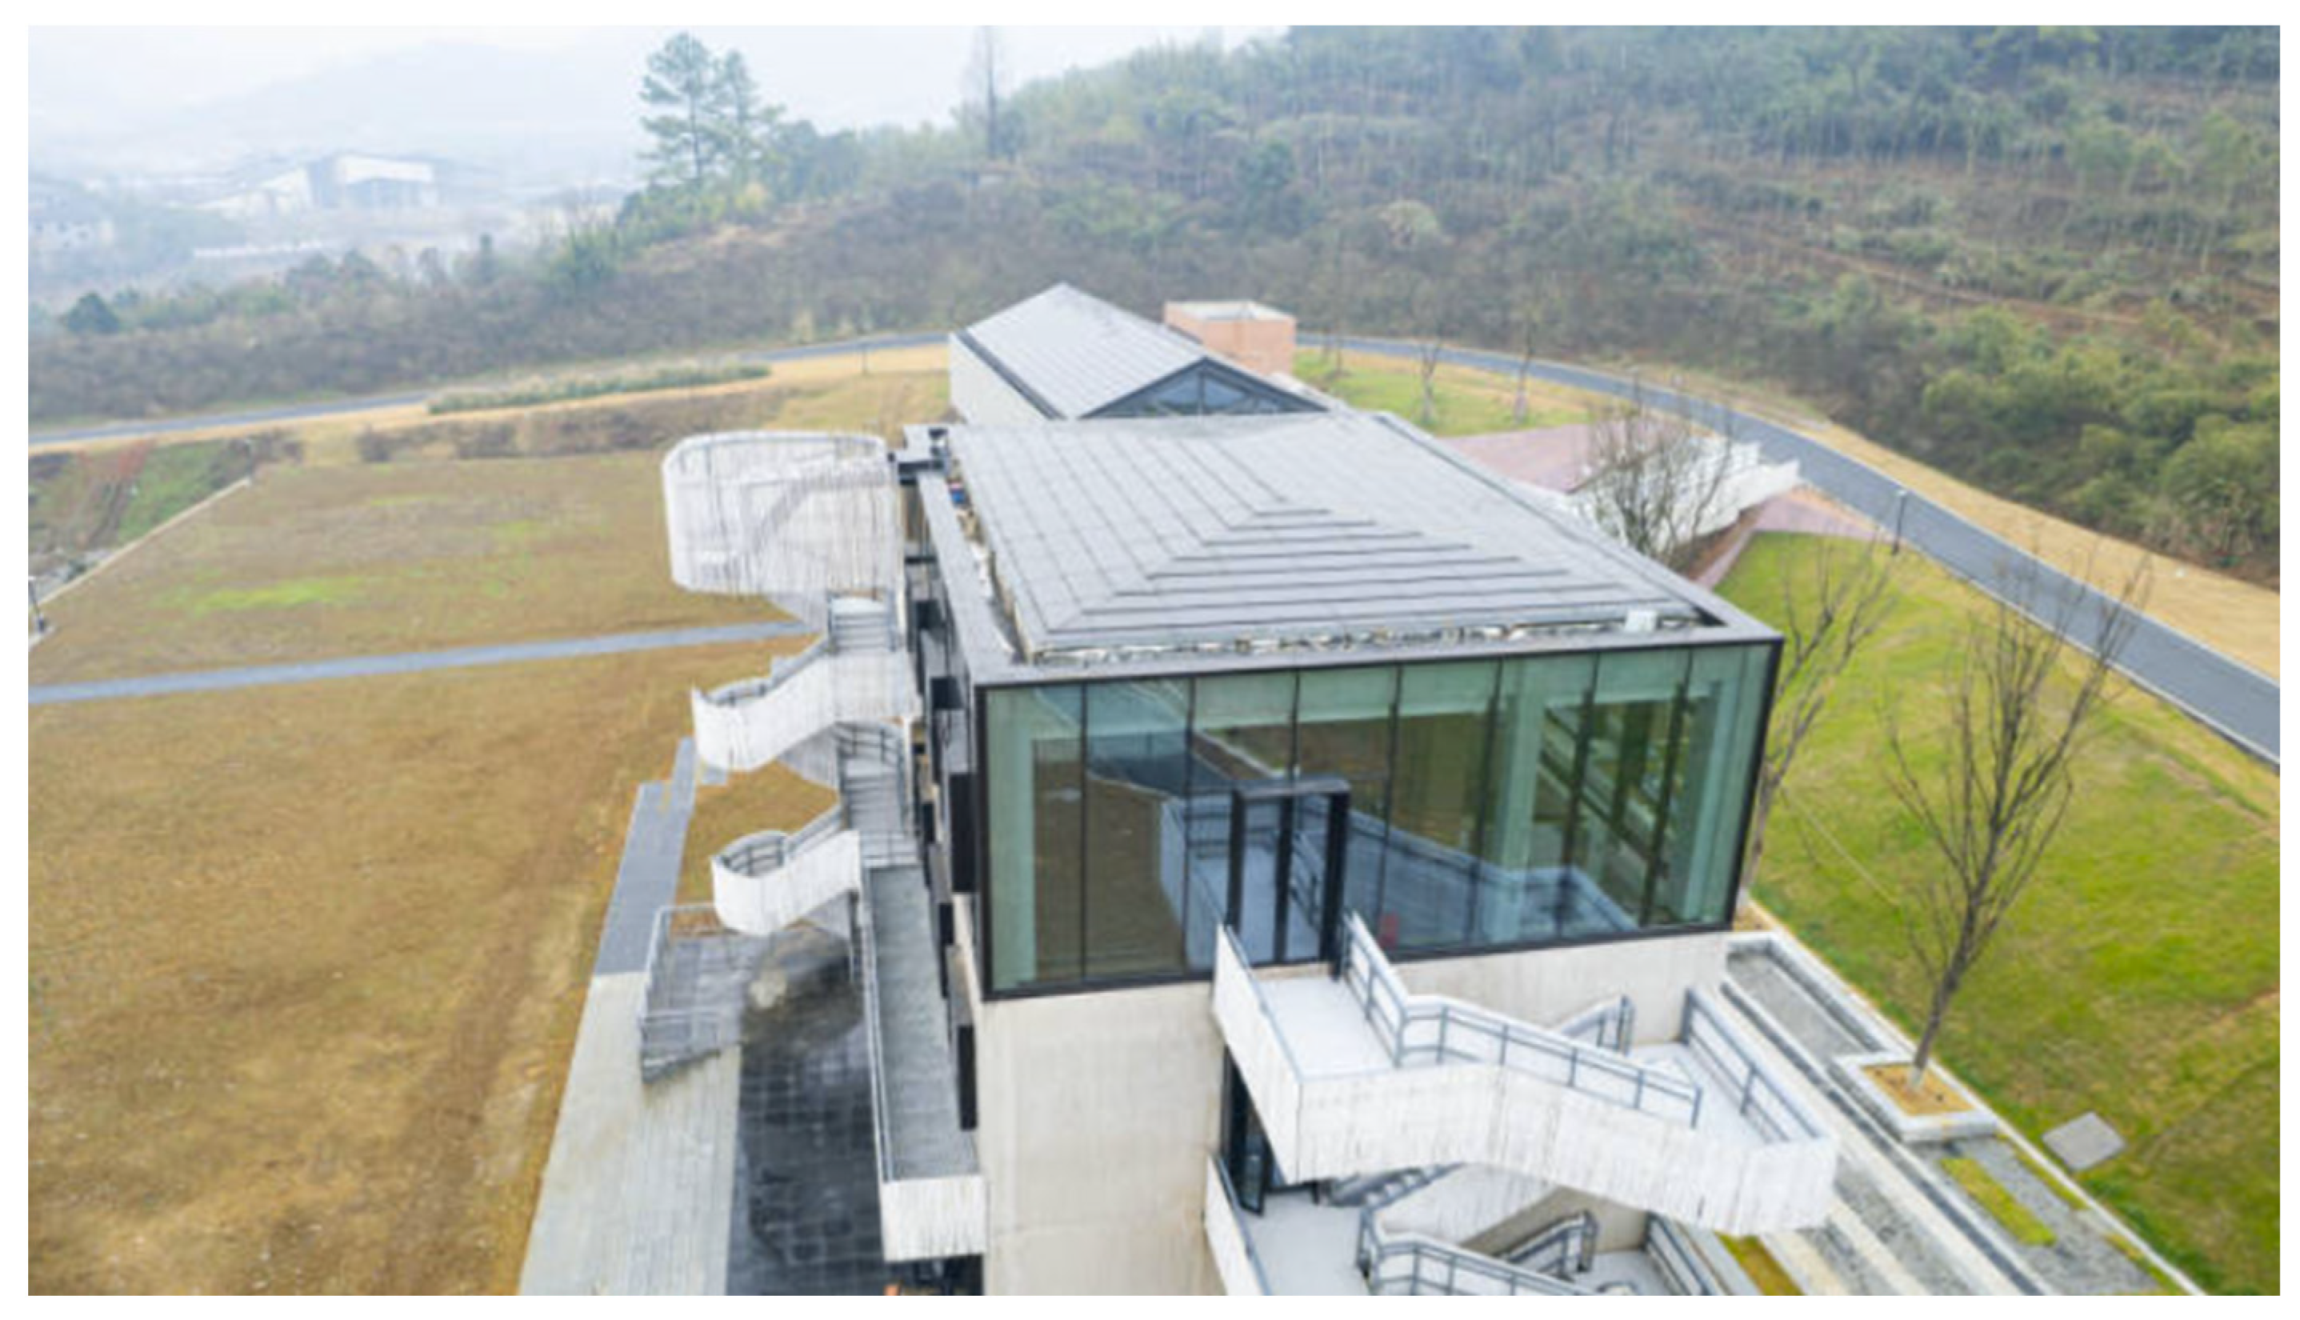
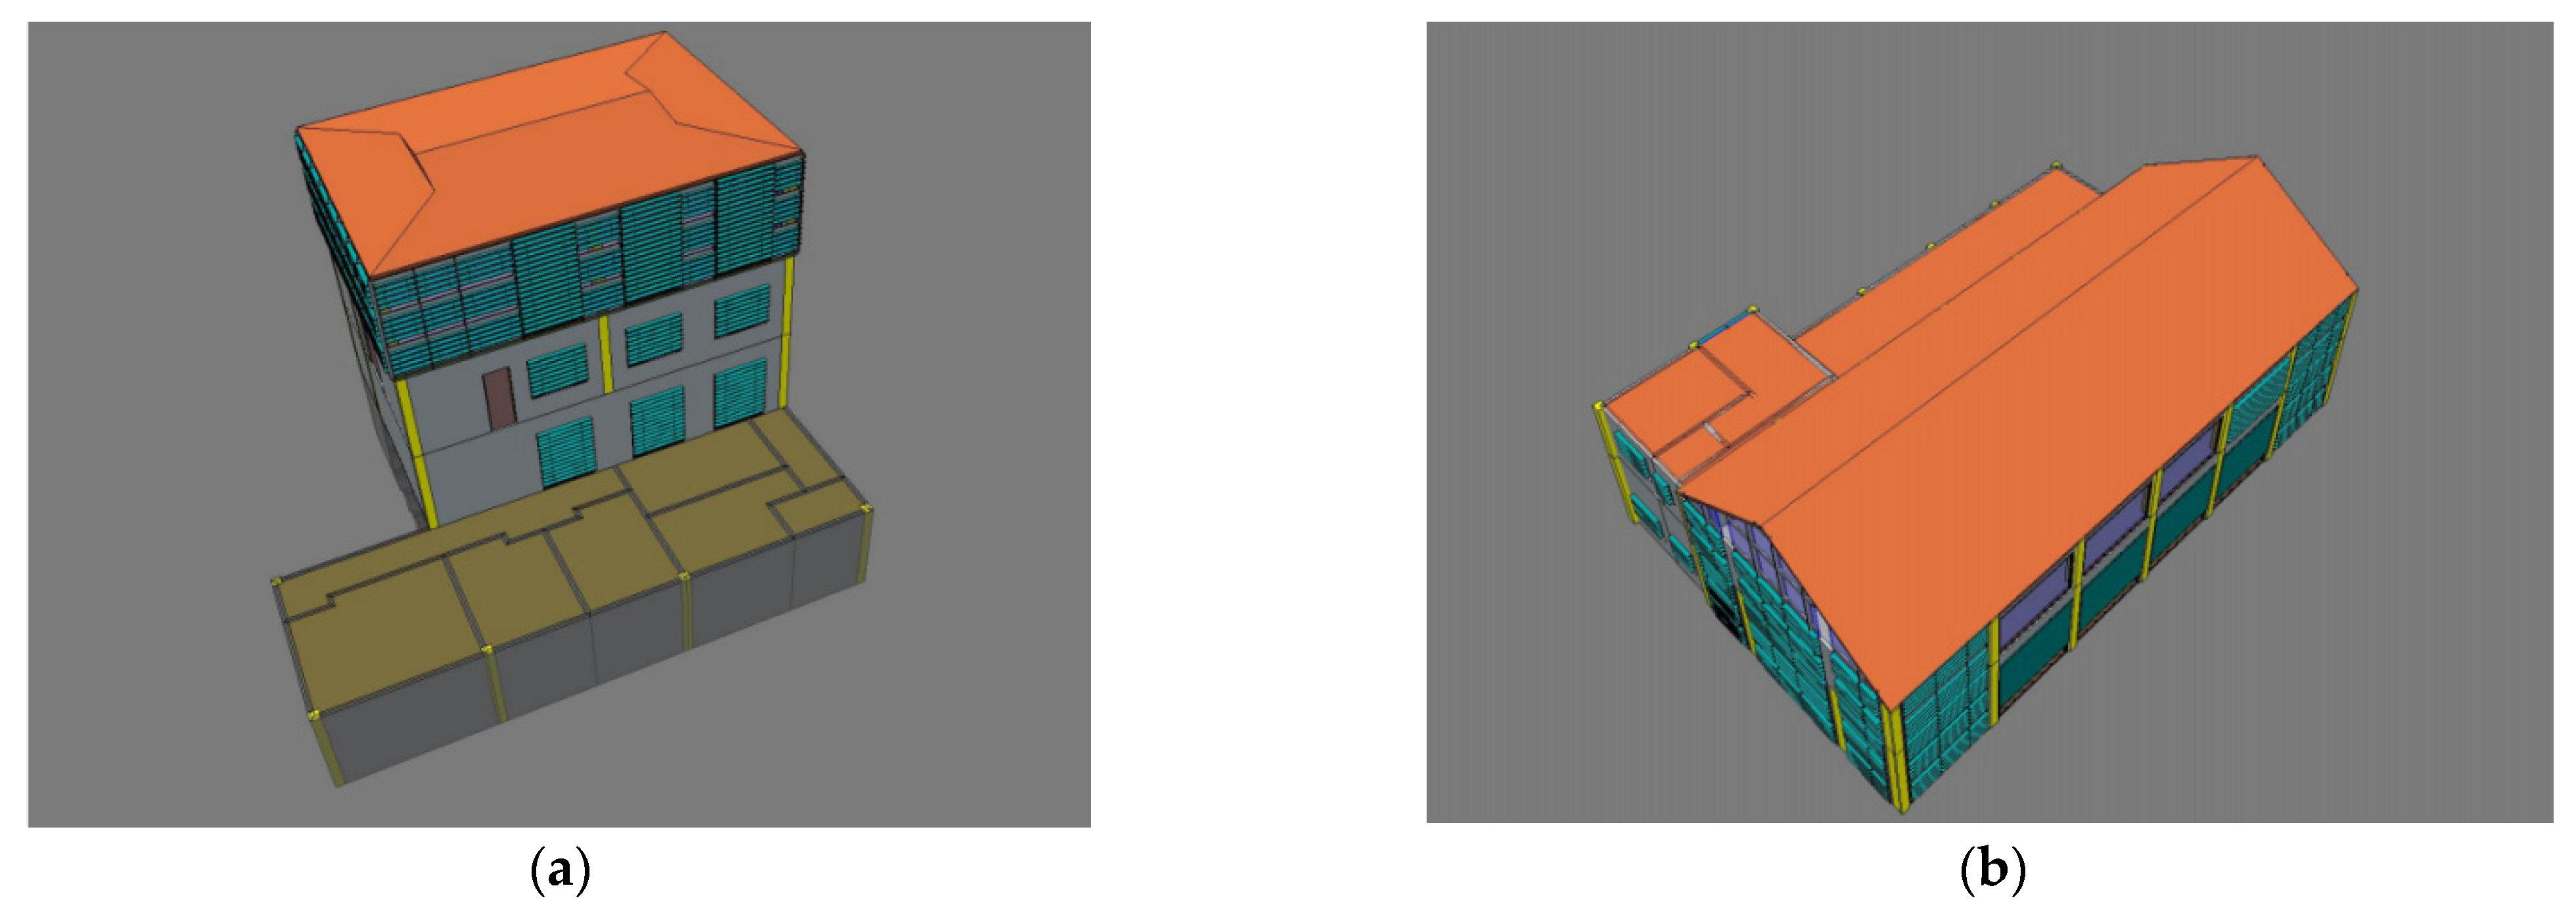
2.1. Case Overview
2.2. Building Carbon Neutrality Design
2.2.1. Building Envelope
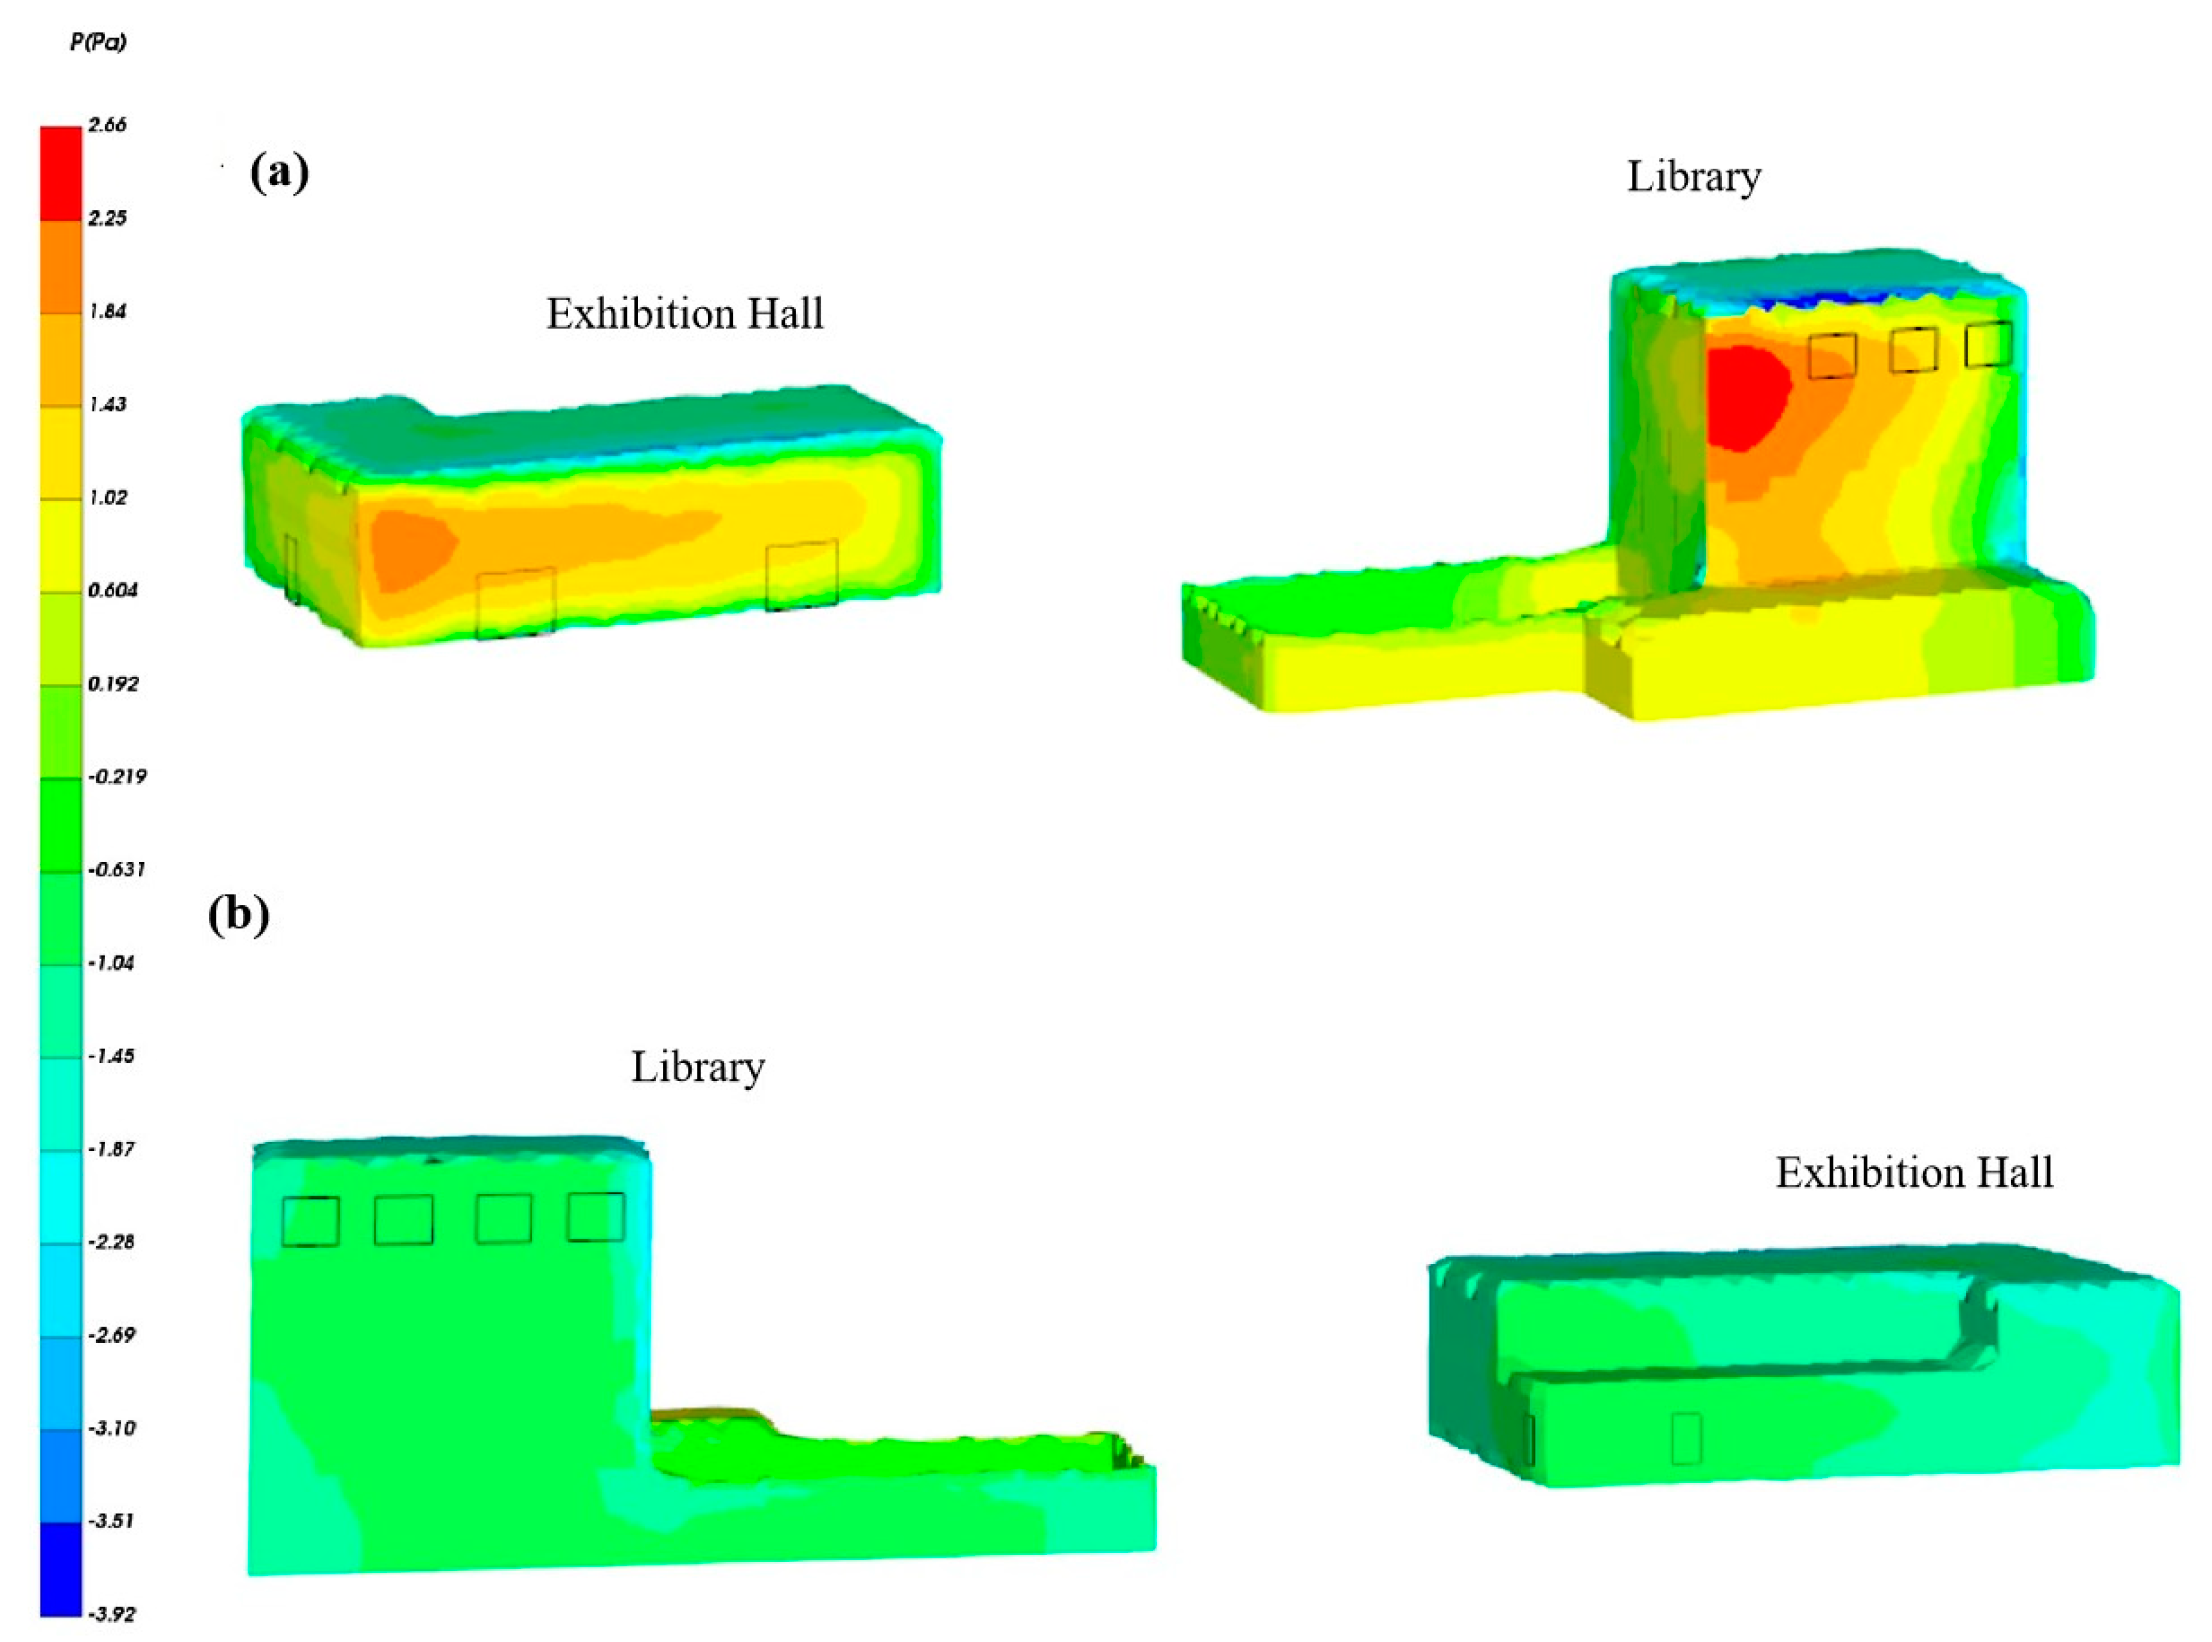
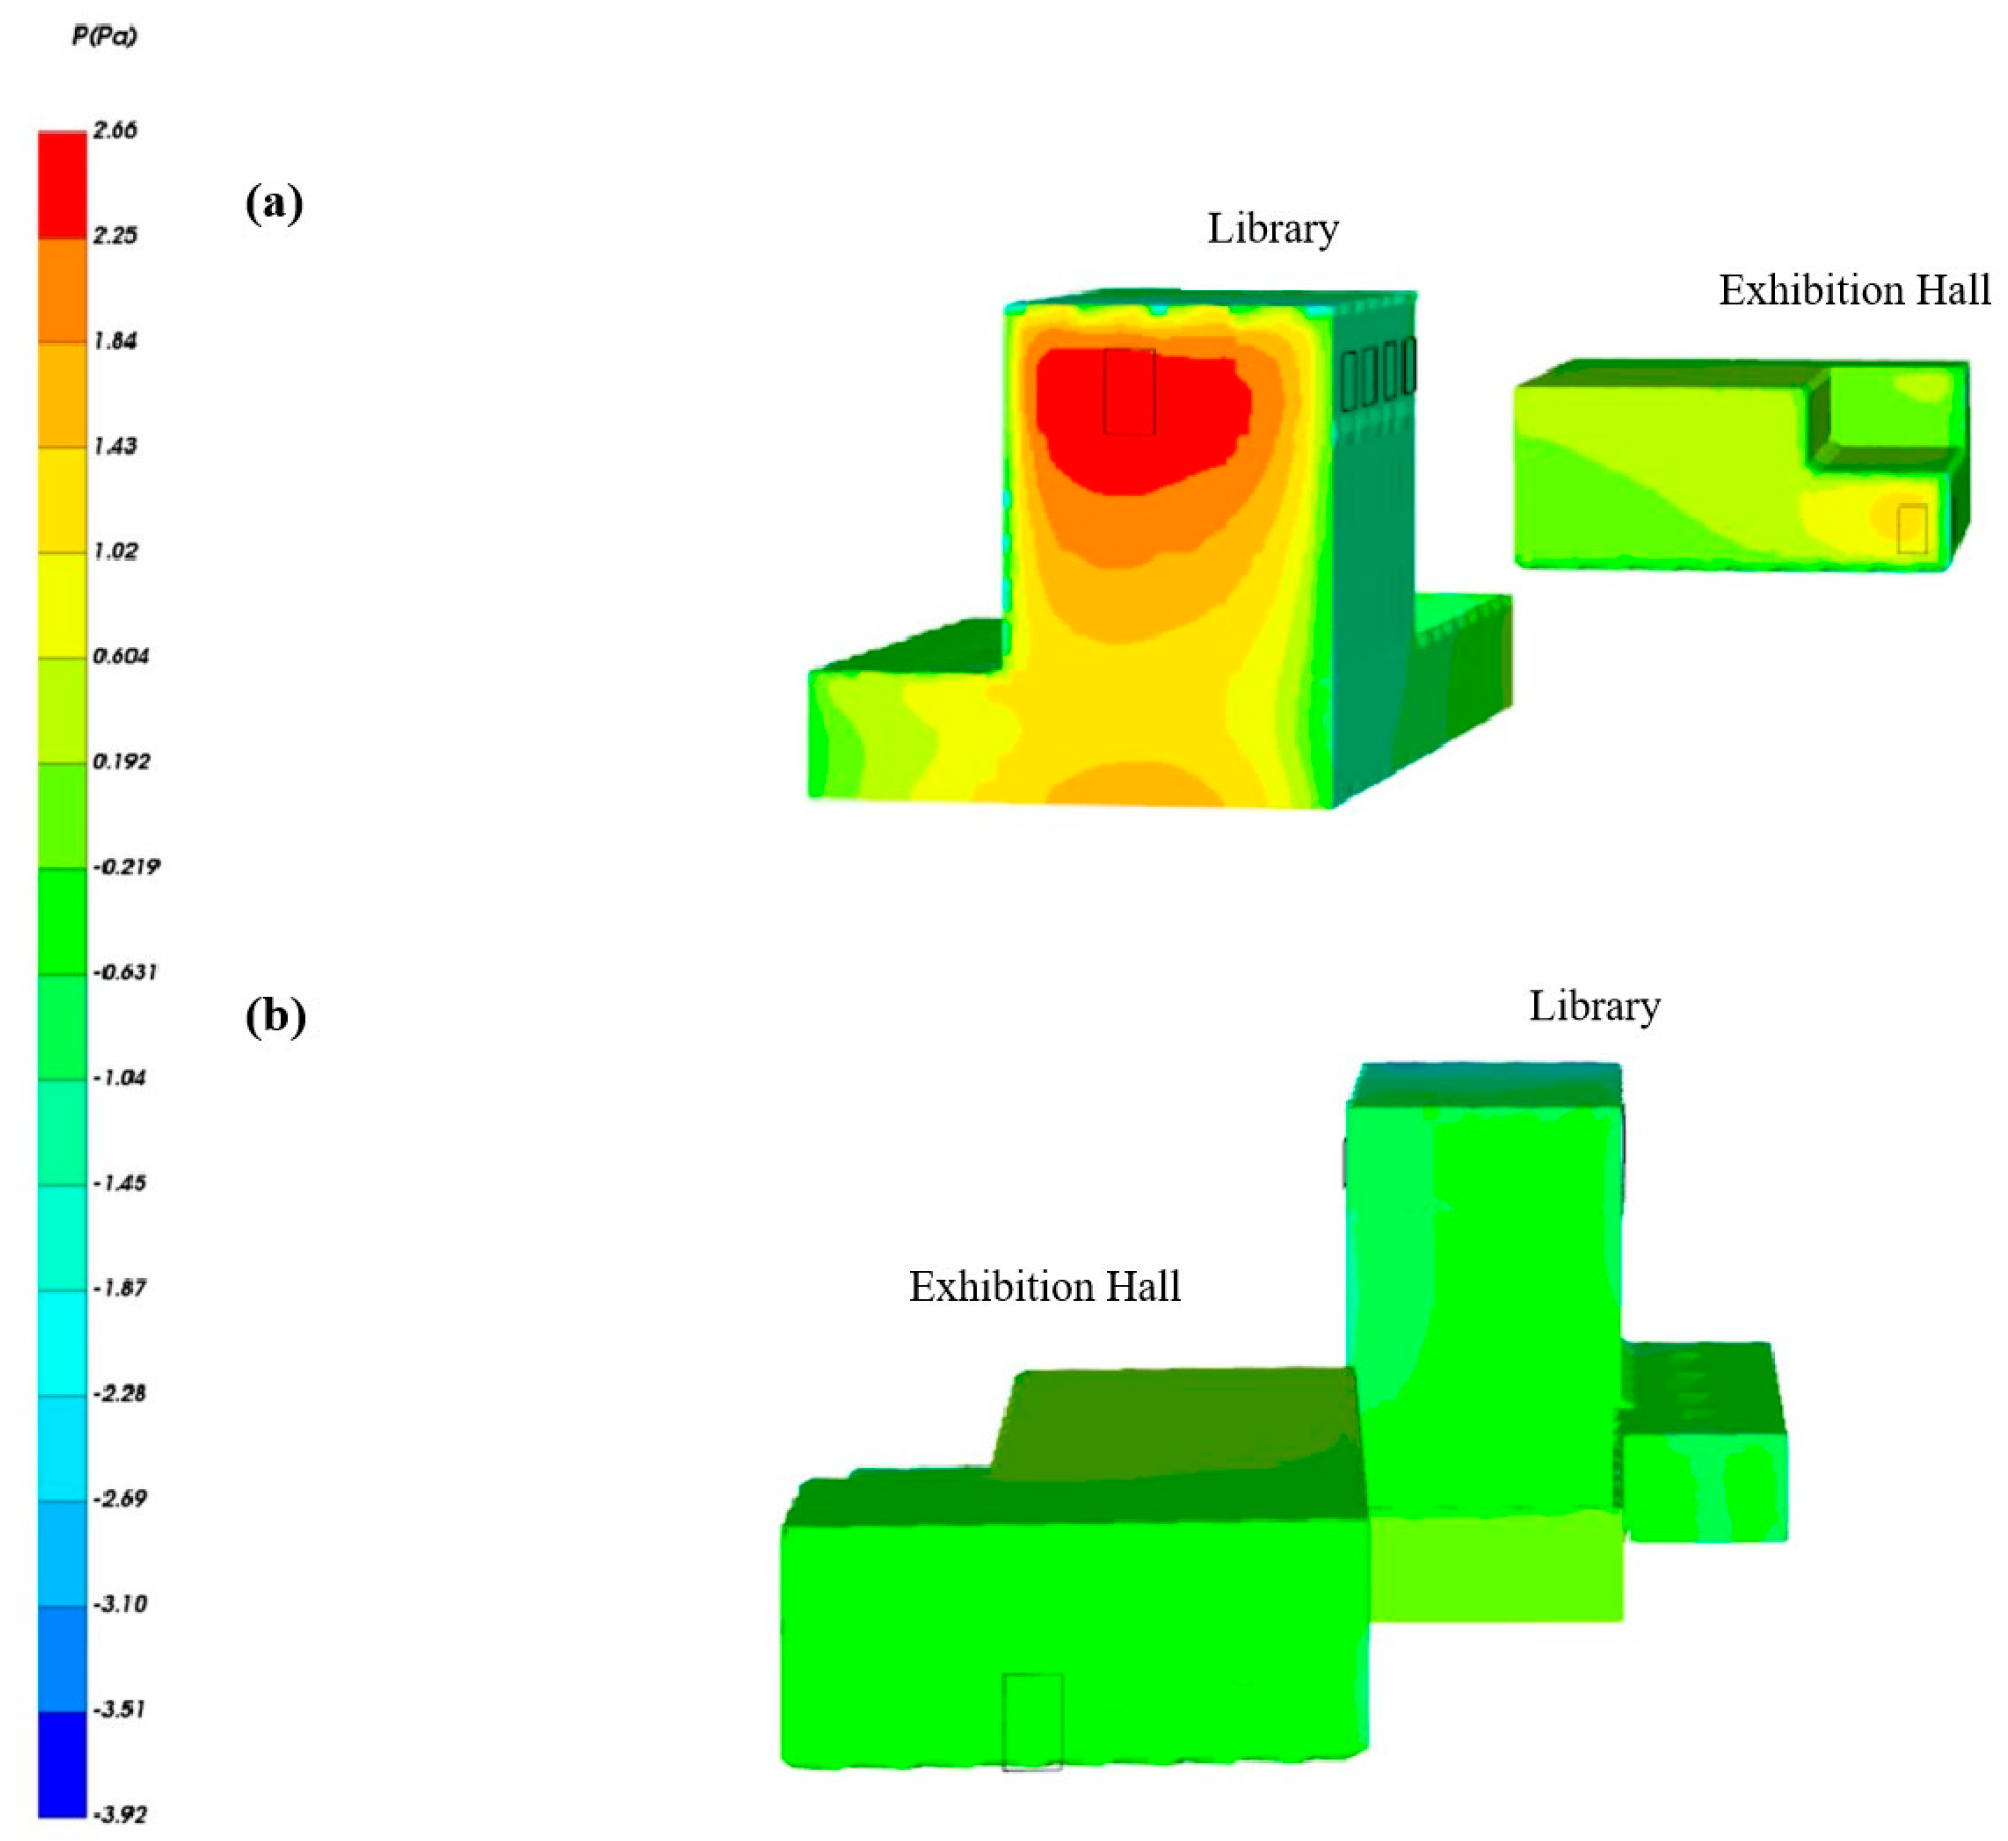
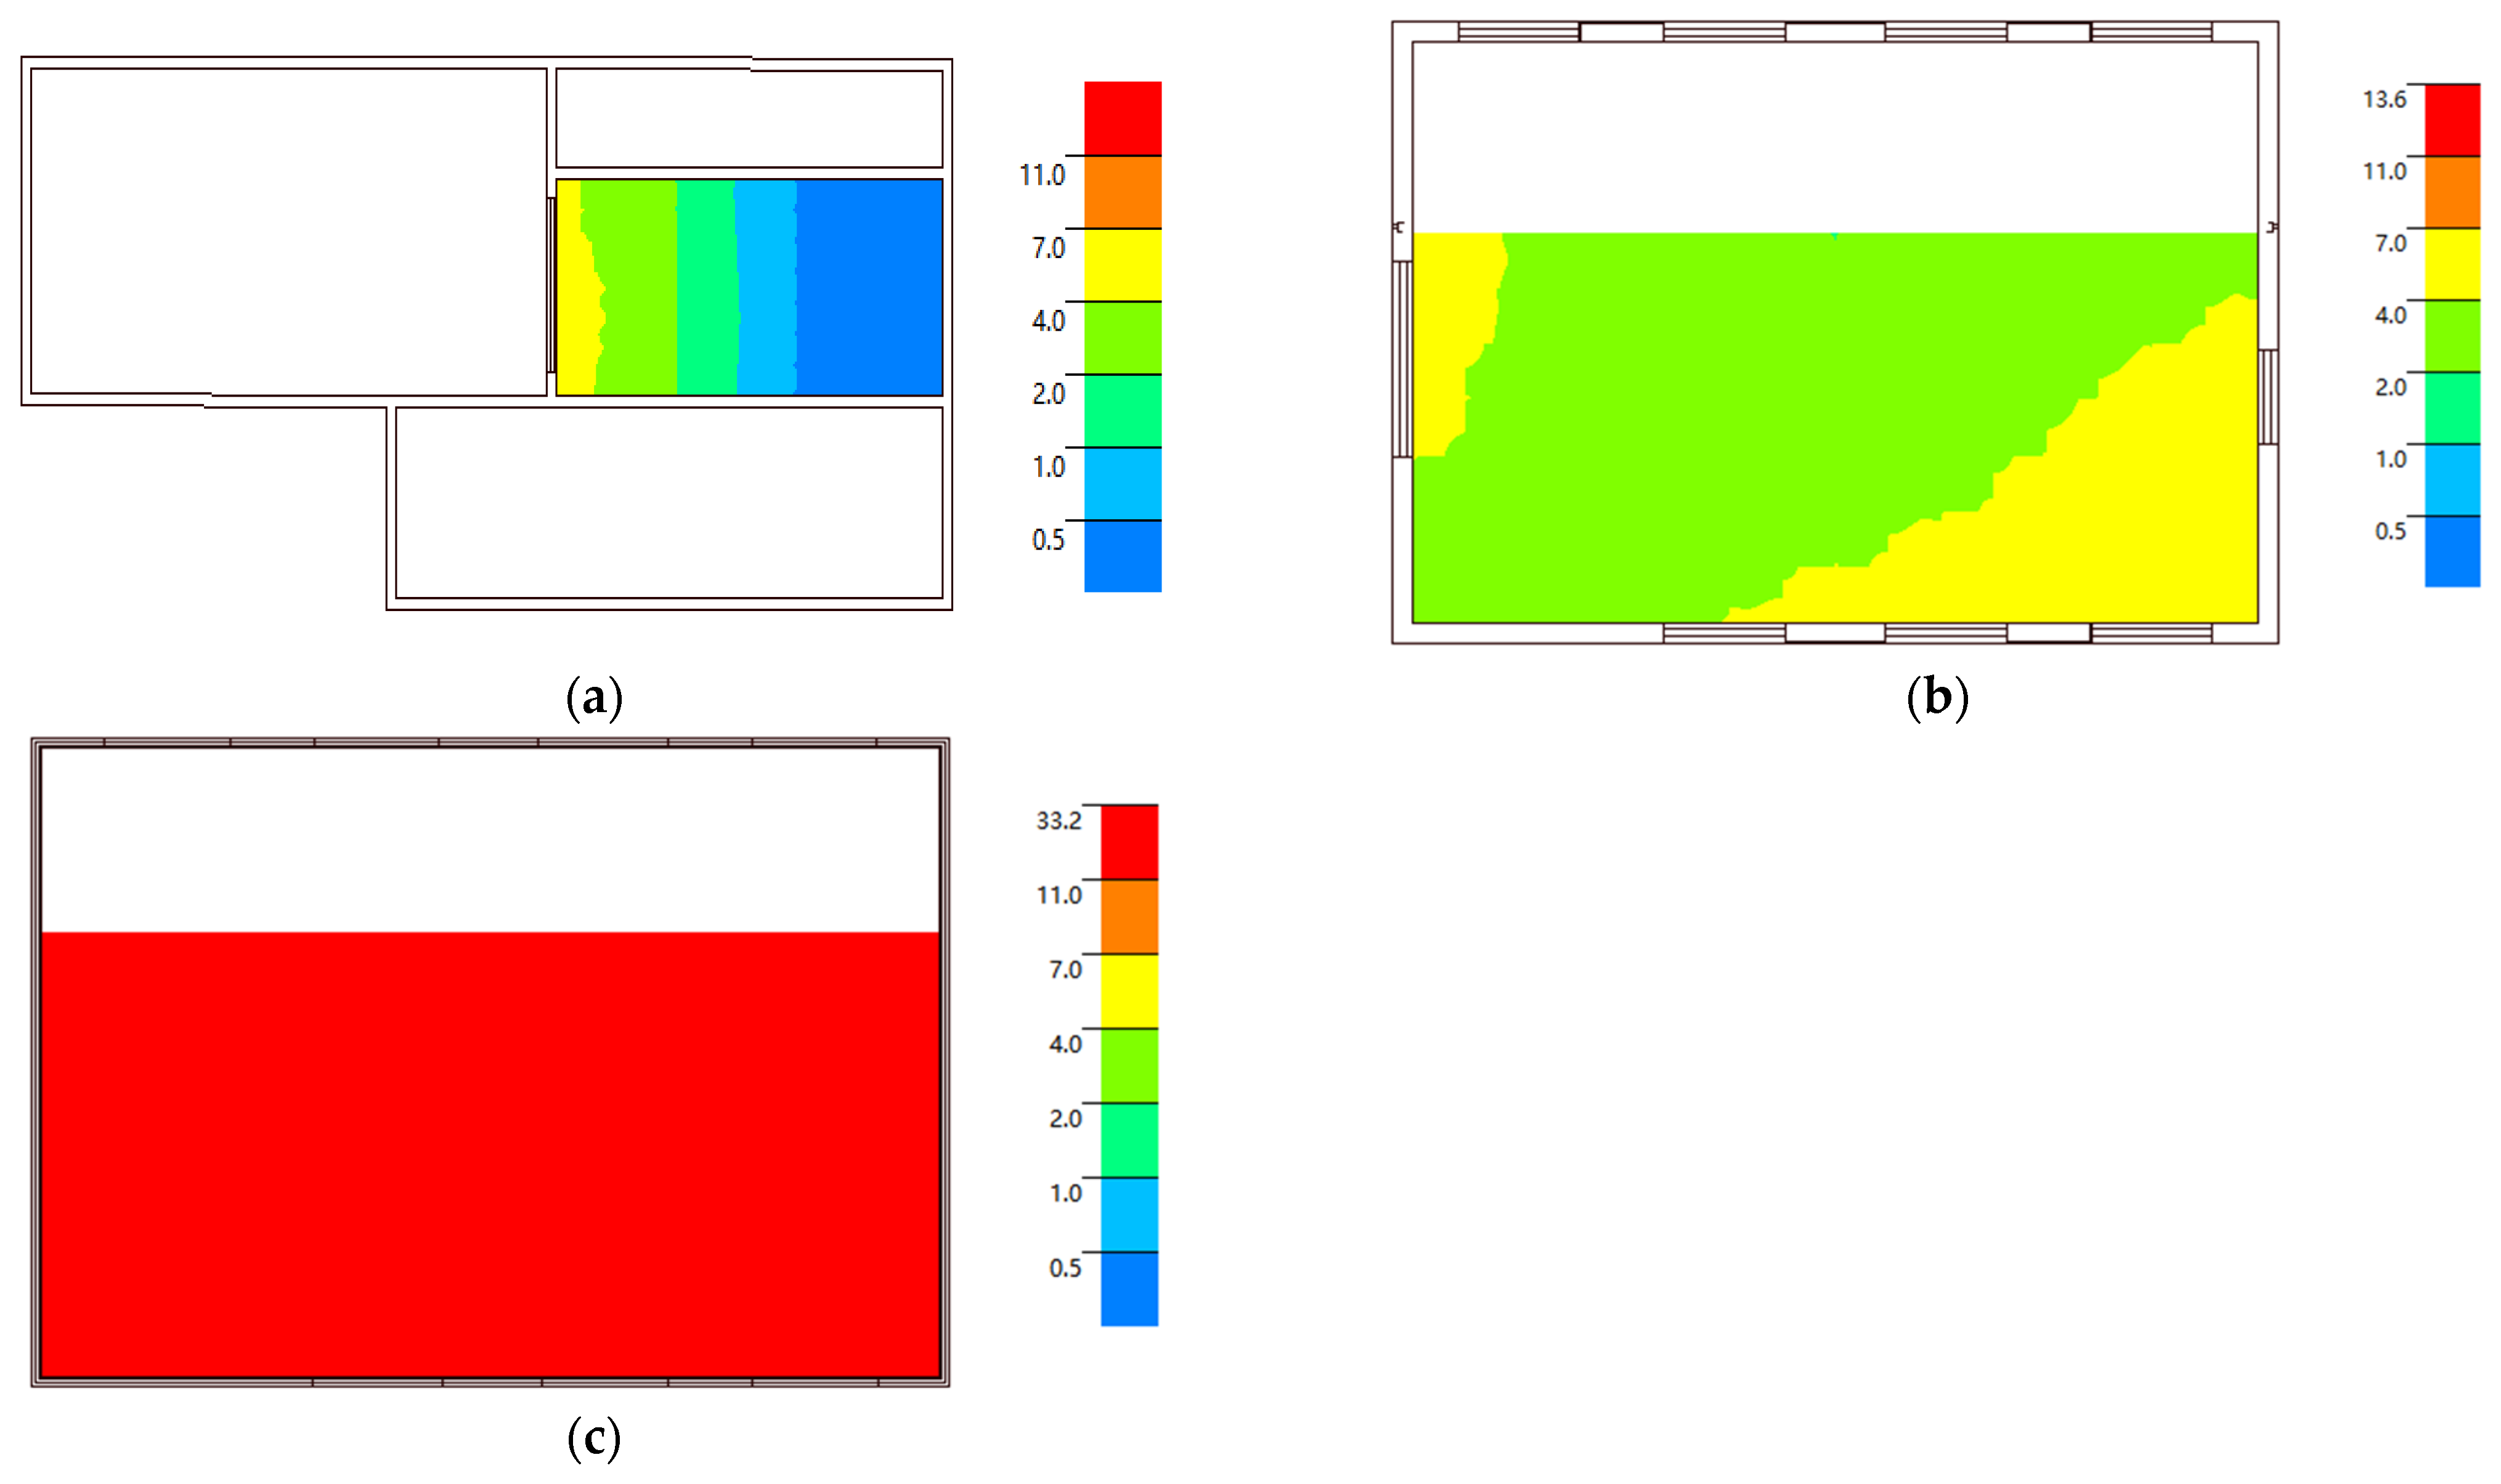
2.2.2. Natural Ventilation
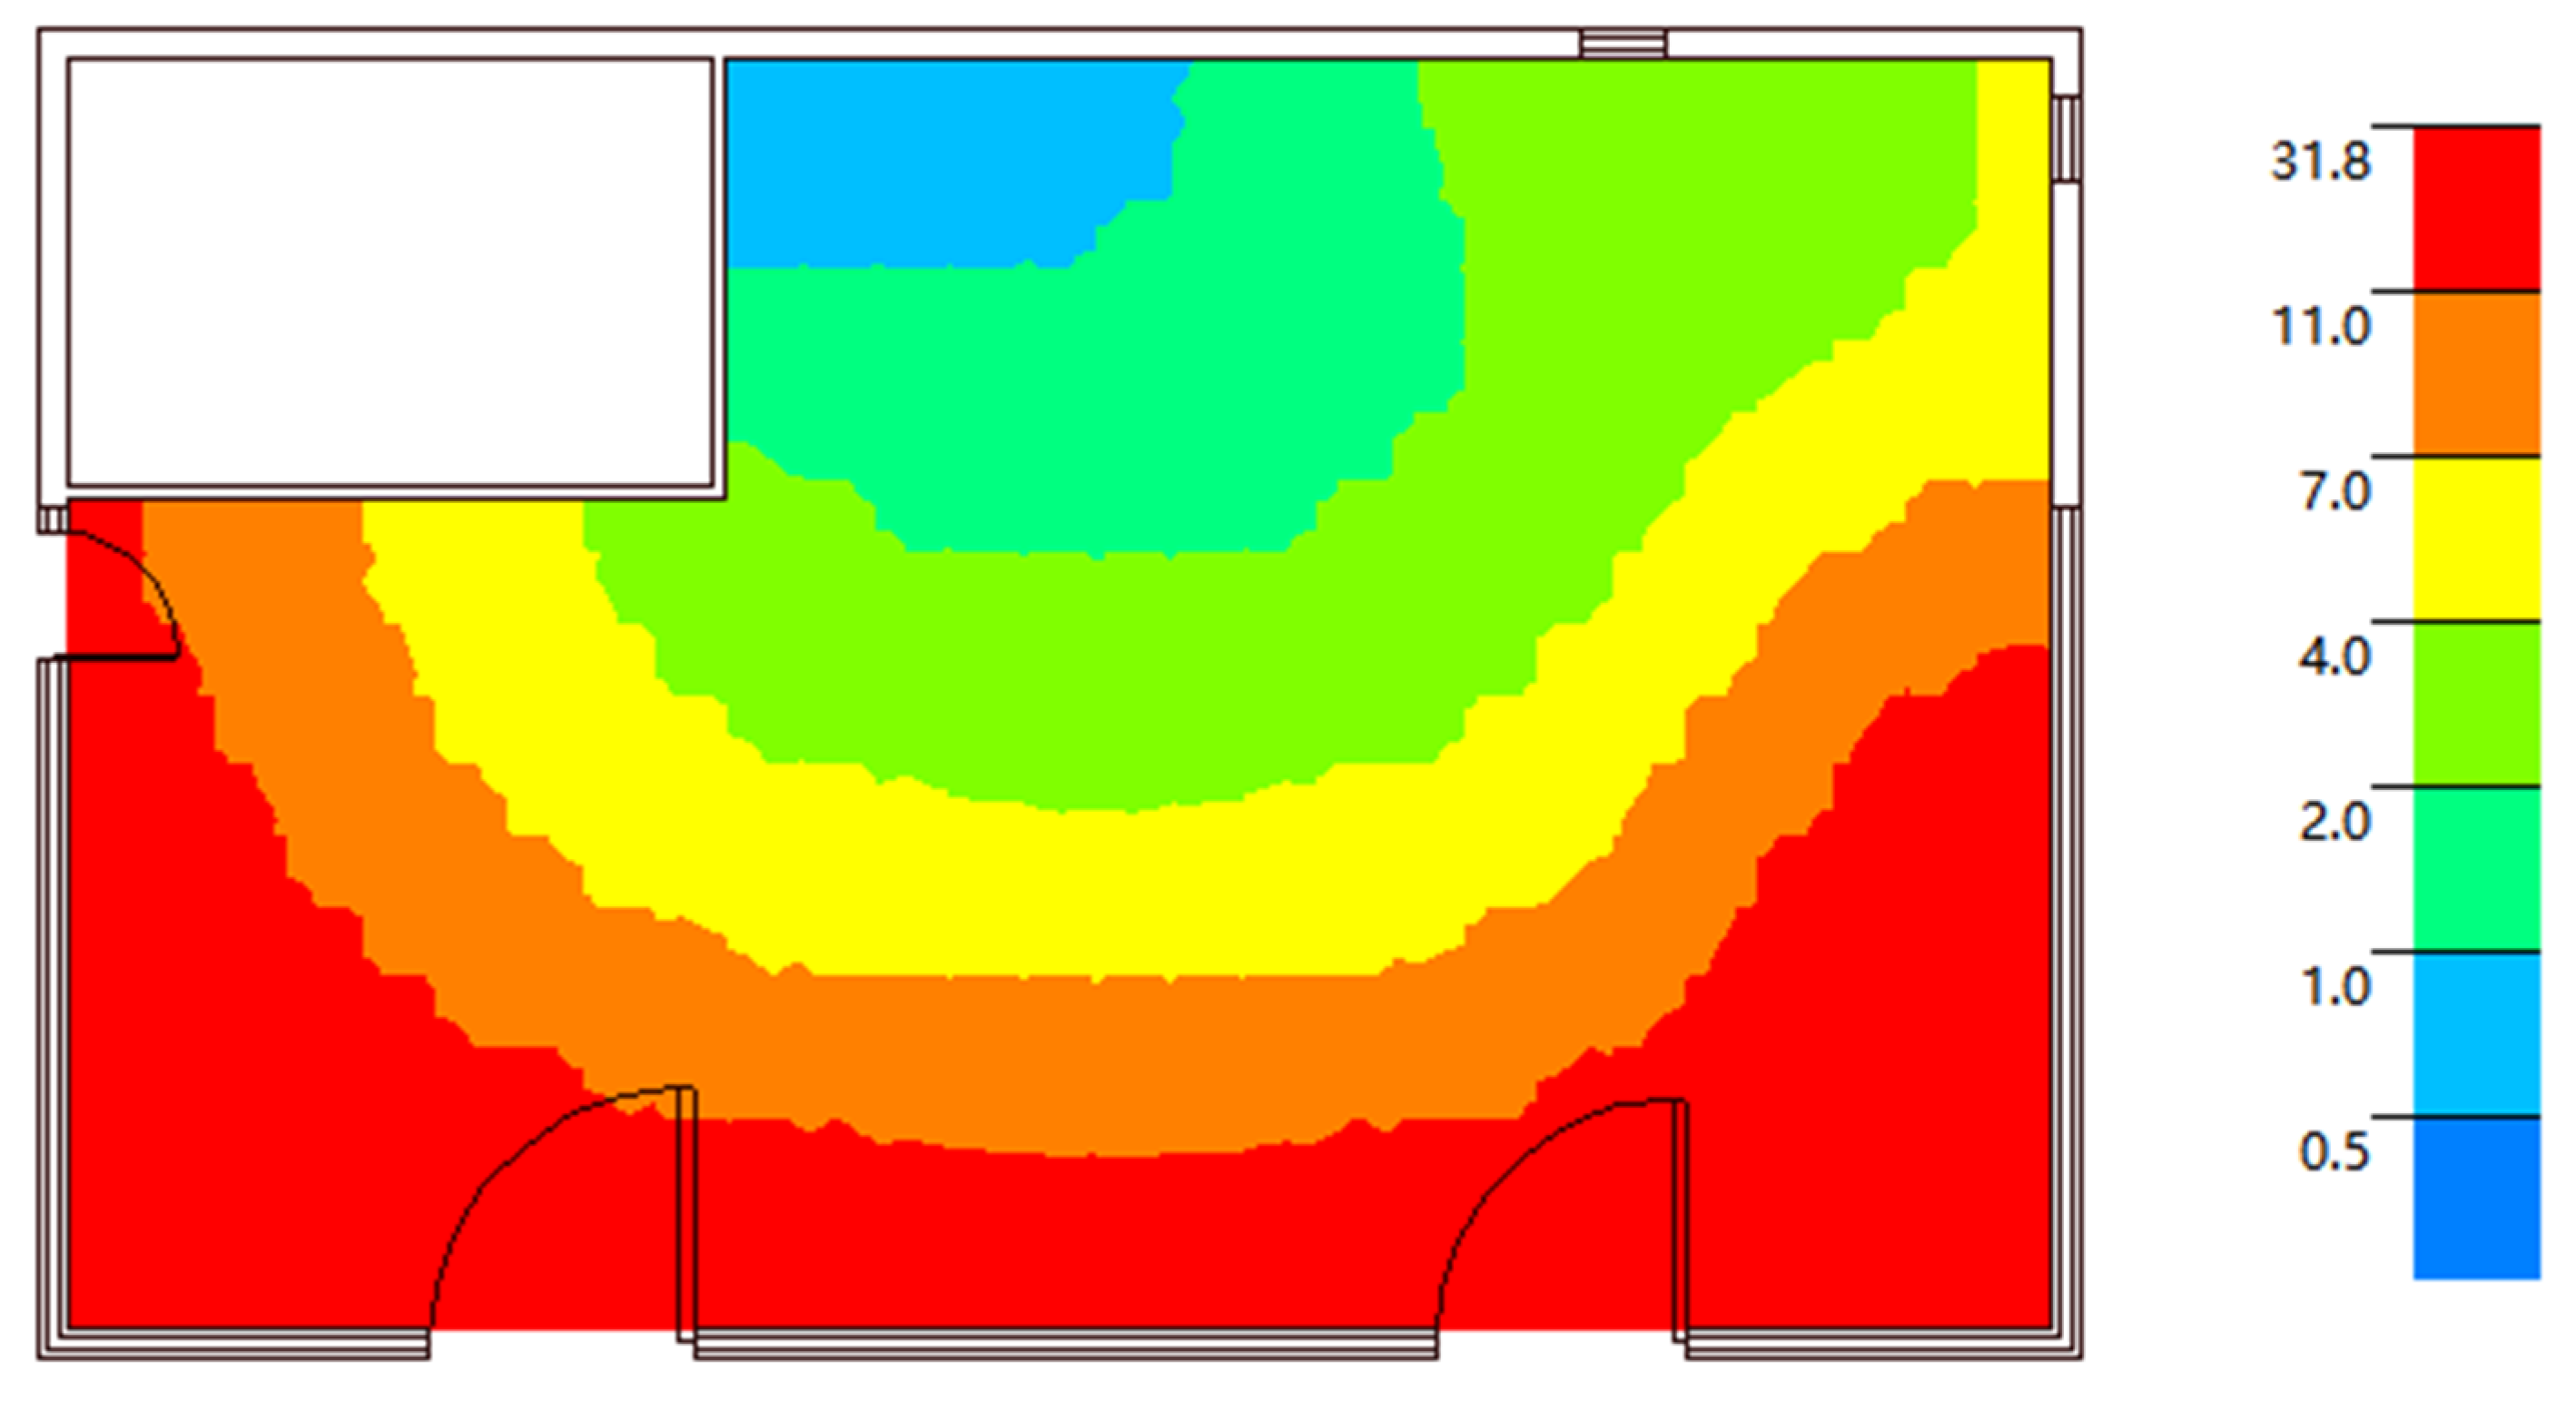
2.2.3. Daylighting
- The all-cloudy day calculation model CIE was adopted.
- Shanghai is in the IV photoclimatic zone, with a photoclimatic coefficient of K = 1.1.
- The outdoor natural light design illuminance value Es = 13,500 lx.
- Based on the construction drawing design instructions, the visible light transmittance of glass is 0.60.
- A plane at 0.75 m above the ground on each floor was selected as the natural lighting analysis surface.
2.2.4. High-Efficiency Air Conditioning Equipment
2.2.5. Volume Ratio of Green Plants
2.2.6. Green Building Materials
2.2.7. PEDF System
2.2.8. Smart Management Platform
- Intelligent control of major energy-consuming devices, monitoring of energy consumption behavior, identification of energy consumption loopholes, and provision of abnormal alarms.
- Assurance of stable operation of the photovoltaic power generation system, continuous monitoring, and abnormal alarm of photovoltaic power generation capacity, actual electricity consumption, and operation status.
- Optimization and adjustment of the electricity consumption of the PEDF system to effectively achieve demand-side management, eliminate the daily peak and valley price difference, balance user electricity load, and reduce user costs.
- Capability to monitor and display the operating status of building energy consumption, statistical parameters such as energy consumption and energy-saving rate, and automated generation of energy consumption reports and related reports. All energy-consuming equipment adopted itemized and graded measurement, and water-saving appliances were equipped with ultrasonic remote water meters to facilitate the itemized and graded measurement of water consumption.
2.2.9. Energy Consumption Simulation
- Meteorological parameters are selected in accordance with the existing standard, “Building Energy Efficiency Meteorological Parameter Standard” JGJ/T 346-2014 [37].
- The range for calculating annual heating and cooling consumption should encompass heat loss from the enclosure and heat (or cold) demand for processing fresh air. Heat (or cold) demanded for processing fresh air should be deducted from heat (or cold) recovered from exhaust air.
- For calculating domestic hot water energy consumption, its hot water consumption index must meet the requirements of the current national standard, “Water Saving Design Standard for Civil Buildings” GB50555-2010 [38].
- The primary energy consumption index range includes heating, air conditioning, lighting, domestic hot water, and elevator energy consumption, which can incorporate the renewable energy supply. The conversion coefficient of various energy types and primary energy should align with the “Technical Standards for Buildings with Near Zero Energy Consumption” GB/T 51350-2019 [29].
- The energy consumption calculation for the heating, ventilation, and air conditioning system should account for the effects of partial load and intermittent use.
- The calculation of lighting energy consumption can account for the influence of daylight and automatic control.
- The use of renewable energy should be calculated.
2.3. Calculation Method for Building Carbon Emissions
- Direct carbon emissions from buildings refer to carbon emissions resulting from direct fossil fuel consumption during the operational phase, primarily generated by cooking, hot water use, and decentralized heating within the building.
- Indirect carbon emissions from buildings refer to carbon emissions from two secondary energy sources, electricity and heat, consumed during the operational phase, which constitute the main sources of carbon emissions from building operations.
- Implicit carbon emissions from buildings refer to carbon emissions generated by building construction and building material production, also known as built-up carbon emissions.
2.3.1. Accounting System Boundary and Data Selection
2.3.2. Calculation Method for Life Cycle Carbon Emissions
- Implicit carbon in the production phase of building materials
- 2.
- Implicit carbon during the construction phase
- 3.
- Implicit carbon during the operation phase of buildings
- 4.
- Operating carbon during the operation phase of buildings
- 5.
- Implicit carbon during the scrapping phase of buildings
- (1)
- Carbon emissions during the demolition phase of buildings
- (2)
- Carbon emissions from waste disposal
- 6.
- Net carbon emissions, including carbon offsetting measures
3. Results and Discussion
3.1. Analysis of Carbon Emissions in the Life Cycle of Buildings
3.1.1. Analysis of Implicit Carbon Emissions in Buildings
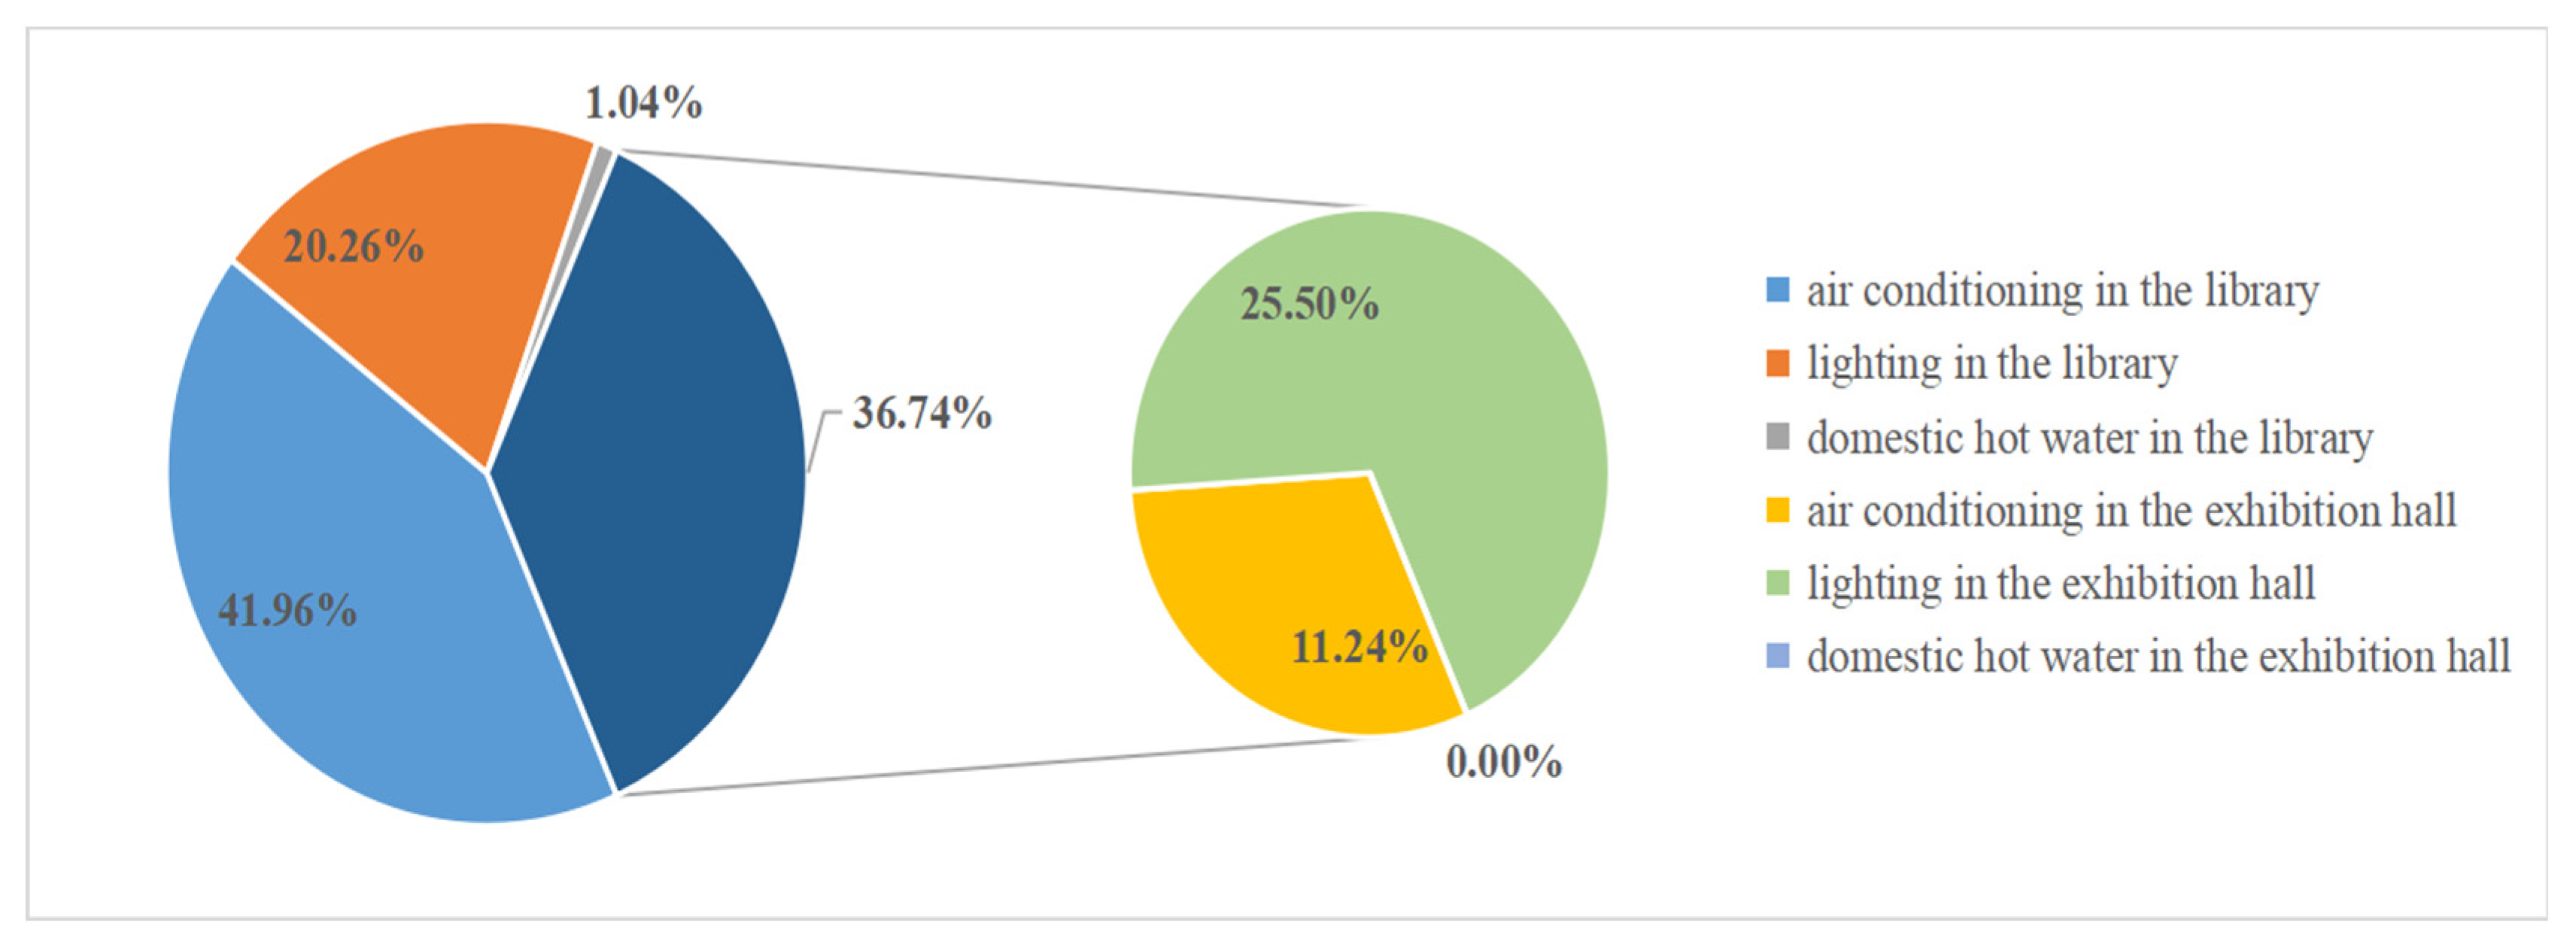
3.1.2. Analysis of Carbon Emissions of Building Operation
3.2. Analysis of Carbon Offsetting Measures of the Life Cycle for Buildings
3.2.1. Analysis of Emission Reductions Using Carbon Offsetting Measures
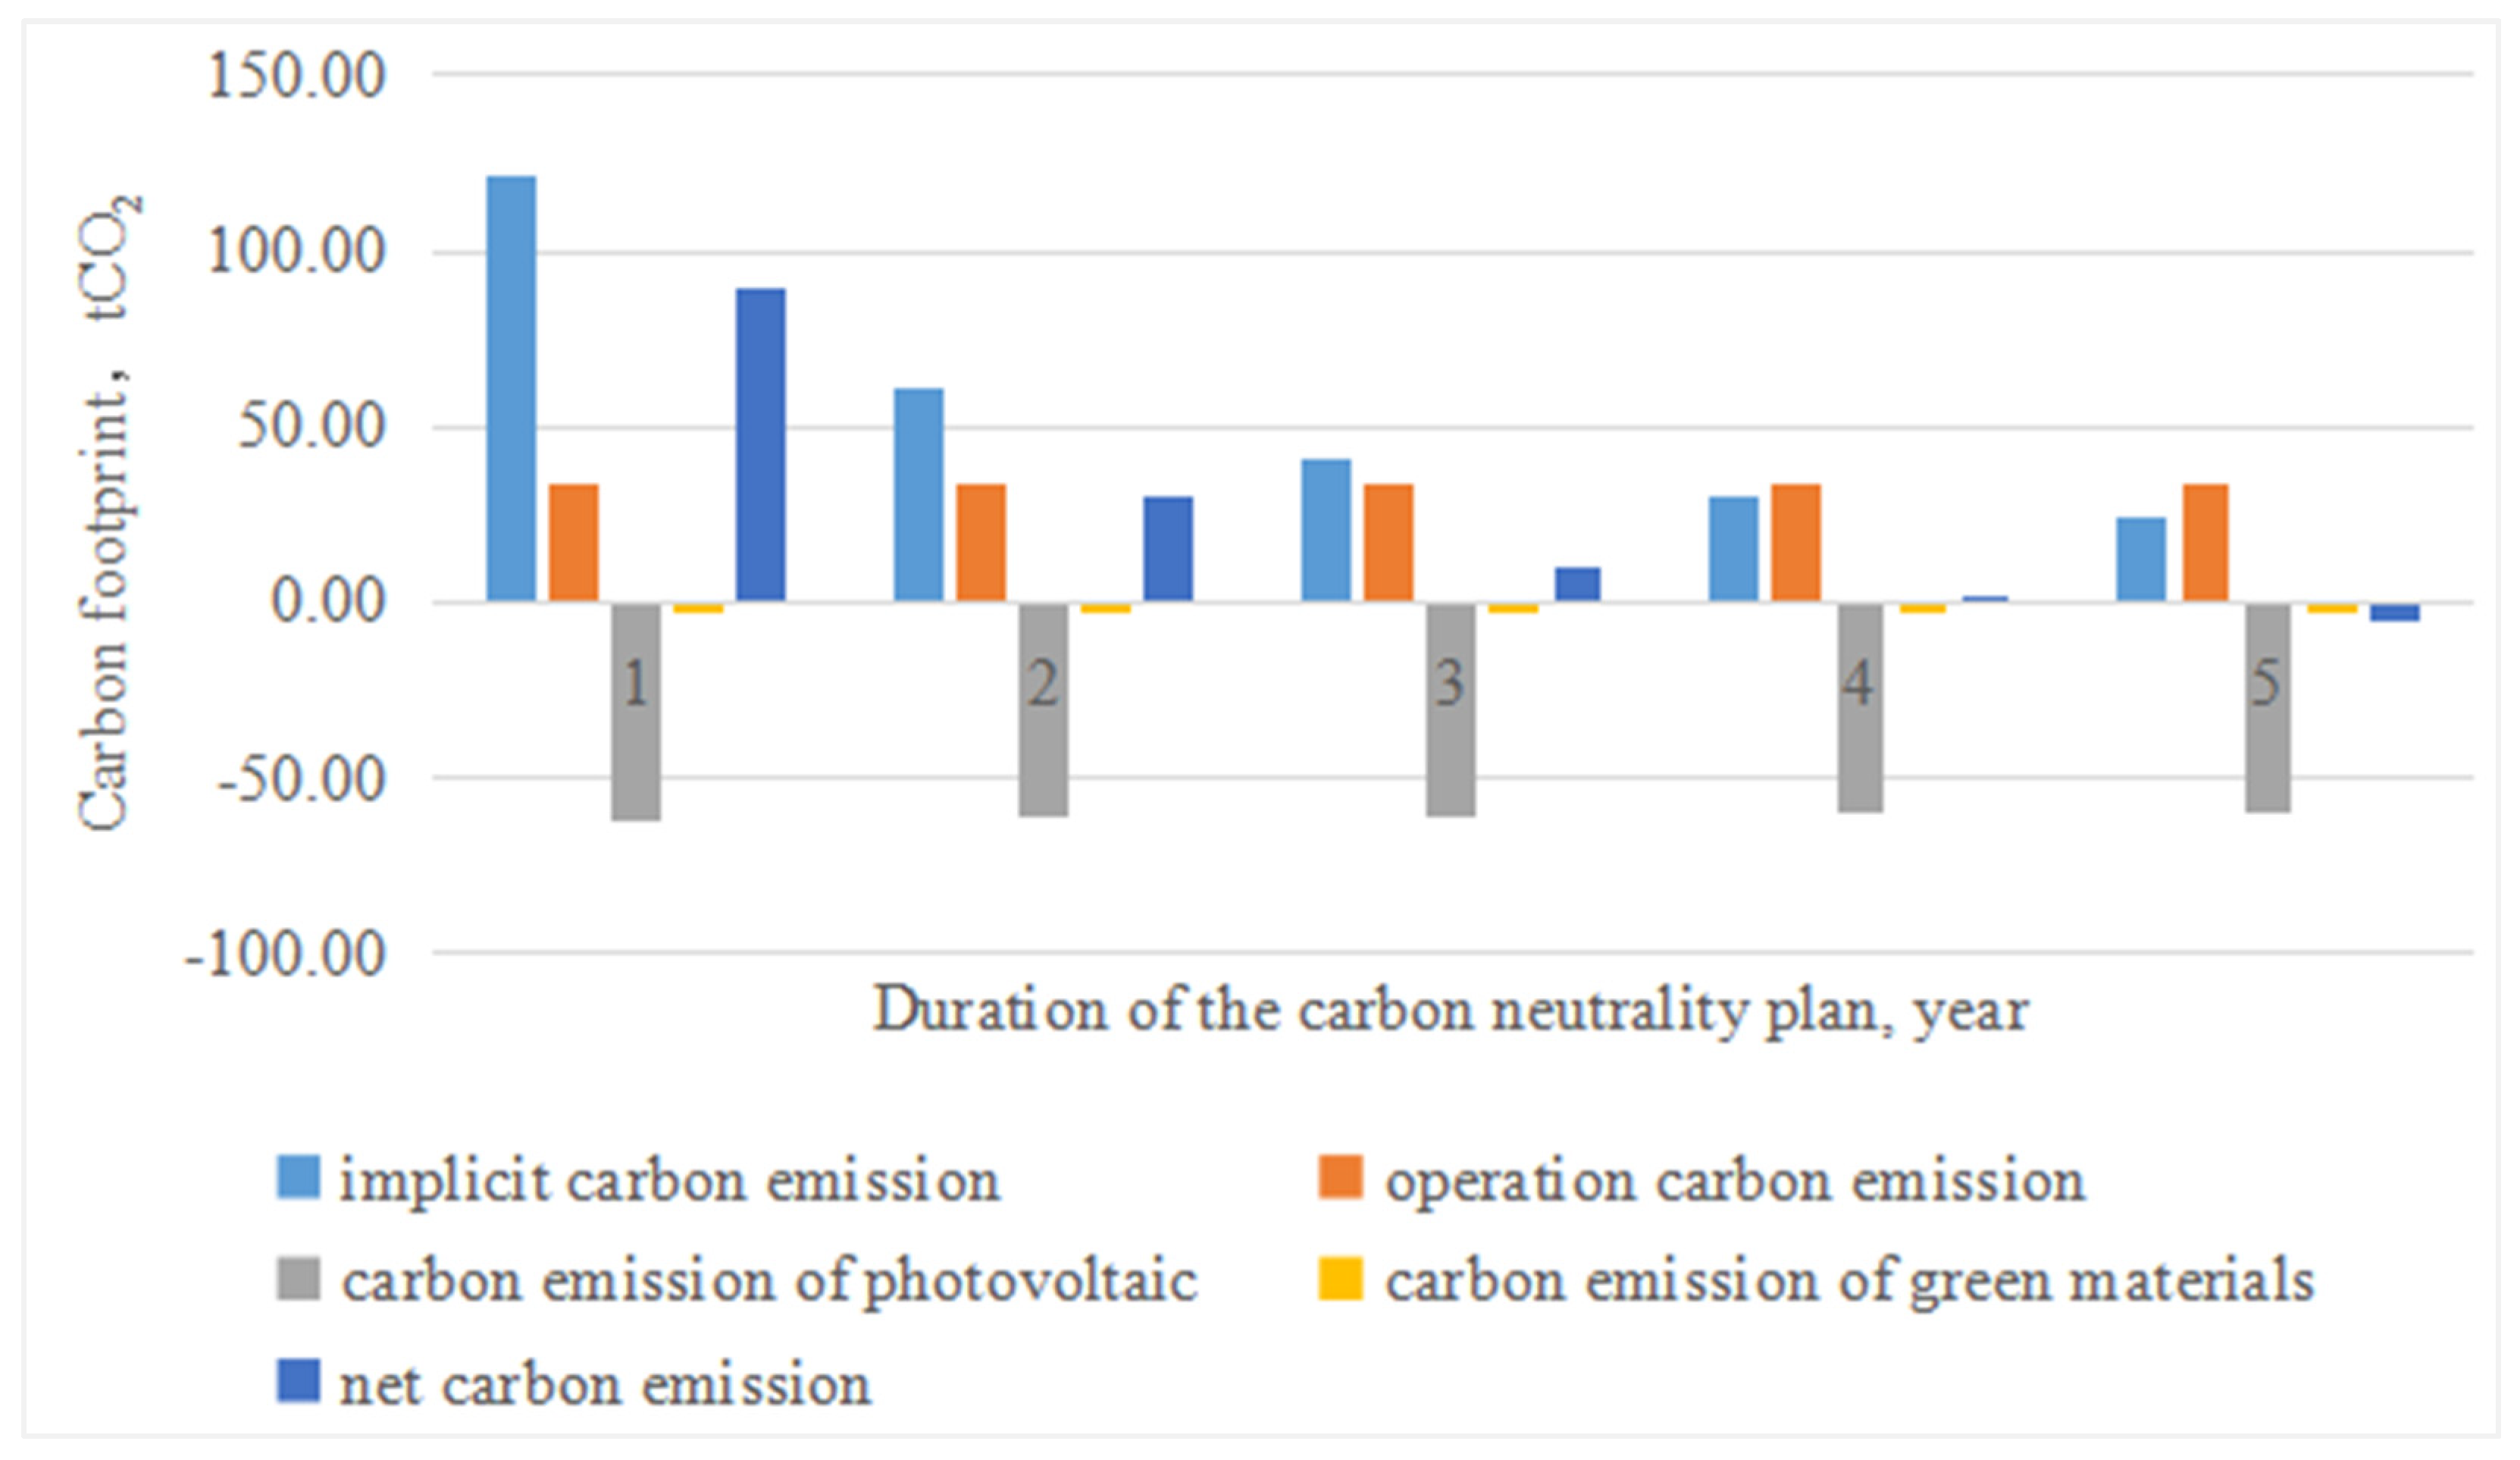
3.2.2. Carbon Neutrality Analysis of Buildings
3.3. Analysis of Building Economic Benefits
3.4. Realization Path of Rural Carbon Neutrality Buildings
4. Conclusions
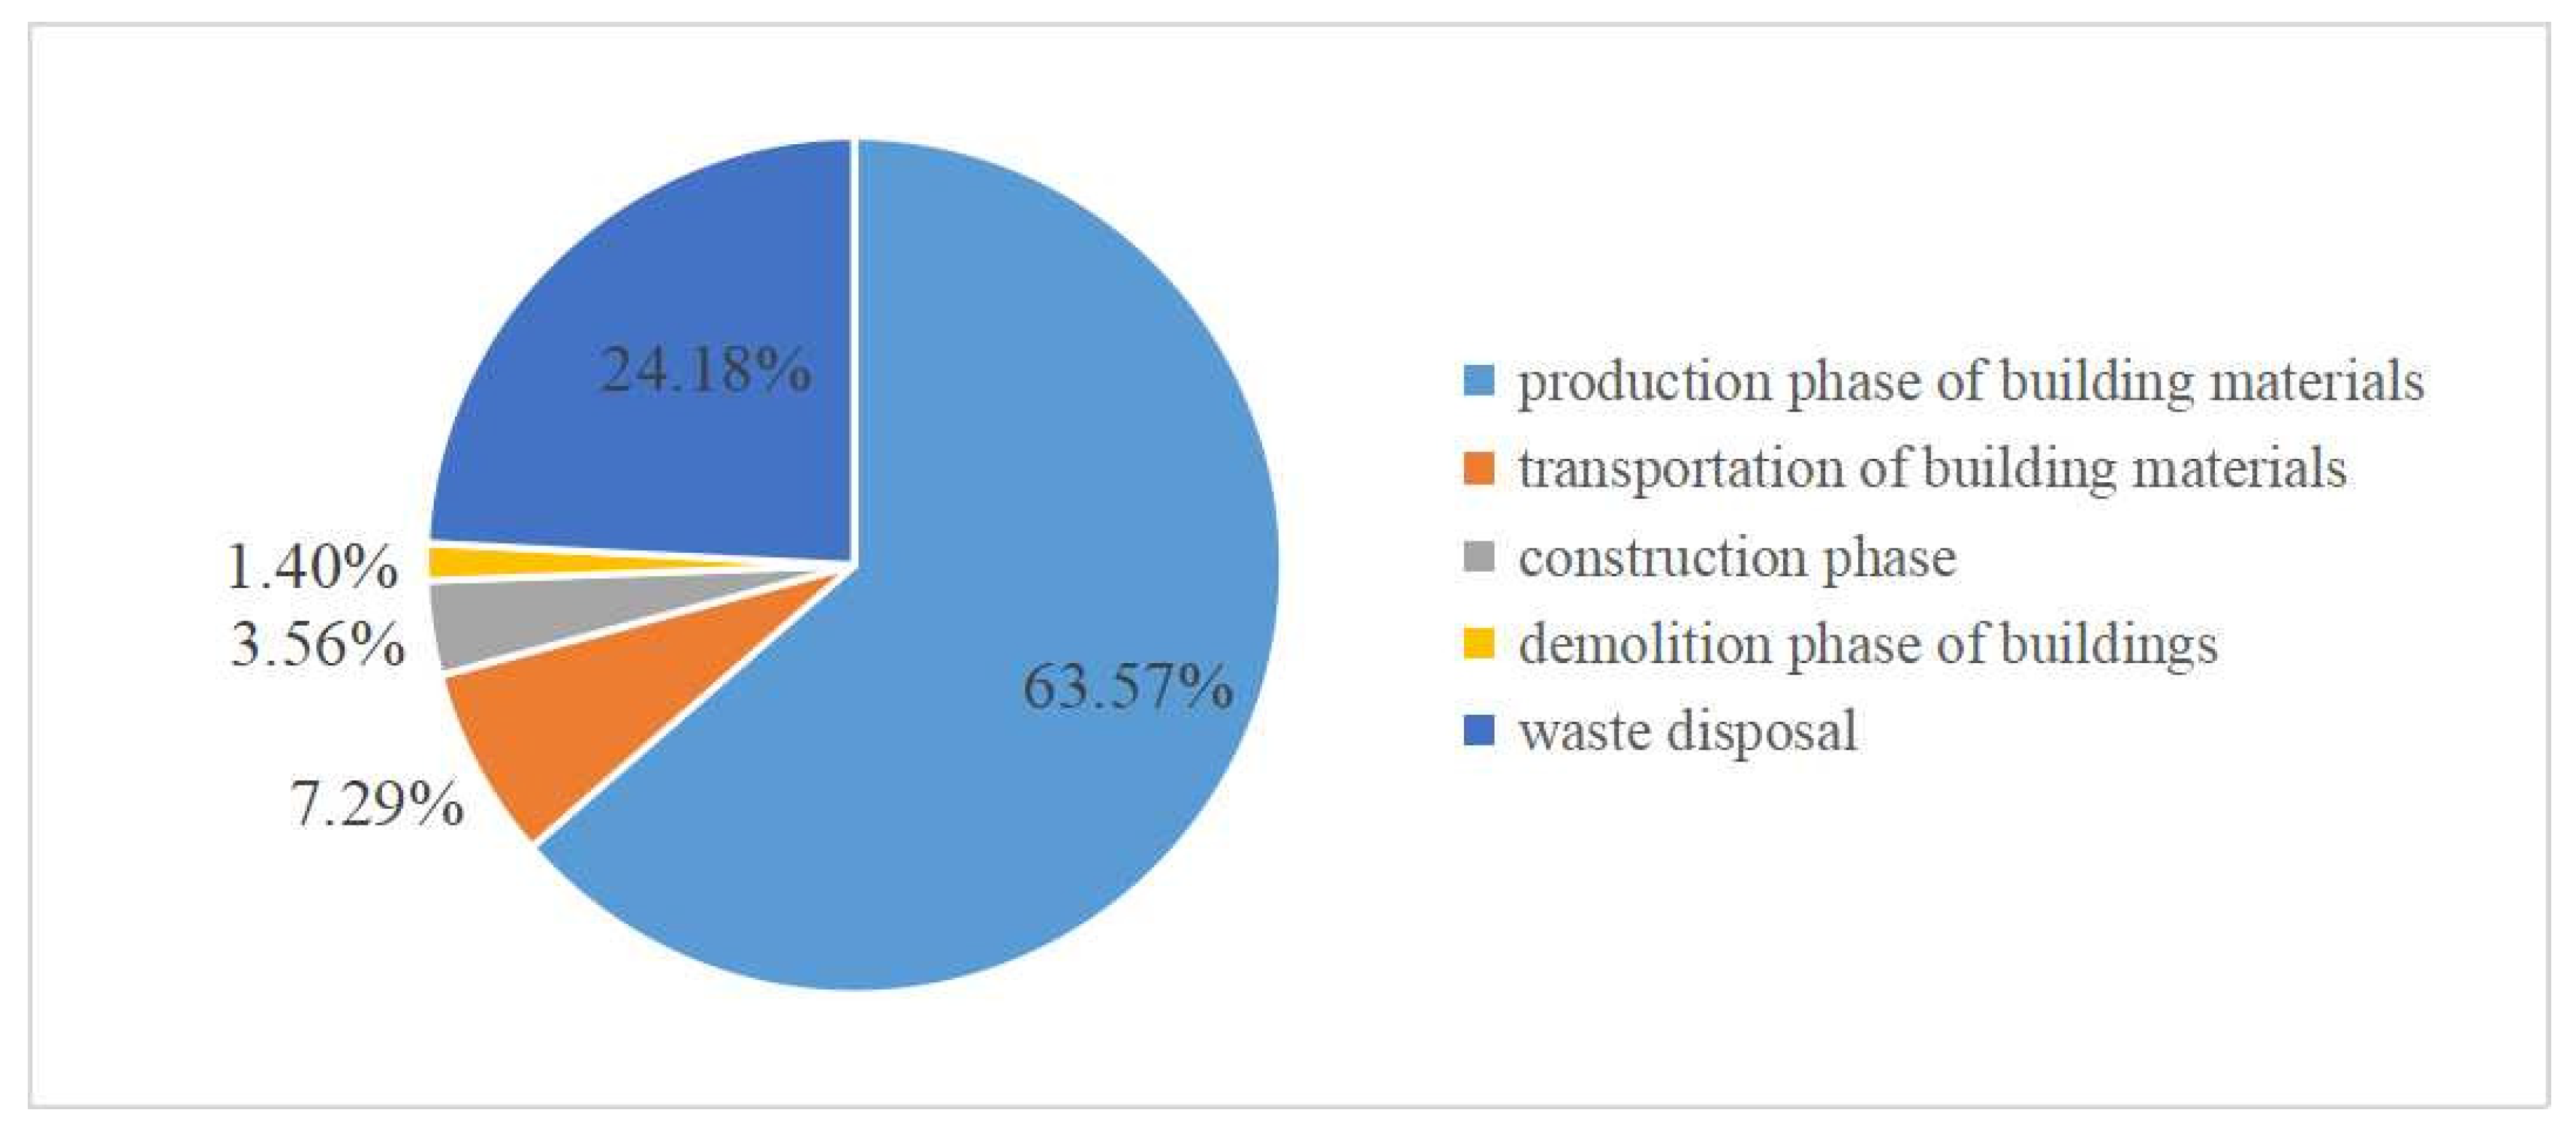
- (1)
- The implicit carbon emissions of buildings were 120.91 t, with the carbon emissions of the building materials production phase accounting for the highest proportion at 63.57%. The energy consumption during the operational phase of the building was 64,284.4 kWh/year, corresponding to 33.72 tCO2. The carbon emissions from library air conditioning accounted for the highest percentage, at 41.96%.
- (2)
- By applying carbon offset measures, including light storage, PEDF, and green building materials, the building can achieve carbon neutrality by the fifth year of operation, with a net total of −5.58 tCO2 by the end of its use.
- (3)
- When the peak electricity price of buildings was 1.2064 yuan/kWh, the payback period for photovoltaic power generation was about seven years. When the peak electricity price was 0.9014 yuan/kWh, the payback period for photovoltaic power generation investment was nine years. The cost-effectiveness ratios of the two scenarios reached 14.33% and 10.70%, respectively, and the annual operating costs saved were 143,266.33 yuan and 10,704,598 yuan, respectively, indicating significant economic benefits.
- (4)
- This study assesses the carbon reduction potential of combining multiple carbon-neutral technologies by calculating the carbon emissions of buildings throughout their life cycle. It provides a valuable reference for the design of rural carbon-neutral buildings. The potential for promoting carbon-neutral buildings in rural areas of China is demonstrated through the analysis of the economic benefits of carbon-neutral buildings. However, since this research only considered specific carbon offset measures, further evaluation will be needed in the future. This should include examining the carbon emission characteristics of carbon-neutral buildings over a longer life cycle.
Author Contributions
Funding
Data Availability Statement
Conflicts of Interest
References
- Nwodo, M.N.; Anumba, C.J. A review of life cycle assessment of buildings using a systematic approach. Build. Environ. 2019, 162, 10629. [Google Scholar] [CrossRef]
- Fan, C.; Xiao, F.; Yan, D. Advanced data analytics for building energy modeling and management. Build. Simul. 2020, 14, 1–2. [Google Scholar] [CrossRef]
- China Association of Building Energy Efficiency. China Building Energy Consumption Annual Report 2020. J. Build. Energy Effic. 2021, 49, 1–6. [Google Scholar]
- Jiang, Y.; Hu, S. Paths to carbon neutrality in China’s building sector. Heat. Vent. Air Cond. 2021, 51, 1–13. [Google Scholar]
- Roose, B. Perovskite Solar Cells. Energies 2022, 15, 6399. [Google Scholar] [CrossRef]
- Chan, M.; Masrom, A.N.; Yasin, S.S. Selection of Low-Carbon Building Materials in Construction Projects: Construction Professionals’ Perspectives. Buildings 2022, 12, 486. [Google Scholar] [CrossRef]
- Pillai, D.S.; Shabunko, V.; Krishna, A.A. comprehensive review on building integrated photovoltaic systems: Emphasis to technological advancements, outdoor testing, and predictive maintenance. Renew. Sustain. Energy Rev. 2022, 156, 111946. [Google Scholar] [CrossRef]
- Zakariyyah, K.I.; John, I.B.; Ijaola, I.A. Cultural orientations and strategic capability for the adoption of building information modeling in construction firms. Eng. Rep. 2021, 3, 12417. [Google Scholar] [CrossRef]
- Bonoli, A.; Zanni, S.; Serrano-Bernardo, F. Sustainability in Building and Construction within the Framework of Circular Cities and European New Green Deal. Contrib. Concr. Recycl. Sustain. 2021, 13, 2139. [Google Scholar]
- Yamaguchi, Y.; Shoda, Y.; Yoshizawa, S.; Imai, T.; Perwez, U.; Shimoda, Y.; Hayashi, Y. Feasibility assessment of net zero-energy transformation of building stock using integrated synthetic population, building stock, and power distribution network framework. Appl. Energy 2023, 333, 120568. [Google Scholar] [CrossRef]
- Perwez, U.; Shono, K.; Yamaguchi, Y.; Shimoda, Y. Multi-scale UBEM-BIPV coupled approach for the assessment of carbon neutrality of commercial building stock. Energy Build. 2023, 291, 113086. [Google Scholar] [CrossRef]
- Yang, Y. Research on Multienergy Complementary System of Rural Buildings in Hanzhong City under Carbon Emission Constraints. Ph.D. Thesis, Xi’an University of Architecture and Technology, Xi’an, China, 2022. [Google Scholar] [CrossRef]
- Shi, C. Research on the construction of energy-saving and land-saving housing in modern countryside. Constr. Econ. 2007, 7, 216–218. (In Chinese) [Google Scholar]
- Jiang, Y. Rural new energy system: The first step of the distributed revolution. Rural Areas Agric. Farmers A 2020, 529, 41–43. [Google Scholar]
- Shehata, N.; Mohamed, O.; Sayed, E.T.; Abdelkareem, M.A.; Olabi, A. Geopolymer concrete as green building materials: Recent applications, sustainable development and circular economy potentials. Sci. Total Environ. 2022, 836, 155577. [Google Scholar] [CrossRef]
- Deng, Q.; Jiang, W.; Zhao, C.; Yang, Y.; Song, B. Performance testing of external wall thermal insulation system of near zero energy consumption building. Build. Energy Effic. 2018, 46, 13–18. [Google Scholar]
- Yang, J.; Wu, J.; Xian, T.; Zhang, H.; Li, X. Research on energy-saving optimization of commercial central air-conditioning based on data mining algorithm. Energy Build. 2022, 272, 112326. [Google Scholar] [CrossRef]
- Chen, Q. Research on Energy Conservation of Passive House in Shandong District. Ph.D. Thesis, Shandong Jianzhu University, Jinan, China, 2016. [Google Scholar]
- Charlie, D.; Zuo, C.; Jia, Y.; Jiang, L.; Zheng, L. Analysis on development potential of rooftop distributed PV power generation of rural residential dwellings in China. Sol. Energy 2023, 01, 5–16. [Google Scholar]
- Zhao, W.H. Analysis on the realization path of rural low carbon housing. Agric. Technol. 2023, 43, 67–70. [Google Scholar]
- Xiaohua, L.; Tao, Z.; Xiaochen, L.; Yi, J. Rethinking of the building energy system towards the carbon neutral targe. Chin. J. Theor. Appl. Mech. 2023, 55, 699–709. [Google Scholar]
- Li, H.; Liu, F.; Li, J. Electric Power Development Situation in 2020 and Outlook for 2021 in China. Energy China 2021, 3, 113324. [Google Scholar]
- Jiang, Y. PSDF (photovoltaic, Storage, DC, flexible)—A new type of building power distribution system for zero carbon power system. Heat. Vent. Air Cond. 2021, 51, 1–12. [Google Scholar]
- Liu, X.; Liu, X.; Jiang, Y.; Zhang, T.; Hao, B. Development statuses and research prospects of PEDF (photovoltaics, energy storage, direct current and flexibility) building energy systems. Heat. Vent. Air Cond. 2022, 52, 1–9. [Google Scholar]
- Chao, Z.; Lei, W.; Jingjing, H.; Hantong, C.; Guocheng, H.; Shida, Z.; Hong, L. Feasibility analysis of PV and energy storage system integration for flexible distribution networks: A moment-based distributionally robust approach. Energy Rep. 2023, 9 (Suppl. 3), 89–98. [Google Scholar]
- Li, Q.J.; Mo, T.Z.; Yang, L.L. Energy Efficiency Analysis Software for Chongqing Construction. Build. Energy Effic. 2011, 39, 67–70+80. [Google Scholar]
- GB50176-2016; Code for Thermal Design of Civil Building. China Planning Press: Beijing, China, 2016.
- Li, J.J. Research on Green Ecological Design and Technology Strategy of Buildings for the Aged in Sunan Region. Ph.D. Thesis, Southeast University, Nanjing, China, 2017. [Google Scholar]
- GB/T 51350-2019; Technical Standard for Nearly Zero Energy Buildings. China Architecture and Building Press: Beijing, China, 2019.
- Guo, W. Study on The Optimization Design of Natural Lighting in Teaching Building of Colleges and Universities in Xuzhou Area Based on Dynamic Light Environment Analysis. Ph.D. Thesis, China University of Mining and Technology, Xuzhou, China, 2022. [Google Scholar]
- GB50033-2013; Standard for Daylighting Design of Buildings. China Architecture and Building Press: Beijing, China, 2013.
- JGJ/T 449-2018; Standard for Green Performance Calculation of Civil Buildings. China Architecture and Building Press: Beijing, China, 2018.
- GB 50189-2015; Design Standard for Energy Efficiency of Public Buildings. China Architecture and Building Press: Beijing, China, 2015.
- Lin, H.-T.; Lin, T.-P.; Tsay, Y.-S. Green Building Evaluation Manual. Basic Version; Architecture and Building Research Institute, Ministry of the Interior: Taipei, Taiwan, 2015. (In Chinese) [Google Scholar]
- Jiang, Y.W. Ecological Application Research on the volume ratio of green plants of Urban Green Space. Real Estate Guide 2022, 1, 190–192. [Google Scholar]
- Zhang, Z.J. Study on Low Energy Consumption Reconstruction Scheme of Tangshan Villa Building; Harbin Institute of Technology: Harbin, China, 2018. [Google Scholar]
- JGJ/T 346-2014; Standard for Weather Data of Building Energy Efficiency. China Architecture and Building Press: Beijing, China, 2014.
- GB50555-2010; Standard for Water Saving Design in Civil Building. China Architecture and Building Press: Beijing, China, 2010.
- Chang, L. Elizabeth Gasiorowski-Denis. Building a sustainable future with ISO 21930. China Qual. Stand. Rev. 2017, 9, 1. [Google Scholar]
- GB/T 51366-2019; Standard for Building Carbon Emission Calculation. China Architecture and Building Press: Beijing, China, 2019.
- Zhang, Y.S. Life Cycle Assessment on the Reduction of Carbon Dioxide Emission of Buildings; National Cheng Kung University: Tainan, Taiwan, 2002. [Google Scholar]
- Chinese Society for Urban Studies. Assessment Guideline for Carbon-Neutral Building; Chinese Society for Urban Studies: Beijing, China, 2022. [Google Scholar]
- Niu, K.Z.; Xue, D.H.; Li, J.X. Research on the Potential Calculation of Carbon Emission Reduction in the Application of Green Building Materials. Sichuan Build. Mater. 2022, 7, 48. [Google Scholar]
- Cui, H. Research on Carbon Emission and Emission Reduction Methods of Net Zero Energy Consumption Buildings. Ph.D. Thesis, Shenyang Jianzhu University, Shenyang, China, 2022. [Google Scholar]


| Position | National Standard Limit [27] | Library | Exhibition Hall | ||
|---|---|---|---|---|---|
| Heat Transfer Coefficient W (m2·K) | Heat Transfer Coefficient W (m2·K) | Increase Proportion | Heat Transfer Coefficient W (m2·K) | Increase Proportion | |
| Roof | 0.25 | 0.18 | 55% | 0.18 | 55% |
| Exterior wall | 0.70 | 0.18 | 77.5% | 0.17 | 78.75% |
| Exterior window | 1.8 | 1.3 | 40.91% | 1.3 | 40.91% |
| Conditions | The Total Area of the Main Functional Space (m2) | Room Area with Air Changes Greater than 2 Times/h (m2) | Percentage of Compliance |
|---|---|---|---|
| Spring/Autumn | 832.37 | 704.45 | 84.63% |
| Location | Material | The Reflectance of the Internal Surface |
|---|---|---|
| Ceiling | Recommended values in JGI/T 449 “Calculation Standard for Green Performance of Civil Buildings” | 0.75 |
| Wall | 0.60 | |
| Floor | 0.30 |
| Building | The Total Area of the Main Functional Space (m2) | Conforming Area (m2) | Percentage of Compliance |
|---|---|---|---|
| Library | 372.92 | 254.52 | 68.25% |
| Exhibition hall | 425.82 | 425.82 | 100% |
| Total | 798.74 | 680.34 | 85.17% |
| Types of Building Materials | Weight of Building Materials | Carbon Emission Factor | Carbon Emission (tCO2) | |
|---|---|---|---|---|
| Non-recyclable materials | Concrete | 127.75 m3 | 295 kgCO2/m3 | 37.69 |
| Building mortar | 290.43 t | 2.51 kgCO2/t | 0.73 | |
| Cement | 9.28 t | 735 kgCO2/t | 6.82 | |
| Brick | 30.32 m3 | 336 kgCO2/m3 | 10.19 | |
| Gravel | 143.07 t | 2.18 kgCO2/t | 0.31 | |
| Bamboo | 14.04 t | −1.43 tCO2/t | −20.08 | |
| Subtotal | 35.66 | |||
| Recyclable material | Steels | 43.735 t | 2365 kgCO2/t | 103.43 |
| Glass curtain wall | 8.65 t | 1130 kgCO2/t | 9.77 | |
| Subtotal | 113.2 | |||
| Total | 148.86 | |||
| Types of Building Materials | Weight of Building Materials | Transport Distance (km) | Transport Vehicles | Carbon Emission Factor (kgCO2/(t.km)) | Carbon Emission (tCO2) | |
|---|---|---|---|---|---|---|
| Non-recyclable materials | Concrete | 127.75 m3 | 250 | 30 t heavy truck | 0.078 | 6.23 |
| Building mortar | 290.43 t | 250 | 0.078 | 5.66 | ||
| Cement | 9.28 t | 250 | 0.078 | 0.18 | ||
| Brick | 30.32 m3 | 250 | 0.078 | 1.18 | ||
| Gravel | 143.07 t | 250 | 0.078 | 2.79 | ||
| Subtotal | 16.04 | |||||
| Recyclable material | Steels | 43.735 t | 250 | 30 t heavy truck | 0.078 | 0.85 |
| Glass curtain wall | 8.65 t | 250 | 0.078 | 0.17 | ||
| Subtotal | 1.02 | |||||
| Total | 17.06 | |||||
| Energy Category | Library- Exhibition Hall | Calorific Value (TJ) | Carbon Emission Factor (tCO2/TJ) or (tCO2/kWh) | Carbon Emission (tCO2) |
|---|---|---|---|---|
| Gasoline (kg) | 156.34 | 7.19 × 10³ | 67.91 | 0.49 |
| Diesel (kg) | 24.36 | 1.11 × 10³ | 72.59 | 0.08 |
| Electricity (kWh) | 14,844.08 | -- | 5.24 × 10⁻⁴ | 7.78 |
| Total | 8.34 | |||
| Building | Number of Floors of above Ground | Building Area (m2) | Carbon Emissions per Unit Area kgCO2/m2 | Carbon Emissions (tCO2) |
|---|---|---|---|---|
| Library | 3 | 959.83 | 2.19 | 2.10 |
| Exhibition hall | 1 | 566.57 | 2.07 | 1.17 |
| Total | 3.27 | |||
| Types of Building Materials | Weight of Building Materials | Carbon Emissions Factor | Carbon Emissions (tCO2) | Recovery Ratio | Energy Saving Carbon Emission (tCO2) | |
|---|---|---|---|---|---|---|
| Recyclable material | Steels | 43.735 t | 2365 (kgCO2/t) | 103.43 | 50% | 51.73 |
| Glass curtain wall Steels | 8.65 t | 1130 (kgCO2/t) | 9.77 | 50% | 4.89 | |
| Total | 16.04 | |||||
| System Category | Production of Building Materials | Construction | Usage | Scrap | Total |
|---|---|---|---|---|---|
| Carbon emissions (tCO2) | 148.86 | 25.4 | / | −53.35 | 120.91 |
| Building | Air Conditioning (kWh) | Lighting (kWh) | Domestic Hot Water (kWh) | Total (kWh) |
|---|---|---|---|---|
| Library | 26,965.38 | 13,025.64 | 660.36 | 40,651.38 |
| Exhibition hall | 7230.37 | 16,402.65 | 0 | 23,633.02 |
| Building | Air Conditioning Carbon Emissions (tCO2) | Lighting Carbon Emissions (tCO2) | Domestic Hot Water Carbon Emissions (tCO2) | Total Carbon Emissions (tCO2) |
|---|---|---|---|---|
| Library | 14.15 | 6.83 | 0.35 | 21.32 |
| Exhibition hall | 3.79 | 8.60 | 0 | 12.40 |
| Building | Total Energy Consumption (kWh) | Energy Consumption per Unit Area (kWh/m2) | Total Carbon Emissions (tCO2) | Carbon Emissions per Unit Area (kgCO2/m2) | Proportion (%) |
|---|---|---|---|---|---|
| Library | 40,651.38 | 42.35 | 21.32 | 22.21 | 63.23 |
| Exhibition hall | 23,633.02 | 41.71 | 12.40 | 21.89 | 36.77 |
| Total | 64,284.4 | 84.06 | 33.72 | 44.10 | / |
| Category | Carbon Neutrality Technical Measures | Unit-Price | General Building Technology | Unit-Price | Usage | Incremental Cost (Million) | |
|---|---|---|---|---|---|---|---|
| 1 | Passive technology | Roof energy-saving improvement | 1300 yuan/m3 | Ordinary roof | 400 yuan/m3 | 56.22 m3 | 5.06 |
| 2 | Energy-saving improvement of exterior walls | 1300 yuan/m3 | Ordinary exterior wall | 400 yuan/m3 | 79.27 m3 | 7.13 | |
| 3 | Energy-saving improvement of external windows | 285 yuan/m2 | Ordinary exterior window | 260 yuan/m3 | 745.6 m2 | 1.86 | |
| 4 | Active sunshade | 400 yuan/m2 | -- | 0 | 352.79 m2 | 14.11 | |
| 5 | Light guide tube | yuan/piece | -- | 0 | 4 piece | 4.00 | |
| 6 | Unpowered hood | 160 yuan/piece | -- | 0 | 4 piece | 0.06 | |
| 7 | Ceiling fan | 400 yuan/piece | -- | 0 | 4 piece | 0.16 | |
| 8 | Equipment energy efficiency improvement | High energy efficiency air-cooled heat pump unit | 100 yuan/kW | Level 3 energy-efficient air conditioning | 50 yuan/kW | 188.4 KW | 0.94 |
| 9 | Energy-efficient multi-line system | 100 yuan/kW | 50 yuan/kW | 121.8 KW | 0.61 | ||
| 10 | Photovoltaic equipment | Roof monocrystalline silicon photovoltaic power generation system | 40.94 | -- | 0 | 1 set | 40.94 |
| 11 | Optimize energy storage and flexible distribution | 70 | -- | 0 | 1 set | 70 | |
| 12 | Intelligent control | Unmanned intelligent control platform | -- | -- | 60 | ||
| Total incremental cost (million) | 204.88 | ||||||
| Total building area (m2) | 1622.80 | ||||||
| Incremental cost per unit area (yuan/m2) | 1262.51 | ||||||
| Phase | Classification | Specific Path |
|---|---|---|
| Production phase | Decarbonization of traditional building materials | Optimize process flow, raw material substitution, CCUS technology |
| Application of low-carbon building materials | Natural wood, low-carbon concrete, new carbon fixing materials | |
| Decarbonization of building materials transportation | Transportation electrification and new energy substitution | |
| Construction phase | Intelligent construction | Comprehensive application of BIM, technology, robot replacement |
| Prefabricated technology | Steel structure, PC structure, and wooden structure | |
| “Four Sections and One Environmental Protection” | Energy saving, land saving, material saving, water saving, and environmental protection | |
| Operation phase | Low carbon design of buildings | Passive design |
| Renewable energy utilization | Building photovoltaic integration, geothermal energy, wind energy | |
| Building energy efficiency improvement | Energy efficiency improvement of lighting and air conditioning equipment, energy system management | |
| Demolition phase | Building recycling | Research on recycled materials, industrialization of construction waste |
| Optimization of the demolition plan | Disassembly method and technology |
Disclaimer/Publisher’s Note: The statements, opinions and data contained in all publications are solely those of the individual author(s) and contributor(s) and not of MDPI and/or the editor(s). MDPI and/or the editor(s) disclaim responsibility for any injury to people or property resulting from any ideas, methods, instructions or products referred to in the content. |
© 2023 by the authors. Licensee MDPI, Basel, Switzerland. This article is an open access article distributed under the terms and conditions of the Creative Commons Attribution (CC BY) license (https://creativecommons.org/licenses/by/4.0/).
Share and Cite
Wang, Q.; Zhou, L.; Zheng, L.; Li, J.; Li, X.; Zhou, H. Research on the Design of Carbon-Neutralized Building in Rural China: A Case Study of “Impression of Yucun”. Energies 2023, 16, 5870. https://doi.org/10.3390/en16165870
Wang Q, Zhou L, Zheng L, Li J, Li X, Zhou H. Research on the Design of Carbon-Neutralized Building in Rural China: A Case Study of “Impression of Yucun”. Energies. 2023; 16(16):5870. https://doi.org/10.3390/en16165870
Chicago/Turabian StyleWang, Qingqin, Lining Zhou, Liangji Zheng, Jiayu Li, Xiaoping Li, and Haizhu Zhou. 2023. "Research on the Design of Carbon-Neutralized Building in Rural China: A Case Study of “Impression of Yucun”" Energies 16, no. 16: 5870. https://doi.org/10.3390/en16165870
APA StyleWang, Q., Zhou, L., Zheng, L., Li, J., Li, X., & Zhou, H. (2023). Research on the Design of Carbon-Neutralized Building in Rural China: A Case Study of “Impression of Yucun”. Energies, 16(16), 5870. https://doi.org/10.3390/en16165870