Article

The Condensation Characteristics of Propane in Binary and Ternary Mixtures on a Vertical Plate

1
School of Thermal Engineering, Shandong Jianzhu University, Jinan 250101, China
2
Shandong Special Equipment Inspection Institute Group Co., Ltd., Jinan 250101, China
3
School of Energy and Power Engineering, Shandong University, Jinan 250061, China
*
Authors to whom correspondence should be addressed.
Energies 2023, 16(16), 5873; https://doi.org/10.3390/en16165873
Submission received: 14 July 2023 / Revised: 2 August 2023 / Accepted: 7 August 2023 / Published: 8 August 2023
(This article belongs to the Special Issue Fluid, Energy and Thermal Comfort in Buildings)

Abstract

:
Natural gas is one of the most common forms of energy in our daily life, and it is composed of multicomponent hydrocarbon gas mixtures (mainly of methane, ethane and propane). It is of great significant to reveal the condensation mechanism of multicomponent mixtures for the development and utilization of natural gas. A numerical model was adopted to analyze the heat and mass transfer characteristics of propane condensation in binary and ternary gas mixtures on a vertical cold plate. Multicomponent diffusion equations and the volume of fluid method (VOF) are used to describe the in-phase and inter-phase transportation. The conditions of different wall sub-cooled temperatures (temperature difference between the wall and saturated gas mixture) and the inlet molar fraction of methane/ethane are discussed. The numerical results show that ethane gas is more likely to accumulate near the wall compared with the lighter methane gas. The thermal resistance in the gas boundary layer is one hundred times higher than that of the liquid film, revealing the importance of diffusion resistance. The heat transfer coefficients increased about 11% (at ΔT = 10 K) and 7% (at ΔT = 40 K), as the molar fraction of ethane increased from 0 to 40%. Meanwhile, the condensation heat transfer coefficient decreased by 53~56% as the wall sub-cooled temperature increased from 10 K to 40 K.

1. Introduction

With the increasing energy demand and rising attention to the environment, researchers are widely concerned with natural gas as a clean and efficient fossil energy. Liquefied natural gas (LNG) is an important technological process in the natural gas exploitation, which can improve transportation efficiency and reduce the supply cost. As multicomponent hydrocarbon mixtures, the natural gas liquefies at the boiling point. When propane condenses, methane and ethane become non-condensable gases. According to our previous research [1,2], the condensation heat transfer coefficient of propane decreases dramatically with a high methane molar fraction. However, the effect of the third gas on the propane condensation characteristics is not yet clear. Hence, research on the condensation characteristics of propane in multicomponent mixtures is of great significance to the design and develop of LNG equipment.
The mass transfer in binary gas mixtures is driven by its concentration gradient. While in the ternary gas mixture, the diffusivity of one component is a function of all components in the system. Therefore, the traditional two-component diffusion equation cannot describe the diffusion of ternary gas mixtures. Maxwell and Stefan [3] were the first to research the mass transfer in a multicomponent system and proposed diffusion equations. Toor [4] studied mass transfer in ternary mixtures via solving the Maxwell–Stefan equation and verified it with experimental research. He summarized the phenomena that occur in ternary gas mixture diffusion: (1) the diffusion rate of a component is zero when its concentration gradient is not zero (diffusion barrier); (2) the diffusion rate of a component is not zero when its concentration gradient is zero (osmotic diffusion); and (3) a component diffuses against its concentration gradient (reverse diffusion). According to the research of Krishna and Wesselingh [5], Fick’s law is limited in its description of multicomponent diffusion, while the Maxwell–Stefan equation is the most general and simplest method to describe mass transfer in a multicomponent system, which involves the thermodynamic non-idealities and external force fields. Moreover, the Maxwell–Stefan equation has been adopted in considerable research [6,7,8] to describe the mass transfer process of multicomponent gas mixtures.
Due to the existence of multicomponent gases, the analytical model of vapor condensation (e.g., boundary layer model [9,10], diffusion layer model [11], and heat and mass transfer analogy method [12]) must be adjusted with multicomponent diffusion equations. Taitel and Tamir [13] generalized the Nusselt model [14] for the condensation process of multicomponent gas mixtures and combined it with multicomponent diffusion to solve equations via integral methods. The boundary layer condensation model was adopted by Sage [15] to analyze the natural convection condensation of vapor in ternary mixtures. The results showed that species with a large molecular weight could enhance the heat transfer coefficient due to the free convection sweeping effect. Peterson et al. [16] utilized the diffusion layer model with an effective mass diffusion coefficient to address the problem of vapor condensation with multiple non-condensable gases. They found that heavy species preferentially accumulate near the interface, which deforms the diffusion layer. Ganguli et al. [17] promoted a numerical model via modifying the derivation for the calculation of effective diffusivity and condensation conductivity to solve the steam condensation outside a vertical tube in the presence of air and helium. They found that the accumulation of non-condensable gases could reduce the heat transfer coefficient, and the addition of the third species changes the influence of the regularity of the wall sub-cooled temperature on the heat transfer coefficient. Karkoszka and Anglart [18,19] proposed two methods to solve the problem of vapor condensation in the presence of non-condensable gases. One is an analytical model based on the boundary layer approximation method, which can only solve the vapor condensation of binary mixtures in a simple geometric structure. The other is a numerical model via solving conservation equations, which can be used to calculate both binary and ternary mixture conditions. Under the conditions of the ternary mixture (steam/air/helium), increasing the amount of helium in the main flow will increase the air mass fraction near the interface, which shows the interaction among non-condensable gases.
Experimental research about vapor condensation in multicomponent gas mixtures mainly uses the ternary mixture of steam/air/helium. According to the research of Liu et al. [20], the introduction of helium into the steam/air mixture outside a vertical tube could decrease the condensation heat transfer coefficient evidently, and there was an obvious gas stratification phenomenon when the helium mole fraction was in excess of 60%. Similar results were obtained by Su et al. [21], in which the condensation heat transfer coefficient of steam/air/helium was about 20% lower than that of the steam/air mixture. The effect of wall sub-cooled temperatures on the heat transfer coefficient in a ternary mixture was more significant than that of the pure steam condition. Xu et al. [22] investigated steam/air/helium condensation in a horizontal tube. The steam condensation heat transfer coefficient increased with the increase in the helium volume fraction, showing different profiles with the increase in the wall sub-cooled temperature at different flow patterns. Park et al. [23,24] focused on the degradation effect of light gas (helium) mixed with a steam/air mixture on the condensation heat transfer outside a vertical tube. The results showed that, when the helium molar fraction reached 40%, the condensation heat transfer coefficient decreased by approximately 35%. According to the above research, light gas is more likely to increase the diffusion resistance and decrease the condensation heat transfer coefficient in a ternary gas mixture.
Above all, numerical and experimental studies about the condensation of multicomponent gas mixtures are mainly using steam/air and steam/air/helium mixtures. There are few studies about the condensation of hydrocarbon gas mixtures, especially natural gas, owing to the low condensation temperature, complex multicomponent condition and excellent flammability. However, the fluid dynamic and heat and mass transport mechanism of the condensation of multicomponent hydrocarbon gas mixtures are important to the exploration of natural gas condensation process.
The numerical model proposed in this paper was established using an iterative procedure to solve the mass condensation source terms and diffusion equations in ANSYS 17.1. A user-defined function (UDF) was compiled for the condensation rate, which was calculated based on the conservation of mass and energy at the gas–liquid interface instead of an empirical formula. Meanwhile, Maxwell–Stefan equations were applied to address mass diffusion in the gas mixtures. This numerical model can be applied in multi-working conditions with different types of working fluids via changing the parameters.

2. Model and Methods

2.1. Physical Model

The condensation heat and mass transfer model of a ternary gas mixture (methane, ethane and propane) flowing along a vertical cold wall is shown in Figure 1. When the gas mixture flows down the wall, the propane gas condenses and forms a liquid film that adheres to the wall, while methane and ethane are as non-condensable gases and accumulate near the gas–liquid interface. As propane condenses, the concentration of the non-condensable components near the wall gradually increases, which prohibits the diffusion of propane from the mainstream to the cold wall. According to the research of Toor and Duncan [25], different from the binary diffusion, there are phenomena of reverse diffusion, osmotic diffusion and diffusion barrier in the ternary gas mixture diffusion process. As the green lines show in Figure 1, the concentration of methane and ethane shows a peak or valley in the gas boundary layer, rather than a monotone distribution.

2.2. Governing Equations

The two-dimensional condensation model was solved under the assumption that the flow is steady, incompressible with constant properties. The cold wall is smooth and isothermal, and there is no slip and contact thermal resistance. There is no velocity and temperature jump at the gas–liquid interface. The conservation equations of the liquid film and methane, ethane and propane gas mixture are expressed as follows.
Mass conservation equation:
Liquid   phase :                           ρ l u l x + v l y = S l
Gas   phase :                       ρ m u m x + v m y = S m
where ρ is density; the subscript l and m represent the liquid and gas mixture phase, respectively; and Sl = −Sm is the mass source term due to condensation.
Momentum conservation equation:
Liquid   phase :                         ρ l u l u l x + v l u l y = ρ l ρ g + μ 2 u l y 2 + F x
ρ l u l v l x + v l v l y = ρ l ρ g + μ 2 v l y 2 + F y
Gas   phase :                         ρ m u m u m x + v m u m y = ρ m ρ g + μ 2 u m y 2 + F x
ρ m u m v m x + v m v m y = ρ m ρ g + μ 2 v m y 2 + F y
where μ is the dynamic viscosity, the subscript represents the main flow, F is the body force driven by the surface tension at the gas–liquid interface, and the first term on the right of the equations are buoyancy forces due to the density difference between the local and main flows.
According to the research of Karkoszka and Anglart [18], in a ternary mixture, the buoyancy force on the momentum conservation equation can be expressed as:
ρ m ρ ρ m = α w C 1 w C 1 , + β w C 2 w C 2 ,
According to the ideal gas law, the constants α and β are expressed as follows.
α = M C 2 M C 3 M C 1 M C 2 M C 1 M C 2 M C 2 M C 3 w C 1 , + M C 1 M C 2 M C 1 M C 3 w C 2 , M C 1 M C 2
β = M C 1 M C 3 M C 1 M C 2 M C 1 M C 2 M C 1 M C 3 w C 1 , + M C 1 M C 2 M C 1 M C 3 w C 2 , M C 1 M C 2
where w is the species mass fraction; M is the molar weight; the subscripts C1 and C2 represent the non-condensable methane and ethane, respectively; and C3 is the condensable propane.
Energy conservation equation:
Liquid   phase :                         ρ l c p l u l T x + v l T y = k l 2 T l y 2 + S h
Gas   phase :   ρ m c p m u m T x + v m T y = k m 2 T l y 2 + c p C 3 c p m j C 3 T y S h
where Cp is the specific heat, k is the thermal conductivity, and Sh is the energy source term produced by condensation. The heat transfer mechanism in a liquid film is convection, while in the gas phase, there is also heat diffusion caused by mass transport, which is shown in the second term on the right in Equation (8).

2.3. Phase Change and Mass Transfer Model

The VOF method was adopted to solve the two-phase flow. The sum of volume fraction of the liquid and gas phase are equal to the unit in a single cell, shown as Equation (12). The cell is full in the liquid phase when Fm = 0, and the cell is full in the gas phase when Fm = 1. Equation (13) is solved to trace the gas–liquid interface.
F m + F l = 1
F m ρ v = m ˙ c o n d
According to Fick’s law, the diffusion velocity of one species is driven by the concentration difference and depends only on its concentration gradient and temperature gradient. Considering the multicomponent diffusion, Fick’s law cannot describe the interaction between ternary components and the different efficiencies of various species, which may be less than zero or tend to infinity. Thus, the Maxwell–Stefan equation was adopted to solve the mass diffusion of the multicomponent condensation process.
1 R T d μ i d z = i = 1 i j n W j ( u i u j ) D ¯ i j
where R is the ideal gas constant, μi is the molar chemical potential, ui is diffusion velocity, and D ¯ i j is the diffusion coefficient. The mass diffusion flux of each component can be expressed as:
j i = ρ j = 1 n 1 D i j w j , i = 1 , , n 1
i = 1 n j i = 0
Meanwhile, the mass diffusion equation of species C1 and C2 in the gas boundary layer are expressed as:
ρ m u m w C 1 x + v m w C 1 y = j C 1 y
ρ m u m w C 2 x + v m w C 2 y = j C 2 y
In the propane vapor condensation process, the non-condensable gases of methane and ethane accumulate near the liquid film and form a gas boundary layer. The propane vapor must diffuse through the gas boundary layer from the main flow to the gas–liquid interface. When the system reaches equilibrium, the propane vapor flows from the main stream to the gas–liquid interface via diffusion, and the convection force should be equal to the propane vapor condensation at the interface. Thus, according to the mass transfer conservation at the gas–liquid interface, the local propane vapor mass flux due to convection and diffusion can be expressed as:
m ˙ C 3 = w C 3 m ˙ + j C 3
where m ˙ C 3 is the propane vapor flux from the main stream to the liquid film, m ˙ is the local mass flux, and w C 3 is the mass fraction of the propane vapor.
It was assumed that a non-condensable gas cannot permeate into a liquid film, and that the mass flux of methane and ethane is zero at the gas–liquid interface. Accordingly, the local mass flux at the gas–liquid interface is as follows.
m ˙ i = m ˙ C 3 , i + m ˙ C 1 , i + m ˙ C 2 , i = m ˙ C 3 , i = m ˙ c o n d
where m ˙ i , m ˙ C 3 , i , m ˙ C 1 , i and m ˙ C 2 , i are, respectively, the total, propane vapor and non-condensable methane and ethane mass flux at the gas–liquid interface; and m ˙ c o n d is the condensation flux of propane at the interface.
Equation (15) can be expressed in the following forms by substituting it in Equation (16).
m ˙ c o n d = w C 3 , i m ˙ c o n d + j C 3 , i
m ˙ cond = j C 3 , i 1 - w C 3 , i
The condensation rate was calculated using Equations (13) and (22), which are expressed in an iterative procedure [26] compiled by UDF in this model, shown in Figure 2. The condensation source terms for mass and energy are defined as:
S m = m ˙ c o n d A e f f V c e l l
S h = m ˙ c o n d A e f f V c e l l h f g
where Aeff is the effective condensation area, hfg is the latent heat of propane, and Vcell is the computational cell volume.
The VOF model was adopted to trace the liquid–gas interface, and the UDF was used to calculate the heat and mass transfer between the gas and liquid phase. The iterative procedure can be explained as follows: (1) The pointer scans and finds the cells in first layer near the cold wall (n = 1). (2) The condensation term is calculated according to the judgement of the temperature and liquid volume fraction in the cell. (3) The pointer turns to the next layer (n = n + 1) and repeats step (2) until the entire control volume is completed.

2.4. Numerical Setup and Model Validation

The conservation equations of this model were calculated using a pressure-based solver. The second-order upwind scheme was adopted for the momentum, VOF and energy equations, while the pressure staggering option (PRESTO!) scheme was employed for the spatial discretization of pressure. The pressure–velocity coupling was addressed using the pressure-implicit with splitting of operators (PISO) algorithm. The Green–Gauss cell-based method was adopted to handle the evolution of the gradient. Considering the multicomponent species transport and two-phase flow, the convergent criteria of the residuals were set as 10−6 for the conservation equations to ensure the accuracy of the simulation. At the same time, the area-weighted average heat transfer coefficient and the liquid-phase volume fraction were both monitored for the judgment of convergence.
To verify the validation of this model, both a mesh independence test and a comparation with analytical results were conducted. Considering the thin liquid film, the mesh was refined near the cold wall as shown in the mesh sample of Figure 1. The distribution of the average condensation heat transfer coefficient with varying grid quantities for propane/methane/ethane condensation at the sub-cooled wall temperature of 10 K is shown in Figure 3. As the grid number reaches 70,000, the hav remains stable at about 84 W. Hence, a seventy-thousand grid was adopted in this paper to discretize the computational domain, assure an accurate numerical result and reduce the computation cost.
Due to the little data about the condensation of hydrocarbon mixtures, a numerical simulation using a steam/air mixture was conducted to compare with the analytical results obtained by Minkowycz and Sparrow [9]. As shown in Figure 4, the numerical and analytical results show a good agreement and the over-prediction is within 10%. Hence, the numerical model is convincing to describe the condensation of multicomponent gas mixtures.

3. Results

The condensation of propane with methane and ethane acting as non-condensable components was studied in this paper. In the numerical model, the ternary mixture flowed into the control volume with a propane molar fraction (WC3,∞) of 10%, an ethane molar fraction (WC2,∞) ranging from 0 to 40% and a methane molar fraction (WC1,∞) ranging from 50% to 90%. The sub-cooled temperature of the vertical wall varied from 10 K to 40 K. As the ternary mixture flowed downstream, the propane condensed and formed a liquid film that adhered to the cold wall, whose temperature was below the boiling point of propane. While the propane condensed, the methane and ethane acted as non-condensable gases, which accumulated near the liquid film and formed a gas boundary layer. Accordingly, the condensation rate of propane was mainly dependent on the heat and mass transfer in the gas boundary layer, and thus heat transfer in the liquid film occurred.

3.1. Characteristics of the Filmwise Condensation

The distribution of the liquid volume fraction, molar fraction, temperature and velocity on the outlet section are shown in Figure 4 under the conditions of WC3,∞ = 10% and ΔT = 10 K. As shown in Figure 5a, the liquid volume fraction decreases sharply to zero in the x-direction near the wall, showing that the liquid film that adhered to the wall is extremely thin. Compared with a binary mixture (WC2,∞ = 0), the liquid volume fraction of the ternary mixture decreases more sharply and the liquid film is thinner. The distribution of the propane molar fraction near the wall is shown in Figure 5b. The propane concentration declines significantly near the wall due to condensation and increases with the increase in inlet ethane molar fraction and decrease in the inlet methane molar fraction. The gradient of the temperature (shown in Figure 5c) and propane concentration is mainly within the range of 0.02 m near the wall. The temperature increases linearly near the wall and then smoothly transits to the main flow. Similarly, the temperature increases with the increase in inlet ethane molar fraction and decrease in the inlet methane molar fraction. The velocity gradient is also within the range of 0.02 m near the wall in Figure 5d, while there is a peak value before approaching the main flow velocity. This is due to the buoyancy, temperature difference and mass diffusion in the gas boundary layer, which could disturb the velocity. In the case of the ternary mixture, the temperature, velocity, propane concentration and liquid volume fraction increase with the inlet ethane molar fraction. However, the case of binary mixture shows different variations compared with that of the ternary mixture. This is because there are different transport mechanisms between the binary and ternary mixtures.

3.2. Distribution of the Non-Condensable Components

Figure 6 shows the distribution of the methane and ethane molar fraction on the sections perpendicular to the flow direction at WC1,∞ = 0.6, WC2,∞ = 0.3 and ΔT = 10 K. The distribution of the molar fraction on the inlet section (y = 0) is uniform, subject to the boundary conditions. Methane and ethane accumulate near the wall (x = 0) along the flow direction with propane condensation. Different from the monotonic distribution of the non-condensable gas in the binary mixture, there are peak and valley values in distribution of the methane and ethane concentration along the x-direction. Moreover, ethane is more likely to accumulate near the wall than methane, relative to the concentration of the main flow. Similarly to the research of Sage [15], the carrying effect of the larger-molecular-weight ethane on methane could result in a nonlinear distribution of the non-condensable gas concentration.
The profile of the methane and ethane gas molar fraction at the outlet section with different inlet molar fractions is shown in Figure 7, at WC3,∞ = 0.3 and ΔT = 10 K. The distribution of methane concentration is monotonous under the condition of WC2,∞ = 10~20%. As WC2,∞ is greater than 30%, there is a peak value of methane concentration near the wall. This illustrates that the ethane gas of a certain concentration can accumulate methane gas near the gas–liquid interface. With the increase in WC2,∞, the concentration gradient of methane decreases, and the concentration gradient of ethane increases near the wall.
To compare the accumulation ability of methane and ethane gas near the wall, a dimensionless molar fraction was introduced as Equation (25). The profile of the dimensionless molar fraction for the non-condensable methane and ethane gas at the outlet is shown in Figure 8. It can be concluded that the ethane gas is more likely to accumulate near the wall, and the increase in the WC2,∞ lowers the accumulation of methane near the wall. Furthermore, under the condition of WC2,∞ = 40%, the concentration of methane nearby the wall appears to be lower than the main flow value.
Ω C i = W C i W C i ,
The influence of the wall sub-cooled temperature on the distribution of methane and ethane gas molar fraction at the outlet at WC1,∞ = 0.6 and WC2,∞ = 0.3 is shown in Figure 9. It illustrates that, with the increase in the sub-cooled temperature, the peak value of methane increases, and valley value of ethane decreases slightly, meanwhile the peak and valley values of the non-condensable methane and ethane gas move towards the cold wall. Therefore, the increase in the wall sub-cooled temperature can increase both the concentration gradient of methane and ethane gas.

3.3. The Distribution of the Liquid Film and Boundary Layers

The distribution of the liquid film along the flow direction is shown in Figure 10, under the conditions of WC3,∞ = 0.3 and ΔT = 10 K. As it can be seen in the figure, the liquid film of the ternary mixture is thinner and more uniform than that of the binary mixture. The results are consistent with the characteristics of the liquid phase volume fraction, shown in Figure 5a. Consequently, the addition of ethane could reduce the liquid film thickness of the methane and ethane mixture. Under the conditions of the ternary mixture, the variation in WC2,∞ has little effect on the liquid film thickness, as the WC3,∞ remains unchanged. The liquid volume fraction contours of the binary and ternary mixtures are shown in Figure 11. The liquid film of the binary mixture fluctuates significantly downstream, while the liquid film of the ternary mixture forms earlier at the entrance and remains stable downstream. To reveal the mechanism of the liquid film fluctuations, the velocity distribution on the sections perpendicular to the flow direction at WC1,∞ = 10% and ΔT = 10 K is shown in Figure 12. There is a peak velocity value near the cold wall, which contributes to the liquid film fluctuation. Meanwhile, the velocity in the x-direction, indicating the mass transportation from the main flow to the liquid film, results in a wavy liquid film.
Figure 13 shows the distribution of the velocity, temperature and gas boundary layer along the flow direction at WC3,∞ = 0.3 and ΔT = 10 K. The velocity boundary layer and temperature boundary layer are defined as the curves where the velocity or temperature are equal to 99.99% of the main flow value. Similarly, the gas boundary layer is the curve where the molar fraction of the propane vapor is equal to 99.99% of the main flow value. It can be seen from the figure that the addition of ethane gas could thicken the gas boundary layer, while with the increase in WC2,∞ and decrease in WC1,∞, the gas boundary layer becomes thinner gradually. The thickness of the temperature boundary layer also decreases with the increase in WC2,∞. While with the increase in WC2,∞, the thickness of velocity boundary layer firstly increases and then decreases. In the binary mixture (WC2,∞ = 0), the gas boundary layer has almost the same thickness with the temperature boundary layer. While with the addition of ethane gas, the gas boundary layer and temperature boundary layer are separated, and the separation distance increases as the increase in WC2,∞.

3.4. The Condensation Heat Transfer Characteristics

In the process of propane vapor condensation with methane and ethane acting as non-condensable gases, there is heat transfer resistance in the liquid film and gas boundary layer. The heat transfer in the liquid film depends mainly on conduction, while heat transfer in the gas boundary layer is composed of condensation latent heat and convection. Accordingly, the heat transfer resistance in the liquid film and the gas boundary layer are expressed as follows.
R l = 1 h l = T i T w q
R m = 1 h c o n v + h c o n d = T T i q
where the subscripts I and w represent the gas–liquid interface and the cold wall, respectively; hl is the heat transfer coefficient of the liquid film; hconv and hcond are, respectively, the convection and condensation heat transfer coefficients; and q is the total heat flux.
To compare the thermal resistance between the liquid film and gas boundary layer, the ratio of resistance is defined as
R m R l = h l h c o n v + h c o n d = T T i T i T w
Figure 14 shows the thermal resistance distribution of the liquid film and gas boundary layer under different wall sub-cooled temperatures, at WC3,∞ = 10%. The thermal resistance of both the liquid film and gas boundary layer increase with the increase in the wall sub-cooled temperature. As shown in Figure 14a, the liquid film thermal resistance of the binary mixture is 1.3~1.7 times that of the ternary mixture, showing that the addition of ethane reduces the thermal resistance of the liquid film. Considering the liquid film distribution shown in Figure 10, the reason for this is that the addition of ethane reduces the liquid film thickness. Additionally, for ternary mixtures, the liquid film thermal resistance decreases with the increase in WC2,∞. From Figure 14b, the gas boundary layer thermal resistance of the binary mixture is higher than that of the ternary mixture and it decrease with the increase in WC2,∞. Therefore, the increase in WC2,∞ can both reduce the liquid film resistance and gas boundary layer resistance.
The thermal resistance ratio of the gas boundary layer and liquid film under different wall sub-cooled temperatures is shown in Figure 15. The thermal ratio of the ternary mixture is considerably higher than that of the binary mixture. In the ternary mixture, the thermal ratio increases with the increase in WC2,∞. This shows that the addition of ethane improves the proportion of the gas boundary layer thermal resistance compared with the liquid film thermal resistance. Under the calculated conditions, the thermal resistance of the gas boundary layer is one-hundred times higher than that of liquid film. Thus, in the condensation process of propane vapor with a high non-condensable gas concentration, the heat transfer resistance is mainly in the gas boundary layer.
The average condensation heat transfer coefficient (defined as Equation (29)) with different wall sub-cooled temperatures and inlet molar fractions of methane and ethane is shown in Figure 16. The condensation heat transfer coefficient decreases by 53~56% with the increase in the wall sub-cooled temperature from 10 K to 40 K. This is because the thermal resistance of both the liquid film and gas boundary layer increase with the wall sub-cooled temperature. As the WC3,∞ remains constant, the heat transfer coefficient increases by about 11% (at ΔT = 10 K) and 7% (at ΔT = 40 K), with the WC2,∞ increase from 0 to 40% and WC1,∞ decrease from 90% to 50%. The addition of ethane could increase the heat transfer coefficient via reducing the thermal resistance of both the liquid film and gas boundary layer. The correlation formula for predicting the condensation heat transfer coefficient of propane/methane/ethane gas mixtures (at WC3,∞ = 0.1 and ΔT = 10~40 K) was obtained by the least squares method. As shown in Equation (30), the R-squared value of the fitting formula was 0.99205.
h = q w T s a t T w
h a v = 301 . 97584 W 0 . 14204 Δ T 0 . 60487

4. Conclusions

A numerical model was adopted in this paper to study the heat and mass transfer characteristics of the condensation of binary and ternary gas mixtures (propane/ethane/methane) along a vertical cold wall. The distribution of the liquid film, gas boundary layer, velocity and temperature boundary layer were analyzed, meanwhile the effect of non-condensable gases (methane and ethane) and the wall sub-cooled temperature on the condensation heat transfer coefficient were discussed in detail.
(1)
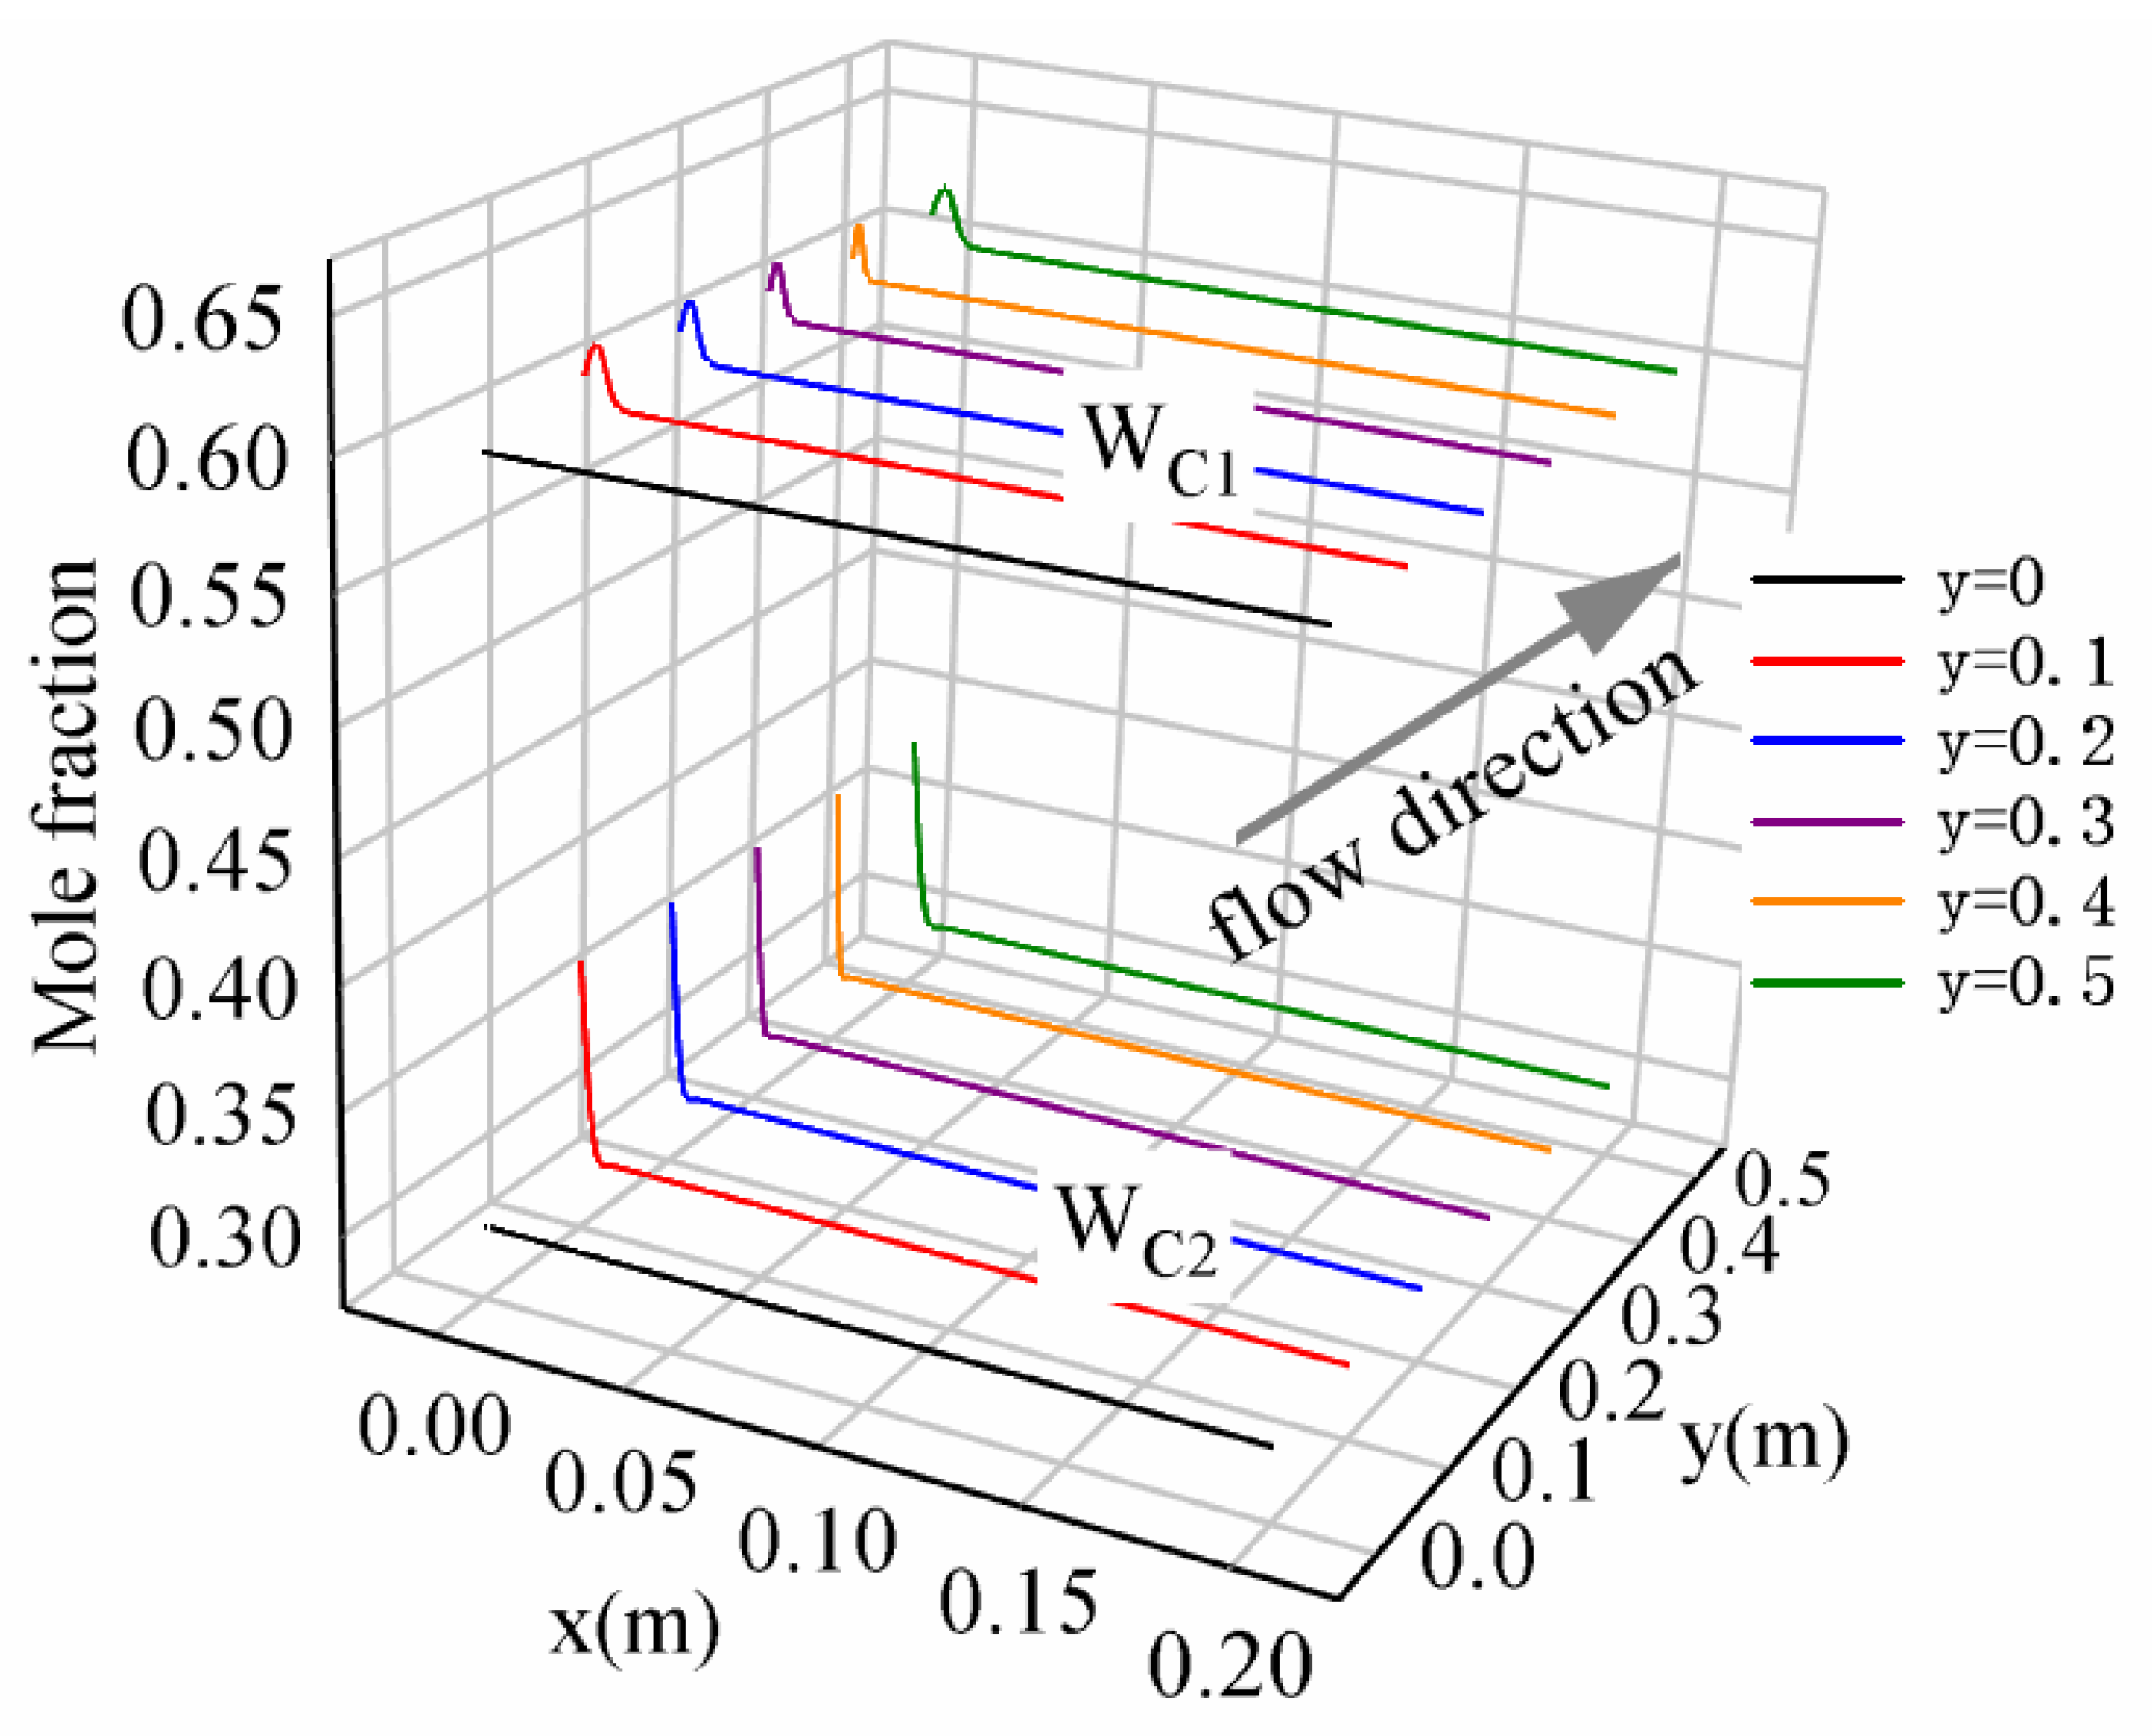
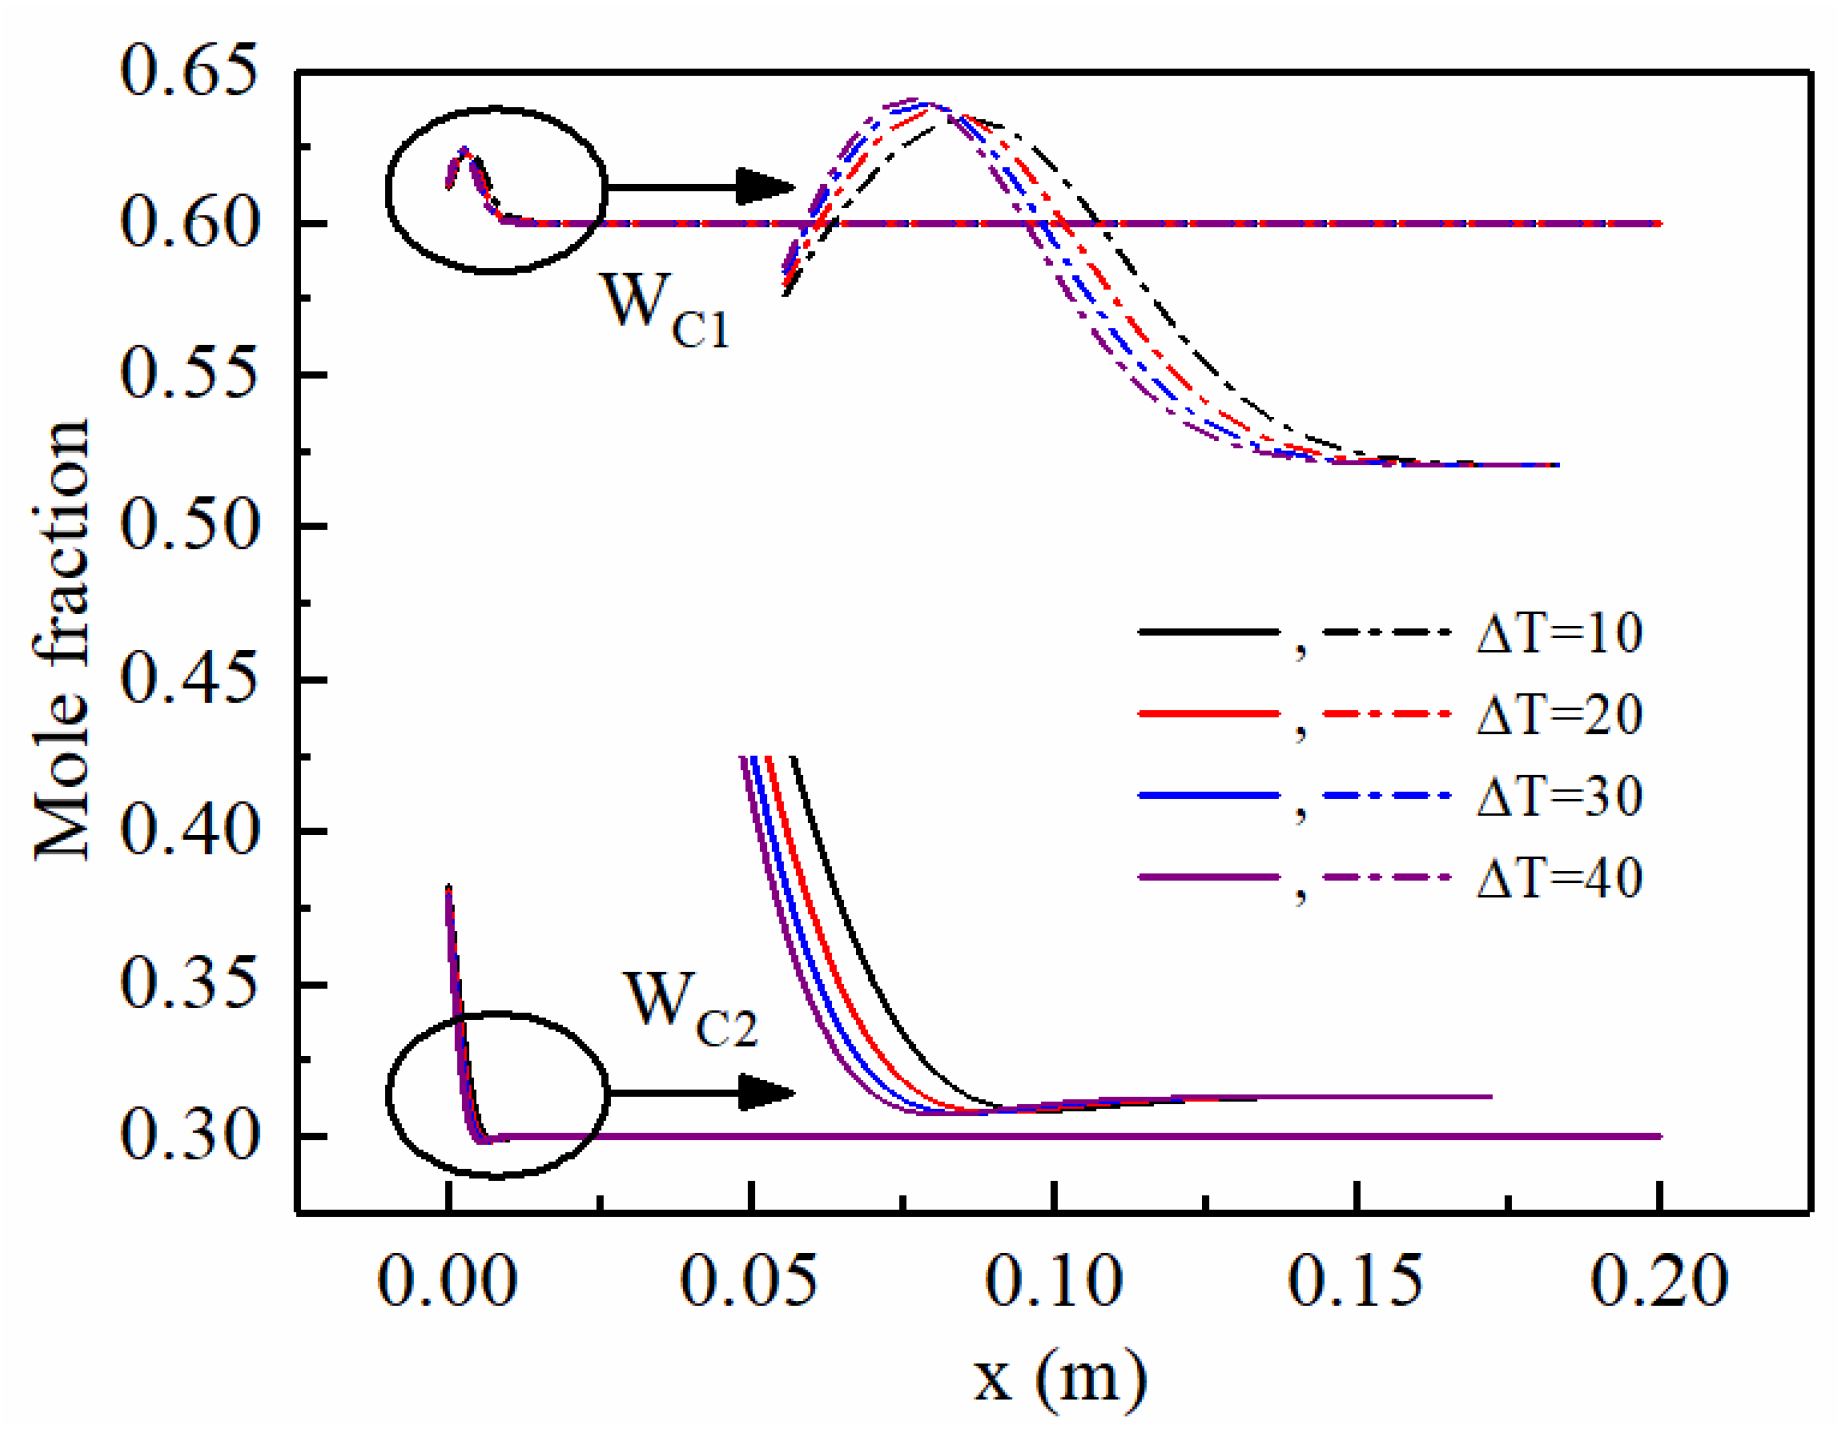
Different from the monotonic distribution of the non-condensable gas concentration in a binary mixture, there were peak and valley values, respectively, in the profile of the methane and ethane concentration along the x-direction in the ternary mixture. The increase in the wall subcooled temperature promotes the accumulation of methane and ethane gas near the gas–liquid interface.
(2)
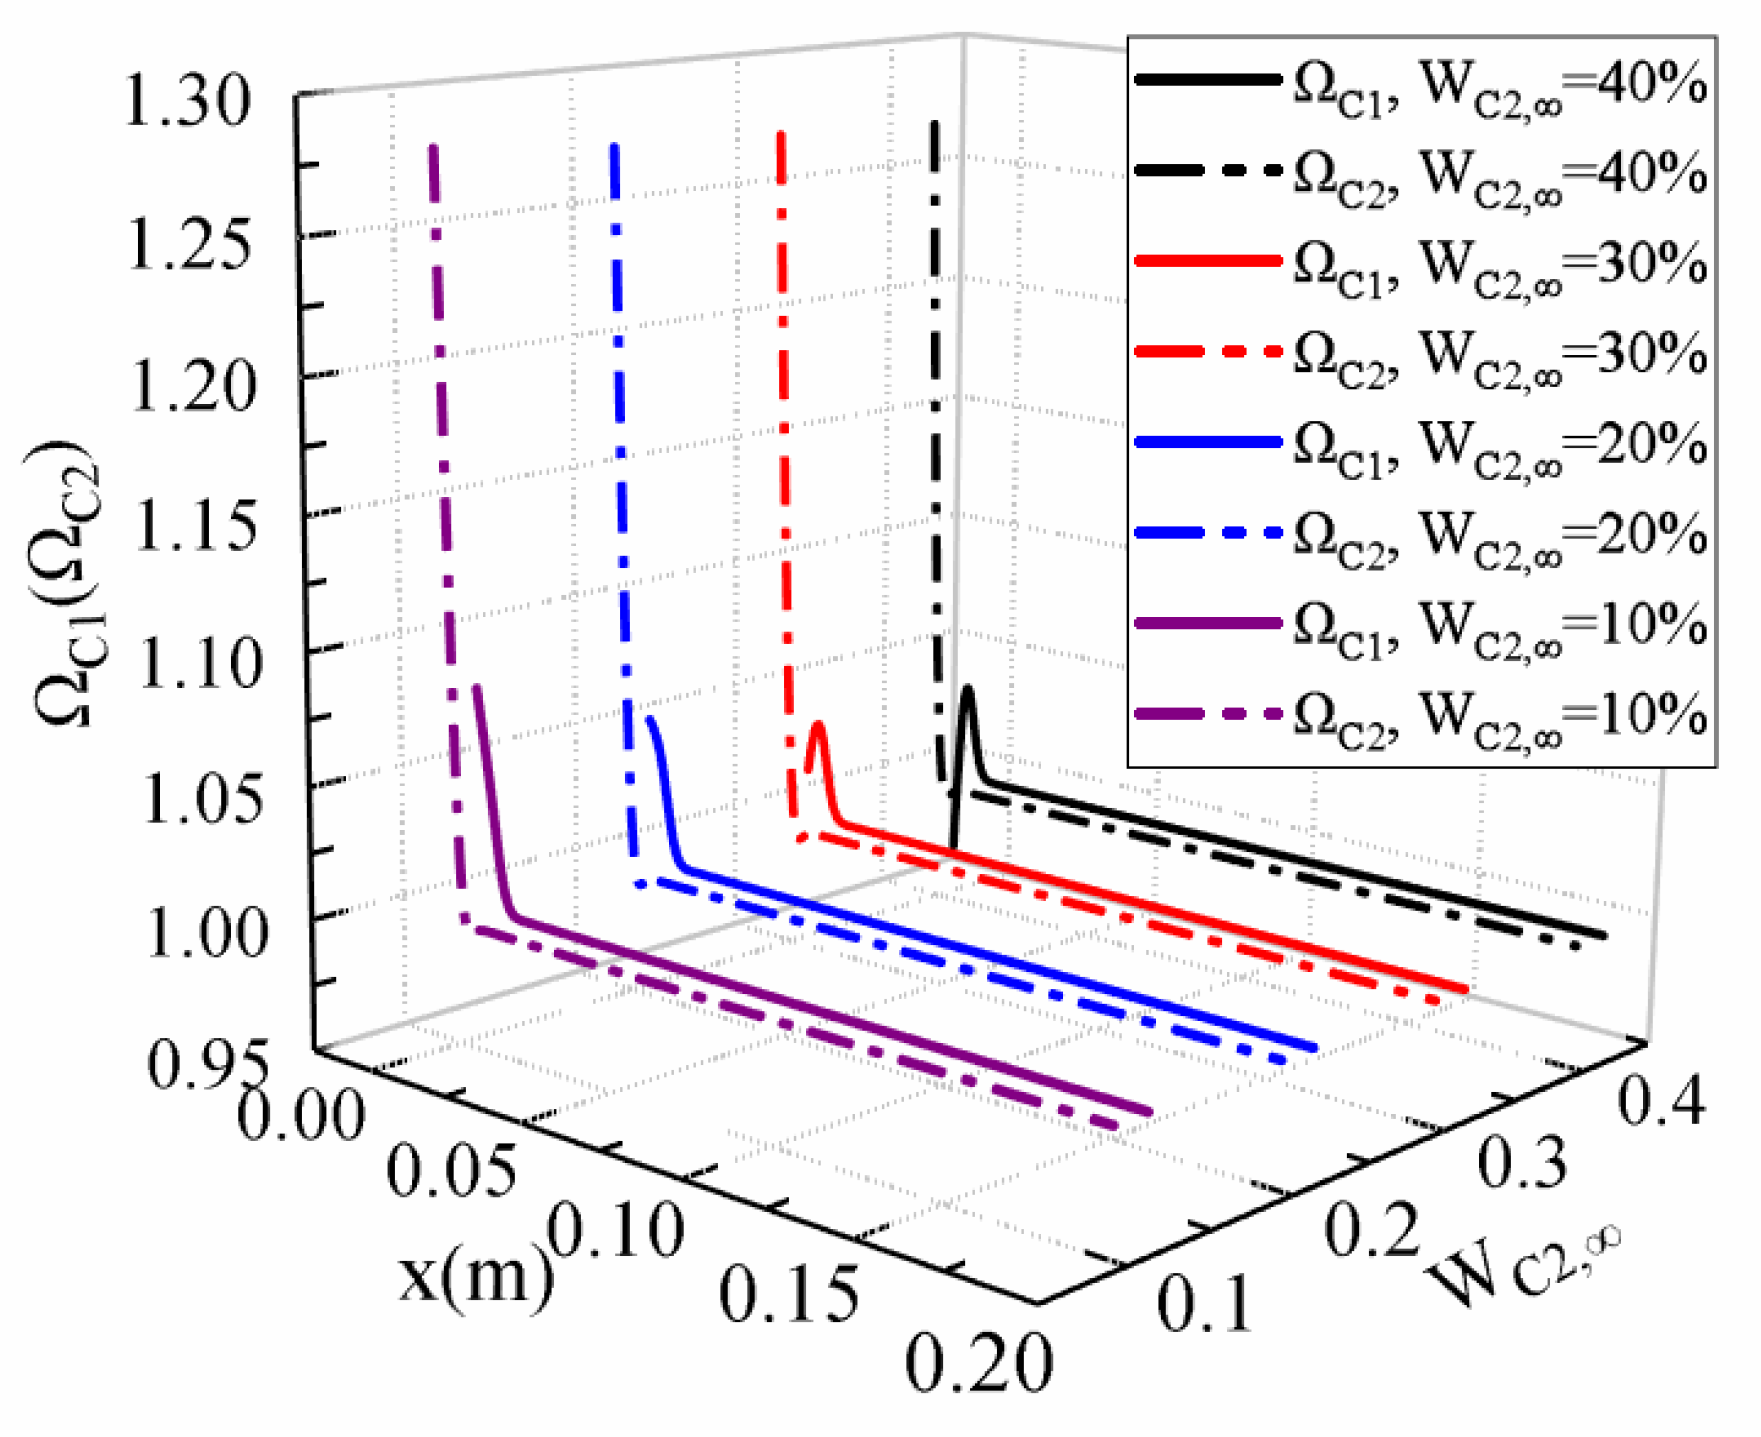
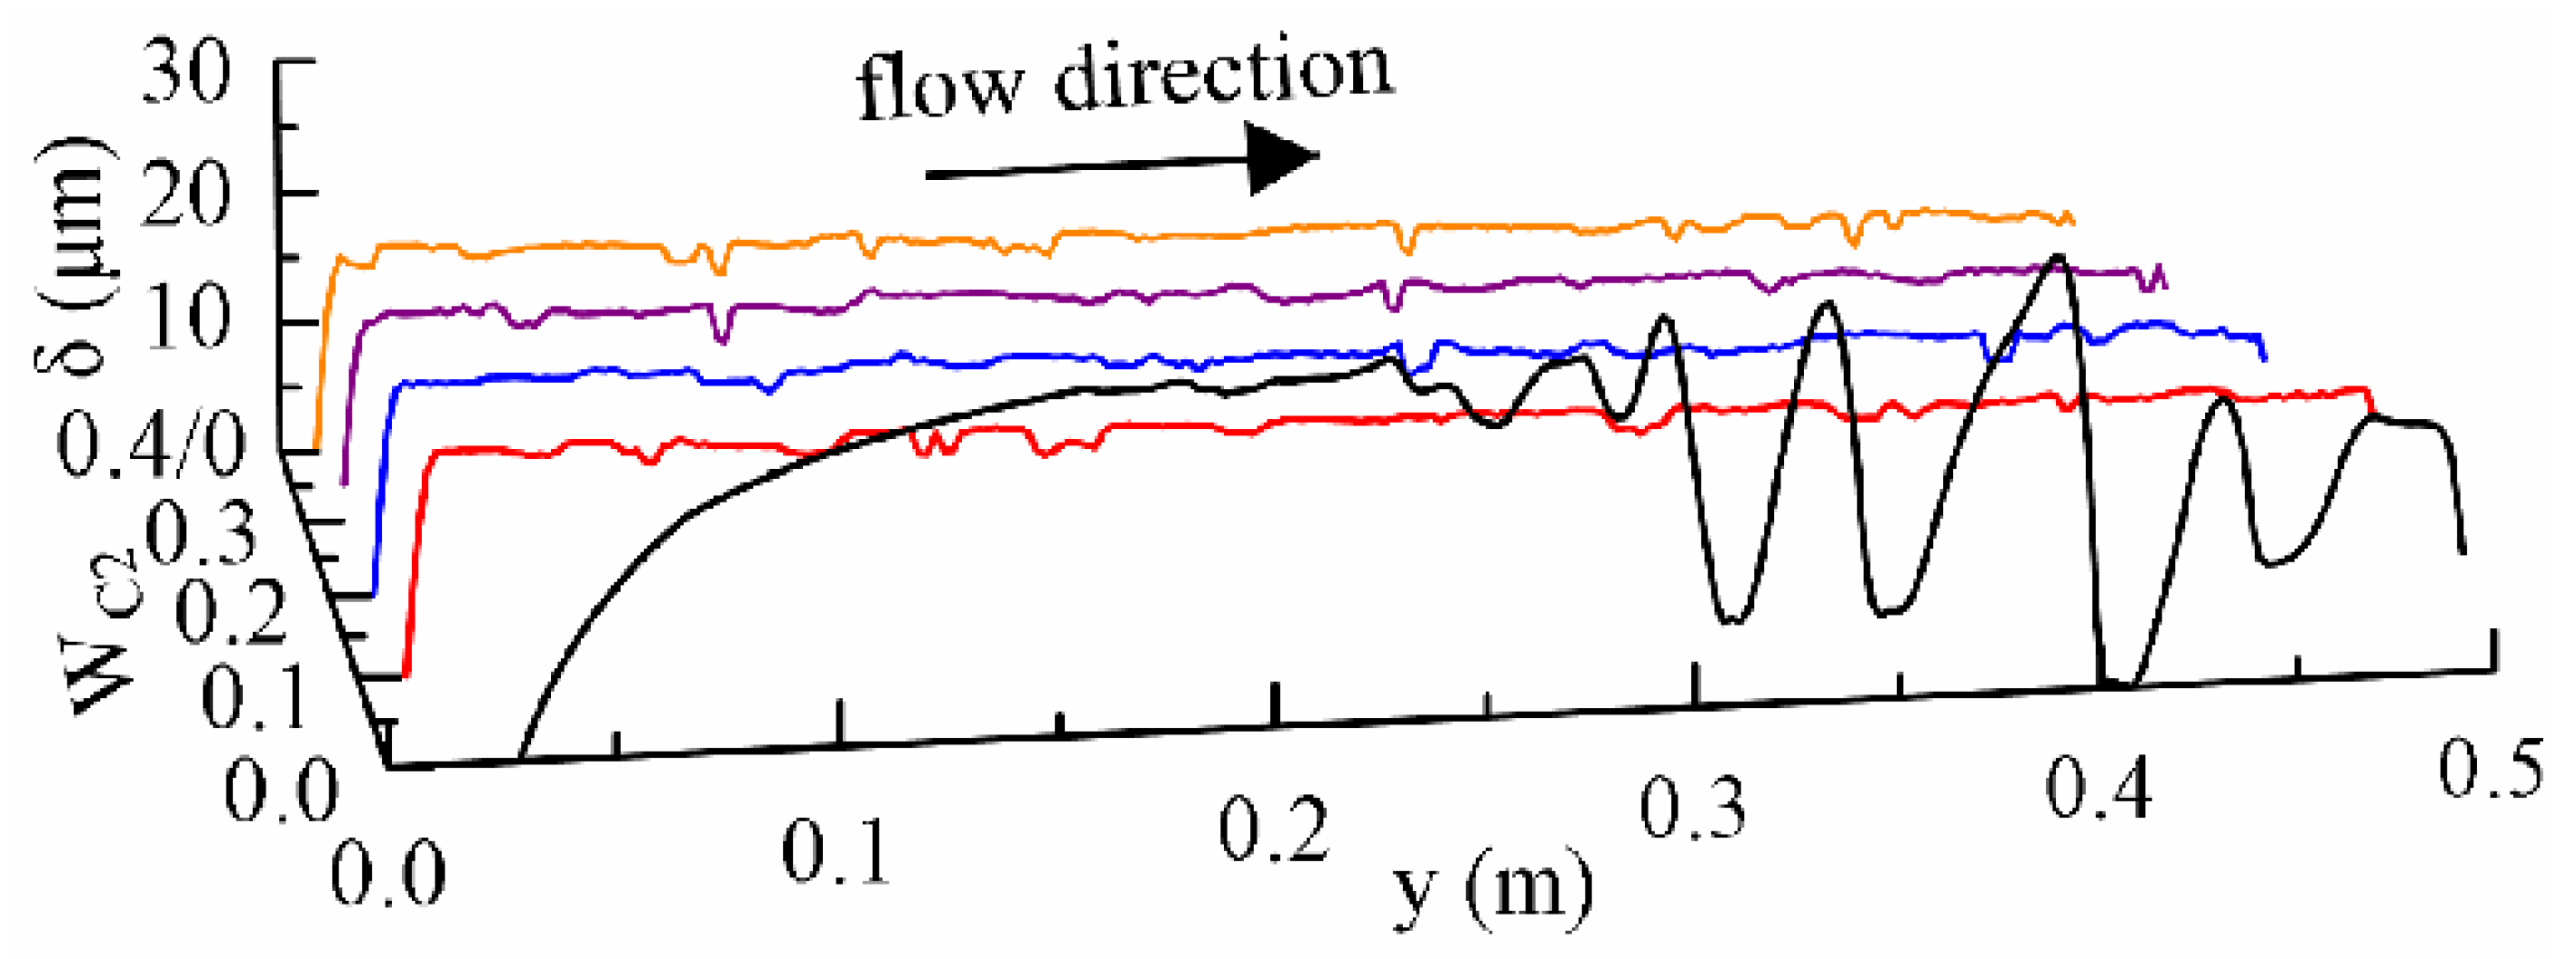
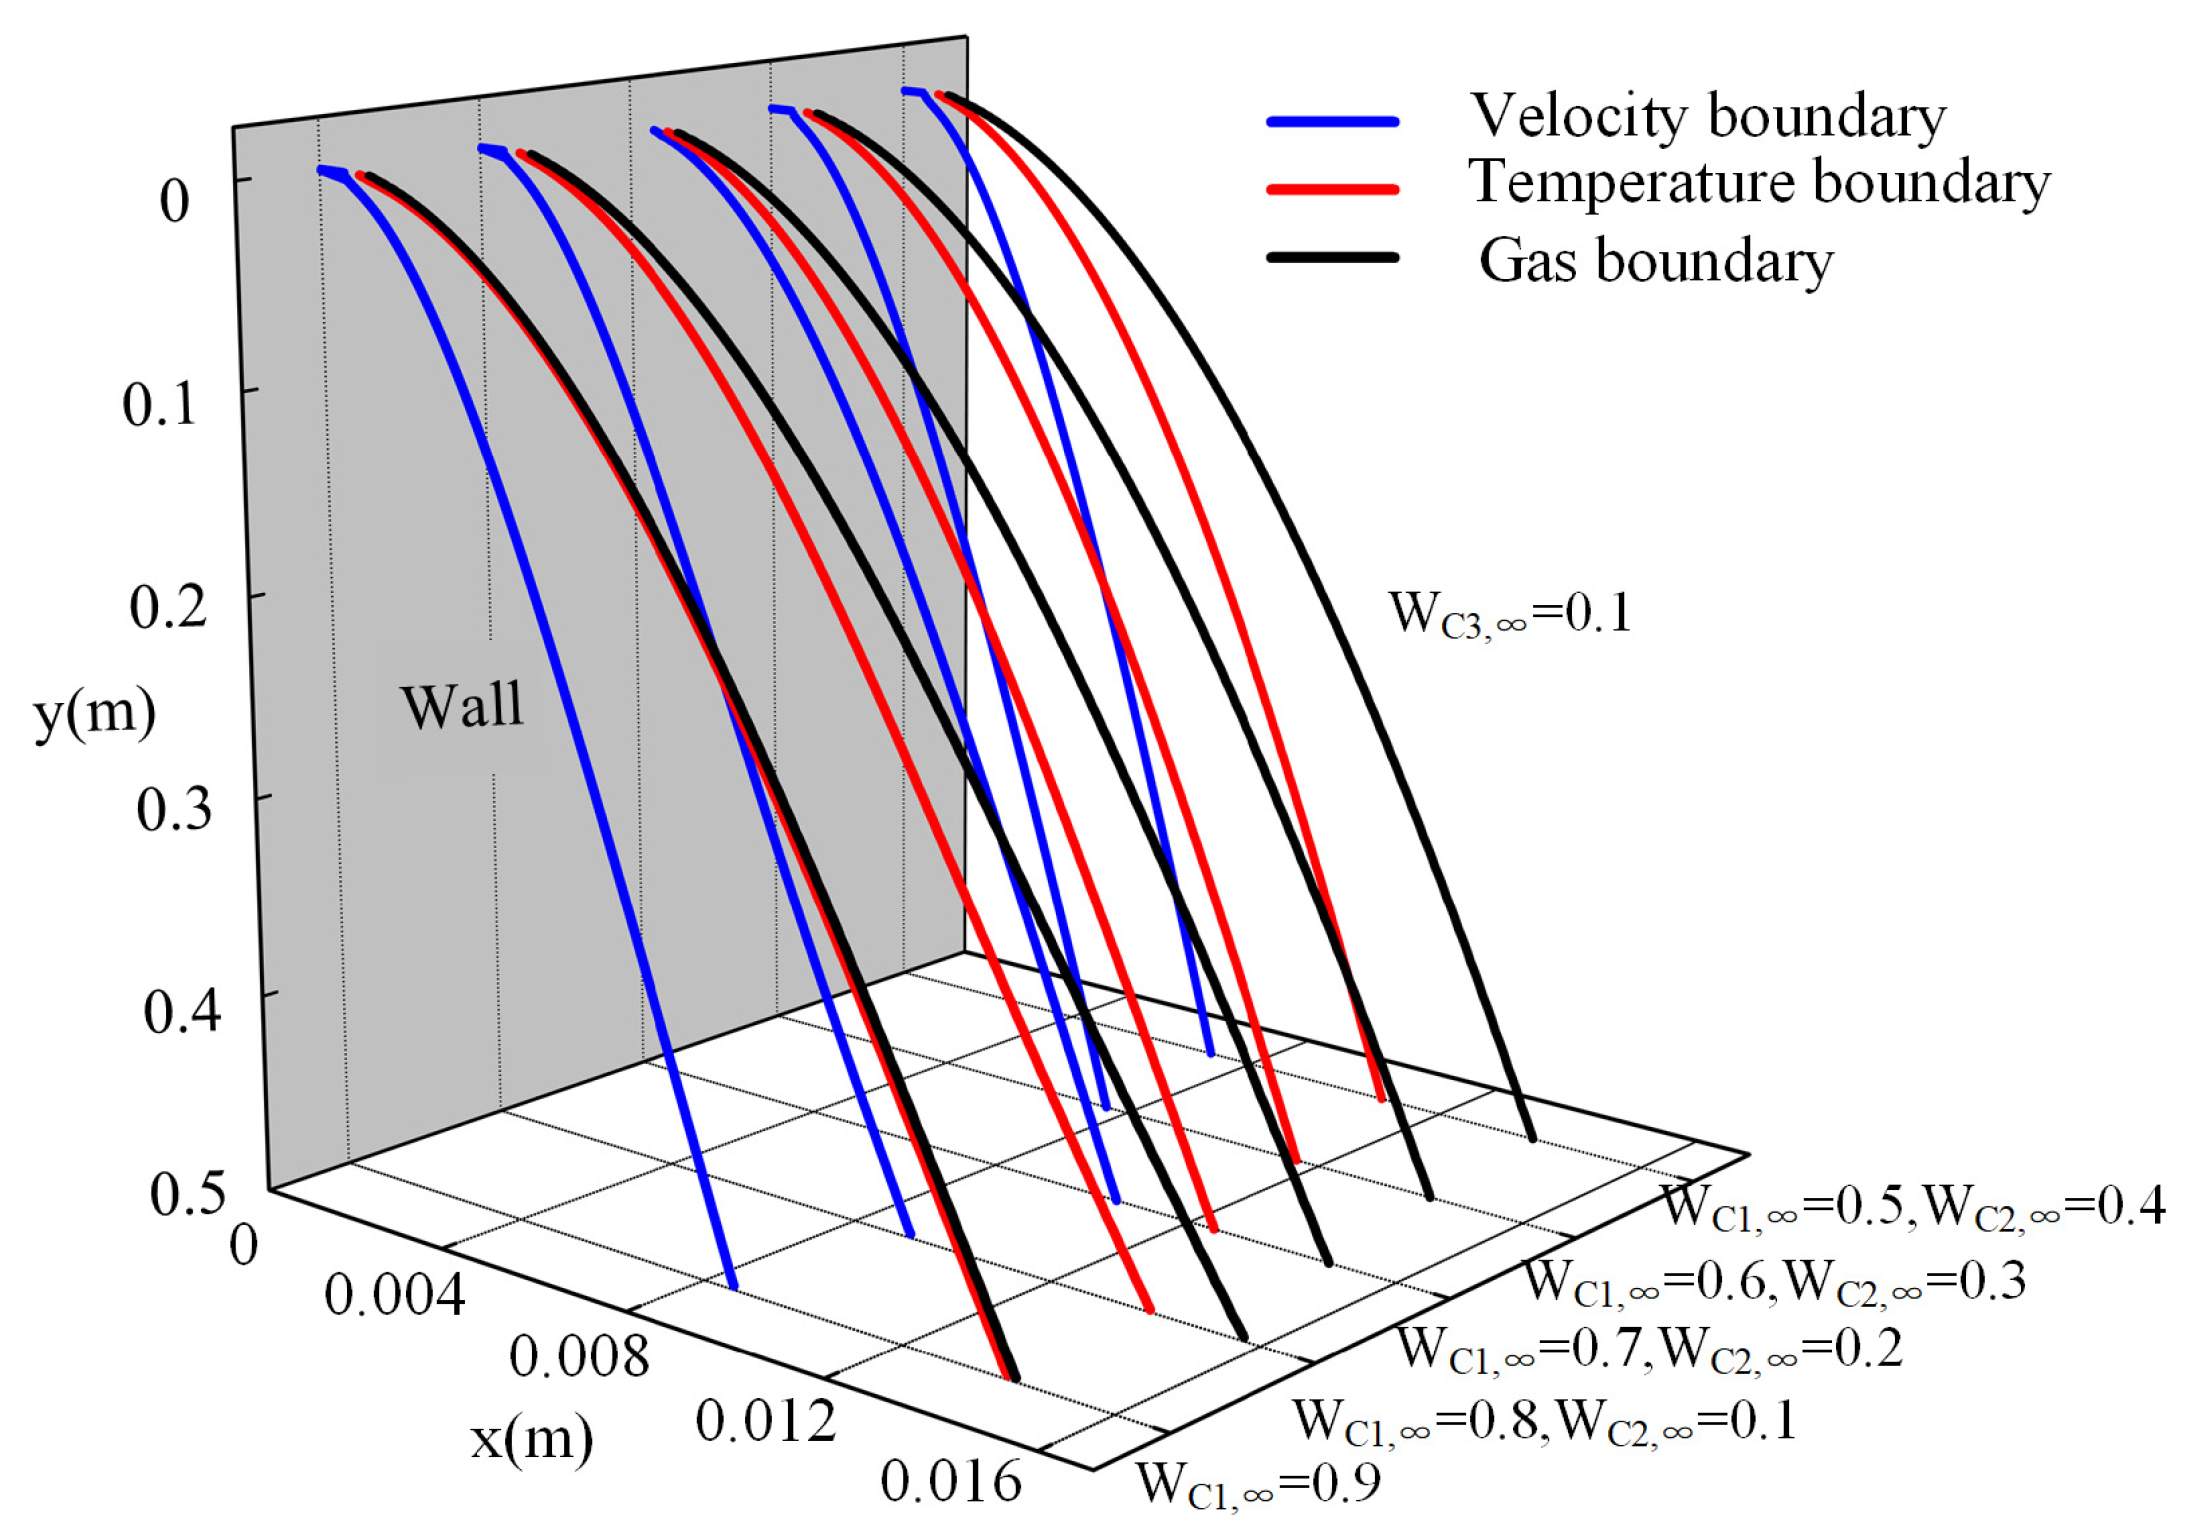
The addition of ethane to the binary mixture (methane/propane) separated the temperature boundary layer and gas boundary layer. The separation distance becomes larger with the increase in inlet molar fraction of ethane. The ethane gas is more likely to accumulate near the wall compared with the lighter methane. Meanwhile, the increase in ethane concentration lowers the accumulation of methane near the wall.
(3)
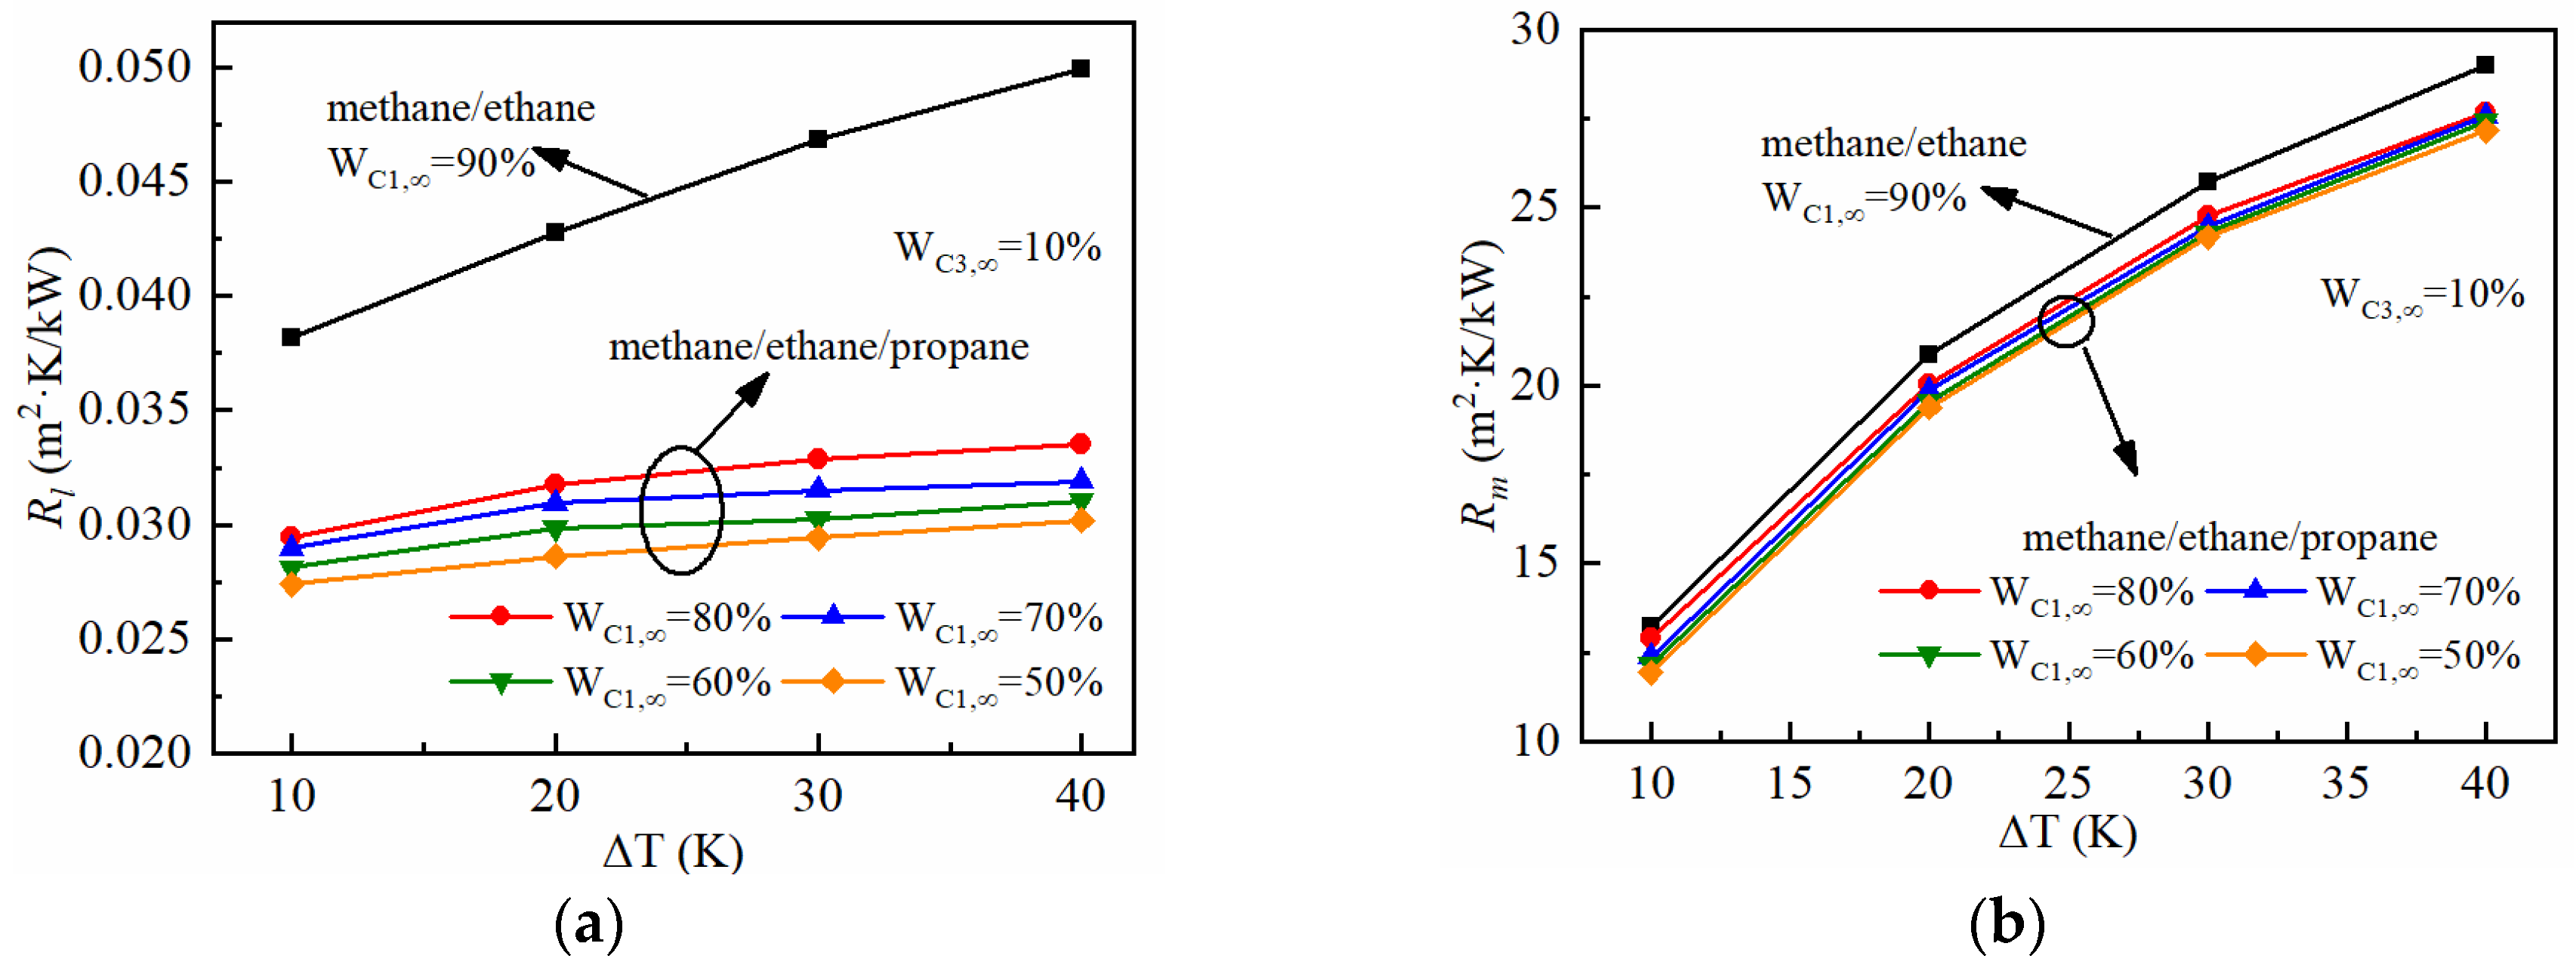
In the condensation process of the propane vapor with a high non-condensable gas molar fraction of 90%, the thermal resistance of the gas boundary layer is one hundred times higher than that of the liquid film. The effect of the wall sub-cooled temperature is more significant on the gas boundary layer than that of the liquid film.
(4)
The addition of ethane to the propane and methane mixture increases the heat transfer coefficient by about 11% (at ΔT = 10 K) and 7% (at ΔT = 40 K), as the molar fraction of ethane increases from 0 to 40%. Under the calculated conditions of WC2,∞ = 10%, the condensation heat transfer coefficient decreases by 53~56% as the wall sub-cooled temperature increases from 10 K to 40 K.

Author Contributions

Conceptualization, L.Z. and Y.C.; methodology, Y.C. and G.Z.; software, L.Z.; validation, L.Z., W.M. and X.S.; data curation, L.Z. and W.M.; writing—original draft preparation, L.Z.; writing—review and editing, L.Z., X.S. and W.M.; funding acquisition, L.Z. and G.Z. All authors have read and agreed to the published version of the manuscript.

Funding

This research was funded by the Shandong Provincial Natural Science Foundation of China, grant numbers ZR2021QE273 and ZR2022ME003.

Data Availability Statement

Datasets are available upon reasonable request.

Conflicts of Interest

The authors declare no conflict of interest.

Nomenclature

AArea (m2)
cpSpecific heat capacity (J/(kg⋅K))
DDiffusion coefficient (m2/s)
FVolume fraction
gGravity acceleration (m/s2)
hHeat transfer coefficient (W/(m2⋅K))
hfgLatent heat (J/kg)
jDiffusion flux (kg/(m2⋅s))
kThermal conductivity (W/(m⋅K))
m ˙ i Mass flux (kg/(m2⋅s))
MMolecular mass (kg/mol)
uVelocity (m/s)
wMass fraction
WMole fraction
pPressure (Pa)
qHeat flux (W/m2)
RHeat transfer resistance (m2⋅K/W)
SSource term (kg/(m⋅s) or W/m)
TTemperature (K)
xHorizontal coordinate axis (m)
yLongitudinal coordinate axis (m)
Greek symbols
δLiquid film thickness (m)
ρDensity (kg/m3)
σSurface tension coefficient (N/m)
μDynamic viscosity (Pa⋅s)
νKinematic viscosity (m2/s)
Subscripts
lLiquid
mGas mixture
iGas–liquid interface
Inlet (bulk flow)
C1Methane
C2Ethane
C3Propane
condCondensation
convConvection
Acronyms
VOFVolume of Fluid method
LNGLiquefied natural gas
PISOPressure-Implicit with Splitting of Operators
PRESTOPressure Staggering Option

References

  1. Zhang, L.; Zhang, G.; Mao, W.; Zhang, Y.; Zhang, J. Experimental and numerical study on filmwise condensation of pure propane and propane/methane mixture. Int. J. Heat Mass Transf. 2020, 156, 119744. [Google Scholar] [CrossRef]
  2. Zhang, L.; Zhang, G.; Zhang, Y.; Tian, M.; Zhang, J. A 2D numerical study on the condensation characteristics of three non-azeotropic binary hydrocarbon vapor mixtures on a vertical plate. Chin. J. Chem. Eng. 2020, 28, 2746–2757. [Google Scholar] [CrossRef]
  3. Maxwell, J.C. On the Dynamical Theory of Gases. In Kinetic Theory; Brush, S.G., Ed.; Pergamon: Oxford, UK, 1867; Volume 157, pp. 49–88. [Google Scholar]
  4. Toor, H. Diffusion in three-component gas mixtures. AIChE J. 1957, 3, 198–207. [Google Scholar] [CrossRef]
  5. Krishna, R.; Wesselingh, J.A. The Maxwell-Stefan approach to mass transfer. Chem. Eng. Sci. 1997, 52, 861–911. [Google Scholar] [CrossRef]
  6. Jackson, R. Diffusion in Ternary Mixtures with and without Phase Boundaries. Ind. Eng. Chem. Fundam. 1977, 16, 304–306. [Google Scholar] [CrossRef]
  7. Broeke, L.J.P.V.D.; Nijhuis, S.A.; Krishna, R. Monte Carlo Simulations of Diffusion in Zeolites and Comparison with the Generalized Maxwell-Stefan Theory. J. Catal. 1992, 136, 463–477. [Google Scholar]
  8. Kerkhof, P.J.A.M. A modified Maxwell-Stefan model for transport through inert membranes: The binary friction model. Chem. Eng. J. Biochem. Eng. J. 1996, 64, 319–343. [Google Scholar] [CrossRef] [Green Version]
  9. Minkowycz, W.J.; Sparrow, E.M. Condensation heat transfer in the presence of noncondensables, interfacial resistance, superheating, variable properties, and diffusion. Int. J. Heat Mass Transf. 1966, 9, 1125–1144. [Google Scholar] [CrossRef]
  10. Dehbi, A.A. The Effects of Noncondensable Gases on Steam Condensation under Turbulent Natural Convection Conditions. Ph.D. Thesis, University of Arizona, Tucson, AZ, USA, 1991. [Google Scholar]
  11. Colburn, A.P.; Hougen, O.A. Design of Cooler Condensers for Mixtures of Vapors with Noncondensing Gases. Ind. Eng. Chem. 1934, 26, 1178–1182. [Google Scholar] [CrossRef]
  12. Maheshwari, N.K.; Saha, D.; Sinha, R.K.; Aritomi, M. Investigation on condensation in presence of a noncondensable gas for a wide range of Reynolds number. Nucl. Eng. Des. 2004, 227, 219–238. [Google Scholar] [CrossRef]
  13. Taitel, Y.; Tamir, A. Film condensation of multicomponent mixtures. Int. J. Multiph. Flow 1974, 1, 697–714. [Google Scholar] [CrossRef]
  14. Nusselt, W. The surface condensation of water vapour. Z. Des Vereines Dtsch. Ingenieure 1916, 60, 541–546. [Google Scholar]
  15. Sage, F.E.; Estrin, J. Film condensation from a ternary mixture of vapors upon a vertical surface. Int. J. Heat Mass Transf. 1976, 19, 323–333. [Google Scholar] [CrossRef]
  16. Peterson, P.F. Diffusion Layer Modeling for Condensation with Multicomponent Noncondensable Gases. J. Heat Transf. 2000, 122, 716. [Google Scholar] [CrossRef]
  17. Ganguli, A.; Patel, A.G.; Maheshwari, N.K.; Pandit, A.B. Theoretical modeling of condensation of steam outside different vertical geometries (tube, flat plates) in the presence of noncondensable gases like air and helium. Nucl. Eng. Des. 2008, 238, 2328–2340. [Google Scholar] [CrossRef]
  18. Karkoszka, K.; Anglart, H. Multidimensional Effects in Laminar Filmwise Condensation of Water Vapour in Binary and Ternary Mixtures with Noncondensable Gases. Nucl. Eng. Des. 2008, 238, 1373–1381. [Google Scholar] [CrossRef]
  19. Karkoszka, K.; Anglart, H. Laminar filmwise condensation of vapor in presence of multi-component mixture of non-condensable gases. In Proceedings of the 12th International Topical Meeting on Nuclear Reactor Thermal Hydraulics, Pittsburgh, PA, USA, 30 September–4 October 2007. [Google Scholar]
  20. Liu, H.; Todreas, N.E.; Driscoll, M.J. An experimental investigation of a passive cooling unit for nuclear plant containment. Nucl. Eng. Des. 2000, 199, 243–255. [Google Scholar] [CrossRef] [Green Version]
  21. Su, J.; Sun, Z.; Ding, M.; Fan, G. Analysis of experiments for the effect of noncondensable gases on steam condensation over a vertical tube external surface under low wall subcooling. Nucl. Eng. Des. 2014, 278, 644–650. [Google Scholar] [CrossRef]
  22. Xu, H.Q.; Gu, H.F.; Sun, Z.N. Forced convection condensation of steam in the presence of multicomponent noncondensable gases inside a horizontal tube. Int. J. Heat Mass Transf. 2017, 104, 1110–1119. [Google Scholar] [CrossRef]
  23. Park, I.W.; Yang, S.H.; Lee, Y.-G. Effect of light gas on condensation heat transfer of steam–air mixture and gas stratification. Int. J. Heat Mass Transf. 2021, 179, 121716. [Google Scholar] [CrossRef]
  24. Park, I.W.; Yang, S.H.; Lee, Y.-G. Degradation of condensation heat transfer on a vertical cylinder by a light noncondensable gas mixed with air-steam mixtures. Int. Commun. Heat Mass Transf. 2022, 130, 105779. [Google Scholar] [CrossRef]
  25. Duncan, J.B.; Toor, H.L. An experimental study of three component gas diffusion. AIChE J. 1962, 8, 38–41. [Google Scholar] [CrossRef]
  26. Zhang, L.; Zhang, G.; Tian, M.; Zhang, J.; Zhang, Y. Modeling of laminar filmwise condensation of methane with nitrogen on an isothermal vertical plate. Int. Commun. Heat Mass Transf. 2019, 105, 10–18. [Google Scholar] [CrossRef]
Figure 1. Schematic of the physical model and computational conditions.
Energies 16 05873 g001
Figure 2. Numerical procedure.
Energies 16 05873 g002
Figure 3. Heat transfer coefficient with different grid numbers, at WC3,∞ = 10%, WC2,∞ = 40%, WC1,∞ = 50% and ΔT = 10 K.
Energies 16 05873 g003
Figure 4. Condensation heat transfer coefficient [9].
Energies 16 05873 g004
Figure 5. The condensation characteristics at the outlet, at WC3,∞ = 10% and ΔT = 10 K. (a) Liquid volume fraction; (b) molar fraction of propane; (c) temperature and (d) velocity.
Energies 16 05873 g005
Figure 6. Distribution of the methane and ethane molar fraction on the sections perpendicular to the flow direction, at WC1,∞ = 0.6, WC2,∞ = 0.3 and ΔT = 10 K.
Energies 16 05873 g006
Figure 7. Profile of the methane and ethane gas molar fraction at the outlet with different inlet molar fractions, at ΔT = 10 K.
Energies 16 05873 g007
Figure 8. Profile of the dimensionless methane and ethane gas molar fraction at the outlet with different inlet molar fractions, at ΔT = 10 K.
Energies 16 05873 g008
Figure 9. The methane and ethane gas molar fraction at the outlet with different subcooled temperatures, at WC1,∞ = 0.6 and WC2,∞ = 0.3.
Energies 16 05873 g009
Figure 10. Profile of the liquid film along the flow direction with different inlet methane and ethane gas molar fractions, at WC3,∞ = 10% and ΔT = 10 K.
Energies 16 05873 g010
Figure 11. Contours of the liquid volume fraction, at ΔT = 10 K. (a) Propane and methane; and (b) propane, ethane and methane.
Energies 16 05873 g011
Figure 12. The velocity distribution of propane/methane on y = 0, 0.1, …, 0.5, at WC1,∞ = 10% and ΔT = 10 K. (a) Velocity magnitude and (b) velocity in the x-direction.
Energies 16 05873 g012
Figure 13. Distribution of the velocity, temperature and gas boundary layer along the flow direction, at WC3,∞ = 10% and ΔT = 10 K.
Energies 16 05873 g013
Figure 14. Thermal resistance of the liquid film and gas boundary layer, at WC3,∞ = 10%. (a) Liquid film and (b) gas boundary layer.
Energies 16 05873 g014
Figure 15. The thermal resistance ratio of the gas boundary layer and liquid film, at WC3,∞ = 10%.
Energies 16 05873 g015
Figure 16. Distribution of the average heat transfer coefficient.
Energies 16 05873 g016
Disclaimer/Publisher’s Note: The statements, opinions and data contained in all publications are solely those of the individual author(s) and contributor(s) and not of MDPI and/or the editor(s). MDPI and/or the editor(s) disclaim responsibility for any injury to people or property resulting from any ideas, methods, instructions or products referred to in the content.

