Article

Assessment of Energy Efficiency Using an Energy Monitoring System: A Case Study of a Major Energy-Consuming Enterprise in Vietnam

1
Faculty of Industrial and Energy Management, Electric Power University, Ministry of Industry and Trade, Hanoi 100000, Vietnam
2
Institute of Energy Science, Vietnam Academy of Science and Technology, Hanoi 100000, Vietnam
3
Faculty of Materials and Energy Sciences, Graduate University of Science and Technology, Vietnam Academy of Science and Technology, Hanoi 100000, Vietnam
4
Department of Personnel and Organization, Electric Power University, Ministry of Industry and Trade, Hanoi 100000, Vietnam
5
Hawaii Natural Energy Institute, University of Hawaii at Manoa, Honolulu, HI 96822, USA
*
Authors to whom correspondence should be addressed.
Energies 2023, 16(13), 5214; https://doi.org/10.3390/en16135214
Submission received: 28 May 2023 / Revised: 22 June 2023 / Accepted: 28 June 2023 / Published: 6 July 2023
(This article belongs to the Special Issue Key Technologies and Challenges for Power Electronics System)

Abstract

:
Vietnam’s economy has been growing rapidly in the last 20 years, leading to significant increases in energy consumption as well as in carbon emissions. Most electricity is consumed by loads of industry and construction due to the country’s socio-economic development strategy. An energy saving strategy cannot be achieved if the industry factories lack energy consumption data. The installation of energy monitoring systems can help to improve energy efficiency by supplying daily, monthly, and yearly energy consumption reports. Moreover, major energy-consuming enterprises in Vietnam must implement solutions for energy-efficient use as prescribed in the Law on Energy Efficient Use. Therefore, this study aimed to determine the impact of an energy monitoring system as an improvement solution for energy efficiency in a typical major energy-consuming enterprise in Vietnam. The study’s results, after six months, show that the total saved electricity after installing the power monitoring system was 191,923 kWh. The company saved approximately 19.584 USD and reduced emission to the environment by 139 tons of CO2. In addition, the return on investment time of power monitoring systems is about 14 months, while the annual energy costs of the factory can be reduced by about 9.62% per year. Therefore, power monitoring systems should be promoted in factories with different scales to control energy wastage in the domestic industry field.

1. Introduction

Currently, the amount of electricity worldwide is increasing to serve socio-economic development [1]. However, electricity prices in many countries around the world are still high [2] due to the energy crisis, prolonged inflation, and the ongoing war in Ukraine [3]. Further, the use of fossil energy sources for electricity generation also causes many problems which affect the environment [4,5]. Therefore, saving electricity [6] is one of the reasonable solutions to improve energy efficiency [7] and ensure national energy security [8].
Industry load is still the main consumer of electricity [9] around the world [10,11]. The industrial sector accounted for 38% (~169 EJ) of the global final use energy total in 2021, compared with 33% in 2000 [12]. Therefore, electricity saving in the industrial sector needs to be achieved through solutions that allow for improving energy efficiency [13], especially for energy-intensive industries [14,15] such as chemicals, iron and steel, food and beverages, cement, and concrete [16]. Moreover, improving energy efficiency is also considered to be an effective measure to promote energy saving, emission reduction, and the meeting of sustainable development goals for countries around the world [17]. In the Netherlands, large enterprises have an obligation to perform an energy audit every four years, according to The Environment and Planning Act. The obligation applies to major energy-consuming enterprises that use more than 50,000 kWh of electricity or 25,000 m3 of gas per year [18]. Besides, the Energy Saving Opportunities Scheme (ESOS) was developed by the governments in the United Kingdom (UK) to help large enterprises realize the financial benefits of implementing energy efficiency solutions [19].
Some solutions are used to improve the efficiency of electricity saving in the industry, such as energy audit [20], behavior change [21], and the use of energy-saving devices in production [22]. In addition, the power monitoring system is also studied and applied in industrial factories [23] to contribute to improving the efficiency of electricity use. The power monitoring system [24] was used to ascertain the power loss and helped to increase the energy efficiency by about 8% for an automobile factory in Pakistan. A distributed power monitoring system is considered essential to improving an organization’s energy efficiency according to the recent European Standard EN17267-2019—Energy measurement and monitoring plan: Design and Implementation [25]. A food factory used an IoT-integrated power monitoring system to collect real-time energy data in a food production system to support informed operational decisions and realize knowledge about energy, resulting in optimized energy consumption and significant savings of about 163,000 kWh in 2017 [26]. A study using energy monitoring equipment was carried out to monitor and reduce the energy consumption of the machining system. The results showed that the power consumption of the machining equipment was reduced by 49.67 kJ [27]. Based on energy monitoring instrumentation [28], an energy efficiency analysis modeling system was built to estimate energy costs by using the load profile of a rail car manufacturing factory as a case study, and an analysis of product manufacturing was provided to meet energy efficiency program requirements. A parameter optimization model and an energy-aware fault control strategy based on IoT energy monitoring were proposed in an aluminum die-casting factory [29]. The research results showed that the energy consumption level was reduced by about 2% using online control of the furnace standby mode. Some other existing solutions in the field were studied to create modern distributed systems for collecting and processing data on the state of various objects, including energy facilities [30,31].
Vietnam’s economy was growing, by 2022, with a growth rate of 8.0%, surpassing the average of 7.1% during 2016–2019 [32]. In the recent decade, the average growth rate of electricity demand reached about 10.3% in the period of 2011–2020. In 2020 and 2021, the energy demand growth rate slowed down by about 3% per year due to the COVID-19 pandemic. However, electricity demand, according to forecasts for the coming period, will still grow by 8–9% per year [33], and the electricity consumption per capita in Vietnam has been about 2300 kWh per year [34]. This is a challenge to ensure the balance of the electricity supply and demand in Vietnam. Most electricity is consumed by the industry and construction sectors due to their contributing to the country’s socio-economic development strategy. This sector accounts for more than 54% of the total national electricity consumption, with an average growth rate of 11% per year for the whole period of 2010–2019. However, the reality of energy use in Vietnam is still very wasteful and the intensity of energy use is very high compared to the average level of other countries in the Asian region [35]. Technically, the energy saving potential in the assessed industries can reach about 20% [36] if appropriate solutions are applied.
The Government of Vietnam has continuously made efforts to increase energy efficiency by promulgating many related policies as well as launching specific activities to promote efficient energy use. The National Program on Saving and Efficient Use of Energy for the period of 2019–2030 [37] was approved to save 8–10% of the total national energy consumption in the period from 2019 to 2030, equivalent to about 60 million tons of oil equivalent (TOE).
Solutions which improve energy efficiency in the industry sector in Vietnam [38,39,40] have been applied such as audits, the integration of energy saving and renewable energy technologies, and the application of smart devices in the management and operation of energy use systems, including power monitoring systems [41]. Research projects on the application of energy monitoring systems for industrial factories in Vietnam are mainly designed at the request of factory owners without a specific assessment of energy-saving efficiency by using an energy monitoring system. In addition, major energy use enterprises often install traditional meters to monitor the general energy use situation for the entire factory, but there is no specific real-time measurement system for the energy use situation at the workshops or for the manufacturing processes. The main operating parameters are recorded by traditional meters, and the collection data is used to calculate the cost of production, but it does not evaluate and improve energy efficiency in the factory. On the other hand, many major industrial factories in Vietnam are not ready to invest in real-time power monitoring systems for the entire process of power use in the factory because they do not have enough information about the technical economic and benefits of power monitoring system.
Therefore, this paper studies a real-time power monitoring system installed to monitor manufacturing processes of a typical major industrial factory in Vietnam and analyzes the obtained energy-saving efficiency. The power monitoring system is considered to be economically beneficial for business owners because the annual energy-saving cost is much higher than the total initial investment. Further, the monitoring and management of power parameters can reduce operating costs and improve the efficiency and operation time of machines and equipment.
This paper is organized into the following sections: Section 2 presents the proposed assessment methodology. Section 3 provides a comprehensive description of the case study at the selected enterprise with high energy consumption. Section 4 is dedicated to presenting the results and discussion derived from the assessment. Finally, the conclusion is presented in Section 5.

2. Methodology

Currently, industrial enterprises are showing significant interest in energy conservation and energy efficiency at both the technical and organizational levels. In general, major energy use enterprises in Vietnam often install traditional meters to monitor the energy use situation for the entire factory, and the energy data are collected and used to determine the production cost but cannot assess and contribute to increasing energy efficiency in the factory. The installation of the real-time energy monitoring system can serve the power consumption management needs and raise the energy efficiency of machines and equipment in industrial factories. Therefore, the steps shown in Figure 1 are proposed to provide a comprehensive evaluation of the enterprise’s energy saving which resulted from the real time power monitoring system after replacing the traditional meters.
Firstly, data on power-consuming equipment and the power grid infrastructure in the factory are collected by a survey. This survey aims to gain a comprehensive understanding of the specifics of the power supply and consumption points in the factory. After collecting and measuring the information, the data will be screened and synthesized by expert methods [42] into analytical and valuable indicators.
In the next step, the current state of the company’s energy management system in general, and the existing power monitoring system in particular, are evaluated to renovate and improve the energy efficiency. The role of the energy management system is to control and monitor energy consumption over time, so that managers can find unreasonable problems and make decisions to improve energy-saving efficiency. The establishment of a monitoring measurement system must ensure accuracy and timeliness. Accordingly, an automatic power monitoring system using energy monitoring software is implemented.
Thirdly, additional installation locations of power monitoring equipment in the factory are identified to determine the level of power loss at each important electrical load location in the factory.
Finally, the electricity measurement data of the periods with and without the upgraded power monitoring system are collected and compared to have a basis for assessing the economic, technical, and environmental efficiency of the enterprise such as total saved electricity, cost of saving electricity, and reduction in the amount of CO2 emitted to the environment.
Assumptions:
-
There is no maintenance and operation cost.
-
Before deploying the monitoring system, the company needs electricity (Ebefore) to produce a number of products (Volbefore), then the specific energy consumption (SEC) equals Ebefore divided by Volbefore.
-
After deploying the monitoring system, the company needs electricity (E) to produce the same number of products (Volafter). Then, SECafter equals E divided by Volafter.
The monitoring system helps to warn of all of the abnormal conditions, then reduce total energy consumption. In the same condition of SECbefore, the company has to need (Volafter × SECbefore) of energy to produce Volafter of products. Therefore, the total saved electricity can be determined by the following, Formula (1):
TSE = Volafter × SECbefore − E
where TSE is total saved electricity (kWh); Volafter is total production output after installing the power monitoring system (m3); SECbefore is the average specific energy consumption of production processes before installing the power monitoring system (kWh/m3), and describes the amount of electricity used to produce one unit of product; E is the real electricity consumption measured by using the power monitoring system (kWh).
The cost of saving electricity is calculated as follows:
Cost of saving electricity = TSE × electricity price
where TSE: total saved electricity (kWh); electricity price is 2500 (VND/kWh), and it is sold by the electric company.
Finally, to evaluate the investment efficiency of the system, the return on investment (ROI) index is determined as follows:
ROI = Saved cost/Investment
where ROI is return on investment (%); Saved cost is the total cost saved from reducing electricity consumption in the period (USD); Investment is the total investment cost for the installation of the monitoring system (USD).
The average reduction in CO2 is determined as below:
kgCO2e = TSE × EFgrid
where TSE: total saved electricity (kWh); EFgrid (CO2 emission factor of the Vietnamese power grid) equals 0.7221 kgCO2/kWh [43].

3. Case Study

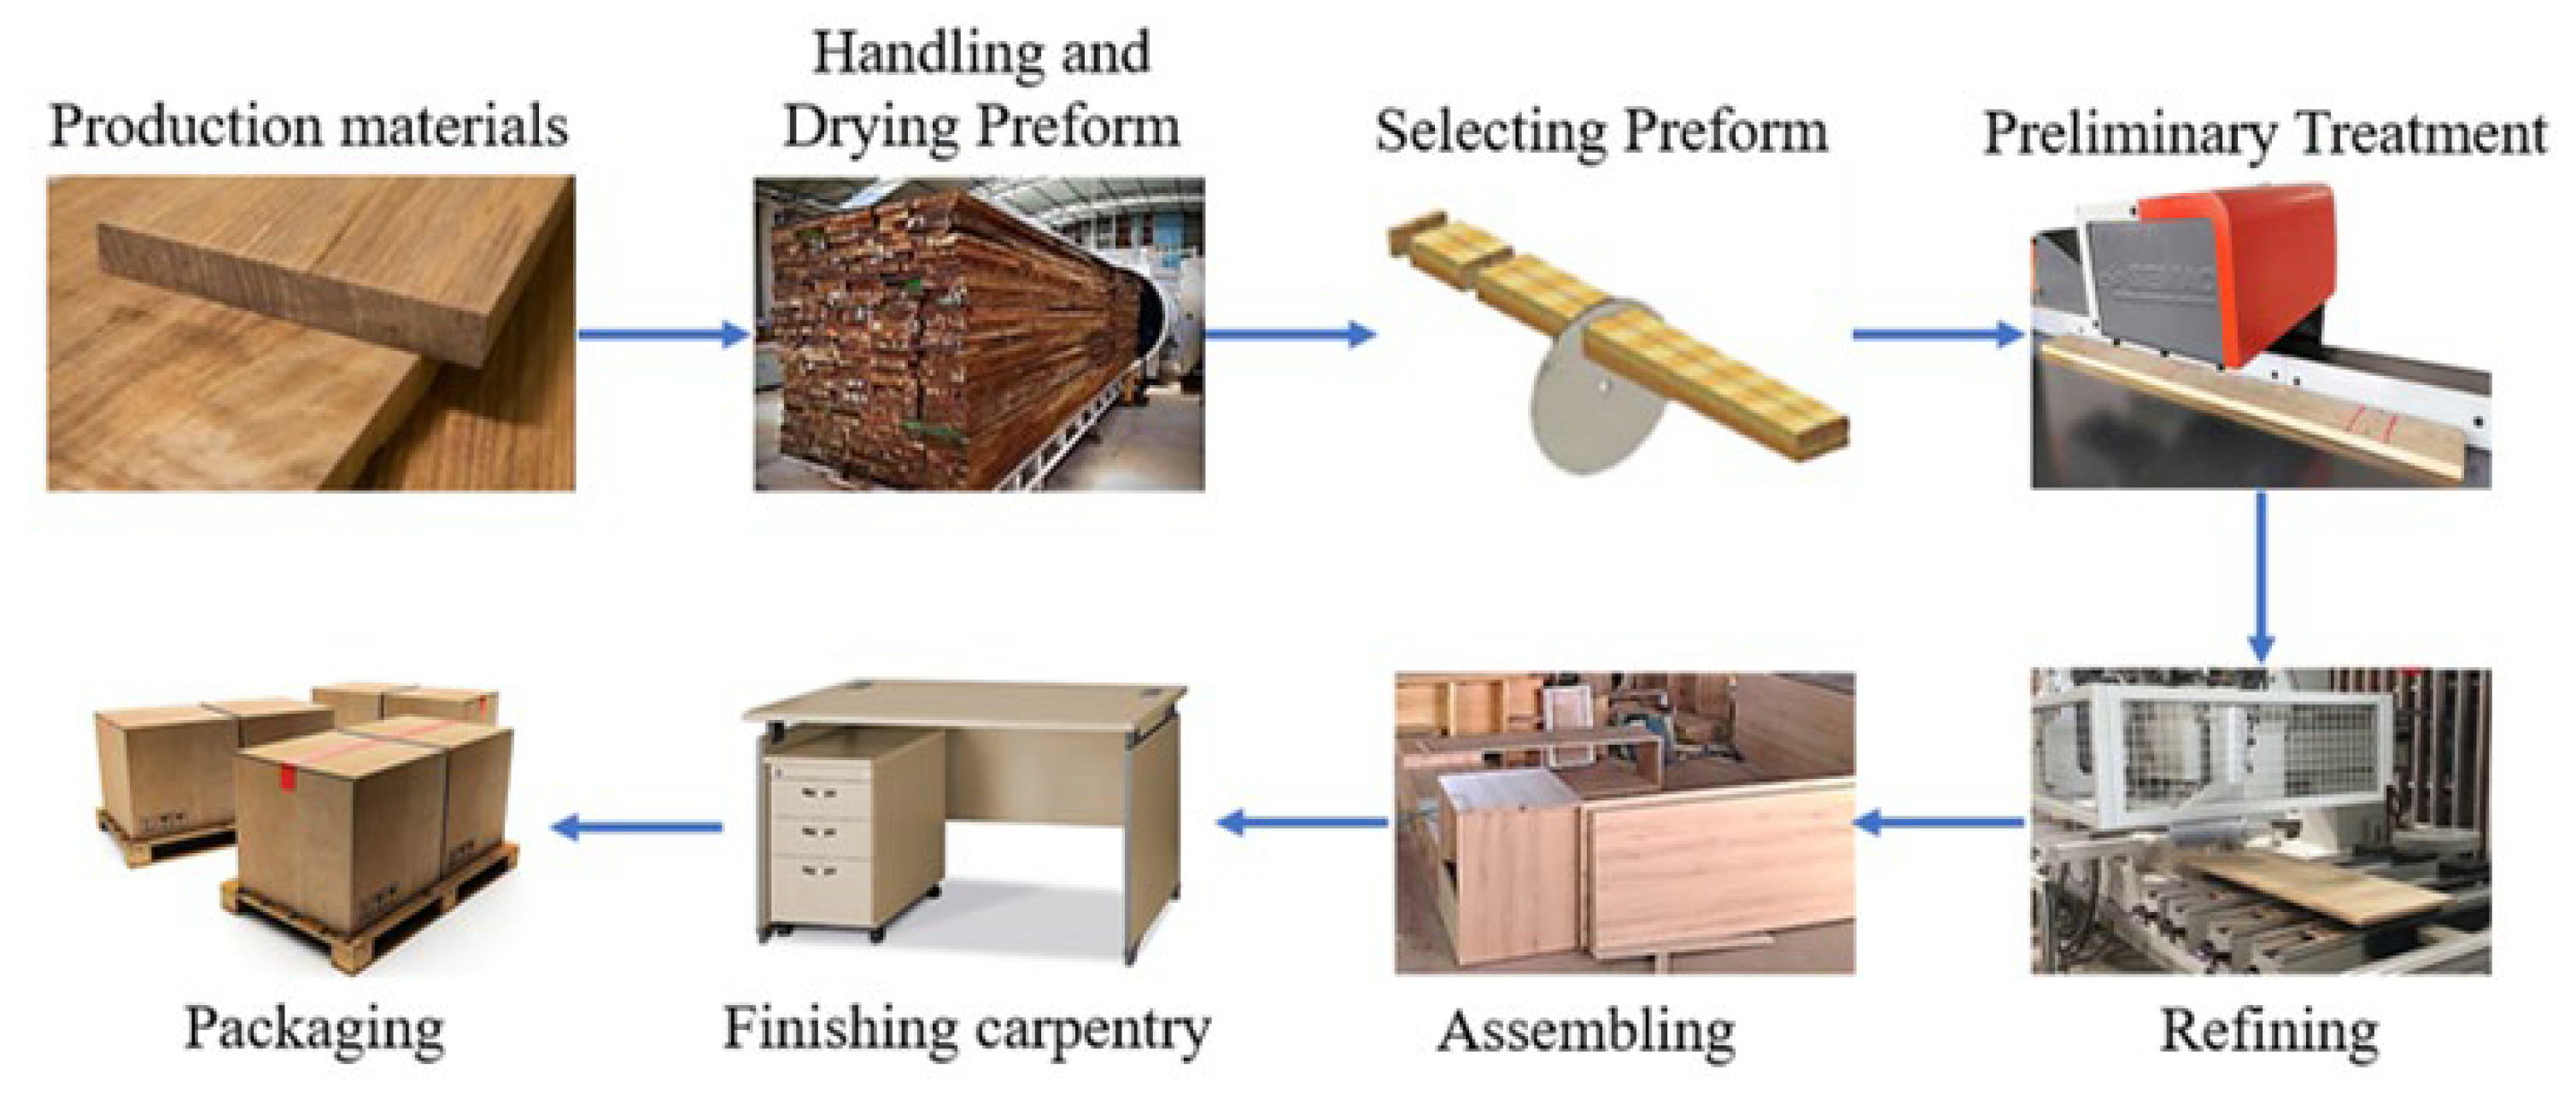
A typical enterprise in the high-energy consumption industrial production field in Vietnam was selected as the case study. The company was established in 2002 and currently employs approximately 1080 individuals. In 2022, their revenue exceeded 100 million USD. This particular enterprise specializes in the production and processing of exported wooden furniture. Their product range includes outdoor furniture such as tables, chairs, and camping sets, as well as indoor furniture like doors, tables, chairs, cupboards, WC dressers, bookshelves, and door leaves. The main production process of products is executed through a primary process of eight steps, as illustrated in Figure 2. The statistics for the energy consumption of the factory in 2021 are listed in Table 1.
It can be observed that electricity consumption accounts for 97.86% of the company’s total energy consumption. Therefore, electricity is the primary energy source, while diesel was only used for operating generators or incidents. Wood and sawdust (self-consumption) were utilized in production to serve the burning process and supply heat for product drying processes. As a consequence, electricity is primarily supplied to power the production machine systems, compressors, dust extraction systems, lighting, and air conditioner systems. The factory used a three-phase power grid, and electricity resources from the substation were divided into the electricity cabinets of processes which were scattered in the workshops.
This company is a major energy use enterprise because the total energy consumption is larger than 1000 TOE according to the Law on Energy Efficient Use in Vietnam. This law provides policies and measures to promote the economical and efficient use of energy, including the rights, obligations, and responsibilities of organizations, households, and individuals in the economical and efficient use of energy. Thus, this enterprise has to implement method of energy management and audit to improve energy use efficiency. This company built an organizational structure and energy management procedures, but the electricity consumption in the company was still at a high level, with a revenue value of about 4%. Besides, energy use monitoring activities were manually implemented monthly by measuring the consumption index to determine the KPI of its energy use. Thus, the managers needed to apply a real time power monitoring system for controlling unusual statuses in manufacturing to limit energy loss.
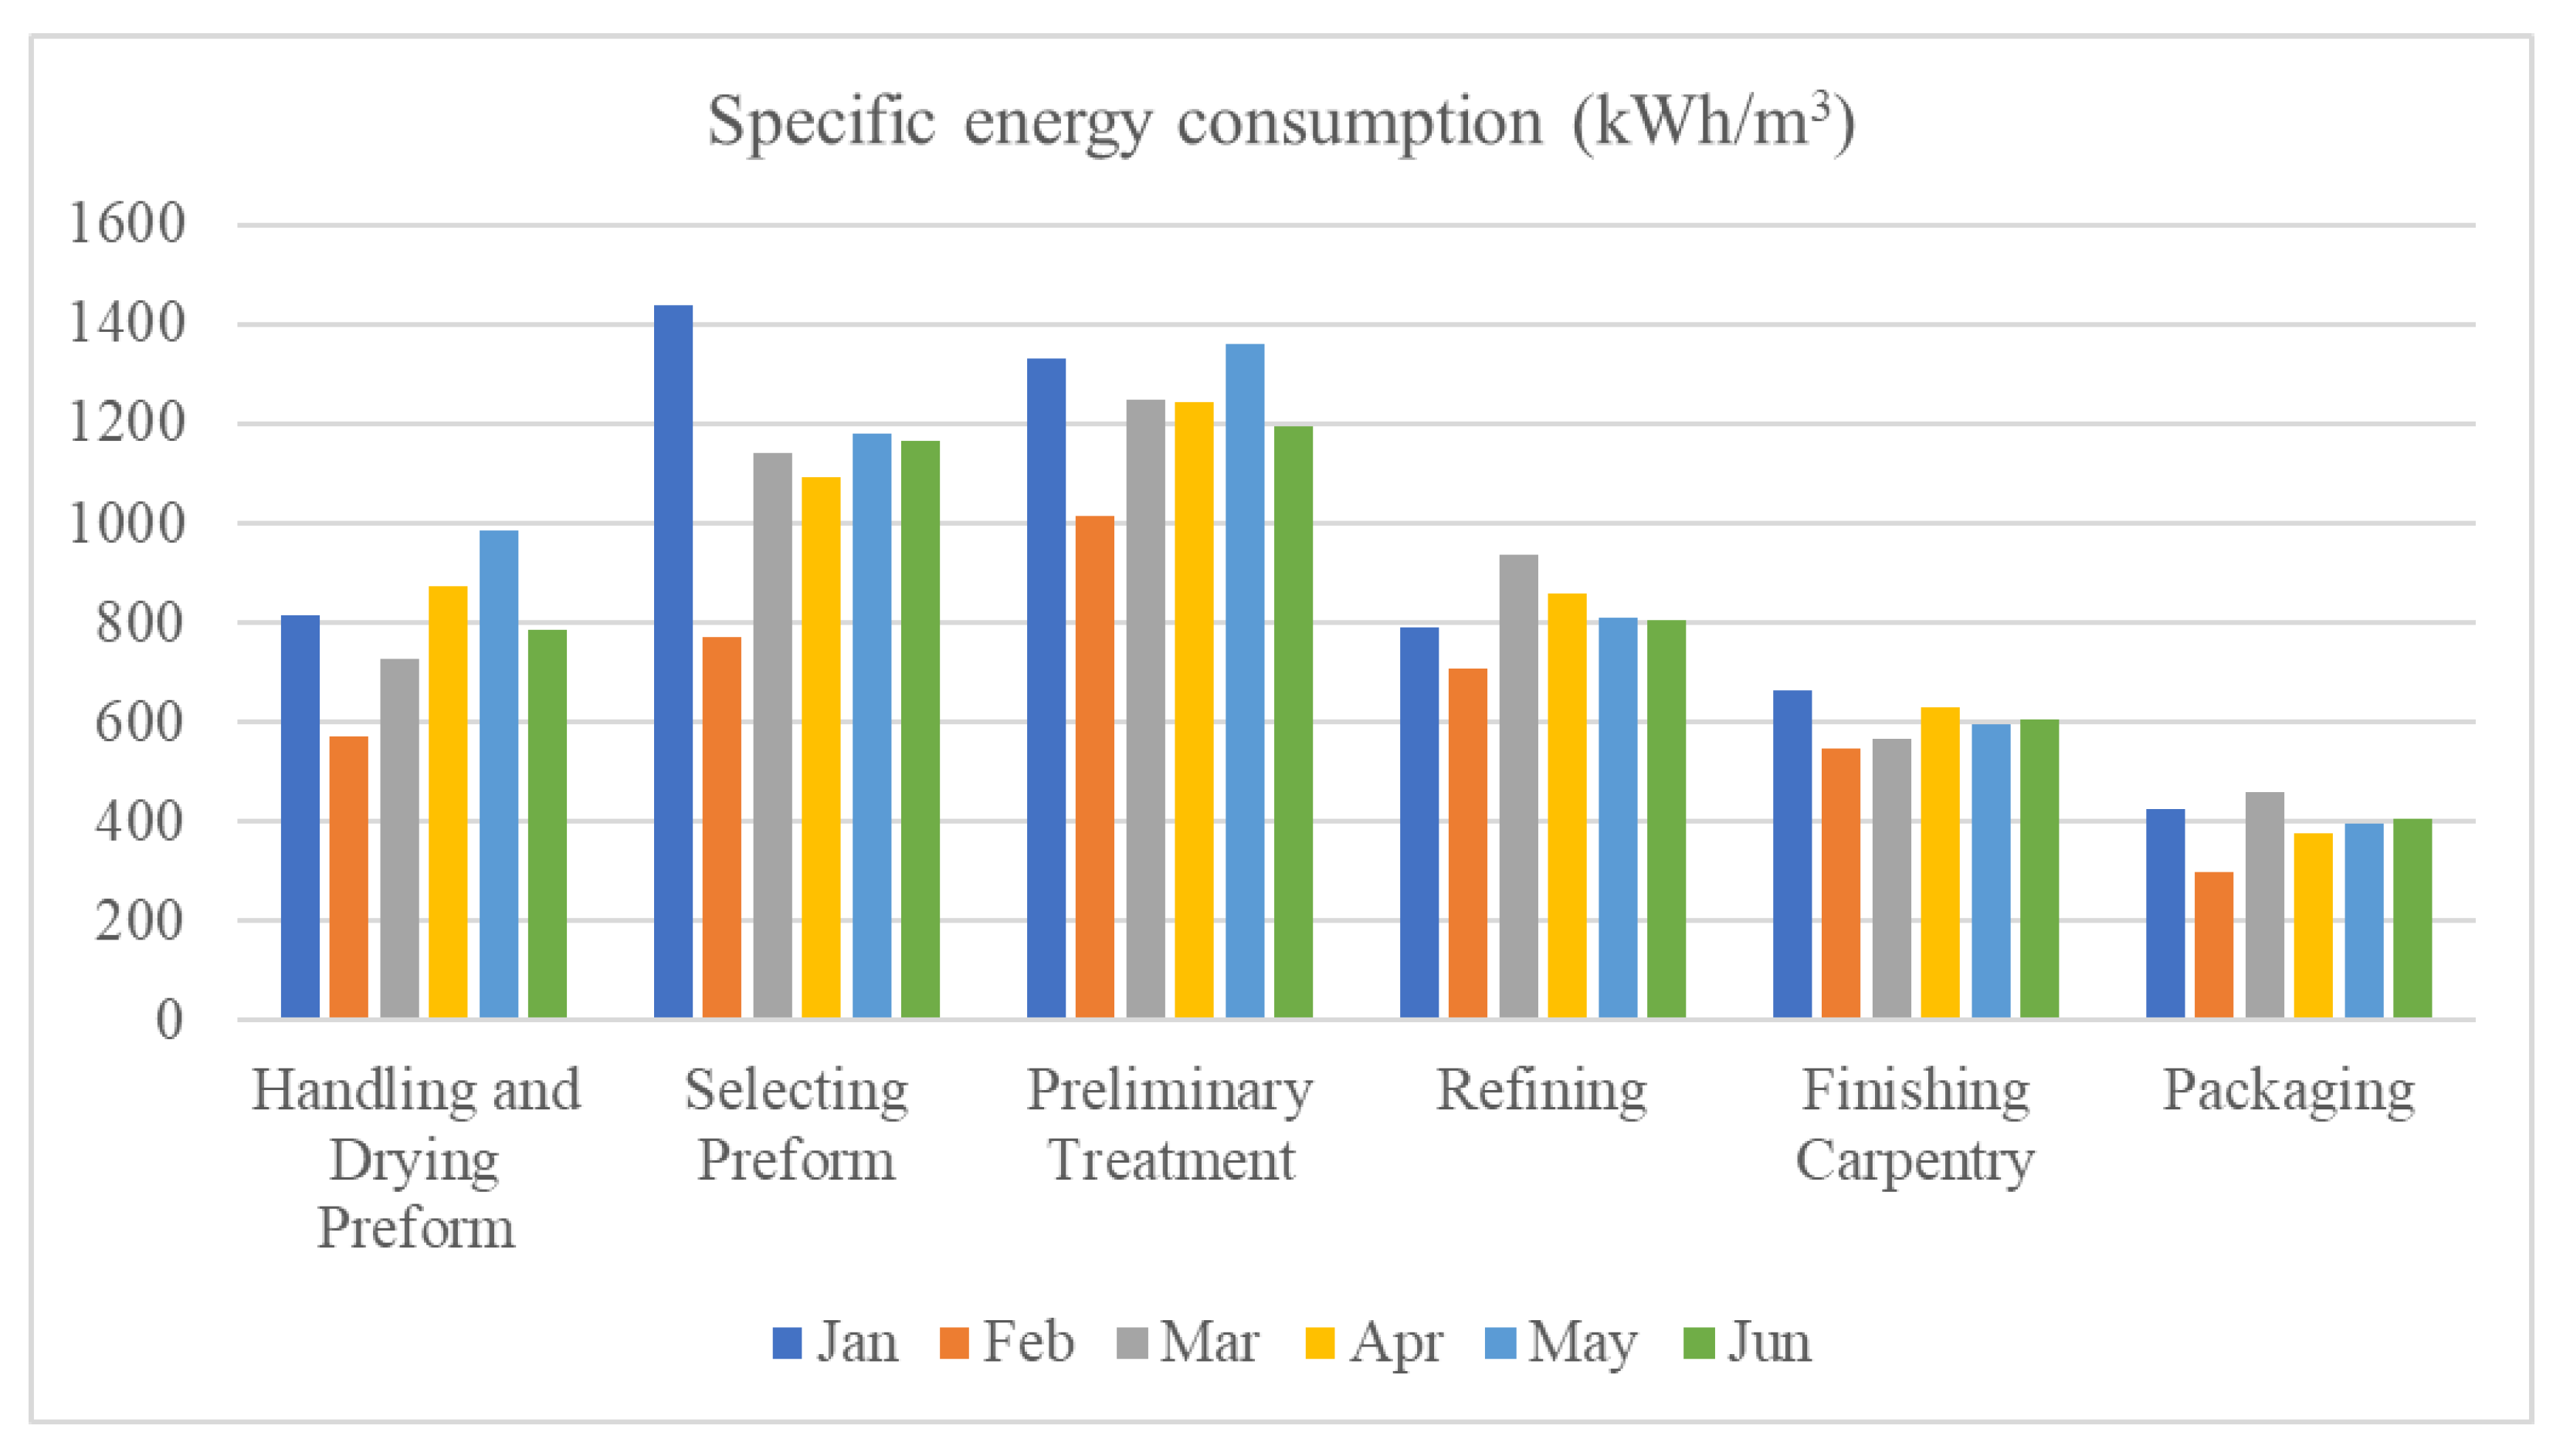
The specific energy consumption (SEC) and production output of six main manufacturing processes were collected by using the manual measurement method, as can be seen in Table 2 and Figure 3. The SEC of the processes had large fluctuations without abnormal causes. Thus, it was difficult for the managers to detect problems and make appropriate decisions regarding energy efficiency. When doing any wood furniture project, the company needs to know the volume of wood to estimate the amount of wood needed. Normally, the company calculates the total output volume of wood at each stage in the production process as m3 of product because the shape of wood products at each production stage is different.
The specific energy consumption chart in Figure 3 shows that the SEC index in January seems the highest, because the Lunar new year in Vietnam is from the middle of January to the middle of February. Thus, the production volume was reduced while the total energy requirement for the operation was not decreased very much. In addition, from March to April, the humidity in the North of Vietnam is very high; therefore, the energy required for drying processes and insulation increases. Similarly, the weather in Vietnam in May and June is very hot, and the demand for air cooling also increased in the factory. In addition, there are many abnormal problems which occurred during production time because of no-load running, heat waste in drying processes, etc. Thus, the trends of SECs from January to June were volatile.
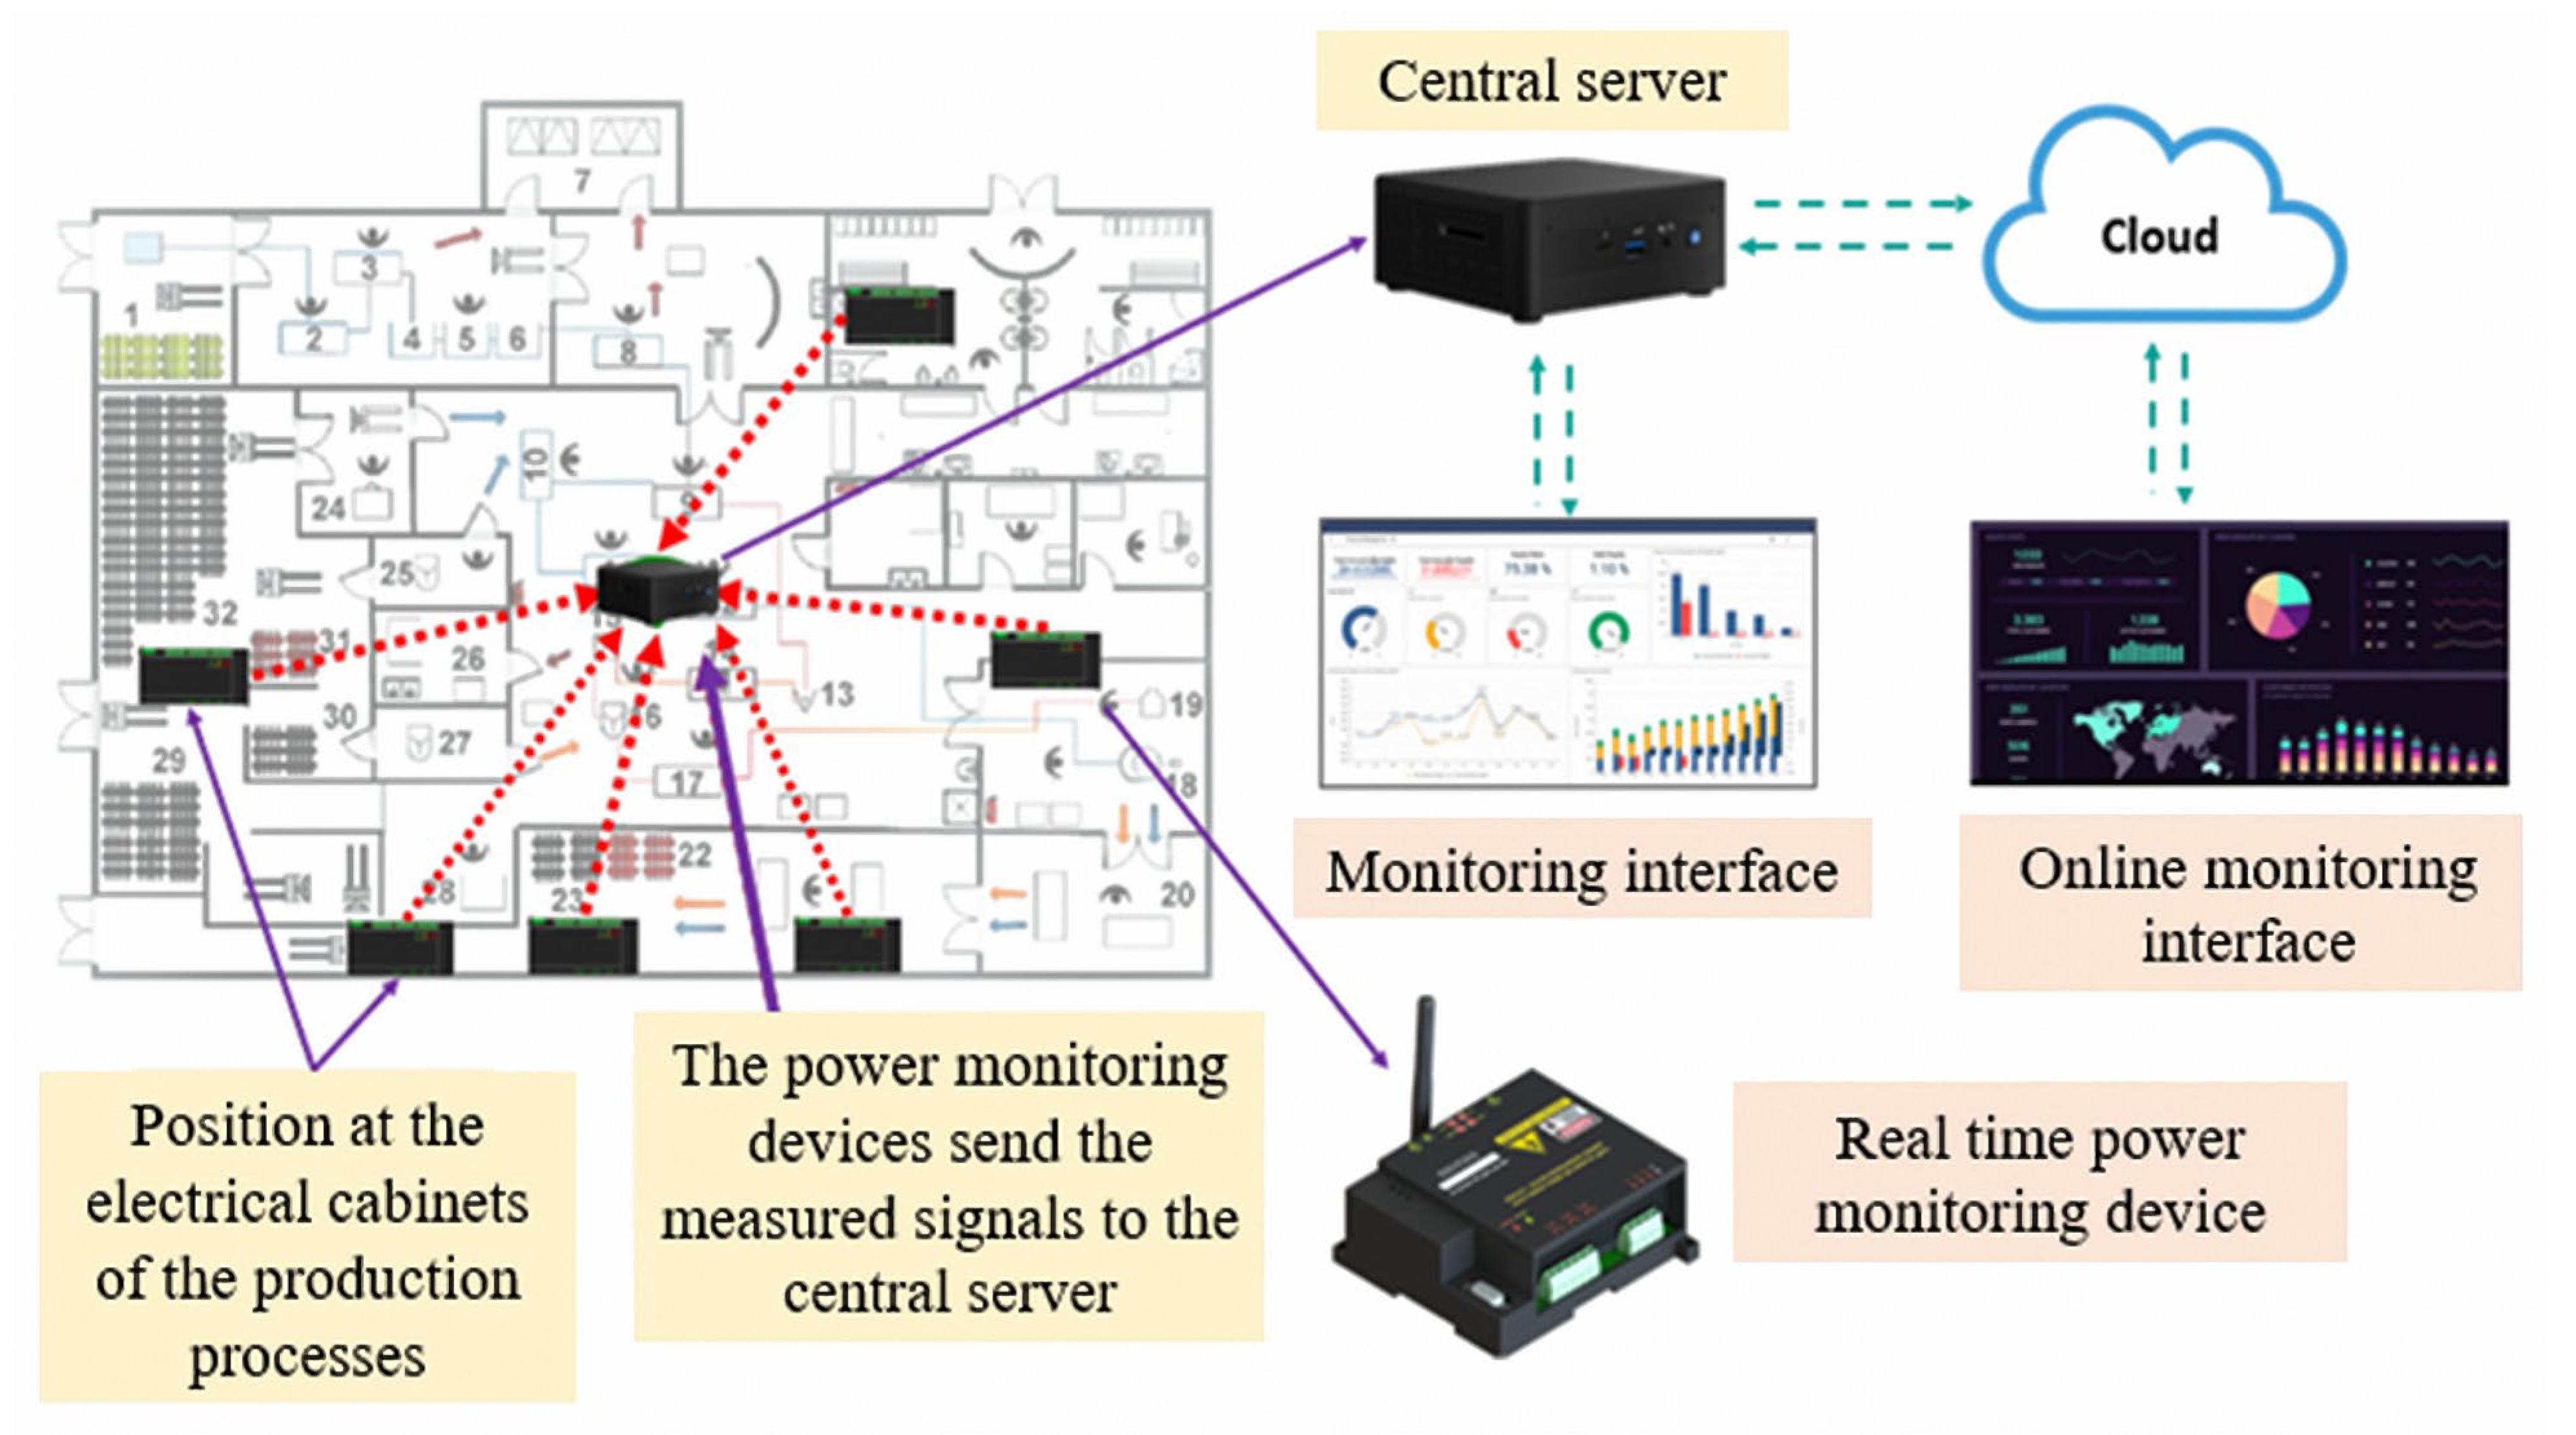
An electricity monitor system was built for collecting data and giving timely warnings to managers when unusual problems occur, as well as timely handling. The measurement and monitoring principles to warn of systems are based on the daily production plan, which is entered into the system. When the SEC of products in processes has suddenly changed compared with the average consumption in weeks, the system will supply a warning signal to the manager. This signal will help managers to ascertain the right processes of the problem and determine the reasons, such as overload, no load, etc. The system also generates signals to the manager to detect machines running with no load, system crashes in the case of the processes not having production plans but the system still receiving power consumption signals, or there being no power consumption signal in exiting production plans. The locations for installing energy meters are determined according to the production processes, as can be seen in Figure 4; meters are installed at electricity cabinets to collect data on power consumption and real-time operating statistics. The collected data are sent to a central server located in the operating room of workshop 3 via LAN network, then they will be synchronized to the central server cloud to service online monitoring. The technical parameter of the power monitoring device (Smart Meter GSNL1K3P) is presented in Table 3; the power consumption is 5 W while the error is 2%.
Because the current status of the selected monitoring points was scattered at different locations, the monitoring system needed to be designed to collect all operating data of the systems, and simultaneous monitoring could be performed through a single software interface. Measurement data and operational parameters (such as voltage, current, and power) obtained from the installation and deployment of the measuring equipment were monitored in real time by using the website interface. In addition, web-based programs were also needed to receive data sent from the measuring equipment and to store the data in the database.

4. Study Results and Discussion

Energy monitoring and management software provides users with multiple interfaces to facilitate their work, including:
-
Site-based monitoring interface.
-
Real-time daily power consumption monitoring interface.
-
Electricity consumption ratio monitoring interface.
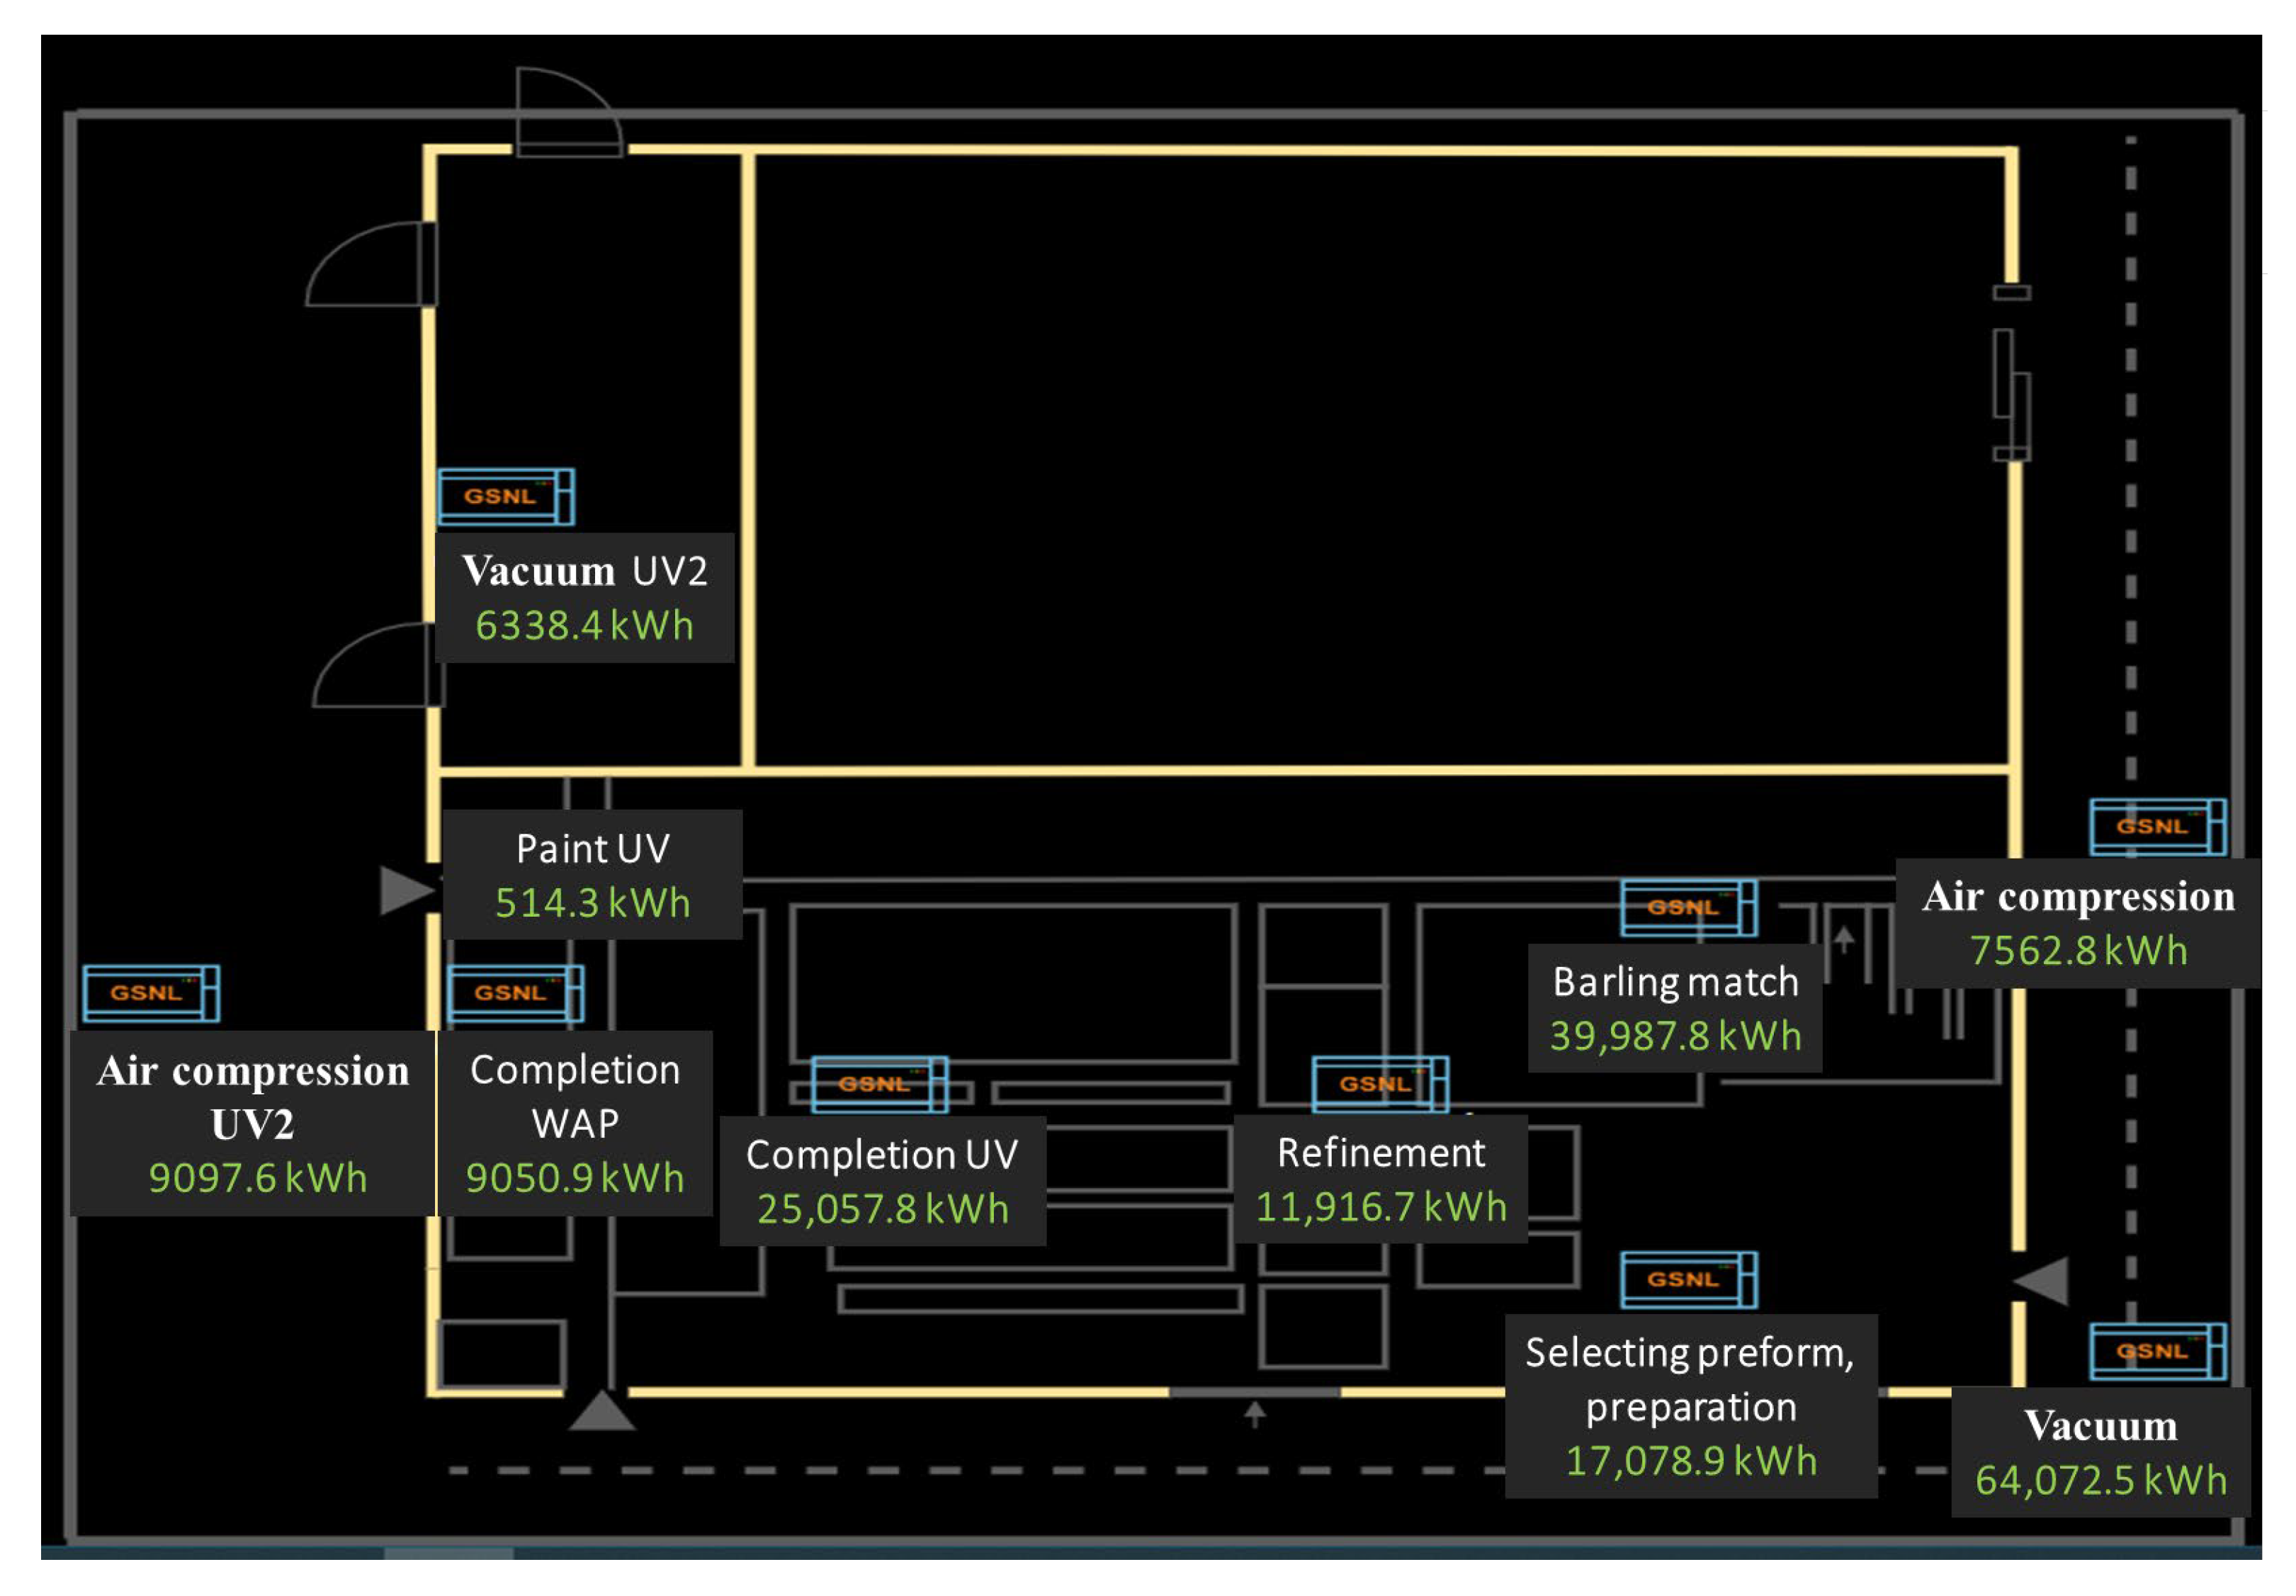
In the site-based monitoring interface, the user can monitor the total capacity of the measuring points on the premises of the factory. Besides, the software also automatically calculates the total daily power consumed by the measurement points, as can be seen in the daily power consumption monitoring interface. The site-based monitoring interface is demonstrated in Figure 5.
On the other hand, the users can understand the power distribution in the factory and the power consuming devices with the support of the power connection diagram monitoring interface. The real-time daily power consumption monitoring interface is shown in Figure 6.
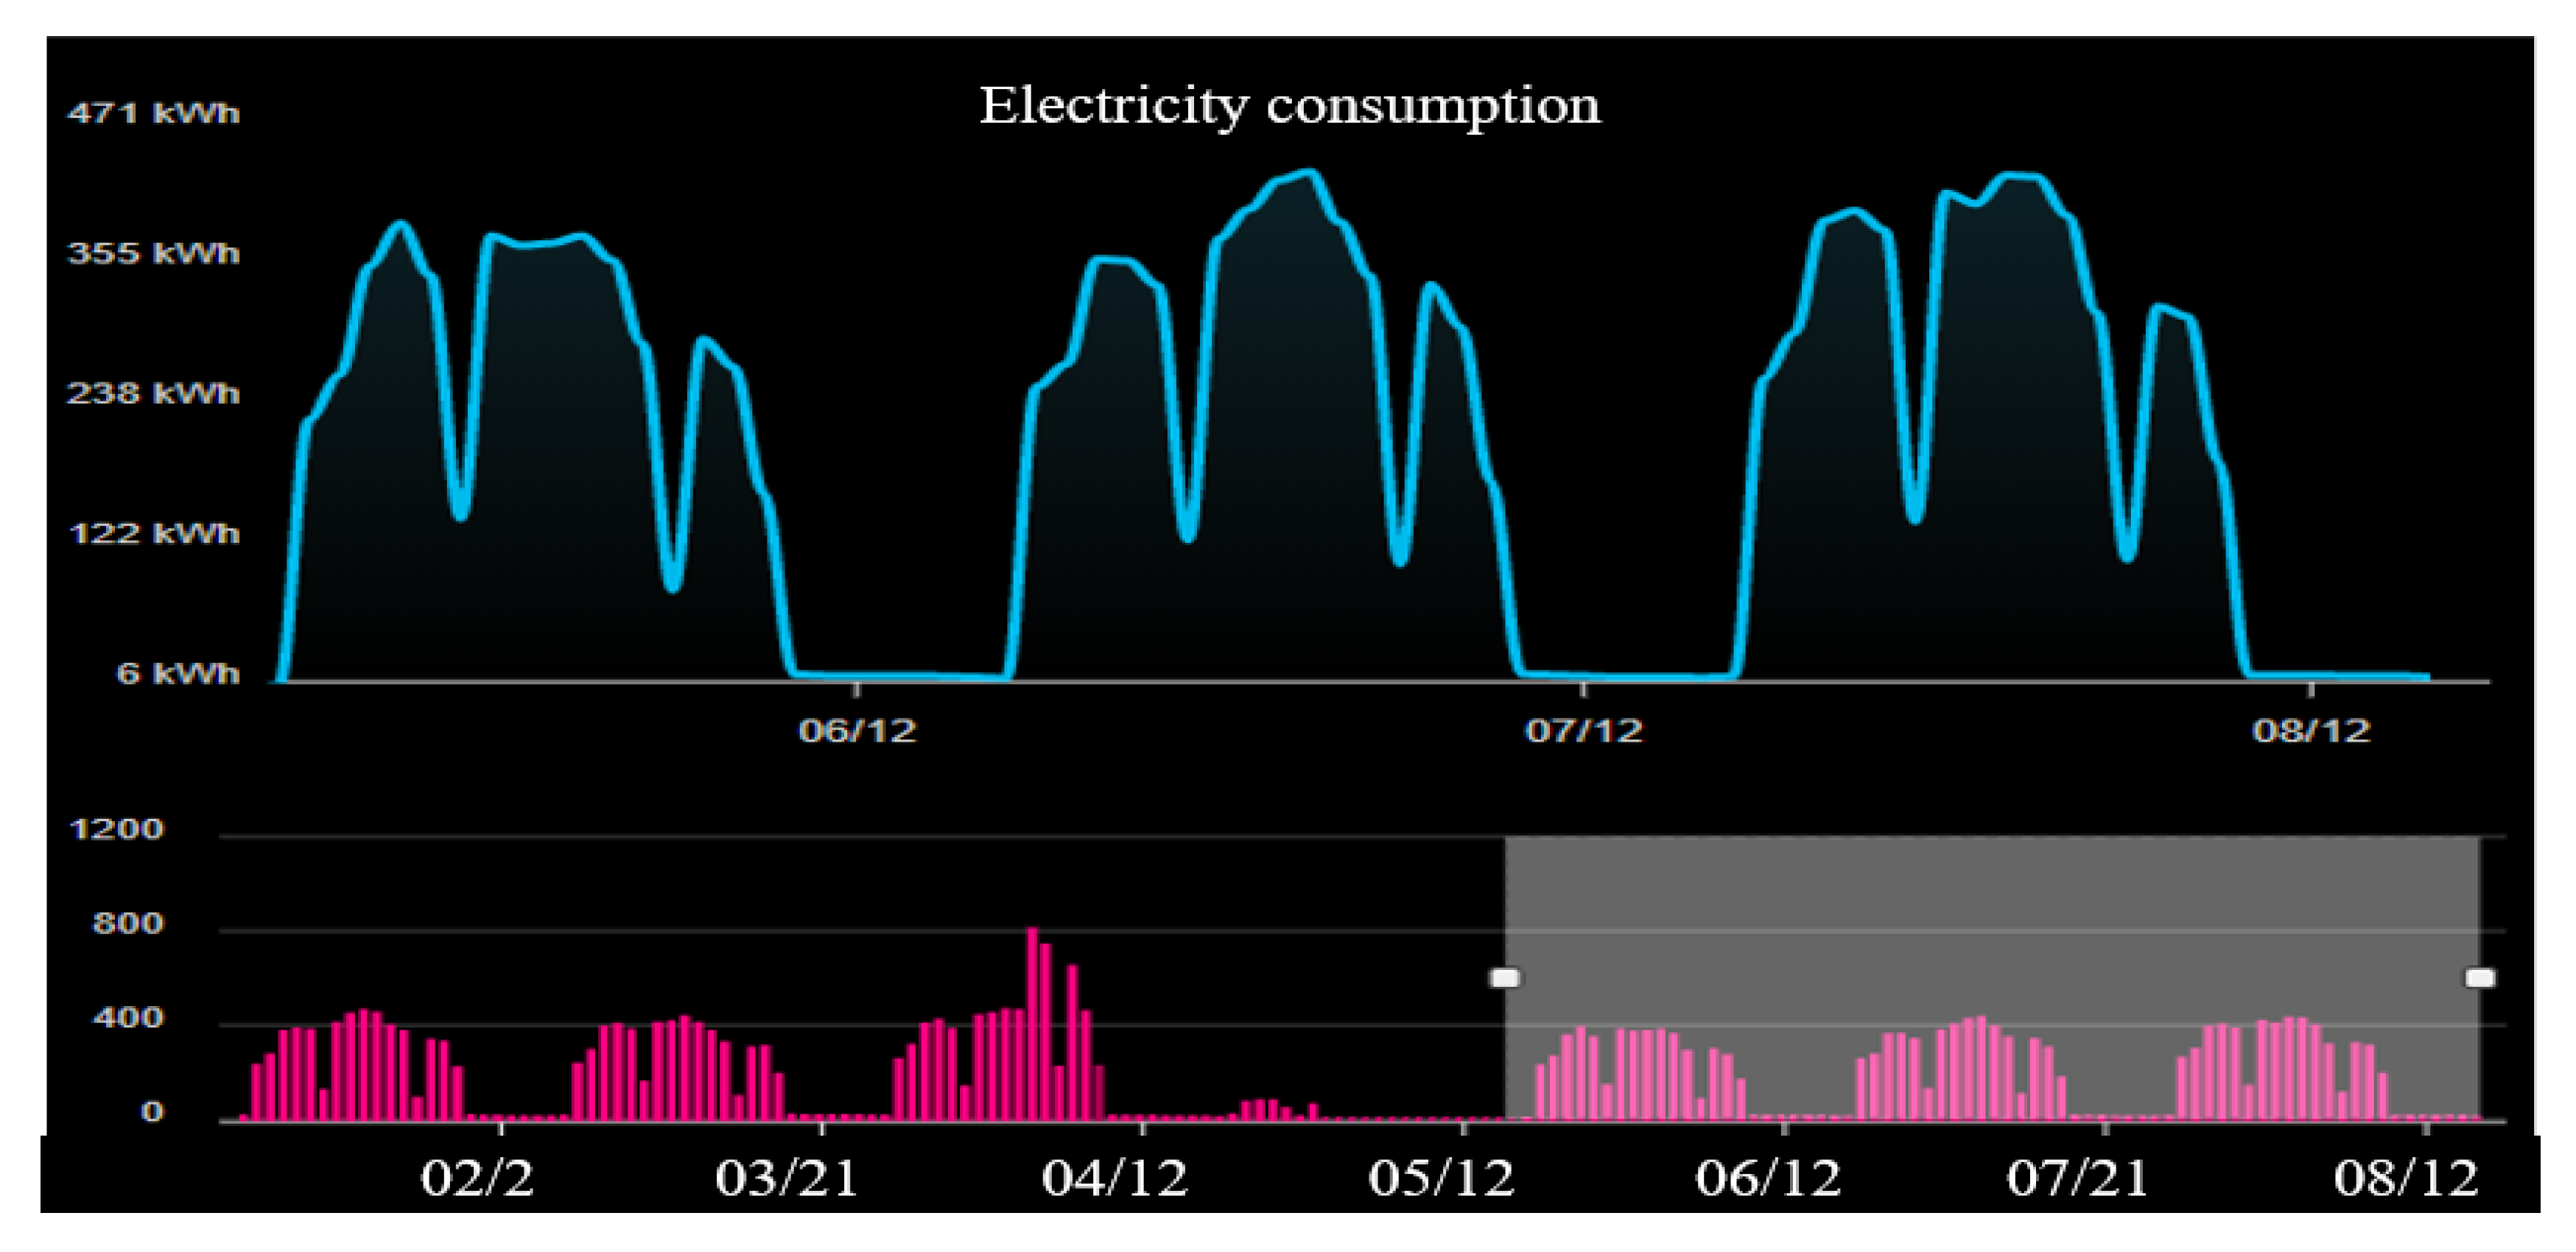
The electricity consumption ratio monitoring interface is shown in Figure 7, the light blue line shows the detailed electricity consumption from pink graph. The power consumption ratio interface for each measurement point location helps users to control, evaluate, and analyze the ratio of power consumption loads in the entire production process.
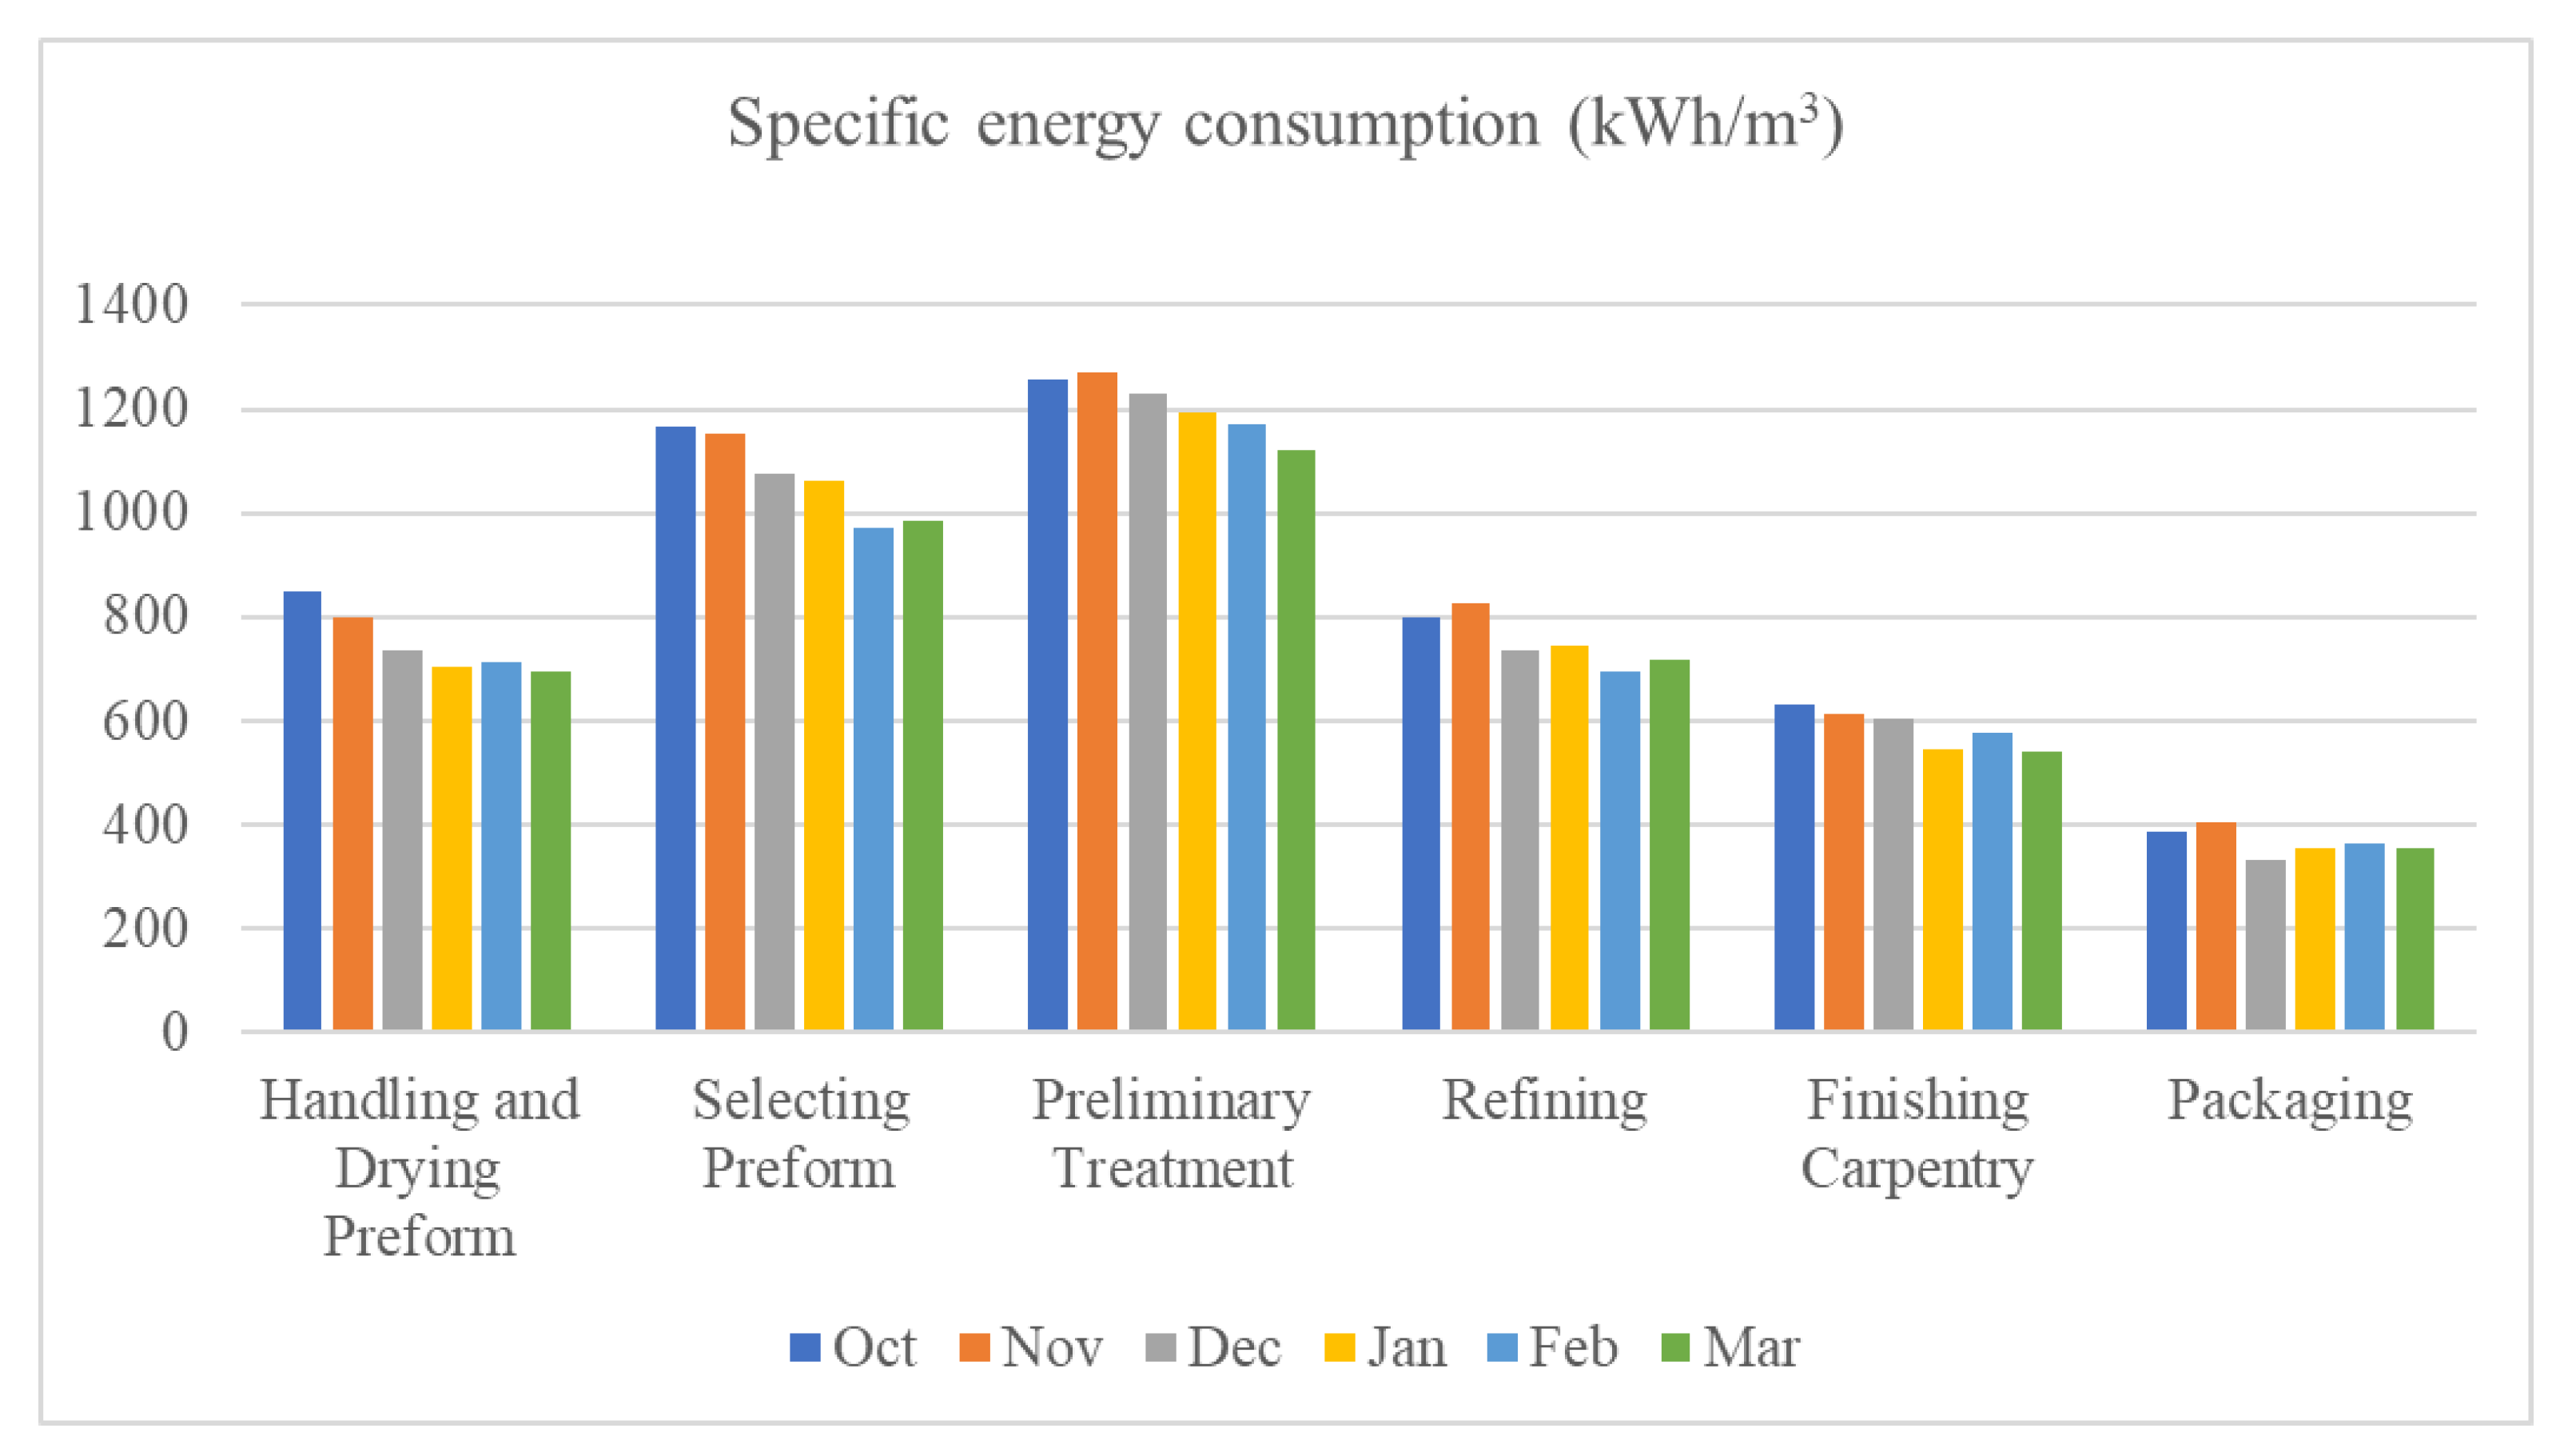
The real-time power monitoring system for the company was measured from October 2022 to March 2023, to evaluate its effectiveness. In Figure 8, it can be seen that the company started operating the energy monitoring system in October and November of 2022, but the managers did not focus on monitoring, so SEC is still at a higher level than the average value from January 2022 to May 2022.
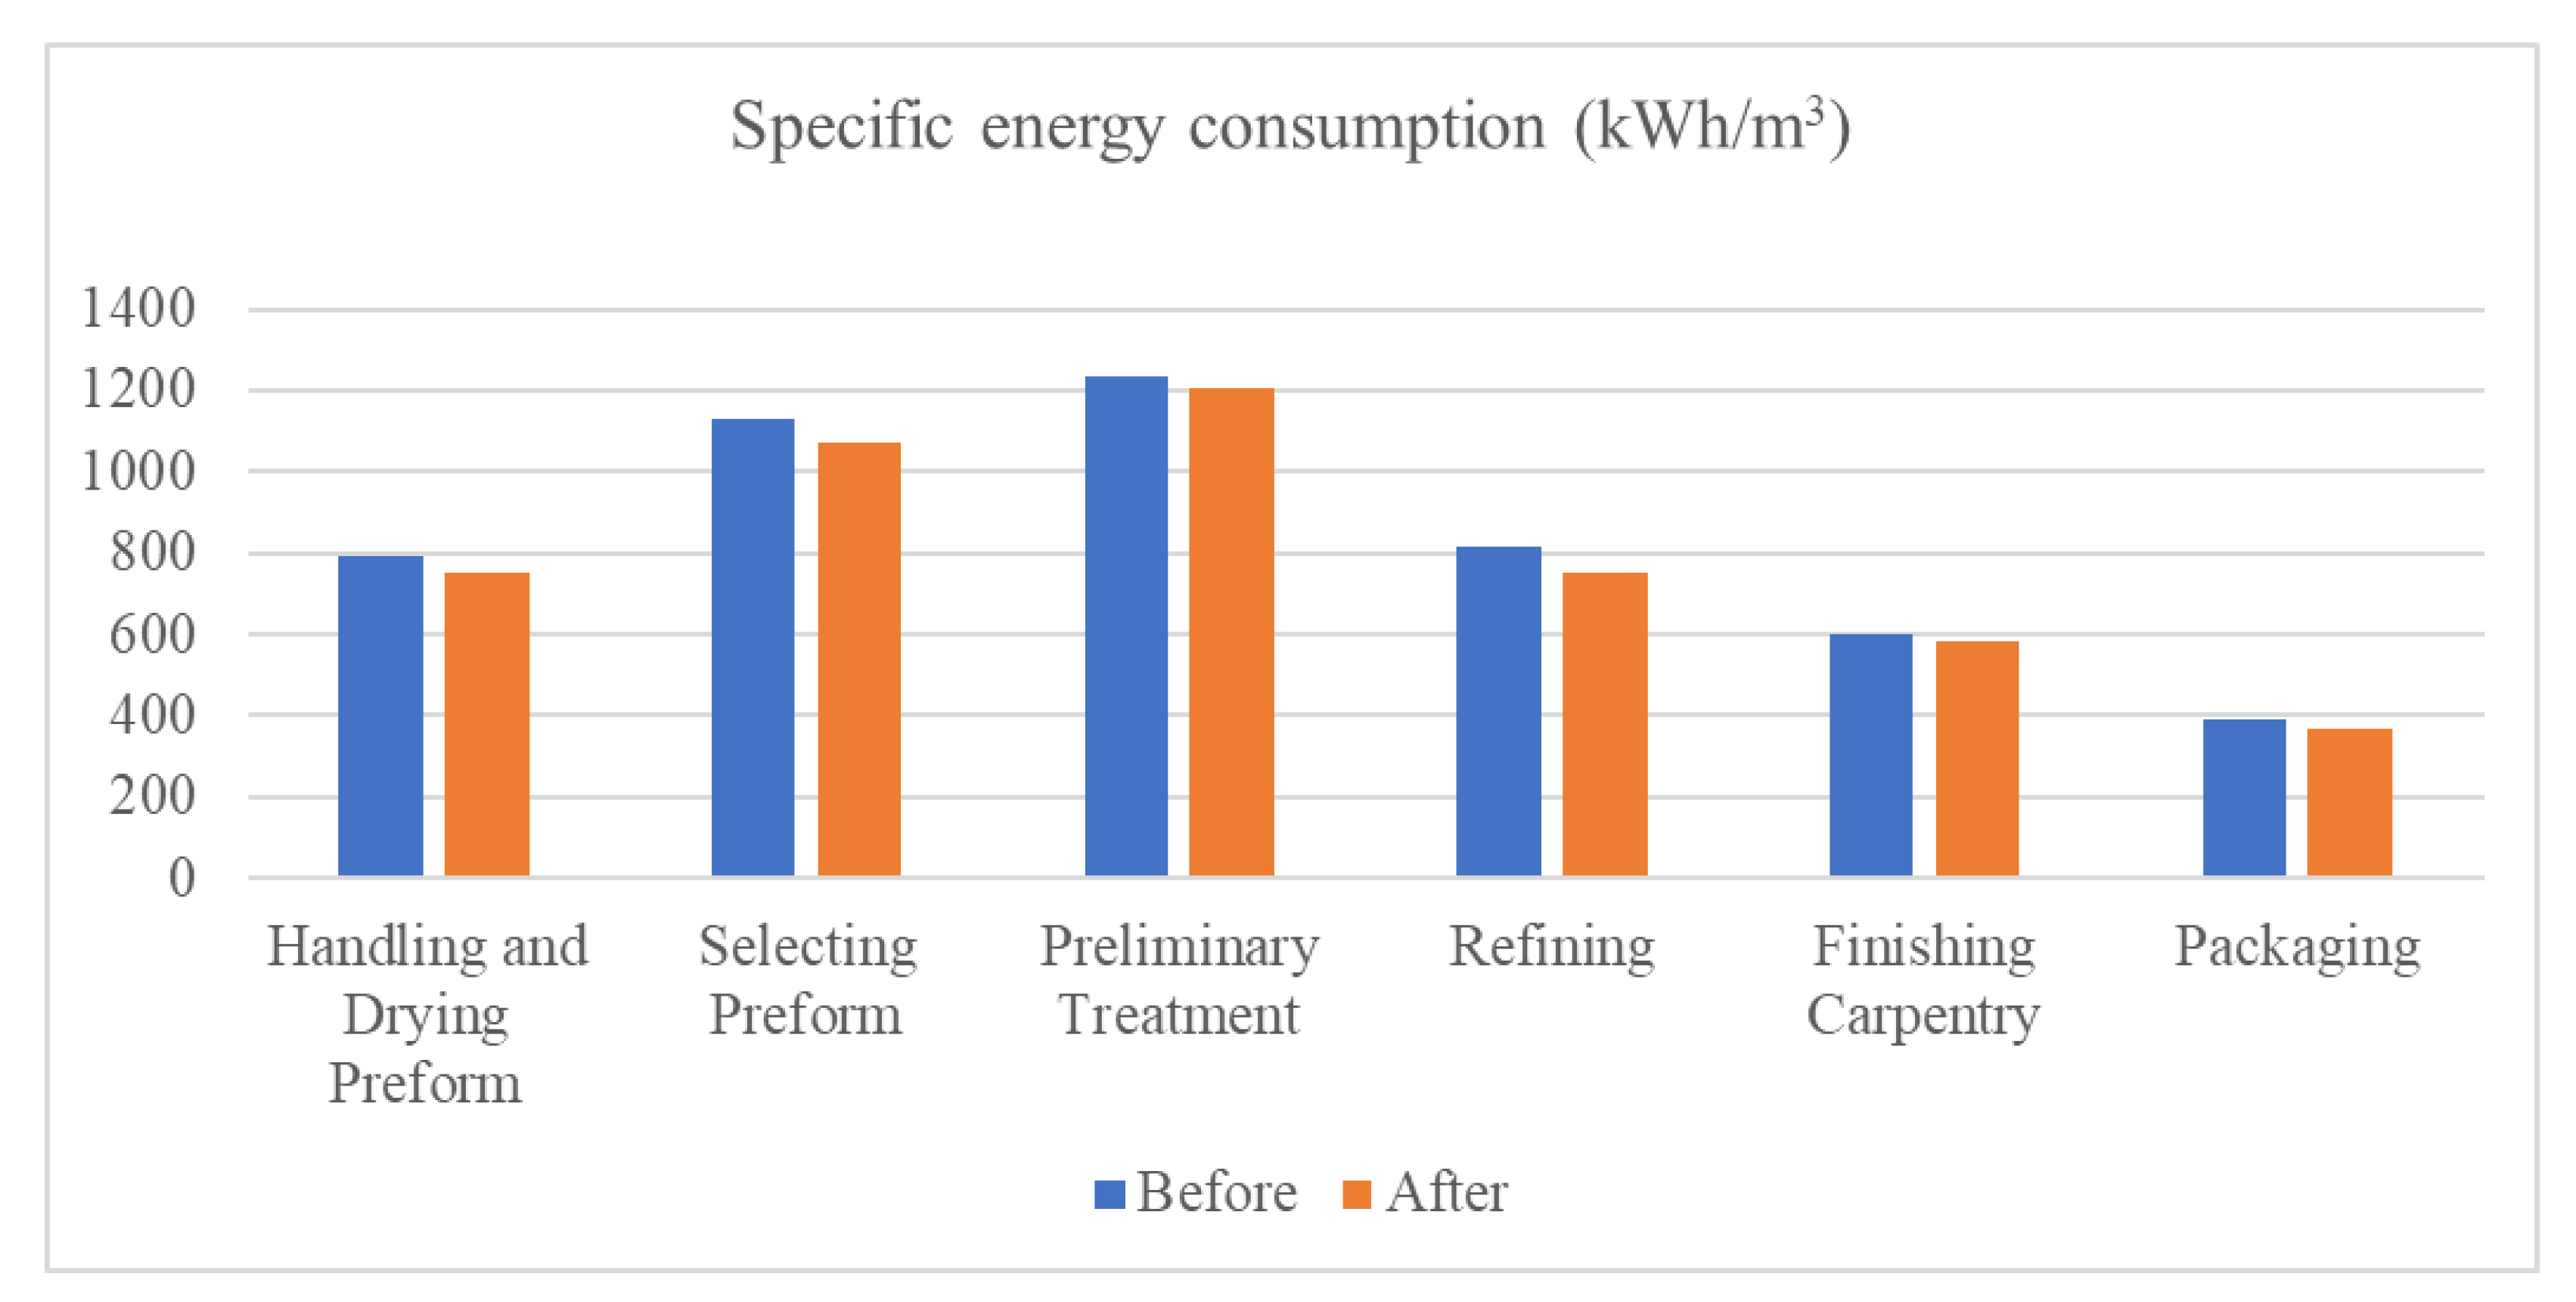
However, the SEC has a decreasing trend from December 2022, with an average from 4% to 8% of power consumption in comparison with the average value before operating the power monitoring system, as can be seen in Figure 9. The reduction in SEC is caused by the amount of saved electricity from controlling and eliminating abnormal energy wastage during operation, including:
-
Completely removing equipment running idle or equipment that is not in the production plan conditions.
-
Handling timely problems occurring in the production process.
The study results show that the trend of SEC value for processes is stable and decreases gradually.
Table 4 shows the production output and specific energy consumption after installing the power monitoring system over six months (from October 2022 to March 2023) for six processes. The saved energy in each process was calculated by Formula (1), shown in Section 2, to determine the total saved energy after deploying the monitoring system.
Accordingly, in the case of the SEC constant, the needed energy consumption to produce 662.32 m3 of products in the first process (handling and drying preform) is shown below:
Process electricity consumption = Volafter × SECbefore = 662.32 × 792.6 = 524,955 (kWh).
However, the actual energy consumption for this process is only 497,603 kWh because the monitoring system helped to detect, warn, and eliminate electricity waste.
Therefore, the saved electricity (SE) = 524,954 − 497,603 = 27,351 (kWh).
Similarly, the saved energy can be identified for other processes. Accordingly, the total saved energy (TSE) in six months is 191,923 kWh while manufacturing the same production output. Therefore, in the initial six months, the energy savings equated to a 5.02% decrease. If this trend continues, an approximate yearly energy reduction will be 10%.
The study result of the economic, technical, and environmental efficiency of the factory, shown in Table 5, shows that the total saved electricity after installing the power monitoring system is 191,923 kWh in six months (from October 2022 to March 2023). Therefore, the company can save approximately 480 million VND (~19,584 USD) and contributes to reducing 139 tons of CO2 emitted to the environment.
According to the energy audit report, the factory can save about 9.62% on energy costs per year by implementing energy policies with the help of the power monitoring system. Besides, the total investment cost of the power monitoring systems, including smart meters, electrical and communication equipment, the server, and installation labor, is about 52,000 USD. Therefore, the return on investment (ROI) index is about 37.6%, and the payback time on investment in power monitoring systems is approximately 14 months.
These study results indicate that the application of real-time power monitoring systems can help factories in Vietnam to reduce operating costs and improve the working efficiency of machinery and equipment.

5. Conclusions

In Vietnam, most electricity is consumed by the industry sector due to its contributing to the country’s socio-economic development strategy. However, many industrial factories do not have solutions for optimal energy use, and their production plans are not reasonable. In addition, the traditional energy management methods are rudimentary, the on-site monitoring equipment is dispersed, and data have not been digitized. The real-time energy monitoring and management system can help managers of a given enterprise determine the situation of energy use, detect abnormal problems, and support the control of energy consumption at different times.
This paper assesses the real-time power monitoring system installed at the manufacturing sites of a typical major energy use industrial factory in Vietnam. The study results show that the total saved electricity after installing the power monitoring system is 191,923 kWh, by which the company can save approximately 480 million VND (~19.584 USD) and contribute to reducing 139 tons of CO2 emitted to the environment. Besides, the return on investment of power monitoring systems is about 14 months, while the annual energy costs of the factory can reduce 9.62% per year.
The research results are an important basis for replicating the real-time energy management and monitoring model for other production enterprises in Vietnam to improve energy use efficiency in the industry sector.

Author Contributions

Conceptualization, M.N.D.; methodology, P.V.M.; data curation, C.D.V. and K.D.T.; Visualization, T.N.N.; writing—original draft preparation, M.N.D., P.V.M., K.D.T. and Q.T.T.; writing—review and editing, M.N.D., P.V.M., Q.T.T. and T.N.N.; supervision, C.D.V. and K.D.T. All authors have read and agreed to the published version of the manuscript.

Funding

This research received no external funding.

Data Availability Statement

Not applicable.

Acknowledgments

This work was supported by the Ministry of Industry and Trade and Electric Power University.

Conflicts of Interest

The authors declare no conflict of interest.

References

  1. Victhalia, Z.C.; Harmen, S.B.; Raúl, M.M.; David, E.H.J.; Gernaat, D.E.; René, B.; Detlef, V. Future global electricity demand load curves. Energy 2022, 258, 124741. [Google Scholar]
  2. IEA. World Energy Outlook 2022; OECD Publishing: Paris, France, 2022. [Google Scholar]
  3. Guan, Y.; Yan, J.; Shan, Y. Burden of the global energy price crisis on households. Nat. Energy 2023, 8, 304–316. [Google Scholar] [CrossRef]
  4. Kashif, R.A.; Muhammad, S.; Zhang, J.; Muhammad, I.; Rafael, A. Analyze the environmental sustainability factors of China: The role of fossil fuel energy and renewable energy. Renew. Energy 2022, 187, 390–402. [Google Scholar]
  5. Mustafa, T.K.; Serpil, K.D.; Fatih, A.; Özer, D. Impact of renewable and fossil fuel energy consumption on environmental degradation: Evidence from USA by nonlinear approaches. Int. J. Sustain. Dev. World Ecol. 2022, 29, 738–755. [Google Scholar]
  6. Qadeer, S.; Fatima, A.; Aleem, A.; Begum, A. Smart Switch for Power Saving. In Lecture Notes in Electrical Engineering; Nath, V., Mandal, J., Eds.; Springer: Singapore, 2019; p. 511. [Google Scholar]
  7. Mahi, M.; Ismail, I.; Phoong, S.W.; Che, R.I. Mapping trends and knowledge structure of energy efficiency research: What we know and where we are going. Environ. Sci. Pollut. Res. 2021, 28, 35327–35345. [Google Scholar] [CrossRef]
  8. Sachs, J.D.; Woo, W.T.; Yoshino, N.; Taghizadeh-Hesary, F. Importance of Green Finance for Achieving Sustainable Development Goals and Energy Security. In Handbook of Green Finance. Sustainable Development; Sachs, J., Woo, W., Yoshino, N., Taghizadeh, H.F., Eds.; Springer: Singapore, 2019. [Google Scholar]
  9. IEA. World Energy Outlook 2019; IEA: Paris, France, 2019. [Google Scholar]
  10. IEA. Electricity Market Report 2023; IEA: Paris, France, 2023. [Google Scholar]
  11. IRENA. Global Energy Transformation: A Roadmap to 2050; International Renewable Energy Agency: Abu Dhabi, United Arab Emirates, 2018. [Google Scholar]
  12. IEA. Industry; IEA: Paris, France, 2022. [Google Scholar]
  13. Malinauskaite, J.; Jouhara, H.; Ahmad, L.; Milani, M.; Montorsi, L.; Venturelli, M. Energy efficiency in industry: EU and national policies in Italy and the UK. Energy 2019, 172, 255–269. [Google Scholar] [CrossRef]
  14. Sander, D.B.; Chris, J.; Bettina, K.; Benjamin, G.; Jan, E.T. Energy-Intensive Industries—Challenges and Opportunities in Energy Transition; Policy Department for Economic, Scientific and Quality of Life Policies, European Parliament: Luxembourg, 2020. [Google Scholar]
  15. Wei, M.; McMillan, C.A.; Stephane, R.D.C. Electrification of Industry: Potential, Challenges and Outlook. Curr. Sustain. Renew. Energy 2019, 6, 140–148. [Google Scholar] [CrossRef]
  16. Blesl, M.; Kessler, A. Industries with Their Highly Specialized or Energy-Intensive Processes. In Energy Efficiency in Industry; Springer: Berlin/Heidelberg, Germany, 2021. [Google Scholar]
  17. Wang, Y.; Zhang, Q. How does electricity consumption of energy-intensive manufacturing affect the installed capacity of power generation? Empirical evidence under the background of China’s supply-side structural reform. Energy Effic. 2022, 15, 44. [Google Scholar] [CrossRef]
  18. Netherlands Government. Articles 2–6 of Temporary Arrangement for the Implementation of Articles 14; Articles 14 of Energy Efficiency Directive; Energy Research Centre: Petten, The Netherlands, 2014.
  19. Environment Agency of UK. Energy Saving Opportunities Scheme (ESOS); Environment Agency of UK: London, UK, 2014.
  20. Davide, C.; Vittorio, C.; Simone, F.; Federico, F.; Vito, M.L. Overcoming internal barriers to industrial energy efficiency through energy audit: A case study of a large manufacturing company in the home appliances industry. Clean Technol. Environ. Policy 2017, 19, 1031–1046. [Google Scholar]
  21. José, R.N.L.; Ricardo, A.K.; Jorge, L.M.R.; Salvador, Á.F. A new model for assessing industrial worker behavior regarding energy saving considering the theory of planned behavior, norm activation model and human reliability. Resour. Conserv. Recycl. 2019, 145, 268–278. [Google Scholar]
  22. Klyuev, R.; Bosikov, I.; Gavrina, O.; Madaeva, M.; Sokolov, A. Improving the Energy Efficiency of Technological Equipment at Mining Enterprises. In International Scientific Conference Energy Management of Municipal Facilities and Sustainable Energy Technologies EMMFT 2019; Murgul, V., Pukhkal, V., Eds.; Advances in Intelligent Systems and Computing; Springer: Cham, Switzerland, 2021; Volume 1258, pp. 262–271. [Google Scholar]
  23. Martirano, L.; Bua, F.; Cristaldi, L.; Grigis, G.; Mongiovì, L.G.; Polverini, S.; Tironi, E. Assessment for a Distributed Monitoring System for Industrial and Commercial Applications. IEEE Trans. Ind. Appl. 2019, 55, 7320–7327. [Google Scholar] [CrossRef]
  24. Akhtar, T.; Rehman, A.U.; Jamil, M.; Gilani, S.O. Impact of an Power monitoring system on the Energy Efficiency of an Automobile Factory: A Case Study. Energies 2020, 13, 2577. [Google Scholar] [CrossRef]
  25. Mongiovì, L.; Cristaldi, L.; Tironi, E.; Martirano, L.; Bua, F.; Grigis, G.; Lavecchia, C.; Canali, R. A New Efficient Method for Evaluating the Level of Coverage of Distributed Monitoring Systems, supporting the recent European Standard EN17267 for Energy Efficiency. In Proceedings of the 2020 IEEE International Conference on Environment and Electrical Engineering and 2020 IEEE Industrial and Commercial Power Systems Europe (EEEIC/I&CPS Europe), Madrid, Spain, 9–12 June 2020; pp. 1–6. [Google Scholar]
  26. Jagtap, S.; Rahimifard, S.; Duong, L.N.K. Real-time data collection to improve energy efficiency: A case study of food manufacturer. J. Food Process. Preserv. 2022, 46, 14338. [Google Scholar] [CrossRef] [Green Version]
  27. Hu, L.; Zheng, H.; Shu, L.; Jia, S.; Cai, W.; Xu, K. An investigation into the method of energy monitoring and reduction for machining systems. J. Manuf. Syst. 2020, 57, 390–399. [Google Scholar] [CrossRef]
  28. Olukorede, T.A.; Khumbulani, M.; Ramatsetse, I.B. Energy efficiency analysis modelling system for manufacturing in the context of industry 4.0. Procedia CIRP 2019, 80, 735–740. [Google Scholar]
  29. Liu, W.; Peng, T.; Tang, R.; Umeda, Y.; Hu, L. An Internet of Things-enabled model-based approach to improving the energy efficiency of aluminum die casting processes. Energy 2020, 202, 117716. [Google Scholar] [CrossRef]
  30. Martirosyan, A.V.; Yury, V.I.; Olga, V.A. Development of a Distributed Mathematical Model and Control System for Reducing Pollution Risk in Mineral Water Aquifer Systems. Water 2022, 14, 151. [Google Scholar] [CrossRef]
  31. Ilyushin, Y.; Afanaseva, O. Development of a spatial-distributed control system for preparation of pulse gas. In Proceedings of the International Multidisciplinary Scientific Geo Conference Surveying Geology and Mining Ecology Management, Albena, Bulgaria, 16–25 August 2020. [Google Scholar]
  32. World Bank. Taking Stock Report: Vietnam Economic Update—Harnessing the Potential of the Services Sector for Growth, March 2023. Available online: https://www.worldbank.org/en/country/vietnam/publication/taking-stock-vietnam-economic-update-march-2023 (accessed on 1 May 2023).
  33. Le, P.V. Energy demand and factor substitution in Vietnam: Evidence from two recent enterprise surveys. Econ. Struct. 2019, 8, 35. [Google Scholar] [CrossRef] [Green Version]
  34. Truong, M.T.; Pham, M.C. Electric consumption and solutions for saving electric of household in Vietnam. J. Energy Sci. Technol. Electr. Univ. 2021, 26, 18–27. [Google Scholar]
  35. Hien, P.D. Excessive electricity intensity of Vietnam: Evidence from a comparative study of Asia-Pacific countries. Energy Policy 2019, 130, 409–417. [Google Scholar] [CrossRef]
  36. International Trade Administration. Vietnam Energy Efficiency. 2022. Available online: https://www.trade.gov/market-intelligence/vietnam-energy-efficiency (accessed on 1 May 2023).
  37. Prime Minister. Decision 280/QĐ-TTg on Approval of the National Energy Efficiency Programme (VNEEP) for the Period 2019–2030. 2019. Available online: https://vepg.vn/legal_doc/pm-decision-280-qd-ttg-on-the-approval-of-the-national-energy-efficiency-programme-vneep-for-the-period-of-2019-2030/ (accessed on 1 May 2023).
  38. Marina, S.; Lina, S.; Bui, X.T.; Sven, U.G. Optimization potentials for wastewater treatment and energy savings in industrial zones in Vietnam: Case studies. Case Stud. Chem. Environ. Eng. 2022, 5, 100169. [Google Scholar]
  39. Ming, Y.; Robert, K.D. Investing in efficient industrial boiler systems in China and Vietnam. Energy Policy 2012, 40, 432–437. [Google Scholar]
  40. Nga, N.T.; Phap, V.M.; Thang, N.Q. Optimization Assessment of Grid-tied Wind and Solar Hybrid Power System for Industrial Factory in Vietnam. Int. J. Renew. Energy Res. 2022, 12, 1484–1494. [Google Scholar]
  41. Pham, D.B.; Tran, T.; Le, H.T.; Nguyen, N.T.; Cao, H.T.; Nguyen, T.T. Research on Industry 4.0 and on key related technologies in Vietnam: A bibliometric analysis using Scopus. Learn. Publ. 2021, 34, 414–428. [Google Scholar] [CrossRef]
  42. Olga, A.; Oleg, B.; Dmitry, P.; Dmitry, T. Experimental Study Results Processing Method for the Marine Diesel Engines Vibration Activity Caused by the Cylinder-Piston Group Operations. Inventions 2023, 8, 71. [Google Scholar]
  43. Department of Climate Change, Ministry of Natural Resources and Environment. Available online: http://www.dcc.gov.vn/van-ban-phap-luat/1101/He-so-phat-thai-luoi-dien-Viet-Nam-2021.html (accessed on 1 May 2023).
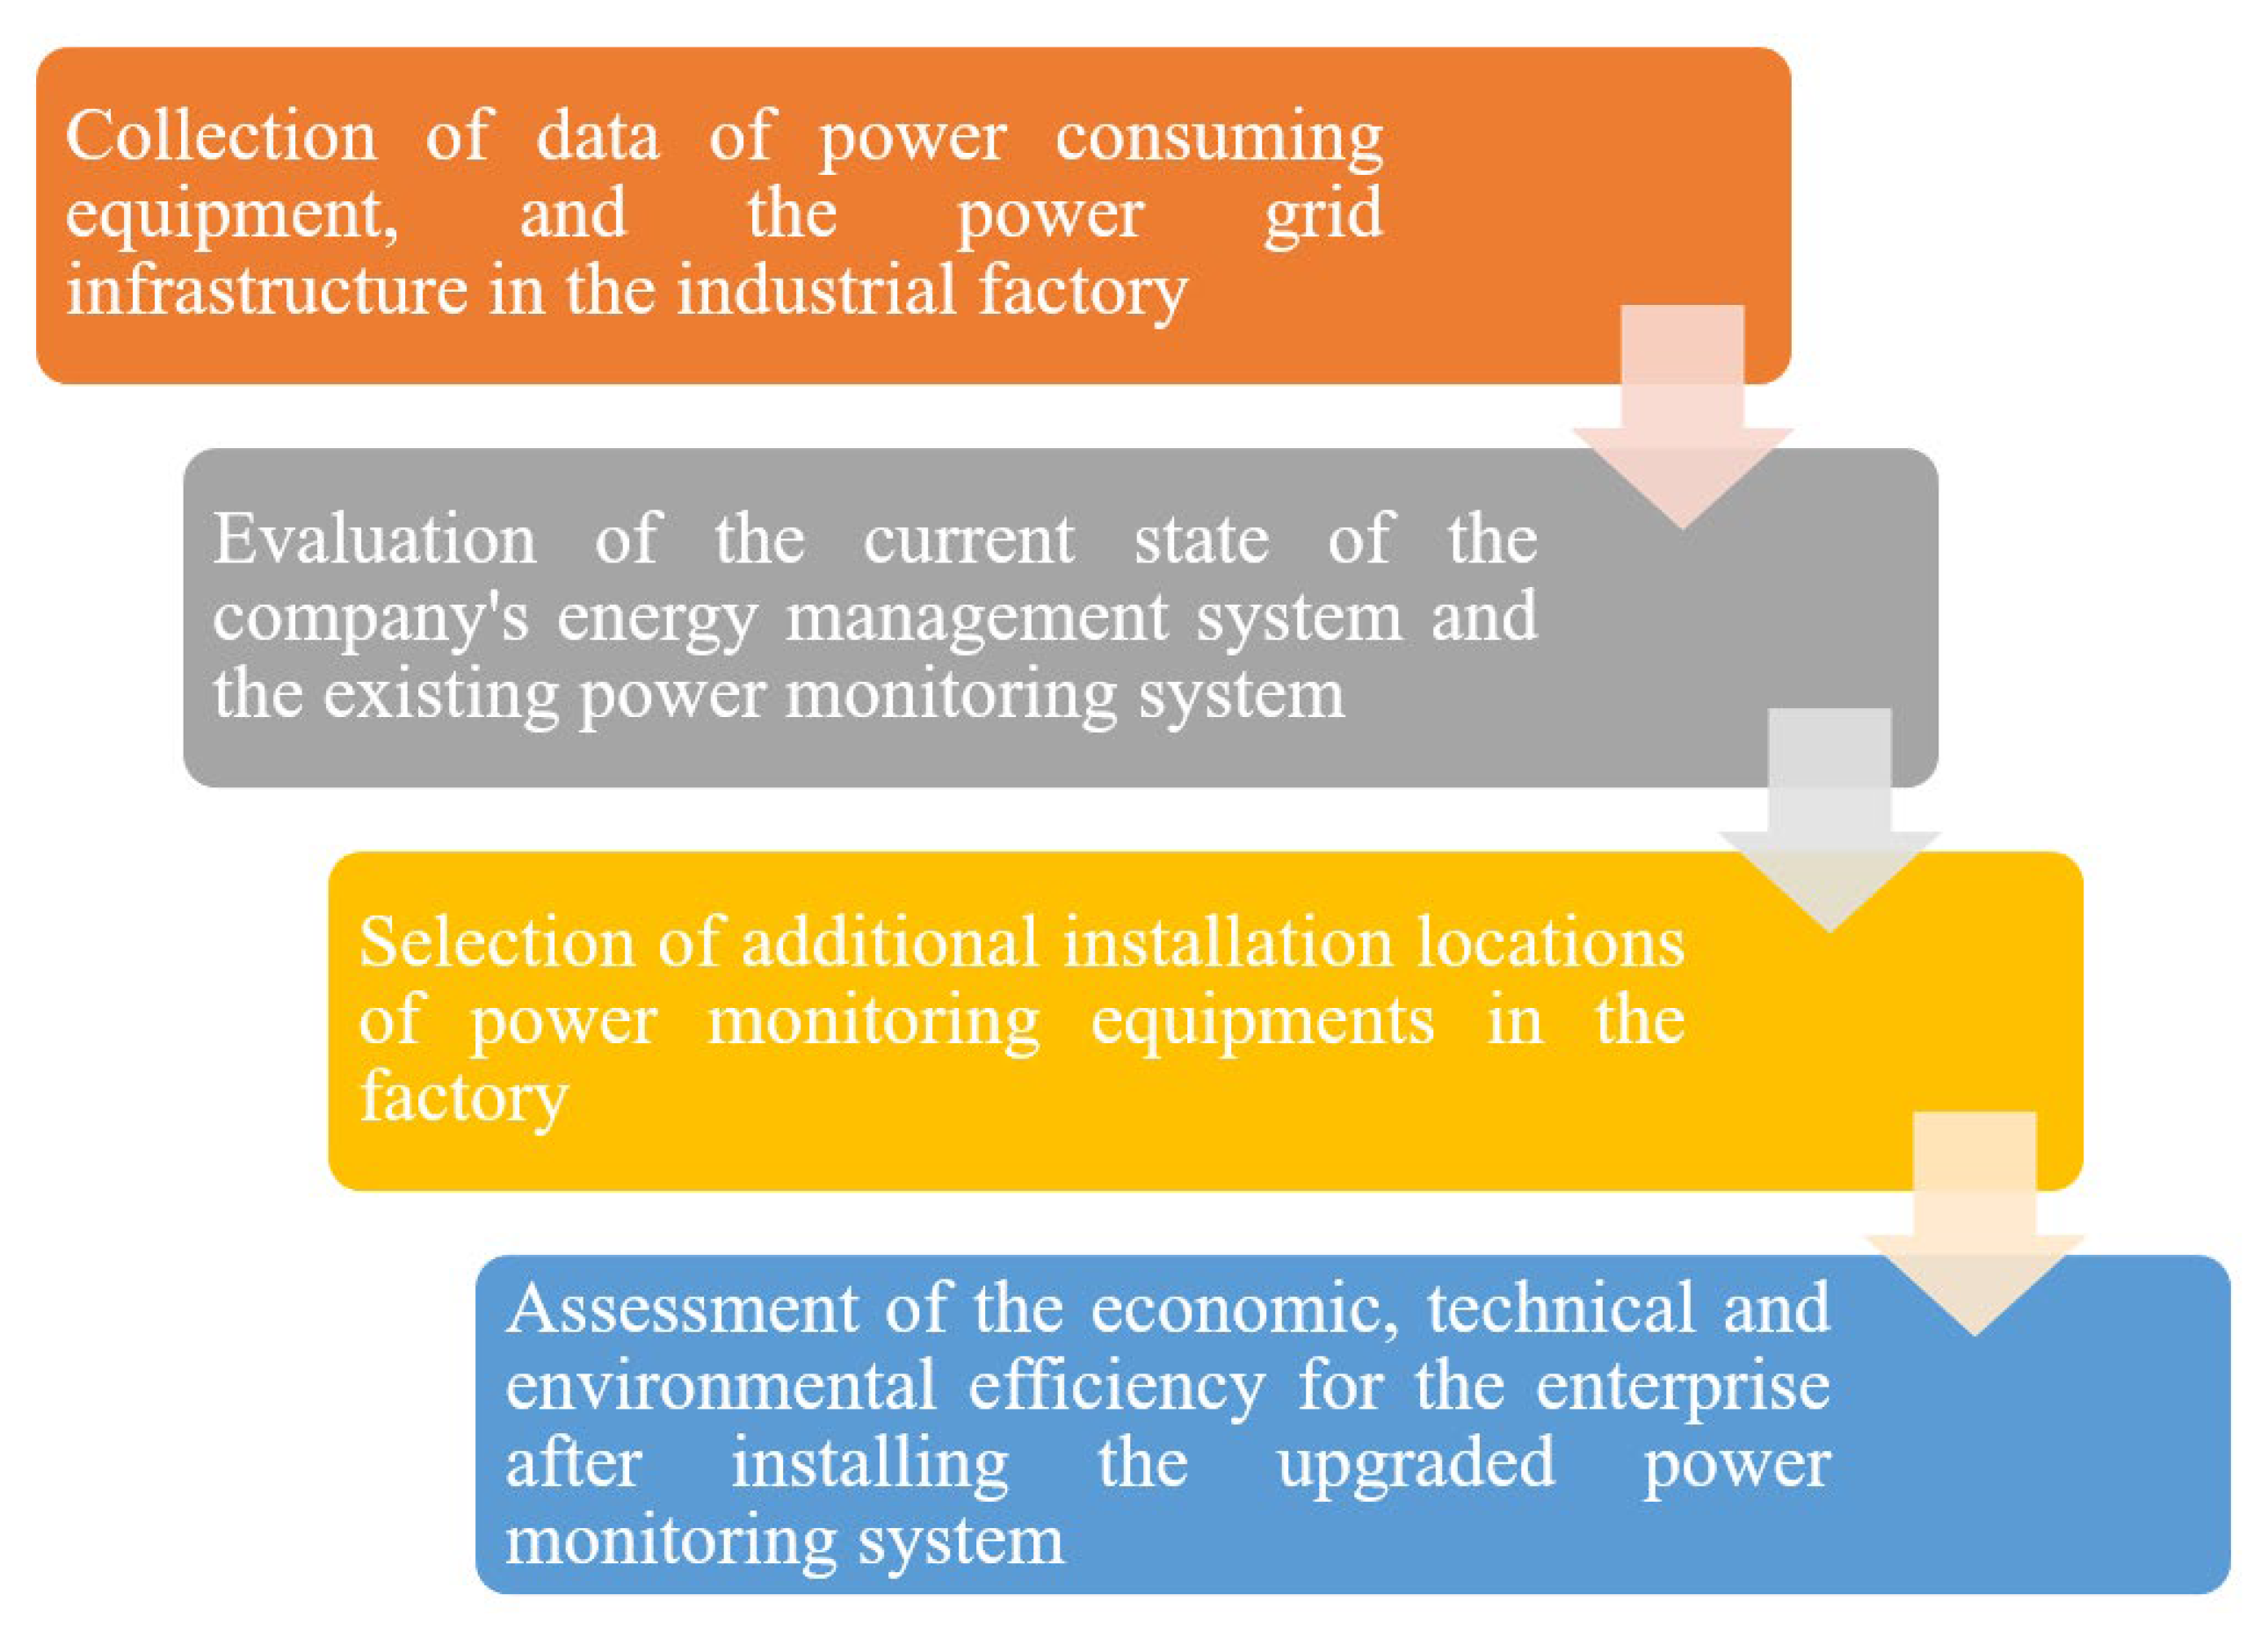
Figure 1. Steps of the efficiency assessment process after installing real-time energy monitoring system.
Energies 16 05214 g001
Figure 2. The main production process of the company.
Energies 16 05214 g002
Figure 3. Specific energy consumption chart before installing the real time power monitoring system in all processes.
Energies 16 05214 g003
Figure 4. Real-time power monitoring system installation diagram.
Energies 16 05214 g004
Figure 5. Site-based monitoring interface.
Energies 16 05214 g005
Figure 6. Real-time daily power consumption interface.
Energies 16 05214 g006
Figure 7. Electricity consumption ratio monitoring interface.
Energies 16 05214 g007
Figure 8. Specific energy consumption after installing the power monitoring system.
Energies 16 05214 g008
Figure 9. The average SEC before and after operating the real-time power monitoring system.
Energies 16 05214 g009
Table 1. The statistics for energy consumption in 2021.
NoEnergy TypeUnitEnergy ConsumptionTon of Oil Equivalent (TOE)Ratio (%)
1ElectricitykWh6,924,180106897.86
2Diesel oillitre26,45123.32.14
Total1091.3100
Table 2. Production output, energy consumption, and SEC of six main processes.
Handling and Drying PreformSelecting PreformPreliminary Treatment
Outputvolume (m3)Energy Consumption (kWh)SEC (kWh/m3)Outputvolume (m3)Energy Consumption (kWh)SEC (kWh/m3)Outputvolume (m3)Energy Consumption (kWh)SEC (kWh/m3)
January7258,4888126187,7141438101134,4951332
February6134,6895698565,549771105106,5081014
March9972,18472995108,2911140133166,0461248
April8473,548876101110,3221092136169,1601244
May7270,92698590106,3891182120163,1301359
June9675,33078597112,9951165145173,2591195
RefiningFinishing CarpentryPackaging
Outputvolume (m3)Energy consumption (kWh)SEC (kWh/m3)Outputvolume (m3)Energy consumption (kWh)SEC (kWh/m3)Outputvolume (m3)Energy consumption (kWh)SEC (kWh/m3)
January155122,800792176116,95266515164,324426
February147103,768706196107,39854816850,069298
March162151,608936254144,38856817379,414459
April180154,451858233147,09663121680,903375
May184148,945809239141,85259419878,019394
June196158,193807250150,66060320582,863404
Table 3. Technical parameters of the power monitoring device.
NoTechnical Parameter
1Operating voltage: 100~260 (V)
2Frequency: 50–60 (Hz)
3Operating temperature: −20~60 °C
4Operating Humidity: 5~95%
5Power consumption: 5 (W)
6Voltage measuring range: 220/380 (V)
7Current measurement range: 0~1000 (A)
8Power measurement range: 0~220 (kVA)
9Error: 2 (%)
Table 4. Production output and specific energy consumption after installing the real-time power monitoring system.
Handling and Drying PreformSelecting PreformPreliminary TreatmentRefiningFinishing CarpentryPackagingTotal
Volafter (m3)6625386339221.2211.0745.050
Real electricity consumption (kWh)497.603576.366762.801686.424712.368395.8013631.363
SECBefore (kWh/m3)79311311232818601392
Electricity consumption based on SECbefore (kWh)524.955608.648779.608754.359734.081421.6363823.287
Saved electricity (kWh)27,35132,28216,80769,93521,71425,834191,923
Table 5. The economic, technical, and environmental efficiency of the factory.
Total Saved Electricity (kWh)191,923
Cost of saving electricity (VND)479,808,178
Annual saving energy cost ratio (%)9.62
Payback time (month)14
The average reduction of CO2 (tons)139
Disclaimer/Publisher’s Note: The statements, opinions and data contained in all publications are solely those of the individual author(s) and contributor(s) and not of MDPI and/or the editor(s). MDPI and/or the editor(s) disclaim responsibility for any injury to people or property resulting from any ideas, methods, instructions or products referred to in the content.