Article

An Experimental Study of High-Pressure Microscopy and Enhanced Oil Recovery with Nanoparticle-Stabilised Foams in Carbonate Oil Reservoir

1
Center for Petroleum Science and Engineering, Skolkovo Institute of Science and Technology, 121205 Moscow, Russia
2
Gazprom Neft STC LLC, 190000 Saint Petersburg, Russia
3
Gazprom Neft-Orenburg LLC, 460000 Orenburg, Russia
*
Author to whom correspondence should be addressed.
Energies 2023, 16(13), 5120; https://doi.org/10.3390/en16135120
Submission received: 24 May 2023 / Revised: 21 June 2023 / Accepted: 29 June 2023 / Published: 2 July 2023
(This article belongs to the Special Issue Enhanced Hydrocarbon Recovery)

Abstract

:
Foams have been successfully implemented to overcome the challenges associated with gas-enhanced oil recovery (EOR) over time. Generally, the foam helps to increase the viscosity of the injected gas, which in turn improves the effectiveness of EOR. However, this technology has rarely been applied in the oilfield due to technological and economical limitations. It is widely considered that nanoparticles may be added to foam to enhance its performance in harsh reservoir conditions to overcome some of these limitations. In this study, we employed high-pressure microscopy (HPM) as an advanced technique to examine the stability of N 2 and C O 2 foams at reservoir conditions, both with and without nanoparticles. The experiments were conducted under vapour and supercritical conditions. Our results indicated that foams produced at 80% quality were more stable than foams produced at 50% quality because the bubble size was significantly smaller and the bubble count was higher. Additionally, foams under supercritical conditions (sc) exhibited greater stability than foams under vapour conditions. This is because at supercritical conditions, the high density of gases helps to strengthen the foam lamella by enhancing the intermolecular contacts between the gas and the hydrophobic part of the liquid phase. Furthermore, core flooding studies were performed to investigate their effect on oil displacement and mobility control in both real and artificial core samples. Rather than focusing on precise quantitative results, our objective was to assess the effect of foams on oil recovery qualitatively. The results indicated that foam injection could significantly increase displacement efficiency, as foam injection raised total displacement efficiency from an initial 48.9% to 89.7% in the artificial core sample. Similarly, in the real core model, C O 2 foam injection was implemented as a tertiary recovery method, and a recovery factor of 28.91% was obtained. These findings highlight the potential benefits of foams for EOR purposes and their ability to mitigate early gas breakthrough, which was observed after injecting approximately 0.14 PV during s c C O 2 injection.

1. Introduction

Due to the trapping effect caused by the dominance of capillary forces over viscous forces, roughly 60–70% of oil is still left behind after primary and secondary recovery operations [1,2]. Enhanced oil recovery (EOR) technologies are commonly used to boost oil production by efficiently increasing sweep efficiency and thus the recovery factor.
For light oils in carbonate deposits, gas injection has been frequently employed as an EOR approach [3,4,5]. Oil recovery in depleted formations is often enhanced when the injected gas is miscible with the reservoir oil. When part of the gas components condense into the reservoir oil, this causes swelling and lowers oil viscosity [4]. As a result, the subsequent phase pushes the oil to the surface, where it can be produced.
Although gas injection is extensively utilised and very efficient, it has some drawbacks that result in gas wastage and poor sweep efficiency [6]. Gravity override, viscous fingering, reservoir heterogeneities, and injectivity problems are some of these challenges [7,8,9]. These limitations are majorly attributed to the high viscosity and density difference between the injected gas and the reservoir oil. Since gas is less dense and viscous than oil, it rises to the top of the formation, missing significant areas of the reservoir. This is especially challenging in situations where the reservoir has a wide range of porosity and permeability since the displacing fluid will struggle to reach low permeability zones [10].
By improving the volumetric sweep efficiency and lowering gas mobility, foam increases the efficiency of gas EOR. This has led to the active development and optimisation of foam EOR technology [11,12,13]
Foam, a gas-and-liquid mixture, has been found to improve sweep efficiency during gas injection, increase gas storage in the reservoir and lower the gas-to-oil ratio [14,15]. However, due to foam instability and the risk of pore blockage, it is not frequently employed in field conditions. There are many challenges regarding foam generation and stability in reservoir conditions. These include harsh reservoir conditions which may result in poor foam generation and which directly affect foam stability, such as the reservoir temperature, pressure, salinity, and surfactant adsorption onto reservoir rocks. If not appropriately screened and studied, these factors can cause poor foam stability and low oil recovery.
Various studies have demonstrated that using surfactants alone is insufficient for generating stable foams [16,17]; hence, nanoparticles have been tested to improve foam stability over time [18,19,20]. When compared to surfactants, the efficiency of nanoparticles in enhancing oil recovery has been linked to their buildup at the gas–liquid interface of foams, which directly enhances stability by minimising liquid–gas contact and by preventing liquid drainage and gas diffusion [19,21,22]. Furthermore, because of their small size (<100 nm), they are less prone to adsorption on rock surfaces and may be efficiently carried through rock pore spaces during the oil displacement process without being confined in the porous medium [23,24,25,26].
Core flooding tests using foams with and without nanoparticles have recently been conducted in several types of porous media. According to Horozov et al. [27], hydrophilic nanoparticles maintain foam stability by penetrating the liquid film and by functioning as a single layer of bridge particles. This causes a network to form inside the film, aggregating the particles into a tightly packed double layer, and strengthening the foam lamella. Nonionic surfactants were utilised by Kim et al. [28] to examine the ability of various S i O 2 nanoparticles to stabilise the foam. The authors found that since smaller nanoparticles have a greater interface and larger diffusivity, they generate more stable foams.
In Kristiansen et al. [29], the authors investigated the spreading properties of a foaming composition in Berea sandstone core samples. This effect was demonstrated by changing the oil in the porous media. Their findings demonstrated that the stability of foams was frequently influenced by the spreading properties of the phases in a porous medium. In Zitha et al. [30], foam generation and its subsequent flow were examined using X-ray computed tomography in a granular porous medium.
An experimental investigation of foam behaviour in Beintheimer sandstone, together with an X-ray CT scanner, was demonstrated in the work of Farajzadeh et al. [31]. In the presence of an anionic surfactant, C O 2 and N 2 gas foaming behaviours were studied. The authors found that the two gases behave differently when foaming in the porous medium. The C O 2 foam developed a smaller pressure drop over the core than N 2 foam at both low and high pressures. Additionally, nitrogen foam propagated in a front-like way, but the propagation front of C O 2 foam appears finger-like. As a result, ultimate production by nitrogen foam was higher than that of C O 2 .
Xu et al. [13] studied the stabilities of nitrogen- and methane-generated foams with a liquid system that comprises commercial surfactants and nanoparticles. Their recovery factors were then compared through microfluidic studies. The authors revealed that although methane foam had better foamability than nitrogen foam, its stability was poor, as its half-life was 50% less than nitrogen foam. Nevertheless, its viscosity and stability were improved by adding 1 wt.% silica nanoparticles. This was evidenced by a rise in the recovery factor of more than 30%.
The combined effect of hydrophilic nanoparticles and anionic surfactants on foam in Berea sandstone cores was studied in Singh et al. [32]. Their findings revealed that when the concentration of nanoparticles increased, the mobility reduction factor in the cores also increased. The addition of nanoparticles to the foaming solution resulted in a 10% increase in oil displacement.
In the experiment conducted by Sun et al. [33], the authors used partially hydrophobic silica nanoparticles to improve foam stability. Although they found that adding nanoparticles to the foaming solution enhanced foam stability, the key mechanisms of stability and interactions between nanoparticles and surfactants were not discussed. Furthermore, the flooding process was carried out at room temperature, which does not indicate actual field conditions because reservoir temperature is a critical parameter that affects foam stability and hence oil recovery. The interaction between nanoparticles and surfactants in the presence of crude oil in a porous medium must be adequately explained to completely understand the flow and displacement process of nanoparticle-stabilised foam. However, previous studies have not thoroughly explored and discussed these issues, indicating a research gap that needs to be investigated.
In order to achieve this goal, we first conducted screening tests in Bello et al. [34] to determine the optimal types of nanoparticles and surfactants and their concentrations in different salinity and temperature conditions. Therefore, in the present work, we conducted foam stability experiments with N 2 and C O 2 foams in the presence and absence of nanoparticles at high pressure and temperature to mimic real oilfield conditions. For this purpose, we used a high-pressure microscope to visualise the foam generation and to investigate the interaction between nanoparticles and surfactants at reservoir conditions. The foam was generated in situ by co-injection with a foam generator built in the lab. The foam was then flowed into a high-pressure microscopy cell at constant pressure and temperature. Bubble size and bubble count were used to assess foam stability. After studying foam stability and its mechanisms, the foam was generated with C O 2 , and its ability to increase oil recovery was studied in both artificial and carbonate cores.

2. Experiment

2.1. Materials

2.1.1. Liquid Phase Components

The foaming agent used in this study was Alpha-Olefin Sulfonate (AOS) surfactant, and the stabilising agent was silica nanoparticles. AOS (BIO-TERGE AS-40 KSB) was obtained from Stepan, Northbrook, IL, USA as a dispersion with a 39% active content. The chemical structure is given in Figure 1:
LLC Khimuniverse, Kazan, Russia, provided nanoparticle dispersion with a 30.4 wt.% silicon dioxide concentration. A synthetic brine was made with sodium chloride (NaCl, >99.0 wt.% pure), magnesium chloride ( M g C l 2 , >99.0 wt.% pure), and calcium chloride ( C a C l 2 , >99.0 wt.% pure) to simulate the salinity condition. Chimmed, Moscow, Russia provided all of the salt types used in this study. All reagents were used as received.

2.1.2. Gas Phase Components

The gases used, C O 2 and N 2 , were supplied by Moscow Gas Processing Plant, Russia with 99% purity levels.

2.1.3. Porous Media

Two types of porous media were used in this study—artificial and real core samples. The artificial core sample (Figure 2) was prepared from spherical glass beads of diameter between 1 and 50 μ m diameter (ballotini), while real core samples were obtained from a carbonate geological formation located in the Volga-Ural region, Russia. For tests with real cores, two composite models which consist of three samples (9 cm) each were built. Their petrophysical properties are shown in Table 1.

2.1.4. Crude Oil

The crude oil used in this study is representative of the target reservoir and can be classified into two models, namely A and B. Oil models A and B were used for the artificial and real core samples, respectively. The oil models were used for flooding after the processes of deasphaltisation and recombination. The detailed procedures of these processes are given in the methodology section. The final characteristics of the oil models are presented in Table 2.

2.2. Methodology

Foams were generated with N 2 and C O 2 and liquid solutions containing nanoparticles and surfactant, at 50% and 80% foam qualities, to achieve the goals of this study. Foam quality refers to the ratio of the gas phase in the foam to the overall foam volume. In this study, it is represented using the formula below:
Γ = Gas   flowrate Gas   flowrate + Liquid   flowrate
where Γ is   foam   quality , % .
High-pressure microscopy was used to evaluate the stability of these foams under the pressure and temperature conditions of an oil reservoir. As described in our previous study [34], foam stability was investigated in the absence and presence of nanoparticles at appropriate concentrations. This was carried out to determine the level of foam stability before proceeding to filtration studies to determine the oil recovery factor, among other objectives. The algorithm of the methodology of this work is shown in Figure 3.

2.2.1. Preparation of Nanofluids

Surfactant solution was dispersed in brine to achieve the necessary surfactant concentration. Since the AOS surfactant was already in the liquid phase, the following dilution formula was employed to calculate the required volume:
C 1 V 1 = C 2 V 2
where C 1 = initial concentration of solution, %; V 1 = initial volume of solution, mL; C 2 = final concentration of solution, %; V 2 = final volume of solution, mL.
The brine solutions were prepared by weighing the required grams of salts into deionised water. In the current study, we prepared a synthetic brine using the quantities and salt combinations specified in Zhu et al. [35]: 3 wt.% NaCl, 0.12 wt.% M g C l 2 , and 0.38 wt.% C a C l 2 . The nanosolutions were homogenised for about 2 h at 500 rpm using a magnetic stirrer. The silica nanoparticles used in this study were also obtained in a dispersed form, and thus, the same dilution formula was applied. A precise and analytical balance was used to determine the masses of all reagents (Mettler-Toledo, Switzerland). During foam stability testing, mechanical vibrations were minimised as much as possible. In our experiments, the concentration of AOS used was slightly above its CMC—0.3 wt.% and was fixed for all tests. The concentrations of silica nanoparticles used were 0.05 wt.% and 0.1 wt.% according to our previous study [34].

2.2.2. High-Pressure Microscopy Foam Stability

The experimental setup for investigating foam stability under reservoir conditions in a high-pressure microscope is shown in Figure 4.
The liquid and gaseous phases were injected into the foam-generating unit using two plunger pumps (LN-400 and LN-P-1000-80) (GEOLOGIKA, Novosibirsk, Russia). Water was pumped into the lower portions of the constant pressure flow piston (CPFP) cylinders (GEOLOGIKA, Novosibirsk, Russia) using the plunger pumps. As a result, gas and nanosolutions were flowed through the pipes, mixed at a three-way junction, and then injected into the foam generator, which is a hollow tube filled with glass beads of sizes ranging from 200 to 300 μ m. The inlet and outlets of the foam generator were equipped with filters of 140 and 90 μ m, respectively. The inlet filter aids in the appropriate mixing of the two phases going into the foam generator, while the outlet filter prevents the glass beads from flowing out of the system.
For each experiment, the foam was generated at 50% and 80% foam qualities. Gas and liquid flow rates were set to 1 mL/min at 50% foam quality, while they were set at 1.6 and 0.4 mL/min, respectively, at 80% foam quality. The valves were opened after foam generation was completed, and the foam flowed into the high-pressure microscope (HPM) (Vinci Technologies, Nanterre, France). With the help of the pumps, the pressure within the HPM system was kept constant. This was observed with the pressure gauge fitted at the inlet of the HPM. The temperature was maintained by circulating silicone oil in a heating jacket around the HPM system. The temperature in the HPM cell was monitored using a calibration thermostat (LAUDA, Lauda-Königshofen, Germany) dipped in the HPM cell and regulated using Applilab supervision software installed on the data acquisition PC. The HPM measurement was accurate, as foam samples were always kept at constant pressure and temperature during the experiment to monitor the changes in size and morphology. The HPM system is embedded with a particle size analyser that can detect sizes with resolution as high as 0.2 μ m and that calculates size distributions by measuring bubble count and size. The data are recorded regularly and are shown in real-time on the image-acquisition unit, where the results can be viewed after the experiment is completed. To remove any foam residue left in the pipes and HPM cell, the entire system was purified with air and 80:20 mixture of acetone and toluene at 60 °C after each experiment.

2.2.3. Preparation of Core Samples

To obtain a stable mass of the core samples, they were cleaned and then dried for over 12 h at 80 °C in a vacuum oven (Memmert GmbH, Schwabach, Germany), and the dry mass was determined using a weighing balance (Mettler Toledo, Columbus, OH, USA). Then, porosity and permeability were measured by helium using an automated porosity and permeability analyser, PIK-PP porosimeter (GEOLOGIKA, Novosibirsk, Russia). Afterwards, the cores were saturated with brine containing 250 g/L of N a C l , and residual water saturation ( S w i r ) was established by using a centrifuge.
Before core flooding tests, the core was filtered with formation water to reduce electrolytes (salts), improving filtration–capacitive properties (porosity and permeability), and assessing the influence of water on the rock matrix. The methodology and results are provided in the Supplementary Material.

2.2.4. Preparation of Oil for Filtration Experiment

The desphaltisation process was carried out to remove asphaltenes from the oil. After that, the oil sample was recombined with methane gas to obtain an appropriate representation of reservoir oil. This was carried out by filling the deasphalted oil into a CPFP cylinder and then connecting it to a methane gas cylinder. When the required gas volume was reached, it was transferred to the recombination unit PIK-RP (GEOLOGIKA, Novosibirsk, Russia) and recombined at 35 MPa.

2.2.5. Filtration Experiments

The filtration tests were carried out to investigate the efficiency of nanoparticle-stabilised foams in recovering residual oil after injecting C O 2 into the core samples under reservoir conditions.
Three sets of filtration experiments were carried out in this study. The first set was conducted with an artificial core sample under a temperature of 38 °C and an injection pressure of 20.8 MPa, while the second set was conducted under the same temperature and injecting pressure conditions but with a real core sample model. In the third set of core flooding experiments, the temperature condition was still 38 °C, but the injection pressure was reduced to 8.5 MPa (see sections below).
The pressure drops across the core sample were monitored during the test, and a baseline was created when a steady differential pressure was reached. The foam mobility reduction factor (MRF) was used to assess the resistance to gas flow during foam generation in steady-state conditions. In the context of this study, MRF was defined as the ratio of pressure drop across the porous medium during foam injection to the pressure drop during gas injection.
M R F = Δ P foam Δ P gas
The experiment was carried out in four stages: (i) core preparation, (ii) oil filtration, (iii) C O 2 injection, and (iv) nanofoam injection.
  • Stage I—During core preparation, the core samples were dried to a constant weight, and then, their filtration–capacitive properties were determined, which are summarised in Table 1. The cores were then saturated in water and centrifuged to create residual water saturation. Afterwards, the cores were filtered with decane in order to convert the system from atmospheric conditions to thermobaric conditions, since a recombined oil is used to represent the reservoir oil. Filtration with decane also serves as a test run experiment to determine if there are any cracks in the core sample or leakages within the core flooding unit.
  • Stage II—To achieve irreducible water saturation, the filtration experiment began with the injection of oil. The injection process was repeated until the differential pressure stabilised. During oil filtration, thermobaric conditions (temperature of 38 °C and pressure of 20.8 MPa) were created by replacing the decane in the core sample with a recombined model of the reservoir oil.
  • Stage III— s c C O 2 was injected until a stable recovery factor with a constant flow rate was obtained. This was determined until a stable pressure gradient was obtained.
  • Stage IV—Finally, nanofluid (low salinity brine + 0.3 wt.% AOS surfactant + 0.1 wt.% silica nanoparticles) and s c C O 2 were injected as foam until a stable recovery factor was obtained, and then, the injection rate was increased.
During the experiment, the oil saturation was determined based on the amount of oil initially present and produced during every injection step in terms of the pore volume of the core sample. Fluids were transferred into CPFP cylinders (GEOLOGIKA, Novosibirsk, Russia) and subsequently displaced into the filtration setup using distilled water pumps (GEOLOGIKA, Novosibirsk, Russia). The pump was used to raise the pressure within each CPFP cylinder to the desired pressure before opening the valves. The pressure drop across the core was monitored and measured using two pressure gauges and a differential pressure gauge.
Foam injection was carried out by continuously injecting pre-generated foam from a foam generator at a foam quality of 80%. The test apparatus was kept at a constant temperature in an oven. Outside the oven, a gas flow meter (Ritter, Gröbenzell, Germany) was used to measure gas production and was coupled to gas chromatography equipment to determine the gas composition. Each experiment lasted until a steady-state pressure drop was obtained across the core. During each experiment, pressure and recovery data were collected, and the findings were evaluated to confirm foam generation and to determine oil recovery. Figure 5 presents a schematic diagram of the experimental setup:
All the parameters such as injection rate, surfactant type and concentration of nanoparticles, foam quality, and temperature were kept constant during the core flooding of s c C O 2 and s c C O 2 foam for justifiable comparison. In addition, the properties of the core, as well as fluid saturation, were established for a valid comparison of the recovery obtained by the two recovery agents.

3. Results and Discussion

Foam stability under various conditions was analysed by the foam bubble count and average bubble size over a three-hour period in high-pressure microscopy studies. The dynamics of these parameters are presented in the sub-sections that follow.

3.1. Effect of Foam Quality on the Stability of Foams without Nanoparticles

Bubble shape and size are frequently used to characterise and classify foams. Since foam bubbles are not uniform in morphology, their bubble size distribution is commonly used to describe them [36,37]. Foam stability is linked to bubble size. Smaller-bubble foams are more stable than larger-bubble foams [33,38,39]. However, more essential is how long they maintain their size and morphology.
In this study, C O 2 and N 2 foam were generated at a pressure of 11.7 MPa and at temperatures of 40 and 26 °C, respectively. Moreover, foam qualities of 80% and 50% were used. Figure 6 shows images of foam bubble evolution over three hours. A graphical representation of the numbers is shown in the Supplementary Materials.
Foam quality, as reported in other studies [40,41], has a direct effect on most foam characteristics. This is because it determines the proportions of the components of the foam.
The graphs presented in the Supplementary Material support these claims even more. It can be seen that in both N 2 and C O 2 foams, 80% foam quality is more stable. At 80% foam quality, the average bubble size is reduced, and the bubble count is increased. We assume that because the gas volume in the foam is smaller in the 50% foam quality, less foam is produced. This results in a lesser number of bubbles, which are completely engulfed by the liquid phase. As a result, the foam lamellae reduces in size, and stability declines as all of the foam bubbles collapse rapidly.
Our findings are consistent with earlier research works. Fu et al. [42] discovered that when foam quality was increased from 10% to 70%, apparent viscosity increased as well; however, increasing foam quality beyond 70% resulted in a decrease in apparent viscosity. The authors further linked these findings to foam texture and observed that as foam quality increased between 10% and 70%, the generated C O 2 foam became finer. They proposed that as foam qualities improve, thus will foam viscosities, and hence foam stability, because the lamellae will provide a better resistance to deformation as the surface tension gradient at the interfaces increases.

3.2. Effect of Nanoparticles on the Stability of Foams at High Pressure

At the parameters previously described, we investigated the effect of nanoparticles on the stability of N 2 and C O 2 foam generated at 80% quality. The results can be seen in Figure 7, which shows a series of images depicting the progression of foam bubble size in the presence and absence of nanoparticles within three hours at a fixed field of view.
Visually, it can be seen that with the addition of nanoparticles, foam bubbles tend to become smaller in size, resulting in an increase in bubble count. To ascertain the numbers underlying the foam bubbles, a quantitative analysis was also performed. Table 3 and Table 4 show the average bubble size of foams generated with supercritical N 2 and C O 2 estimated with the particle-detecting software embedded in the HPM, while the foam bubble counts are shown in Table 5 and Table 6.
The absence of nanoparticles resulted in a lesser bubble count, as shown in the tables above. This can be explained by Ostwald ripening. Due to the pressure differences generated by the Young–Laplace effect [43], the bubble size increased rapidly over time, and large-sized bubbles merged with neighbouring small bubbles. The pressure within the smaller bubble is higher than the pressure within the larger one, as shown in Figure 8, and if the diffusing gas is soluble in the liquid phase, gas can be transported from the smaller bubble to the larger one. As a result, the number of large bubbles will continue to increase. When compared to the data collected for foam in the presence of nanoparticles, it can be seen that adding nanoparticles increased the number of bubbles and hence foam stability.
The bubbles were more uniform in the presence of nanoparticles than in the absence of nanoparticles, and the morphology of the bubbles was maintained. This is because S i O 2 was adsorbed on the bubble surface, and it increased the surface dilational viscoelasticity, which strengthened the foam’s interfacial layer [44,45]. Furthermore, the adsorption of S i O 2 on the bubble surface decreased the surface area accessible for interbubble gas diffusion, which prevents Ostwald ripening [46].
Nanoparticles do not have the ability to generate foams on their own; however, they can cause an increase in foam volume by forming an extra layer at the gas–liquid interface, which limits the area available for gas diffusion, resulting in the formation of more foam bubbles.
The trends in the graphs in the Supplementary Material can be used to interpret foam stability. The addition of nanoparticles resulted in an increase in foam bubble count and in a corresponding decrease in average bubble size in all cases. The extent of these changes varies depending on the type of gas used in foaming and the concentration of nanoparticles added. This is why determining the optimal nanoparticle concentration at specific conditions is critical.
In our experiment, it appears that smaller bubbles were produced in the presence of nanoparticles in both nitrogen and C O 2 foams. This is due to the nanoparticles’ high adhesion energy at the interface. Nanoparticles can improve foam stability by adsorbing at the interface and as such increase the flow resistance on liquid films and slow liquid drainage [47,48]. Binks et al. [49] claimed that nanoparticle adhesion energy at the interface was hundreds of times more than that of a surfactant molecule.
Nanoparticles in the liquid film form a monolayer structure between the bubbles, slowing drainage by limiting gas mobility and by preventing bubble coalescence. However, foam stability will be reduced at concentrations above the optimum concentration of nanoparticles. This reduction in foam stability is caused by an accumulation of nanoparticles at the foam interface, which can begin to precipitate, thereby lowering the stability.

3.3. Role of the Gas Phase in Foam Generation and Stability

Foams created with gases in their original vapour state and at supercritical conditions are compared in this section. At 26 °C and 3 MPa, both N 2 and C O 2 foams were generated under vapour conditions. Nitrogen foam was produced at 26 °C and 11.7 MPa under supercritical conditions, whereas C O 2 foam was produced at 40 °C and 11.7 MPa.
It is clear from Figure 9 that foams generated with vapour gases differ greatly from foams generated with gases at supercritical conditions (Figure 7). Due to the higher density of the gas at a supercritical state, especially for C O 2 , the foam generated was emulsion-like, and hence, more stable foams were generated than when the gas was in the vapour state. Our findings can be supported with the study of Johnston and Shah [50]. The authors noted that fluids at supercritical temperatures do not exhibit surface tension because they are not in contact with both gas and liquid phases. This absence of gas–liquid contact prevents the attraction of gas molecules towards the interior of the liquid phase [51,52]. Consequently, this lack of surface tension is the reason that foams were observed to be more stable under supercritical conditions of gases in our study. Foams are composed of gas bubbles dispersed in a liquid medium, and thus, their stability depends on the balance between various forces, including surface tension. In the absence of surface tension in supercritical fluids, there is no attraction between gas molecules and the surrounding liquid phase. This lack of attraction can result in enhanced stability of foams formed in supercritical conditions.
Figure 9 illustrates that N 2 foam is significantly more stable than C O 2 foam even under vapour conditions. Although the stability of foams generated with C O 2 in the gas phase appears to be poor, the effect of nanoparticles can still be seen when 0.05 wt.% silica nanoparticles were added, as shown in Figure 9b. Foams generated with 0.05 wt.% nanoparticles were thicker than foams generated without nanoparticles. This is also the case for the foam generated with N 2 in gas phase (Figure 9a). The foam bubble size is reduced and is evenly distributed when 0.05 wt.% nanoparticles were added to the N 2 foam.
The stability difference between the N 2 and C O 2 foams at vapour conditions is primarily due to their solubility differences [53,54]. This effect is more pronounced in C O 2 foam due to its greater solubility, which resulted in a decrease in foam stability, as seen in Figure 9b. This is consistent with the findings of Szabries et al. [55]. The authors asserted that N 2 foams are stronger and more stable than C O 2 foams, because C O 2 has a high solubility in water, which is about 60 times greater than that of N 2 . C O 2 dissolves more quickly in the liquid layers of the foam, resulting in a higher rate of gas diffusion between the bubbles. Pressure has a similar influence on average bubble size for both N 2 and C O 2 in the experiments conducted in this study. With an increase in pressure from 3 to 11.7 MPa, the average bubble size of the foam bubbles was reduced, and the bubble count was increased.
Foam stability is better improved at greater pressures, regardless of the gas type, according to the findings of this study. At high pressures, gases become denser, which improves intermolecular interactions between the gas and the hydrophobic part of the surfactant molecules. With N 2 , stable foams may be produced at both low and high pressures, while with C O 2 , only high pressure is favourable for foam stability.

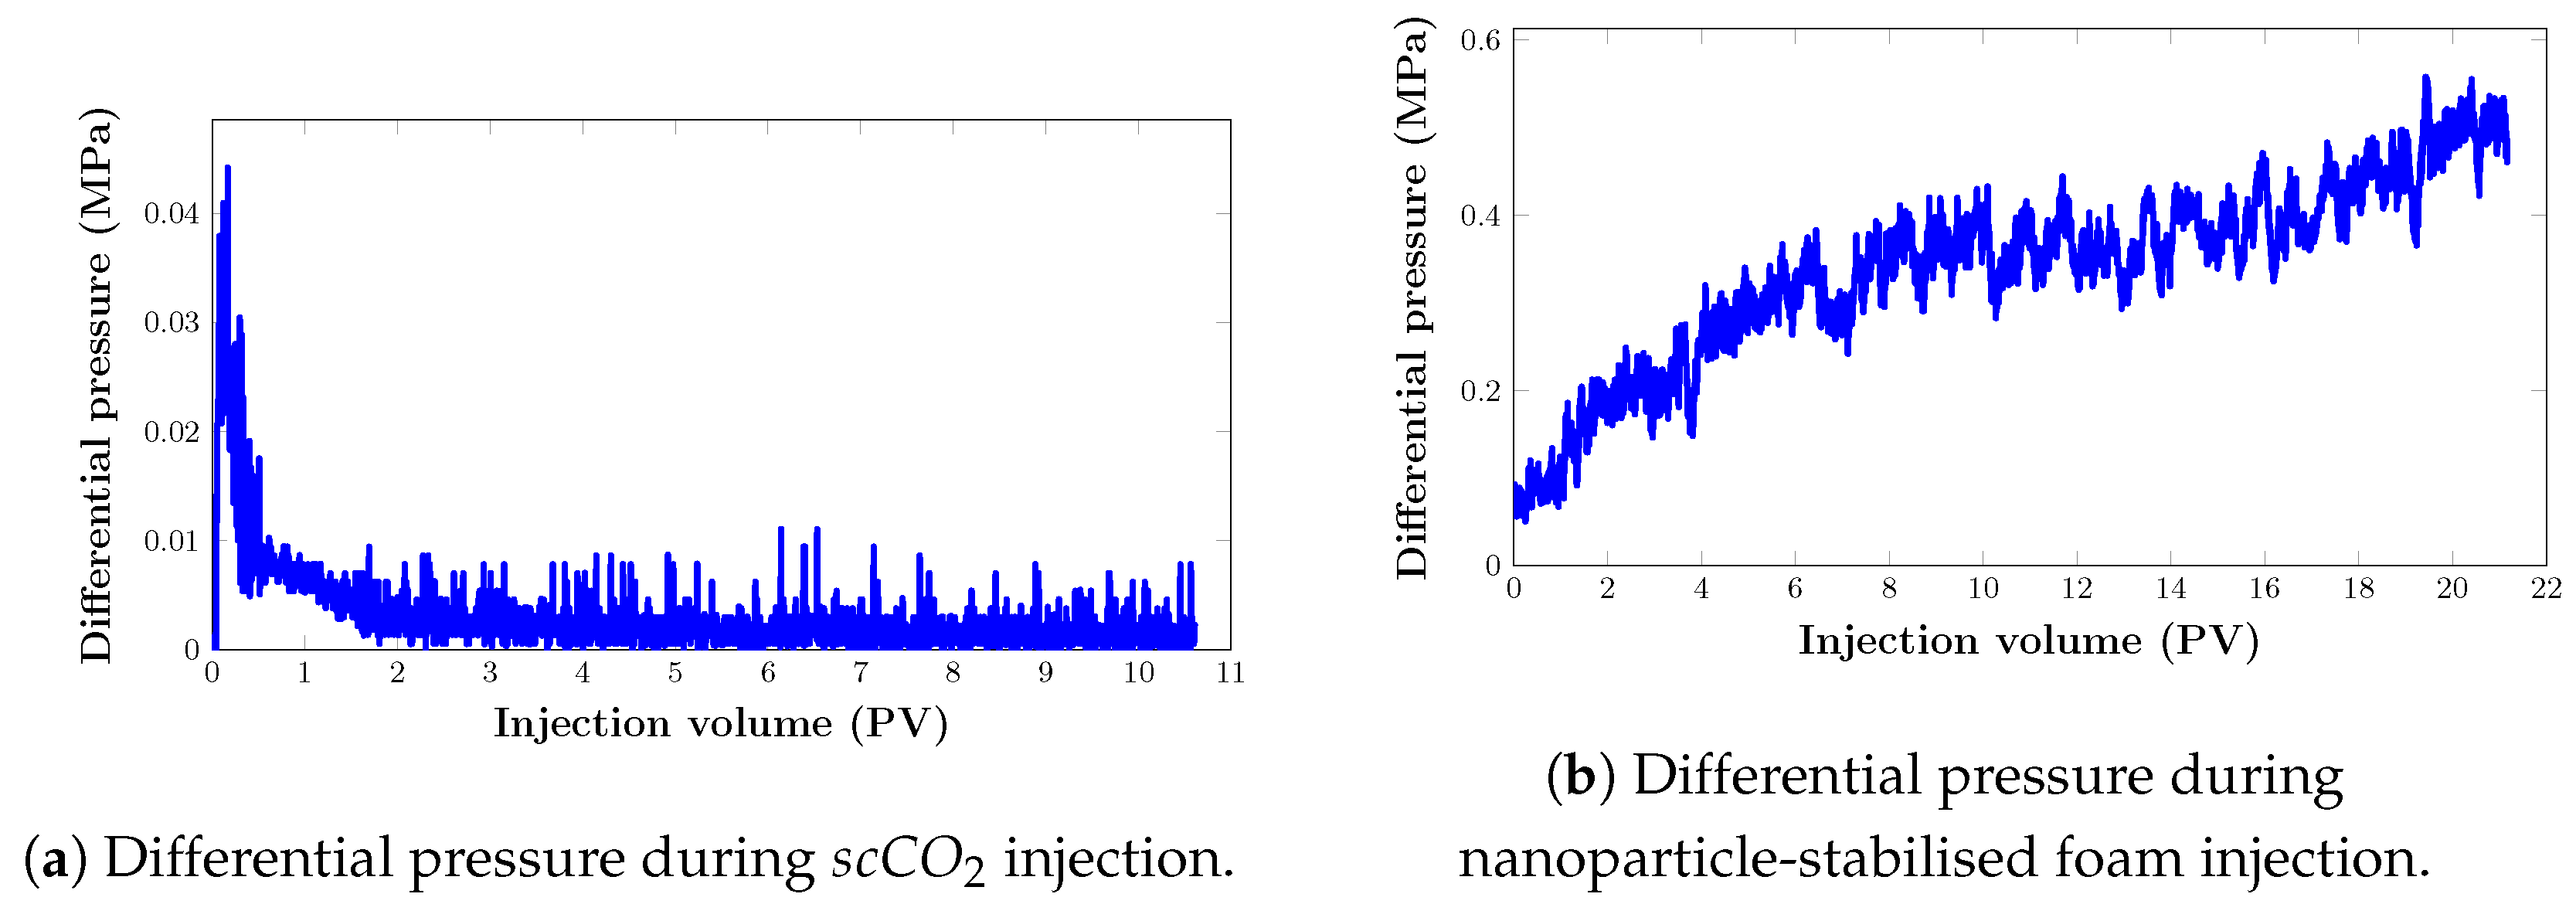
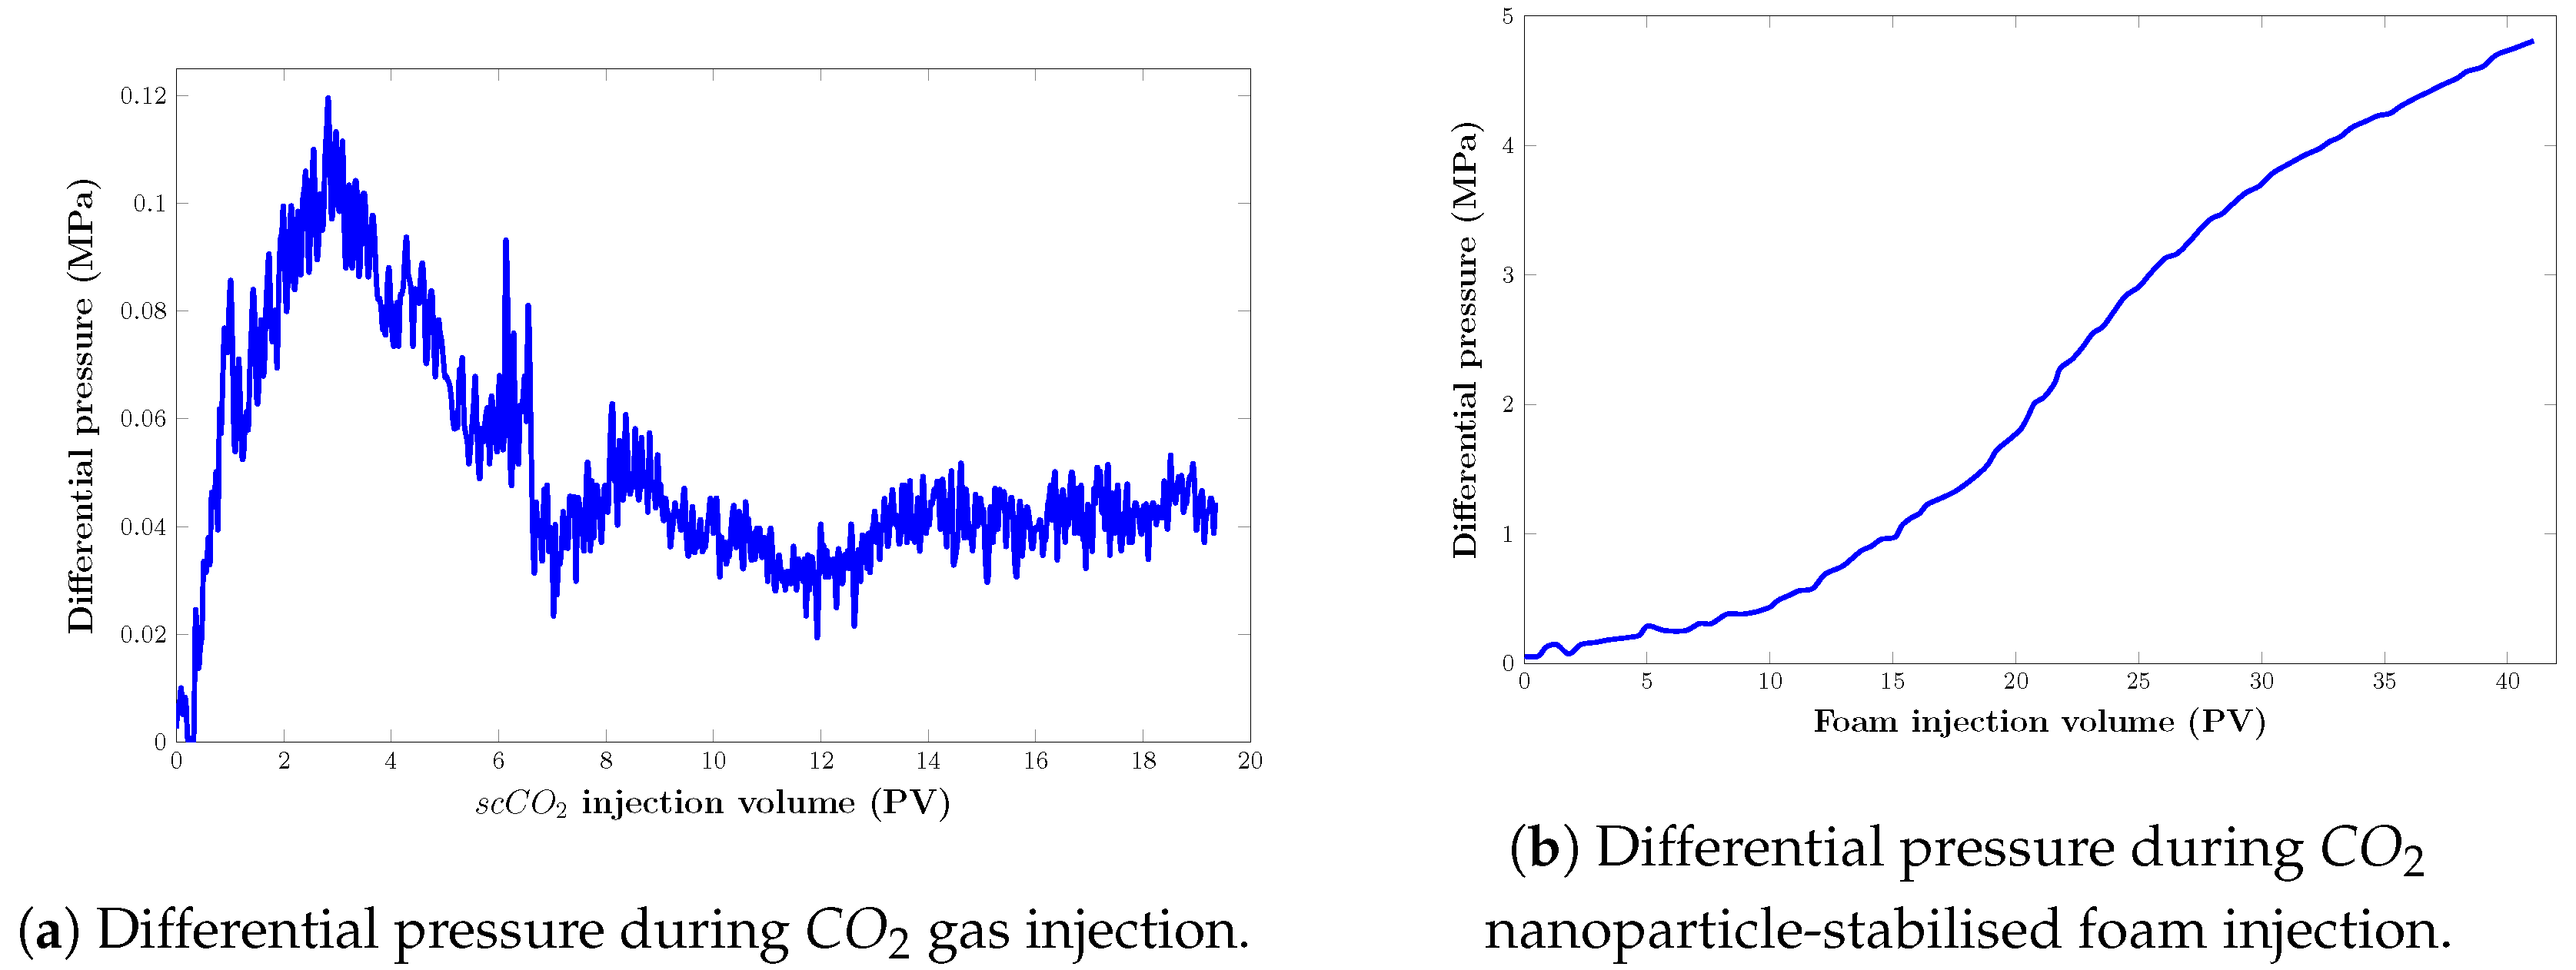
3.4. Oil Recovery Performance of Core Flooding Experiments

The sequence of flooding in core samples is summarised in Figure 10.

3.4.1. Core Flooding in an Artificial Core Sample (Set 1)

Oil Recovery Factor

Figure 11 illustrates oil recovery at a reservoir temperature of 38 °C and injection pressure of 20.8 MPa as a function of injected pore volumes. s c C O 2 was injected into the artificial core sample at an initial flow rate of 0.2 mL/min. The initial oil saturation of the core sample was 91.25%. The total oil recovery with s c C O 2 injection was 48.9%. Pre-generated nanoparticle-stabilised s c C O 2 foam of 80% foam quality was then injected at a total flow rate of 0.2 mL/min after almost 11 PV of s c C O 2 injection. There was no additional oil produced as a result of this. It was believed that the differential pressure across the core was not high enough and that the injected surfactant in the liquid phase was used up by rock adsorption, resulting in insignificant oil production. Therefore, to counteract capillary end effects, the flow rate was gradually increased up to 2 mL/min. During foam flooding, an additional 40.8% of oil was recovered.
The oil recovery from the core sample was 28.6% when 2 PV of s c C O 2 was injected, as it can be observed in Figure 11. Oil recovery increased to 40.5% after injecting 5 PV of s c C O 2 . After that, it gradually grew until it reached 48% after 10 PV was injected. Following gas injection, nanoparticle-stabilised foams were injected. As 2 PV of foam was injected, 24.3% of residual oil was recovered (Figure 11), bringing the total oil recovery from 48.9% to 73.2%. After 5 PV foam was injected, it climbed to 80.3%. The cumulative oil recovery reached almost 90% after about 11 PV of gas injections and 21 PV of foam injections.
During s c C O 2 flooding, s c C O 2 gas breakthrough occurred as soon as 0.14 PV of s c C O 2 was injected. The density difference between the displacing and displaced fluids, which caused gravitational segregation, is a typical problem during most C O 2 field operations. To put this into context, the viscosity of s c C O 2 gas at thermobaric conditions in this experiment was 0.086 mPa · s. Oil, on the other hand, had a viscosity of 3.13 mPa · s.
When s c C O 2 foams were injected, the gas breakthrough was not noticed. This was a substantial improvement over the much earlier gas breakthroughs seen in s c C O 2 flooding. This implies that the nanofoam has a higher sweep efficiency than s c C O 2 .
To limit gravity override and viscous fingering, the injected foam must have a viscosity of several orders of magnitude higher than pure s c C O 2 , so as to lower gas mobility and to mitigate gas channeling, as described in previous sections.

Mobility Control

It is necessary to characterise the mobilities of injected fluids in the porous media in order to understand the displacement process and the superior oil recovery performance of foam in comparison with s c C O 2 injection. Figure 12 below shows the dynamics of differential pressure during the filtration experiment.
The results during foam injection (Figure 12) demonstrate a rapid foam-generation process shortly after injection, indicating favourable foam behaviour. Although at some point, gradual changes in pressure drop response are noted, this can be explained by the high permeability and initial low injection rate. High permeability suggests that the porous medium has relatively large and interconnected pores to enable fluid movement. This means that foam can quickly flow and propagate through the pathways created by the existing porosity or fractures. We believe that this rapid movement led to rapid foam generation shortly after injection. Furthermore, a low injection rate allows the foam to gradually penetrate and displace the existing fluid within the medium. As the foam displaces the fluid, it fills the pore spaces and creates a foam front that propagates through the porous medium. However, during this initial stage of low injection rate, the foam may encounter resistance, especially if there are narrow or constricted pathways. The gradual changes in pressure drop response observed during this stage could be attributed to dynamics of foam flow through these pathways.
During s c C O 2 gas flooding, the pressure drop increased sharply until gas breakthrough. The pressure drop was significantly reduced after the gas breakthrough, and it was stabilised with a further injection of s c C O 2 . This is similar to the results in Ghoodjani et al. [56]. According to the authors, the high compressibility of gas increases the pressure prior to gas breakthrough. Following breakthrough, gas has an open path to flow into, and as gas saturation rises, gas relative permeability rises, resulting in a drop in differential pressure.
Mobility control performance of foam injection can also be characterised using the mobility reduction factor (MRF). Using Equation (3), the mobility reduction factor was determined as 12.6. This implies that in our experiment, nanoparticle-stabilised foam was able to reduce the mobility of s c C O 2 in the porous medium by over 10 times.

3.4.2. Core Flooding in a Real Core Sample with an Injection Pressure of 20.8 MPa (Set 2)

The sequence of flooding in the real core model is the same as that of the artificial core earlier shown in Figure 10. The baseline injection flow rate of C O 2 was also 0.2 mL/min. The initial oil saturation was 66.15%.
As seen in Figure 13, the oil recovery from the core sample quickly increased to 74.4% after almost 1 PV of C O 2 was injected. After that, oil recovery grew gradually to 91% after two pore volumes. From the graph, it can be seen that the last increase in oil recovery was noted between 2 and 2.5 PV. Hence, the flooding process was stopped when there was no significant increase in cumulative oil production. This brings the total oil recovery to 98.8% with a total s c C O 2 injection of three pore volumes. Nevertheless, the foam was injected at 80% quality at a total flow rate of 0.2 mL/min. As expected, there was no oil production. This is mainly due to the fact that s c C O 2 injection proved to be very effective in recovering almost all the oil in the porous medium at such pressure. This can be attributed to the absence of gas breakthrough and a stable pressure drop (Figure 14).
However, there were some other fascinating findings from this. Comparing the results of s c C O 2 and s c C O 2 foam injections from the artificial core (Figure 11) with those of a real core (Figure 13), it should be answered why foam injection was successful in the artificial core and unsuccessful in the real core.
At this point, this is not a question of foam stability, as foam viscosity was determined in a capillary tube as 0.54 and 0.58 mPa · s. Foam stability in the porous medium during filtration can be evidenced by this, as there was no significant change between foam viscosity before and after filtration.
Additionally, we believe that the permeability differences between the real and artificial cores played a big role in their oil recovery outcomes. From Table 1, it can be seen that the permeability of the artificial core is higher than that of the real core by several orders of magnitude. Another petrophysical property that could have influenced the disparity of results is the length of the porous medium. The length of the artificial core was 7.58 cm and that of the real core model sums to 9.23 cm. This suggests a shorter propagation distance for the injectant in the case of the artificial core.
Furthermore, we propose that the injection pressure during s c C O 2 injection (20.8 MPa) is much higher than the minimum miscibility pressure (MMP) of C O 2 with the oil model in the core sample. In order to verify this, an MMP simulation was made using CMG-WINPROP. Further details of the simulation process can be found in the Supplementary Material. C O 2 MMP was determined as 8.63 MPa. This indicates that the injection occurred at a pressure more than twice its MMP, which makes C O 2 instantly miscible with reservoir oil upon first contact and which tends to recover all the oil in place. This is in agreement with the results in Li et al. [57] where an investigation of the influence of C O 2 injection pressure when the pressure is below and above MMP was conducted.

3.4.3. Core Flooding in a Real Core Sample with an Injection Pressure of 8.5 MPa (Set 3)

To support our claims from the previous section, the third set of core flooding experiments was conducted. As with the other sets, the core flooding sequence was the same. However, the injection pressure was reduced to 8.5 MPa, which is closer to the minimum miscibility pressure. When planning gas injections, injection pressure is crucial because, to some extent, it determines the miscibility of the injected gas with the reservoir oil.
Figure 15 and Figure 16 show that after injecting about 19 pore volumes of s c C O 2 , 37.69% of the oil was recovered, and an additional 28.91% was recovered after injecting roughly 40 pore volumes of nanoparticle-assisted C O 2 foam at a ratio of 4:1 of the gas and liquid phases.
These results further confirm our claims in the previous section that the injection pressure during s c C O 2 injection plays a significant role in the implementation of foam injection in the field. It would be pointless to inject foam for EOR in circumstances where the injection pressure is significantly higher than the MMP and where a high recovery factor is obtained.
These arguments are supported by the claims in Shyey-Yung J. [58], who suggested that recovering residual oil by injecting s c C O 2 at pressures close to MMP may be enhanced by a potential improvement in the mobility ratio of the reservoir oil and s c C O 2 . Additionally, Song et al. [59] compared oil recovery factors at different s c C O 2 injection pressures. According to their findings, the optimum injection pressure was close to the minimum miscibility pressure. Even though they asserted that a higher injection pressure led to a higher oil recovery, it was not ideal because it led to an early breakthrough of gas.

4. Conclusions

High-pressure microscopy and core flooding experiments have been used in this study to conduct comprehensive analyses of nanoparticle-stabilised foam under conditions of a producing conventional oil field located onshore Russia. The following inferences can be made based on the experimental results of foam stability, foam structure, and foam EOR at reservoir pressures:
  • Since s c C O 2 easily dissolves in liquid, the stability of s c C O 2 and s c N 2 foams significantly differs. Gas penetration between C O 2 foam bubbles is significantly increased, which has a detrimental effect on foam stability.
  • As pressure increases, the foam becomes more stable. This is more pronounced in C O 2 foams. Foams generated with C O 2 are significantly less stable than foams made with N 2 in both the vapour and supercritical states. However, generating foams with supercritical C O 2 is more stable than with vapour C O 2 because of the increased pressure.
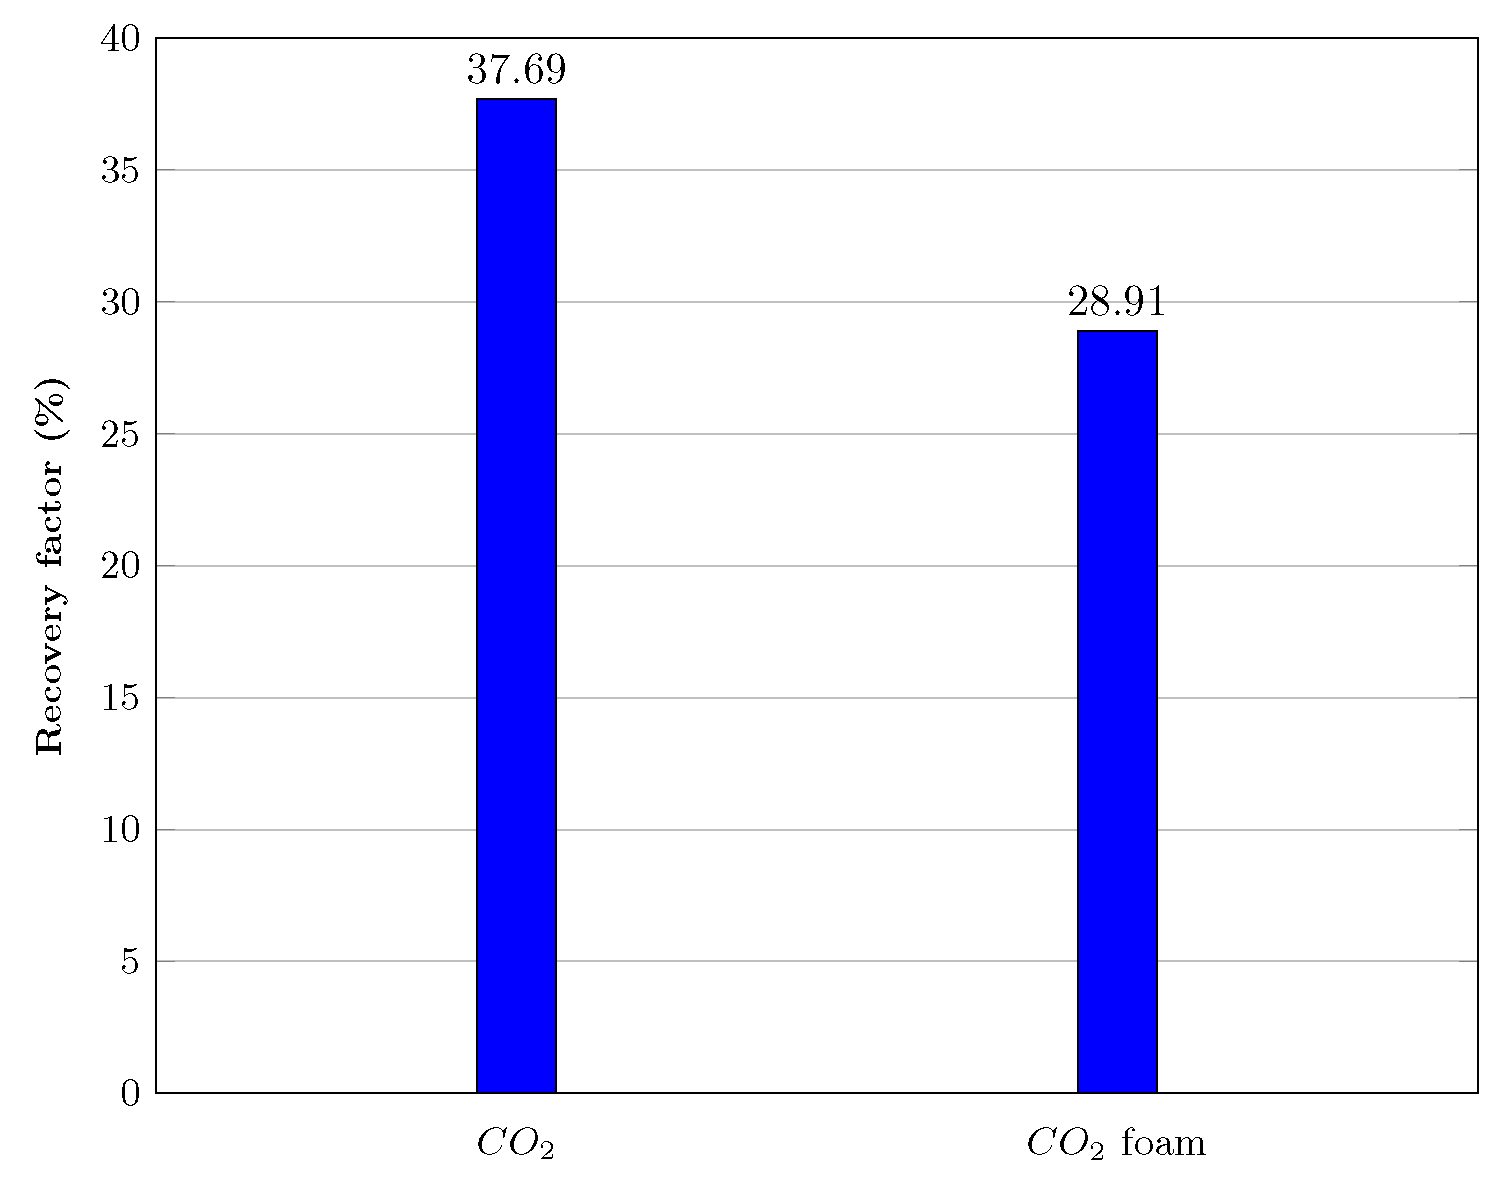
  • Core flooding tests showed that nanoparticle-stabilised C O 2 foam helped to improve oil displacement efficiency from the porous media. At some point in both the artificial and real core samples, C O 2 injection could no longer recover oil. However, implementing foam as a tertiary recovery technique resulted in recovery factors of 40.8% and 28.91%, respectively. This can be attributed to the enhanced viscosity of the propagating phase during the injection of foam, which helped to eliminate the gas breakthrough that was observed during the injection of C O 2 .
  • The mobility reduction factor in artificial core flooding was determined as 12.6, which suggests that the injected nanofoam was able to lower the mobility of s c C O 2 in the porous medium by a factor of more than ten.
  • Finally, the difference in EOR results could be seen in the implementation of foam injection in artificial and real core samples. Our study has demonstrated that these differences might be attributable to rock permeability, the length of the core sample, minimum miscibility pressure, and the mode of foam injection. Therefore, before performing laboratory core flooding studies, it is crucial to precisely identify, characterise, and validate these parameters.

Supplementary Materials

The following supporting information can be downloaded at: https://www.mdpi.com/article/10.3390/en16135120/s1, Table S1: Results of analytical study of formation water; Table S2: Results of analytical study of core sample; Figure S1: CT scan images of the core sample before and after filtration; Figure S2: Distributions of average bubble size and bubble count to show influence of foam quality on foam stability; Figure S3: Distributions of average bubble size and bubble count over 3 h to show influence of nanoparticles on foam stability; Figure S4: Mass components of Oil Model B; Figure S5: MMP results of CO2 injection in Oil model B (see methodology part).

Author Contributions

A.B.: Conceptualisation, Methodology, Investigation, Data Curation, Writing— Original Draft, Visualisation. A.I.: Conceptualisation, Methodology, Investigation, Data Curation, Writing—Review and Editing, Supervision. A.R.: Methodology, Investigation, Writing—Review and Editing. T.A.: Methodology, Investigation, Writing—Review and Editing. A.M.: Methodology, Investigation, Writing—Review and Editing. D.B.: Methodology, Investigation, Writing—Review and Editing, Supervision P.G.: Methodology, Project Administration, Supervision. P.B.: Writing—Review and Editing, Resources, Supervision. A.P.: Writing—Review and Editing, Resources, Supervision. K.K.: Writing—Review and Editing, Resources, Supervision. A.C.: Writing—Review and Editing, Resources, Project Administration, Supervision. All authors have read and agreed to the published version of the manuscript.

Funding

This work was supported by the Ministry of Science and Higher Education of the Russian Federation under agreement no. 075-10-2022-011 within the framework of the development program for a world-class research centre.

Data Availability Statement

Required datasets will be made available upon request.

Acknowledgments

The authors would like to thank Jafar Khalighi for assisting with HPM tests and Timur Yunusov for his technical assistance.

Conflicts of Interest

The authors declare that they have no competing interests that could have influenced the work reported in this paper.

References

  1. Johns, R.T.; Dindoruk, B. Chapter 18—In situ combustion. In Enhanced Oil Recovery Field Case Studies; Gulf Professional Publishing: Oxford, UK, 2013; pp. 1–22. [Google Scholar]
  2. Zhang, P.Y.; Huang, S.; Sayegh, S.; Zhou, X.L. Effect of CO2 impurities on gas-injection EOR processes. In Proceedings of the SPE/DOE Symposium on Improved Oil Recovery, Tulsa, OK, USA, 17–21 April 2004. [Google Scholar] [CrossRef]
  3. Song, Z.J.; Li, M.; Zhao, C.; Yang, Y.L.; Hou, J.R. Gas injection for enhanced oil recovery in two-dimensional geology-based physical model of Tahe fractured-vuggy carbonate reservoirs: Karst fault system. Pet. Sci. 2020, 17, 419–433. [Google Scholar] [CrossRef] [Green Version]
  4. Teletzke, G.F.; Patel, P.D.; Chen, A.L. Methodology for miscible gas injection EOR screening. In Proceedings of the SPE International Improved Oil Recovery Conference in Asia Pacific, Kuala Lumpur, Malaysia, 5–6 December 2005; pp. 315–325. [Google Scholar] [CrossRef]
  5. Yu, H.; Chen, Z.; Lu, X.; Cheng, S.; He, Y.; Shi, L.; Xian, B.; Shi, T. Experimental Study on EOR Performance of Natural Gas Injection in Tight Oil Reservoirs. IOP Conf. Ser. Earth Environ. Sci. 2019, 252, 052021. [Google Scholar] [CrossRef]
  6. Hudgins, D.A.; Llave, F.M.; Chung, F.T. Nitrogen miscible displacement of light crude oil: A laboratory study. SPE Reserv. Eng. 1990, 5, 100–106. [Google Scholar] [CrossRef]
  7. Asgarpour, S. An Overview of Miscible Flooding. J. Can. Pet. Technol. 1994, 33, 5–12. [Google Scholar] [CrossRef]
  8. Awan, A.R.; Teigland, R.; Kleppe, J. A survey of North Sea enhanced-oil-recovery projects initiated during the years 1975 to 2005. SPE Reserv. Eval. Eng. 2008, 11, 497–512. [Google Scholar] [CrossRef]
  9. Farajzadeh, R.; Andrianov, A.; Krastev, R.; Hirasaki, G.J.; Rossen, W.R. Foam-oil interaction in porous media: Implications for foam assisted enhanced oil recovery. Adv. Colloid Interface Sci. 2012, 183–184, 1–13. [Google Scholar] [CrossRef] [PubMed]
  10. Afzali, S.; Rezaei, N.; Zendehboudi, S. A comprehensive review on Enhanced Oil Recovery by Water Alternating Gas (WAG) injection. Fuel 2018, 227, 218–246. [Google Scholar] [CrossRef]
  11. Chen, Q.; Gerritsen, M.G.; Kovscek, A.R. Modeling Foam Displacement with the Local-Equilibrium Approximation: Theory and Experimental Verification. SPE J. 2010, 15, 171–183. [Google Scholar] [CrossRef]
  12. Li, S.; Zhang, K.; Jia, N.; Liu, L. Evaluation of four CO2 injection schemes for unlocking oils from low-permeability formations under immiscible conditions. Fuel 2018, 234, 814–823. [Google Scholar] [CrossRef]
  13. Xu, Z.X.; Li, S.Y.; Li, B.F.; Chen, D.Q.; Liu, Z.Y.; Li, Z.M. A review of development methods and EOR technologies for carbonate reservoirs. Pet. Sci. 2020, 17, 990–1013. [Google Scholar] [CrossRef]
  14. Spirov, P.; Rudyk, S.N.; Khan, A.A. Foam assisted WAG, snorre revisit with new foam screening model. In Proceedings of the North Africa Technical Conference and Exhibition, Cairo, Egypt, 20–22 February 2012; Volume 1, pp. 624–641. [Google Scholar] [CrossRef]
  15. Bello, A.; Ivanova, A.; Cheremisin, A. Foam EOR as an Optimisation Technique for Gas EOR: A Comprehensive Review of Laboratory and Field Implementations. Energies 2023, 16, 972. [Google Scholar] [CrossRef]
  16. Yang, W.; Wang, T.; Fan, Z.; Miao, Q.; Deng, Z.; Zhu, Y. Foams Stabilized by in Situ-Modified Nanoparticles and Anionic Surfactants for Enhanced Oil Recovery. Energy Fuels 2017, 31, 4721–4730. [Google Scholar] [CrossRef]
  17. Li, S.; Li, Z.; Wang, P. Experimental Study of the Stabilisation of CO2 Foam by Sodium Dodecyl Sulfate and Hydrophobic Nanoparticles. Ind. Eng. Chem. Res. 2016, 55, 1243–1253. [Google Scholar] [CrossRef]
  18. Karakashev, S.I.; Ozdemir, O.; Hampton, M.A.; Nguyen, A.V. Formation and stability of foams stabilized by fine particles with similar size, contact angle and different shapes. Colloids Surfaces A Physicochem. Eng. Asp. 2011, 382, 132–138. [Google Scholar] [CrossRef]
  19. Yekeen, N.; Manan, M.A.; Idris, A.K.; Padmanabhan, E.; Junin, R.; Samin, A.M.; Gbadamosi, A.O.; Oguamah, I. A comprehensive review of experimental studies of nanoparticles-stabilized foam for enhanced oil recovery. J. Pet. Sci. Eng. 2018, 164, 43–74. [Google Scholar] [CrossRef]
  20. Singh, R.; Mohanty, K.K. Foam flow in a layered, heterogeneous porous medium: A visualisation study. Fuel 2017, 197, 58–69. [Google Scholar] [CrossRef]
  21. Bello, A.; Ozoani, J.; Adebayo, A.; Kuriashov, D. Rheological study of nanoparticle-based cationic surfactant solutions. Petroleum 2022, 8, 522–528. [Google Scholar] [CrossRef]
  22. Son, H.A.; Lee, T. Enhanced Oil Recovery with Size-Dependent Interactions of Nanoparticles Surface-Modified by Zwitterionic Surfactants. Appl. Sci. 2021, 11, 7184. [Google Scholar] [CrossRef]
  23. Maestro, A.; Rio, E.; Drenckhan, W.; Langevin, D.; Salonen, A. Foams stabilised by mixtures of nanoparticles and oppositely charged surfactants: Relationship between bubble shrinkage and foam coarsening. Soft Matter 2014, 10, 6975–6983. [Google Scholar] [CrossRef]
  24. Bello, A.; Ivanova, A.; Cheremisin, A. Application of Nanoparticles in Foam Flooding for Enhanced Oil Recovery and Foam Stability in Carbonate Reservoirs. In Proceedings of the 83rd EAGE Annual Conference & Exhibition, Madrid, Spain, 6–9 June 2022. [Google Scholar] [CrossRef]
  25. Zargartalebi, M.; Kharrat, R.; Barati, N. Enhancement of surfactant flooding performance by the use of silica nanoparticles. Fuel 2015, 143, 21–27. [Google Scholar] [CrossRef]
  26. Arain, Z.U.A.; Al-Anssari, S.; Ali, M.; Memon, S.; Bhatti, M.A.; Lagat, C.; Sarmadivaleh, M. Reversible and irreversible adsorption of bare and hybrid silica nanoparticles onto carbonate surface at reservoir condition. Petroleum 2020, 6, 277–285. [Google Scholar] [CrossRef]
  27. Horozov, T. Foams and foam films stabilised by solid particles. Curr. Opin. Colloid Interface Sci. 2008, 13, 134–140. [Google Scholar] [CrossRef]
  28. Kim, I.; Worthen, A.J.; Johnston, K.P.; DiCarlo, D.A.; Huh, C. Size-dependent properties of silica nanoparticles for Pickering stabilisation of emulsions and foams. J. Nanoparticle Res. 2016, 18, 82. [Google Scholar] [CrossRef]
  29. Kristiansen, T.; Holt, T. Properties of Flowing Foam in Porous Media Containing Oil. In Proceedings of the SPE/DOE Enhanced Oil Recovery Symposium, Tulsa, OK, USA, 22–24 April 1992. [Google Scholar] [CrossRef]
  30. Zitha, P.L.J.; Nguyen, Q.P.; Currie, P.K.; Buijse, M.A. Coupling of Foam Drainage and Viscous Fingering in Porous Media Revealed by X-ray Computed Tomography. Transp. Porous Media 2006, 64, 301–313. [Google Scholar] [CrossRef]
  31. Farajzadeh, R.; Andrianov, A.; Bruining, H.; Zitha, P.L.J. Comparative Study of CO2 and N2 Foams in Porous Media at Low and High Pressure Temperatures. Ind. Eng. Chem. Res. 2009, 48, 6423–6431. [Google Scholar] [CrossRef]
  32. Singh, R.; Mohanty, K.K. Synergistic stabilisation of foams by a mixture of nanoparticles and surfactants. In Proceedings of the SPE Improved Oil Recovery Symposium, Tulsa, OK, USA, 12–16 April 2014; Volume 3, pp. 1379–1391. [Google Scholar]
  33. Sun, Q.; Li, Z.; Li, S.; Jiang, L.; Wang, J.; Wang, P. Utilisation of surfactant-stabilized foam for enhanced oil recovery by adding nanoparticles. Energy Fuels 2014, 28, 2384–2394. [Google Scholar] [CrossRef]
  34. Bello, A.; Ivanova, A.; Cheremisin, A. Enhancing N2 and CO2 foam stability by surfactants and nanoparticles at high temperature and various salinities. J. Pet. Sci. Eng. 2022, 215, 110720. [Google Scholar] [CrossRef]
  35. Zhu, T.; Ogbe, D.O.; Khataniar, S. Improving the foam performance for mobility control and improved sweep efficiency in gas flooding. Ind. Eng. Chem. Res. 2004, 43, 4413–4421. [Google Scholar] [CrossRef]
  36. Farhadi, H.; Riahi, S.; Ayatollahi, S.; Ahmadi, H. Experimental study of nanoparticle-surfactant-stabilized CO2 foam: Stability and mobility control. Chem. Eng. Res. Des. 2016, 111, 449–460. [Google Scholar] [CrossRef]
  37. Yekeen, N.; Idris, A.K.; Manan, M.A.; Samin, A.M.; Risal, A.R.; Kun, T.X. Bulk and bubble-scale experimental studies of influence of nanoparticles on foam stability. Chin. J. Chem. Eng. 2017, 25, 347–357. [Google Scholar] [CrossRef]
  38. Caps, H.; Vandewalle, N.; Broze, G. Foaming dynamics in hele-shaw cells. Phys. Rev. E—Stat. Nonlinear Soft Matter Phys. 2006, 73, 5–8. [Google Scholar] [CrossRef] [Green Version]
  39. Yu, J.; Khalil, M.; Liu, N.; Lee, R. Effect of particle hydrophobicity on CO2 foam generation and foam flow behaviour in porous media. Fuel 2014, 126, 104–108. [Google Scholar] [CrossRef]
  40. Osei-Bonsu, K.; Shokri, N.; Grassia, P. Fundamental investigation of foam flow in a liquid-filled Hele-Shaw cell. J. Colloid Interface Sci. 2016, 462, 288–296. [Google Scholar] [CrossRef] [PubMed]
  41. Tyrode, E.; Pizzino, A.; Rojas, O.J. Foamability and foam stability at high pressures and temperatures. I. Instrument validation. Rev. Sci. Instruments 2003, 74, 2925–2932. [Google Scholar] [CrossRef] [Green Version]
  42. Fu, C.; Liu, N. Rheology and stability of nanoparticle-stabilized CO2 foam under reservoir conditions. J. Pet. Sci. Eng. 2021, 196, 107671. [Google Scholar] [CrossRef]
  43. Stevenson, P. Inter-bubble gas diffusion in liquid foam. Curr. Opin. Colloid Interface Sci. 2010, 15, 374–381. [Google Scholar] [CrossRef]
  44. Koelsch, P.; Motschmann, H. Relating foam lamella stability and surface dilational rheology. Langmuir 2005, 21, 6265–6269. [Google Scholar] [CrossRef]
  45. Ivanova, A.; Cheremisin, A.; Spasennykh, M. Application of Nanoparticles in Chemical EOR. In Proceedings of the 19th European Symposium on Improved Oil Recovery, Stavanger, Norway, 24–27 April 2017. [Google Scholar] [CrossRef]
  46. Georgieva, D.; Cagna, A.; Langevin, D. Link between surface elasticity and foam stability. Soft Matter 2009, 5, 2063–2071. [Google Scholar] [CrossRef]
  47. Salameh, S.; Schneider, J.; Laube, J.; Alessandrini, A.; Facci, P.; Seo, J.W.; Ciacchi, L.C.; Mädler, L. Adhesion mechanisms of the contact interface of TiO 2 nanoparticles in films and aggregates. Langmuir 2012, 28, 11457–11464. [Google Scholar] [CrossRef] [Green Version]
  48. Dehdari, B.; Parsaei, R.; Riazi, M.; Rezaei, N.; Zendehboudi, S. New insight into foam stability enhancement mechanism, using polyvinyl alcohol (PVA) and nanoparticles. J. Mol. Liq. 2020, 307, 112755. [Google Scholar] [CrossRef]
  49. Binks, B.P.; Horozov, T.S. Aqueous foams stabilized solely by silica nanoparticles. Angew. Chem.—Int. Ed. 2005, 44, 3722–3725. [Google Scholar] [CrossRef]
  50. Johnston, K.P.; Shah, P.S. Making Nanoscale Materials with Supercritical Fluids. Science 2004, 303, 482–483. [Google Scholar] [CrossRef] [PubMed]
  51. Cleaves, H.J. Supercritical Fluid. In Encyclopedia of Astrobiology; Springer: Berlin/Heidelberg, Germany, 2011; pp. 1636–1637. [Google Scholar] [CrossRef]
  52. Montalbán, M.G.; Víllora, G. Supercritical Fluids: Properties and Applications. In Phase Equilibria With Supercritical Carbon Dioxide—Application to the Components of a Biocatalytic Process; IntechOpen: London, UK, 2022. [Google Scholar] [CrossRef]
  53. Zeng, Y.; Farajzadeh, R.; Eftekhari, A.A.; Vincent-Bonnieu, S.; Muthuswamy, A.; Rossen, W.R.; Hirasaki, G.J.; Biswal, S.L. Role of gas type on foam transport in porous media. Langmuir 2016, 32, 6239–6245. [Google Scholar] [CrossRef] [PubMed] [Green Version]
  54. Ivanova, A.; Orekhov, A.; Markovic, S.; Iglauer, S.; Grishin, P.; Cheremisin, A. Live imaging of micro and macro wettability variations of carbonate oil reservoirs for enhanced oil recovery and CO2 trapping/storage. Sci. Rep. 2022, 12, 1262. [Google Scholar] [CrossRef] [PubMed]
  55. Szabries, M.; Jaeger, P.; Amro, M.M. Foam Analysis at Elevated Pressures for Enhanced Oil Recovery Applications. Energy Fuels 2018, 33, 3743–3752. [Google Scholar] [CrossRef]
  56. Ghoodjani, E.; Bolouri, S. Experimental Study of CO2-EOR and N2-EOR with Focus on Relative Permeability Effect. J. Pet. Environ. Biotechnol. 2011, 2, 1–5. [Google Scholar] [CrossRef] [Green Version]
  57. Li, L.; Zhang, Y.; Sheng, J.J. Effect of the Injection Pressure on Enhancing Oil Recovery in Shale Cores during the CO2 Huff-n-Puff Process When It Is above and below the Minimum Miscibility Pressure. Energy Fuels 2017, 31, 3856–3867. [Google Scholar] [CrossRef]
  58. Shyeh-Yung, J.G. Mechanisms of Miscible Oil Recovery: Effects of Pressure on Miscible and Near-Miscible Displacements of Oil by Carbon Dioxide. In Proceedings of the SPE Annual Technical Conference and Exhibition, Dallas, TX, USA, 6–9 October 1991. [Google Scholar] [CrossRef]
  59. Song, C.; Yang, D. Performance Evaluation of CO2 Huff-n-puff Processes in Tight Oil Formations. In Proceedings of the SPE Unconventional Resources Conference Canada, Calgary, AB, Canada, 5–7 November 2013. [Google Scholar] [CrossRef]
Figure 1. Chemical structure of Alpha-Olefin Sulfonate (AOS) surfactant.
Energies 16 05120 g001
Figure 2. Image of artificial core sample.
Energies 16 05120 g002
Figure 3. Experimental methodology.
Energies 16 05120 g003
Figure 4. Experimental setup for N 2 and C O 2 foam stability at reservoir conditions.
Energies 16 05120 g004
Figure 5. Experimental setup for core flooding experiment.
Energies 16 05120 g005
Figure 6. Effect of foam quality on foam stability: (a) N 2 foam texture at 50% and 80% foam qualities (T = 26 °C; P = 11.7 MPa); (b) C O 2 foam texture at 50% and 80% foam qualities (T = 40 °C; P = 11.7 MPa).
Energies 16 05120 g006
Figure 7. Effect of nanoparticles on foam stability: (a) Nitrogen foam texture in the presence and absence of nanoparticles (T = 26 °C; P = 11.7 MPa); (b) C O 2 foam texture in the presence and absence of nanoparticles (T = 40 °C; P = 11.7 MPa).
Energies 16 05120 g007
Figure 8. Young–Laplace effect on neighbouring foam bubbles (adapted from Stevenson et al. [43]).
Energies 16 05120 g008
Figure 9. Effect of nanoparticles on foam stability: (a) Nitrogen vapour foam texture in the presence and absence of nanoparticles (T = 26 °C; P = 3 MPa); (b) C O 2 vapour foam texture in the presence and absence of nanoparticles (T = 26 °C; P = 3 MPa).
Energies 16 05120 g009
Figure 10. Core flooding design.
Energies 16 05120 g010
Figure 11. Oil recovery performance during filtration experiment in artificial core sample.
Energies 16 05120 g011
Figure 12. Pressure drop response of displacing agents in the artificial core sample during the filtration experiment: (a) s c C O 2 injection; (b) foam injection.
Energies 16 05120 g012
Figure 13. Oil recovery performance of C O 2 during filtration experiment in a real core sample.
Energies 16 05120 g013
Figure 14. Pressure drop response of s c C O 2 in core model during filtration.
Energies 16 05120 g014
Figure 15. Oil recovery performance during filtration experiment in a real core model with an injection pressure of 8.5 MPa.
Energies 16 05120 g015
Figure 16. Pressure drop response of displacing agents in a real core model during the filtration experiment: (a) s c C O 2 injection; (b) foam injection.
Energies 16 05120 g016
Table 1. Petrophysical properties of core samples used in this study.
Experimental SetCore SampleLength (cm)Diameter (cm)Porosity (%)Absolute Permeability (mD)
Set 1Artificial core7.582.9111.68102.81
Set 2Real core 13.032.9619.200.767
Real core 23.112.9715.670.743
Real core 33.092.9615.530.576
Set 3Real core 42.842.9610.910.359
Real core 53.072.968.250.145
Real core 63.052.968.650.236
Table 2. Characteristics of the reservoir oil models used in this study.
Oil ModelDensity (g/cm 3 )Viscosity (mPa · s)Gas Factor
Oil model A0.9153.1372
Oil model B0.7851.7160
Table 3. The average bubble size of supercritical nitrogen foam in the presence and absence of nanoparticles.
Average Bubble Size, μ mt = 0t = 1 ht = 2 ht = 3 h
S c - N 2 foam25.84145.38368.33594.09
S c - N 2 foam with 0.05% NP15.27937.13159.41373.382
S c - N 2 foam with 0.1% NP23.96243.6458.82775.169
Table 4. The average bubble size of supercritical C O 2 foam in the presence and absence of nanoparticles.
Average Bubble Size, μ mt = 0t = 1 ht = 2 ht = 3 h
S c - C O 2 foam7.68235.50253.60782.374
S c - C O 2 foam with 0.05% NP4.22213.12828.4250.068
S c - C O 2 foam with 0.1% NP5.88121.82244.74672.180
Table 5. Bubble count of supercritical nitrogen foam in the presence and absence of nanoparticles.
Bubble Countt = 0t = 1 ht = 2 ht = 3 h
S c - N 2 foam6825496034933299
S c - N 2 foam with 0.05% NP9182807063925460
S c - N 2 foam with 0.1% NP11,629829967365959
Table 6. Bubble count of supercritical C O 2 foam in the presence and absence of nanoparticles.
Bubble Countt = 0t = 1 ht = 2 ht = 3 h
S c - C O 2 foam11,817870559993932
S c - C O 2 foam with 0.05% NP14,74011,60482934828
S c - C O 2 foam with 0.1% NP14,63613,84812,75112,078
Disclaimer/Publisher’s Note: The statements, opinions and data contained in all publications are solely those of the individual author(s) and contributor(s) and not of MDPI and/or the editor(s). MDPI and/or the editor(s) disclaim responsibility for any injury to people or property resulting from any ideas, methods, instructions or products referred to in the content.

