Article

Crude Oil Pyrolysis Studies: Application to In Situ Superheat Steam Enhanced Oil Recovery

1
Sandia National Laboratories, Albuquerque, NM 87123, USA
2
Energy Analyst LLC, Albuquerque, NM 87123, USA
3
Department of Mechanical Engineering, Howard University, Washington, DC 20059, USA
*
Authors to whom correspondence should be addressed.
Energies 2023, 16(3), 1544; https://doi.org/10.3390/en16031544
Submission received: 22 December 2022 / Revised: 21 January 2023 / Accepted: 24 January 2023 / Published: 3 February 2023
(This article belongs to the Special Issue Enhanced Hydrocarbon Recovery)

Abstract

:
This work focuses on the occurrence and composition of flammable pyrolysis gases which can be expected from stimulation of heavy oil with superheat steam. These gases can have commodity value or be used to fire a conventional boiler to generate steam vapor for superheater feed. Seven oil samples taken from different US locations were tested via thermogravimetric analysis (TGA) with off-gas analysis of light hydrocarbons via mass spectrometry (MS). The samples were heated up to 500 °C at 5 °C/min in a gas flow of moist carbon dioxide and held at 500 °C until no further mass loss was noted. Then, carbonaceous residue was exposed to air at 500 °C to determine enthalpy of combustion by differential scanning calorimetry (DSC). To demonstrate that pyrolysis was indeed occurring and not simple de-volatilization, a high-molecular-weight reagent-grade organic molecule, lactose, was first demonstrated to produce components of interest. After treatment under moist CO2 at 500 °C, all samples were found to lose around 90% of mass, and the follow-up combustion process with air further reduced the residual mass to between 2% and 12%, which is presumed to be mineral matter and char. The light hydrocarbons methane, ethane, and propane, as well as hydrogen, were detected through MS during pyrolysis of each oil sample. Heavier hydrocarbons were not monitored but are assumed to have evolved, especially during periods where additional mass loss was occurring in the isothermal process, with minimal light hydrocarbon evolution. These results correspond to a possible concept of subsequent in situ combustion drive with or without heat scavenging following high-temperature pyrolysis from in situ superheat steam injection.

1. Introduction

Superheated steam occurs when steam is heated to a temperature higher than that required for saturation at a given pressure; it can therefore give up some of its heat without returning to liquid water. Due to elevated temperature, stimulation of heavy oil zones by superheated steam has the capability of pyrolyzing oil in situ and leads to improved recovery by multiple mechanisms. Heated oil mobility is improved; the lighter hydrocarbon fractions that are produced will be solubilized in cold oil ahead of the thermal front, and some of the pyrolysis products will reach production wells where they can be produced and used as fuel for the boiler. Figure 1 shows a simplified diagram of a superheat-steam EOR operation. The boiler can be configured to feed saturated steam vapor to multiple wells, depending on proximity. The transfer line for water vapor from the boiler to the direct contact superheater is insulated to minimize energy losses, as is the injection tubing. The feed into the injection well is a mixture of superheated steam, carbon dioxide, and nitrogen (if air is used for oxidation) in a direct contact superheater. It is well recognized that high viscosity is an impediment to the production of heavy oil, and viscosity is inversely proportional to temperature. Additionally, superheat steam stimulation has been observed to improve formation permeability.
More recently, there has been increased interest in superheated steam for enhanced oil recovery (EOR). For example, superheated steam stimulation in a high-water-cut heavy oil reservoir pilot test showed average daily oil production 2–4 times higher than that of traditional saturated steam stimulation [1]. From simulation models discussed in [2,3], it was concluded that the heating radius, distillation effect, and oil production with superheated steam are greater than those of saturated steam, while the volume in need of superheated steam is less than that of saturated steam. In [4], it was reported that superheated steam increased the average daily oil production 2–4 times compared to saturated steam in Kazakhstan’s heavy oil reservoir. Pilot tests of cyclic steam stimulation (CSS) with superheated steam exhibited better performance compared with wet steam: the average oil rate increased by 62%, the cyclic production time increased by 90 days, the average water cut was reduced by more than 10%, and the cyclic steam–oil ratio (SOR) was reduced by 27.3% [5]. Another advantage of superheat steam stimulation in shallow heavy oil formations where slim hole completion is implemented is the reduced convective heat loss in delivery tubing compared with saturated steam [6]. The formation permeability with superheated steam has been shown to be increased up to four-fold in formations with damaged porous media, and up to six-fold in formations with un-damaged media, compared with saturated steam [7].
In the late 1970s, a field operation showed rather dramatic benefits of superheated steam in shallow US mid-continent oils, where conventional steaming had shown poor results [8]. More recently, in an adjacent field, a strategy as illustrated in Figure 1 was implemented using a proprietary design superheater. It was satisfactorily operated for several months in the Missouri site (Grassy Creek) in a proof-of-concept test. Injection temperature and pressure were 430 °C and 300 psi, and flammable gases were observed at surrounding production wells. In this field, the oil was “dead” and contained no solution gas. For this pilot demonstration, the superheater and boiler fuels were natural gas, and the direct contact superheater oxidizer was air. Previous attempts at commercial production with low-pressure saturated steam in this field did not achieve economic success due to the high viscosity (~3500 cp) of this oil and the low steam temperature associated with shallow depth and injection pressure limit. Based on the encouraging results of this test, it was desired to determine the temperature at which pyrolysis occurs and the composition of produced gases which might be of benefit. This need is the objective of the study reported here.
In order to develop the process of thermal recovery of heavy oil through superheated steam stimulation, thermal analysis of heavy oil samples via thermogravimetric analysis with differential scanning calorimetry (TGA/DSC) was carried out with concurrent off-gas analysis by mass spectrometry (MS) to determine the principal volatile components and the temperatures at which they were released. The heating value of residue chars was estimated via controlled oxidation in a calorimeter. To best simulate the environment of an underground oil reservoir, thermal analysis was conducted under an atmosphere of flowing humid carbon dioxide until all volatiles had been released at 500 °C. At that point, controlled oxidation was initiated with dry air.
To confirm that methane and hydrogen can be produced by heating a high-molecular-weight hydrocarbon in the presence of carbon dioxide, chemical equilibrium calculations were performed with the NASA chemical equilibrium code (CEA) [9]. Calculations indicate that when n-octane in the presence of humid carbon dioxide was heated to temperature above 400 °C, both hydrogen and methane appear in equilibrium products.
Since a direct contact superheater utilizing air as oxidizer will include both carbon dioxide and nitrogen with water vapor, a subsequent test series investigated the use of inert argon as the carrier gas during pyrolysis of heavy hydrocarbons. A comparison of pyrolysis products indicated there is negligible difference with moist carbon dioxide. Therefore, it is concluded that carbon dioxide with nitrogen comingled with superheated steam will not skew results.
While various literature sources presented studies of crude oil pyrolysis, the speed of reaction was not investigated here. The similarity or differences of results for a range of oils was the primary interest, which indicated that superheated steam can crack oils into lighter fractions.

2. Experimental Details

Five samples of heavy oil (API 14°–16°) were obtained from California and Missouri, and two light oil (API 35°) samples were obtained; one was from the strategic petroleum reserve (SPR) and one was from the Bakkens field. Samples were provided in sealed 20mL glass vials; they were used as received. D-Lactose monohydrate (A.C.S. reagent grade) was acquired from Sigma Aldrich and used as-received.

2.1. Thermogravimetric Analysis and Differential Scanning Calorimetry

Thermal analysis was conducted using a Netzsch STA 409 CD instrument using simultaneous TGA and DSC. Off-gas analysis was achieved using a Hiden HPR-20 mass spectrometer which monitored the gas exiting the TGA/DSC furnace via a 2 m long heated capillary inlet. Specimens for TGA/DSC-MS weighed approximately 80 mg and were placed in platinum crucibles that were heated at 5 °C min−e from ambient to 500 °C under flowing humid carbon dioxide. The carbon dioxide was humidified by passing it through a sparger submerged in deionized water at room temperature. The gas flow rate was maintained at nominally 100 sccm (standard cubic centimeters per minute). Once at 500 °C, the samples were subjected to a 60-minute isotherm, before switching the gas stream to dry air (100 sccm) for an additional 75 min. Due to the high sensitivity of the DSC signal to changes in ramp rate, the data recorded at the beginning of each pyrolysis run, i.e., the steeply rising signal below approx. 50 °C, should be ignored. All experiments were conducted at ambient atmospheric pressure, which in Albuquerque is typically ~ 635 Torr.

2.2. Mass Spectrometry

Ions, or ionic fragments characteristic of the following molecules were monitored via MS throughout each TGA/DSC scan: hydrogen, methane, ethane, propane, benzene. Heavier hydrocarbons are not readily detected in this system due to the long transfer path between the sample and the MS detector and the existence of cold spots in the transfer path which tend to condense out heavier species and are therefore not presented here. It should be noted that the interpretation of the MS results is complicated by the overlapping of molecular fragments from some of the species expected to be present. As an example, atomic mass unit (amu) 28 can arise from any or all of the following species that could be present: nitrogen, carbon monoxide, carbon dioxide, ethane, ethylene, propane, or numerous higher hydrocarbons. Table 1 lists the major fragmentation products of some of the chemical compounds expected in the gas phase during pyrolysis, illustrating the complexity of interpretation.
Future work on this project will attempt a clearer speciation of the species present through the application of other techniques such as gas chromatography and infrared spectroscopy.
MS signals from water, carbon dioxide, nitrogen, and oxygen were ignored since those species were present in excess due to the flowing gas environments chosen for the tests. In the results that follow, the signal for benzene is omitted since no significant changes from baseline were observed during any of the runs. In a separate test comparing pyrolysis under humid carbon dioxide versus pyrolysis under dry inert gas (argon), only minor differences in TGA, DSC, and MS observations were noticed. Since humid carbon dioxide would be expected in superheat steam stimulation with a direct contact superheater, the measurements in this study were conducted with humid carbon dioxide purge gas during the pyrolysis stage.
It is noted that the MS includes an ionizing, preconditioning chamber which appears to result in prompt hydrogen production in many cases. This is attributed to a breakdown of either hydrocarbons or water and is not a result of pyrolysis, which is typically presumed to begin above 300 °C. Additionally, early production of light hydrocarbons can be presumed to be caused by sample de-volatization, particularly for the lighter oil samples. Hence, for the MS results at temperature below 300 °C, those are not attributed to pyrolysis. A dashed line is shown at 300 °C to indicate that pyrolysis is not expected until temperature exceeds this value.

3. Results

3.1. Pyrolysis under Moist Carbon Dioxide

Each sample result is presented in its own figure in the following section. There are two plots in each figure: TGA/DSC (top), and associated MS data (bottom), recorded simultaneously with the TGA/DSC data. In order to simplify the MS plots, only the molecules, or molecular fragments, of interest are plotted as semi-quantitative concentration versus time. These figures show only the initial temperature ramp portions of each test since the majority of decomposition and off-gas were detected there; the subsequent oxidative decomposition of residue is presented in the following section.
Lactose, Figure 2A, showed two endothermic reaction steps below 250 °C. The first of these at 150 °C is consistent with loss of water of crystallization [10] (3.5 mass-%) and was accompanied by a peak for hydrogen in the MS (from fragmentation of the evolved water in the MS ionizing prechamber). The second major endothermic peak (200–235 °C) is assigned to a combination of melting (lit.: 202.8 °C) and decomposition [9]. The major mass loss step between 230 and 320 °C did not include significant net enthalpic contribution. Hydrocarbon evolution, principally methane, was detected between 275 and 500 °C, indicating that pyrolysis is occurring in that temperature range.
The strategic petroleum reserve (SPR) sample with an American Petroleum Institute gravity (API gravity) of approximately 35°, Figure 2B, showed a gradual mass loss, and relatively featureless DSC signal between ambient temperature and 400 °C, suggesting a gradual evaporation of sample. A slight acceleration in mass loss rate above 425 °C was accompanied by a slight reduction in endothermicity, and release of hydrocarbons. The MS peaks for ethane and propane correspond temporally with the DSC peak (470 °C), while the hydrogen and methane peaks are slightly delayed (500 °C). Hydrocarbons (principally ethane) were detected as low as 75 °C, indicative of a small quantity of dissolved gases in the SPR sample.
It can be noticed that the DSC signal did not return to zero by the end of the pyrolysis ramp, even though the sample mass had plateaued. This is attributed to a change in the heat capacity of the residue relative to the starting oil sample. This phenomenon can be observed for several samples in this series of tests. Furthermore, the DSC signals do approach zero after the oxidation step when the residue has been burnt off, leaving only small quantities of ash.
Figure 2C shows the data for Bakken oil (API gravity ~35°), which gradually lost mass during most of the temperature ramp. Hydrogen and small quantities of light hydrocarbons were detected around 100 °C, presumably due to the hydrocarbons dissolved in the as-received oil. The mass of the sample plateaued around 450 °C, but the absence of hydrocarbon evolution peaks in the MS indicates the absence of pyrolysis. The mass loss is therefore attributed to gradual evaporation of the oil. Again, hydrogen production is presumed to be a consequence of the ionizing prechamber and the probable source of hydrogen is probably ethane, since the bond energy of C-H bonds is lower than O=H bonds.
The sample from Monterey Well 16-31 (API gravity ~14°) is shown in Figure 2D. It has a similar appearance to the SPR sample shown in Figure 2B. In contrast to the SPR sample, the low-temperature evolution of hydrocarbons from the Monterey Well sample is relatively low compared to the high-temperature evolution. The DSC signal remained endothermic during the gradual mass loss, indicative of evaporation. The rather noisy-looking DSC signal between 400 and 500 °C is probably a consequence of the evolution and/or decomposition of many different chemical species in the same temperature range. The hydrocarbon signatures in the MS plot suggest pyrolysis occurred above 400 °C, and the mass loss rate increased beginning at 410 °C.
The sample from Diatomite Well 1312 (API gravity ~14°), Figure 3A, behaved similarly to the Monterey Well sample shown in Figure 2D with the exception that a slightly larger proportion of hydrocarbons were evolved at lower temperature for the Diatomite sample compared to the Monterey sample, accompanied by a slightly more pronounced endotherm in the DSC below 100 °C. The accelerated rate of mass loss associated with high-temperature pyrolysis began at 400 °C, slightly lower than the Monterey Well sample.
The TGA trace for the Orcutt sample (Zones S2–S6, API gravity ~14°) in Figure 3B shows a mass loss step between 115 and 130 °C which is accompanied by two sharp endothermic bands, presumably due to de-solvation and/or evaporation of low-boiling components. Note that the intensity of the endotherm was sufficient to cool the sample despite the applied heat ramp—hence the apparent “knee” in the TGA curve near 115 °C. Evolution of hydrocarbons began during the first mass loss step, and the MS signals remained above their starting (baseline) levels throughout the gradual mass loss up to 390 °C. The hydrocarbon signals then peaked during the second mass loss step between 390 and 500 °C. The DSC curve shows a subtle but increasingly endothermic trend between 150 and 500 °C, consistent with the gradual increase in mass loss rate due to evaporation over the same temperature range.
Figure 3C shows data for the Orcutt zone S1B sample (API gravity ~14°) which was a mixture of oil–water emulsion with water as the dominant component. The specimen analyzed was taken from the oily portion of the sample. While the TGA/DSC data look very similar to those of Orcutt zones S2–S6 in Figure 3B, one notable difference between these two samples is the hydrogen evolution during the low temperature mass loss step, which was lower for Orcutt zone S1B than zones S2–S6. The light hydrocarbons monitored by MS did not rise above the baseline until above 350 °C; the gradual mass loss between 150 and 400 °C is therefore presumed to be due to loss of heavier hydrocarbons.
The Grassy Creek #1 sample (API gravity ~16°) shown in Figure 3D exhibited a gradual mass loss from ca. 150 to 440 °C, and an accelerated rate between 440 and 480 °C. Propane and ethane signals peaked at 480 °C, while methane and hydrogen reached their maxima only at 500 °C. The lack of pyrolysis products below 400 °C may be an explanation as to why conventional saturated steam injection had little beneficial effect on oil production. The endothermic envelope seen in the DSC ended sharply around 450 °C, coinciding with the accelerated mass loss. It can be speculated that this oil is a “dead oil” in the sense that there are no dissolved light hydrocarbons. Hence, in addition to heating the formation, it is suggested that gas injection of CO2 and N2 will provide a necessary function in transporting mobilized oil to the production well during steam drive stimulation. These data also support the contention that for shallow, heavy oil zones, superheated steam is necessary in order to raise formation temperatures sufficiently for oil mobilization, where high pressure and attendant high temperature are not possible with two-phase steam injection.
Most samples showed a gradual loss in mass up to ca. 400 °C, followed by a more rapid rate of loss up to 480 °C and leveling off of the mass by 500 °C. Bakken was the only sample that did not show evidence of pyrolysis at high temperature. All oil samples except Orcutt S1B and Grassy Creek #1 showed release of light hydrocarbons below 200 °C. This low temperature gas evolution is attributed to the release of gases that had been dissolved into the oil. The two Orcutt samples showed a marked mass loss step centered around 120 °C that was not seen in the other oils. All pyrolysis reactions were endothermic, as shown via DSC. Apart from lactose and the two Orcutt specimens, the DSC traces were rather featureless. For lactose, the DSC peaks corresponded to loss of hydration, and melting/decomposition, while for Orcutt, the endotherms are assumed to result from de-solvation and/or evaporation of low-boiling hydrocarbon components. All DSC signals, apart from that for the sample of strategic petroleum reserve, ended close to zero once the sample reached 500 °C.
In looking at Table 2, some interesting observations can be made. As previously mentioned, the Bakkens sample evaporated before pyrolysis temperatures were reached at normal ambient pressure. It can also be observed that pyrolysis occurs at temperatures of 450 F-500 F. Further, it can be observed that the yield of ethane typically exceeds that of methane. However, all samples showed a significant yield of hydrogen. There does not appear to be a strong correlation of yield with API gravity, except that the lighter oils, e.g., Bakkens, may totally evaporate before pyrolysis conditions are reached at local ambient pressure.
Although the SPR sample had approximately the same API gravity as Bakkens, it obviously contained some heavier component which did not evaporate before pyrolysis conditions were reached. Nevertheless, approximately 50% of the mass was lost from the SPR sample before a temperature of 400 °C was reached, indicating that it does contain significant volatile fractions. It is also interesting to note that the Grassy Creek sample yielded the highest quantity of the measured gases, but at a slightly elevated temperature.

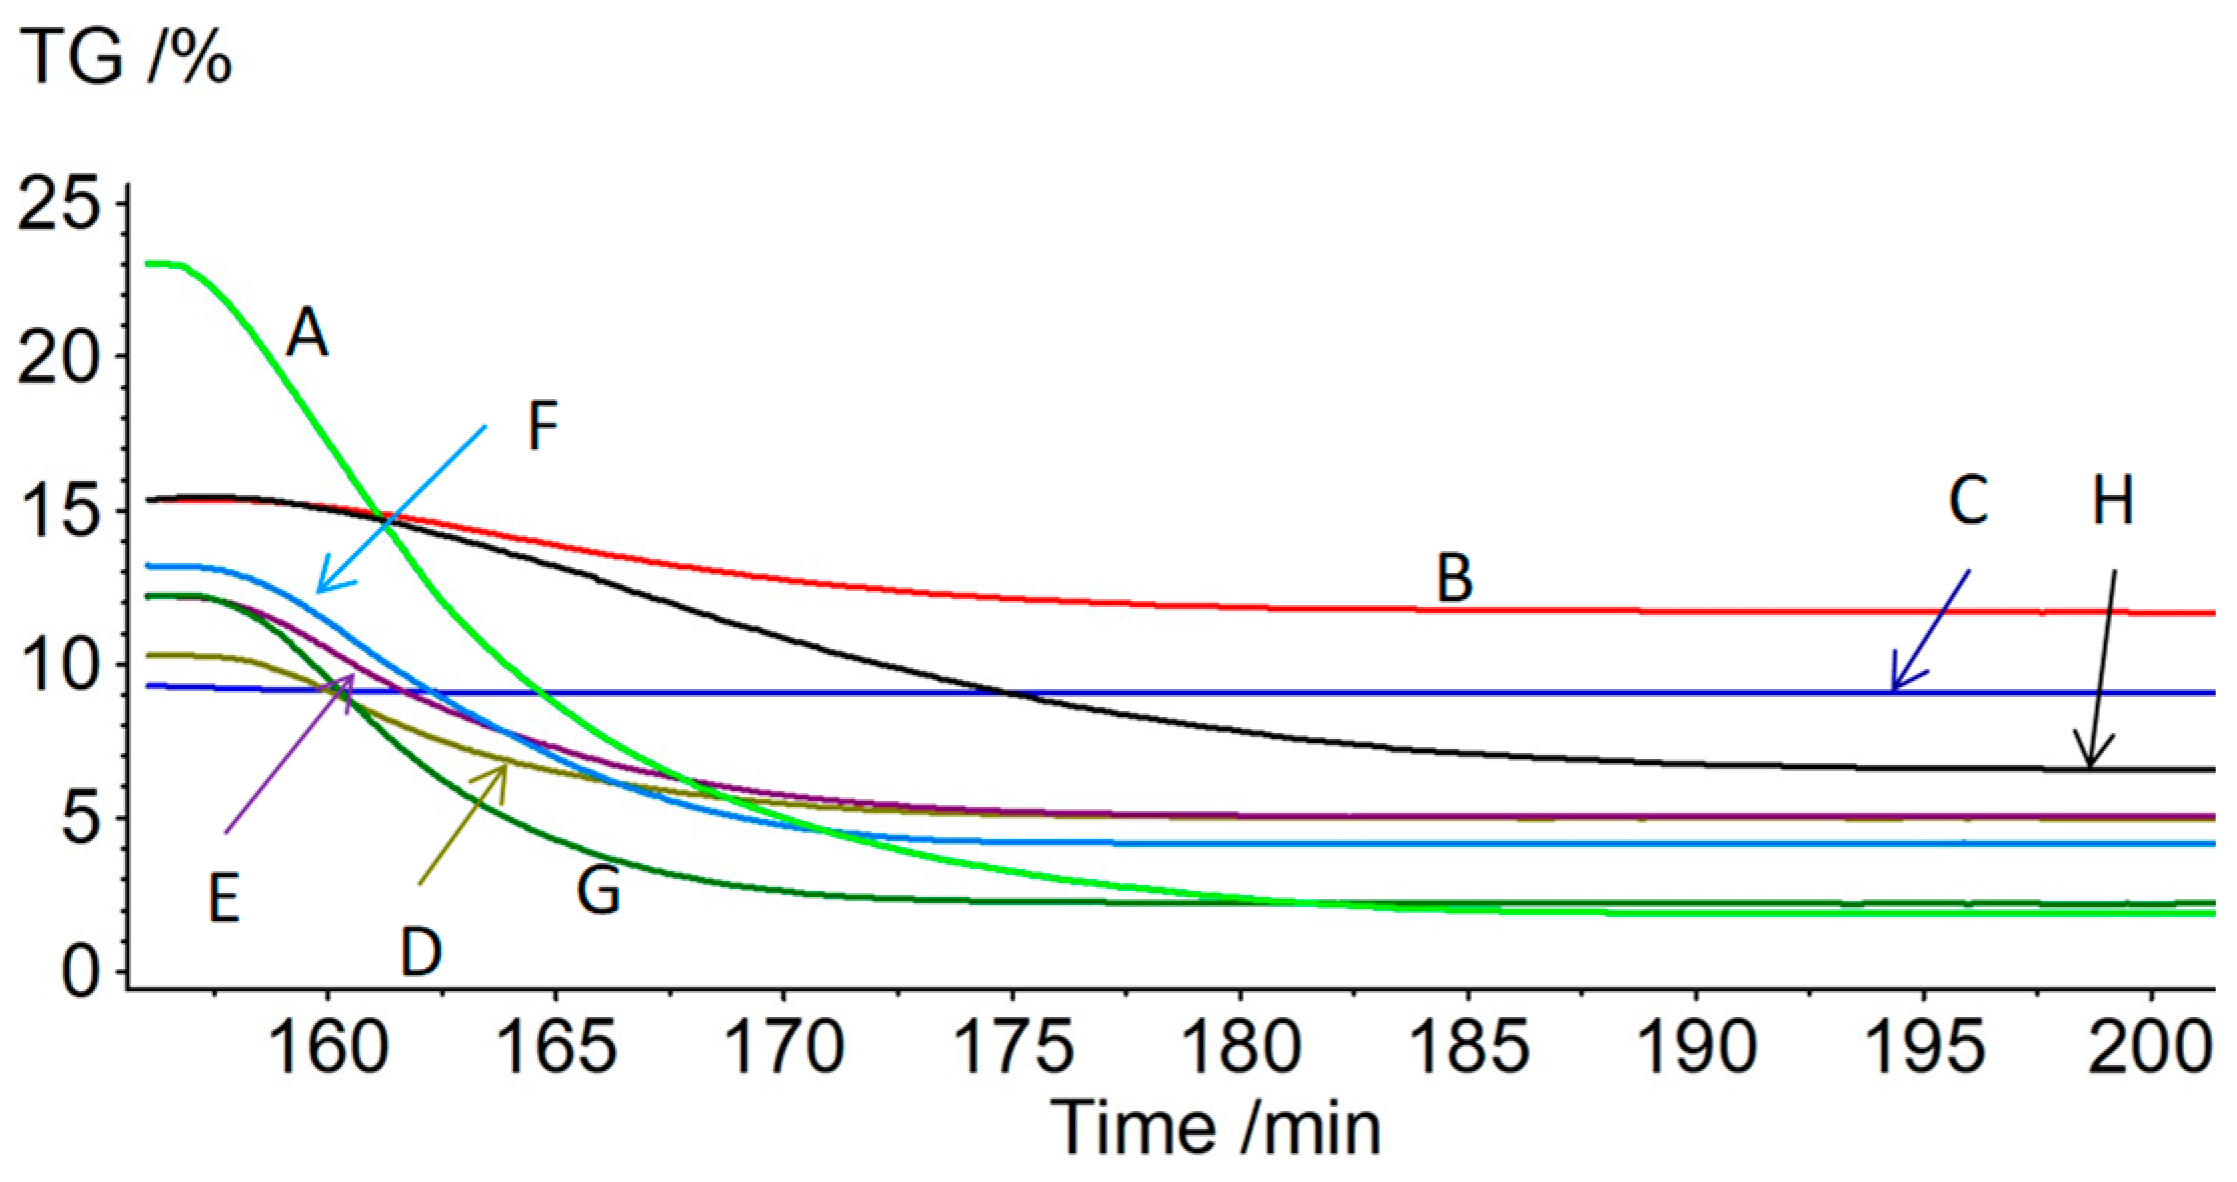
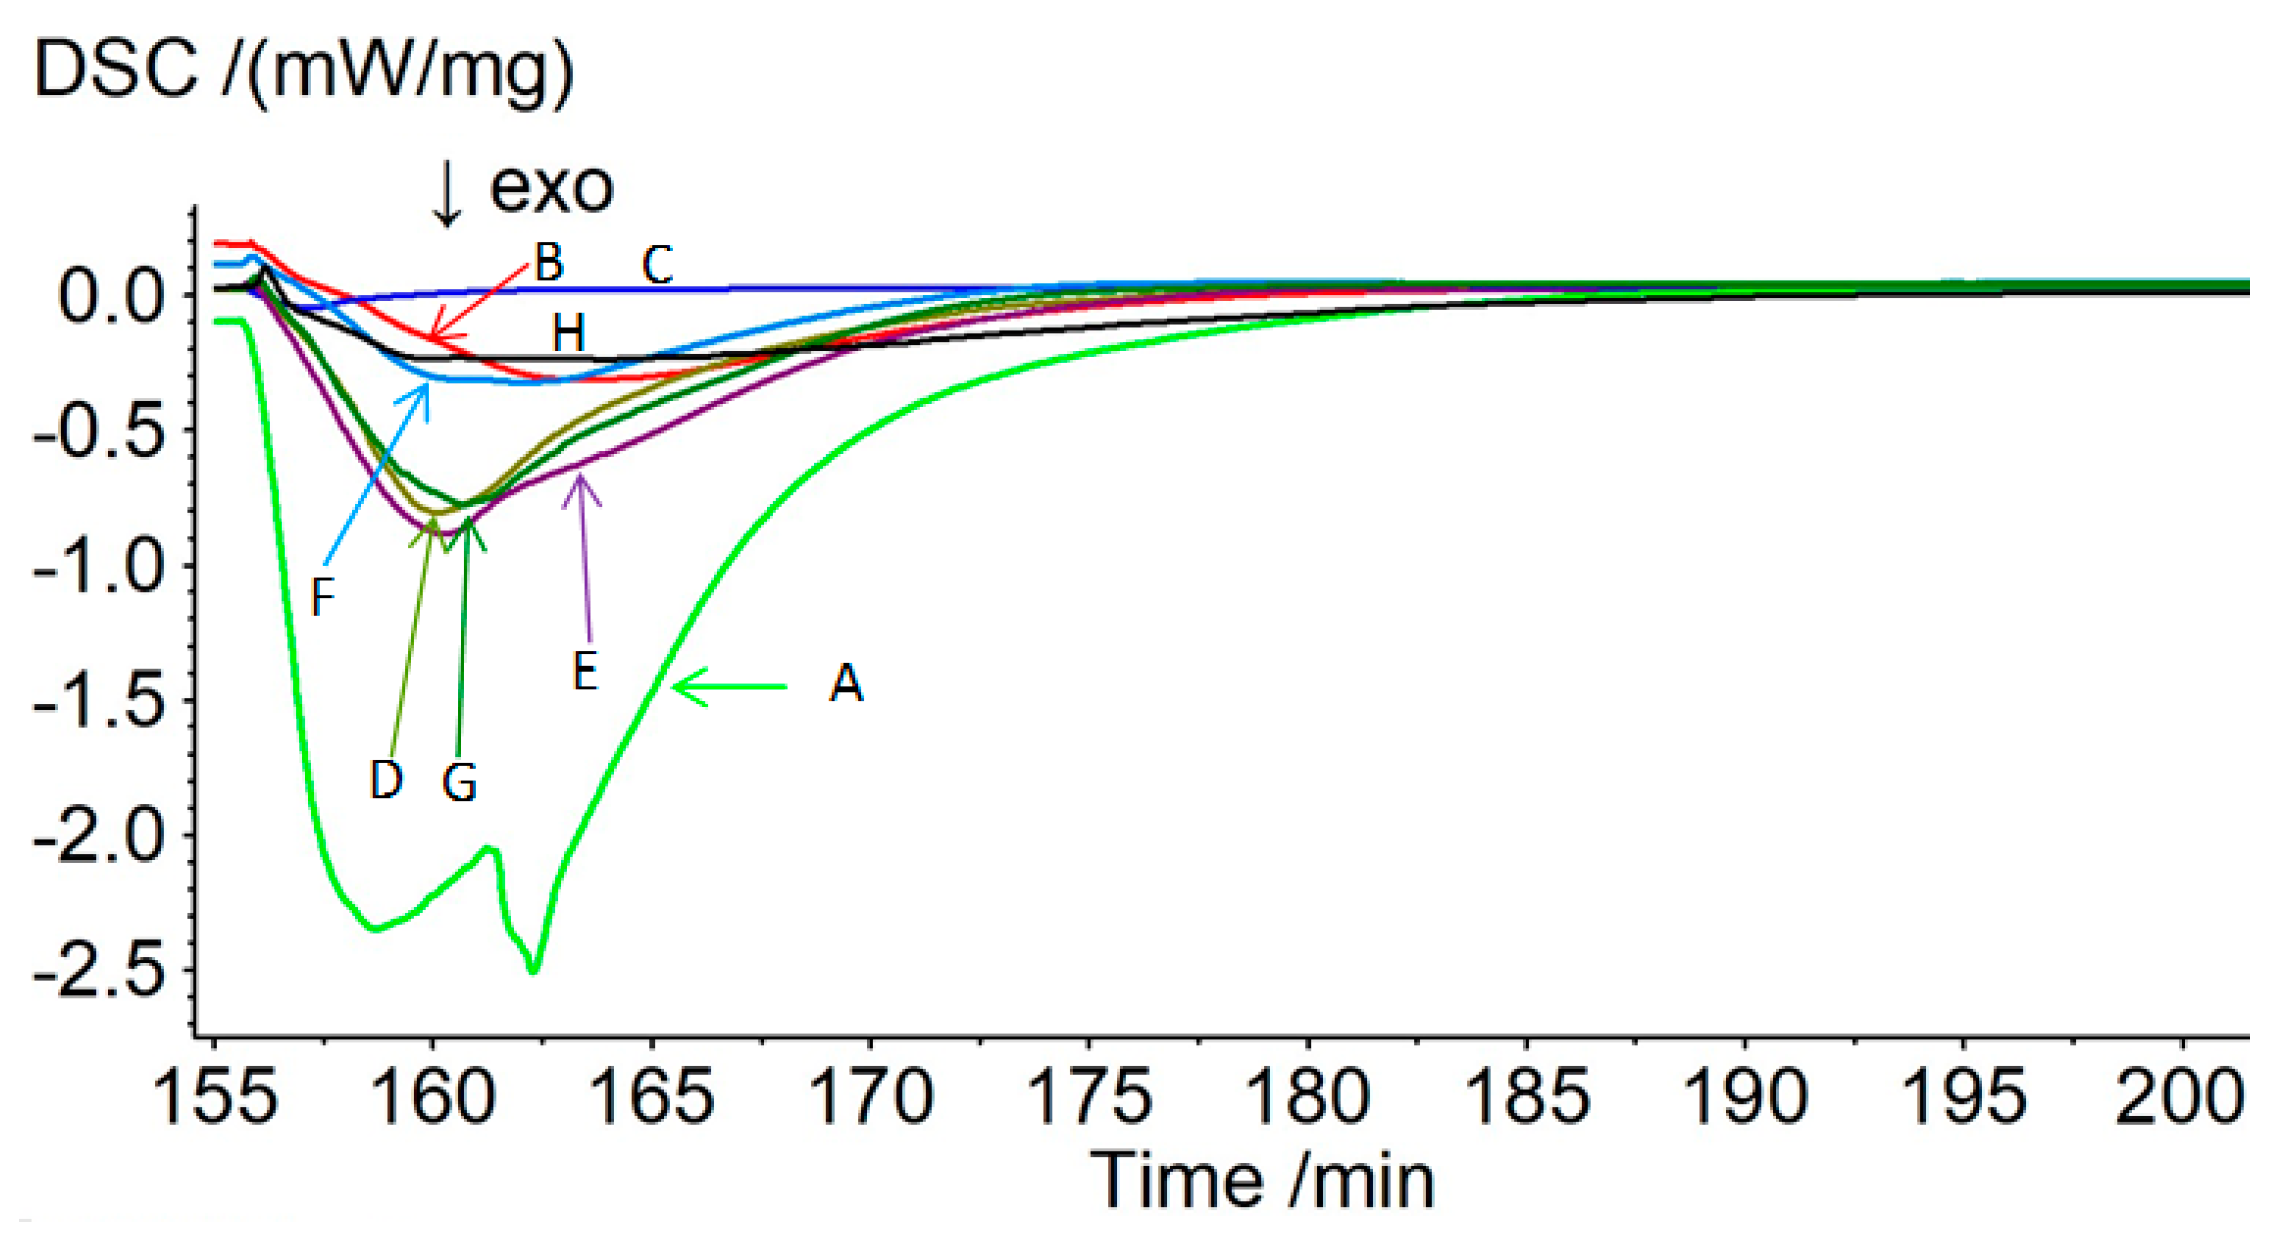
3.2. Oxidation of Residual Char Post-Pyrolysis

As a possible secondary recover method, a combustion drive may be considered, following formation stimulation by superheat steam. To that end, the heating value of the residual hydrocarbons may be of interest. Hence, Figure 4 and Figure 5 show the TGA and DSC data, respectively, for all samples during air oxidation after the pyrolysis step discussed above. A summary of the mass loss data and DSC exotherm intensity is given in Table 3.
The Bakken oil residue showed negligible mass loss and concomitant small exotherm upon oxidation at 500 °C. The SPR residue contained the largest fraction of non-combustible (at 500 °C) material and showed the longest time to reach peak energy output according to DSC. Lactose, being a high-purity chemical reagent sourced from a reputable supplier, is not expected to have an appreciable ash content. The residual 1.8% mass after oxidation is assumed to be high-molecular-weight hydrocarbons or poly-aromatics that formed during pyrolysis under moist carbon dioxide. Such organic species may require oxidation temperatures in excess of 500 °C to burn off completely. Similar high-temperature stable organics may also be present in the residues of the pyrolyzed oil samples, although it is also expected that inorganic residues will occur in these samples. The DSC signals recorded for Monterey, Diatomite, and Orcutt zone S1B were all similar in magnitude and peak shape. The lactose and Grassy Creek samples took the longest time to burn, as evidenced by their tails in both TGA and DSC plots.
The integrated peak areas from Figure 5 are included in Table 3 as enthalpies of oxidation. Two values are given, one based on the mass of the sample at the beginning of the experiment (before pyrolysis) and one based on the mass of material combusted during the oxidation step.

4. Discussions

In reviewing these results, it can be seen that off-gassing of hydrocarbons can begin at temperatures lower than 150 °C, particularly for the higher gravity or light oils, and this is not considered to be pyrolysis. However, for lower gravity or heavy oils, significant pyrolysis does not take place until above 400 °C. At a temperature of 500 °C, mass loss for all samples stabilizes at around 85–90% after introduction of air, and the residue is ash and carbonaceous material (presumably coke) with appreciable heating value. If there is evidence that coke formation is occurring, a periodic injection of air should cause the coke to combust and contribute to the thermal stimulation. While this heating value is markedly lower than the standard lower heating value of carbon (e.g., graphite, LHV = 33,000 Jg−1), it should be remembered that the DSC technique is not a closed system measurement, and a proportion of the evolved thermal energy is “lost” as the hot gaseous reaction products leave the sample. The standard approach for quantifying the calorific value of a fuel, i.e., a bomb calorimeter, is a closed system where all combustion products are retained, and the total energy output can be determined.
These experiments show that simpler hydrocarbons are produced from the pyrolysis of complex organic molecules. These simpler hydrocarbons support the contention that superheat can be beneficially used for the stimulation of heavy oil production, and while not established, it is reasonable to speculate that because of the apparent hydrogen production and high temperature, the beneficial effect of hydrovisbreaking [11] and hydrogenolysis of the heteroatoms and unsaturates that are formed during pyrolysis may occur with superheat steam injection where pressures will be much higher than the ambient pressure under which the experiments discussed here were conducted.
While shallow heavy oil formations will not support high-pressure injection with the corresponding limited saturated steam temperature, the application of superheated steam is not restricted so that injection temperature is no longer constrained by pressure limits. For deep formations, with higher injection pressure and higher corresponding saturated steam temperature, those temperatures may be sufficient to achieve some modest level of pyrolysis (depending on the oil) in addition to the well-known benefit of viscosity reduction. Hence, most successful conventional steam injection projects involve deeper formations (>500 ft.) where saturated steam temperature can be 250 °C or higher. If the formation depth is near the traditional limit for injection of saturated steam from the surface (~2500 ft.) with an injection pressure limit below 2500 psi, then a saturated steam temperature at this pressure is only around 350 °C, so only a limited amount of oil pyrolysis products might be expected, again depending on the oil. Hence, to the extent that pyrolysis may play a role in conventional steam operations (saturated steam), the effect will be minimal. Again, superheat steam stimulation is not subject to the constraint of the link between pressure and temperature which exists for saturated, or wet steam.

5. Conclusions

The results presented here show that heavy oil will pyrolyze at temperatures above 400 °C and that hydrogen and simpler hydrocarbons are produced. While these results do not necessarily indicate behavior in actual field operations, operating experience has confirmed the production of flammable gases with superheat steam injection. The characteristics of the residual oils following superheated steam stimulation will need to be determined, as well as composition of produced gases. It can be speculated that if the hydrogen economy is realized, this suggested stimulation may be a viable method for producing hydrogen, since semi-permeable membranes already exist for separating hydrogen from a gaseous stream [12].

Author Contributions

Writing—original draft preparation, E.N.C., B.D., B.H. and N.Y.; writing—review and editing, E.N.C., B.D., B.H. and N.Y. All authors have read and agreed to the published version of the manuscript.

Funding

This research received no external funding.

Institutional Review Board Statement

Not applicable.

Informed Consent Statement

Not applicable.

Data Availability Statement

Not applicable.

Acknowledgments

This paper describes objective technical results and analysis. Any subjective views or opinions that might be expressed in the paper do not necessarily represent the views of the U.S. Department of Energy or the United States Government. Sandia National Laboratories is a multi-mission laboratory managed and operated by National Technology and Engineering Solutions of Sandia, LLC, a wholly owned subsidiary of Honeywell International, Inc., for the U.S. Department of Energy’s National Nuclear Security Administration under contract DE-NA0003525. This project was supported by the New Mexico Small Business Assistance Program.

Conflicts of Interest

The authors declare no conflict of interest.

References

  1. Xu, A.Z.; Mu, L.X.; Wu, X.H.; Fan, Z.F.; Zhao, L. Superiority of Superheated Steam Flooding in Development of High Water-cut Heavy Oil Reservoir. Adv. Mater. Res. 2013, 616–618, 992–995. [Google Scholar] [CrossRef]
  2. Zheng, Q.; Liu, H.Q.; Pang, Z.X.; Li, F. A Study on Effect Evaluating and Parameters Sensitivity Analyzing of Superheated Steam Soak in Heavy Oil Reservoirs. Adv. Mater. Res. 2011, 239–242, 3069–3073. [Google Scholar] [CrossRef]
  3. Xu, A.; Mu, L.; Fan, Z.; Wu, X.; Zhao, L.; Bo, B.; Xu, T. Mechanism of Heavy Oil Recovery by Cyclic Superheated Steam Stimulation. J. Pet. Sci. Eng. 2013, 111, 197–207. [Google Scholar] [CrossRef]
  4. Xu, A.; Fan, Z.; Zhao, L.; Xue, X.; Wang, C. Significant Superiorities of Superheated Steam in Heavy Oil Thermal Recovery. Adv. Pet. Explor. Dev. 2012, 4, 46–51. [Google Scholar]
  5. Wu, Y.; Ma, D.; Liu, S. EOR of Superheated Steam Injection in Shallow Heavy Oil Reservoir: A Case Study. In Proceedings of the International Oil and Gas Conference, Beijing, China, 8–10 June 2010. [Google Scholar]
  6. Zhao, X.; Gao, P.; Wu, Y. Superheated Steam Injection in North Кенкияк Shallow Heavy Oil Reservoir. J. Geol. Min. Res. 2013, 5, 136–146. [Google Scholar] [CrossRef]
  7. Zhou, T.Y. Improvement of Porous Medium Permeability by Injecting Overheated Steam. Adv. Mater. Res. 2013, 668, 279–282. [Google Scholar] [CrossRef]
  8. John, S.; Sperry, F.S.; Robert, Y., Jr.; Poston, S. Field Testing of the Vapor Therm™ Process in the Eastburn (Cherokee) Field Vernon Co., Missouri. In Proceedings of the Fifth Annual Department of Energy Symposium on Enhanced Oil and Gas Recovery and Improved Drilling Technology, Tulsa, OK, USA, 22–24 August 1979; Linville, B., Ed.; Bartlesville Energy Technology Center, Carmel Energy, Inc.: Bartlesville, OK, USA, 1979; Volume 2, pp. H1/1–H1/16. [Google Scholar]
  9. NASA CEA. Available online: https://cearun.grc.nasa.gov/ (accessed on 20 December 2022).
  10. Listiohadi, Y.; Hourigan, J.; Sleigh, R.; Steele, R. Thermal Analysis of Amorphous Lactose and α-Lactose Monohydrate. Dairy Sci. Technol. 2009, 89, 43–67. [Google Scholar] [CrossRef]
  11. Manapov, E.; Ishkil’din, A.; Akhmetov, A. Hydrovisbreaking Petroleum Resids. Chem. Technol. Fuels Oils 1997, 33, 251–253. [Google Scholar] [CrossRef]
  12. Chiesa, P.; Romano, M.C.; Kreutz, T.G. Use of Membranes in Systems for Electric Energy and Hydrogen Production from Fossil Fuels. In Handbook of Membrane Reactors; Woodhead Publishing: Sawston, UK, 2013; Volume 2, pp. 416–455. [Google Scholar]
Figure 1. Simplified process diagram for EOR using superheated steam stimulation.
Energies 16 01544 g001
Figure 2. Pyrolysis of samples under humid carbon dioxide. Data for lactose (A), strategic petroleum reserve (B), Bakken (C), and Monterey Well 16-31 (D). Each panel contains TGA/DSC data (upper) and MS data (lower). Exothermic peaks in the DSC appear as negative peaks. The dashed vertical line at 300 °C is to illustrate that pyrolysis is not expected below this temperature so the indicated compositions are from a different source.
Energies 16 01544 g002
Figure 3. Pyrolysis of samples under moist carbon dioxide. Data for Diatomite Well 1312 (A), Orcutt Zones S2–S6 (B), Orcutt Zone S1B (C), and Grassy Creek #1 (D). Each panel contains TGA/DSC data (upper) and MS data (lower). Exothermic peaks in the DSC appear as negative peaks. The dashed vertical line at 300 °C is to illustrate that pyrolysis is not expected below this temperature.
Energies 16 01544 g003
Figure 4. TGA data for lactose (A), SPR (B), Bakken (C), Monterey (D), Diatomite (E), Orcutt zones S2–S6 (F), Orcutt zone S1B (G), and Grassy Creek (H), during the 500 °C oxidation step under dry air after pyrolysis.
Energies 16 01544 g004
Figure 5. DSC signal recorded during the 500 °C oxidation step under dry air after pyrolysis. Curve identification is the same as in Figure 4.
Energies 16 01544 g005
Table 1. Typical fragmentation products of given compounds within the mass spectrometer, and signal chosen for monitoring specific chemical species during this study.
Compound; Atomic WeightMajor Fragmentation Products/m/zAnalyzed Signal/m/z
Hydrogen; 22, 12
Methane; 1616, 15, 14, (13, 2, 12, 17)15
Water; 1818, 17, (16)18
Carbon monoxide; 2828, (12, 29)-
Nitrogen; 2828, (14)-
Ethylene; 2828, 27, 26, 25, (14, 24, 13, 29, 12)-
Ethane; 3028, 27, 30, 26, (12, 25, 14)27
Oxygen; 3232, 16-
Propylene; 4241, 39, 42, 27, 40, 38, 37, 26, (15, 14)-
Propane; 4429, 26, 28, 15, 27, 44, 14, 43, 39, 41, (42, 38, 37, 40, 30)29
Carbon dioxide; 4444, 28, (16, 12, 45, 22)44
Benzene; 7878, 52, 51, 50, 77, 39, (38)78
Table 2. Summary of results for oil samples.
OilAPI. Deg.Peak H2 %T, C @ Peak H2Peak CH4%T, C @ Peak CH4Peak C2H6 %T, C@ Peak C2H6
Bakkens35NANANANANANA
SPR~352.64902.34903.6485
Monterrey 16-31142.44801.34801.3460
Diatomite 1312142.24600.84501.1440
Orcutt S2–S6143.94701.54601.7450
Orcutt S!B142.54801.14651.3450
Grassy Creek165.95004.35054.8490
Table 3. TGA and DSC results elucidated from Figure 4 and Figure 5, respectively.
Specimen;
(API Gravity/°)
Mass Loss during Pyrolysis/%Mass Loss during Oxidation/%Residue after Oxidation /%Enthalpy of Oxidation a/J g−1Enthalpy of Oxidation b/J g−1
Lactose; (N/A)76.521.71.82−1411−6497
SPR; (35)84.24.2111.58−364.7−8668
Bakken; (35)90.70.239.07−11.61−5046
Monterey Well 16-31; (14)89.75.334.97−384.9−7221
Diatomite Well 1312; (14)87.87.185.04−498.3−6929
Orcutt zones S2–S6; (14)86.89.004.2−243.4−2704
Orcutt zone S1B; (14)87.710.132.19−396.4−3907
Grassy Creek #1; (16)84.39.236.51−293.7−3174
a: enthalpy normalized to sample mass prior to pyrolysis stage. b: enthalpy normalized to sample mass change during oxidation.
Disclaimer/Publisher’s Note: The statements, opinions and data contained in all publications are solely those of the individual author(s) and contributor(s) and not of MDPI and/or the editor(s). MDPI and/or the editor(s) disclaim responsibility for any injury to people or property resulting from any ideas, methods, instructions or products referred to in the content.

