Abstract
The greenhouse’s energy consumption is a major limiting factor for output and development. To address this, it is necessary to adopt green and low-carbon heating technologies to replace traditional fuels. This will not only help conserve energy but will also reduce emissions, thereby improving the thermal environmental conditions for agriculture. This paper aims to research and develop a vertical heat exchange tube array device specifically designed for greenhouses. The focus is on enhancing the passive heat absorption and heat storage efficiency of the device and its influence on the thermal environment of the greenhouse. In order to improve the heat absorption and storage efficiency of the heat exchanger device and its impact on the greenhouse thermal environment, experimental comparative analysis was conducted using air, water, and phase-change materials as working fluids inside the pipes. Through a combination of experiments and simulations, it was verified that the heat exchanger device is capable of actively regulating the greenhouse thermal environment. The results show that heat exchangers of all three types of working fluids can effectively improve the stability of soil temperature and play a “shifting the peak and filling the valley” role in regulating the indoor air temperature while positively regulating the relative humidity of the air. Notably, when the working fluid is a phase-change material, it has the most significant impact on the thermal environment of the greenhouse.
1. Introduction
A greenhouse is a specialized facility that aims to provide an ideal growth environment for plants [1,2]. It can help improve the crop yield and quality by extending the growing season of crops [3]. Moreover, it can regulate environmental factors such as the temperature, humidity, and light to create optimal conditions for crop growth [4,5]. Greenhouses have become a crucial production tool in modern agriculture. The development of energy-efficient and smart greenhouses, coupled with the enhancement of agricultural production efficiency and quality, holds significant importance for economic and social progress [6,7].
While greenhouses are essential for agricultural production, they also pose certain challenges. Traditional solar greenhouses may have limited environmental regulation capacity, and the substrate and air temperatures can drop during winter nights, which can impede plant growth. To ensure optimal plant growth in colder areas, it is important to implement measures that can supplement greenhouse heating. However, this may lead to increased energy consumption, which can raise concerns regarding the use of electricity and gas [8]. Greenhouse heating costs make up around 30% to 50% of the total operational expenses in agriculture during winter. Additionally, it is a major consumer of agricultural energy, with a heavy reliance on fossil fuels [9]. The adoption of eco-friendly and low-carbon heating technology instead of traditional fossil fuels provides a unique opportunity to conserve energy and reduce emissions in the agricultural industry. Thus, the focus of this research is on developing new heat storage and heating technologies that utilize renewable solar energy to achieve cost-effective control of greenhouse thermal environments and improve energy utilization rates [10].
The primary energy source for greenhouses is solar radiation. However, at night, the heat is lost, resulting in temperature fluctuations that may not be suitable for crop growth. To maintain an optimal thermal environment for crop growth, it is necessary to store the abundant solar radiation energy during the day and release it at night when the ambient temperature drops. This approach can effectively save energy and reduce consumption, which has been a research hotspot [11]. In light of this area of research becoming a hotspot, scholars have divided the utilization into two categories: passive and active methods of heat storage and release. As a result, there has been significant research conducted on this topic [12,13,14,15]. In both national and international research on active heat storage and release using solar energy in greenhouses, to optimize the utilization of solar energy and increase indoor greenhouse temperature, Hu et al. [16] developed and analyzed an active solar heating system (ASHS). The system consists of five solar water heaters equipped with vacuum tube solar collectors, a heat storage tank, and a heating system that includes a booster pump and heating pipes. In this system, water is heated in the solar collector during the daytime and stored in a water tank. The heated water is then circulated through heating pipes to distribute heat to the ground and root areas of the plants. The implementation of this system has demonstrated an increase in the average indoor air temperature of 2.2 °C and an increase in the substrate temperature of 3.3 °C in constant-temperature greenhouses. Xia et al. [17] presented a wall-mounted active solar water curtain heating system that exhibits exceptional chemical stability, high specific heat capacity, and great fluidity. The system serves multiple functions including heating, transportation, and storage. Field tests were conducted and showed that the system increased the indoor temperature by 3.6 °C and decreased the relative humidity of the indoor air by 6.6%. Zhou et al. [18] substituted the conventional north wall heat storage and release system in Chinese solar greenhouses (CSGs) with a new system that incorporated a heat pump. The heat pump system consumed an average of 0.04 kWh/m2 daily. The experimental greenhouse showed an increase in night temperature from 2 °C to 4.5 °C, compared to the reference greenhouse. Zong et al. [19] proposed a thermal energy utilization system for fan coil air, comprising nine fan coil units, a water tank, a pipeline, and a circulating water pump. By enabling heat exchange between the air and water flowing through the coil, the system can collect heat energy from the air during the daytime and release heat energy from the water into the greenhouse at night. According to the results, the system can collect heat energy from the air during the day and release heat energy into the greenhouse at night, ranging from 0.25 to 0.44 MJ/m2 and 0.24 to 0.38 MJ/m2, respectively. The active heat storage and warming technology used in greenhouses requires external fans and pumps to provide power. While this can heat the greenhouse to a certain extent, it also requires additional energy, such as electricity consumption, to power the heating system. Furthermore, regulating and controlling the thermal environment of the greenhouse can be costly due to the technical means required. Therefore, there are limitations to the application of active heat storage and release technology in greenhouse heating. In terms of passive heat storage technology for greenhouse heating, which requires no additional energy input, significant research has been conducted by scholars both domestically and internationally. As an example, in a study conducted by Govind et al. [20], four 0.8 m3 buckets that were blackened were placed on the northern side of a 15.4 m2 greenhouse located in Delhi, India, to collect solar energy during the day. This led to natural convection heating inside the greenhouse during the night. The results from the experiment indicated that the temperature inside the greenhouse was 5–6 °C higher than the temperature outside, even during the coldest winter nights in December and January. Gourdo et al. [21] developed a passive solar water jacket system for greenhouses, which was utilized to warm the root area of tomatoes in a Canary greenhouse. The impact of the solar heating system on the microclimate environment, tomato yield, and indoor pests in the greenhouse was researched. The experimental results demonstrate that, compared to the control greenhouse that lacked a passive solar heating water jacket, the solar heating system can increase the temperature in the greenhouse by 3.1 °C, decrease the humidity by 10%, and boost the tomato yield by 35%. Consequently, indoor climatic conditions are significantly enhanced, offering optimal growth conditions for tomato crops in the greenhouse. Moreover, a decrease in the number of pests in the greenhouse is observed. Bazgaou et al. [22] utilized a water jacket for passive solar heating and combined it with rock bed heat storage technology to effectively warm a greenhouse located in Canari. Their findings revealed that the two solar heating systems together enhanced the nighttime greenhouse environment, resulting in a 3–5 °C increase in air temperature, a 2–4 °C increase in substrate temperature, and a 10–15% reduction in air relative humidity. The solar thermal collection technologies mentioned above predominantly rely on passive heat storage methods. Although such methods are capable of accumulating a certain level of heat, the energy efficiency is relatively lower when compared to active heat storage techniques. Consequently, various scholars have integrated passive greenhouse heat storage technology with phase-change material (PCM) technology to augment the greenhouse’s heat storage and warming ability [23,24,25,26]. This study focuses on passive greenhouse heat storage technology and introduces a vertical heat exchange tube device. The aim is to address the issue of the low utilization efficiency of passive heat storage energy. The study compares the use of air, water, and PCM as heat storage working mediums in vertical heat exchange and analyzes their impact on the thermal environment of the greenhouse, including the soil layer temperature, air temperature, and air relative humidity.
The principle of heat storage and warming in a greenhouse using a vertical heat exchange tube array is as follows: the heat exchange tube is divided into an aboveground section and an underground section. During the daytime, the aboveground section of the heat exchange tube absorbs solar radiation and hot air inside the greenhouse. The working medium in the tube absorbs this heat, which leads to an increase in temperature. Through the vertical heat transfer process of the heat exchange tube, the underground section of the tube absorbs more heat and reaches higher temperatures, transmitting the energy to the underground soil. At night, the accumulated heat in the heat exchange tube and soil layer is released to the greenhouse air via the wall of the heat exchange tube. The vertical heat exchange tube device effectively utilizes solar energy resources and regulates the greenhouse’s thermal environment, shifting the peak and filling the valley. Considering the limited efficiency of heat storage and utilization through vertical heat exchange tubes, this study compares and analyzes the heat storage properties of air, water, and PCM within the tubes. Additionally, it examines their influence on greenhouse thermal environment factors, including the air temperature, air relative humidity, and soil depth temperature. Given the passive utilization of solar energy resources, enhancing the energy efficiency and developing optimal growth environments for crops are crucial for promoting energy conservation, reducing emissions, and fostering sustainable agricultural practices.
2. Materials and Methods
2.1. Experiment Setting
The study was conducted in two adjacent arched greenhouse structures situated at coordinates 40.48° N, 111.41° E in the energy center of the Inner Mongolia University of Technology, located in Hohhot, Inner Mongolia Autonomous Region, China. The location of the two experimental greenhouses is illustrated in Figure 1. Figure 2 offers a detailed description of the layout and positioning of the control and experimental sheds. Both sheds are oriented east–west and have dimensions of 3 m in length, 2 m in width (north–south), and 2.2 m in height with an arch radius of 1 m. The hollow vertical heat exchange tubes in the experimental greenhouse were arranged in a specific layout. The north–south distance between the experimental group and the control group was determined based on the maximum shading caused by the minimum solar elevation angle on the winter solstice to the south-facing greenhouse. Equation (1) was used to calculate the solar altitude angle, with the local latitude of the test site being a 40.48° north latitude and the latitude of the sun directly shining on the Tropic of Cancer on the winter solstice being 23.26°. The calculated solar altitude angle was 26.26°. Figure 3a provides a graphical representation of the minimum distance between two greenhouses. A sunlight path simulation for greenhouse shading during the winter solstice at noon was conducted using Autodesk Revit 2020 software. The simulation and modeling utilized input parameters such as the latitude and longitude of the experimental site (40.48° N, 111.41° E), winter solstice time, and other relevant factors to simulate the maximum shadow cast by the arch shed at noon on the winter solstice throughout the year. The simulated shadow, as shown in Figure 3b, measures 3.4 m. Therefore, the distance between the north and south sides of the experimental greenhouse is set at a minimum of 3.5 m to ensure that it remains unaffected by shading throughout the year.
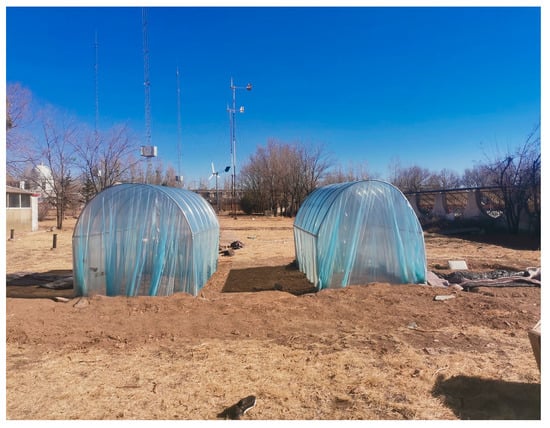
Figure 1.
Field layout of control greenhouse and experimental greenhouse.
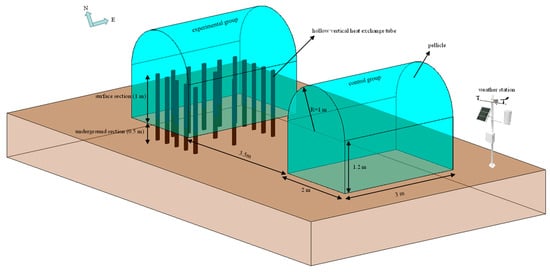
Figure 2.
Comparison of greenhouse and experimental greenhouse model details.
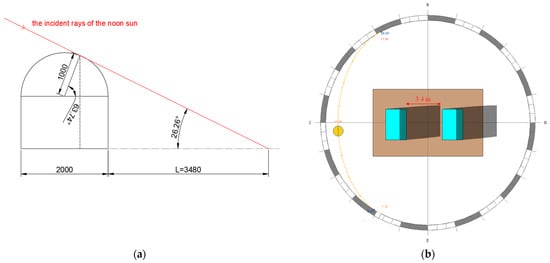
Figure 3.
North–south spacing design of control and experimental arches. (a) Calculation diagram; (b) shadow of arch shed at noon on winter solstice.
2.2. Hollow Vertical Heat Exchange Tube Device
This study used aluminum square tubes as the vertical heat pipes because aluminum has superior thermal conductivity and corrosion resistance. The tube was divided into two sections, an aboveground section measuring 1 m and an under-ground section measuring 0.5 m, resulting in a total length of 1.5 m. The upper part of the heat exchange tube is coated with a black heat-absorbing material, which helps to absorb solar radiation during the day. The underground part of the tube is arranged in an array and buried in the soil, facilitating heat exchange with the soil, as shown in Figure 4a. The hollow aluminum heat exchange tube has a cross-sectional square size of 80 mm × 40 mm and a wall thickness of 2 mm, as illustrated in Figure 4b. In the experimental group, 16 hollow vertical heat exchange tubes were arranged in the arch shed. Figure 4c,d provide a physical map and layout details of the experimental setup, respectively.
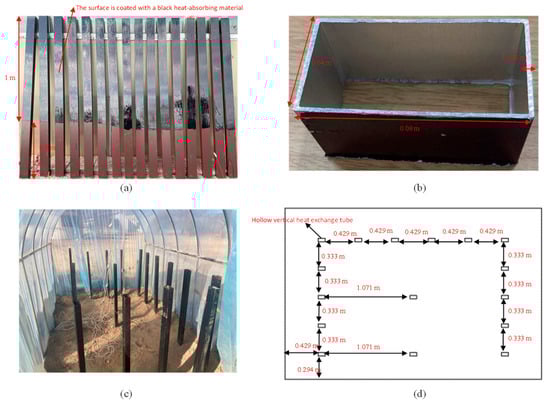
Figure 4.
Heat exchange tube design and layout. (a) Physical picture of heat exchange tube; (b) section diagram of heat exchange tube; (c) arch shed heat exchange tube physical picture; (d) detailed layout of heat exchange tube shed.
For the hollow array heat pipe, air, water, and PCM were sequentially chosen as filling media to compare respective levels of impact on the greenhouse thermal environment. The principle of the vertical heat pipe’s impact on the greenhouse thermal environment is as follows: during the day, the vertical heat pipe absorbs excess solar radiation and heat from the air inside the greenhouse and stores it in the heat storage medium and soil layer. At night, the stored heat is released into the greenhouse air through the heat pipe, achieving a peak-shaving effect.
2.3. Filling Medium
The experiment involved filling the heat exchange tube with conventional air, water, and PCM organic paraffin. The study on the hollow vertical heat exchange tube was conducted between 18 October and 25 October, with conventional air being used as the filling medium. From 27 September to 2 October 2022, an experimental study was carried out on a vertical heat exchange tube filled with water as the heat storage medium. The study on the influence of the PCM vertical heat exchange tube on the thermal environment of the arch shed was conducted from 3 October to 9 October. For the experiment, it is necessary to have a filling medium volume that is equal to the volume of 16 hollow heat exchange tubes. One tube contains 0.0048 m3 of the working medium, so the total volume required is 0.0768 m3. The arch shed in which the experiment was conducted has a volume of 11.91 m3, and the ratio of the filling medium volume to the greenhouse arch shed volume is 0.0064. The experiment used organic paraffin from Shanghai HEMAI new Energy Company with a phase change temperature of 24 °C and a latent heat value of phase change of 165 kJ/kg. Table 1 displays the physical parameters of air, water, and PCM, and Figure 5 showcases the PCM performance test curve; the PCM performance testing curve was provided and tested by the Shanghai HEMAI New Energy Company.

Table 1.
Table of physical property parameters of air, water, and PCM.
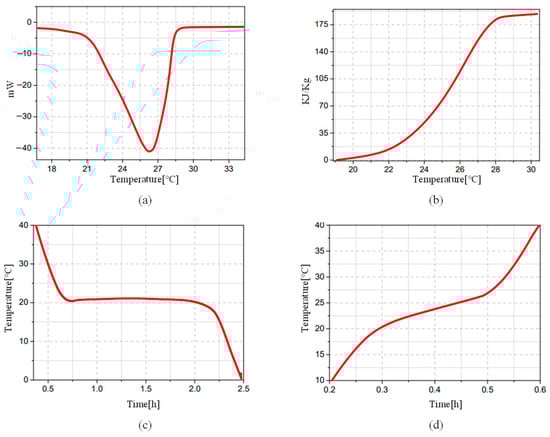
Figure 5.
PCM performance test curve. (a) DSC test; (b) heat storage capacity; (c) cooling curve; (d) temperature rise curve.
2.4. Measuring Point Arrangement
Real-time measurements of thermal environment parameters such as the temperature and relative humidity were taken during the experiment in the greenhouse. The temperature was measured using a PT100 thermocouple, and readings were collected every 20 min by connecting it to a PT700 data-acquisition instrument. Bluetooth thermometers were utilized to measure the relative humidity, and data were collected and recorded through a mobile phone at hourly intervals. Figure 6 displays the equipment used, and Table 2 provides further information on the equipment parameters.
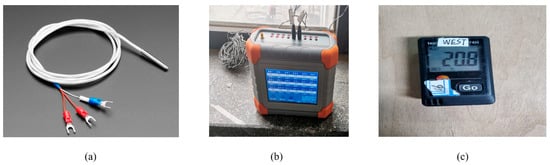
Figure 6.
Physical equipment used for measurements. (a) PT100 temperature sensor; (b) multi-channel data acquisition instrument; (c) Bluetooth hygrograph.
Table 2.
Equipment parameter table.
2.4.1. Placement of Temperature Measuring Point
The temperature monitoring in the arch shed includes measuring both the air and soil temperature. The locations for temperature measurement are the same in both the experimental and control arch sheds. In the shed, the temperature of the soil layer is measured at six evenly spaced points in the horizontal direction. As a soil depth shallower than 50 cm is the area where most crops grow their roots, each measuring point is arranged vertically with a PT100 thermocouple probe at soil depths of 10 cm, 30 cm, and 50 cm. To monitor the air temperature, seven PT100 thermocouples are arranged vertically in the middle of the shed. The thermocouples are positioned at 0, 30, 60, 90, 120, 150, and 180 cm from the ground. Additionally, an outdoor ambient temperature measuring point is installed at a height of 1 m on the east side of the experimental shed.
The layout of the soil layers and atmospheric temperature measurement points in the arch shed is shown in Figure 7. The symbols and definitions of the measurement points are as follows: pentagram, inverted triangle, horizontal diamond, equilateral triangle, vertical diamond, circle, and pentagon represent the atmospheric temperature measurement points and the six horizontal soil temperature measurement points labeled 1 to 6. Each horizontal soil point and atmospheric point has multiple thermocouple probes arranged vertically with different representations. If named according to Shed A and Shed B, refer to the Nomenclature for symbol and point naming methods.
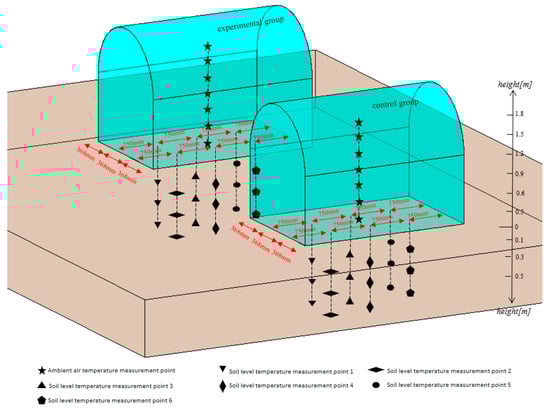
Figure 7.
Temperature measuring point layout.
2.4.2. Relative Humidity Measuring Point Arrangement
There are three measurement points for the relative humidity evenly arranged in the middle of each arch shed, located at heights of 30, 100, and 170 cm above ground level. The specific arrangement can be seen in Figure 8. Refer to the Nomenclature for the naming of symbols for each relative humidity measuring point in the reference shed and experimental shed.
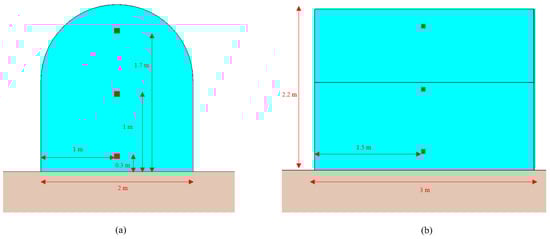
Figure 8.
Relative humidity measuring point layout. (a) Relative humidity measurement point east and west side view; (b) north–south main view of relative humidity measurement points.
2.4.3. The Arrangement of Measuring Points for Tube Wall Temperature, Working Medium Temperature, and Soil Horizontal Temperature around the Tube
The use of conventional air as the working medium in heat exchange tubes facilitates the study of energy flow between the tubes, ambient air on the ground, and deep underground soil. To enable this study, a working medium temperature measuring point is added to one of the heat exchange tubes. Additionally, a tube wall temperature measuring point and a horizontal temperature measuring point around the tube are also added.
Figure 9a depicts the plan view of the selected vertical heat pipe and surrounding soil measurement points for studying the energy flow, while Figure 9b shows the cross-sectional detail of the heat pipe wall, internal fluid, and surrounding soil measurement points. Temperature measurement points at soil depths of 10, 30, and 50 cm are arranged at horizontal distances of 10, 20, and 30 cm from the heat pipe wall. Temperature measurement points for the heat pipe wall and internal fluid are located at the same height, with measurement points situated 30, 60, and 90 cm above ground level and at soil depths of 10, 30, and 50 cm below ground level. The nomenclature and representation methods for each measurement point are referred to in the Nomenclature. When water or PCM is used as the internal fluid, working medium temperature measurement points are only retained at 30 and 60 cm above ground level and 30 cm below ground level, since their higher specific heat and unit heat storage capacity compared to air and the presence of latent heat during PCM heat storage and the release process render the internal fluid temperature in the upper and lower sections of the heat pipe relatively stable and uniform.
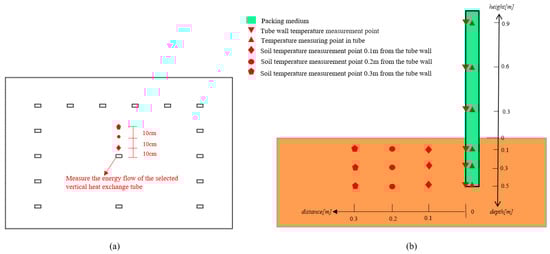
Figure 9.
Temperature measurement points of the working medium in the heat exchange tube, tube wall, and soil temperature measurement points around the tube. (a) Plan of selected heat exchange tube and surrounding soil measuring points; (b) detailed section of selected heat exchange tube and surrounding soil measuring points.
2.5. Energy Exchange Model in Arch Shed
Figure 10 illustrates the energy exchange model of the experimental shed and the control shed. Unlike the experimental shed, the control shed does not have a heat-exchanging tube device. The energy flow and exchange in the shed involve solar radiation that penetrates the shed’s film and refracts or reflects off of it, and some rays are absorbed by the film. The absorbed solar radiation on the soil surface transmits energy deep into the soil through heat conduction. As solar radiation is absorbed by the soil surface, it subsequently releases energy to the surrounding air in the form of long-wave radiation and convective heat transfer. This occurs when the temperature of the soil is higher than that of the air within the shed or during nighttime. The ambient air in the shed then exchanges heat with the external environment through convective heat exchange. The energy exchange and flow in the experimental shed are comparable to those of the control shed, with the exception of the two-way heat exchange between the heat exchange tube and the soil layer, as well as the air temperature within the shed. To streamline the current model, we have divided the physical and mathematical model of energy flow in greenhouses into three separate models: air, soil, and heat exchange tubes. The study of energy exchange and flow in the arched greenhouse is based on the following assumptions:
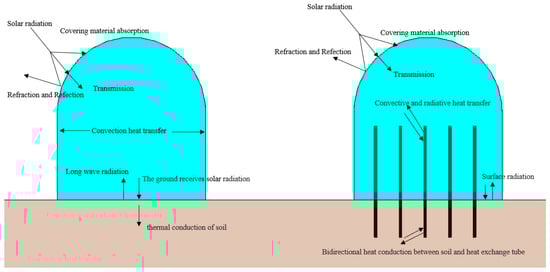
Figure 10.
Energy flow in an arch shed.
- The thermal conductivity and heat storage of transparent materials can be ignored;
- The long-wave radiation heat transfer between the inner surfaces of the greenhouse is not considered;
- The thermal physical parameters of the tube and soil of the heat exchange tube are fixed;
- There is no evaporation and infiltration of water on the soil surface and underground, no ventilation in the shed, and no loss of water vapor in the air.
The energy balance equation for the air in the greenhouse can be expressed using Equation (2). This equation takes into account the convective and radiative heat exchange that occurs between the air and the soil surface, as well as the heat transfer process that occurs through the film and between the air inside and outside the greenhouse. Additionally, it considers the heat exchanged by solar radiation and the convective heat exchanged with the surface of the heat exchange tube.
The energy balance equation for soil is presented in Equation (3). Soil energy exchange encompasses solar radiation absorbed by the soil surface, heat transfer between the soil’s vertical layers, convective heat transfer between indoor air and the soil surface, and heat transfer between buried heat exchange tubes and the soil.
Equation (4) illustrates the energy balance of the vertical heat exchange tube. The energy transfer of the model includes the solar radiation absorbed by the heat exchange tube surface, the heat exchange between the tube surface and the shed air, the heat exchange with the soil for the underground part tube, and the energy accumulation of the working medium within the tube.
When the filling medium in the tube is air or water, the heat accumulation of the working fluid in the heat exchange tube is solely a process of sensible heat. The heat accumulation of the working fluid in the heat exchange tube is represented by Equation (5).
When the heat exchange tube uses PCM as the working medium, the heat accumulation in the medium comprises both sensible and latent heat processes. The heat accumulation of the working medium is represented by Equation (6).
2.6. The Repeatability Characteristic of the Experiments
The experimental reproducibility of the impact of vertical array heat pipes on the thermal environment in greenhouses depends mainly on the source of heat and the process of heat treatment and conversion. Therefore, the reproducibility of the experiment mainly includes physical conditions and environmental conditions. Physical conditions mainly include the greenhouse size, heat pipe specifications, and repeatability of the filling fluid. The greenhouse size and heat pipe specifications can be met using a similar theory for approximate comparison, and the filling fluid can be replaced with PCM with similar thermal and physical parameters. Environmental conditions include the repeatability of the solar radiation value, ambient air temperature, solar elevation angle, etc., during the experiment, which can be met by simulating a greenhouse and solar heat source to ensure the repeatability of environmental conditions. Therefore, this experimental study can be repeated.
3. Results
3.1. Verification of Heat Exchange Tube ‘Peak Shifting and Valley Filling’ to Regulate the Greenhouse Thermal Environment
3.1.1. Experimental Verification of Soil Layer Temperature and Tube Wall Temperature around the Heat Exchange Tube
In order to evaluate the effectiveness of the vertical heat exchange tube in utilizing solar energy and regulating the thermal environment of a greenhouse through ‘peak shifting and valley filling’, an analysis of the soil temperature around the tube at a horizontal measuring point was conducted, as well as experimental data on the wall temperature of the heat exchange tube. The experiment used air as the working medium. The article provides a clear reference to the location and arrangement of the measuring points in Figure 9 of Section 2.4.3. The temperature variation in the soil and wall surrounding the heat exchange tube over time is demonstrated in Figure 11. TBT_Y indicates the temperature measurement at the wall point Y cm away from the heat exchanger, which can also be used to represent the temperature of the soil near the pipe wall. TX_Y represents the temperature measurement at a depth of Y cm in the soil layer X cm away from the heat exchanger wall horizontally.
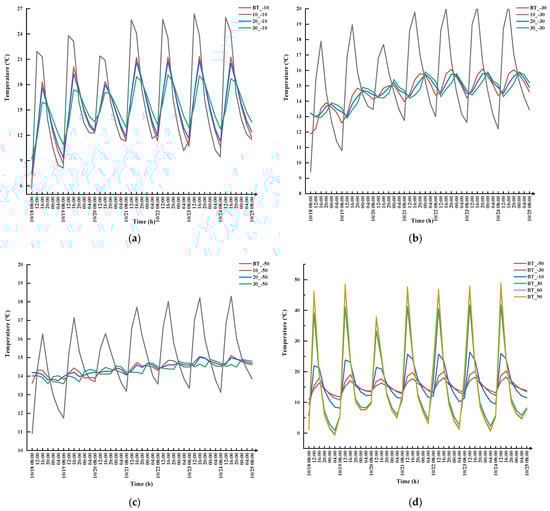
Figure 11.
The temperature of each soil layer around the heat exchange tube and the heat exchange tube wall. (a) Soil layer temperature 10 cm underground; (b) soil layer temperature 30 cm underground; (c) soil temperature 50 cm underground; (d) tube wall temperature of heat exchange tube.
As shown in Figure 11a, it is evident that the temperature of each measurement point in the soil layer 10 cm below ground around the heat exchange tube follows the same trend over time. The temperature tends to rise from 8:00 to 16:00, followed by a decline from 16:00 to 8:00. Between 8:00 and 20:00 in daylight, there is significant temperature stratification in the soil layer 10 cm below ground, with the soil layer closer to the heat exchange pipes having higher temperatures. The opposite temperature distribution occurs between 20:00 and 8:00 at night, with the soil layer closer to the heat exchange pipes having lower temperatures. This means that during the day, the closer the distance to the heat exchange tube, the higher the temperature of the soil layer 10 cm underground, whereas, at night, the closer the distance, the lower the temperature. The analysis reveals that the heat exchange tube absorbs a significant amount of solar radiation energy during the day. This energy is then transmitted to the surrounding soil, which affects the temperature of the 10 cm underground soil layer around the heat exchange tube. As a result, the temperature decreases gradually as we move away from the heat exchange tube. During nighttime, the heat exchange tube absorbs heat from the surrounding soil and releases it into the air within the shed, resulting in a decrease in the temperature of the soil layer around the tube at a depth of 10 cm. This temperature decrease is noticeable in a horizontal direction, with the temperature gradually decreasing from far to near around the heat exchange tube.
Figure 11b,c demonstrate that the temperature stratification gradients around the heat exchange tubes at 30 cm and 50 cm underground horizontally are evident during both day and night. During the day, the temperature decreases as the distance from the heat exchange tubes increases, while at night, the temperature tends to rise as the distance increases. This phenomenon is consistent with the analysis of the 10 cm underground soil layer around the heat exchange tube. However, the temperature fluctuations of the 30 cm and 50 cm underground soil layers are relatively stable. The temperature of the 30 cm underground soil layer fluctuates around 15 °C with a range of 2 °C, while the temperature of the 50 cm underground soil layer fluctuates around 14 °C with a range of 1 °C.
As shown in Figure 11d, the temperatures of various measuring points on the heat exchange pipe wall reach their maximum values at 15:00 and their minimum values at 7:00, with a clear temperature distribution. During the day, the temperature of the heat exchange pipe wall decreases from the top of the aboveground section to the bottom of the underground section, and vice versa at night. Moreover, at the time when the temperature of each measuring point on the pipe wall reaches its highest point at 15:00, the temperature difference between the two ends of the pipe is about 20 °C, while at 7:00, when the temperature of each measuring point reaches its lowest point, the temperature difference between the two ends of the pipe is about 15 °C. As such, there is a temperature gradient within the heat exchange tube throughout the day, which effectively facilitates the transfer of solar radiation heat to the soil. At night, the temperature gradient in turn allows for the transfer of accumulated heat from the soil to the surrounding air in the greenhouse, with a significant temperature differential present at either end of the exchange tube. By utilizing the heat transfer from the higher temperature end to the lower temperature end, the vertical exchange tube efficiently absorbs excess solar radiation during the day. It also transfers heat from the greenhouse air to the soil layer and releases accumulated heat from the soil back into the greenhouse air at night.
The impact of heat exchange tubes on the temperature of the surrounding soil layer and the temperature gradient of the heat exchange tube wall during day and night confirms that vertical heat exchange tubes can regulate the thermal environment of a greenhouse by shifting the peak and filling the valley.
3.1.2. Simulation Verification of Air Temperature in Greenhouse
In order to verify the absorption of solar radiation by the heat exchange tube during the day and its ability to transfer heat with the air in the shed to reduce the air temperature as well as the release of heat through convection with the air at night, a comparison of the air temperature in the control shed and experimental shed is simulated when the vertical heat exchange tube is empty. In this study, the model, boundary conditions, outdoor environment temperature, and solar radiation parameters were input into COMSOL to simulate the temperatures of the control and experimental sheds at 14:00 during the day and 4:00 at night. The temperature cloud image was obtained from the north–south section in the middle of the shed and is depicted in Figure 12 as a simulated image.
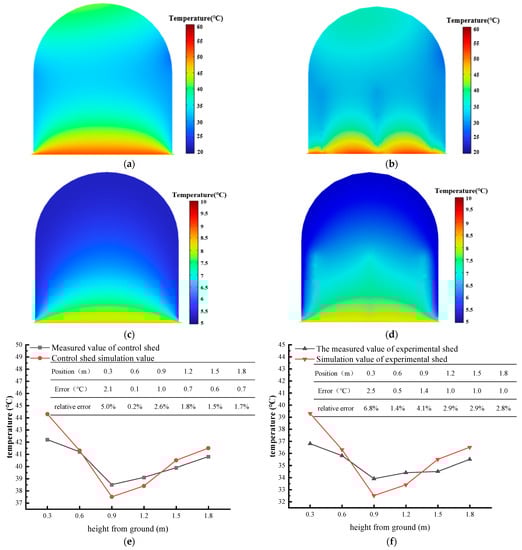
Figure 12.
Temperature cloud maps for the control and experimental sheds, with a north–south section, and comparison between simulation and experimental analysis. (a) Control shed temperature cloud map at 14:00; (b) experimental shed temperature cloud map at 14:00; (c) control shed temperature cloud map at 4:00; (d) experimental shed temperature cloud map at 4:00; (e) comparison of simulation and experimental test results at 14:00 in control shed; (f) comparison of simulation and experimental test results at 14:00 in experimental shed.
According to Figure 12a,b, at 14:00 during the day, the temperature of the roof and ground in the control greenhouse was higher than the temperature in the middle of the greenhouse. The greenhouse air temperature ranged from 40 to 45 °C. In the experimental group, the shed’s air temperature was lower than the control group due to the absorption of solar radiation and convective heat transfer with air through the array heat exchange tube, especially around the tube in the middle of the shed. The ambient air temperature dropped significantly, with temperature fluctuations ranging between 35 and 40 °C. The heat exchange tubes within the array absorb a substantial amount of solar radiation and ambient air heat throughout the day, which helps to decrease the high temperatures present within the greenhouse and shift the peak of the air temperature.
Simultaneously, as indicated in Figure 12c,d, it is evident that solely the ground in the control shed emits heat to the air inside the shed, resulting in higher ambient air temperature near the ground. The temperature distribution within the shed is uneven, with the air temperature ranging from 5 to 8 °C. The experiment group released heat from the heat exchange tube into the air, which caused the surrounding air temperature to increase. This led to a higher level of temperature uniformity in the crop planting area within the shed, with the middle position having a higher temperature than the control group. Consequently, the array heat exchange tube was successful in increasing the mean overnight temperature above the control group and promoting a more even distribution of temperature.
To verify the reliability of the simulation model’s simulation results, the temperature values at different heights at 14:00 for the experimental group and the control group were selected for comparison analysis with the corresponding temperature measurement points for the experimental results. The comparison results are shown in Figure 12e,f. The simulation results and the experimental test results show that the maximum error for the control group and the experimental group close to the ground (position 0.3 m above the ground) is 2.1 °C and 2.5 °C, respectively. This is due to the fact that the simulation assumes a flat ground with a fixed absorption coefficient. However, the error rate for both is within 10.0%, which is an acceptable range for the simulation model. The error rates for other heights range from 0.2% to 2.9%. The reason for the errors is due to the fixed wind speed outside the shed. Although the heat exchange coefficient between the air inside the shed and the environment outside the shed remains the same in the simulation model, the setting for both groups is the same, resulting in a small error rate and a more reliable value for the simulation results.
Based on the analysis provided, it can be confirmed that the array of heat exchange tubes contributes positively to regulating the shed’s air temperature. Specifically, it reduces the temperature during the day and increases it at night, while also improving the vertical temperature consistency throughout the shed.
3.2. Analysis of Working Medium Temperature and Energy Exchange in Tube
The vertical heat exchange tube has demonstrated the capability of “peak shifting and valley filling” to regulate the thermal environment in greenhouses. To investigate the heating control capacity of air, water, and PCM as the filling medium in the tube, an analysis of the temperature of the medium in the tube was conducted. The accumulated heat during the heat storage phase of each medium was obtained, which can be used to compare their heating control capacities. Figure 13a shows that the average ambient temperature and solar irradiation were consistent on 29 September, 7 October, and 22 October. The working medium temperature in the tube was analyzed over three days to maintain consistency with conditions outside the laboratory. Table 1 displays the physical properties of air, water, and phase-change materials.
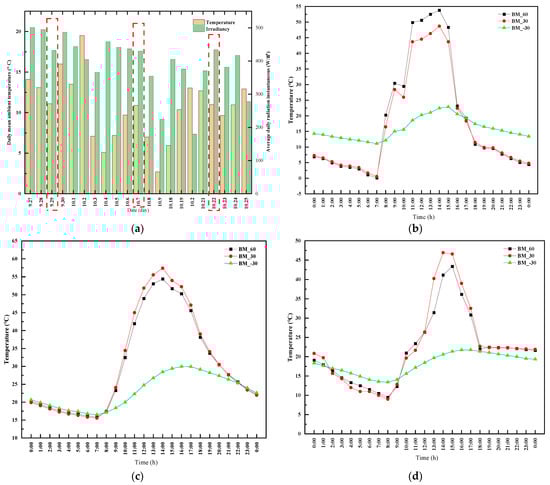
Figure 13.
The weather conditions and temperature changes in the three working fluids during the experiment. (a) The irradiance and outdoor ambient temperature changes during the experiment of different working fluids, and the outdoor environmental conditions selected within the dotted line are approximately the same for three days; (b) the working medium temperature of each measuring point with air as the working fluid; (c) the working medium temperature of each measuring point with water as the working fluid; (d) the working medium temperature of each measuring point with PCM as the working fluid.
As demonstrated in Figure 13, solar radiation affects the temperature curves of air, water, and PCM, resulting in a peak temperature at around 15:00. The temperature of the ground’s 30 cm and 60 cm working fluid measuring points significantly fluctuates due to direct solar radiation exposure, whereas the underground 30 cm working fluid experiences relatively stable temperature fluctuations. Compared to other working fluids, air has a lower specific heat and density. The temperature typically fluctuates between 2.5 and 55 °C, and during the daytime, there is notable temperature stratification. The vertical temperature gradient inside the tube results in a decrease in temperature from top to bottom. At night, the stratification pattern is reversed. Water serves as the working fluid, with the temperature fluctuating from 16 to 55 °C. The heat exchange tube exhibits noticeable temperature stratification during the day, but due to water’s excellent thermal conductivity, the temperature distribution between the ground and underground parts tends to equilibrate at night. PCM is used as a working fluid, with its temperature fluctuating between 10 and 45 °C, which is considered relatively stable. During the temperature rise stage, it was observed that the temperature rise rate of air was the highest, followed by water, while the temperature rise rate of PCM was the most gradual. During the exothermic phase of the working fluid, the rate of air temperature drop is at its highest. While the PCM temperature drop rate surpasses water between 15:00 and 18:00, it remains relatively stable between 18:00 and midnight as PCM releases heat close to its phase change temperature. Consequently, the temperature of the working fluid inside the tube remains almost the same as that of the heat exchange tube wall in the same external environment. The heat exchange tube filled with PCM offers a stable temperature fluctuation, creating a constant and optimal growth environment for plants inside arch-shed greenhouses.
Figure 13 demonstrates that the three working fluids in the heat exchange tubes have the same heat accumulation and temperature rise time periods from 7:00 to 15:00. By calculating the temperature difference of the working fluid during the heat storage period and substituting it into Equations (5) and (6), the heat accumulated by different working fluids can be obtained. The calculated heat is the heat transfer to the soil excluded during the thermal storage phase. As the temperature at 30 cm underground of the three working fluids is about 20 °C, the heat transferred from the three working fluids to the soil during the heat storage stage is approximately equal. Therefore, the relative heat storage capacity of the three working fluids in the heat exchange tube can be compared. For a single tube, the heat storage is only 0.34 kJ due to the relatively small specific heat and density of air. In comparison to using heat conduction on the tube wall of the heat exchange tube to shift the peak and fill the valley, the heat storage and temperature increase of the air as the working medium in the tube can be neglected. The relative storage heat of a single tube of water is 887.04 kJ, and the relative storage heat of PCM is 1200.26 kJ. The greenhouse has 16 heat exchange tubes. The daily total relative heat storage of water as the working medium is 14192.64 kJ, while the daily total relative heat storage of PCM is 19204.16 kJ. Therefore, the heat exchange tube containing PCM as the filling medium has a substantial heat storage capacity and also ensures a stable temperature fluctuation that is favorable for the growth conditions of the plants.
3.3. Soil Layer Temperature Analysis
3.3.1. Air as the Working Medium in the Heat Exchange Tube
Figure 14 illustrates that the temperature of each soil layer in the experimental shed and the control shed varied over time when air was used as the working medium in the heat exchange tube. The six measuring points at the same depth in the soil layer of the shed had almost identical temperatures, and the mean temperature of these points was used as the soil layer temperature.
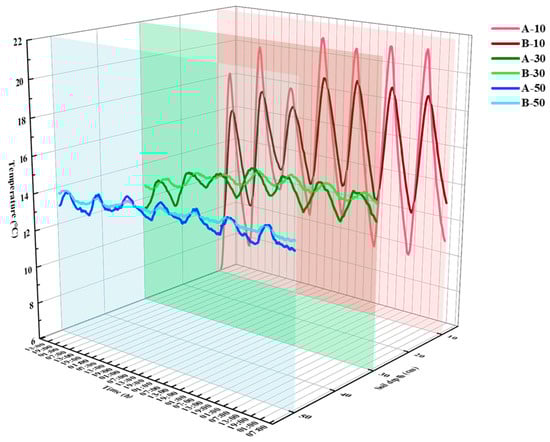
Figure 14.
The temperature distribution of 10, 30, and 50 cm soil layer in the control and experimental groups when the working medium in the array heat exchange tube is air.
Figure 14 shows that the soil temperature at a depth of 10 cm undergoes the most significant changes over time. This is because the solar radiation heat received by the surface is efficiently transmitted to the 10 cm stratum. In the control group, the temperature reaches its peak at 15:30 on the seventh day, with the highest temperature recorded at 18–21 °C. In the experimental group, the underground section of the heat exchange tube wall conducts heat conduction with the 10 cm soil layer and transfers the heat to deeper layers, such as 30 cm and 50 cm of soil. This process weakens the formation temperature during high-temperature periods of the day. At 15:30, the temperature peaks at 17–19 °C. The experimental group temperature peak is reduced by approximately 3 °C compared to the control group. At 8:00 in the morning, when the temperature is extremely low, the heat loss rate of the formation at a 10 cm depth is faster in the control group. The minimum temperature per day reaches 9–11 °C. In the experimental group, the distributed heat exchange tube effectively heats the soil at night, and the lowest temperature in one day can reach about 12–13 °C. This is about 2.7 °C warmer than the control group. Thus, the air-filled heat exchange tube in the arch shed plays a peak-shaving and valley-filling role in stabilizing the temperature at the 10 cm soil layer. It reduces the degree of temperature fluctuations and helps to maintain a constant soil temperature.
The temperature at a depth of 30 cm in the soil layer remains relatively stable due to the stratum’s inability to absorb radiation heat during the day and its slow heat dissipation rate at night. As a result, heat is not lost from the surface. In the control group, the soil layer temperature remained within the range of 13.5–15.5 °C over a few days. The experimental group showed a more moderate temperature curve at the 30 cm soil layer due to the peak-shifting and valley-filling effect of the heat exchange tubes on the heat. As a result, the temperature rise and drop were relatively moderate compared to the control group, with the temperature range being between 14.5 °C and 15.5 °C. When using air as the working medium in the heat exchange tube, the temperature at the 30 cm soil layer was approximately 1 °C higher than that of the control group.
At a depth of 50 cm, direct solar radiation has a minimal impact on the soil layer, and temperature fluctuations are minor. The experimental group exhibited higher temperatures than the control group, especially at night. The daily temperature range for the experimental group was 14.3–14.8 °C, while the control group had a range of 13.8–14.8 °C. By using air as the working medium in the heat exchange tube, the soil temperature at 50 cm was raised by 0.5 °C, resulting in a somewhat improved formation temperature.
3.3.2. Water as the Working Medium in the Heat Exchange Tube
Results from Figure 15 demonstrate that water as a working medium has a significant effect on the temperature of the experimental group at a depth of 10 cm in the soil layer, resulting in peak shifting and valley filling. The control group exhibited temperature fluctuations between 20 and 32 °C, while the experimental group showed fluctuations between 23.2 and 30 °C. At 15:30, when the temperature peak occurred, the experimental group’s temperature was approximately 2 °C lower than that of the control group. Conversely, at the 8:00 temperature valley moment, the experimental group’s temperature was approximately 3.2 °C higher than that of the control group. The temperature fluctuations in the experimental group at 30 cm of soil were consistently around 1.3 °C higher than those in the control group, while at 50 cm of soil, the temperature fluctuations were consistently about 0.8 °C higher than in the control group.
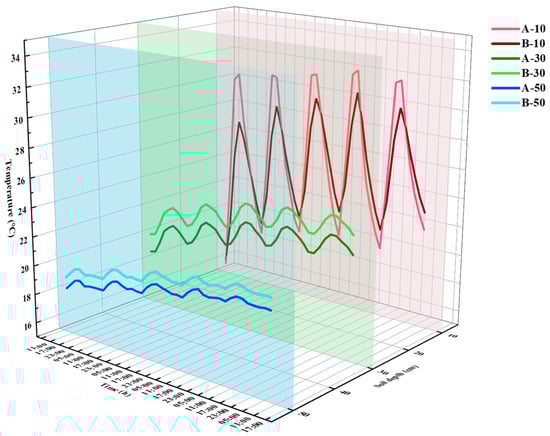
Figure 15.
The temperature distribution of 10, 30, and 50 cm soil layer in the control and experimental groups when the working medium in the array heat exchange tube is water.
3.3.3. PCM as the Working Medium in the Heat Exchange Tube
As shown in Figure 16, the soil temperature distribution of the experimental group and the control group is shown when the PCM is filled in the heat exchange tube. The thermal physical parameters of PCM can be referred to in Table 1 and Figure 5.
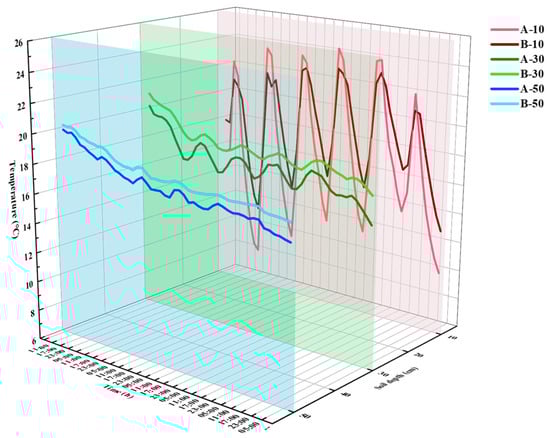
Figure 16.
The temperature distribution of 10, 30, and 50 cm soil layer in the control and experimental groups when the working medium in the array heat exchange tube is PCM.
The temperature fluctuation range of the control group at 10 cm of the soil layer is observed to be 10–25 °C, as shown in Figure 16. On the other hand, the soil layer in the experimental group shows a temperature fluctuation range of 14–24 °C when the heat exchange tube is filled with PCM. The use of PCM in the heat exchange tube can reduce the peak temperature of the 10 cm soil layer by approximately 1 °C while increasing the valley temperature by around 4 °C. At 30 cm deep in the soil layer, the temperature changes in the control group and the experimental group tend to be stable, and the temperature in the two groups fluctuates around 16–20 °C. The experimental group consists of heat exchange tubes containing a filling medium of PCM, resulting in a daily temperature difference of approximately 1.5 °C higher than the control group. In the 50 cm soil layer, both groups experienced stable temperature changes, fluctuating between 16 and 18 °C. The energy transfer between the heat exchange tube and soil layer caused the experimental group to maintain a temperature approximately 1 °C higher than the control group throughout the experimental period.
Therefore, regardless of the filling medium such as air, water, or PCM, the heat exchange tube will have the effect of peak shifting and valley filling at 10 cm of the soil layer and will increase the temperature at 30 cm and 50 cm of the soil layer. However, the difference is that the heat exchange tubes with different working fluids have different effects on the soil layer temperature of the experimental group compared with the control group. The peak clipping ability of air, water, and PCM as working fluids in the heat exchange tube to the soil layer at 10 cm decreases in turn. The reason is that the specific heat and density of air in the heat exchange tube are small, which leads to a small heat storage capacity. The heat exchange capacity between the soil layer and the underground heat exchange tube with air in the daytime is stronger and more direct, which makes the peak clipping ability stronger. And the unit heat storage capacity of water is not as good as PCM, so the heat exchange capacity between the heat exchange tube with water and the soil layer is stronger than that of the heat exchange tube with PCM. Because the heat storage capacity of PCM, water, and air as the working fluid in the heat exchange tube decreases in turn, the heat exchange to the soil layer, in turn, decreases at night. Therefore, in the three experimental conditions using PCM, water, and air as the working fluid for the heat exchange tube, the temperature increasing values for the 10 cm, 30 cm, and 50 cm soil layers decrease sequentially with different working fluid.
3.4. Analysis of Air Temperature and Humidity in Shed
The ambient air in the experimental arch shed absorbs solar radiation during the day, and the temperature rises. The heat exchange tube absorbs heat by convective heat transfer with the air in the shed, so the ambient air is lower than the temperature of the control greenhouse. The night array heat exchange tube releases heat to the ambient air to increase the air temperature. The relative humidity of the air in the experimental shed is also related to the heat transfer between the array heat exchange tubes and the air in the shed, as shown in the 17 d enthalpy–humidity diagram. If the air temperature and humidity in the experimental shed are point 1 in the figure, when the array heat exchange tubes absorb heat through heat exchange with the ambient air during the day, the ambient air temperature decreases, and the heat enthalpy decreases. The process is as shown in points 1 to 3 in the figure, and the relative humidity of the air in the experimental shed increases. At night, the heat exchange tube releases heat by convective heat transfer with the air in the shed, so the air temperature in the experimental shed increases and the enthalpy value increases. The process is shown from point 1 to point 2 in the figure, and the relative humidity of the air decreases. As shown in Figure 17, when the working fluid in the array heat exchange tube is air, water, and PCM, the variation law of air temperature and relative humidity in the experimental shed and the control shed is shown. The temperature values of seven different height temperature measuring points and three different height relative humidity measuring points arranged vertically in the middle of the shed are almost the same with time. The average value of the seven temperature measuring points is taken as the air temperature in the shed, and the average value of the three relative humidity measuring points is taken as the air relative humidity in the shed.
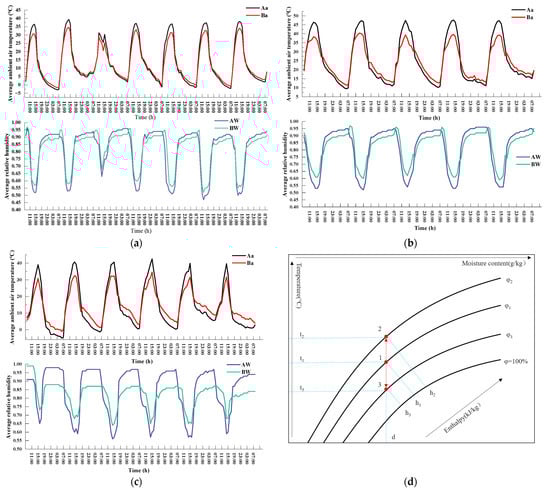
Figure 17.
The variation in air temperature and relative humidity in the experimental shed and the control shed under three working fluids in the heat exchange tube. (a) Air as the working fluid in the array heat exchange tube; (b) water as the working fluid in the array heat exchange tube; (c) PCM as the working fluid in the array heat exchange tube; (d) the schematic diagram of the relative humidity change in the air in the experimental shed.
As shown in Figure 17a, when the air is used as the working medium in the heat exchange tube, due to the convective heat transfer between the upper section of the array heat exchange tube and the ambient air in the shed, the air temperature of the experimental group moves to the peak and fills the valley relative to the air temperature of the control group. The daily temperature of the control group reaches a peak of about 35 °C at 15:00, and the temperature of the experimental group is weakened by 5 °C relative to the control group. At night, from 18:00 to 8:00, due to the heat released by the array heat exchange tube to the ambient air, the experimental group is always higher than the control group at night. The temperature filling value is about 1.5 °C. The relative humidity of the experimental group was higher than that of the control group at 8:00–17:00 during the day, especially at 15:00; the relative humidity was 5% higher than that of the control group, and the relative humidity was 3% lower than that of the control group at 18:00–7:00 at night. The main reason is that the heat exchange tube absorbs the ambient air during the day, and the air enthalpy in the shed decreases and the relative humidity increases. The array heat exchange tubes at night release heat to the ambient air, and the air enthalpy in the shed increases and the relative humidity decreases. Therefore, the array heat exchange tube can increase the relative humidity of the air in the greenhouse during the day. The greater the relative humidity of the air, the greater the scattering of air solar irradiance, that is, the less solar radiation reaches the ground, thus alleviating the high-temperature phenomenon in the greenhouse to a certain extent. At the same time, the array heat exchange tube reduces the relative humidity of the air in the greenhouse at night and reduces the water vapor in the humid air to reach the saturation value, condensing into liquid water, which avoids the harm of the high humidity environment to the plants in the greenhouse to a certain extent.
As shown in Figure 17b, the air temperature in the shed is reduced by about 8 °C at 15:00 at the peak time of daytime temperature, and the air temperature in the shed is increased by about 2 °C at night. The daytime relative humidity was 8% higher than that of the control group at 15:00 and 4% lower than that of the control group at night. Therefore, compared to using air as the working fluid in an array heat exchange tube, water improves the peak clipping ability at high temperatures and valley filling ability at night when it interacts with the air temperature. This results in increased relative humidity during the day and decreased relative humidity at night.
As demonstrated in Figure 17c, utilizing PCM as the operating fluid in the array heat exchanger tube resulted in an 8 °C reduction in daytime air temperature within the shed compared to the control group, just like the working medium water. Simultaneously, there was a 5 °C increase in nighttime temperature. At 15:00, the relative humidity in the shed was 8% higher compared to the control group. During the night, the relative humidity dropped by 10% in comparison to the control group, stabilizing at approximately 88%.
Regardless of the working medium utilized in the tube heat exchanger array, including air, water, and PCM, it has an effect on the air temperature in the shed by shifting peaks and filling valleys. During the day, the relative humidity of the air in the shed is heightened, which reduces solar radiation transmittance and helps mitigate high temperatures. Lowering the air’s relative humidity at night avoids excess moisture saturation and condensation, which can be deleterious to plant life. However, the different working fluids have varying effects on air temperature and relative humidity. In terms of peak shifting and valley filling of air temperature in the shed, air is the least effective, followed by water, and then PCM, which is the best. During the day, the effect of a relative humidity increase is weakest with air, followed by water and PCM. At night, the reduction in relative humidity in the air is the smallest with air as the working medium in the tube, followed by water, and then the largest amount of reduction is observed in PCM.
4. Discussion
The results of the experiment reveal that the arrangement of heat exchange tubes in the arched greenhouse can efficiently utilize solar energy and actively regulate the thermal environment. Whether using air, water, or PCM as the working fluid, they all maintain a constant temperature in the soil layer and regulate the relative humidity by shifting the peaks and filling valleys of air temperature inside the greenhouse. As a vertically oriented heat pipe unit with PCM as the working fluid, it has a higher heat storage capacity and more stable temperature fluctuations inside the heat pipe. This makes it the most effective in actively regulating the thermal environment parameters inside the shed, such as soil temperature, indoor air temperature, and relative humidity. However, different crops have different optimal temperature requirements for soil layer roots and air inside the greenhouse. Water and air, due to the limited heat storage capacity and large temperature fluctuation, cannot maintain the desired temperature range. PCM, due to the constant temperature heat storage and release characteristics, can be chosen based on different phase change temperatures to maintain the appropriate growth temperature range for different types of crops, ultimately promoting crop growth and improving yield. Nonetheless, the relationship between the phase change temperature of the vertical PCM heat exchange tube array and the required temperature of the soil layer and air inside the greenhouse needs to be further studied as the experimental period required is long. In this study, the effect of the phase change temperature of the PCM in the heat pipe on improving the thermal environment is conducive to future research on the relationship between the phase change temperature of vertical PCM heat pipe arrays and the control of soil and air temperatures. Meanwhile, the greenhouse size to array heat pipe specification ratio and working fluid filling volume to greenhouse volume ratio in this experiment can be used as a reference to improve the numerical level of the thermal environment, and similar theory can be applied to design the size of the future greenhouse heat pipe system structure.
It can be inferred that the energy source for the vertical heat exchanger mainly comes from the solar radiation absorbed by the upper surface of the heat exchanger and the heat of the air inside the shed. However, the number of array heat exchange tubes in the greenhouse is limited, and enhancing the surface of the heat exchange tube to absorb solar radiation is crucial. Therefore, selecting high-absorption radiation coatings on the surface of the ground section heat exchange tube, such as electroplating coating, anodizing coating, and vacuum coating, is recommended [27]. Secondly, since the heat exchange tube in the underground section cannot accept solar radiation, the heat accumulated in the soil layer during the day is transferred via the heat transfer process between the aboveground section and the underground section of the heat exchange tube. However, the heat transfer caused by the density difference of the working medium in the tube and the heat conduction of the tube wall is limited. Therefore, strengthening the heat transfer process at both ends of the heat exchange tube with a working medium is the next stage of research. This helps to accumulate heat in the soil and release heat in the soil to the air at night. Presently, some cutting-edge research has studied the impact of medium flow and tube structure on heat transfer in the non-forced flow in the tube [28]. For instance, metal particles or non-metallic nano-powders can be added to the heat transfer medium, such as PCM in the tube [29], to make a uniform, stable, and high-thermal-conductivity heat transfer medium. This mechanism improves the atomic mobility, increases the heat transfer of the medium in the heat transfer tube, and further advances the heat exchange of the underground heat exchange tube and the heat storage of the soil layer. Additionally, enhancing the heat exchange capacity between the working medium in the upper and lower sections of the tube may be accomplished by setting up copper tubes with good thermal conductivity in the vertical direction of the heat exchange tube. Some studies also focus on improving the heat transfer between the media in the tube by inserting twisted tape and screw inserts in the tube or adding rough threads on the inner wall of the tube [30].
The array vertical heat exchange tube without external work has broad application prospects in future greenhouse planting. It can not only make full use of the solar energy resources projected into the greenhouse and regulate the suitable thermal environment conditions of crops in the greenhouse but can also meet the needs of energy conservation and emission reduction. In order to meet the planting needs of various types of crops and the effect of cold weather devices, we will continue to study and determine the relationship between the phase change temperature of the array vertical PCM heat exchange tube device and the temperature of the soil layer and air to be controlled, and explore how to strengthen the energy transfer between the working fluids in the heat exchange tube, so that the array vertical heat exchange tube is more suitable for greenhouse applications.
5. Conclusions
This study experimentally analyzes the horizontal soil temperature around a single array heat exchange tube and the temperature of the heat exchange tube wall. Additionally, the air temperature cloud diagram from COMSOL simulation is used to confirm the effectiveness of the array vertical heat exchange tube in both experimental and control sheds. The study also analyzes the ability of air, water, and phase-change materials (PCM) to regulate the thermal environment of the shed when used as heat storage filling mediums. The working medium temperature within the pipe is experimentally analyzed, and heat accumulation during the heat storage process is compared. The study also compares and analyzes the influence of the array heat exchange tubes on the soil layer temperature, air temperature, and relative humidity in the greenhouse. The results show that the array heat exchange tube effectively regulates the thermal environment of the greenhouse. Vertical heat exchange tubes of air, water, and PCM all increase soil layer temperature and have a positive effect on air temperature and relative humidity, with PCM having the strongest regulatory effect.
The main results are summarized in the following bullet points:
- In the horizontal layer of soil surrounding the heat exchange tubes, the temperature decreases as the distance from the tube increases during the day, while at night, the temperature exhibits an upward trend as the distance from the tube increases. This indicates that the heat exchange tubes transfer heat to the soil during the day and absorb heat from the soil layer at night. Additionally, there is a decreasing temperature gradient along the length of the tube during the day, from the upper end to the lower end, and a decreasing gradient at night, from the lower end to the upper end. Both ends of the tube exhibit a large temperature difference, which facilitates the storage and release of heat in the soil through the heat transfer process of the heat exchange tubes.
- Among the three different working fluids used in the heat exchange tube array, namely air, water, and PCM, under the same outdoor environment, air shows a temperature fluctuation range of 2.5–55 °C, water fluctuates between 16 and 55 °C, and PCM varies from 10 to 45 °C. The relative heat storage capacity of a single array vertical heat exchange tube filled with air is 0.34 kJ/d, while that of water is 887.04 kJ/d, and that of PCM is 1200.26 kJ/d. Hence, the heat exchange tube with PCM as the filling medium can effectively support high heat storage capacity as well as maintain stable temperature fluctuations, which is particularly beneficial for plant growth conditions.
- The trio of filling mediums utilized in the array heat exchange tubes all demonstrate an improvement in soil layer temperature and a reduction in temperature fluctuations. However, when the heat storage medium within the tube is phase-change material (PCM), the array heat exchange tube showcases the greatest ability to regulate soil layer temperature. With PCM as the working medium within the tube, the peak temperature at a depth of 10 cm is reduced by 1 °C, the valley temperature increases by approximately 4 °C, the temperature at a depth of 30 cm increases by 1.5 °C, and the temperature at a depth of 50 cm increases by approximately 1 °C.
- The heat exchange tubes, which contain the three working fluids, have a constant temperature peak shifting and valley-filling effect on the air temperature inside the shed. Furthermore, the tubes moderately increase the relative humidity of the air during the daytime and decrease it at night. As the fluid flowing inside the pipes, PCM possesses remarkable capabilities in regulating the airflow inside the shed. It can lower the average daytime air temperature by 8 °C while simultaneously increasing the relative air humidity by 8%. At night, on the other hand, PCM can raise the average air temperature by 5 °C and reduce the relative air humidity by 10%.
Author Contributions
Conceptualization, M.Z. and N.W.; methodology, N.W.; software, N.W. and X.H.; validation, C.C., Y.L. and L.L.; formal analysis, N.W. and J.W.; investigation, N.W.; resources, M.Z; data curation, N.W.; writing—original draft preparation, N.W.; writing—review and editing, M.Z.; visualization, N.W.; supervision, M.Z. All authors have read and agreed to the published version of the manuscript.
Funding
This research is sponsored by the Science and Technology Department of Inner Mongolia Autonomous Region of China, project number 2020CG0066, focused on “Key technologies for solar energy application in ecological restoration and modern agriculture in deserts and saline-alkali lands”. The financial support includes material costs for pre-experiment preparation and publication fees for the research paper, totaling approximately CNY 50,000.
Data Availability Statement
This research received no external funding.
Conflicts of Interest
The authors declare no conflict of interest.
Nomenclature
| Symbols | |
| L | Maximum north–south shading distance between the control shed and the experimental shed |
| HS | Solar altitude angle of the experimental site |
| B1 | Local latitude of the experimental site |
| B0 | The sun is directly over the Tropic of Capricorn at 23.26° latitude on the winter solstice |
| PT100 | Temperature probe |
| PT700 | Data Collector |
| Ambient air temperature measurement points in the shed | |
| Soil level temperature measurement point 1 | |
| Soil level temperature measurement point 2 | |
| Soil level temperature measurement point 3 | |
| Soil level temperature measurement point 4 | |
| Soil level temperature measurement point 5 | |
| Soil level temperature measurement point 6 | |
| A1-10 | Temperature measurement at 10 cm soil depth at control shed level measurement point 1 |
| A1-30 | Temperature measurement at 30 cm soil depth at control shed level measurement point 1 |
| A1-50 | Temperature measurement at 50 cm soil depth at control shed level measurement point 1 |
| A2-10 | Temperature measurement at 10 cm soil depth at control shed level measurement point 2 |
| A2-30 | Temperature measurement at 30 cm soil depth at control shed level measurement point 2 |
| A2-50 | Temperature measurement at 50 cm soil depth at control shed level measurement point 2 |
| A3-10 | Temperature measurement at 10 cm soil depth at control shed level measurement point 3 |
| A3-30 | Temperature measurement at 30 cm soil depth at control shed level measurement point 3 |
| A3-50 | Temperature measurement at 50 cm soil depth at control shed level measurement point 3 |
| A4-10 | Temperature measurement at 10 cm soil depth at control shed level measurement point 4 |
| A4-30 | Temperature measurement at 30 cm soil depth at control shed level measurement point 4 |
| A4-50 | Temperature measurement at 50 cm soil depth at control shed level measurement point 4 |
| A5-10 | Temperature measurement at 10 cm soil depth at control shed level measurement point 5 |
| A5-30 | Temperature measurement at 30 cm soil depth at control shed level measurement point 5 |
| A5-50 | Temperature measurement at 50 cm soil depth at control shed level measurement point 5 |
| A6-10 | Temperature measurement at 10 cm soil depth at control shed level measurement point 6 |
| A6-30 | Temperature measurement at 30 cm soil depth at control shed level measurement point 6 |
| A6-50 | Temperature measurement at 50 cm soil depth at control shed level measurement point 6 |
| Aa-0 | Control shed ambient air above ground 0 cm temperature measurement points |
| Aa-30 | Control shed ambient air above ground 30 cm temperature measurement points |
| Aa-60 | Control shed ambient air above ground 60 cm temperature measurement points |
| Aa-90 | Control shed ambient air above ground 90 cm temperature measurement points |
| Aa-120 | Control shed ambient air above ground 120 cm temperature measurement points |
| Aa-150 | Control shed ambient air above ground 150 cm temperature measurement points |
| Aa-180 | Control shed ambient air above ground 180 cm temperature measurement points |
| Ba-0 | Experimental greenhouse ambient air above ground 0 cm temperature measurement points |
| Ba-30 | Experimental greenhouse ambient air above ground 30 cm temperature measurement points |
| Ba-60 | Experimental greenhouse ambient air above ground 60 cm temperature measurement points |
| Ba-90 | Experimental greenhouse ambient air above ground 90 cm temperature measurement points |
| Ba-120 | Experimental greenhouse ambient air above ground 120 cm temperature measurement points |
| Ba-150 | Experimental greenhouse ambient air above ground 150 cm temperature measurement points |
| Ba-180 | Experimental greenhouse ambient air above ground 180 cm temperature measurement points |
| AW-30 | Air relative humidity of 30 cm above ground in the control shed |
| AW-100 | Air relative humidity of 100 cm above ground in the control shed |
| AW-170 | Air relative humidity of 170 cm above ground in the control shed |
| BW-30 | Relative humidity of air at 30 cm above the floor of the experimental shed |
| BW-100 | Relative humidity of air at 100 cm above the floor of the experimental shed |
| BW-170 | Relative humidity of air at 170 cm above the floor of the experimental shed |
| Packing medium | |
| Tube wall temperature measurement point | |
| Temperature measuring point in tube | |
| Soil temperature measurement point 0.1 m from the tube wall | |
| Soil temperature measurement point 0.2 m from the tube wall | |
| Soil temperature measurement point 0.3 m from the tube wall | |
| BT_-50 | Heat exchanger tube wall underground 50 cm temperature measurement point |
| BT_-30 | Heat exchanger tube wall underground 30 cm temperature measurement point |
| BT_-10 | Heat exchanger tube wall underground 10 cm temperature measurement point |
| BT_30 | 30 cm temperature measurement point on the wall of the heat exchanger tube |
| BT_60 | 60 cm temperature measurement point on the wall of the heat exchanger tube |
| BT_90 | 90 cm temperature measurement point on the wall of the heat exchanger tube |
| BM_-50 | Temperature measurement point 50 cm below the surface of the working mass in the pipe |
| BM_-30 | Temperature measurement point 30 cm below the surface of the working mass in the pipe |
| BM_-10 | Temperature measurement point 10 cm below the surface of the working mass in the pipe |
| BM_30 | 30 cm temperature measurement point on the ground of the working mass in the tube |
| BM_60 | 60 cm temperature measurement point on the ground of the working mass in the tube |
| BM_90 | 90 cm temperature measurement point on the ground of the working mass in the tube |
| 10_-50 | Temperature measurement point 50 cm deep in the soil at 10 cm from the tube horizontally |
| 10_-30 | Temperature measurement point 30 cm deep in the soil at 10 cm from the tube horizontally |
| 10_-10 | Temperature measurement point 10 cm deep in the soil at 10 cm from the tube horizontally |
| 20_-50 | Temperature measurement point 50 cm deep in the soil at 20 cm from the tube horizontally |
| 20_-30 | Temperature measurement point 30 cm deep in the soil at 20 cm from the tube horizontally |
| 20_-10 | Temperature measurement point 10 cm deep in the soil at 20 cm from the tube horizontally |
| 30_-50 | Temperature measurement point 50 cm deep in the soil at 30 cm from the tube horizontally |
| 30_-30 | Temperature measurement point 30 cm deep in the soil at 30 cm from the tube horizontally |
| 30_-10 | Temperature measurement point 10 cm deep in the soil at 30 cm from the tube horizontally |
| Ca | Air constant pressure specific heat capacity, kJ/(kg·k) |
| Va | Volume of air in the shed, m3 |
| Qa-s | Heat exchange between air and soil surface, W |
| Qa-c | Heat exchange of air through the film, W |
| Qrd-a | Air receives heat from solar radiation, W |
| Qa-q | Heat exchange of air through heat exchanger tube, W |
| Cs | Soil specific heat capacity, kJ/(kg·k) |
| As | Soil area of greenhouse, m2 |
| ds{m,m +1} | Soil depth, m |
| ds{0,1} | Distance from the surface to the first layer, depth 0 cm to 10 cm section, m |
| ds{1,2} | The distance from the first layer to the second layer, the depth of 10 cm to 30 cm section, m |
| ds{2,3} | The distance from the second layer to the third layer, the depth of 30 cm to 50 cm section, m |
| Qs{m,m +1} | Energy transfer between soil depth layer m and layer m + 1, W |
| Qq-s | Heat exchange between buried part of heat exchanger tube and soil, W |
| Cq | Specific heat capacity of heat exchanger tube material, kJ/(kg·k) |
| Acq | Heat exchanger tube cross-sectional area, m2 |
| dq | Heat exchanger tube length, m |
| Qrd-q | Heat exchanger tube surface absorbs solar radiation for heat exchange, W |
| Qq-n | The heat accumulated in the heat exchanger tube by the filling mass, W |
| Cn | Specific heat capacity of the working material in the heat exchanger tube, W |
| Vn | Volume of working mass in heat exchanger tube, m3 |
| ΔTn | Temperature difference of the thermal storage mass, °C |
| mn | Quality of filler material, kg |
| h | Phase change latent heat value, kJ/kg |
| Tn | Regional phase-change material temperature, °C |
| T′n | Phase change interval upper temperature, °C |
| Greek symbols | |
| ρa | Air density in the greenhouse, kg/m3 |
| ρs | Soil sensity, kg/m3 |
| ρq | Heat exchanger tube density, kg/m3 |
| ρn | Density of the working mass in the heat exchanger tube, kg/m3 |
| Abbreviations | |
| ASHS | Active solar heating system |
| CSG | Chinese solar greenhouse |
| PCM | Phase-change materials |
References
- Özçelep, Y.; Bekdaş, G.; Apak, S. Meeting the electricity demand for the heating of greenhouses with hydrogen: Solar photovoltaic-hydrogen-heat pump system application in turkey. Int. J. Hydrogren Energy 2022, 48, 2510–2517. [Google Scholar] [CrossRef]
- Villagran, E.; Bojacá, C.; Akrami, M. Contribution to the Sustainability of Agricultural Production in Greenhouses Built on Slope Soils: A Numerical Study of the Microclimatic Behavior of a Typical Colombian Structure. Sustainability 2021, 13, 4748. [Google Scholar] [CrossRef]
- Miller, A.; Langenhoven, P.; Nemali, K. Maximizing productivity of greenhouse-grown hydroponic lettuce during winter. HortScience 2020, 55, 1963–1969. [Google Scholar] [CrossRef]
- Davies, P.A.; Zaragoza, G. Ideal performance of a self-cooling greenhouse. Appl. Therm. Eng. 2019, 149, 502–511. [Google Scholar] [CrossRef]
- Fatnassi, H.; Poncet, C.; Bazzano, M.M.; Brun, R.; Bertin, N. A numerical simulation of the photovoltaic greenhouse microclimate. Sol. Energy 2016, 120, 575–584. [Google Scholar] [CrossRef]
- Barbera, E.; Sforza, E.; Vecchiato, L.; Bertucco, A. Energy and economic analysis of microalgae cultivation in a photovoltaic-assisted greenhouse: Scenedesmus obliquus as a case study. Energy 2017, 140, 116–124. [Google Scholar] [CrossRef]
- Zhang, M.; Yan, T.; Wang, W.; Jia, X.; Wang, J.; Kleme, J.J. Energy-saving design and control strategy towards modern sustainable greenhouse: A review. Renew. Sust. Energy Rev. 2022, 164, 112602. [Google Scholar] [CrossRef]
- Yano, A.; Cossu, M. Energy sustainable greenhouse crop cultivation using photovoltaic technologies. Renew. Sust. Energy Rev. 2019, 109, 116–137. [Google Scholar] [CrossRef]
- Shen, Y.; Wei, R.; Xu, L. Energy Consumption Prediction of a Greenhouse and Optimization of Daily Average Temperature. Energies 2018, 11, 65. [Google Scholar] [CrossRef]
- Kumar, M.; Haillot, D.; Gibout, S. Survey and evaluation of solar technologies for agricultural greenhouse application. Sol. Energy 2022, 232, 18–34. [Google Scholar] [CrossRef]
- Ahamed, M.S.; Guo, H.; Tanino, K.K. Energy saving techniques for reducing the heating cost of conventional greenhouses. Biosyst. Eng. 2019, 178, 9–33. [Google Scholar] [CrossRef]
- Arinze, E.A.; Schoenau, G.J.; Besant, R.W. Thermal performance evaluation of active and passive water heat-storage schemes for solar energy applications. Energy 1985, 10, 1215–1223. [Google Scholar] [CrossRef]
- Mohammadi, S.; Khalife, E.; Kaveh, M.; Sayyah, A.H.A.; Nikbakht, A.M.; Szymanek, M.; Dziwulski, J. Comparison of Optimized and Conventional Models of Passive Solar Greenhouse—Case Study: The Indoor Air Temperature, Irradiation, and Energy Demand. Energies 2021, 14, 5369. [Google Scholar] [CrossRef]
- Zhang, X.; Lv, J.; Dawuda, M.M.; Xie, J.; Yu, J.; Gan, Y.; Zhang, J.; Tang, Z.; Li, J. Innovative passive heat-storage walls improve thermal performance and energy efficiency in chinese solar greenhouses for non-arable lands. Sol. Energy 2019, 190, 561–575. [Google Scholar] [CrossRef]
- Chen, C.; Ling, H.; Zhai, Z.J.; Li, Y.; Yang, F.; Han, F.; Wei, S. Thermal performance of an active-passive ventilation wall with phase change material in solar greenhouses. Appl. Energy 2018, 216, 602–612. [Google Scholar] [CrossRef]
- Hu, Y.; Miao, L.; Song, L.; Li, C.; Xiao, J.; Wang, H.; Cao, Y.; Sun, G.; Li, J. Active solar collector located on roof ridge assisted Chinese solar greenhouse for thermal environment enhancement. Energy Sources Part A Recovery Util. Environ. Eff. 2022, 44, 8959–8979. [Google Scholar] [CrossRef]
- Xia, T.; Li, Y.; Sun, Z.; Wan, X.; Sun, D.; Wang, L.; Liu, X.; Li, T. Performance study of an active solar water curtain heating system for Chinese solar greenhouse heating in high latitudes regions. Appl. Energy 2023, 332, 120548. [Google Scholar] [CrossRef]
- Zhou, S.; Zhang, Y.; Yang, Q.; Cheng, R.; Fang, H.; Ke, X.; Lu, W.; Zhou, B. Performance of active heat storage-release unit assisted with a heat pump in a new type of Chinese solar greenhouse. Appl. Eng. Agric. 2016, 32, 641–650. [Google Scholar] [CrossRef]
- Zong, C.; Xiao, Z.; Song, W.; Wang, P.; Zhang, G.; Li, M. Performances of an air thermal energy utilization system developed with fan-coil units in large-scale plastic tunnels covered with external blanket. Int. J. Agric. Biol. Eng. 2022, 15, 56–62. [Google Scholar] [CrossRef]
- Bansal, N.K.; Goyal, I.C. An experimental and theoretical study of a plastic film solar greenhouse. Energy Conv. Manag. 1987, 27, 395–400. [Google Scholar] [CrossRef]
- Gourdo, L.; Fatnassi, H.; Tiskatine, R.; Wifaya, A.; Demrati, H.; Aharoune, A. Solar energy storing rock-bed to heat an agricultural greenhouse. Energy 2019, 169, 206–212. [Google Scholar] [CrossRef]
- Bazgaou, A.; Fatnassi, H.; Bouharroud, R.; Elame, F.; Ezzaeri, K.; Gourdo, L.; Wifaya, A.; Demrati, H.; Tiskatine, R.; Bekkaoui, A.; et al. Performance assessment of combining rock-bed thermal energy storage and water filled passive solar sleeves for heating canarian greenhouse. Sol. Energy 2020, 198, 8–24. [Google Scholar] [CrossRef]
- Guan, Y.; Chen, C.; Han, Y.; Ling, H.; Yan, Q. Experimental and modelling analysis of a three-layer wall with phase-change thermal storage in a chinese solar greenhouse. J. Build Phys. 2015, 38, 548–559. [Google Scholar] [CrossRef]
- Pankaew, P.; Aumporn, O.; Janjai, S.; Pattarapanitchai, S.; Sangsan, M.; Bala, B.K. Performance of a large-scale greenhouse solar dryer integrated with phase change material thermal storage system for drying of chili. Int. J. Green Energy 2020, 17, 632–643. [Google Scholar] [CrossRef]
- Benli, H.; Durmus, A. Performance analysis of a latent heat storage system with phase change material for new designed solar collectors in greenhouse heating. Sol. Energy 2009, 83, 2109–2119. [Google Scholar] [CrossRef]
- Kürklü, A. Energy storage applications in greenhouses by means of phase change materials (PCMs): A review. Renew. Energy 1998, 13, 89–103. [Google Scholar] [CrossRef]
- Zhang, X.; Zhou, J.; Fu, W.; Chen, L. Research on materials of solar selective absorption coating based on the first principle. Open Phys. 2021, 19, 477–485. [Google Scholar] [CrossRef]
- Ravanji, A.; Rajabi Zargarabadi, M. Effects of pin–fin shape on heat transfer, flow behavior and pressure loss in a swirl tube. Exp. Tech. 2023, 47, 153–166. [Google Scholar] [CrossRef]
- Bose, J.R.; Manova, S.; Angeline, A.A.; Asirvatham, L.G.; Gautam, S. Numerical Study on the Heat Transfer Characteristics of Cu-Water and TiO2-Water Nanofluid in a Circular Horizontal Tube. Energies 2023, 16, 1449. [Google Scholar] [CrossRef]
- Zheng, L.; Xie, Y.; Zhang, D. Numerical investigation on heat transfer performance and flow characteristics in circular tubes with dimpled twisted tapes using Al2O3-water nanofluid. Int. J. Heat Mass Transf. 2017, 111, 962–981. [Google Scholar] [CrossRef]
Disclaimer/Publisher’s Note: The statements, opinions and data contained in all publications are solely those of the individual author(s) and contributor(s) and not of MDPI and/or the editor(s). MDPI and/or the editor(s) disclaim responsibility for any injury to people or property resulting from any ideas, methods, instructions or products referred to in the content. |
© 2023 by the authors. Licensee MDPI, Basel, Switzerland. This article is an open access article distributed under the terms and conditions of the Creative Commons Attribution (CC BY) license (https://creativecommons.org/licenses/by/4.0/).