Abstract
Due to the depletion of fossil fuels, cost-effective and efficient alternate energy resources are a major topic of research nowadays. Solar energy is one of the renewable energy sources which is under research. The main emphasis is on developing new technologies for harnessing the sun’s energy efficiently. Solar photovoltaic (PV) cells are one such technology that works on the principle of the photovoltaic effect, with the electric output generated by it being directly influenced by the amount of light reaching the surface of the cell. Identification of those parameters, which act as an obstacle between light and the solar cell surface and decrease the efficiency of the cell drastically, is necessary. This research study focuses on the environmental parameters (dust and humidity) that directly influence PV cell performance. Here, experiments were conducted by using different types of dusts (sand, soil, ash) of varying quantities and then finding their effect on PV cell output. The results clearly indicate an adverse effect of quantity of dust on performance of the solar PV cell. Moreover, the relative humidity effect on the PV cell performance was also checked, which shows significant change in efficiency for high relative humidity.
1. Introduction
Any physical activity in our world, whether by humans or nature, is caused by the flow of energy in some form. The majority of the world’s power needs are still fulfilled by fossil fuels. According to a report of the World Energy Council 2013, as of 2011, fossil fuels provided 82% of the world energy needs [1]. However, the trend is toward renewable energy, and according to the International Energy Association (IEA), as of 2019, fossils fuels fulfilled about 78.8% of the global energy requirements [2]. Many of the world’s transportation systems also depend on fossil fuels. This use of fossil fuels has increased global emissions of greenhouse gases. Therefore, changes have been made globally to reduce emissions of greenhouse gases and focus on renewable energy sources that produce zero pollution [3,4]. Most power companies and organizations are concentrating on introducing renewable energy sources to replace fossil fuels as fossil fuels create environmental issues due to emissions of particulate matter, greenhouse gas emissions, and other toxic emissions as well as facing a depletion problem. To address these issues, the scientific community continues its research on renewable and sustainable sources. Electricity generated by solar energy systems is one of these renewable energies which is free of greenhouse gases and maintains a critical position in the energy mix [5,6]. Solar light is the largest renewable energy source and can support the world’s total annual energy consumption in a single hour of radiation of the Earth [7]. It can be brought into use either through a photovoltaic (PV) system or a solar heating system [8,9].
PV modules are one of the most efficient, long-lasting, and environmentally friendly solar systems available and are significantly increasing all over the world [10,11,12]. A small percentage of the solar irradiation that strikes these modules gets converted to useful energy [13]. Only 15–20 percent of incident solar irradiation is converted to electricity in practice, while the rest becomes heat [14]. The heat then raises the solar module’s operating temperature. A low PV module temperature improves its electrical efficiency. To maintain a lower operating temperature, different strategies, including air and water cooling, are used to cool the PV module. Many numerical and experimental studies have been conducted to find the relation between photovoltaic module performance and its operating temperature, and a lot of such data are available in the literature. Researchers around the world have performed research on different types of operating parameters such as irradiation intensity, operating temperature, angle of incident radiation, cooling fluid mass flow rate, humidity, and dust [15,16,17,18]. They have varied these parameters to notice their effects on PV module performance. The output of the PV cell is higher at a low installation angle, and the ideal angle for installation of solar panel is within the range of ±20° [19]. Moreover, the glass samples with a large tilt angle generally have a higher spectral transmittance [20].
The impact of dust on the PV module performance has been studied in a variety of ways, because it is highly dependent on location and weather conditions. The average deterioration of PV module performance due to dust fouling is not uniform. In the literature, a wide variety of PV module performance loss rates has been reported. The efficiency of commercial PV panels ranges between 15 to 20%, while annual PV mean efficiency is 8.7% [21,22]. However, for different types, its efficiency varies, e.g., for amorphous silicon, it is 7–11%, while for crystalline silicon, it is 14–19% [23]. Moreover, dust deposition on PV panels greatly affects their efficiency. Cleaning them takes time and effort, which means higher maintenance expenses with lower efficiency. Said and Walwil [24] found that accumulated dust of 5 gm/m2 of PV module reduced total transmittance by 20% and spectral transmittance by 85%. PV power output decreased by 50% after six months of outside exposure in Dhahran, Saudi Arabia, but the average degradation rate of the efficiency was 7% per month [25]. In the United Arab Emirates, a ten-percent decline in PV panel output after five weeks of outside exposure has been reported [26]. A reduction of 2.78% per day of short-circuit current and a reduction in open-circuit voltage of 0.863% per day have been obtained [27]. In Qatar, a 10% drop in PV module efficiency was reported after 100 days of external exposure [28]. A 60–70% reduction in PV module power output has been observed after six months of outdoor exposure in Egypt [29]. In Sultan Qaboos University, Oman, the average percentages of energy loss in the PV system due to soiling were 9.5%, 18.2%, 31.13%, and 45.6%, after 29, 32, 72, and 98 days, respectively [30]. In Oman, the power generation dropped by 4.8%, 18.1, and 38.1% due to exposure to soil after one week, three weeks, and seven weeks, respectively [31]. These data are also presented in Table 1.

Table 1.
Exposure effect on PV module efficiency according to the region.
The degree of PV performance degradation owing to dust deposition rates has been quantified in a number of studies. For 12.5 g/m2, 25 g/m2, and 37.5 g/m2 dust density, the drop in PV module conversion efficiency was 10%, 16%, and 20%, respectively [13,32] given in Table 2. The PV output efficiency dropped from 0 to 26% as dust deposition density increased from 0 to 22 g/m2, indicating the drop in efficiency has a linear connection with dust deposition density [33]. Moreover, the dust deposition decreases with the higher air speed and higher tilt angle of the panel and thus the effect on the panel performance [34].
Table 2.
Dust quantity effect on efficiency of PV panel.
The photovoltaic module efficiency decreases as the relative humidity increases. According to E. B. Ettah, at low percentages of relative humidity, the PV modules showed high efficiency [35]. Touati and Al-Hitmi have shown that efficiency decreases as relative humidity increases [36]. Katkar and his group found that the efficiencies of solar cells were 9.7% and 12.04% at a relative humidity of 60% and 48%, respectively [37].
The electrical efficiency of mono-crystalline, polycrystalline, and amorphous silicon modules were examined experimentally by Ugwuoke and Okeke [38]. At an irradiance of 600 W/m2, they attained maximum efficiencies of 12.97%, 9.67%, and 4.94% for mono-crystalline, polycrystalline, and amorphous silicon modules, respectively, which are also shown in Table 3. At a 1000 W/m2 irradiance, the mono-crystalline, polycrystalline, and amorphous silicon PV modules’ efficiency declined to 9.61 percent, 7.65 percent, and 3.62 percent, respectively. Recently Sattar et al. [39] worked on the optimization of cooling systems for hybrid solar panels. Their results showed that a multi-pass duct with 31 passes delivered a maximum power output of 186.713 W at a mass flow rate of 0.14 kg/s. Moreover, the maximum cell temperature achieved for the configuration was 38.810 °C at a velocity of 0.092 m/s.
Table 3.
PV module type effect on its performance.
The degradation of PV performance owing to the deposition and buildup of several pollutant types has been investigated in this work. Experiments on the impact of air pollutants such as red dirt, ash, and silica sand on the generated power are carried out and examined. The findings reveal that the reduction in PV voltage and power was greatly influenced by the type of pollutants and the amount of deposition. In comparison to the other dust pollutants, the results suggest that the ash pollutant has the greatest impact on PV module performance.
2. Experimental Setup
Solar panels usually consist of 5 layers including tempered glass, encapsulant ethylene vinyl acetate (EVA), solar cells, encapsulant EVA at the back of the cells, and the back sheet, which are given in Figure 1 [40]. Meanwhile, the environmental factors such as dust and humidity generate extra layers. In this research, the effect of these factors on the performance of the panel is determined.
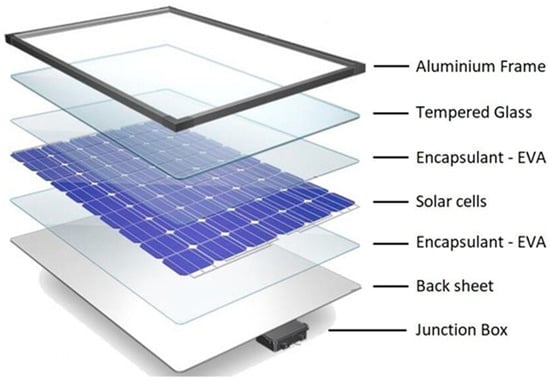
Figure 1.
Solar PV panel various layers.
The flow chart of this research study is shown in Figure 2. In this study, first, the performance of the clean solar PV panel is determined in step 1. Then, the humidity and dust effect on the PV panel is measured presented as step 2 in below figure, and a comparison is drawn between them in 3 and concluded in 4.
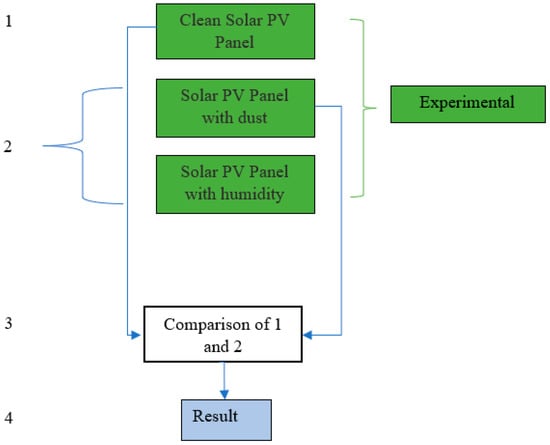
Figure 2.
Flow chart of complete procedure.
To carry out any research study, the setup for the experiment, or some software in case of numerical study, is needed. As this is an experimental study, the setup is shown in Figure 3. It comprised a solar PV panel of 40 watts, a solar simulator, a cooling fan, a control unit, and other experimental instruments. The solar panel module is of poly-crystalline silicon cells with a total panel area of 0.4131 m2. Here, the conditions are ideal with no dust.
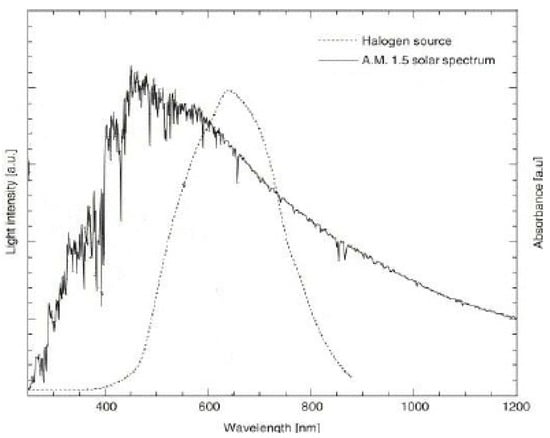
Figure 3.
Spectrum of sunlight and halogen light.
The simplest way of solar cell testing is to assess its performance outdoors on a clear sunny day, normally between 11.00 am and 3.00 pm. Although this is relatively cheap and straightforward, it is very time consuming. There is also the problem of lack of repeatability because of changing input parameters such as solar intensity, ambient temperature, and wind velocity. It is a common practice to characterize solar cells according to their performance, i.e., efficiency, power, etc. Measuring solar cells’ performance requires a stable light source that closely matches the conditions of sunlight. Not only the intensity but also the spectrum must be matched to a standard. In locations where there is little cloud, the use of direct sun radiation is a good solution, but if variations in atmospheric conditions exist, then correction is required to compare measurements over time. The spectrum also changes throughout the day, thus limiting the time for testing. So, a proper solar simulator device is required to conduct experiments for evaluating the performance of solar cells under controlled conditions. Different solar simulators can be designed to operate under controlled conditions of temperature, humidity, ventilation, and irradiation intensity. For irradiation needs, the selection of a proper light source also depends upon the availability, wattage, aging factor, etc. According to K. Emery [41], the ideal solar simulator should have the following features: a spatial non-uniformity in and several centimeters above the test plane of less than +1%, a variation in total irradiance with time of less than +1%, and be filtered for a given reference spectrum to have a spectral mismatch error of less than 1%. These requirements are essential in obtaining an accuracy of better than 2% in efficiency measurements. Various lamps can be proposed for the design of solar simulator including a xenon arc lamp, tungsten halogen lamp, metal halide lamp, and LED lamp. However, these selections should be based on the light source and match the sunlight, as the total power emitted from the sun is composed not of a single wavelength but of many wavelengths and therefore appears white or yellow to the human eye. The sun provides 1.4 × 10⁵ TW power as received on the surface of the Earth, and about 3.6 × 10⁴ TW of this power is usable [42]. The spectral distribution of the halogen and sun radiation [43] is shown in Figure 3. From the figure, it is clear that halogen is best suited in the range of 500 to 750 W/m2. Natural sunlight has a color temperature of approximately 5600 K, whereas halogen lamps radiate at a black-body temperature of about 3200 K, and as a result, they radiate weaker in the shorter wavelengths (blue and UV portion) but stronger in the infrared portion [44], which make them widely used as the infrared light source in multi-source solar simulators and the solar simulators with less spectrum requirements, such as the solar simulator for collector testing [45]. The majority of the emitted energy (up to 85 percent) lies in the infrared and near-infrared regions of the spectrum, with 15–20 percent falling into the visible (400 to 700 nm), and less than 1 percent in the ultraviolet wavelengths (below 400 nm) [46].
The solar simulator containing halogen bulbs as shown in Figure 4 was used to simulate sunlight as these halogen bulbs are high-powered lights and cause a rise in temperature very rapidly. This temperature needs to be maintained, controlled, and constant. The cooling fan was used to regulate the simulator inside temperature. The control unit consists of light regulators and power supply source to control the light intensity according to the test requirements. The experimental instruments consist of a pyranometer, a humidifier, a digital weight scale, and two thermocouples. The pyranometer TES-1333 was used for measuring the incident solar radiation on the panel. The digital ultrasonic humidifier SU-3600, was used to measure the percent relative humidity of the testing space and generating the required humidity according to the test requirements. A high-precision strain gauge sensor digital weight scale was used to find out the weight of pollutant before spreading it evenly on the panel. Two thermocouples, one to measure the outside (ambient) temperature and the other one placed on the panel to measure the panel surface temperature, were used.
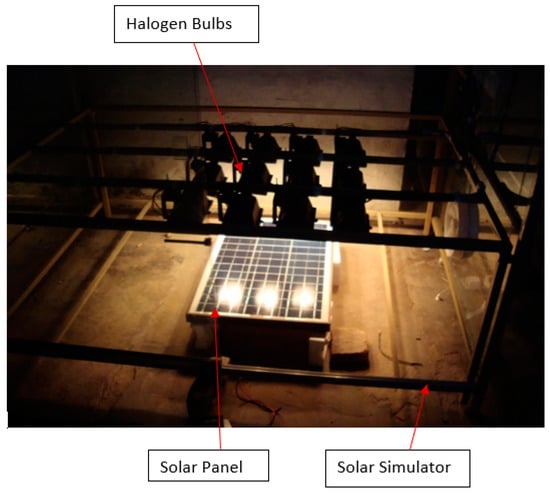
Figure 4.
Solar simulator.
The solar simulator comprised 12 halogens bulbs each with a power of 500 W, and the total capacity was 12 × 500 = 6000 W. Halogen bulbs provide radiation that can match solar light easily [47,48] and provide an outdoor environment in the laboratory. The setup was designed for 21 bulbs to have flexibility and to adjust the number of bulbs whenever needed. Each bulb was connected to a regulator to vary the intensity. In order to minimize the unevenness on the PV module, the bulbs were installed in a manner so that they can be moved in any direction. The bulbs were adjusted in such a way to avoid shadows on the solar panels. To overcome the heat produced by the light, a cooling fan was installed to lower the simulator inside temperature. The simulator was enclosed by glass from the sides and a plastic sheet at the top to provide an insulated condition that was required for the experiments and prevent the effects of the outdoor environment. Moreover, it was also needed to provide the required humidity ranges for the relative-humidity tests.
2.1. Testing for Dust
Different tests were conducted on the solar panel under different testing conditions, i.e., both the clean panel and the panel with dust shown in Figure 5 and humidity on it. All the parameters were tested separately and then combined, and the results were collected. Initially, the dust was placed on the solar panel. In Khyber Pakhtunkhwa region, the dust usually consists of soil, sand, along with small proportion of ash. The amount of dust was 72.6 gm/m2 and 121 gm/m2. The dust had ash, sand, and soil. These tests were conducted both for the constituents alone and of their mixture in various proportions such as for the soil main component in 72.6 gm/m2 consisting of 48.4 gm/m2 soil with the remainder in equal amount. However, for 121 gm/m2, the soil is 72.6 gm/m2, with others in equal amount per unit area. The composition of the three was varied with every test, and that is why we had to conduct a number of tests to get accurate results. The intensities used were 500 W/m2, 600 W/m2, and 700 W/m2. The intensity was first fixed to 500 W/m2, and the clean panel was tested at this intensity. Then, dust of different compositions and weights was placed on the panel and the output measured with the help of a digital multimeter. The output was obtained in the form of the short-circuit current (I) and voltage (V). In the quantity of dust, the composition of ash, soil, and sand was varied each time. In this way, a large number of test results were obtained.
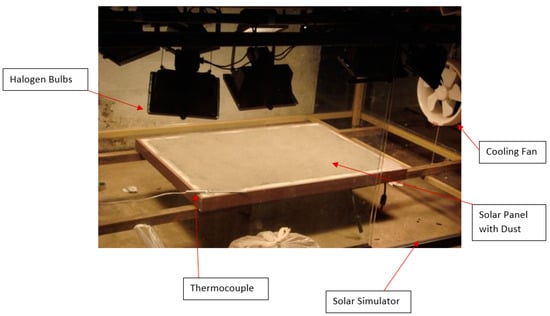
Figure 5.
Testing apparatus showing even distribution of dust on the PV panel.
Similarly, with the intensity fixed at 600 W/m2, all the tests were repeated with different compositions of dust. The results obtained at this intensity had a difference from the ones obtained at 500 W/m2. The procedure was again repeated for 700 W/m2.
2.2. Testing for Humidity
The humidity was used as another parameter, while the light intensities remain the same as in the case of dust at 500 W/m2, 600 W/m2, and 700 W/m2 with clean panels. A digital ultrasonic humidifier of model SU-3600 with humidistat was used to regulate the humidity inside the solar simulator. One of the reasons for using this humidifier is that it has inbuilt humidity-monitoring and -controlling sensor which measures relative humidity of the space. Different tests under different relative humidities were conducted. At the start of each experiment, the ambient humidity was measured by the humidity sensor installed in the humidifier and the panel’s voltage and current output were noted at ambient humidity. The setup is shown in Figure 6.
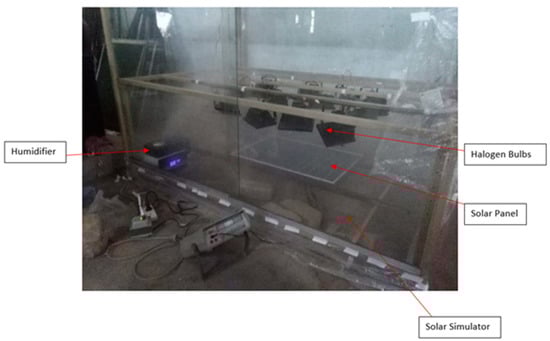
Figure 6.
Testing apparatus showing even distribution of humidity inside.
As the relative humidity in most regions is in the range of 30% to 70%, tests were conducted at a relative humidity of 30%, 40%, 45%, 50%, 55%, 60%, and 65% for each level of radiation intensity. Once the humidity reached the set level, readings were taken with the help of digital multimeter.
3. Results and Discussions
The parameters used to characterize the output of solar cells in standard solar irradiance consist of the open-circuit voltage, short-circuit current, fill factor FF, characteristic resistance, photon flux, and solar cell efficiency [49].
Two outputs, current and voltage, were collected, and from them, power and efficiency were obtained through different formulas. Our main objective was to find the effect of the parameters on the solar PV cells by comparing the efficiency. As mentioned earlier, the main constituents of the dust were sand, soil, and ash. I and V were measured with the help of a digital multimeter, while the power and efficiency were found by using the following formulas. However, the most extractable voltage [50,51] is
where K is the Boltzmann constant, T is the absolute temperature, and q is the electric charge. Jsc is the short-circuit current density approximately equal to photo-generated current density Jph. Reverse saturation current density J0 is a measurement of the minority carrier leakage (or recombination) through the p–n junction in reverse bias. Due to the fact that this leakage is brought on by carrier recombination in the neutral areas on either side of the junction, J0 is principally responsible for determining the value of Voc in solar cells. J0 is highly sensitive to temperature changes because of thermal generation of minority carriers. The equation for determination of J0 [50] is
where ni is the intrinsic carrier density, NA is the density of acceptor atoms and ND is the density of donor atoms, Dn and Dp are the diffusion constants of minority carriers in the p–n junction, and Ln and Lp are diffusion lengths of minority carriers in n and p regions, respectively. As from the equation, J0 is proportional to square of ni,
Nc is effective density of state in conduction band, Nv is effective density of state in valence band, and Eg is the band gap of the semiconductor. The voltage and current is measured by a device directly, then power is calculated from it by the following equation.
Power of panel:
where “P” is the panel output power, “I” is the panel output current, while “V” is the output panel voltage.
Efficiency of panel:
The efficiency of the solar panel is very crucial for measuring panel performance and is calculated through the equation
where E is the intensity of light in W/m2, and A is the cross-sectional area in square meters.
The efficiency decrease compared to clean panel is
The data sheet of the manufacturer of the employed electronic load states that the uncertainty for current and voltage measurement is only 0.2%. The overall uncertainty, however, also depends on the irradiance, particularly at low light intensities, and the spectral makeup of the light, both of which are exceedingly challenging to measure at the test site. As a result, the measured data’s standard deviations were calculated as a measure of uncertainty. Within 0.1–0.6%, the computed standard deviation for the power output data was obtained.
3.1. Photovoltaic Panel Performance with Variety of Dusts
The results for dust were carried out with 72.6 gm/m2 and 121 gm/m2, with the composition of the constituents changed each time. Here, there were three main cases, i.e., in case 1 solar panel performance was determined under the light intensity of 500 W/m2, while for case 2, the light irradiation was 600 W/m2, and in case 3, it was 700 W/m2.
3.1.1. Case 1
The performance of PV module was determined under various conditions because of dust. Dust such as sand, soil, and ash as well as its mixtures in a quantity of 72.6 gm/m2 are dispersed evenly on panel, and their individual effect is noted. The results are presented in Figure 7. From the bar chart, it is clear that sand has the lowest effect on PV performance, while the ash dust has the greatest effect. For the mixture, total quantity dispersed was still 72.6 gm/m2, but all types of pollutants were mixed, making one of pollutant type the main constituent by mixing a large amount of that constituent such as two-thirds of the weight, with the remainder in the same proportion or mixing all in the same ratio.
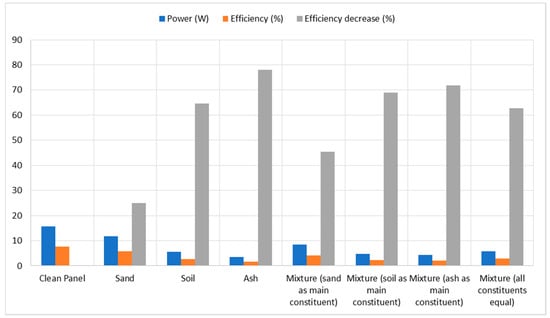
Figure 7.
Panel power, efficiency, and efficiency decrease for 500 W/m2 and 72.6 gm/m2 of dust.
Similarly, 121 gm/m2 of each pollutant was dispersed on the panel, and their individual effect is noted. The results obtained for 121 gm/m2 dust given in Figure 8 shows that the power and efficiency were affected much more when the quantity increased. As a mixture, the total distributed amount remains 121 gm/m2, in which all kinds of pollutants are mixed in equal proportion, or one component is mixed in large quantities and considered the main component of the dust.
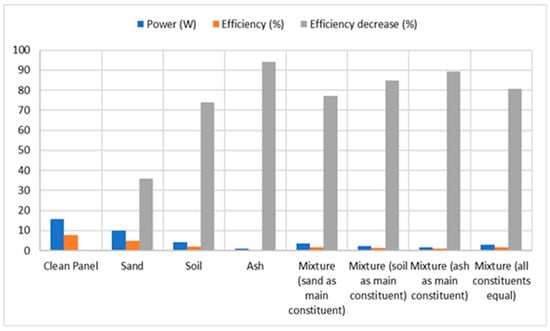
Figure 8.
Panel power, efficiency, and efficiency decrease for 500 W/m2 and 121 gm/m2 of dust.
Figure 7 and Figure 8 show that the power and efficiency decrease as the quantity of dust increases. From these figures, the power drops from 11.7 W to 10 W, and efficiency drops from 25% to 35.9%, which is approximately 10% higher than from 72.6 gm/m2 sand as dust. In the case of soil, the efficiency drop for 72.6 gm/m2 is 64.6%, while for 121 gm/m2, it is 74%. Similarly, for ash, the decrease in efficiency is at a maximum compared to all others, which is 78 and 94.3% for 72.6 gm/m2 and 121 gm/m2, respectively. For mixtures of the above, three results are shown in Figure 7 and Figure 8. For sand as the main constituent of the mixture, the output of the panel was less than that of sand deposited on the panel while more than that of other dust. In the case of soil and ash as a main constituent of the mixture, the output was comparable to the respective dusts.
3.1.2. Case 2
The methods were all the same as for 500 W/m2 intensity, but only the intensity was increased from 500 W/m2 to 600 W/m2. From Figure 9, it is evident that under 72.6 gm/m2 of various dusts, the sand has the lowest effect. The power drop observed was 1.8 W, while its efficiency dropped 10%. For soil, the drop in power was approximately 7 W, and the efficiency drop was 40%. However, in the case of ash as dust, the power decreased by 12.5 W.
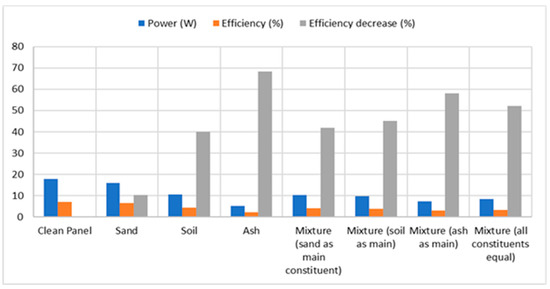
Figure 9.
Panel power, efficiency, and efficiency decrease for 600 W/m2 and 72.6 gm/m2 of dust.
Similarly, when the dust deposition on the panel reaches 121 gm/m2, shown in Figure 10, the pattern of effect on the power of panel was the same as in the case of 72.6 gm/m2 dust but greater in quantity. For sand, the power decrease was about 3.3 W, while for soil, the drop in power and efficiency decrease were 13 W and 73.3%, respectively. In the case of ash as dust, the power decreased by approximately 15 W, while its efficiency decreased to 89%.
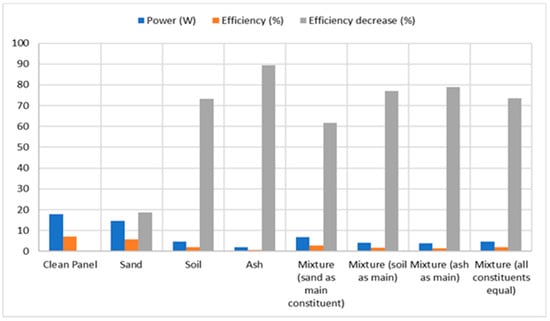
Figure 10.
Panel power, efficiency, and efficiency decrease for 600 W/m2 and 121 gm/m2 of dust.
Figure 9 and Figure 10 show that the power dropped from 16 W to 14.52 W and efficiency decreased from 10.4% to 18.6% while using sand as dust of 72.6 gm/m2 and 121 gm/m2. In the case of soil, the efficiency decrease for 72.6 gm/m2 is 40.12%, while for 121 gm/m2, it is 73.3%. Similarly, for ash, the drop in power is at a maximum compared to all others, which is 68.25% and 89.35% for 72.6 gm/m2 and 121 gm/m2, respectively. Mixtures of the above three results are shown in Figure 9 and Figure 10, which show that in the case of ash as the main constituent, the drop is higher. When using mixture of the above as dust while sand as the main constituent, the power of 6.81 was obtained, which is less than in the case of sand while greater than that of ash and soil. However, for the mixture in which soil and ash were the main constituent, the output is comparable to that of soil and ash respectively. These results show that in the case of 600 W/m2, the effect of dust is less than that in the case of 500 W/m2.
3.1.3. Case 3
When the light intensity increases to 700 W/m2 while using 72.6 gm/m2 of dust, the same pattern is found as in cases of other light intensities shown in Figure 11. In the deposition of sand on the panel, the effect was lowest, while for ash, the effect was highest. For the clean panel, the power output was 21.37 W, but due to accumulation of sand as dust, the power dropped by approximately 3.6 W. Now, when we checked the soil deposited on the panel, the power output observed was 11.9, and the drop was about 10.6 W. However, due to ash as dust, the power dropped drastically while giving 6.27 W output.
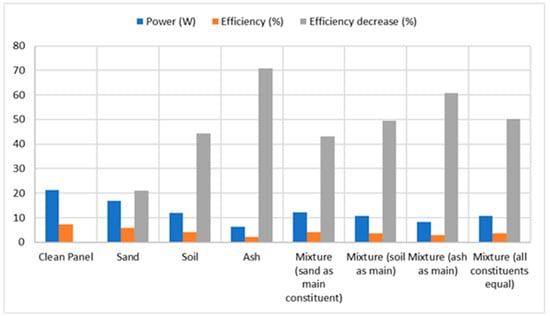
Figure 11.
Panel power, efficiency, and efficiency decrease for 700 W/m2 and 72.6 gm/m2 of dust.
Similarly, the panel performance checked on the dust deposition of 121 gm/m2 shown in Figure 12. The trend of the drops behaves the same as in the case of 72.6 gm/m2 but higher in quantity. For sand, the power output is 15.4, and its efficiency is 5.32%, while the decrease in efficiency is about 28%. For soil, the power measured about 5.08 W, which dropped approximately by 16.3 W. However, the drop in power was highest for ash, which is about 18.47 W, and the efficiency of panel is 1%. From Figure 11 and Figure 12, it is clear that for the mixture with sand as the main constituent, the power is less than that of pure sand and more than that of pure soil as dust, while for soil and ash as the main constituents, comparable to that of soil and ash, respectively.
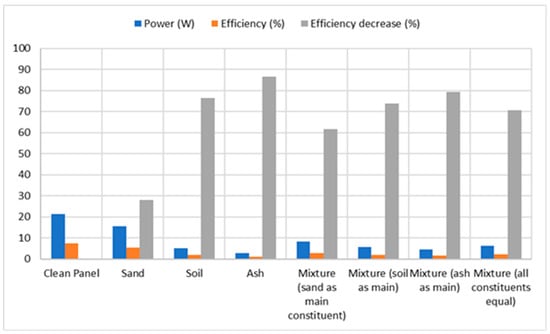
Figure 12.
Panel power, efficiency, and efficiency decrease for 700 W/m2 and 121 gm/m2 of dust.
From Figure 11 and Figure 12, the power drops from 16.9 W to 15.4 W, and efficiency dropped from 21% to 27.95% when increasing sand quantity from 72.6 gm/m2 to 121 gm/m2. In the case of soil, the efficiency drop for 72.6 gm/m2 is 44.4%, while for 121 gm/m2, it is 76.26%. Similarly, for ash, the drop is at a maximum compared to all others, which is 70.7 and 86.5 for 72.6 gm/m2 and 121 gm/m2, respectively.
Moreover, from Figure 13 and Figure 14, it is evident that the output power for irradiance of 700 W/m2 in cases of any dust type is higher than that of 500 W/m2 and 600 W/m2. On the other side, the highest drop in power was found in the case of ash as dust on the panel, then soil and sand consecutively. Table 4 summarizes the performance under the various dust types and their amounts.
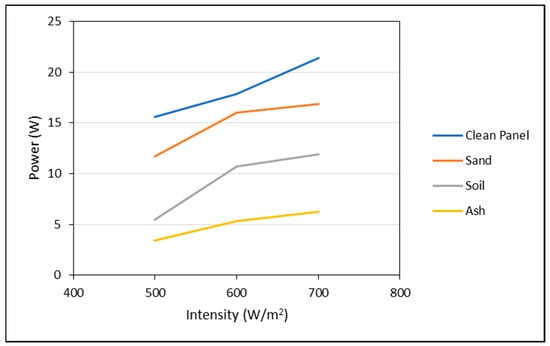
Figure 13.
Panel power output vs. intensity at 72.6 gm/m2 of dust.
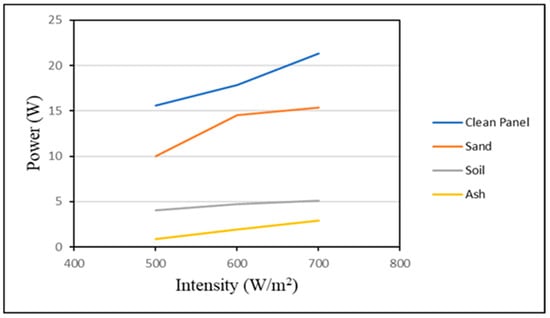
Figure 14.
Panel power output vs. intensity at 121 gm/m2 of dust.
Table 4.
Data of dusts along with photovoltaic module output.
3.2. Photovoltaic Panel Performance under Various Humidities
The main objective of this test was to find out quantitatively the effect of various relative humidities on the panel’s performance and then to compare them with each other against different intensities. The experimental setup shown in Figure 6 was used for the relative-humidity tests.
These tests were performed by providing relative humidity in the simulator through the humidifier and then testing the panel output. The results were collected at the three different light intensity levels that were used throughout the testing, i.e., 500 W/m2, 600 W/m2, and 700 W/m2 and are given in Figure 15 and Figure 16. These graphs specify the relationship between various humidities in which the panel is placed under the light for different intensities and the panel output obtained.
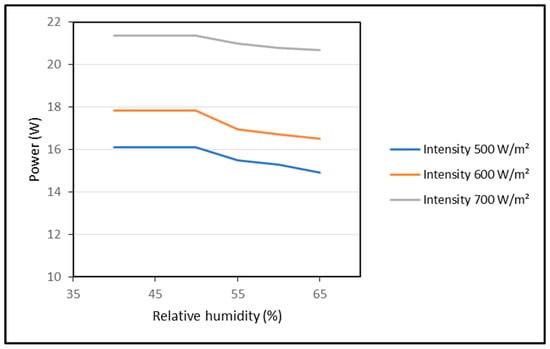
Figure 15.
Relative humidity vs. panel output power.
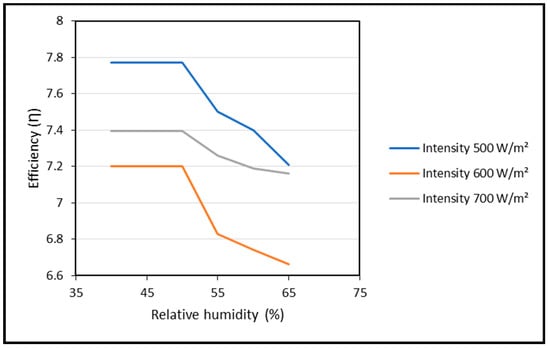
Figure 16.
Relative humidity vs. panel efficiency.
As from Figure 15 and Figure 16, as the humidity increases, the panel output power decreases. In Table 5, it is given that at an intensity of 500 W/m2, the power decreased from 16.06 W to 14.9 W, that is 1.16 W. Meanwhile, at the intensity of at 600 W/m2, the highest drop in efficiency was 7.5%, and the power drop from 17.84 to 16.5 at 40% and 65% relative humidity, respectively, and are given in Table 6; however, at 700 W/m2, the power of the panel decreased from 21.38 to 20.7, which is 0.68 W, and is given in Table 7. So, increasing the intensity of light undermines the effect of humidity on the panel’s output, but at low light intensity, the humidity affects the performance. The effect on efficiency drop is visible in the range of 55% to 65% relative humidity from all three irradiation intensities and presented in Table 8.
Table 5.
Humidity test results for 500 W/m2.
Table 6.
Humidity test results for 600 W/m2.
Table 7.
Humidity test results for 700 W/m2.
Table 8.
Humidity effects on performance.
Overall, these results suggest that dust widely affects the performance of solar modules, especially ash, whose particle size is very small and does not allow the light rays to strike the PV cells. Moreover, when the particle humidity is higher, the deposition density is higher. Furthermore, among the three forms of dust, sand has the lowest deposition density. This is due to the sand’s low surface energy and high Young’s modulus [52]. As a result, it can be inferred from this investigation that the power is minimized due to the particle size of all three types of dust and also observed by Tamadher M.A Alnasser [53]. The gravitational force, adhesion force, and rebound force all play a role in particle deposition when they collide with the surface [54].
4. Conclusions
To investigate the effect of environmental parameters such as humidity and dust on the performance of photovoltaic modules, a number of experiments were conducted. The main findings of this work are as follows:
- The experiment results clarify that the output of the panel decreases as the quantity of dust increases from 72.6 gm/m2 to 121 gm/m2. Ash has the highest effect on the panel’s output. Ash is the lightest of all and has the smallest particle size; therefore, for same weight of dust, particles of ash cover more space and completely cover the panel’s surface, thus causing a large impact.
- Sand has the lowest effect on the photovoltaic module performance among the three different dusts.
- In the case of the relative humidity, its effect was negligible up to 50%, but beyond that, a decrease in the panel’s output power and efficiency was observed. However, the drops in efficiency were inversely changed with intensity of light.
- Moreover, by comparing the current, voltage and power of clean panel at three different intensities, we found that the maximum output was obtained at an intensity of 700 W/m2. This shows that the intensity of light has a direct relation with output.
- The findings of this study can be applied by those who need to develop a PV system by taking the dust effect into account to satisfy a given load. Furthermore, the outcomes can also utilized by maintenance departments to decide how frequently module cleaning is necessary for the required performance at various irradiation intensities.
Author Contributions
A.A.S., conceptualization, formal analysis, software, investigation, and writing—original draft; N.A., methodology, software, investigation, visualization, and writing—original draft; M.S., resources, software, formal analysis, and validation; U.G., methodology, formal analysis, and proofreading original draft; U.H.S., conceptualization, visualization software, conceptualization, formal analysis, and project administration/PI. All authors have read and agreed to the published version of the manuscript.
Funding
This research received no external funding.
Data Availability Statement
Not applicable.
Acknowledgments
This work was supported by the Deanship of Graduate Studies and Research (DGSR) Program, Ajman University, United Arab Emirates.
Conflicts of Interest
The authors declare no conflict of interest.
References
- World Energy Council. World Energy Council Energy Resources: Solar; World Energy Council: London, UK, 2013; pp. 1–28. [Google Scholar]
- IEA. Key World Energy Statistics 2021; IEA: Paris, France, 2021; Available online: https://www.iea.org/reports/key-world-energy-statistics-2021 (accessed on 5 May 2023).
- Awan, A.B.; Khan, Z.A. Recent Progress in Renewable Energy–Remedy of Energy Crisis in Pakistan. Renew. Sustain. Energy Rev. 2014, 33, 236–253. [Google Scholar] [CrossRef]
- Bagdadee, A.H.; Zhang, L. Electrical Power Crisis Solution by the Developing Renewable Energy Based Power Generation Expansion. Energy Rep. 2020, 6, 480–490. [Google Scholar] [CrossRef]
- Xiong, W.; Liu, Z.; Wu, Z.; Wu, J.; Su, F.; Zhang, L. Investigation of the Effect of Inter-Building Effect on the Performance of Semi-Transparent PV Glazing System. Energy 2022, 245, 123160. [Google Scholar] [CrossRef]
- Wang, P.; Liu, Z.; Zhang, L. Sustainability of Compact Cities: A Review of Inter-Building Effect on Building Energy and Solar Energy Use. Sustain. Cities Soc. 2021, 72, 103035. [Google Scholar] [CrossRef]
- Zhu, X.-G.; Long, S.P.; Ort, D.R. What Is the Maximum Efficiency with Which Photosynthesis Can Convert Solar Energy into Biomass? Curr. Opin. Biotechnol. 2008, 19, 153–159. [Google Scholar] [CrossRef]
- Samneang, H.; Kumar, L.; Zafar, A.; Ali, M.U.; Zahid, T.; Bibi, S.; Ahmad, M.S.; Ghafoor, U.; Selvaraj, J. A Systematic Indoor and Outdoor Study of the Effect of Particle Size and Concentration of TiO2 in Improving Solar Absorption for Solar Still Application. Front. Mater. 2021, 8, 683490. [Google Scholar] [CrossRef]
- Han, S.S.; Ghafoor, U.; Saeed, T.; Elahi, H.; Masud, U.; Kumar, L.; Selvaraj, J.; Ahmad, M.S. Silicon Particles/Black Paint Coating for Performance Enhancement of Solar Absorbers. Energies 2021, 14, 7140. [Google Scholar] [CrossRef]
- Wu, Y.; Liu, Z.; Liu, J.; Xiao, H.; Liu, R.; Zhang, L. Optimal Battery Capacity of Grid-Connected PV-Battery Systems Considering Battery Degradation. Renew. Energy 2022, 181, 10–23. [Google Scholar] [CrossRef]
- Wang, C.; Huang, X.; Hu, X.; Zhao, L.; Liu, C.; Ghadimi, P. Trade Characteristics, Competition Patterns and COVID-19 Related Shock Propagation in the Global Solar Photovoltaic Cell Trade. Appl. Energy 2021, 290, 116744. [Google Scholar] [CrossRef]
- Kim, M.-H.; Kim, D.-W.; Lee, D.-W. Feasibility of Low Carbon Renewable Energy City Integrated with Hybrid Renewable Energy Systems. Energies 2021, 14, 7342. [Google Scholar] [CrossRef]
- Memiche, M.; Bouzian, C.; Benzahia, A.; Moussi, A. Effects of Dust, Soiling, Aging, and Weather Conditions on Photovoltaic System Performances in a Saharan Environment—Case Study in Algeria. Glob. Energy Interconnect. 2020, 3, 60–67. [Google Scholar] [CrossRef]
- Teo, H.G.; Lee, P.S.; Hawlader, M.N.A. An Active Cooling System for Photovoltaic Modules. Appl. Energy 2012, 90, 309–315. [Google Scholar] [CrossRef]
- Zaihidee, F.M.; Mekhilef, S.; Seyedmahmoudian, M.; Horan, B. Dust as an Unalterable Deteriorative Factor Affecting PV Panel’s Efficiency: Why and How. Renew. Sustain. Energy Rev. 2016, 65, 1267–1278. [Google Scholar] [CrossRef]
- Khodakaram-Tafti, A.; Yaghoubi, M. Experimental Study on the Effect of Dust Deposition on Photovoltaic Performance at Various Tilts in Semi-Arid Environment. Sustain. Energy Technol. Assess. 2020, 42, 100822. [Google Scholar] [CrossRef]
- Zitouni, H.; Azouzoute, A.; Hajjaj, C.; El Ydrissi, M.; Regragui, M.; Polo, J.; Oufadel, A.; Bouaichi, A.; Ghennioui, A. Experimental Investigation and Modeling of Photovoltaic Soiling Loss as a Function of Environmental Variables: A Case Study of Semi-Arid Climate. Sol. Energy Mater. Sol. Cells 2021, 221, 110874. [Google Scholar] [CrossRef]
- Santhakumari, M.; Sagar, N. A Review of the Environmental Factors Degrading the Performance of Silicon Wafer-Based Photovoltaic Modules: Failure Detection Methods and Essential Mitigation Techniques. Renew. Sustain. Energy Rev. 2019, 110, 83–100. [Google Scholar] [CrossRef]
- Jiang, Y.; Lv, M.; Sun, K. Effects of Installation Angle on the Energy Performance for Photovoltaic Cells during Airship Cruise Flight. Energy 2022, 258, 124982. [Google Scholar] [CrossRef]
- Zhao, W.; Lu, H. Self-Cleaning Performance of Super-Hydrophilic Coatings for Dust Deposition Reduction on Solar Photovoltaic Cells. Coatings 2021, 11, 1059. [Google Scholar] [CrossRef]
- Gaglia, A.G.; Lykoudis, S.; Argiriou, A.A.; Balaras, C.A.; Dialynas, E. Energy Efficiency of PV Panels under Real Outdoor Conditions—An Experimental Assessment in Athens, Greece. Renew. Energy 2017, 101, 236–243. [Google Scholar] [CrossRef]
- Stropnik, R.; Stritih, U. Increasing the Efficiency of PV Panel with the Use of PCM. Renew. Energy 2016, 97, 671–679. [Google Scholar] [CrossRef]
- King, R.R.; Bhusari, D.; Larrabee, D.; Liu, X.-Q.; Rehder, E.; Edmondson, K.; Cotal, H.; Jones, R.K.; Ermer, J.H.; Fetzer, C.M.; et al. Solar Cell Generations over 40% Efficiency. Prog. Photovolt. Res. Appl. 2012, 20, 801–815. [Google Scholar] [CrossRef]
- Said, S.A.M.; Walwil, H.M. Fundamental Studies on Dust Fouling Effects on PV Module Performance. Sol. Energy 2014, 107, 328–337. [Google Scholar] [CrossRef]
- Said, S.A.M. Effects of Dust Accumulation on Performances of Thermal and Photovoltaic Flat-Plate Collectors. Appl. Energy 1990, 37, 73–84. [Google Scholar] [CrossRef]
- Mohandes, B.M.A.; El-Chaar, L.; Lamont, L.A. Application Study of 500 W Photovoltaic (PV) System in the UAE. Appl. Sol. Energy 2009, 45, 242–247. [Google Scholar] [CrossRef]
- Ghitas, A.E.; Sabry, M. A Study of the Effect of Shadowing Location and Area on the Si Solar Cell Electrical Parameters. Vacuum 2006, 81, 475–478. [Google Scholar] [CrossRef]
- Charabi, Y.; Gastli, A. Integration of Temperature and Dust Effects in Siting Large PV Power Plant in Hot Arid Area. Renew. Energy 2013, 57, 635–644. [Google Scholar] [CrossRef]
- Elminir, H.K.; Ghitas, A.E.; Hamid, R.H.; El-Hussainy, F.; Beheary, M.M.; Abdel-Moneim, K.M. Effect of Dust on the Transparent Cover of Solar Collectors. Energy Convers. Manag. 2006, 47, 3192–3203. [Google Scholar] [CrossRef]
- Alawasa, K.M.; AlAbri, R.S.; Al-Hinai, A.S.; Albadi, M.H.; Al-Badi, A.H. Experimental Study on the Effect of Dust Deposition on a Car Park Photovoltaic System with Different Cleaning Cycles. Sustainability 2021, 13, 7636. [Google Scholar] [CrossRef]
- Al Siyabi, I.; Al Mayasi, A.; Al Shukaili, A.; Khanna, S. Effect of Soiling on Solar Photovoltaic Performance under Desert Climatic Conditions. Energies 2021, 14, 659. [Google Scholar] [CrossRef]
- Kumar, E.S.; Sarkar, B.; Behera, D.K. Soiling and Dust Impact on the Efficiency and the Maximum Power Point in the Photovoltaic Modules. Int. J. Eng. Res. Technol. 2013, 2, 1–8. [Google Scholar]
- Jiang, H.; Lu, L.; Sun, K. Experimental Investigation of the Impact of Airborne Dust Deposition on the Performance of Solar Photovoltaic (PV) Modules. Atmos. Environ. 2011, 45, 4299–4304. [Google Scholar] [CrossRef]
- Paul Ndeto, M.; Wafula Wekesa, D.; Njoka, F.; Kinyua, R. Correlating Dust Deposits with Wind Speeds and Relative Humidity to Overall Performance of Crystalline Silicon Solar Cells: An Experimental Study of Machakos County, Kenya. Sol. Energy 2022, 246, 203–215. [Google Scholar] [CrossRef]
- Ettah, E.; Udoimuk, A.B.; Obiefuna, J.N.; Opara, F.; State, R. The Effect of Relative Humidity on the Efficiency of Solar Panels in Calabar, Nigeria. Univers. J. Manag. Soc. Sci. 2012, 2, 8–11. [Google Scholar]
- Touati, F.A.; Al-Hitmi, M.A.; Bouchech, H.J. Study of the Effects of Dust, Relative Humidity, and Temperature on Solar PV Performance in Doha: Comparison between Monocrystalline and Amorphous PVS. Int. J. Green Energy 2013, 10, 680–689. [Google Scholar] [CrossRef]
- Katkar, A.A.; Shinde, N.N.; Patil, P. Performance & Evaluation of Industrial Solar Cell w.r.t. Temperature and Humidity. Int. J. Res. Mech. Eng. Technol. 2011, 1, 69–73. [Google Scholar]
- Ugwuoke, P.E.; Okeke, C.E. Performance Assessment of Three Different PV Modules as a Function of Solar Insolation in South Eastern Nigeria. Int. J. Appl. Sci. Technol. 2012, 2, 319–327. [Google Scholar]
- Sattar, M.; Rehman, A.; Ahmad, N.; Mohammad, A.; Al Ahmadi, A.A.; Ullah, N. Performance Analysis and Optimization of a Cooling System for Hybrid Solar Panels Based on Climatic Conditions of Islamabad, Pakistan. Energies 2022, 15, 6278. [Google Scholar] [CrossRef]
- Svarc, J. Solar Panel Construction. Clean Energy Review. 2020. Available online: https://www.cleanenergyreviews.info/blog/solar-panel-components-construction (accessed on 5 May 2023).
- Emery, K.; Myers, D.; Rummel, S. Solar Simulation-Problems and Solutions. In Proceedings of the Conference Record of the Twentieth IEEE Photovoltaic Specialists Conference, Las Vegas, NV, USA, 26–30 September 1988; Volume 2, pp. 1087–1091. [Google Scholar]
- Hosenuzzaman, M.; Rahim, N.A.; Selvaraj, J.; Hasanuzzaman, M.; Malek, A.B.M.A.; Nahar, A. Global Prospects, Progress, Policies, and Environmental Impact of Solar Photovoltaic Power Generation. Renew. Sustain. Energy Rev. 2015, 41, 284–297. [Google Scholar] [CrossRef]
- Kim, J.-W.; Choi, Y.-S.; Lee, K.-S.; Cho, S.-Y.; Hwang, J.-S. Analysis of Electrical Properties for Optimal Operating Conditions of Mono-Crystalline Si Solar Cell. J. Korean Inst. Electr. Electron. Mater. Eng. 2011, 24, 654–658. [Google Scholar] [CrossRef]
- Bickler, D. The Simulation of Solar Radiation. Sol. Energy 1962, 6, 64–68. [Google Scholar] [CrossRef]
- Wang, W.; Laumert, B. Simulate a ‘Sun’ for Solar Research: A Literature Review of Solar Simulator Technology; KTH Royal Institute of Technology, Heat and Power Technology, Energy Technology, School of Industrial Engineering and Management (ITM), KTH: Stockholm, Sweden, 2014. [Google Scholar]
- Michael, W. Davidson Tungsten-Halogen Incandescent Lamps; National High Magnetic Field Laboratory: Tallahassee, FL, USA, 2016; pp. 1–18. [Google Scholar]
- Li, Y.; Sun, Y.; Zhang, Y. Luminescent Solar Concentrators Performing under Different Light Conditions. Sol. Energy 2019, 188, 1248–1255. [Google Scholar] [CrossRef]
- Pasquier, A.D.; Miller, S.; Chhowalla, M. On the Use of Ga–In Eutectic and Halogen Light Source for Testing P3HT–PCBM Organic Solar Cells. Sol. Energy Mater. Sol. Cells 2006, 90, 1828–1839. [Google Scholar] [CrossRef]
- Arkan, F.; Izadyar, M. Theoretical Prediction of Voltage-Current Behavior and Other Photovoltaic Properties of Natural Flavonoid-Based Solar Cells. Sol. Energy 2021, 228, 89–99. [Google Scholar] [CrossRef]
- Cheraghizade, M.; Jamali-Sheini, F. Photovoltaic Behavior of SnS Solar Cells under Temperature Variations. Optik 2022, 254, 168635. [Google Scholar] [CrossRef]
- Singh, P.; Ravindra, N.M. Temperature Dependence of Solar Cell Performance—An Analysis. Sol. Energy Mater. Sol. Cells 2012, 101, 36–45. [Google Scholar] [CrossRef]
- Lu, H.; Cai, R.; Zhang, L.-Z.; Lu, L.; Zhang, L. Experimental Investigation on Deposition Reduction of Different Types of Dust on Solar PV Cells by Self-Cleaning Coatings. Sol. Energy 2020, 206, 365–373. [Google Scholar] [CrossRef]
- Alnasser, T.M.A.; Mahdy, A.M.J.; Abass, K.I.; Chaichan, M.T.; Kazem, H.A. Impact of Dust Ingredient on Photovoltaic Performance: An Experimental Study. Sol. Energy 2020, 195, 651–659. [Google Scholar] [CrossRef]
- Chanchangi, Y.N.; Ghosh, A.; Sundaram, S.; Mallick, T.K. Dust and PV Performance in Nigeria: A Review. Renew. Sustain. Energy Rev. 2020, 121, 109704. [Google Scholar] [CrossRef]
Disclaimer/Publisher’s Note: The statements, opinions and data contained in all publications are solely those of the individual author(s) and contributor(s) and not of MDPI and/or the editor(s). MDPI and/or the editor(s) disclaim responsibility for any injury to people or property resulting from any ideas, methods, instructions or products referred to in the content. |
© 2023 by the authors. Licensee MDPI, Basel, Switzerland. This article is an open access article distributed under the terms and conditions of the Creative Commons Attribution (CC BY) license (https://creativecommons.org/licenses/by/4.0/).