Review

Revisiting Market Power in the Polish Power System

by
Przemysław Kaszyński
1,
Aleksandra Komorowska
2,* and
Jacek Kamiński
1
1
Division of Energy Economics, Mineral and Energy Economy Research Institute of the Polish Academy of Sciences, ul. Wybickiego 7A, 31-261 Kraków, Poland
2
Division of Minerals and Energy Sustainable Development, Mineral and Energy Economy Research Institute of the Polish Academy of Sciences, ul. Wybickiego 7A, 31-261 Kraków, Poland
*
Author to whom correspondence should be addressed.
Energies 2023, 16(13), 4856; https://doi.org/10.3390/en16134856
Submission received: 18 May 2023 / Revised: 16 June 2023 / Accepted: 19 June 2023 / Published: 21 June 2023
(This article belongs to the Special Issue Prospects and Challenges of Energy Transition)

Abstract

:
The consequences of the liberalisation of electricity markets have been widely discussed in the literature emphasising the successes or failures of privatisation and deregulation. While most developed power systems have undergone a form of economic transformation, they still require to be monitored and analysed to assess market power. The Polish power system is an example wherein the potential of market power examined fifteen years ago was summarised as significant. Since then, the transformation process and changes in the ownership structure have taken place. This study focuses on the assessment of the potential of market power in the Polish electricity market. For this purpose, statistics on power companies were collected and processed. Then, structural and behavioural measures were applied, including concentration ratios, the entropy coefficient, the Gini coefficient, the Herfindahl–Hirschman Index (HHI), the Residual Supply Index (RSI), and the Lerner Index. The results reveal that, despite a dynamic increase in renewable capacity, market concentration has increased in recent years, achieving an HHI of 2020.9 in 2021. An increase in the Lerner Index of lignite and hard coal-fired units is also observed, indicating high mark-ups by the key market players. Based on quantitative analysis, policy recommendations are outlined to reduce the negative impact of market power on consumers.

1. Introduction

The liberalisation of the power industry has been conducted in several global economies since the 1990s [1]. The key assumption of liberalised markets is to provide conditions of increased competitiveness that should lead to an increase in efficiency. Energy markets, however, are unique due to the specific features of the electricity that is being traded [2]. As often emphasised, electricity is not a basic commodity whose trading is governed by the principles of classical economics [3]. Apart from maintaining constant reliability, energy markets are sensitive to policy decisions related to climate or incentives supporting individual technologies by international or local governments [4]. Nicoli and Vona [5] highlighted the fact that the liberalisation and privatisation of energy markets reduce the support for renewable energy policies, which is not desirable in the current context. Moreover, despite recent technological advances in electricity storage, the concept is not yet commercially available, and electricity demand must be directly met by the available suppliers.
Due to inelastic demand, electricity markets are extremely vulnerable to the negative consequences of market power when compared to markets of other commodities. While regulators are responsible for ensuring transparency and competitiveness as well as for protecting consumers from the negative practice of power market players, the mixed structure of ownership (large state-owned companies and small private ones) and unique features of electricity often result in negative consequences of the exercise of market power. As a result, there is a need to constantly examine and monitor the potential of market power in electricity systems to adjust policies and regulations that should mitigate the risk of the negative practices of the largest companies.
This study is conceptually based on previous research [6] that revealed that structural changes and consolidations that occurred in 1999–2008 significantly increased the potential of market power in the Polish power generation system. Since then, the power industry has undergone numerous mergers and acquisitions. The research problem addressed in this study is to revisit the Polish power system, identify the key electric power companies, and examine the current potential of market power in the system to assess the impact of system transition on concentration rates and other indices commonly used in similar studies.
A previous in-depth analysis of market power in the Polish power generation system focused on the years 1999–2008 [7]. Although the energy market has undergone numerous changes since then, including several mergers and acquisitions, there has been no study analysing the outcomes of such consolidations on market power potential with a wider perspective. As a result, there is a need to revisit the Polish power sector and reinvestigate the competitiveness of the market. The analysis should provide valuable lessons on the energy markets operating in Central and Eastern Europe, where the Polish power market is still the largest one.
With this in mind, the objectives of this paper are as follows. First, this study provides a comprehensive analysis of the Polish power system over the course of recent years, including the structural changes that have taken place and key market players. Second, it presents a comprehensive analysis of market power with the employment of appropriate indicators. Third, it compares the results with the outcomes presented in the previous study and analyses how government decisions have impacted the current competitiveness of the electricity market. Finally, it extends the academic discussion on market power issues in Central and Eastern European (CEE) countries undergoing energy transition.
This paper is structured as follows. Section 2 presents a review of the current studies on market power. Section 3 shows the methods applied in this study. The case study of the Polish power system is presented in Section 4. Section 5 provides an assessment of market power and a discussion of the results. Section 6 concludes this study and provides policy implications.

2. Literature Review

Market power is usually examined using a variety of indicators, depending on the approach. Some studies apply quantity-based indicators, whereas others employ price-based ones. Structural and behavioural measures were used by Ciarreta et al. [8] to assess competition in energy markets. The study proposed the concentration ratio, market share, Herfindahl–Hirschman Index (HHI), and Entropy coefficient as structural indices, and the Pivotal Supply Index, Residual Supply Index (RSI), and Residual Demand Elasticity as behavioural measures to examine the situation following market liberalisation in Spain. The results showed that market power decreased. It was also expected that this trend will continue in the coming years due to interventions to mitigate the risk introduced by governments.
Prabhakar Karthikeyan et al. [9] conducted a comprehensive literature review of the indices used in the assessment of market power in deregulated electricity markets. They identified the Herfindahl–Hirschman Index and Lerner Index as the most popular measures. Then, they provided the Must Run Ratio, Must-Run Share, Nodal Must-Run Share, Expected Nodal Must-Run Share, System Interchange Capacity, Location Privilege (LP)-surplus deviation index, Contribution congestion factor matrix, Variation Index, and Inverse residual demand derivative. Kvålseth [10] analysed the relationship between the other most commonly used measures, i.e., concentration ratio and Herfindahl–Hirschman Index. The results revealed that knowledge about the market shares of the largest electric power companies may provide more accurate predictions of the Herfindahl–Hirschman Index. However, the analyses carried out by Hesamzadeh et al. [11] showed that common measures to assess market power cannot be applied to meshed transmission networks. Instead, the authors propose a Transmission-Constrained Pivotal Supplier Indicator that is defined as the maximum must-run generation for any subset of generation units while allowing for the strategic operation of other facilities under the control of the same power company. Shafie-khah et al. [12] developed a model of market power to examine the behaviour of key electric power companies from the perspective of the regulator. They conclude that simulations may significantly improve the decision-making process by providing scenario-based results for different market principles considered by policymakers.
Samadi and Hajiabadi [13] evaluated the opportunity for collusion and profitability by employing a new index, the Jacobian matrix of electric power companies’ profit, while taking into account transmission constraints. The introduction of the new approach allowed one to quantify both the financial constraints and the ability to withhold the capacity of the power companies. The other new approach to assessing market power in the electricity market used social network analysis [14]. The comparison of this approach with basic power market indices (such as concentrations and share, Residual Supplier Index, and Entropy coefficient) confirms their reliability and effectiveness. In contrast, Almeida et al. [15] compared the classic market power indices (such as the Herfindahl–Hirschman Index) to the Barrier Index recently developed to identify the barriers to entry into European energy markets. The results show that the Barrier Index diverges from previous indices, has failures in methodology, and may lead to inappropriate decisions made by policymakers.
The existing literature also presents the results on market power in different countries. Loi and Jindal [16], inter alia, used market power indices in multivariate Autoregressive–Moving Average models to assess the impact of electricity market deregulation on wholesale electricity prices in Singapore. The results show that liberalisation resulted in a price drop, and a further market deregulation process will continue this downward trend. Sensoy [17] conducted a market power analysis for the Turkish Electricity Market using market share, the Herfindahl–Hirschman Index, and the Residual Supply Index as key measures. The results show that reforms in the electricity market resulted in a drop in the share of state-controlled companies in total electricity generation in recent years. Current wholesale market competition in Australia was examined by Marshall et al. [18]. The study employed the Herfindahl–Hirschman Index, Entropy Concentration Index, Pivotal Supplier Index, and Residual Supply Index. The results reveal that most regions are usually competitive at most times these days, and that market principles fulfil their role. Shukla and Thampy [19] examined the wholesale electricity market in India with a focus on competitiveness and market power analysis using concentration ratios, HHI, and RSI measures. The obtained results also confirmed that the use of market power by energy companies could lead to an increase in electricity prices. The supply function equilibrium-based model to assess market power in electricity markets is proposed by Salarkheili and Foroud [20]. The study presents the impact of market power on wholesale electricity prices by using the capacity withheld index, capacity distortion index, and price distortion index. The results reveal that forward contracts and demand elasticity may significantly affect capacity withholding by key electric power companies.
Bataille et al. [21] revisited the German–Austrian wholesale electricity market and conducted a screening of instruments used to assess market power. Previous lessons from the German energy market were provided in the study of Bataille et al. [22]. The results show that, while energy markets have been liberalised, incumbent companies still hold dominant positions. Recent studies on the power market in Europe were also conducted using the case study of the Hungarian and Romanian energy sectors. Szőke et al. [23] provided a comprehensive analysis of the market power development of the Hungarian electricity market. They used an asymmetric price transmission modelling method and captured two stages of the market (under transition and liberalised). The study focused on the market concentration analysis of the biomass sector in Romania was conducted by Busu [24]. The author developed an algorithm to calculate the HHI with high accuracy, especially for markets with a large number of companies.
Although the literature review provides crucial findings on the subject of market power in most developed countries, there are no recent studies on market power in Poland. As previously mentioned, the recent study on market power presents the results for the years 1999–2008. Therefore, this study contributes to the existing literature by providing the most current outcomes and remarks from the perspective of a power system with a significant share of the state in the ownership structure. For this purpose, the most common measures were adopted (described in detail in Section 3).

3. Methods

This section presents the mathematical framework employed in the present study (Figure 1). First, methods of desk research and data collection were used to outline the power system. Then, the indicators of ex-post analysis of market power were applied to examine the impact of the electricity market structure on potential market power in Poland. For this purpose, the following structural and behavioural indices were used: Concentration Ratio ( C R ), number of companies with at least 5% of market share ( N R 5 ), Herfindahl–Hirschman Index ( H H I ), Entropy Coefficient ( E C ), Gini Coefficient ( G C ), Residual Supply Index ( R S I ), and Lerner Index for Short-Run Marginal Cost ( L I S R M C ) as well as for Long-Run Marginal Cost ( L I L R M C ). These indices and their mathematical representations are further described in this paper.
The first measure used to examine market power is the concentration ratio (Equation (1)) calculated for the largest ( C R 1 ) or three largest ( C R 3 ) electric power companies in the market. The C R i in Equation (1) is the market share of the i-th company, which is estimated according to Equation (2), where q i stands for the quantity of electricity generation or capacity of the i -th company and n is the number of power companies in the market [25]. The concentration index may take values from close to zero (market structure similar to perfect competition) to one, indicating a market monopoly (only one energy producer on the market).
As a consequence, the structure of the analysed market can be assessed using the CR1 and C R 3 indicators. If C R 1 has high values and CR3 is at a similar level, it may indicate a monopolistic structure, while if CR3 is greater than CR1 and has very high values, there may be an oligopoly in the market. Otherwise, the lower the values of both indicators, the greater competition in the market [7].
The number of companies sharing above 5% ( N R 5 ) of the market is then considered in a study to evaluate the potential impact of market power. This measure indicates the level of market competitiveness; the higher the number of companies with a market share above this limit, the more competitive the market is.
C R 1 = i = 1 n = 1 C R i C R 3 = i = 1 n = 3 C R i ( a s s u m i n g C R 1 C R 2 C R n )
C R i = q i i = 1 n q i
The Herfindahl–Hirschman Index ( H H I ) is formulated according to Equation (3). This index is expressed as the sums of the squares of market shares of n power electric power companies [15] where C R i stands for a market share of the i -th electric power company, and n means the number of companies. This measure of market concentration may range from 0 to 10,000, where higher values mean greater market concentration [10]. The HHI below 750 reflects a low concentrated market, from 750 to 1800—moderately concentrated, from 1800 to 5000—highly concentrated, and above 5000—very highly concentrated [26].
H H I = C R 1 2 + C R 2 2 + C R 3 2 + + C R n 2 = i = 1 n ( C R i ) 2
The Entropy Coefficient ( E C ) is calculated as shown in Equation (4), where C R i stands for the market share of the i -th producer, and n represents the number of power companies [27]. The index does not have upper boundaries that could simply allow for defining the market concentration. Asgari and Monsef provided case studies in which the entropy index is 3.23 for markets with 10 companies with equal market share and 2.32 in the case of 5 companies [28]. As a result, the higher the value of the entropy coefficient, the less concentration is observed in the market.
E C = i = 1 n C R i × l o g 2 1 C R i
The Gini Coefficient ( G C ) represents the sum of absolute differences in percentages of individual companies of all pairs of nodes in the sample, normalised by the average market share of the company for scale, as shown in Equation (5) [29]. C R i and C R j stand for the shares of the i -th and j -th companies, respectively, in terms of total electricity generation or capacity, n represents the number of companies in the market, and C R ¯ is the average market share (Equation (6)). This index provides insights about inequality and ranges from zero to one, where zero means that all the power companies account for an equal share of electricity generation or capacity, and one represents a monopoly (100% share of one company).
G C = i = 1 n j = 1 n C R i C R j 2 n 2 × C R ¯
C R ¯ = i = 1 n C R i n
The Residual Supply Index ( R S I ) [28] is the sum of total generation provided by all the companies divided by the demand in a given time period t , as given in Equation (7), where R S I i , t is the generation of the i -th company, i = 1 n S 1 is the sum of generation of the market without the generation of the i -th company, and D t is the demand in time period t . This index is used to assess the scale of the market power of the i -th company. If a power company is pivotal to meeting demand, the RSI index is below one.
R S I i , t = i = 1 n S i D t
The Lerner Index ( L I ) reflects the difference between the market price and the marginal costs of a power company in relation to the market price. This index is zero in the case of perfect competition and rises if market power increases [30]. The Lerner Index is calculated as shown in Equations (8) and (9), where p stands for the wholesale electricity price, S R M C i is the short-run marginal cost of electricity production of the i -th producer and is based on variable costs, and L R M C i is the long-run marginal cost of electricity production by the i -th producer, which also includes fixed costs.
L I S R M C = p S R M C i p
L I L R M C = p L R M C i p

4. Case Study

4.1. The Polish Power System

The Polish power system is still reliant on fossil fuels for the vast majority of its generation. While the total electricity production was 179.6 TWh in 2021, most of it (78.4%; 140.7 TWh) was produced by public power plants and combined heat and power plants fuelled mainly by hard coal, lignite, and natural gas. The remainder of the electricity produced in 2021 was mainly sourced from (i) variable renewable energy sources (13.4%; 24.1 TWh), namely onshore wind turbines and small-scale rooftop solar PV systems, and (ii) industrial autoproducers (8.2%; 14.7 TWh) [31]. A rapid increase in renewable generation has been observed over recent years. An energy transition of the Polish power system is mainly the consequence of the implementation of European energy policies (e.g., the introduction of the European Union Emission Trading System (EU ETS)), gradual decarbonisation related to the negative environmental impact of fossil fuels, and a decrease in the costs of new renewable technologies.
Considering onshore wind turbines, the largest growth was observed in 2009–2016. This period covered the third phase of the EU ETS, in which only a part of all allowances was grandfathered, and the remainder had to be purchased in the market. While the share of free allowances decreased annually, the share of tradable allowances increased [32]. This period was also of key importance due to the need to meet three key climate targets of the European Union (20-20-20), i.e., a reduction in greenhouse gas emissions by 20% compared to 1990 levels, an increase in energy from renewables up to 20%, and an improvement in energy efficiency by 20% [33].
The above-mentioned policy frameworks and decreasing capital costs of investment in wind turbines resulted in an increase in capacity installed in onshore wind from 0.7 GW in 2009 to 5.8 GW in 2016 [34]. Then, distance regulations were introduced, which stopped the development of wind farms in Poland. The Act on Wind Farm Investments defined a minimum distance of wind turbines from residential buildings and protected areas at 10 times the tip height of a wind installation, called the 10H rule [35]. As a result, new turbines must be deployed at a minimum distance of 1.6–2 km to residential buildings or protected areas, and almost the entire area of Poland has been excluded from building new wind capacity [36].
As far as solar PV installations are concerned, a rapid increase was observed from 0.2 GW in 2017 to 7.4 GW in 2021. The growth was mainly caused by decreasing investment costs and government incentives for small-scale systems installed by private owners in residential buildings [37,38]. While the capacity from RES and autoproducers accounted for 38% of the total capacity of the Polish power system (20.2 GW), the share of dispatchable power plants and combined heat and power plants was 62% (32.2 GW). Please note that, by using the definition of capacity here and in further parts of the present study, we mean the attainable capacity that is expressed by the Transmission System Operator as the maximum active power, confirmed by tests, at which the generating unit may operate at nominal parameters over a period of at least 4 consecutive hours without an adverse impact on the lifetime of such a unit.
This study analyses the market power of power units that relates to the calculated 62.2% of total capacity. For comparison, the previous study published in 2012 analysed the potential market power of the 85% share of public dispatchable generation units in 2008 [7].
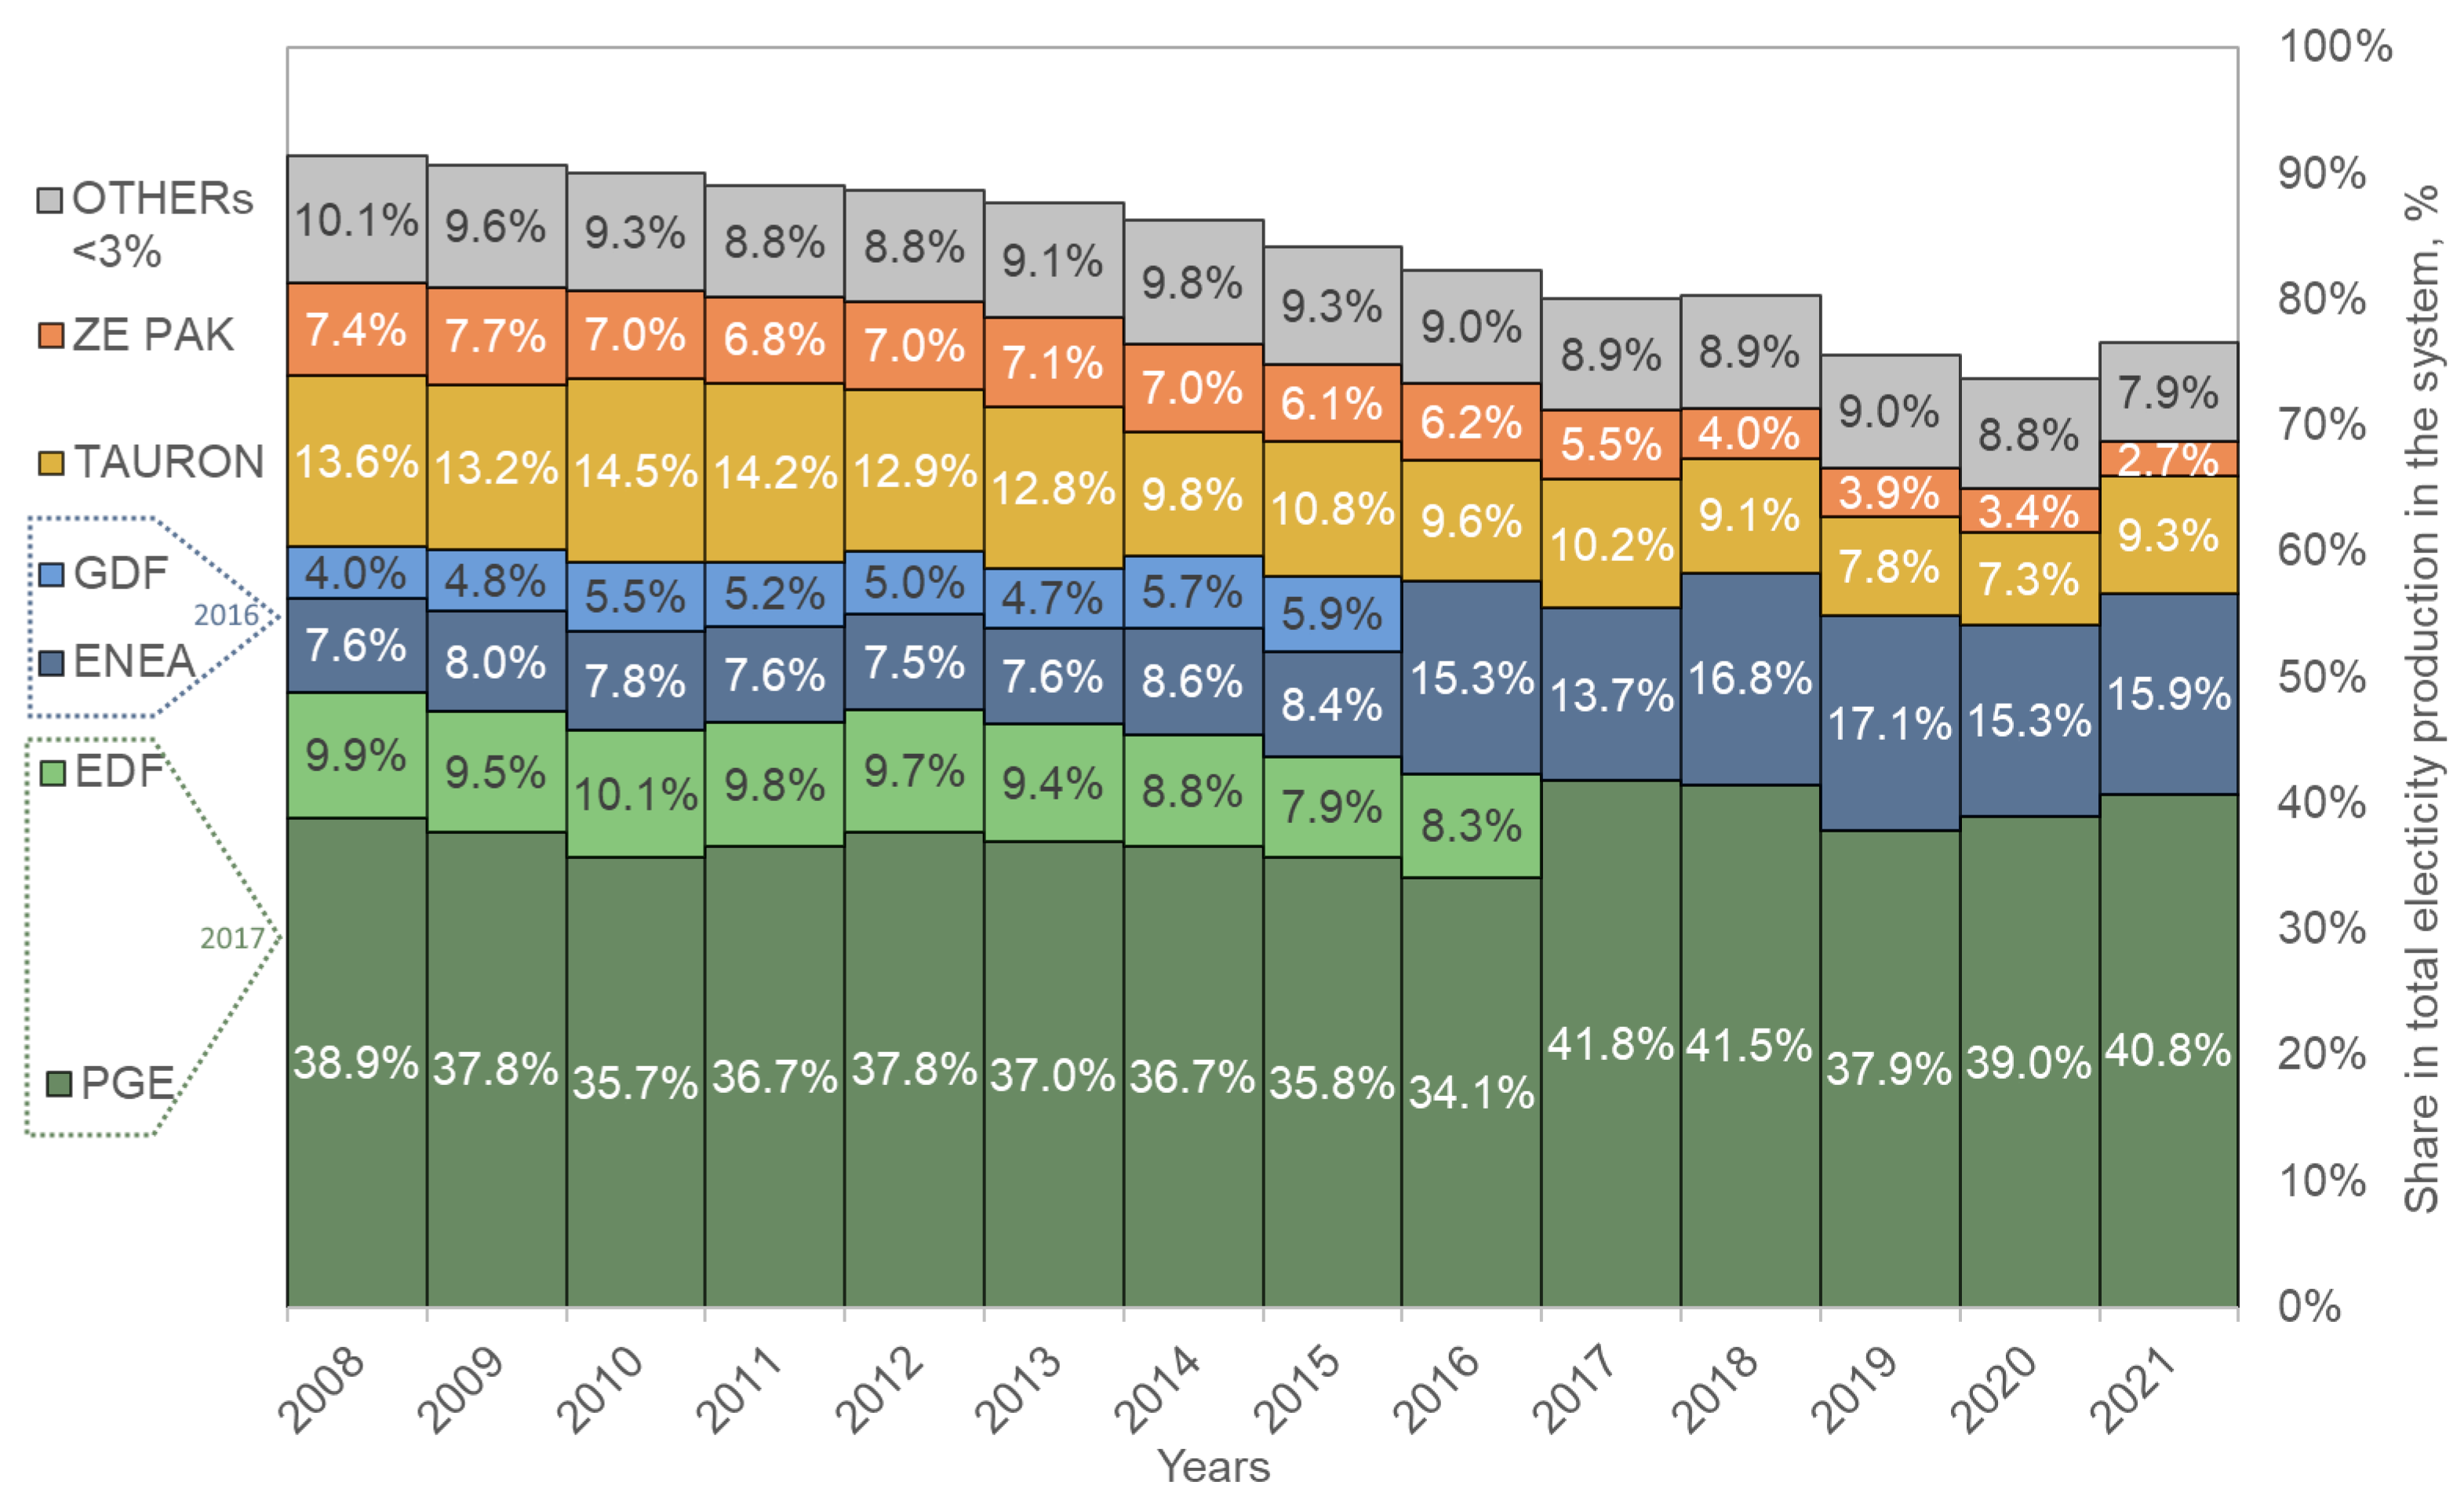
Apart from the changes in the fuel mix, the structure of ownership has also changed. After 2008, the process of merger and acquisition proceeded gradually. Sales of coal power plants and CHPs by private investors were also observed. In 2011, one of the state-owned natural gas companies (PGNiG) took over the CHPs previously owned by Swedish Vattenfall and increased their market share to 2.95% (electricity generation) and 4.59% (capacity) in 2021 (Table 1).
In 2014, Veolia took over the combined heat and power plants located in Poznań and Łódź, which had previously been owned by the Dalkia Group. However, this acquisition did not significantly change the market from the perspective of market power. The market share of this company was 1.92% (electricity generation) and 2.08% (capacity) in 2021.
In 2015, one of the largest hard coal-fired power plants (the Połaniec Power Plant), which had been owned by the GDF Suez Group, was taken over by the state-owned company (ENEA Group). As a result, the ENEA Group became the second-largest power company in Poland, representing a market share of 20.25% (electricity generation) and 18.49% (capacity) in 2021. For comparison, its market share was only 8.3% in 2008.
In 2017, the next significant acquisition in the Polish power system took place. The EDF Group, putting into action their new environmentally friendly strategy, decided to withdraw from Poland and sell all their operations (the EDF Group was the third largest power producer in Poland, with a market share in electricity generation of 10.8% in 2008). All of their generation units (the Rybnik power plant and CHPs in Kraków, Gdańsk, Gdynia, Zielona Góra, Toruń, and Wrocław) were taken over by the largest state-owned company, i.e., PGE Group (Polska Grupa Energetyczna). This transfer of assets resulted in an increase in the market share of the PGE Group to the substantial values of 52.2% (electricity generation) and 47.3% (capacity), respectively, of the total electricity generation and capacity in Poland in 2021. The ownership structure in detail and the key figures of the Polish power system in 2021 are presented in Table 1.
The takeover of EDF’s assets by the PGE Group was investigated as part of anti-monopoly proceedings by the President of the Office of Competition and Consumer Protection. This procedure involved a sector inquiry, including obtaining the opinions and statements of the President of the Energy Regulatory Office (ERO), the Polish Power Exchange (Towarowa Giełda Energii) and key power companies. The position expressed by the ERO President clearly indicated that concentration ratios and HHI indices would worsen after the acquisition and would be a threat to competitiveness. The President of the ERO also pointed out that, after the takeover of EDF’s assets, all the largest power companies will be controlled by the state. As a result, considering the effects on competition in the electricity market that were described, the ERO President expressed disapproval of the planned acquisition. Power companies also expressed their concerns about the possibility of withdrawing a significant volume of electricity from exchange trading, which would negatively impact prices and would reduce the liquidity of this market.
As a result of the inquiry conducted on the sector, the President of the Office of Competition and Consumer Protection concluded that the transaction that had been notified may restrict competition. However, it finally consented to market concentration and the takeover of EDF’s assets by the PGE Group provided that, in 2018–2021, all electricity from the largest power plant (Rybnik) to be acquired would be subject to exchange trading [39].
The above-mentioned changes in the structure of ownership of the electric power companies are shown in Figure 2 as they relate to the total electricity production in public thermal power plants and CHPs, autoproducers, and renewable generation units. Apart from the withdrawal of private capital and taking over of the assets by state-owned power companies, a decrease in the production in units owned by the TAURON and ZE PAK Groups has been observed in recent years. As regards the TAURON Group, the reduction was caused by the shutting down of the most heavily exploited and least efficient hard coal-fired units, whereas in the case of the ZE PAK Group, the power plant was phased-out due to the depletion of lignite resources in the adjacent mines.
As a result of mergers and acquisitions, the number of key market players decreased to four in 2017 compared to six in 2008, and it has stayed at that level until today. The PGE Group, ENEA Group, TAURON Group, and ZE PAK Group have the greatest shares in the market and provide together around 70% of the total electricity generation in Poland. Please note that these shares only include electricity produced in dispatchable power and combined heat and power plants fuelled by fossil fuels (hard coal, lignite, and natural gas) and biomass.

4.2. Costs of Electricity Generation and Wholesale Electricity Prices

The data on the structure of ownership enable the potential market power of key players in the electricity market to be examined. The analysis of the costs of electricity generation in power plants and CHPs owned by key market players in relation to wholesale electricity prices may facilitate the assessment of the consequences of the exercise of market power. Since data on the marginal costs of electricity generation are sensitive and usually kept secure by companies, this study applies aggregated values reflecting the costs separately for hard coal-fired power plants, hard coal-fired CHPs, and lignite-fired power plants.
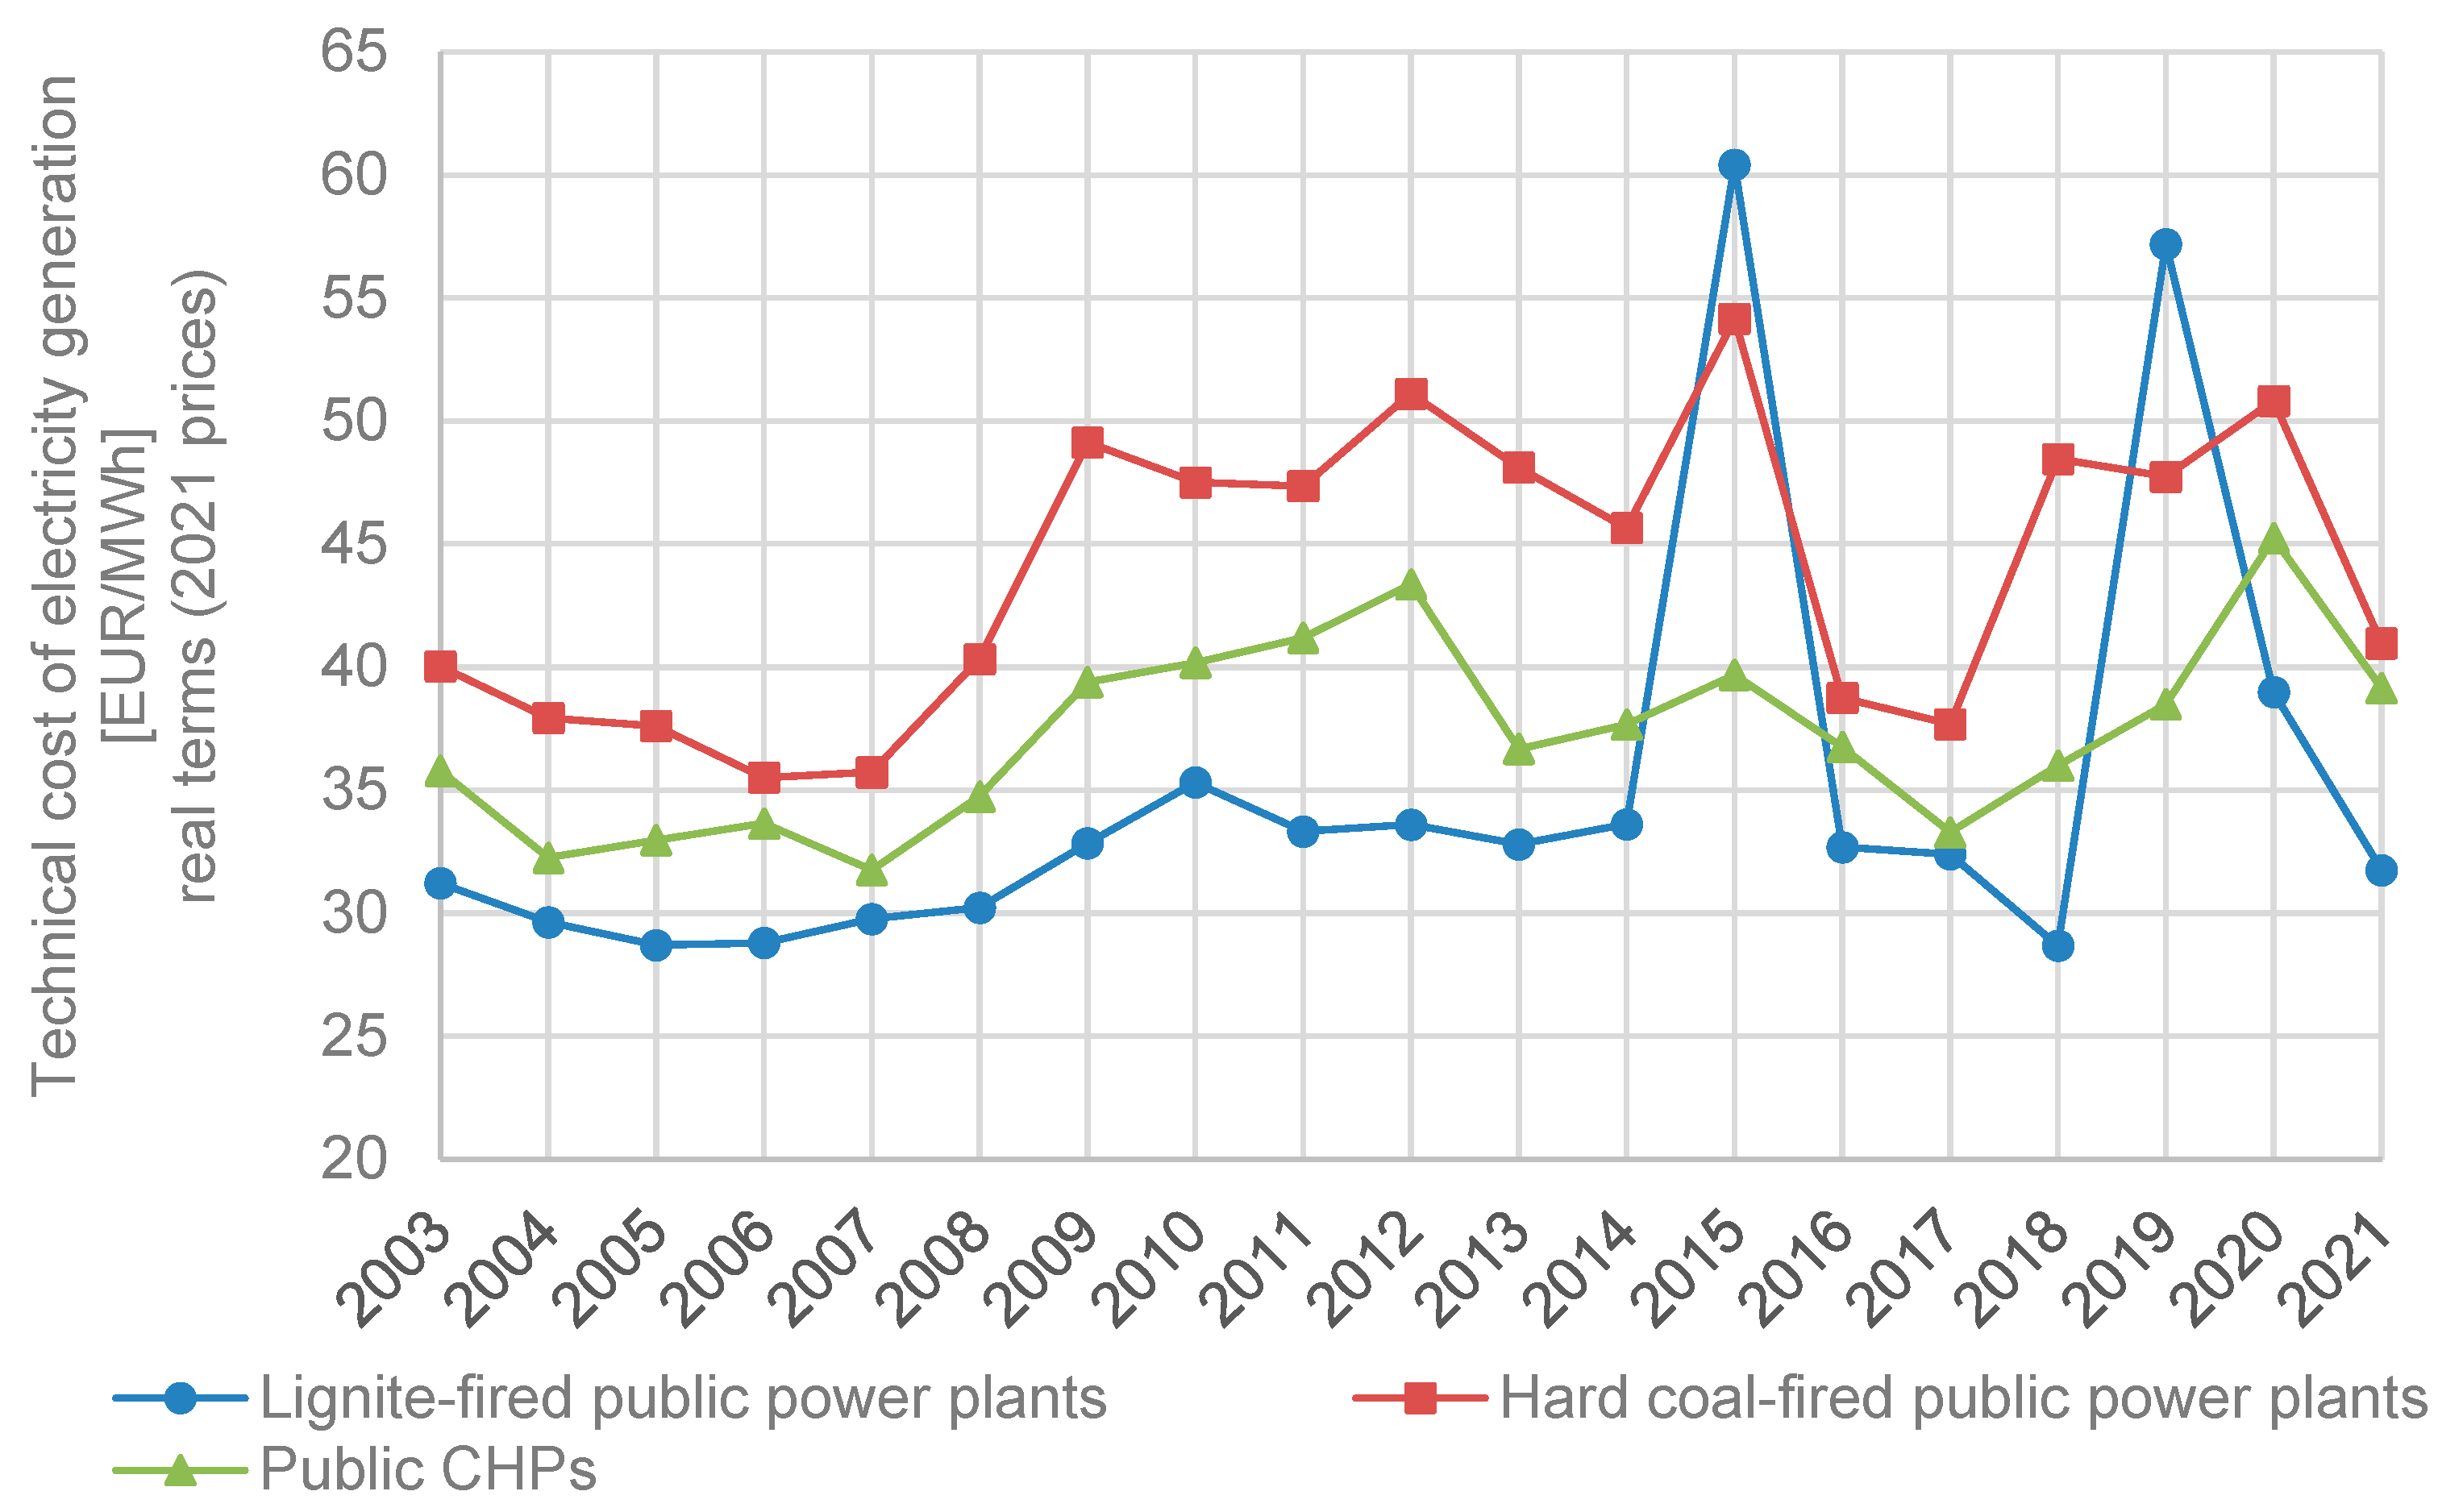
The unit technical costs of electricity generation in these groups, including fixed costs, are shown in Figure 3. The lowest costs were observed in lignite-fired power plants due to the electric power companies having access to their own fuel resources located close to their power plants. The highest costs were observed in hard-coal power plants. This was the result of increasing prices of fuel and carbon allowances in recent years. This trend continued in the period up to 2008 considered in the previous study [7] and in the period analysed in the present study (2009–2021). The only exceptions were noticed in 2015 and 2019. However, these changes were not caused by the changes in variable costs of generation. They resulted from the large write-downs of fixed assets by companies that owned lignite-fired units due to the lack of long-term prospects due to climate policy.
It is worth noting that, despite the fluctuations in unit technical costs of electricity generation in different years, the costs in 2021 were at a similar level to those in 2003, achieving EUR 31.7/MWh for lignite-fired power plants, EUR 39.1/MWh for hard coal-fired CHPs, and EUR 40.9/MWh for hard coal-fired power plants.
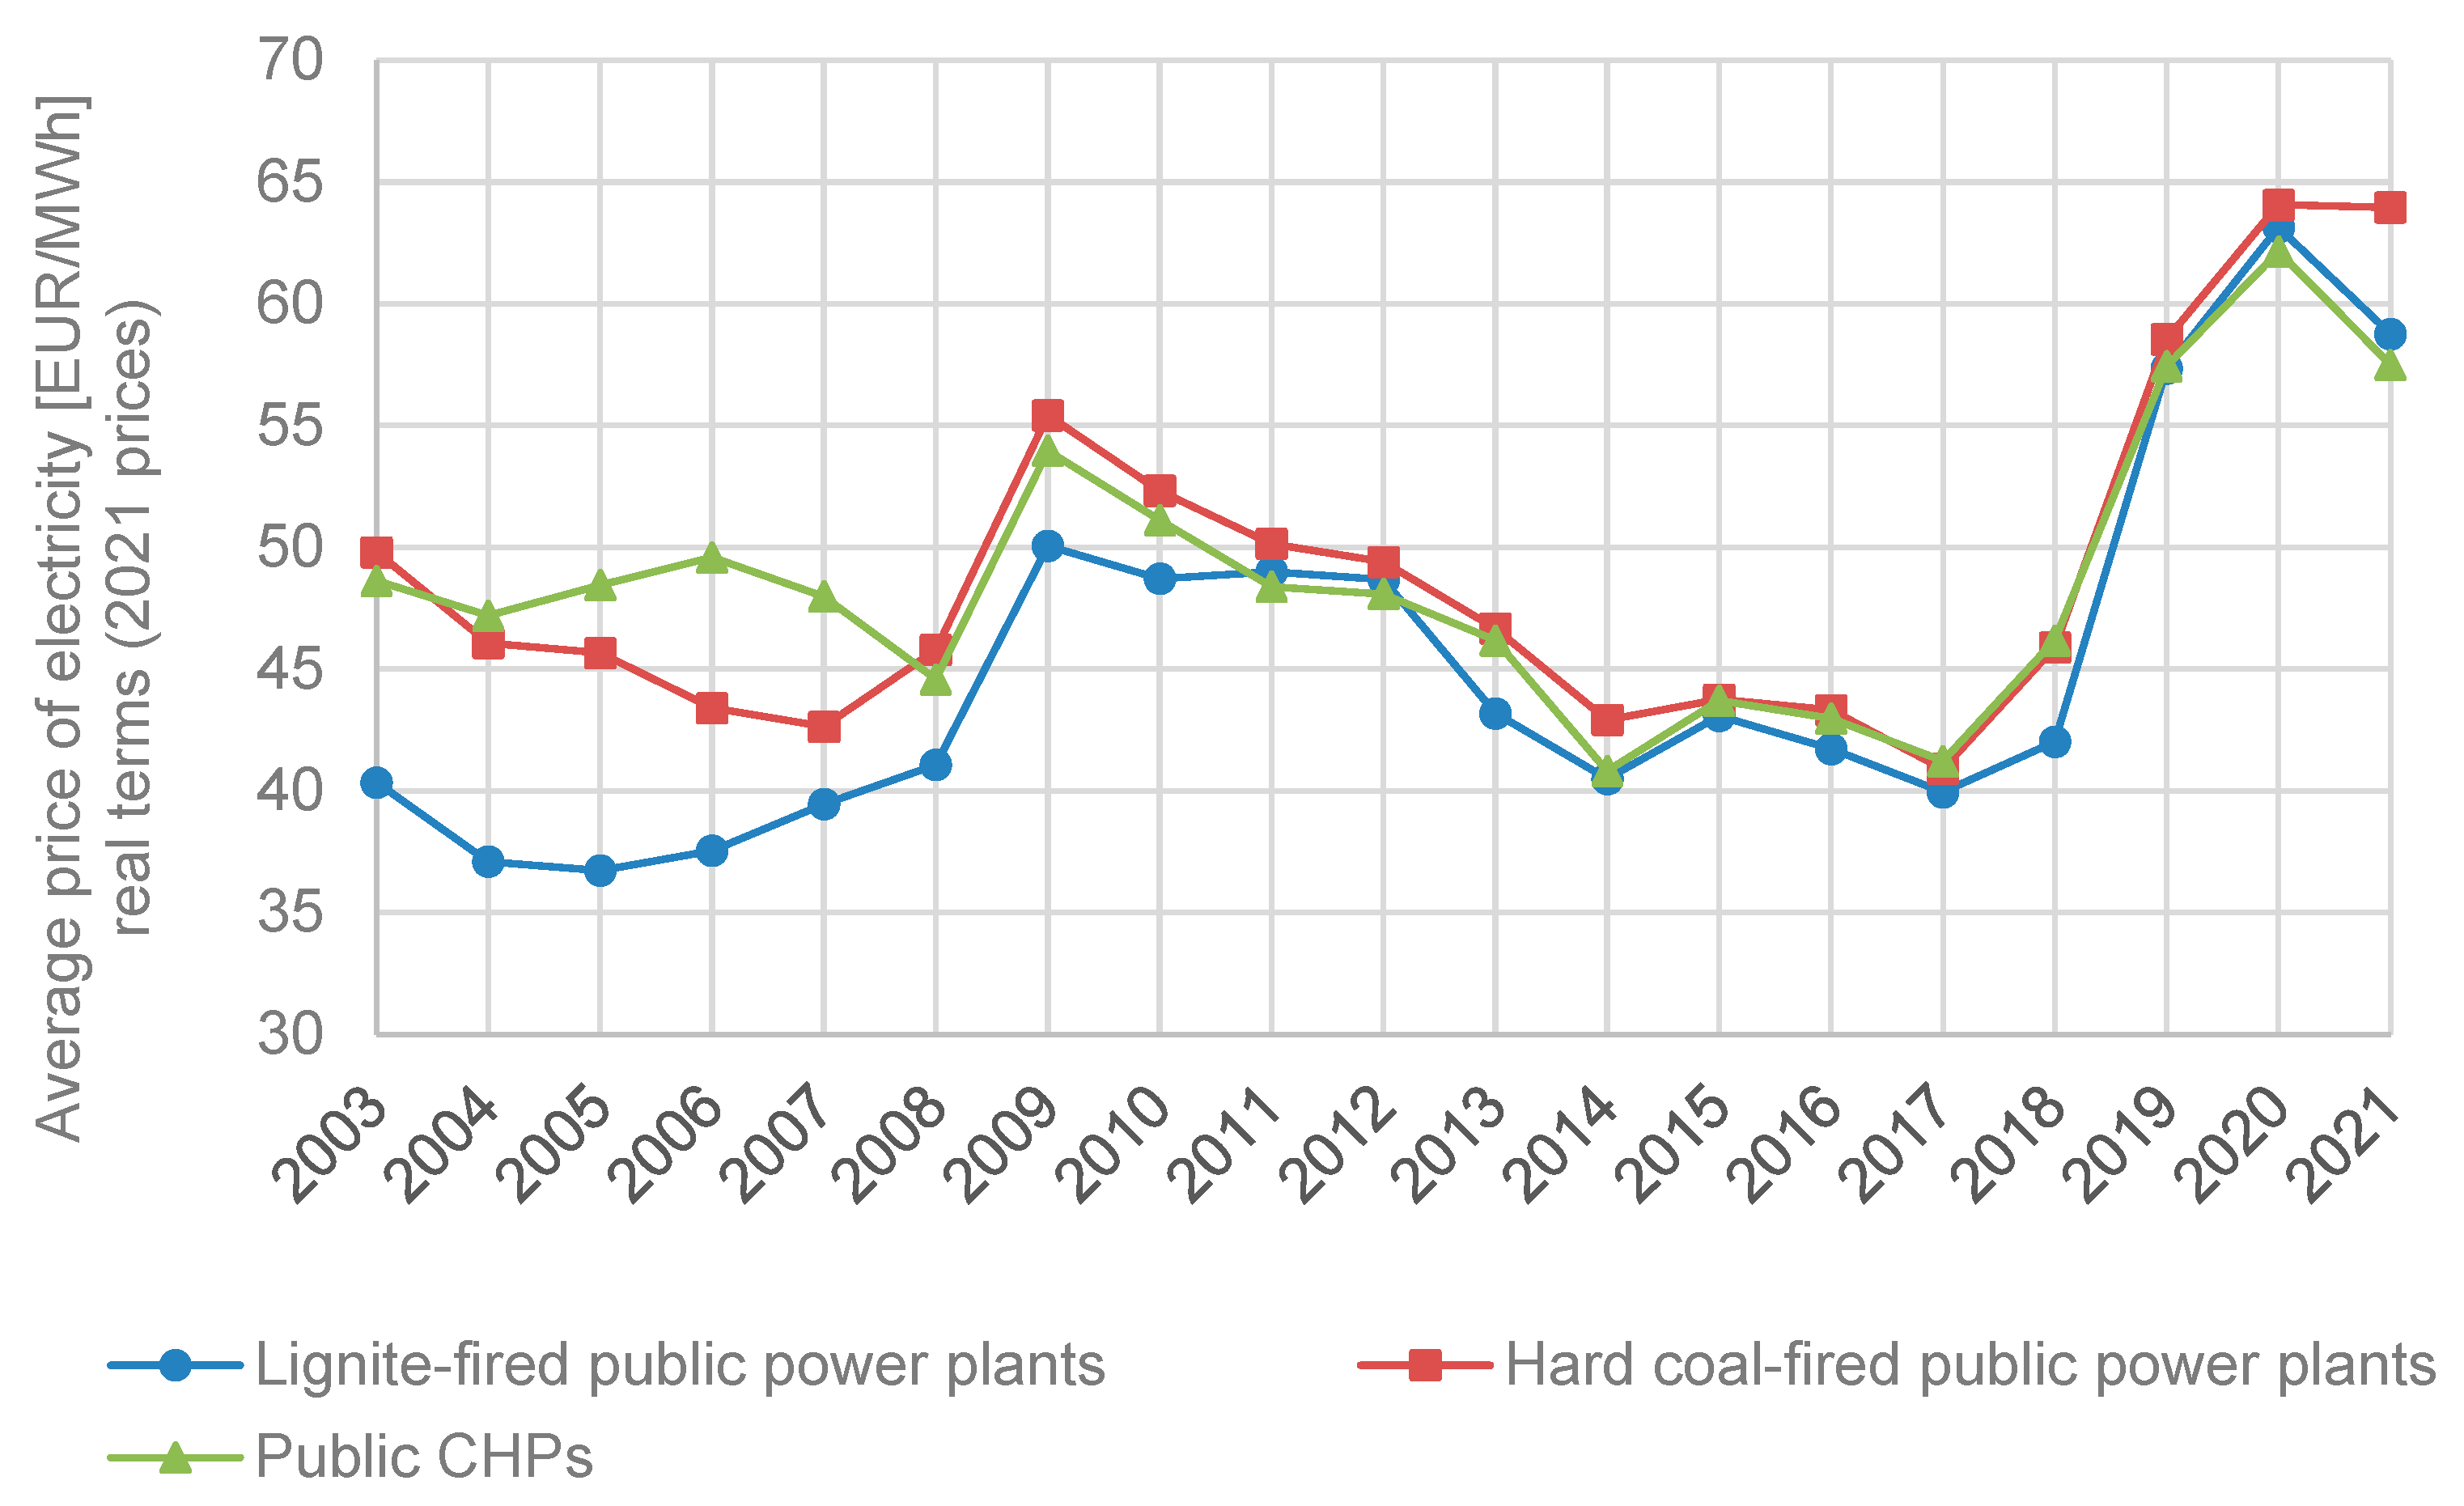
The wholesale prices of electricity from hard coal- and lignite-fired power producers are presented in Figure 4. While differences were observed between the prices of electricity in different groups of units before 2009, the prices have been similar since 2009. First, this was a consequence of the mergers and acquisitions at this time. Second, more electricity was traded in the power exchange instead of through long-term bilateral contracts.
A dynamic increase in electricity prices was observed in 2017–2020, while a stabilisation (hard coal-based power plants) or decrease (lignite-fired power plants and hard-coal CHPs) was observed in 2021. These trends were also observed in the unit technical costs of generation. Apart from fluctuations in the costs of generation, changes in the market for carbon allowances (European Union Allowances, EUAs) were also observed in these years. In 2017, the prices of the EUAs ranged from EUR 7.0 to 7.5/Mg CO2 to reach EUR 80/Mg CO2 at the end of 2021 (based on the ICE daily futures and EEX spot market data).

5. Results and Discussion

This section presents and discusses the results obtained using the research framework described in the previous section. The changes in indices used to assess the potential for market power are examined, including the Concentration Ratio, HHI, Entropy coefficient, Gini coefficient, Residual Supply Index, and Lerner Indices for short and long-run marginal costs. Then, the impact of mergers and acquisitions in the Polish power system in recent years is investigated to assess the potential for market power and compare the results with those obtained eleven years ago.

5.1. Concentration Ratios

The results of the concentration ratio analysis confirm the changes that have taken place in the Polish power system in recent years. These ratios were calculated individually for electricity generation and capacity, independently for the largest power company ( C R 1 , as shown in Figure 5) and for the three largest power companies ( C R 3 , as shown in Figure 6). The horizontal consolidation, described in detail in [7], resulted in dynamic growth in concentration ratios to 2008, followed by a downward trend that was observed from 2009 to 2015 ( C R 1 ) and to 2016 ( C R 3 ). The slight decrease in CRs resulted from the minor changes in the ownership structure in those years and the increasing share of renewable capacities in the system. In 2016 (for C R 3 ) and 2017 (for C R 1 ), dynamic growth in CRs occurred, achieving over 67% and 57%, respectively, when C R 3 is considered for electricity generation and capacity and over 42% and 32% when C R 1 is analysed. These changes were caused by the takeover of generation assets from the GDF Suez and EDF Groups by state-owned companies already operating in the market.
In the final years (2019–2021), the trends of CRs observed in electricity generation and capacity varied. While concentration ratios calculated for capacity decreased, those for electricity generation increased. This resulted from the dynamic growth in the capacity installed in renewables, in particular in solar PV installations that have low utilisation rates. As a result, while an increase in renewables is observed, the power sector is still highly concentrated and relies on a few large market players. As indicated in Section 3, such values of CR1 and CR3 indices may indicate an oligopolistic market structure [7]. However, taking into account the ownership structure of these companies (they are controlled by the state, as presented in Table 1), the market structure tends towards a monopoly.
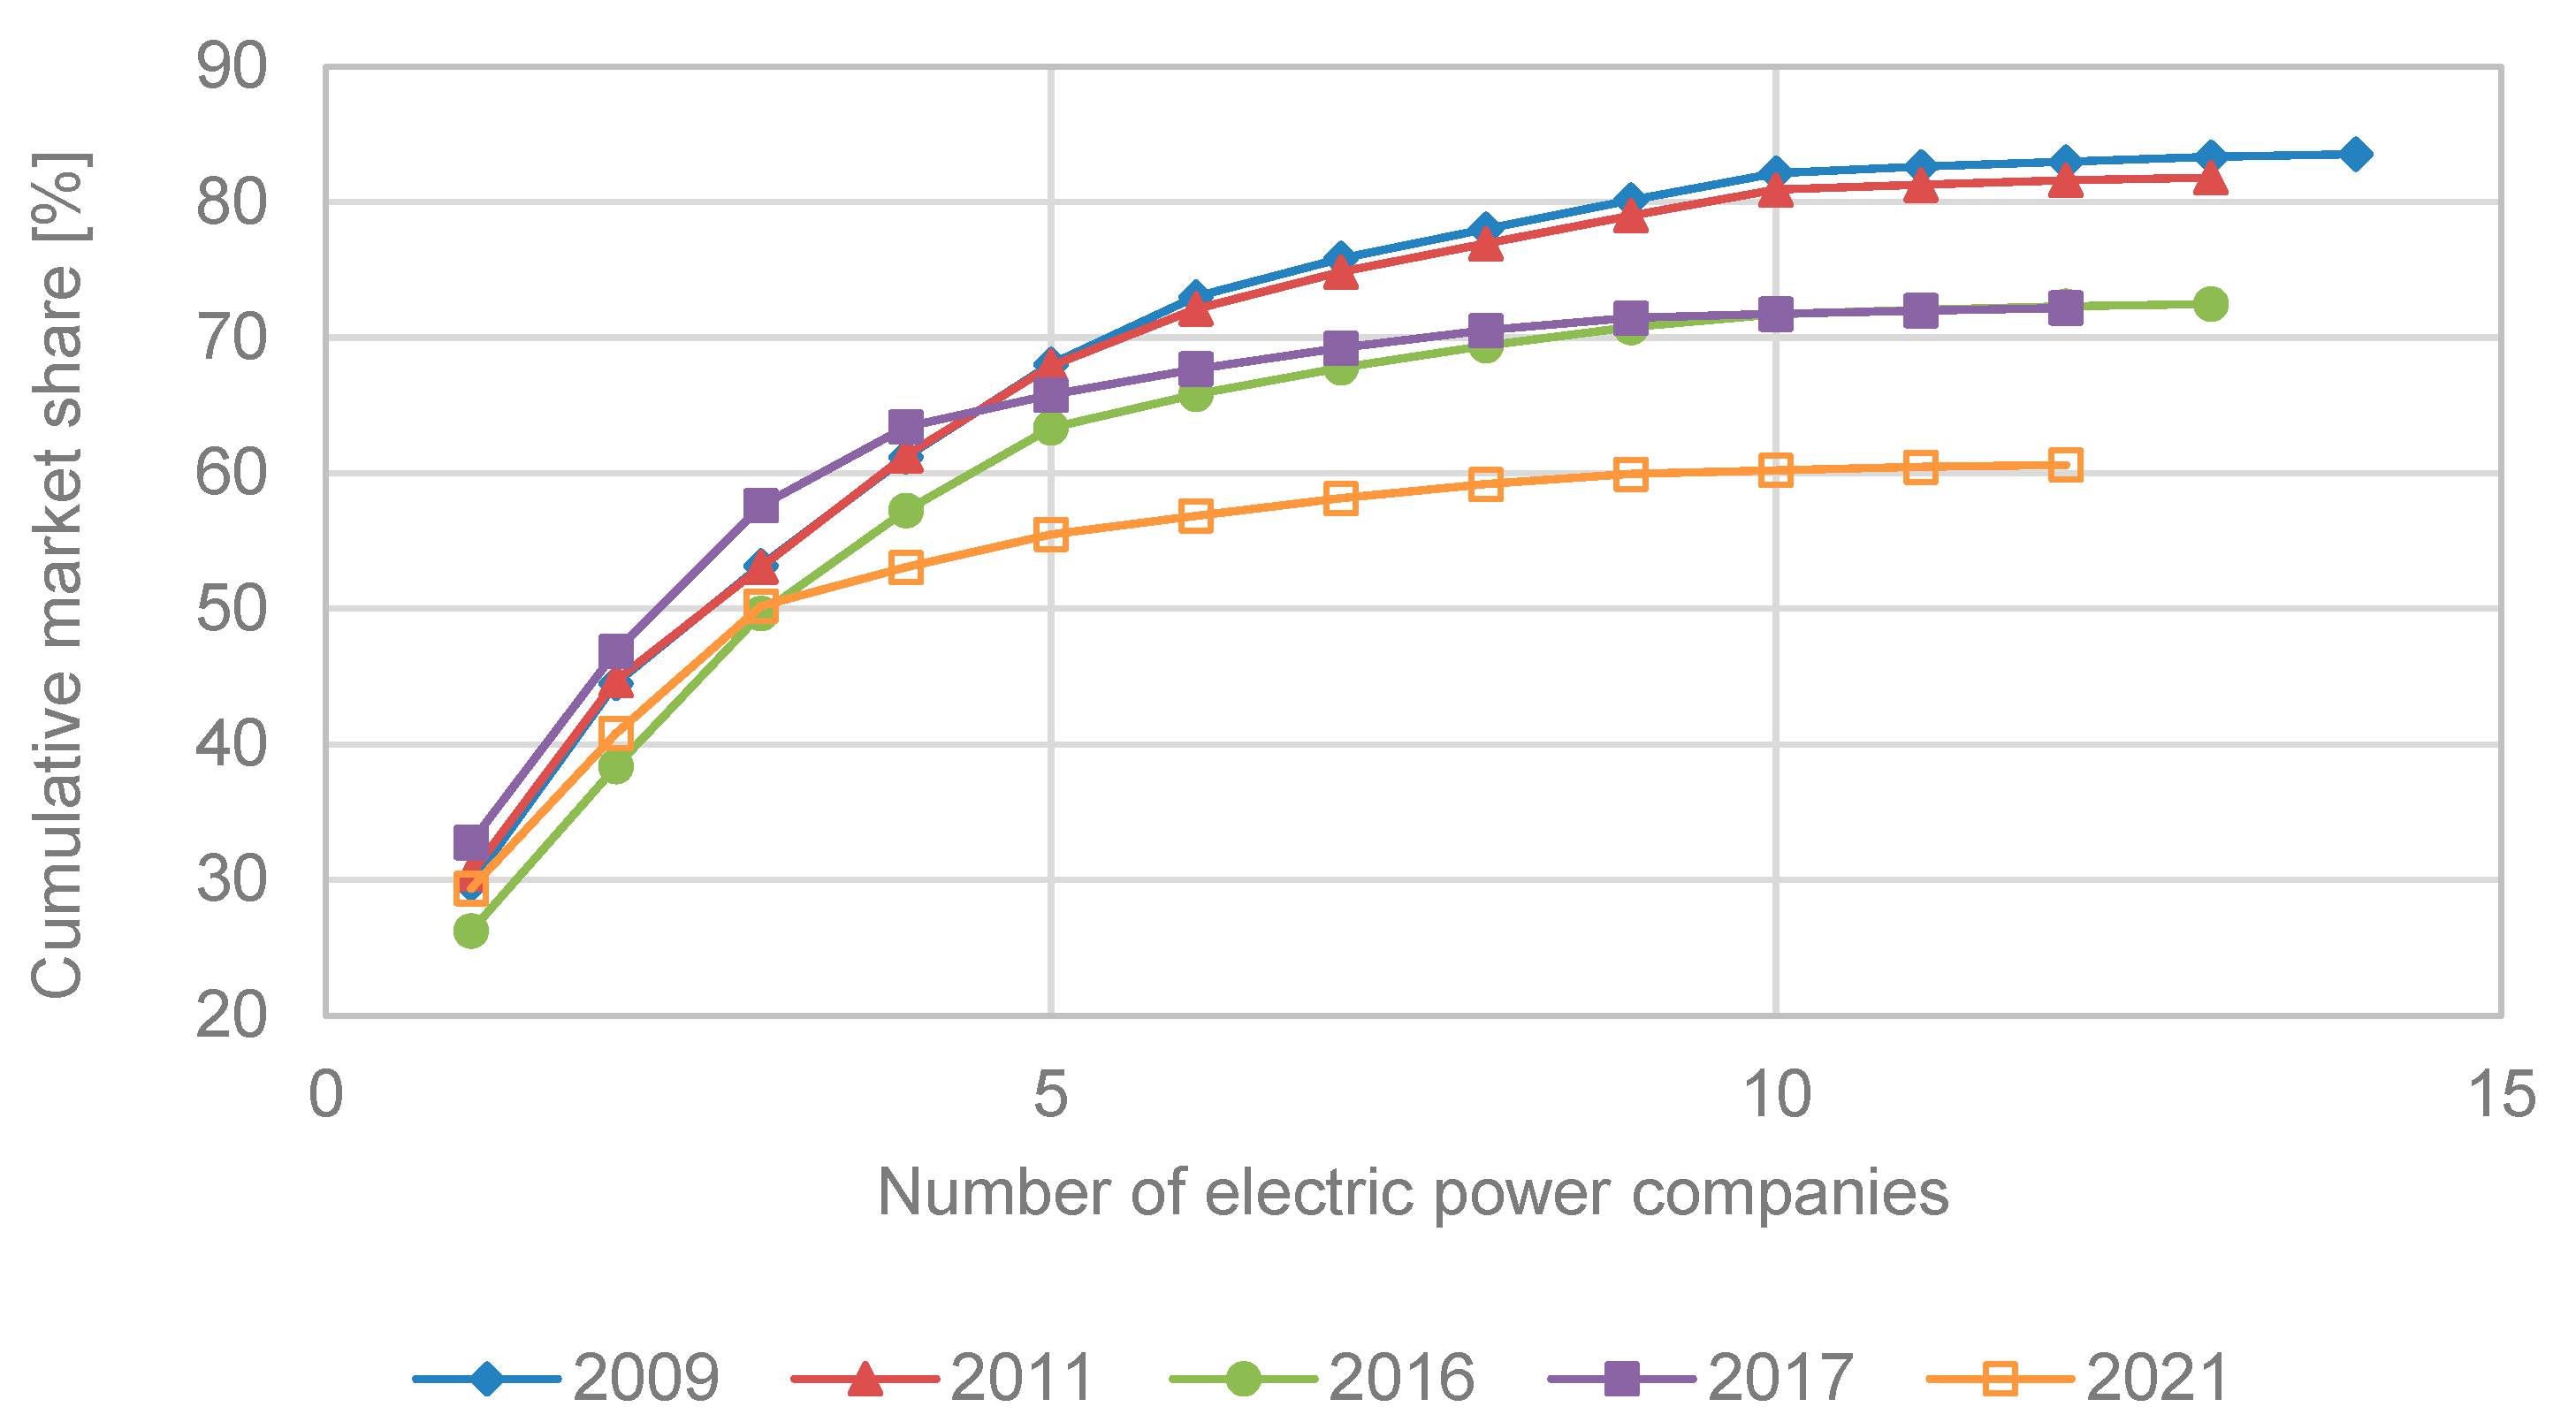
The consolidation of power companies and the reduction In the shares of total electricity generation and capacity of dispatchable units is also observed in the cumulative market shares of electric power companies as shown in Figure 7 and Figure 8. In 2009, the cumulative shares of power companies that owned public dispatchable units accounted for 91% of total electricity generation (Figure 7) and 85% of total capacity (Figure 8). In the years that followed, the curves were flattening, and finally (in 2021) the cumulative concentration ratios were around 77% and 61%, respectively, for electricity generation and capacity.
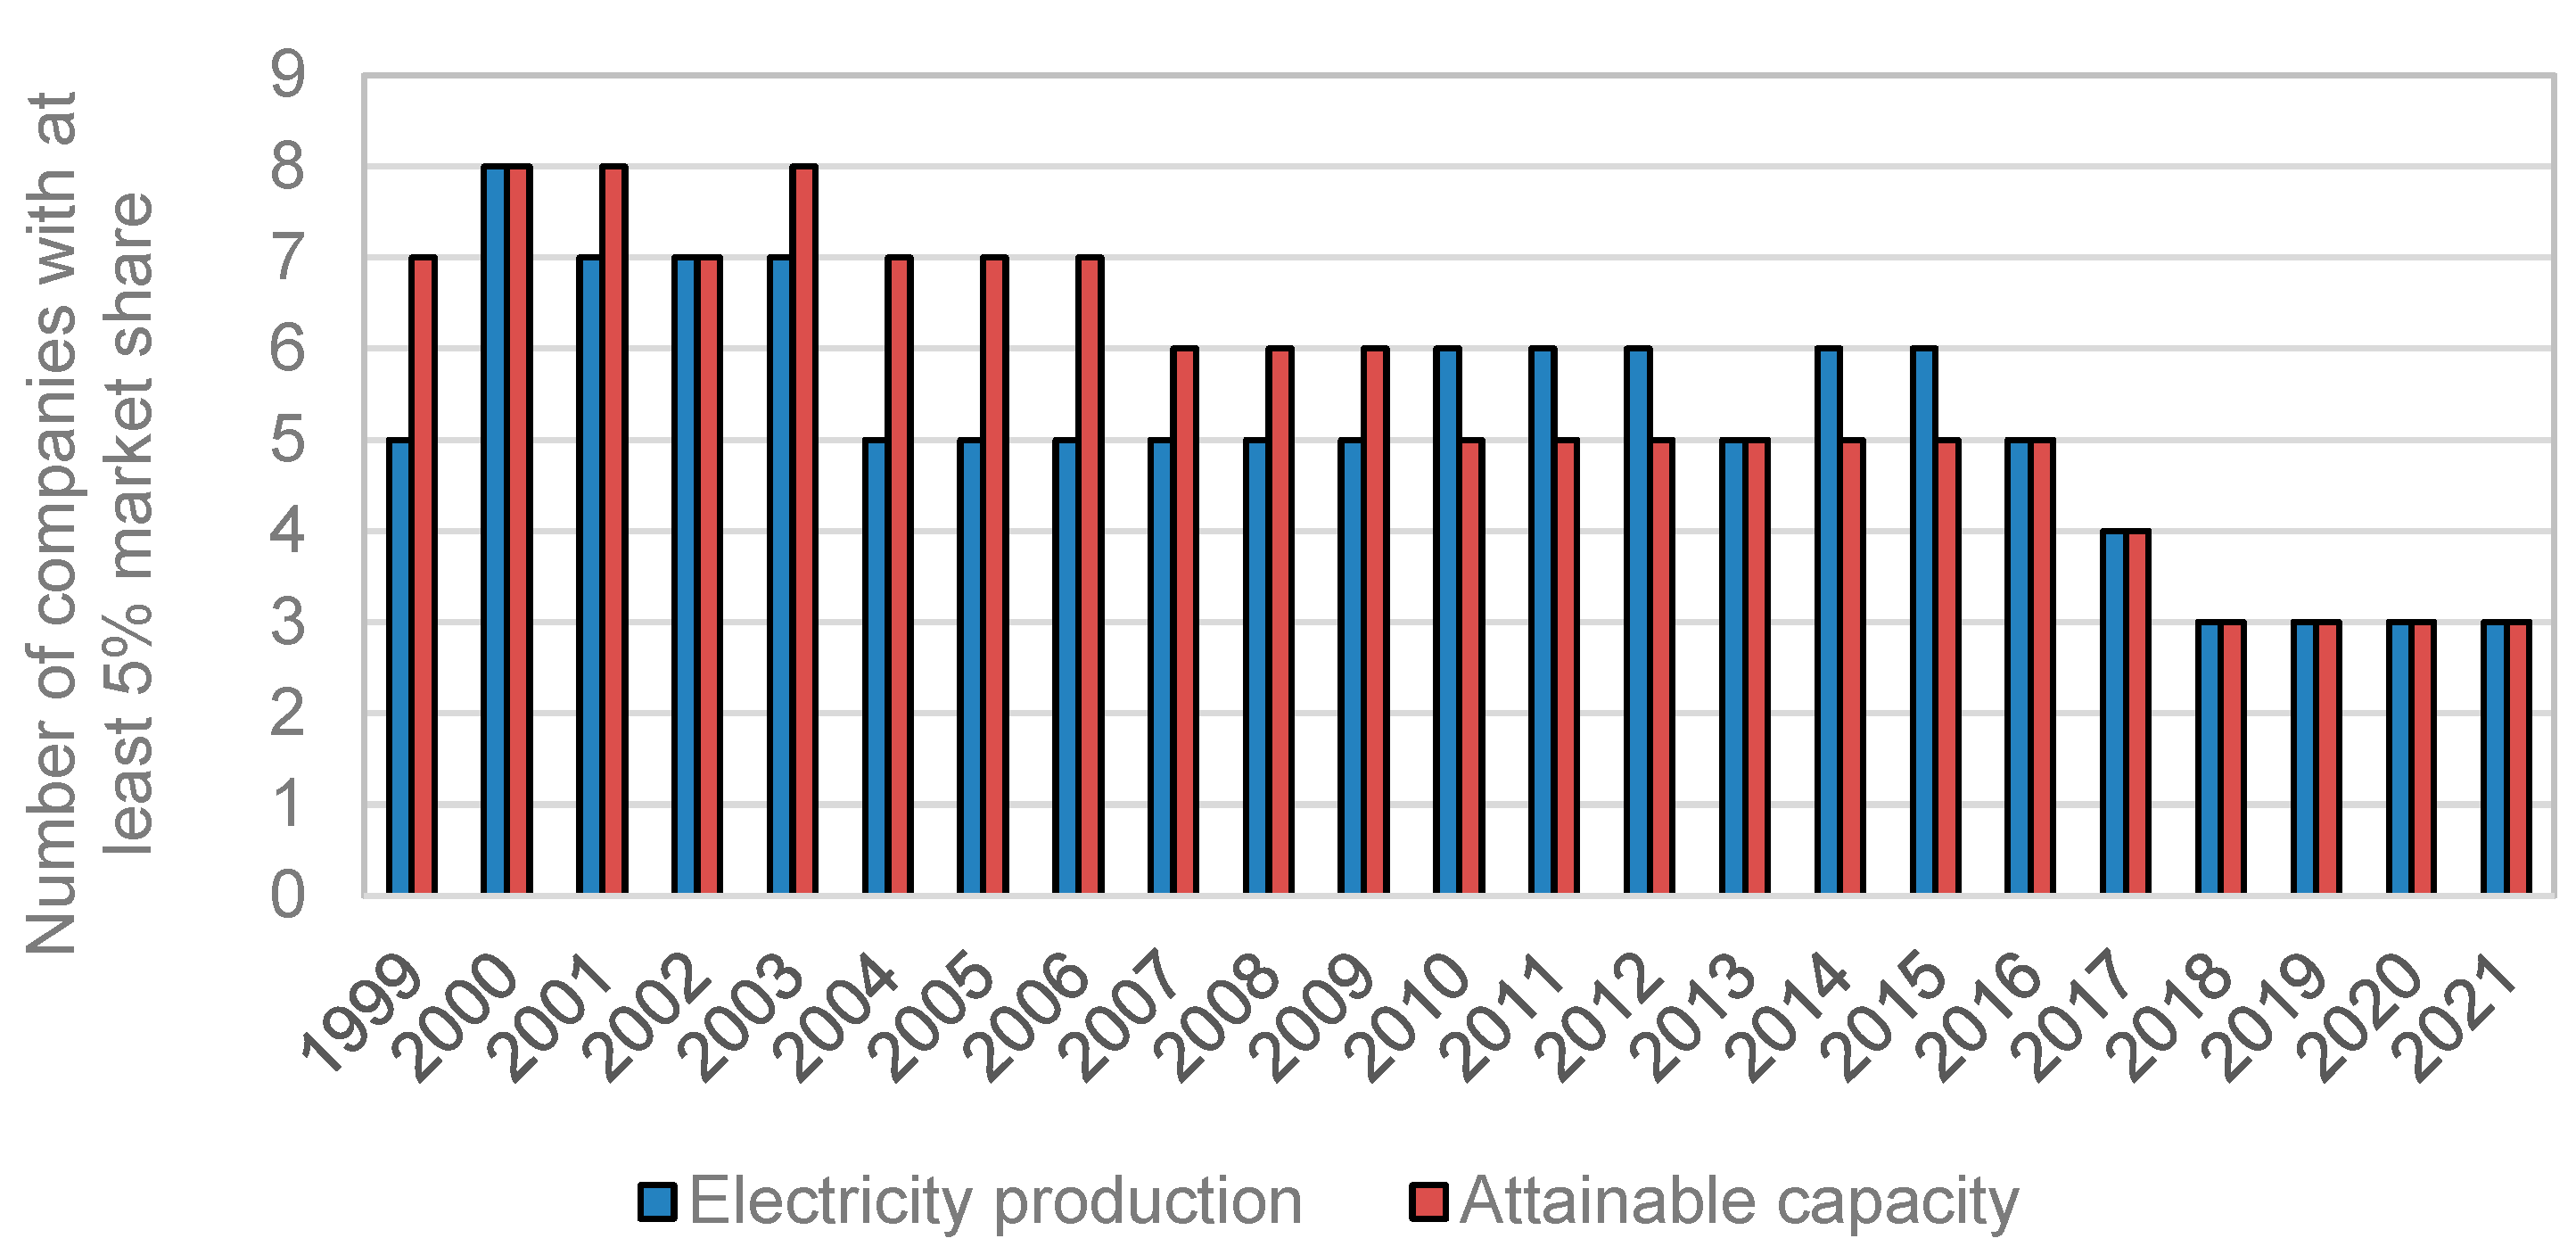
The changes are also observed when the number of companies with at least a 5% market share ( N R 5 ) is examined, as shown in Figure 9. In 2008, there were five power companies with at least a 5% share in electricity generation including four owned by the state and one owned by a private company. In 2021, there were three companies with such a share in the market, and all of them were state-owned. One should also note that the company with the fourth largest share in the market produced below 3.5% of the total electricity in 2021 (Table 1), while in 2008, six companies produced electricity at a quantity of over 3.5%. These changes indicate an increase in stratification between power companies and increasing potential for market power.

5.2. Herfindahl–Hirschman Index

The concentration ratios discussed above have a direct impact on the value of the Herfindahl–Hirschman index, which is one of the most common indices used to assess potential market power. The Polish power market evolved—based on the thresholds provided in Section 3 [26]—from a market with relatively low concentration (HHI < 1000) before 2004 to a moderately concentrated one in the case of capacity (HHI~1100) and a highly concentrated one in the case of electricity generation (HHI~2000) in 2021, as shown in Figure 10.
Following changes in the concentration ratios, the HHI index decreased between 2008 and 2016, achieving 1610 (electricity generation) and 1073 (capacity), which represents a moderately concentrated market due to the increase in renewables in Poland. However, the mergers and acquisitions that took place in 2016 and 2017 resulted in an increase in the HHI, which reached 2121 (electricity generation) and 1481 (capacity), meaning a highly concentrated market in the former and a moderately concentrated one in the latter.
The results show a relatively large difference between the HHIs for electricity generation and capacity (on average, 537 in 2009–2020). The peak value was observed in 2021, achieving 920. As previously mentioned, the differences are caused by the dynamic growth in the capacity of small-scale solar PV installations in recent years which have significantly lower utilisation rates compared to conventional thermal power plants. As a result, electricity consumption in Poland is still mainly covered by public thermal power plants and CHPs fuelled by coal and natural gas.

5.3. Entropy Coefficient

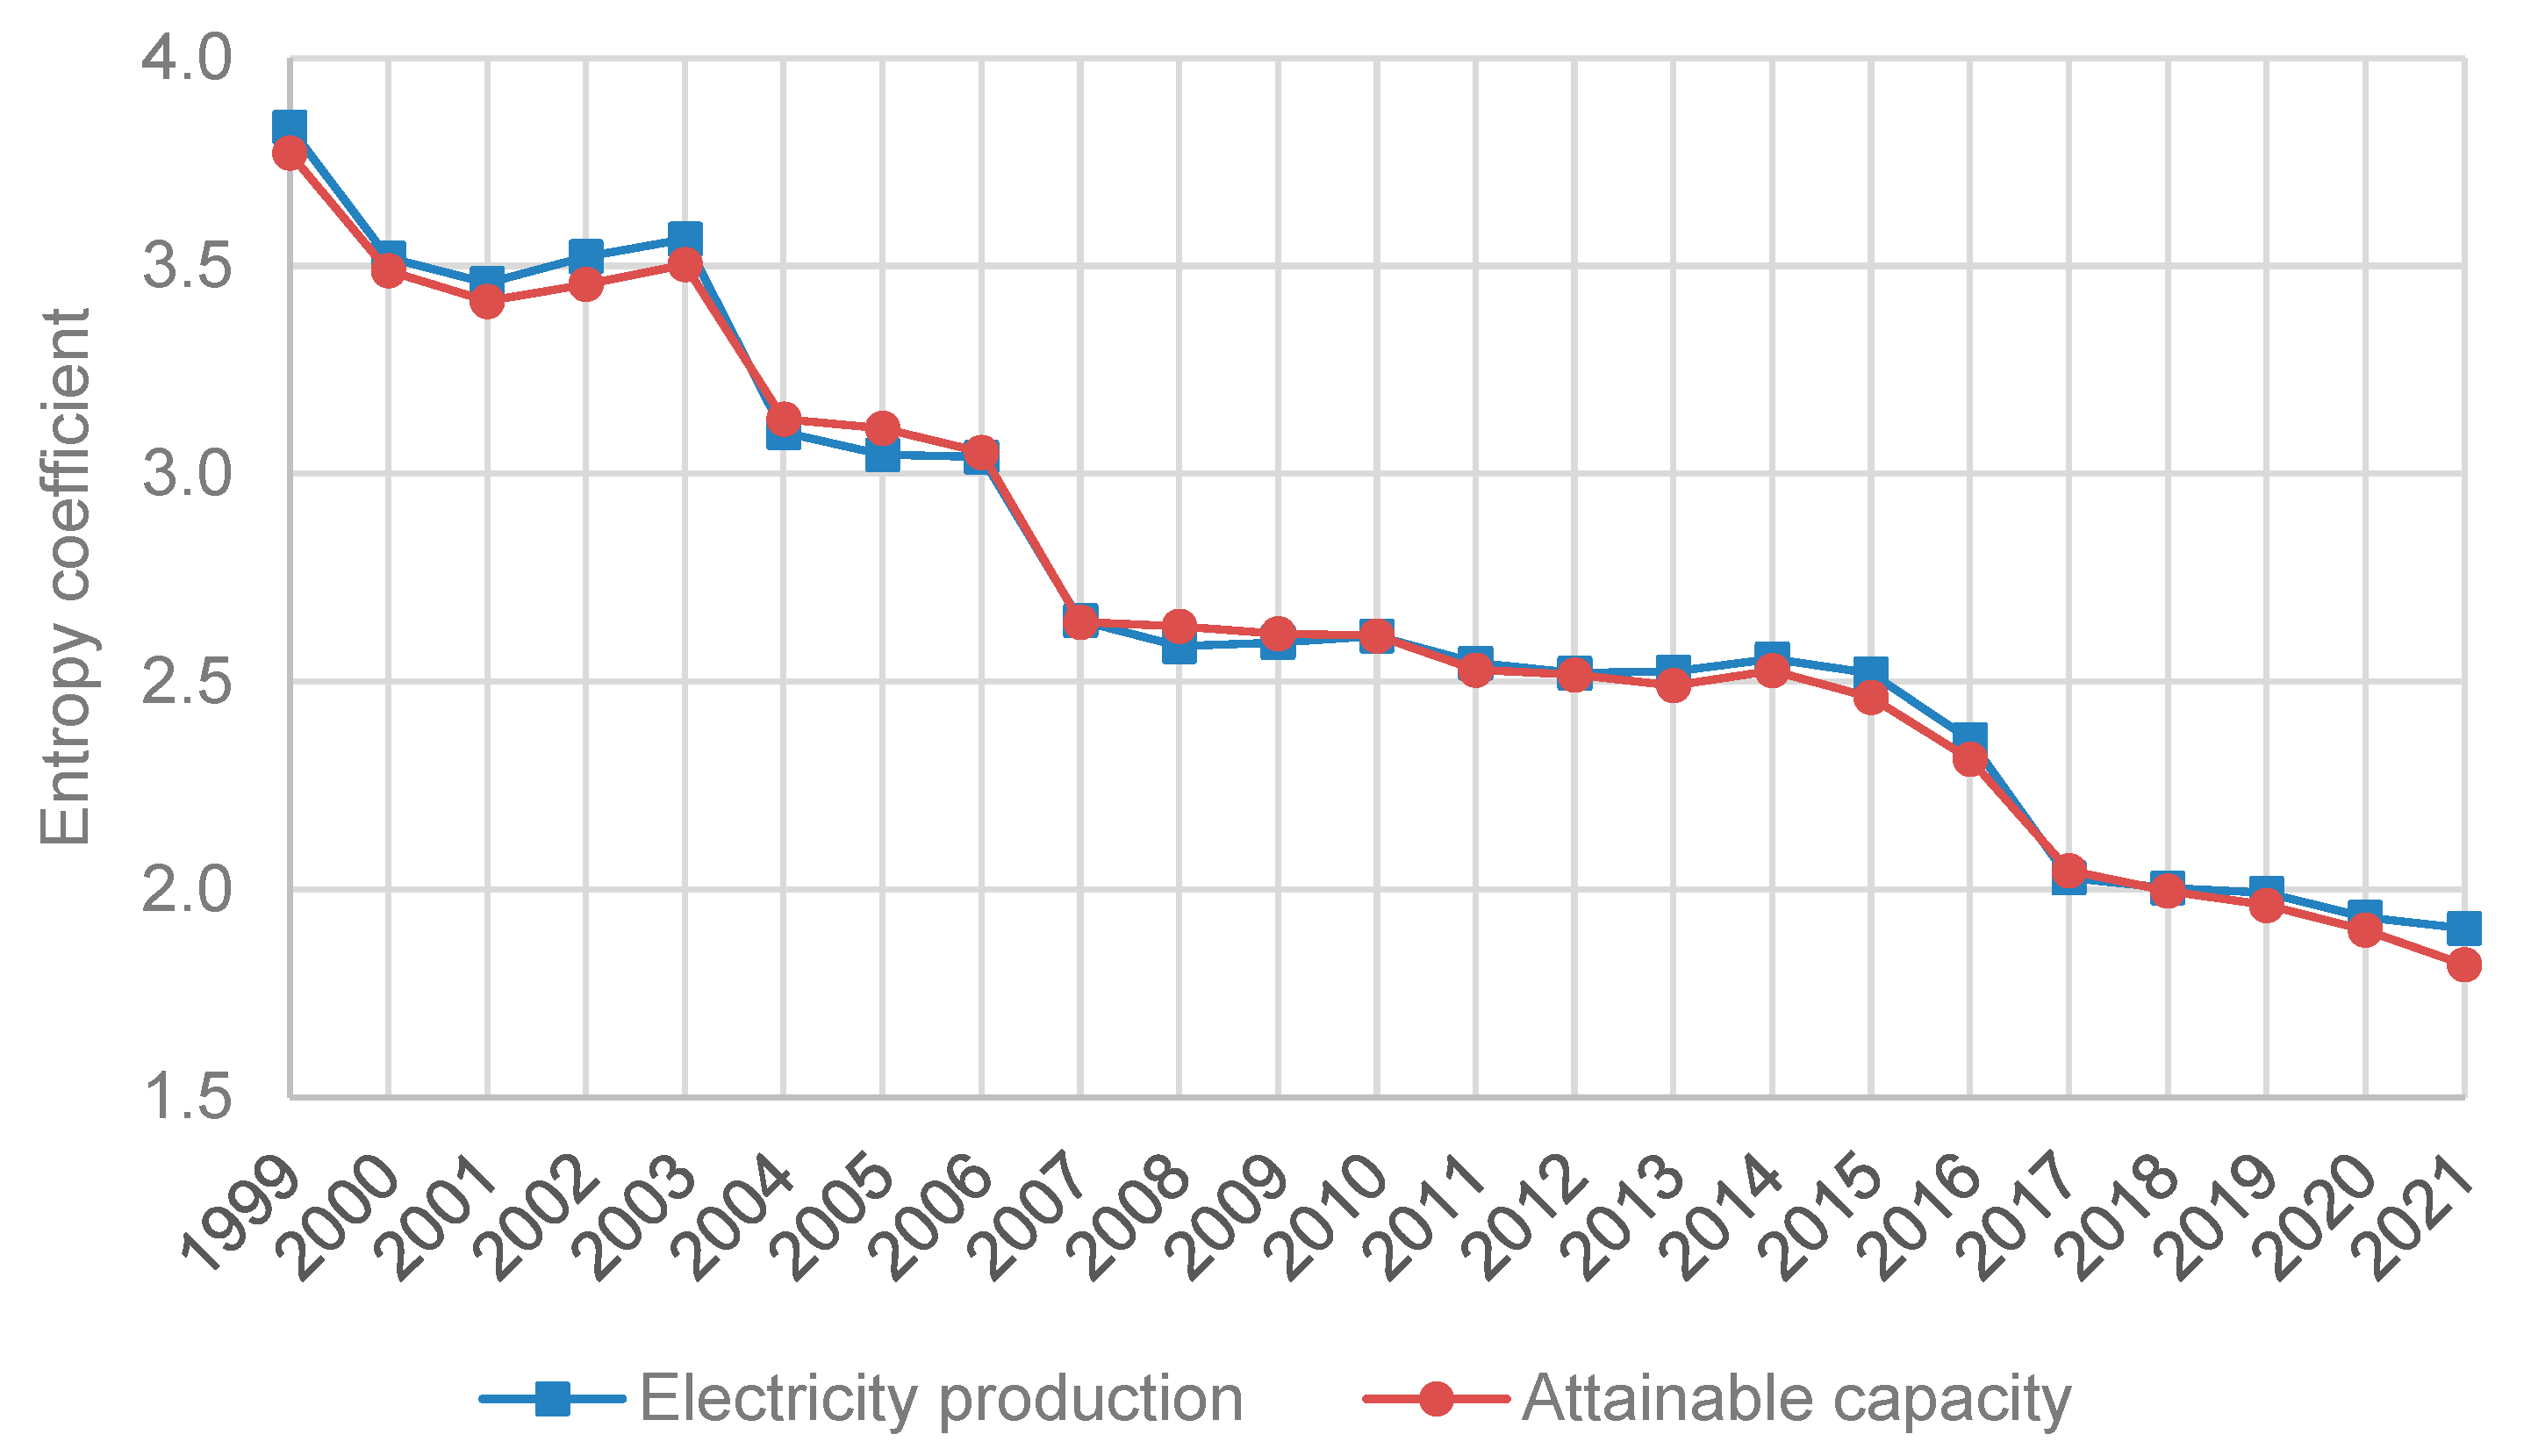
The increase in market concentration and potential market power is also shown in the values of the entropy coefficients (Figure 11). In 1999, entropy coefficients reached 3.8 and then decreased to 2.6 in 2008, still representing a concentrated market. This value remained at the same level until 2015, which indicated no significant change in the structure of ownership in those years, regardless of whether electricity generation or capacity was concerned.
In 2016–2017, the sale of assets by the GDF Suez and EDF Groups to state-owned companies resulted in a decrease in entropy coefficients to around 2.0 for both electricity generation and capacity. In 2021, a further reduction was observed, achieving values that were even lower than 2, representing a highly concentrated market (with respect to findings provided by Asgari and Monsef [28]).

5.4. Gini Coefficient

The changes in the Gini coefficients are presented in Figure 12. The first peaks were observed in 2005, amounting to 0.76 for electricity generation and 0.72 for capacity. This was the result of the horizontal consolidation of the power system carried out a year before. Then, despite further changes in ownership structure and an increase in the share of the largest electric power company, the Gini coefficients decreased, reaching 0.68 for electricity generation and 0.64 for capacity in 2015. However, a halving of the number of power companies was observed over those years, which resulted in the coefficients remaining constant and representing a moderately concentrated market.
The second peak in Gini coefficients was observed in 2016–2017. This was associated with the ownership changes described in the previous section that strengthened the role of the largest power company in the market. Finally, the index reached 0.79 for electricity generation and 0.75 for capacity in 2021, representing a high potential for market power in the sector (according to description provided in Section 3, value 1 represents the monopolistic market structure).

5.5. Residual Supply Index

The results of the Residual Supply Index are presented in Figure 13, Figure 14 and Figure 15. First, the surplus of capacity with respect to peak demand is examined. Second, the Residual Supply Index of the largest electric power company is investigated. Finally, the hourly RSI of the largest producer is analysed and discussed.
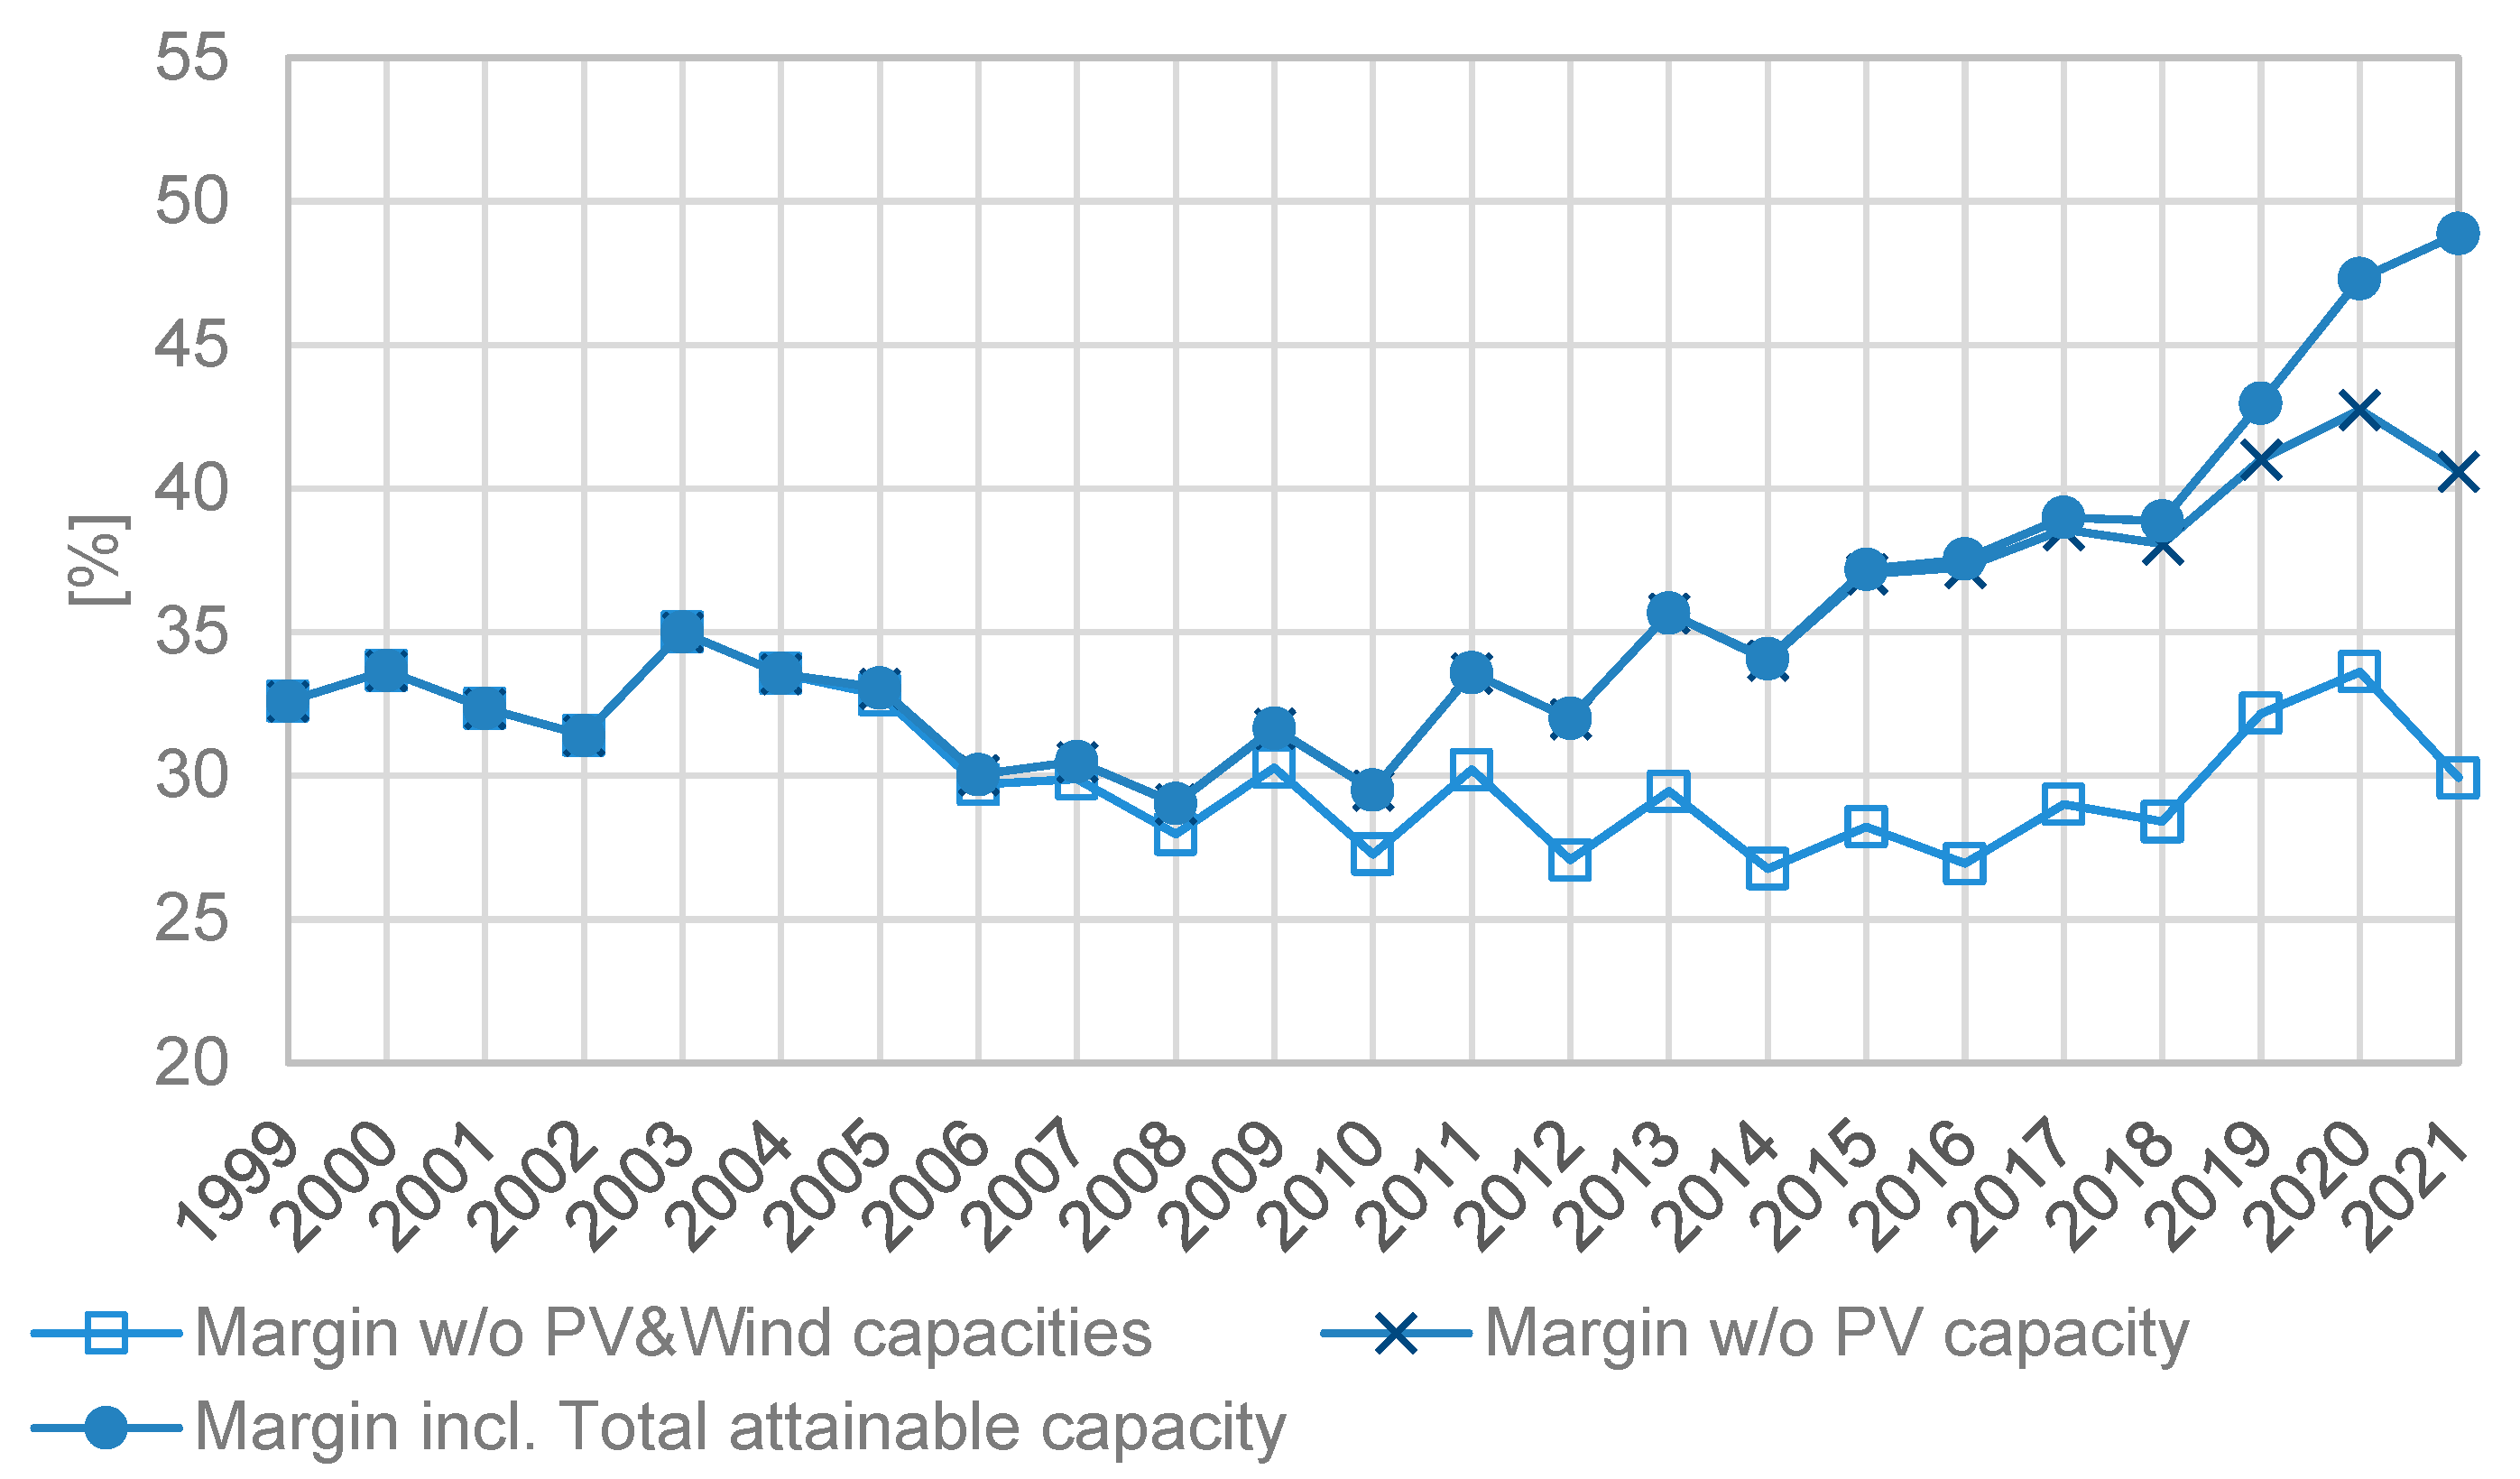
The surplus of capacity in 1999–2021 is presented in Figure 13. The minimum values, below 30%, occurred in 2008. Then, the surplus of capacity in the power system increased year by year, with the most dynamic growth observed in recent years, achieving 49% in 2021. The increase in the total capacity in the system was related to (a) an increase in the capacity of renewable units, first in onshore wind turbines and then in small-scale solar PV systems, (b) new investments in thermal power plants, and (c) the implementation of the capacity market as a capacity remuneration mechanism that has allowed for inefficient coal units to remain in the system in the years to come [41].
Since wind and solar PV power units are intermittent, their production is non-dispatchable and strongly depends on wind conditions and insolation. As a result, an increase in the capacity of wind and solar PV installations, without the development of energy storage systems, cannot secure the stability of the system. The surplus of capacity, excluding capacity in wind and solar PV generation units, was below 30% until 2018. In 2019–2020, the surplus increased to around 34%, and in 2021 decreased, again, to approx. 30%.
To extend the analysis, the Residual Supply Index was examined for the largest electric power company in the market. As a result, the share of its generation was calculated, as shown in Figure 14. In the previous study, the key market player was identified for the first time in 2008 with an RSI of 0.98 [7]. Then, the RSI calculated for the largest company increased to 1.38 in 2021 (except for 2017–2019, when the RSI decreased to 1.1 due to the largest company in Poland taking over 3.3 GW of power units from the EDF Group). Therefore, the results obtained for RSI analysis are in line with those presenting a surplus of total capacity in the system.
Considering the power system without renewables shows that the potential market power of the largest power company may be much higher, in particular in windless and sunless periods. The RSI is below one and decreased in the period of analysis, reaching 0.85 in 2021. The results indicate that the largest company was a pivotal supplier (according to the interpretation of this indicator provided in Section 3 [7,28]) over the entire period of analysis with a high potential for the exercise of market power in unfavourable hours for generation from onshore wind turbines and solar PV systems.
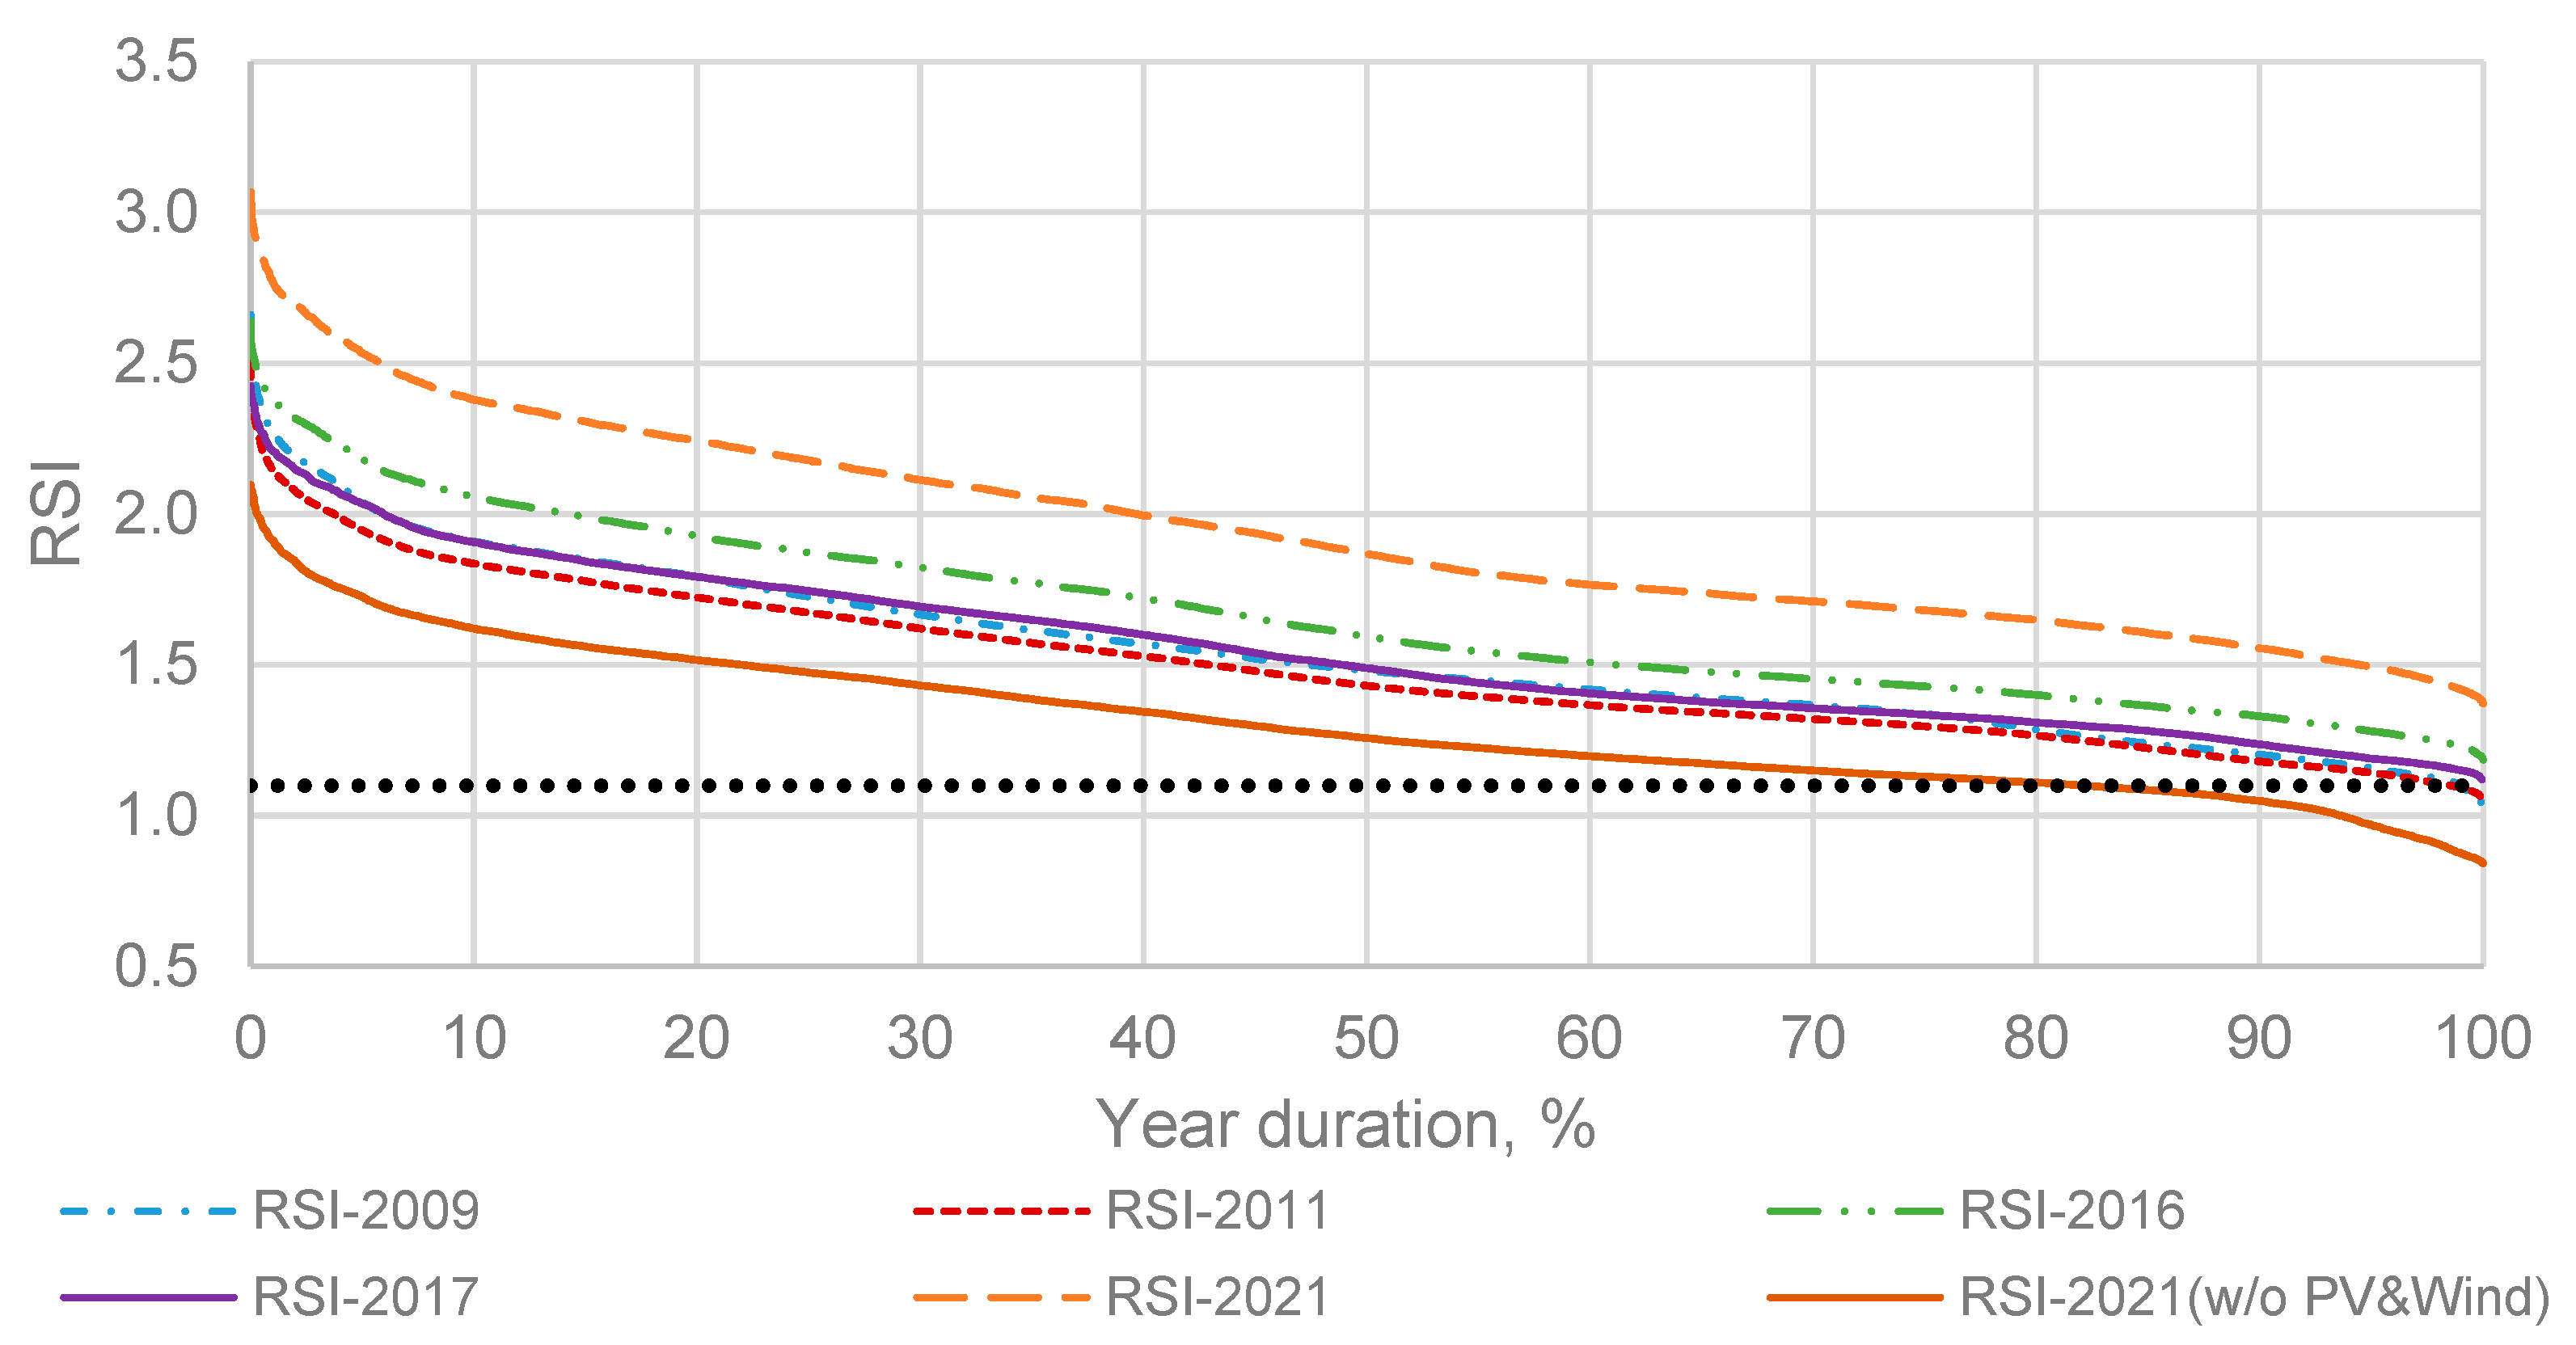
The Transmission System Operator may apply various measures when surplus capacity is not secured, e.g., intervention import from neighbouring systems or Demand Side Response. Therefore, having the occasional potential of market power does not necessarily mean that it can easily be exercised. With this in mind, the analysis of the length of periods when there is a potential for market power to be exercised in a given year is examined. The results are presented in Figure 15. When total capacity is considered, there are almost no hours wherein one company has the potential to impact wholesale electricity prices (RSI > 1).
However, the exclusion of wind turbines and solar PV installations from the analysis shows that the RSIs were below 1 for about 7% of the time per annum. Taking into account the limit value recommended by the California Transmission System Operator at the level of 1.1, there is about 18% of the time per annum with values of RSIs below this limit. According to these recommendations, the share should not exceed 5% of the annual hours [42].

5.6. Lerner Index

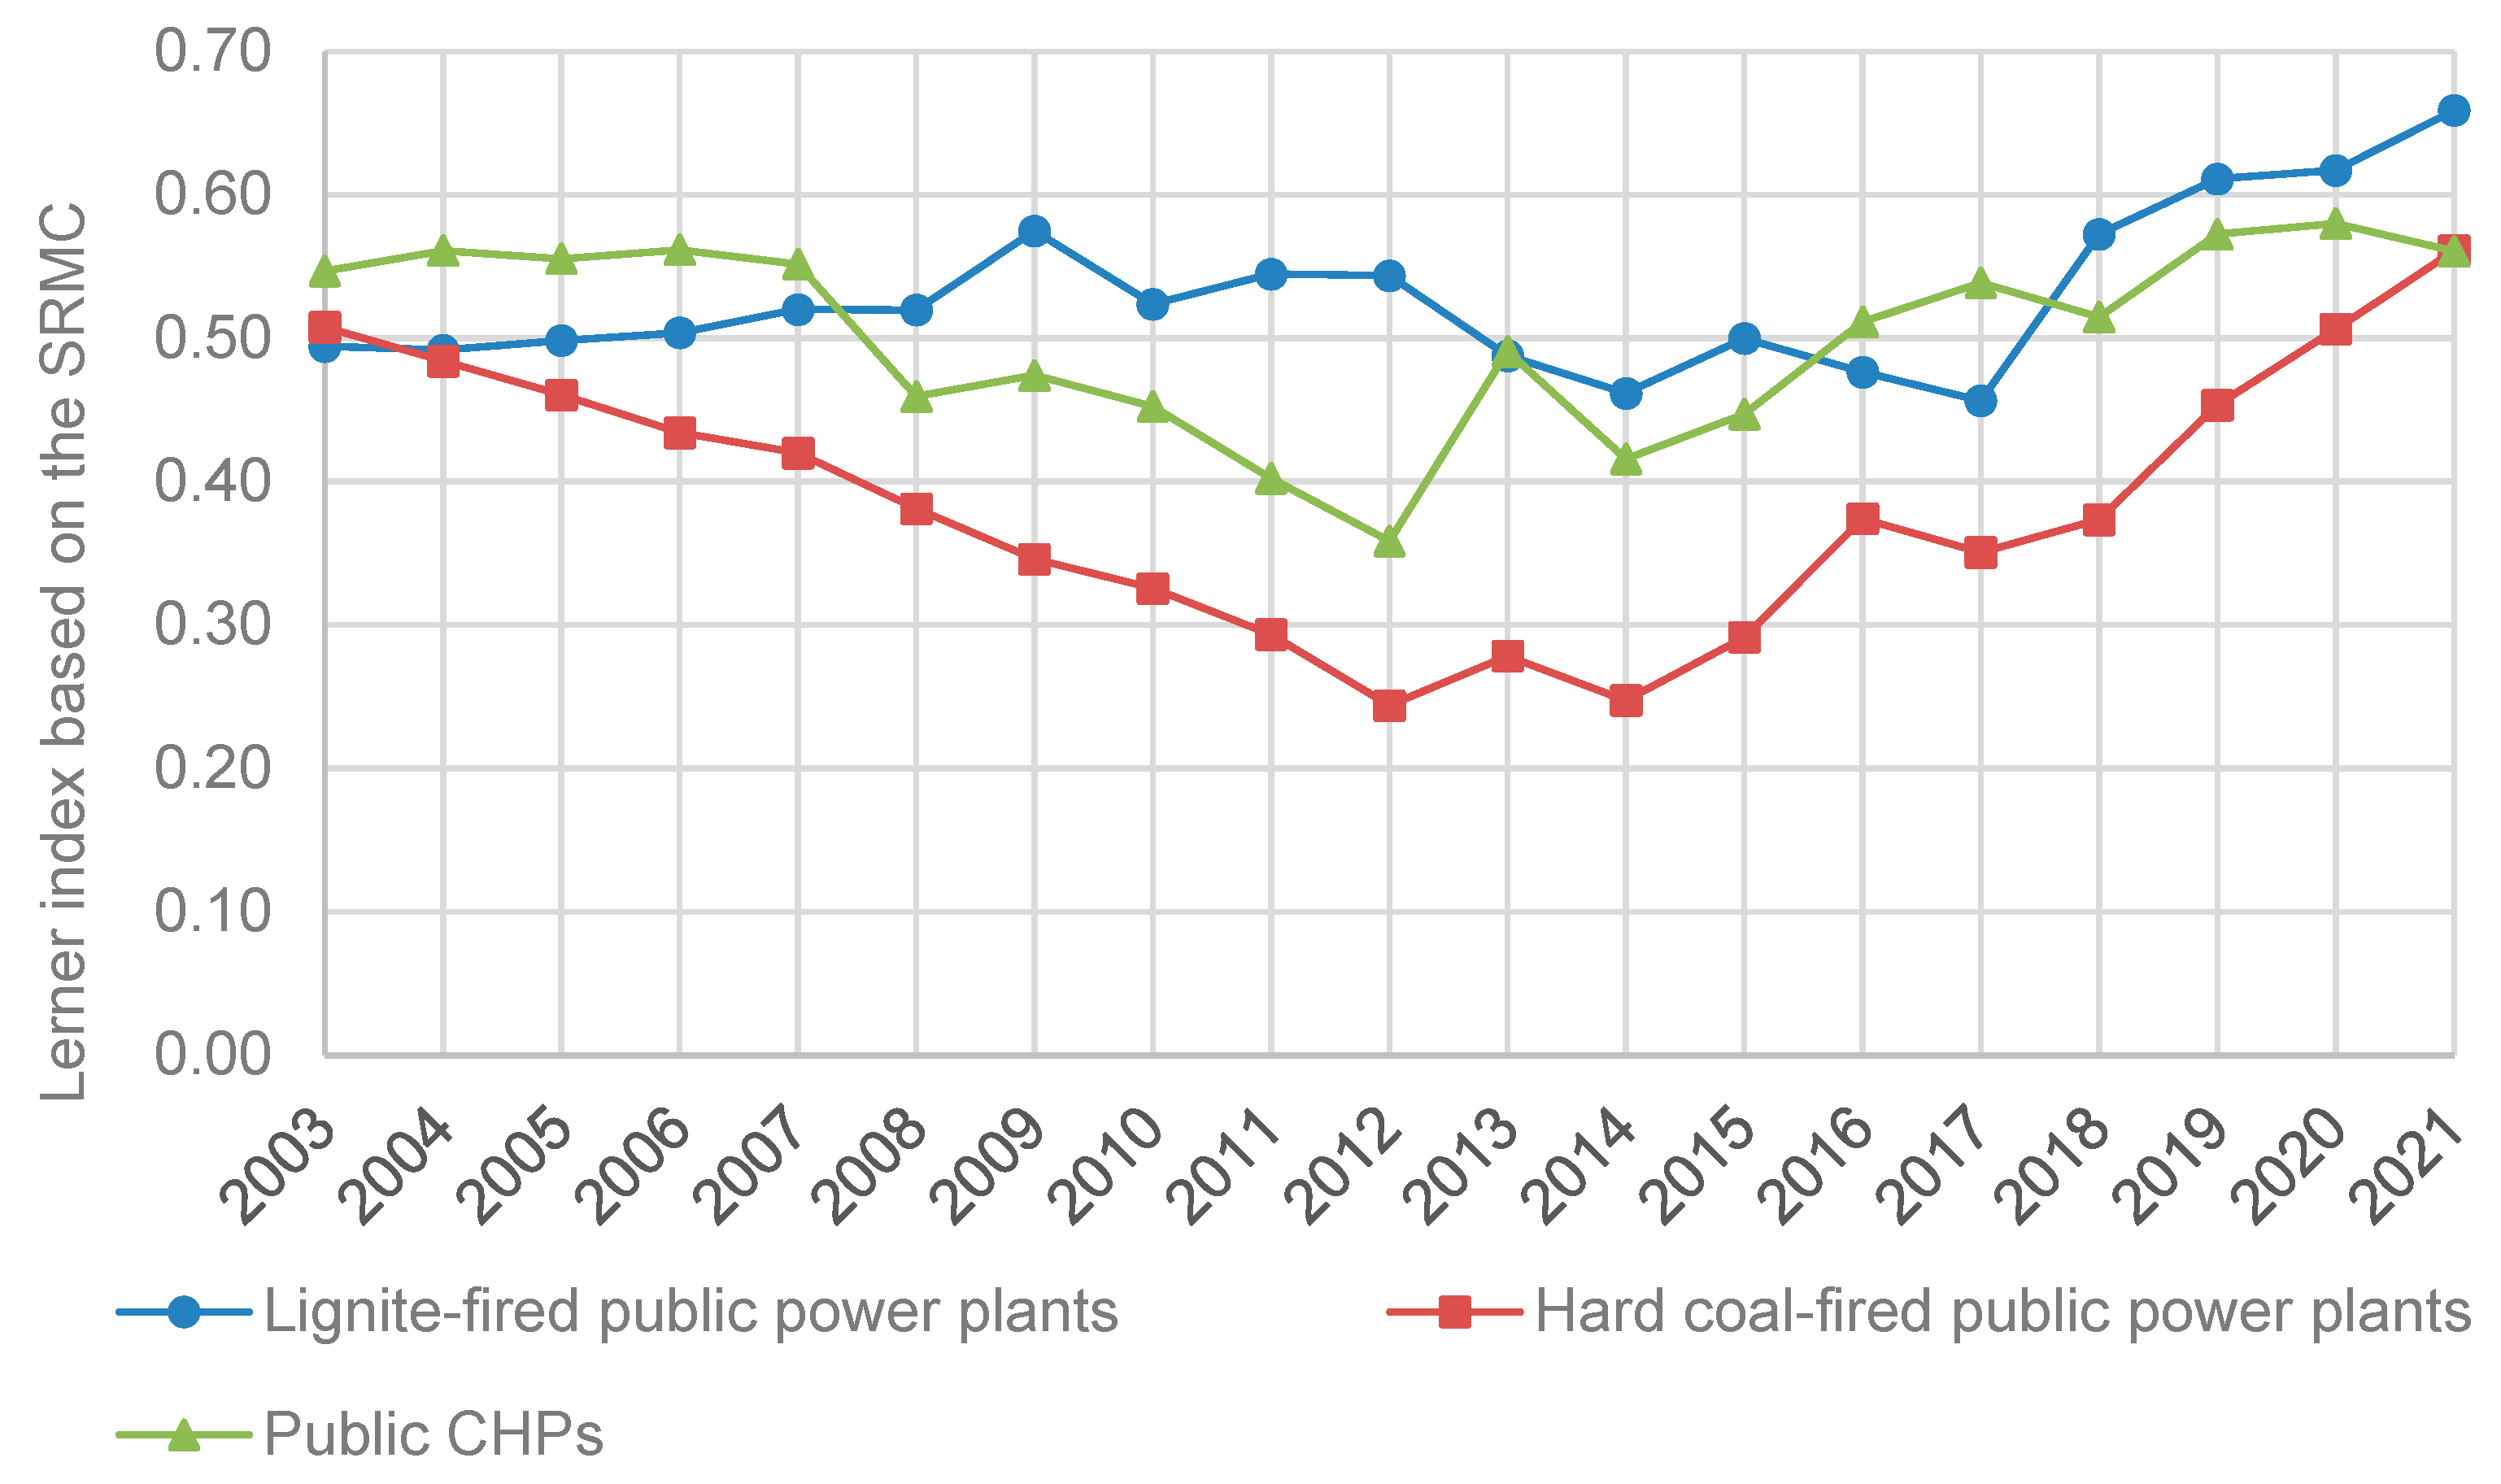
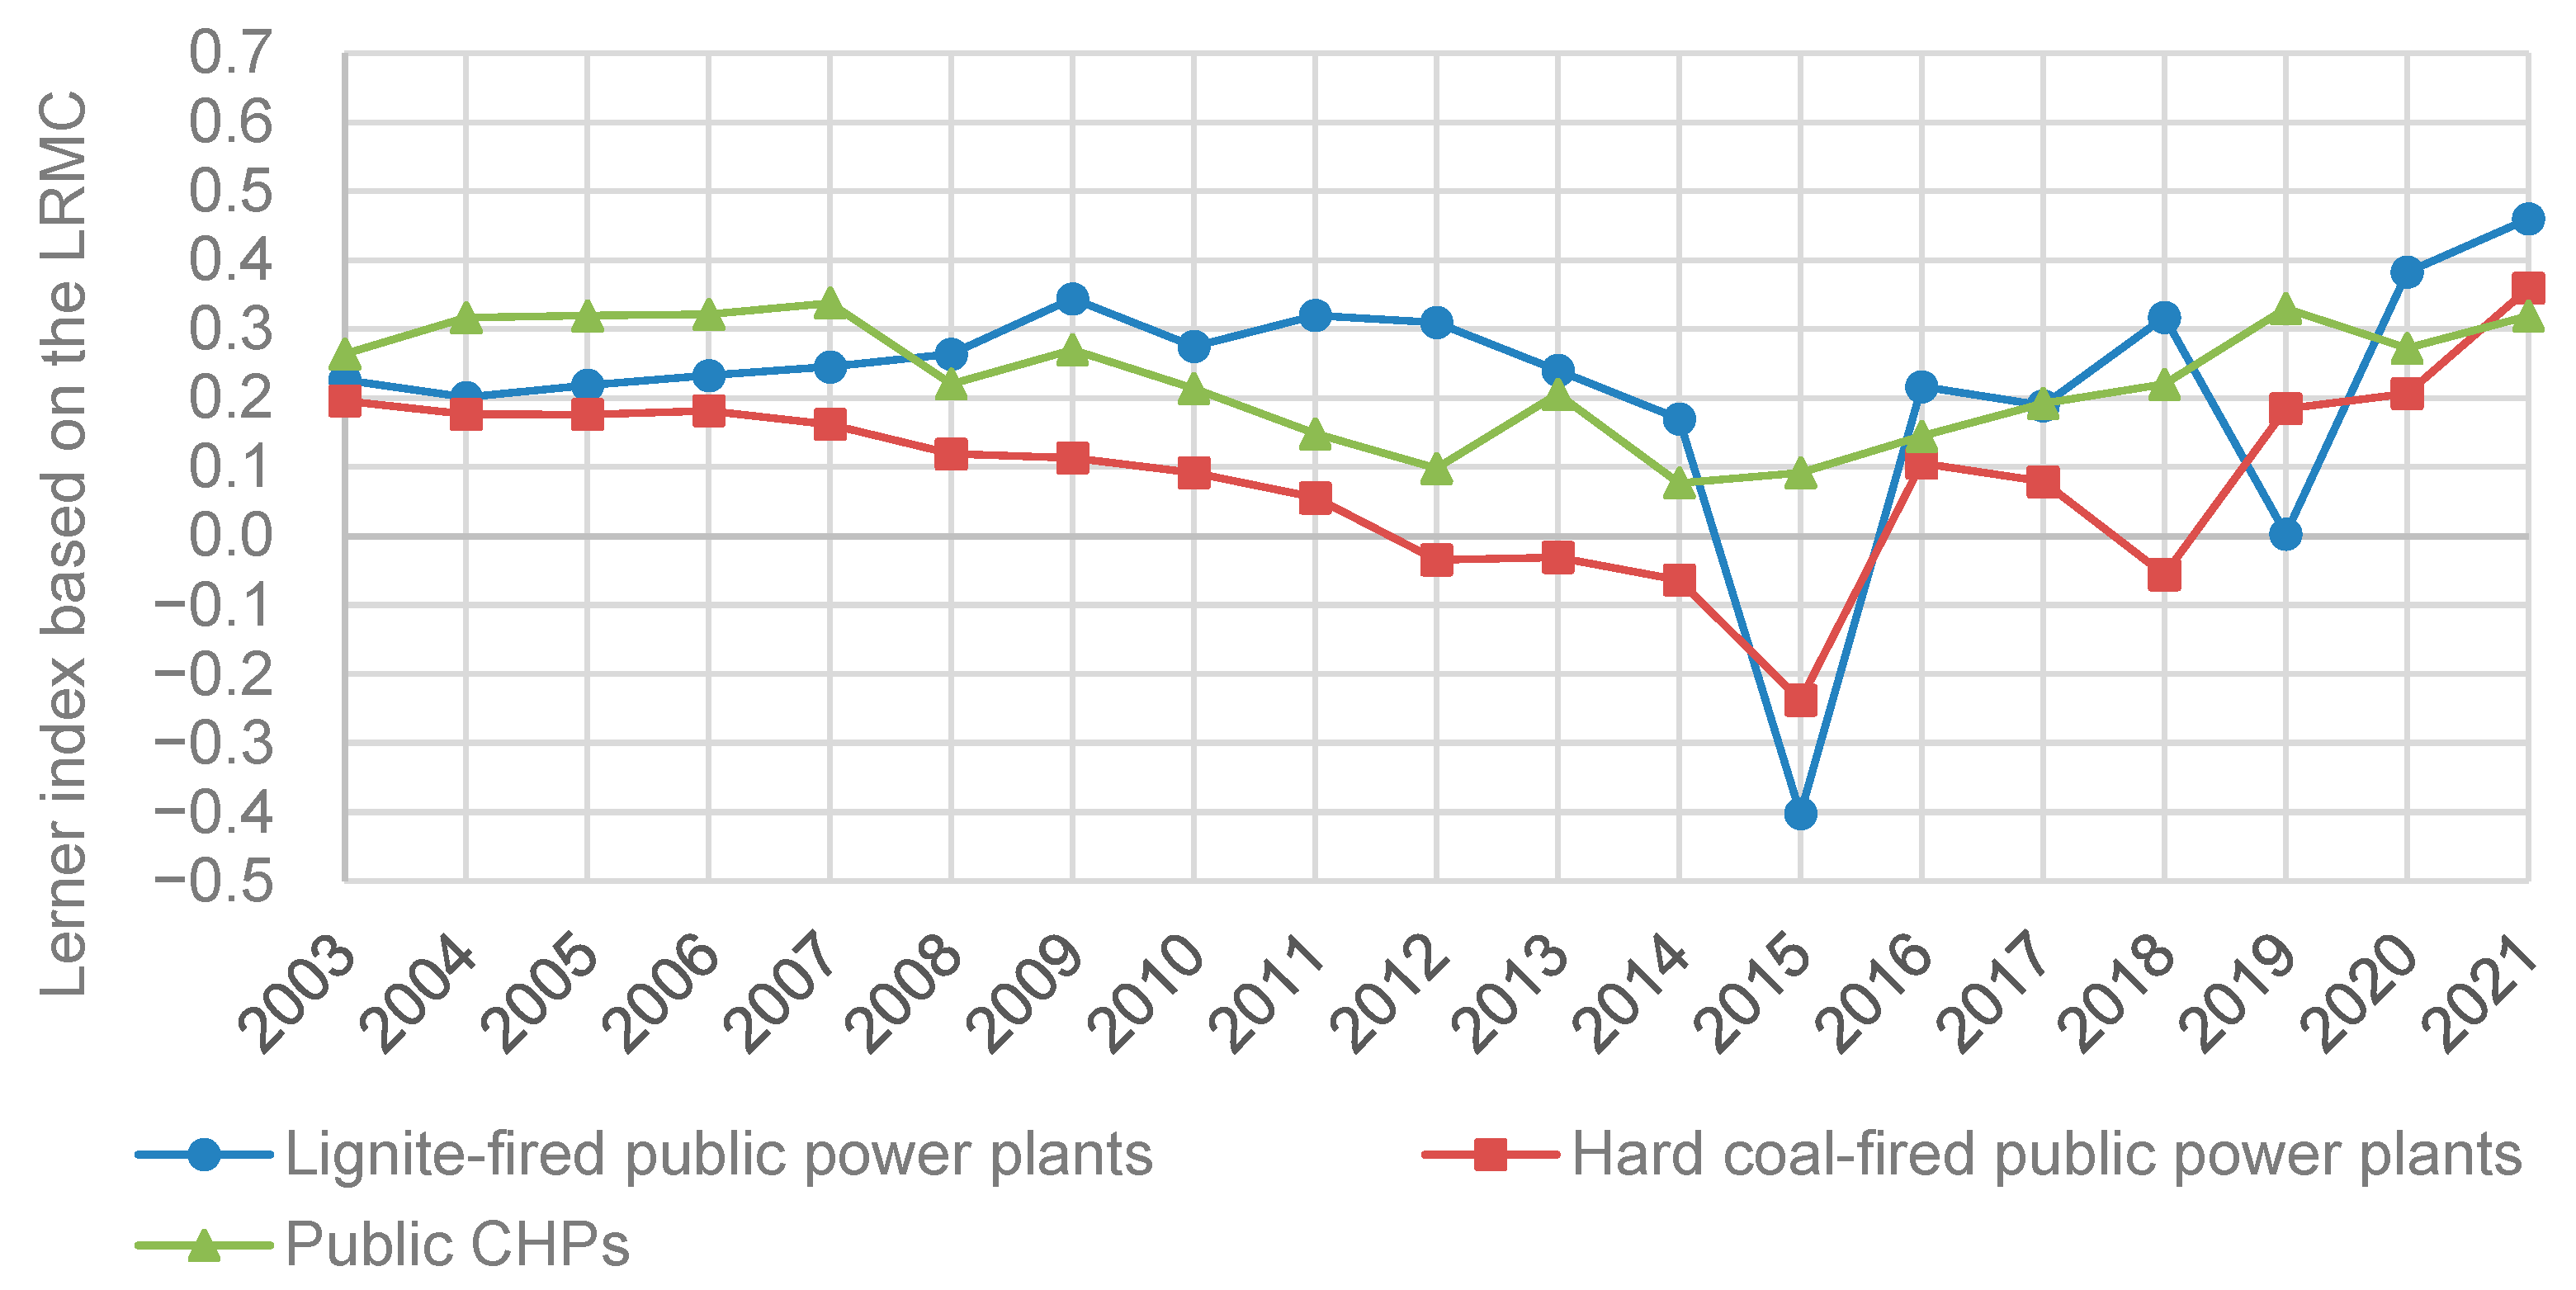
The Lerner Index was calculated using data on the costs of electricity generation in public thermal power plants and CHPs and then examined. First, the index based on short-run marginal costs (SRMCs) was analysed (Figure 16). Second, the index based on long-run marginal costs (LRMCs) was investigated (Figure 17).
The results of the Lerner Index based on the SRMC reveal high margins, reaching over 50% for lignite-fired power plants and over 45% for hard coal-fired CHPs in 2009–2017. In these years, the lowest margins were observed for hard coal-fired public power plants, which resulted from highly variable costs (costs of fuel and carbon allowances) of electricity generation in these units and low prices of electricity. The margin decreased from 37% in 2009 to 24% in 2017.
Since 2018, a significant increase in wholesale electricity prices has been observed. As a result, the Lerner Index (SRMC) increased in 2018–2021, regardless of the generation unit considered. In the case of hard coal-fired units (power plants and CHPs), the Lerner Index reached 56%, whereas, in the case of lignite-fired power plants, the index was 66% in 2021. The high profitability of high-emission coal-fired units may partly result from the exercise of market power.
The analysis of the Lerner Index conducted by considering fixed costs confirms the conclusions drawn for this index based on SRMC. The highest margins were achieved by lignite-fired power plants and coal-fired CHPs (except for 2015 and 2019, when the electric power companies that owned lignite-fired units updated their write-offs due to the impairment of their fixed assets). The average Lerner indices were around 26% for the former and 16% for the latter. For hard coal-fired power plants, the index decreased from 11% in 2009 to 24% in 2015.
In the years that followed the values increased, regardless of the generation unit (excluding fluctuations related to the revaluation of generation assets). The Lerner indices reached relatively high levels and ranged from 32 to 36% for hard coal-fired power plants and CHPs, and almost 46% for lignite-fired power plants.

6. Conclusions and Policy Implications

This paper assesses the impact of the potential of market power, taking Poland as a case study. Since the previous study which examined market power up until 2008, mergers and acquisitions have taken place in recent years that require a revision of the analysis of the Polish power system, reanalysing the structural and behavioural indices and comparing the results and trends with the previous ones. The results of the quantitative analysis carried out in this study are as follows:
  • The concentration ratio of the largest electric power company increased from 37.8% in 2009 to 40.8% in 2021 in terms of electricity generation and decreased from 29.7% to 29.4% in terms of capacity.
  • The concentration ratio of the three largest electric power companies increased from 60.5% in 2009 to 66.0% in 2021 in terms of electricity generation and decreased from 53.7% to 50.2% in terms of capacity.
  • The number of companies with at least a 5% market share decreased from five in 2009 to three in 2021 in terms of electricity generation and from six to three in terms of capacity.
  • The Herfindahl–Hirschman Index increased from 1858.6 in 2009 to 2020.9 in 2021 in terms of electricity generation and decreased from 1334.4 to 1101.1 in terms of capacity.
  • The Entropy Coefficient decreased from 2.6 in 2009 to 1.9 in 2021 in terms of electricity generation and decreased from 2.6 to 1.8 in terms of capacity.
  • The Gini Coefficient increased from 0.68 in 2009 to 0.78 in 2021 in terms of electricity generation and from 0.65 to 0.75 in terms of capacity.
  • The Residual Supply Index of the largest electric power company increased from 1.03 in 2009 to 1.38 in 2021 when the total capacity in the system was considered and decreased from 1.0 to 0.85 when wind and solar PV capacity was excluded.
  • The Lerner Index based on short-run marginal costs increased from 0.57 in 2009 to 0.66 in 2021 for lignite-fired power plants, from 0.35 to 0.56 for hard coal-fired power plants, and from 0.47 to 0.56 for hard coal-fired CHPs.
  • The Lerner Index based on long-run marginal costs increased from 0.34 in 2009 to 0.46 in 2021 for lignite-fired power plants, from 0.11 to 0.36 for hard coal-fired power plants, and from 0.27 to 0.32 for hard coal-fired CHPs.
While the dynamic increase in renewable capacity has an impact on the reduction in the concentration ratios in terms of capacity, the market is still highly concentrated in terms of electricity generation. In addition, the withdrawal of significant private capital in 2016 and 2017 and the takeover of generation assets by state-controlled companies resulted in an increased concentration of the market and the potential for the exercise of market power.
The analysis of the Lerner Index shows that companies may overuse their dominant position in the market. The reports published by the Energy Regulator Office also confirm that key market players may use their position and impact electricity prices. At the end of 2018, the Energy Regulatory Office initiated an investigation procedure regarding possible manipulation resulting in an excessive increase in electricity prices in base future contracts for 2019 [43]. According to the analysis of the Energy Regulatory Office, the significant increase in electricity prices could not solely result from the increase in the prices of fuels and EU allowances. The clean dark spread, which is the difference between the price of electricity and the unit costs of fuels and EU allowances, was approximately twice as large as compared to the same period in previous years. As a result, the exercise of market power was indicated as a cause for these increases.
Summarising, there is still a need to monitor the operation of power companies, and in particular the largest ones. It should be emphasised that all electric power companies with a market share above 5% are currently controlled by the state, which reduces their competitiveness. In addition, further mergers and acquisitions are expected in the years to come. All coal-fired power plants are expected to be separated from their current owners and consolidated within one state-owned company. While this process is aimed at improving the financial liquidity of the electric power companies willing to accelerate the energy transition, that would also lead to a further increase in their potential market power.
Based on the lessons learnt from previous mergers and acquisitions, we recommend extending the market power analysis conducted by the Energy Regulatory Office in Poland to mitigate the potential negative consequences of reducing market competition. First, the measurement should consider the power system with and without non-dispatchable renewable capacities separately. The results presented in this study reveal the significant difference between the market power potential of the largest power companies depending on consideration of wind and PV capacities. The low utilisation rates of renewable sources result in their unreliability in sunless and windless periods. Second, the analyses carried out by the ERO should include at a minimum advanced analyses based upon market power indices. So far, only the concentration ratios, the HHI index, and the number of companies with at least a 5% market share are applied to measure the potential of market power in Poland. The findings of this study show that other indices, namely the Gini Coefficient, the RSI, and the Lerner Indices, also provide crucial information about the market power behaviour of power companies. We believe that extending the analysis of market power in the annual reports of the ERO may provide a more adequate picture of market concentration. Third, further mergers and acquisitions should be based on robust model analyses. The ERO should include new tools to oversee power companies which take potential consequences and risks into account.

Author Contributions

Conceptualisation, P.K., A.K. and J.K.; methodology, P.K., A.K. and J.K.; software, P.K.; validation, P.K., A.K. and J.K.; formal analysis, P.K., A.K. and J.K.; investigation, P.K., A.K. and J.K.; resources, P.K. and A.K.; data curation, P.K. and A.K.; writing—original draft preparation, P.K., A.K. and J.K.; writing—review and editing, P.K., A.K. and J.K.; visualisation, P.K. and A.K.; supervision, J.K. All authors have read and agreed to the published version of the manuscript.

Funding

This research received no external funding.

Data Availability Statement

Not applicable.

Acknowledgments

This work was carried out as part of the statutory research activity of the Mineral and Energy Economy Research Institute of the Polish Academy of Sciences.

Conflicts of Interest

The authors declare no conflict of interest.

Nomenclature

NameExplanation
Abbreviations
10H10 times the tip height of a wind turbine
CHPCombined heat and power
CRConcentration ratio
ECEntropy coefficient
EROEnergy Regulatory Office
EUAEuropean Union Allowance
EU ETSEuropean Union Emission Trading System
GCGini Coefficient
HHIHerfindahl–Hirschman Index
LILerner Index
NR5Number of companies with at least a 5% market share
LRMCLong-run marginal cost
OPFsOpen pension funds
PPPower plant
RSIResidual Supply Index
SRMCShort-run marginal cost
Symbols
CR1; CR3Concentration ratios of the largest (CR1) and three largest (CR3) companies in the market
C R i Market   share   of   the   i -th company
C R ¯ Average market share
D t Demand in time period t
S i Supply   of   the   i -th company
m c i Marginal cost of electricity generation of the i -th company
n Number of electric power companies in the market
p Wholesale electricity price
q i Quantity of electricity generation or capacity of the i -th company
t Time period

References

  1. Pollitt, M.G. The Role of Policy in Energy Transitions: Lessons from the Energy Liberalisation Era. Energy Policy 2012, 50, 128–137. [Google Scholar] [CrossRef]
  2. Keppler, J.H.; Quemin, S.; Saguan, M. Why the Sustainable Provision of Low-Carbon Electricity Needs Hybrid Markets. Energy Policy 2022, 171, 113273. [Google Scholar] [CrossRef]
  3. Kirschen, D.; Strbac, G. Fundamentals of Power System Economics, 2nd ed.; John Wiley & Sons Ltd.: Hoboken, NJ, USA, 2019. [Google Scholar]
  4. Komorowska, A.; Kaszyński, P.; Kamiński, J. Where Does the Capacity Market Money Go? Lessons Learned from Poland. Energy Policy 2023, 173, 113419. [Google Scholar] [CrossRef]
  5. Nicolli, F.; Vona, F. Energy Market Liberalization and Renewable Energy Policies in OECD Countries. Energy Policy 2019, 128, 853–867. [Google Scholar] [CrossRef] [Green Version]
  6. Kamiński, J. The Impact of Liberalisation of the Electricity Market on the Hard Coal Mining Sector in Poland. Energy Policy 2009, 37, 925–939. [Google Scholar] [CrossRef]
  7. Kamiński, J. The Development of Market Power in the Polish Power Generation Sector: A 10-Year Perspective. Energy Policy 2012, 42, 136–147. [Google Scholar] [CrossRef]
  8. Ciarreta, A.; Nasirov, S.; Silva, C. The Development of Market Power in the Spanish Power Generation Sector: Perspectives after Market Liberalization. Energy Policy 2016, 96, 700–710. [Google Scholar] [CrossRef]
  9. Prabhakar Karthikeyan, S.; Jacob Raglend, I.; Kothari, D.P. A Review on Market Power in Deregulated Electricity Market. Int. J. Electr. Power Energy Syst. 2013, 48, 139–147. [Google Scholar] [CrossRef]
  10. Kvålseth, T.O. Relationship between Concentration Ratio and Herfindahl-Hirschman Index: A Re-Examination Based on Majorization Theory. Heliyon 2018, 4, e00846. [Google Scholar] [CrossRef] [Green Version]
  11. Hesamzadeh, M.R.; Biggar, D.R.; Hosseinzadeh, N. The TC-PSI Indicator for Forecasting the Potential for Market Power in Wholesale Electricity Markets. Energy Policy 2011, 39, 5988–5998. [Google Scholar] [CrossRef]
  12. Shafie-khah, M.; Parsa Moghaddam, M.; Sheikh-El-Eslami, M.K. Development of a Virtual Power Market Model to Investigate Strategic and Collusive Behavior of Market Players. Energy Policy 2013, 61, 717–728. [Google Scholar] [CrossRef]
  13. Samadi, M.; Hajiabadi, M.E. Assessment of the Collusion Possibility and Profitability in the Electricity Market: A New Analytical Approach. Int. J. Electr. Power Energy Syst. 2019, 112, 381–392. [Google Scholar] [CrossRef]
  14. Beni, S.A.; Sheikh-El-Eslami, M.K. Market Power Assessment in Electricity Markets Based on Social Network Analysis. Comput. Electr. Eng. 2021, 94, 107302. [Google Scholar] [CrossRef]
  15. De Almeida, L.; Esposito, F.; van Zeben, J. When Indicators Fail Electricity Policies: Pitfalls of the EU’s Retail Energy Market Barrier Index. Energy Policy 2022, 165, 112892. [Google Scholar] [CrossRef]
  16. Loi, T.S.A.; Jindal, G. Electricity Market Deregulation in Singapore–Initial Assessment of Wholesale Prices. Energy Policy 2019, 127, 1–10. [Google Scholar] [CrossRef]
  17. Sensoy, N. Market Power Analysis for the Turkish Electricity Market. In Proceedings of the International Conference on the European Energy Market, EEM, Ljubljana, Slovenia, 18–20 September 2019. [Google Scholar]
  18. Marshall, L.; Bruce, A.; MacGill, I. Assessing Wholesale Competition in the Australian National Electricity Market. Energy Policy 2021, 149, 112066. [Google Scholar] [CrossRef]
  19. Shukla, U.K.; Thampy, A. Analysis of Competition and Market Power in the Wholesale Electricity Market in India. Energy Policy 2011, 39, 2699–2710. [Google Scholar] [CrossRef]
  20. Salarkheili, S.; Foroud, A.A. Market Power Assessment in Electricity Markets: Supply Function Equilibrium-Based Model. Int. Trans. Electr. Energy Syst. 2013, 23, 553–569. [Google Scholar] [CrossRef]
  21. Bataille, M.; Bodnar, O.; Steinmetz, A.; Thorwarth, S. Screening Instruments for Monitoring Market Power — The Return on Withholding Capacity Index (RWC). Energy Econ. 2019, 81, 227–237. [Google Scholar] [CrossRef] [Green Version]
  22. Bataille, M.; Steinmetz, A.; Thorwarth, S. Screening Instruments for Monitoring Market Power in Wholesale Electricity Markets–Lessons from Applications in Germany. SSRN Electron. J. 2014. [Google Scholar] [CrossRef] [Green Version]
  23. Szőke, T.; Hortay, O.; Balogh, E. Asymmetric Price Transmission in the Hungarian Retail Electricity Market. Energy Policy 2019, 133, 110879. [Google Scholar] [CrossRef]
  24. Busu, M. A Market Concentration Analysis of the Biomass Sector in Romania. Resources 2020, 9, 64. [Google Scholar] [CrossRef]
  25. Kruger, W.; Nygaard, I.; Kitzing, L. Counteracting Market Concentration in Renewable Energy Auctions: Lessons Learned from South Africa. Energy Policy 2021, 148, 111995. [Google Scholar] [CrossRef]
  26. Financial Aspects in Energy; Springer Science & Business Media: Berlin/Heidelberg, Germany, 2011. [CrossRef]
  27. Sutrisno, A.; Nomaler, Ö.; Alkemade, F. Has the Global Expansion of Energy Markets Truly Improved Energy Security? Energy Policy 2021, 148, 111931. [Google Scholar] [CrossRef]
  28. Asgari, M.H.; Monsef, H. Market Power Analysis for the Iranian Electricity Market. Energy Policy 2010, 38, 5582–5599. [Google Scholar] [CrossRef]
  29. Brown, D.P.; Zarnikau, J.; Woo, C.-K.; Woo, H.-C. Does Locational Marginal Pricing Impact Generation Investment Location Decisions? An Analysis of Texas’s Wholesale Electricity Market. J. Regul. Econ. 2020, 58, 99–140. [Google Scholar] [CrossRef]
  30. Keller, J.T.; Kuper, G.H.; Mulder, M. Challenging Natural Monopolies: Assessing Market Power of Gas Transmission System Operators for Cross-Border Capacity. Energy Policy 2022, 170, 113228. [Google Scholar] [CrossRef]
  31. Energy Statistics Energy Market Agency. Available online: https://www.are.waw.pl/wydawnictwa#statystyka-elektroenergetyki-polskiej (accessed on 6 February 2023).
  32. Dechezleprêtre, A.; Nachtigall, D.; Venmans, F. The Joint Impact of the European Union Emissions Trading System on Carbon Emissions and Economic Performance. J. Environ. Econ. Manag. 2023, 118, 102758. [Google Scholar] [CrossRef]
  33. Economidou, M.; Ringel, M.; Valentova, M.; Castellazzi, L.; Zancanella, P.; Zangheri, P.; Serrenho, T.; Paci, D.; Bertoldi, P. Strategic Energy and Climate Policy Planning: Lessons Learned from European Energy Efficiency Policies. Energy Policy 2022, 171, 113225. [Google Scholar] [CrossRef]
  34. Rogus, R.; Castro, R.; Sołtysik, M. Comparative Analysis of Wind Energy Generation Forecasts in Poland and Portugal and Their Influence on the Electricity Exchange Prices. Inventions 2020, 5, 35. [Google Scholar] [CrossRef]
  35. Ministry of Energy. The Act on Wind Farm Investments (Dz.U. 2016 Poz. 961); Ministry of Energy: Warsaw, Poland, 2016. [Google Scholar]
  36. Sliz-Szkliniarz, B.; Eberbach, J.; Hoffmann, B.; Fortin, M. Assessing the Cost of Onshore Wind Development Scenarios: Modelling of Spatial and Temporal Distribution of Wind Power for the Case of Poland. Renew. Sustain. Energy Rev. 2019, 109, 514–531. [Google Scholar] [CrossRef]
  37. Kulpa, J.; Olczak, P.; Surma, T.; Matuszewska, D. Comparison of Support Programs for the Development of Photovoltaics in Poland: My Electricity Program and the RES Auction System. Energies 2021, 15, 121. [Google Scholar] [CrossRef]
  38. Kaczmarzewski, S.; Matuszewska, D.; Sołtysik, M. Analysis of Selected Service Industries in Terms of the Use of Photovoltaics before and during the COVID-19 Pandemic. Energies 2021, 15, 188. [Google Scholar] [CrossRef]
  39. Office of Competition and Consumer Protection Decision No. DKK-156/2017. Available online: https://decyzje.uokik.gov.pl/bp/dec_prez.nsf/1/99CFF28A924BF296C12581E10052CFCA?editDocument&act=Decyzja (accessed on 15 March 2023).
  40. Energy Market Agency. Technical and Economic Situation of the Power Sector; ARE: Warsaw, Poland, 2022. [Google Scholar]
  41. Komorowska, A. Can Decarbonisation and Capacity Market Go Together? The Case Study of Poland. Energies 2021, 14, 5151. [Google Scholar] [CrossRef]
  42. Shefferin, A. Predicting Market Power Using the Residual Supply Index. Department of Market Analysis. California Independent System Operator (CISO). 2002. Available online: https://www.caiso.com/Documents/PredictingMarketPowerUsingResidualSupplyIndex_AnjaliSheffrin_FERCMarketMonitoringWorkshop_December3-4_2002.pdf (accessed on 15 February 2023).
  43. Energy Regulatory Office Potential Manipulation in Energy Market. Available online: https://www.ure.gov.pl/pl/urzad/informacje-ogolne/aktualnosci/8257,Prezes-URE-zlozyl-kolejne-zawiadomienie-do-Prokuratury-o-podejrzeniu-popelnienia.html#_ftn1 (accessed on 12 February 2023).
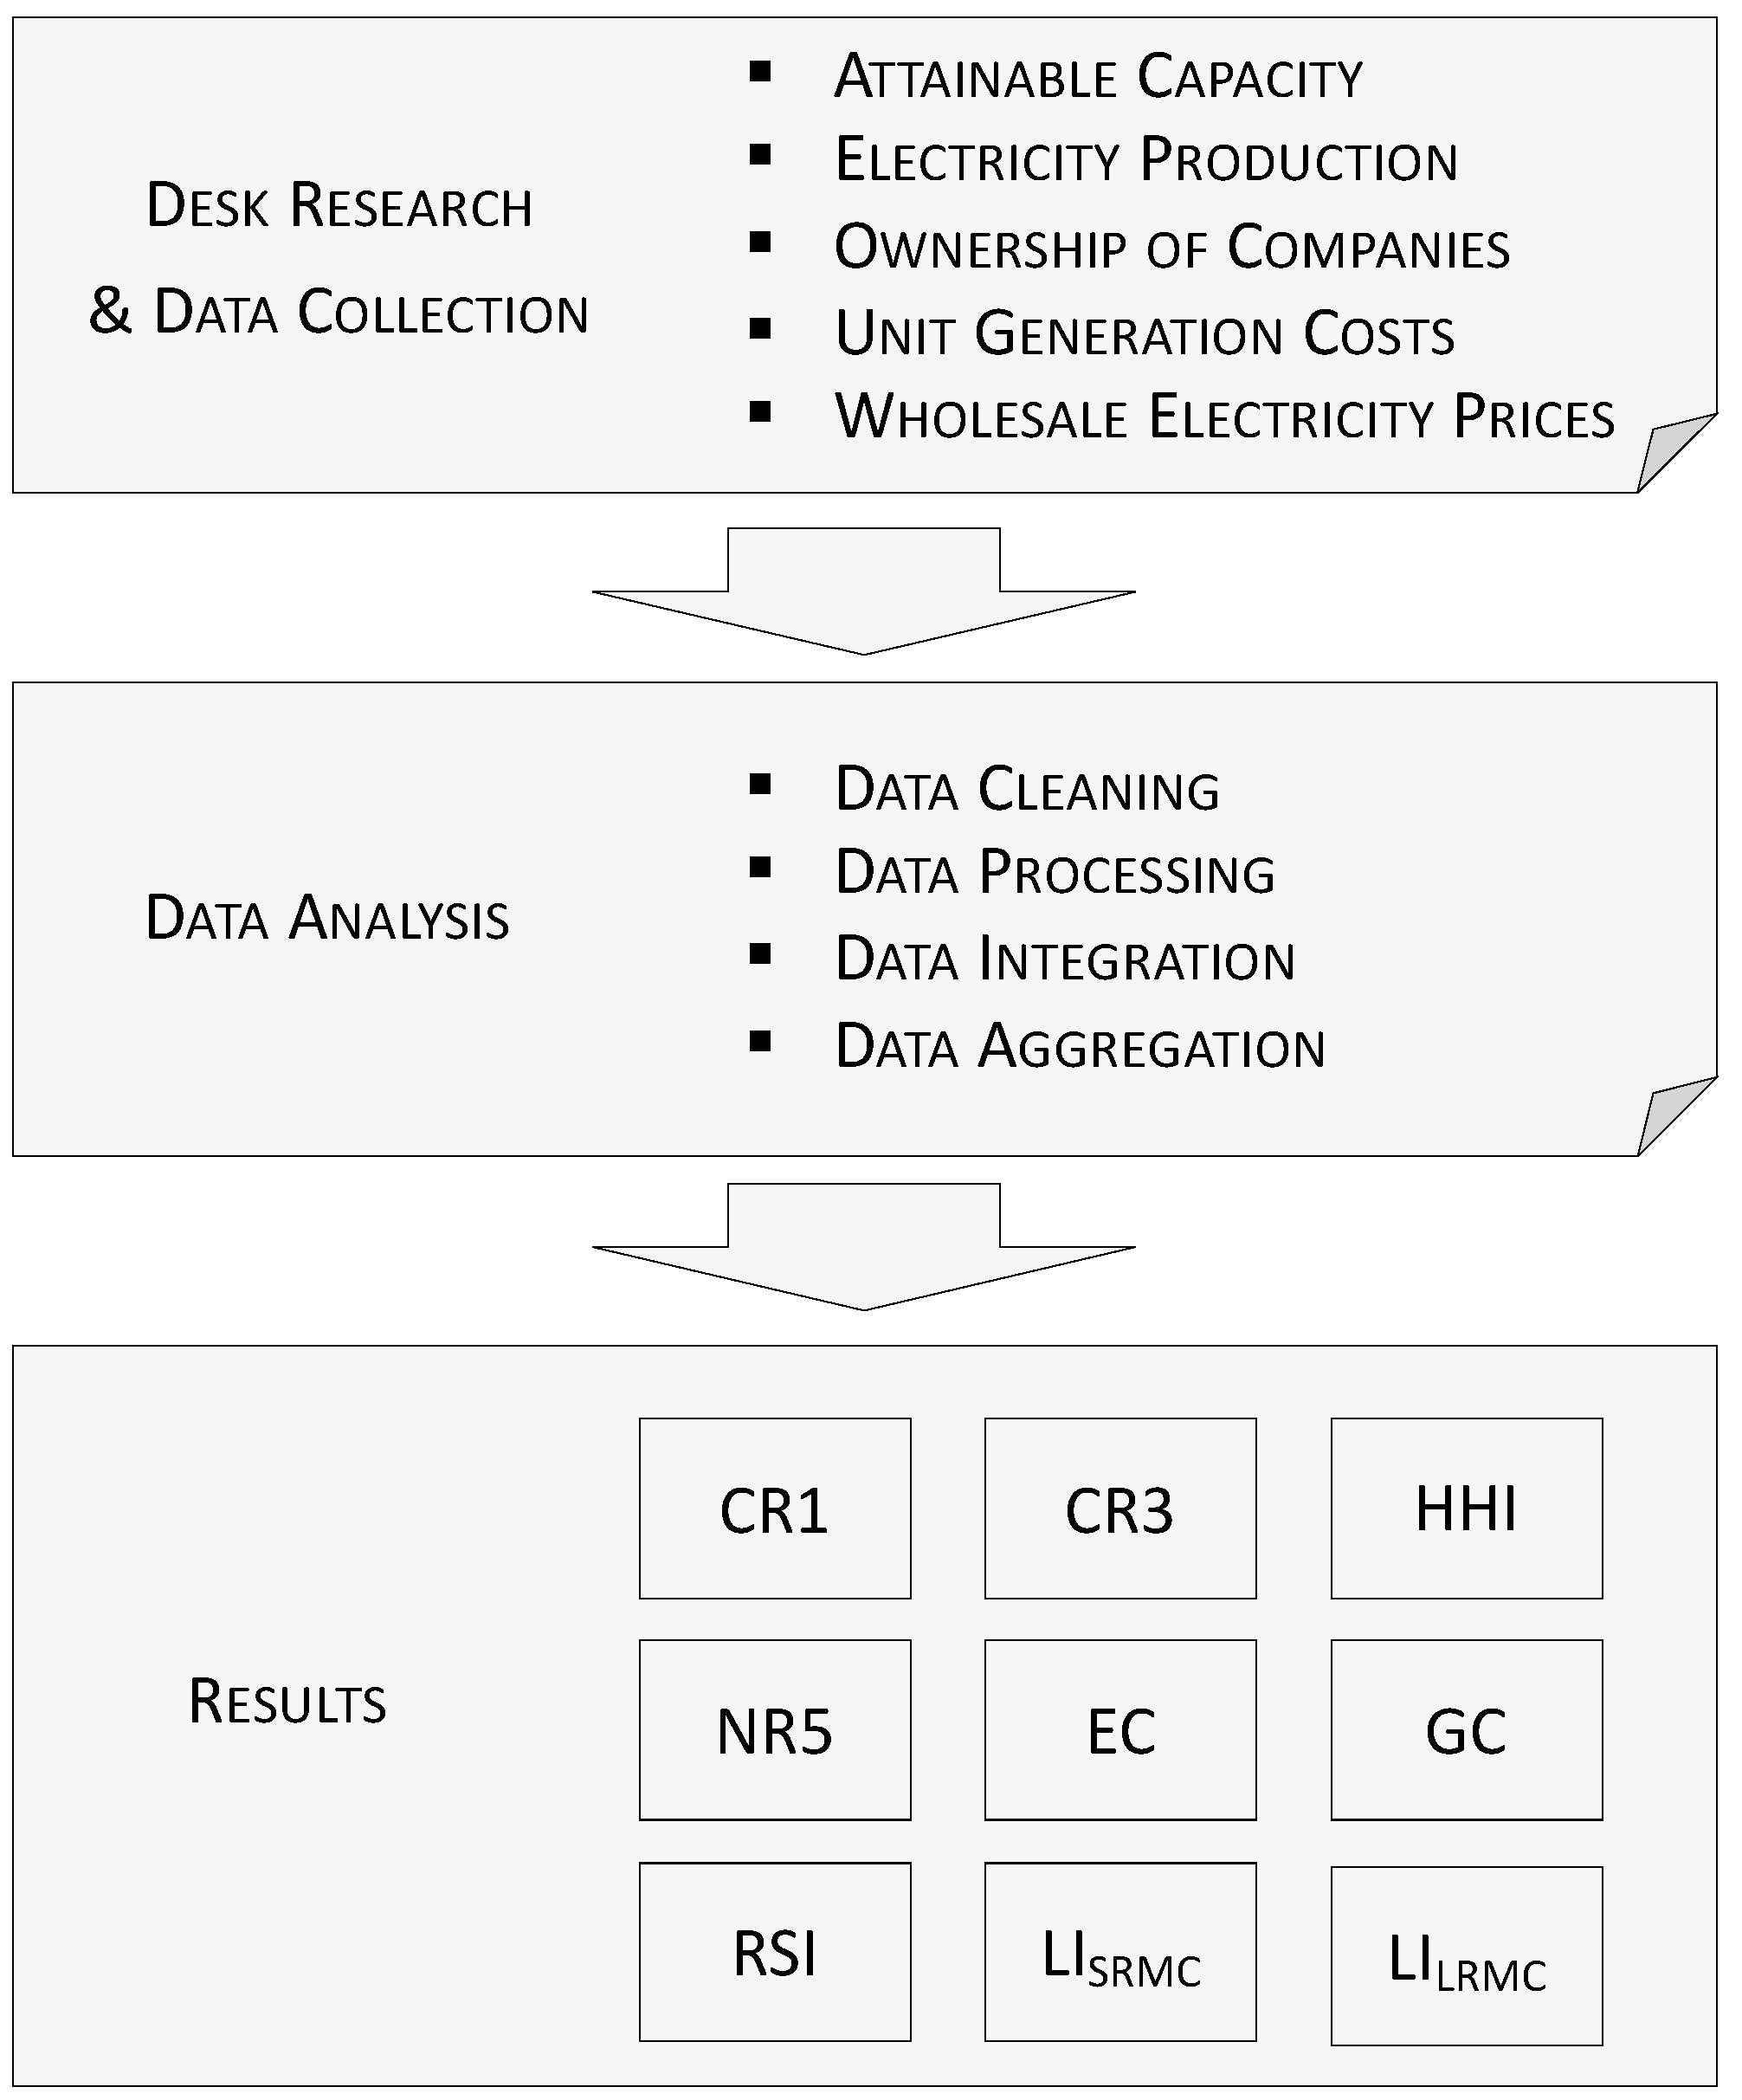
Figure 1. Schematic diagram of the research framework.
Energies 16 04856 g001
Figure 2. Development of the ownership structure (2008–2021), % of the total electricity generation. Source: Own work based on: [31] and information published online by electric power companies.
Energies 16 04856 g002
Figure 3. Unit technical cost of electricity generation, 2003–2021 (EUR/MWh) (average exchange rate at NBP (National Bank of Poland) for 2021: 1 EUR = 4.5674 PLN). Based on: [40].
Energies 16 04856 g003
Figure 4. Average prices of electricity, 2003–2021 (EUR/MWh) (Average exchange rate at the NBP for 2021: 1 EUR = 4.5674 PLN). Based on [40].
Energies 16 04856 g004
Figure 5. Concentration ratios of the largest electric power company (CR1), 1999–2021 (%).
Energies 16 04856 g005
Figure 6. Concentration ratios of the three largest electric power companies (CR3), 1999–2021 (%).
Energies 16 04856 g006
Figure 7. Concentration curves based on electricity generation of public dispatchable units, selected years (%).
Energies 16 04856 g007
Figure 8. Concentration curves based on capacity of public dispatchable units, selected years (%).
Energies 16 04856 g008
Figure 9. Number of electric power companies with a market share above 5%, 1999–2021.
Energies 16 04856 g009
Figure 10. Herfindahl–Hirschman Index, 1999–2021.
Energies 16 04856 g010
Figure 11. Entropy coefficient, 1999–2021.
Energies 16 04856 g011
Figure 12. Gini coefficient, 1999–2021.
Energies 16 04856 g012
Figure 13. The surplus of capacity with respect to peak demand, 1999–2021 (%).
Energies 16 04856 g013
Figure 14. Residual Supply Index of the largest electric power company, 1999–2021.
Energies 16 04856 g014
Figure 15. Hourly Residual Supply Index of the largest electric power company in selected years.
Energies 16 04856 g015
Figure 16. Lerner Index based on SRMC, 2003–2021.
Energies 16 04856 g016
Figure 17. Lerner index based on LRMC, 2003–2021.
Energies 16 04856 g017
Table 1. Ownership structure and key figures of the Polish power system in 2021.
Company Name Ownership Structure (%)Power Plants (PPs) and Heat and Power Plants (CHPs) Controlled by the CompanyElectricity GenerationCapacity
TWhMarket Share (%)MWMarket Share (%)
PGE Capital Group (PGE Polska Grupa Energetyczna)57.4%—State treasury
18.3%—Open Pension Funds (OPFs)
24.3%—Other stakeholders
Bełchatów (PP)73.4752.19%15 619.147.43%
Opole (PP)
Turów (PP)
Rybnik (PP)
Dolna Odra (PP)
Kraków-Łęg (CHP)
Zielona Góra (CHP)
Gorzów (CHP)
Wrocław (CHP)
Gdańsk (CHP)
Lublin-Wrotków (CHP)
Rzeszów (CHP)
Pomorzany (CHP)
Bydgoszcz (CHP)
Gdynia (CHP)
Toruń (CHP)
Other CHPs <100 Mwe
ENEA Group51.5%—State treasury
48.5%—Other stakeholders
Kozienice (PP)28.5120.25%6089.318.49%
Połaniec (PP)
Białystok (CHP)
Other CHPs
TAURON Polish Energy
(TAURON
Polska Energia)
30.06%—State treasury
10.39%—KGHM Polska Miedź S.A. (controlled by state treasury)
5.06%—Nationale-Nederlanden OPF
54.49%—Other stakeholders
Jaworzno (PP)16.7611.90%4997.215.18%
Łaziska (PP)
Stalowa Wola (CHP)
Łagisza (PP)
Siersza (PP)
Katowice (CHP)
Tychy (CHP)
Bielsko-Biała (CHP)
Other PPs/CHPs
ZE PAK Group65.96%—Private investor
9.12%—PZU OPF (controlled by state treasury)
8.86%—Nationale-Nederlanden OPF
16.06%—Other stakeholders
Pątnów (PP)4.913.49%1296.03.94%
Konin (PP)
PGNiG
(Polskie Górnictwo Naftowe i Gazownictwo)
71.88%—State treasury
28.12%—Other stakeholders
Siekierki (CHP)4.152.95%1511.14.59%
Żerań (CHP)
Pruszków (CHP)
and other CHPs
PKN ORLEN27.52%—State treasury
7.54%—Aviva Santander OPF
6.43%—Nationale-Nederlanden OPF
58.51%—Other stakeholders
Ostrołęka B (PP)2.711.93%725.02.20%
Elbląg (CHP)
Kalisz (CHP)
VEOLIA Energy Poland
(VEOLIA Energia Polska)
60.0%—Veolia Energie International
40.0%—Global InfraCo S.à r.l.
Poznań-Karolin (CHP)2.711.92%683.42.08%
Łódź 4 (CHP)
Łódź 3 (CHP)
& other CHPs
CEZ Poland
(CEZ Polska)
100% Controlled by ČEZ. A.s.Chorzów 2 (CHP)2.141.52%556.01.69%
Skawina (PP)
Other companies--5.423.85%1 452.24.41%
Total public thermal plants (PPs and CHPs)--140.77100.00%32,929.3100.00%
Source: Own work based on: [31] and information published online by electric power companies.
Disclaimer/Publisher’s Note: The statements, opinions and data contained in all publications are solely those of the individual author(s) and contributor(s) and not of MDPI and/or the editor(s). MDPI and/or the editor(s) disclaim responsibility for any injury to people or property resulting from any ideas, methods, instructions or products referred to in the content.