Abstract
Public transport is essential to provide urban mobility, and cities need to offer a fast, comfortable, secure, and low-pollutant public transport mode to attract passengers and reduce private car use. Despite metros, trains, and light rail systems being desirable, the cost of implementation and low flexibility make bus services the best option for many cities. One solution for improving bus service systems is the implementation of bus rapid transit systems that are composed of buses running in segregated lines with pre-payment fares and level boarding platforms in stations. However, the main challenge of bus systems is the use of engines fueled by diesel, which is extremely polluted. One possible solution is the use of battery buses; but are they really feasible regarding daily operation cost? In this paper, we investigate the adoption of battery buses in comparison to diesel engines in a BRT system using municipal data from São Paulo, Brazil, as a reference. We collected operational data from the Sao Paulo city government transport agency and data from the literature to produce an analytic hierarchy process (AHP) model, which allowed us to compare both systems. The AHP model considered a triple-bottom-line perspective using social, economic, and environmental impact criteria. The result showed that the initial costs of acquisition can be a barrier, but in the long run, cities adopting battery buses in their BRT system can benefit from the effects of reduction in gas emissions and longer lifetimes of electric bus components. Moreover, the results showed that the adoption of battery buses in BRT systems depends on local government subsidies being implemented.
1. Introduction
The majority of the world’s population, around 56% (4.4 billion inhabitants), lives in cities, and by 2050, 7 of 10 will live there [1]. Life in cities provokes congestion and environmental issues due to the necessity of movement to work, study, leisure, medical appointments, and so on. Thus, urban planners address this by trying to mitigate the problem of public transport. However, Kebłowski et al. [2] affirm that planners have been insufficiently engaged with diverse social, political, and economic dynamics that shape how transport is planned, regulated, and organized.
Addressing global climate change challenges from a transport perspective is necessary and involves life in cities [3]. Globally, transport represents 70% of greenhouse gases (GHG) and two-thirds of energy consumption [4]. Hence, choices made in cities around long-lived urban infrastructure will determine the impact of climate change [3].
Inevitably, the current solution prefers public transport rather than private modes and prefers the adoption of active mobility when possible. This is not an easy task, but the decision of a transit authority to become “greener” provides benefits beyond environmental benefits and may also benefit business because companies that show a commitment to the environment are more likely to attract customers who care deeply about their environmental impacts [5].
Currently, the main alternatives used by companies to be more sustainable include the following [6]: (i) the purchase of energy-efficient vehicles with low environmental impact; (ii) the testing of less-polluting fuels; and (iii) monitoring the performance of vehicles and drivers. While trains and metros run using electric energy, bus services remain connected to diesel engines. Metros are present in only 178 cities [7]. Suburban rail services are slightly more common and are usually present in the same cities that run metros, which makes buses the most common service for urban mobility worldwide.
Therefore, understanding how the bus sector is progressing in the transition toward being cleaner with the use of zero-emission fleets is fundamental to making cities healthier and more sustainable [8]. Indeed, developed countries are ahead in this sense, and some have plans for future fleets. For instance, UITP is conducting the European Bus Rapid Transit of 2030, a new EU project on electric mobility that seeks to support sustainable urban transport by proposing innovative solutions for electric bus rapid transit (BRT) [9].
BRT is the highest level of prioritization of bus systems and can be considered a medium/high-capacity system composed of structural lines. Such a system can transport up to 35,000 passengers/hour/direction [10]. The main characteristics of a BRT system are exclusive bus lanes aligned on the central axis, stations with fare pre-payment, level boarding platforms, and treatment of intersections prioritizing the flow of buses [11].
The first BRT system was established in the 1970s in Curitiba, Brazil [12,13]. It was then developed in many cities in Latin America, the United States, Canada, China, and Asia [14,15]. In Delhi, the capital of India, a decision was made in 2017 to abandon and dismantle the BRT system launched in 2008 [16,17].
In Europe, metrobuses are used mainly in the UK, in addition to individual lines in cities in France, the Netherlands, and Scandinavia [18]. A model line of high-speed buses consists of lanes dedicated specifically for them, usually in the middle of the roadway. The stops placed on these lanes more closely resemble commuter rail stations. Buses—often very long, and even with two articulated buses—pull up these stops almost one after another. Traffic control and passenger information systems are also in operation [19,20].
There is no BRT system in Poland. There have been several attempts to introduce this solution [21]. The closest to creating it was Wrocław, which, in 2014, issued a tender for the project [22]. Eventually, the idea was abandoned, and a new tram line was created. The basic analyses carried out for the purpose of the attempt to introduce BRT to the capital of Poland show that the basic BRT systems can reach a throughput of up to approx. 16,000 passengers per hour, just like tram lines (assuming standard vehicle sizes). With advanced management and meeting the above assumptions, it is possible to achieve an efficiency of up to 40,000 passengers (for comparison, the Warsaw metro exceeds 30,000; these are not the full capabilities of the system) [23]. BRT is also supported by the relatively low costs of constructing infrastructure and purchasing rolling stock, which are lower than for trams or metros. A bus fleet is less spacious than trams (a standard tram carries about 220–240 passengers, while an articulated bus carries 150). Moreover, it wears out faster, and replacements should take place no later than after 12 years of use. The price of extended rolling stock for BRT may be similar to that of a tram.
When analyzing BRT, it is necessary to take into account the continuous development of technologies and increasingly innovative products on the market [24].
BRT systems are primarily identified with Volvo and Van-Hoof, which specialize in the production of three-member low-floor buses with a length of 24 m [25,26]. Among current automotive companies, Mercedes-Benz also has extensive experience in building BRT systems. The German company took its first steps in Central and South America, including Brazil, Bogota, Colombia, and Mexico. Over the past three years, Mercedes has built two systems from scratch in Europe: Metrobus in Istanbul and BusWay in Nantes.
In 2023, EMT Madrid presented the first electric buses for its new bus rapid transit system. It will be the first high-capacity bus line in Madrid. Interestingly, the purchased vehicles belong to the MAXI class and are 12 m long [27].
In October 2021, an order for Solaris double-articulated electric buses to serve passenger traffic in Aalborg, a Danish city located on the Jutland Peninsula, was launched [28]. Tide Bus Danmark placed an order for 14 double-articulated electric buses in the MetroStyle version. These are 24-metre vehicles with a special design and have been specifically designed to operate BRT public transport systems. These 24 m electric buses are powered by two traction motors with a total output of 240 kW, which drive two drive axles. The Solaris high-energy battery pack installed in these e-buses with a total capacity of over 700 kWh is charged via a plug-in connector. Each of the 14 ordered e-buses is equipped with automatic systems supporting mirror driver work. In addition, the Mobileye Shield+ system has been proposed, which allows the elimination of risks associated with the so-called vehicle dead zone.
The world’s first hydrogen buses for BRT have been operating in France since 2019. The Fébus city bus system operates in the south of France [29]. The system was launched in the city of Pau and is served by eight 18-metre Van Hool ExquiCity FC hydrogen buses.
In Köln, Switzerland, and Finland, the Dutch VDL Citea SLFA-181 electric bus is part of BRT. It is an articulated 18 m bus with a maximum capacity of 143 passengers. It has three axles and four doors. This bus was designed primarily for BRT [30,31].
Despite the fact that these initiatives aim to change fuel emissions, BRT buses are composed basically of diesel vehicles that contribute to 25% CO2 emissions and consequently to climate change [32]. With these ideas in mind, we established three research questions:
RQ1—Is it feasible for the adoption of BRT systems to move to electric energy use?
RQ2—Is it possible develop a multiple decision-making model to compare the operations between diesel and electric BRT systems?
RQ3—How can the idea of BRT raised in developing countries as an alternative of low cost for mass rail system transport become feasible to allow the adoption of this new technology in these countries?
To answer these questions, the objective of this study is to analyze the viability of the adoption of electric battery buses for a BRT system in Sao Paulo, Brazil. To do so, an analytic hierarchy process (AHP) model considering the criteria from the triple-bottom-line sustainable approach—economic, environmental, and social—was developed and tested using the literature and data from the transport municipal authority of Sao Paulo city in Brazil. The results indicated that in a more comprehensive view rather than simply considering the implementation costs, an electric BRT system can be advantageous for a city’s society.
The main contribution of this paper is to provide and test a decision-making model that can be used for decision-makers to verify the feasibility of adoption of battery buses to operate in their BRT systems.
This article is divided as follows: after this introduction, a section on the background of electric buses is presented; after the materials and methods are indicated, the results and discussion sections show and discuss the main findings; and the conclusion points out the main ideas obtained from the research.
2. Background
2.1. Electric Buses
The first electric bus dates back to 1882 in Germany when Siemens and Holske created an electric vehicle called Elekromote which gave rise to the Trolleybus. Around 30 years later, the first trolleybus line was implemented in 1911 in England [33].
Currently, there are three models of electric buses in operation worldwide, as shown in Figure 1: trolleybuses that make their journeys connected to parallel overhead lines, hybrid buses that have an electric motor working in conjunction with a combustion engine, and battery electric buses that are powered by a battery present in the vehicle itself.
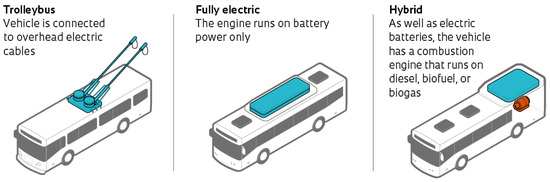
Figure 1.
Type of electric energy buses. Source: adapted from [34].
Trolleybuses are one of the most suitable technologies in environmental terms and have consolidated and reliable technology [35]. In the beginning, trolleybuses had a low implementation cost because they took advantage of the electrical structure of existing trams and managed to overcome obstacles that could be on the road [36].
However, as they need to be connected to parallel overhead lines and power substations, they are less flexible than a conventional bus since any changes in their operations must take into account the parallel overhead lines.
To understand a trolleybus network, it is necessary to manage the cost of this infrastructure, which is estimated at around USD 280,000.00/km (value converted from BRL considering USD cost on 1 June 2023, 1 USD = 5 BRL) for parallel overhead lines and USD 220,000.00 for each necessary substation, and these values can also be an impediment to its expansion [37].
Battery electric vehicles were common until the second decade of the 21st century. However, electric buses in this period were manufactured on a small scale due to the low autonomy and weight of batteries at the time [38]. Since the beginning of the 21st century, battery electric buses have returned to use and have experienced new research.
The battery pack is one of the main parts of a vehicle; it is through battery packs that vehicles are powered, and they are recharged through Electric Vehicle Supply Equipment (EVSE) [36]. Currently, the autonomy of a battery electric bus is 250 km and can be recharged overnight or receive small loads during commercial operation. Hybrid buses are intermediate and are seen as a bridge between the use of internal combustion engines and the electrification of a fleet; the use of hybrid engines is up to 40% more efficient than the use of internal combustion engines only [39,40]. The electric motor is used when the combustion engine has low efficiency, so the combination of two energy sources makes a hybrid engine more efficient than a combustion one and an electric motor [36]. Currently, Shenzhen in China is a reference in terms of electric buses since it has fully electrified its fleet of 16,000 buses [40]. In comparison, there are only 4150 electric buses currently in operation in Latin America [41].
2.2. Bus Rapid Transit—BRT
A bus rapid transit or BRT is a medium-capacity system with exclusive lanes for bus circulation that provides a better user experience. Reasonable cost, high-capacity vehicles, and services are some economic and social advantages of BRT systems [42].
The five main characteristics of a BRT are segregated infrastructure with exclusive circulation; alignment of bus lanes, especially in the median; off-bus fare collection; level boarding; and treatment of intersections with passing priority [11].
To implement a BRT system, it is necessary to plan and adjust the demand, concentrating on the system from feeder lines using an Operational Control System (OCC), with information obtained in real time through Intelligent Transport Systems (ITSs) [10].
The main ITS present in a BRT system provides information on electronic ticketing, vehicle location in real time with GPS, user information in real time, communication between the OCC and the buses, and traffic light preference prioritizing the buses [10].
The literature highlights the BRT system in Curitiba, Brazil, as the first BRT in the world; before the idea was conceived for the city transport system, there were already efforts to improve the quality of transport for the population that influenced the BRT system. Current BRT systems implemented ideas already used by rail systems for the operation of buses [42].
The first BRT concept was implemented in the City of Chicago in 1937, with the conversion of three railroads, Douglas Park, Lake Street, and Logan Square, into express bus lanes. At that time, the growth of private vehicles had brought inconvenience to traffic. While, in 1915, Chicago had 35,000 registered vehicles, the fleet now has 335,000 registered vehicles [43].
In 1963, counterflow bus lanes were introduced in New York City, and in 1964, exclusive lanes, this time in the street flow, arrived in the City of Paris, France. In 1966, the first bus lanes built on the median were built in the City of St. Louis in the USA and Liège in Belgium after the conversion of the tram systems in these cities [42].
In 1969, the first 6.5 km high-speed busway opened on the Shirley Highway in Northern Virginia in the USA, and prioritizing buses resulted in a substantial improvement in the ability of people to move along the corridor during peak times [42,44].
In 1971, the town of Runcorn in the UK opened a bus corridor that catalyzed the town’s development, increasing the use of public transport and increasing the mobility of the town’s residents [42,45].
Busways arrived in developing countries in 1972 with the Via Expressa in Lima, Peru, which offered a basic service and could not be considered a BRT. In the same year in London, United Kingdom, with the conversion of Rua Oxford, the first exclusive streets for buses and taxis appeared, and in the following year in 1973, the exclusive route “El Monte” with 11 km was developed in Los Angeles. However, it was difficult to walk or use a bicycle to access the buses [42,46,47].
In Brazil, during the 1960s and 1970s, there was an increase in the discussion about the problems of public transport. The main issues were increasing traffic congestion and the precariousness of the transport service, and for these issues, it was proposed to improve public transport using corridor design and bus networks [48].
The Curitiba system was conceived before the use of the term BRT [10]. Due to the lack of financial resources to fund a metro rail system, Curitiba combined bus lanes with a more pedestrian-friendly city, green spaces, and social programs to meet the rapid population growth that occurred during the 1970s, which, together with the oil crisis, further increased the demand for public transport [48].
Curitiba’s success turned the city into a world case study and inspired many similar projects that turned Brazil into the country of bus lanes and BRTs became widely known. However, from the 1990s onward, there was a decline in passenger numbers in Brazil and Latin American transport systems due to the increased use of individual motorized transport [42,48].
In 1996, a BRT was inaugurated in Quito, using trolleybus technology. Quito’s trolleybus system was well accepted by the population, had improved quality of life, and reduced gas emissions and noise pollution [49]. Simultaneously, in 1999, in the City of Kunming in China, the first busway was developed at a central job site, and in 2001, another system was inaugurated in the City of Taipei. Similar systems were implemented in the cities of Vancouver in Canada (1996), Miami in the USA (1997), and Brisbane in Australia (2000) [42].
However, the most prominent BRT project implemented in the year 2000 was the TransMilenio in Bogota, Colombia. The Colombian capital is a large city with a population of around seven million people and a high density. Based on the experiences seen in Curitiba, Goiânia (Brazil), and Quito (Ecuador), the managers decided to apply the system in the city [42].
Currently, TransMilenio has 12 corridors, with 141 stations and nine terminals, which together have 114.4 km of network extension. The data obtained in February 2023 accounted for 10 million kilometers traveled and 496,000 trips made on the trunk corridors, which served approximately 42 million passengers [50].
Nowadays, there are BRTs on all five continents. Table 1 presents an overview of existing BRTs in the world.

Table 1.
BRT lines per continent.
There are currently 5607 km of BRTs in 186 cities around the world, and these systems transport more than 31 million passengers per day [51].
Latin America is the continent that has the largest number of BRTs in operation, and approximately 36% of the corridors transport 60% of the volume of passengers. In Asia, approximately 24% of the corridors carry 30% of passengers. In Europe, 25% of the corridors are present, but they carry only 8.36% of passengers. Africa and Oceania have approximately 6% of the world’s BRTs and carry approximately less than 3% of passengers [51]. In Brazil, the available 95 BRT corridors add up to 872 km and transport more than 7.4 million passengers daily, positively impacting their areas of influence [51].
3. Materials and Methods
To conduct this study, the first step was to establish an electric vehicle to be adopted running on zero emissions. We adopted the battery bus—governments are not interested in trolleybus systems anymore due to the necessity of spending on the infrastructure of parallel overhead lines and substations. A trolleybus system is expensive to be implemented, and the municipality would be responsible for maintaining the system. In Brazil, only Sao Paulo operates a trolleybus system since the 1950s and sustains it until now. There is no new network infrastructure since the privatization of the municipal transport services of the city more than 30 years ago.
To make a comparison between the two BRT models (battery electric bus and diesel bus), we adopted the analytic hierarchy process methodology (AHP). The AHP methodology aims to assist in the decision-making of complex problems based on the hierarchical importance of one criterion over the others [52].
The first step of the AHP is the construction of a decision tree which is composed of the following attributes: decision is the most complex problem and is at the highest level; at the intermediate level are the criteria used to reach the final decision; and at the lowest level are available alternatives [53] (Figure 2).
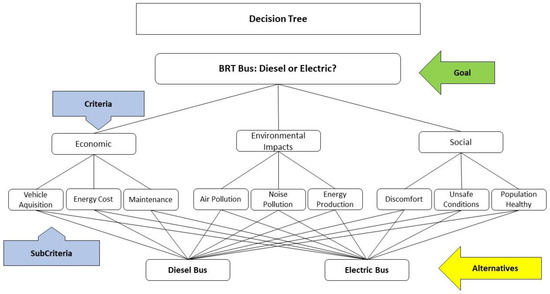
Figure 2.
Decision tree.
The problem is divided into hierarchical levels to facilitate understanding, and from there, an evaluation can be made on the qualitative and quantitative criteria where the most important is defined through a parity comparison. This means, two by two, using a scale that correlates the verbal judgments with the number of judgments that must be filled in the judgment matrix (Table 2).
Table 2.
Importance scale of the AHP.
Peinaldo [54] and Lucena and Mori [55] explain that there must be the principle of reciprocity to perform a comparison using this scale. When criterion A is much more important than B on a scale of 5, criterion B must be 5 times less important than criterion A and must be 1/5. The mathematical representation of the pairwise comparison is represented by Equation (1).
Our research considered two alternatives (electric bus and diesel bus) and three criteria (economic, environmental, and social impacts). The scale was compared using data obtained in the literature and from the Sao Paulo transport authority. For each criterion, we established sub-criteria:
- Economic impact: To build the economic impact factor, we used the sub-criteria of vehicle acquisition (cost/estimated years of use), energy cost (energy per kilometer traveled—tank-to-wheel (TTW)) and maintenance (cost of maintenance per kilometer traveled).
- Environmental impact: To build the environmental impact factor, the following criteria were considered: air pollution (USD per passenger per km), noise pollution (qualitative value based on the literature), and energy production (cleanliness of production energy matrix of country—well-to-tank (WTT)).
- Social impact: To build the social impact factor, we considered discomfort (on the trip—qualitative value based on the literature), unsafe conditions (qualitative value based on the literature), and population health (qualitative value based on the literature).
We considered a BRT system operating 100,000 km per year per vehicle considering daily use of 250 km—the average daily operation of a bus in São Paulo, the biggest city in Brazil, is 196 km.
The parameters for the AHP sub-criteria were as follows:
- Vehicle acquisition: The vehicle acquisition cost is currently higher for an electric bus (USD 682,000.00 using the BYD D11B as a basis [56]) than for a diesel bus (USD 359,000.00 using the Mercedes-Benz O-500 UDA—BlueTec 5 as a basis) [57]. However, an electric model has a longer duration of use, estimated to be 15 years, compared to a diesel vehicle which has 10 years [58]. For this reason, to equalize the cost, it was decided to compare the purchase price divided by the useful life of the vehicle, which resulted in USD 46,000.00 for an electric bus and USD 36,000.00 for a diesel bus.
- Energy cost: The energy cost for vehicle operation was calculated for an electric bus considering the value of kWh is USD 0.13 [59] and an electric bus has a consumption of 1.26 kWh/km [38], resulting in USD 0.16/km plus 13% for air conditioning operation for a total of USD 0.19/km, with an overnight battery recharge. For a diesel bus, the average cost of diesel was calculated to be USD 1.14 [60] and consumption was calculated to be 0.15 l/km, resulting in the value of USD 0.85/km; by adding 13% for the consumption for air conditioning, a total cost of USD 0.96/km was calculated for implementing the Arla 32 system to reduce emissions [61].
- Maintenance: Operation and maintenance costs were obtained from Rebouças and Daniel [58], being USD 1.06/km for diesel buses and USD 1.04/km for electric buses (Table 3).
Table 3. Comparison of BRT values.
- Air pollution: In terms of emissions into the air, electric vehicles have an advantage over diesel vehicles as they do not emit gases. The emissions from an articulated bus was calculated considering the value of the impact of smoke in a metropolitan area—EUR 0.0116 converting to USD 0.01200/passenger/km. Considering an articulated bus with a capacity of 170 passengers (22 m for electric buses and 23 for diesel ones) running at its maximum capacity, we reached the value of USD 216,000.00, which is very close to the operating cost of the vehicle [62].
- Noise pollution: For monitoring noise pollution, the evaluation was qualitative, according to Raymundo and Reis [62]. The noise generated by vehicle operation creates effects on sound waves and is well known in the literature, but it is not easy to measure outside a laboratory. In this way, it was considered that an electric bus has an impact between moderate and strong, and we assigned an index of 4 according to Table 2. Noise causes well-being and social disturbances that can be psychological and emotional, such as displeasure, sleep disturbances, and loss of productivity, and physiological disturbances, such as hearing damage and fatigue [62].
- Energy production: Regarding the energy production requirement, the impact of energy generation due to vehicle movement was evaluated. An electric bus is considered in the Brazilian electrical matrix to be predominantly clean, with 82.9% of energy extracted from renewable sources, most of them through hydroelectric plants (56.8%) [63].
- Discomfort: The disutilities of transport were not socially evaluated; in a qualitative way, they reflect the preservation of the use of a transport system, and in the case of this study, the bus model [62]. The first disutility is discomfort, which is the disutility related to what bothers passengers during transport, such as an earlier injury or abortion, allowing the consideration of how physical or psychological discomfort can be limited.
- Unsafe conditions: the second disutility is unsafe conditions, which is the disutility of transporting passengers that are related to the safety of using the mode of transport under study, and the causes can be human, vehicle, and infrastructure deficiencies in addition to the risk of traffic accidents [62].
- Population health: the health of the population is an externality related to the negative impacts on society associated with transport infrastructure to the detriment of other land uses [63].
To deal with data processing and to obtain AHP results, we used Expert Choice® v.11. Expert Choice is a user-friendly supporting software that has contributed to the success of the AHP method because it incorporates intuitive graphical user interfaces and automatic calculation of priorities and inconsistencies, and it still runs the AHP precisely as described in its original publication [64,65].
One important aspect of the AHP approach refers to the inconsistences that validate the model. Therefore, consistency ratio (CR) needs to be calculated, as shown in Equation (2). A decision can be considered acceptable if its CR ≤ 0.1 [66]. To establish the CR, it is necessary to obtain the consistency index (CI), as shown in Equation 3, and the random index (RI) from Table 4 [67].
is the biggest eigenvalue of the pairwise comparison for each matrix of order . Then, the consistency ratio is calculated using Equation (3) and the random index (RI), presented in Table 4, is generated for a matrix with [52].
Table 4.
Random index.
Table 4.
Random index.
| n | 1 | 2 | 3 | 4 | 5 | 6 | 7 | 8 | 9 |
| RI | 0.0 | 0.0 | 0.58 | 0.90 | 1.12 | 1.24 | 1.32 | 1.41 | 1.45 |
4. Results
The general results, as shown in Figure 3, allowed us to identify the viability of the adoption of battery electric buses for a BRT system in Sao Paulo, Brazil. The social and environmental scores were essential to this result.
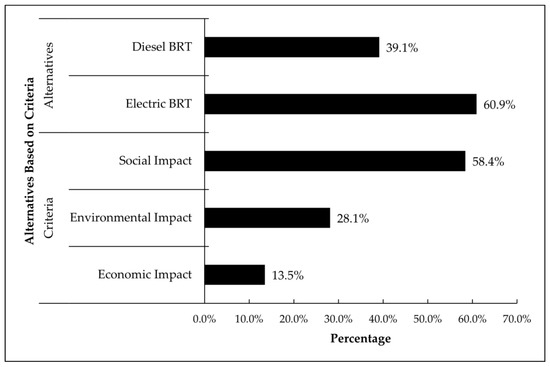
Figure 3.
AHP general results (CR: 0.10).
It was possible to verify an advantage of electric buses (60.9%) over diesel ones (39.1%). The results show that the economic impact (13.5%) on the best energy matrix is smaller than the environmental impact (28.1%) and the social impact (58.4%). Thus, it is possible to infer that the higher cost of electric buses can be amortized due to the other benefits, mainly the social ones [68].
An example is the calculation of the impact of gas emissions, which is not included in the direct calculation of the comparison among vehicles but generates an impact that represents 90% of the value of a diesel bus. This value is not a direct cost, so it is added separately and ends up being funded by the state, even if indirectly, as a result of public transport emissions [62].
We now discuss the results according to the main criteria. The economic impact can be seen in Figure 4.
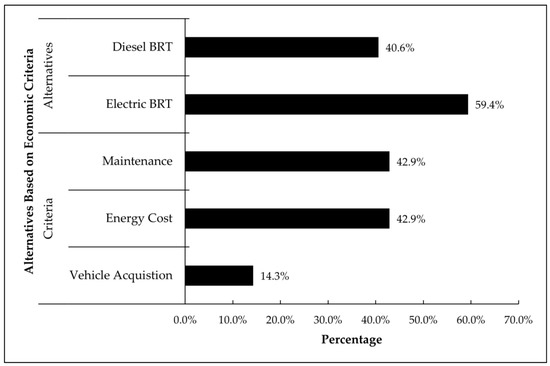
Figure 4.
Economic impact results (CR: 0.01).
It is possible to verify an advantage of electric buses (59.4%) over diesel ones (40.6%). Vehicle acquisition has a small impact on the decision of the best option for the BRT system because the prices considering the years of use of vehicles are close. Electric buses operate for 15 years, and they are more expensive; a diesel BRT is cheaper, but the duration of use is 10 years only.
The values of maintenance (42.9%) and energy cost (42.9%) are equivalent in the decision model. All these calculations considered the advantage in the adoption of an electric BRT. However, there is no electric BRT in Sao Paulo. In Brazil, only two corridors operate with battery electric buses: (1) Linha Verde (São José dos Campos) with 12 articulated vehicles, and (2) BRT Salvador with standard vehicles [69]. In the ABD corridor (Metropolitan Area of São Paulo), the operation is carried out with trolleybuses [70].
The results of the environmental criteria are presented in Figure 5.
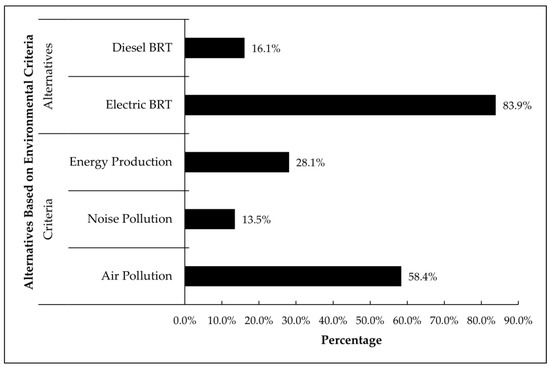
Figure 5.
Environmental impact results (CR: 0.10). Source: the authors.
According to these criteria, an electric BRT is by far the best option (83.9%) compared to a diesel one (16.1%). Regarding air pollution, as it has zero emission, an electric system is more advantageous than a diesel bus with a Euro V engine [71].
An electric bus does not emit polluting gases, and the impact of operation is less than that of diesel buses. Therefore, it is not necessary to add the impact of emission of gases that represents almost the value of another bus [72].
For noise pollution, an electric BRT produces a low level of sound compared with diesel vehicles. As for the criterion of energy production, as it is cleaner and more renewable, the impact of this criterion favors electric buses.
The results of the social criteria are presented in Figure 6.
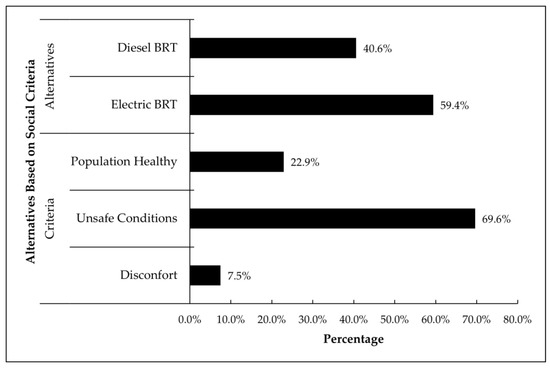
Figure 6.
Social impact results (CR: 0.07). Source: the authors.
Considering the social aspect, electric buses are the better option to choose (53.8%) compared to diesel buses (46.2%). The discomfort level is similar in both vehicle types and, for this reason, the impact on the decision is low. Unsafe conditions are highlighted due to the greater contact between the diesel engine and the passenger compartment. Diesel vehicles also have a greater impact on the health conditions of the population than electric ones [72]. Motorized transport is responsible for several pollutants that are harmful to health and degrade the urban environment, and diesel vehicles, even when they are responsible for a small part of displacements, are responsible for a large part of carbon, nitrogen, and sulfur emissions [11].
5. Discussion
Urban mobility is a challenge worldwide. More people now live in cities, and they need one system of transport to attend to their activities on a daily basis. Hanson [73] points out that distances between activity sites have become longer and accessibility has come to depend increasingly on mobility, particularly privately owned vehicles.
Active mobility is by far the most sustainable method, but many activities are located at distances where walkability and cycling can be impractical. Therefore, passenger collective transport needs to be encouraged because it moves more people than private cars and can contribute to optimizing the urban space. Yang et al. [74] infer that public transport reduces traffic congestion and greenhouse gas emissions.
Even though public and collective transport seems to be one of the best options to move around in cities, such system faces the costs of infrastructure and provokes externalities and disutilities [73,75]. One of the main concerns regarding these externalities and disutilities is the environmental impact caused by operation. There is no doubt that metros and trains can run with low emission impacts, but their costs of construction and operations are impracticable for many cities and reduce the possibility to extend them to all areas of a metropolitan city. Even London, one of the most important and richest capitals of the world, waited 40 years to approve the project of another metro line, the Elizabeth Line in 2008 [76].
For this reason, bus transport remains the most used public transport system worldwide. However, buses are responsible for traces of pollution in cities due to diesel engine emissions. Sao Paulo, for instance, has 14,000 buses running daily in 1340 lines and transporting 8 million people, but these buses emit 21% of NOx, generating negative effects on human health, such as heart disease, stroke, lung cancer, asthma, and chronic obstructive pulmonary disease [76]. Buses are a major source of climate pollutant emissions, including carbon dioxide (CO2) and black carbon, a potent short-lived pollutant [76].
As mentioned previously, one solution adopted to transform bus transport to be more attractive in comparison to metros, trains, and trams systems is the adoption of bus rapid transit, which started in the 1970s in Curitiba, Brazil, and has disseminated worldwide. The International Association of Public Transport (UITP) acknowledges that BRT is one of the biggest innovations in the bus domain due to the transformative effect it can have on cities in terms of congestion and air pollution [77]. However, there remains the question of how to turn these systems less polluted.
Our results comparing the adoption of battery electric buses rather than diesel ones allow us to verify that, in the long run, electric systems are more economical and can be the next generation of BRT systems. For example, São Jose dos Campos in Brazil developed their project of BRT using electric buses provided by the Chinese company BYD, which is a strong investment in this sector [78], as shown in Figure 7. However, it was possible only because the city government resolved to assume the operation itself without a private company.
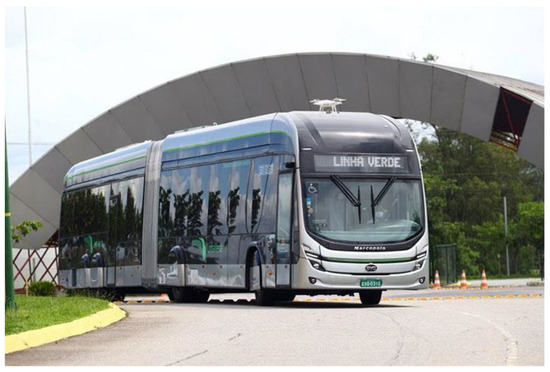
Figure 7.
Battery BRT in São José dos Campos, Brazil. Source: [79].
Electric buses are not the ultimate solution for environmental problems because there are issues regarding the generation of energy and the discard of batteries. However, they can be the first step in the direction of building a more sustainable city. Unfortunately, a sustainable city does not depend on industrial steps but on a change in the mindset of people who use private cars as a means of transportation. The only way to change this scenario is to offer a fast, comfortable, connected, and economic public collective system.
The AHP methodology allowed us to adopt a quantitative methodology to analyze the advantages of the adoption of battery buses in BRT systems, showing decision-makers the feasibility of such adoption while considering the impacts on three societal pillars: economic, environmental, and social. And this is the novelty of the study. We could find studies using MCDM techniques to analyze the operation process of BRT [80], but none of them compared battery and diesel bus adoption.
In this study, we measured the values in the Brazilian scenario, more specifically Sao Paulo’s situation, but the methodology can be used to compare different countries, which may present even better results. Brazil does not retain its battery bus technology and suffers the influence of the devaluation of its currency before the US dollars (currency used in international trade) during foreign acquisition of equipment, reducing the competitiveness of adoption of electric systems in BRT.
6. Conclusions
This study compared battery electric and diesel BRT operations using an AHP decision-making model. The criteria adopted were economic, social, and environmental impacts. Even though electric BRT has a higher acquisition cost than diesel ones, the lower cost of electricity in comparison to diesel makes it advantageous in the long run. Besides that, such a system has no gas emissions.
Our results indicated that the social benefits of public transport are more important than the economic criteria. However, this does not receive much attention in Brazil where economic criteria often end up overlapping, reducing the quality of public transport and increasing the use of motorized individual transport.
The environmental benefit of electric buses that do not emit gases contributes to the reduction in environmental pollution and, as they are silent, these buses also reduce noise pollution and increase comfort during travel, which must be considered in the decision to obtain a sustainable transport system in urban areas.
This study is not free of limitations. The AHP model developed to make comparison in this study required a large quantity of data, which prevents the development of a more comprehensive model involving comparing the same scenario in many cities at the same time. Each city has particularities regarding fares, government subsidies, population, infrastructure of transport, and income, which may affect the results of the model. Moreover, the quantitative data obtained and the literature background may affect the AHP model and its results according to the sources adopted. Despite these limitations, the AHP model permits a more comprehensive analysis than a straight cost decision, which is always affected by the adoption of new technologies. It is clear that new technologies in early developments will be more expensive than mature ones, and it is necessary to look ahead based on indirect advantages. We believe that an analysis considering social, economic, and environmental impacts could aid decision-makers in making decisions based on a consideration of the future of their cities and population welfare.
A suggestion for future studies is to compare BRT with trams in the same context presented in this paper. Moreover, future studies could include in the analysis the discarded components and emissions due to energy production.
Author Contributions
Conceptualization, G.S.R., J.G.M.d.R., O.O., K.T., S.T.M. and H.R.; methodology, G.S.R., J.G.M.d.R., O.O., K.T., S.T.M. and H.R.; software, G.S.R., J.G.M.d.R., O.O., K.T., S.T.M. and H.R.; validation, G.S.R., J.G.M.d.R., O.O., K.T., S.T.M. and H.R.; formal analysis, G.S.R., J.G.M.d.R., O.O., K.T., S.T.M. and H.R.; investigation, G.S.R., J.G.M.d.R., O.O., K.T., S.T.M. and H.R.; resources, G.S.R., J.G.M.d.R., O.O., K.T., S.T.M. and H.R.; data curation, G.S.R., J.G.M.d.R., O.O., K.T., S.T.M. and H.R.; writing—original draft preparation, G.S.R., J.G.M.d.R., O.O., K.T., S.T.M. and H.R.; writing—review and editing, G.S.R., J.G.M.d.R., O.O., K.T., S.T.M. and H.R.; visualization, G.S.R., J.G.M.d.R., O.O., K.T., S.T.M. and H.R.; supervision, G.S.R., J.G.M.d.R., O.O., K.T., S.T.M. and H.R.; project administration, G.S.R., J.G.M.d.R., O.O., K.T., S.T.M. and H.R.; funding acquisition, G.S.R., J.G.M.d.R., O.O., K.T., S.T.M. and H.R. All authors have read and agreed to the published version of the manuscript.
Funding
The research was carried out under financial support obtained from the research subsidy of the Faculty of Engineering Management (WIZ) of Bialystok University of Technology, grant No. WZ/WIZ-INZ/4/2022 (Olga Orynycz). This study was financed in part by the Coordenação de Aperfeiçoamento de Pessoal de Nível Superior—Brasil (CAPES)—Finance Code 001 (Scholarship for Gabriel Santos Rodrigues).
Data Availability Statement
Data will be made available from the corresponding author upon request.
Conflicts of Interest
The authors declare no conflict of interest.
References
- Carvalho, C.H. Urban Development. Available online: https://www.worldbank.org/en/topic/urbandevelopment/overview (accessed on 5 May 2023).
- Kębłowski, W.; Dobruszkes, F.; Boussauw, K. Moving past sustainable transport studies: Towards a critical perspective on urban transport. Transp. Res. Part A Policy Pract. 2022, 159, 74–83. [Google Scholar] [CrossRef]
- Tucki, K.; Orynycz, O.; Wasiak, A.; Świć, A.; Mruk, R.; Botwińska, K. Estimation of Carbon Dioxide Emissions from a Diesel Engine Powered by Lignocellulose Derived Fuel for Better Management of Fuel Production. Energies 2020, 13, 561. [Google Scholar] [CrossRef]
- OECD. Financing Climate Objectives in Cities and Regions to Deliver Sustainable and Inclusive Growth; OECD Environment Policy Papers: Paris, France, 2019; p. 17. [Google Scholar] [CrossRef]
- Vicente, P.; Sampaio, A.; Reis, E. Factors influencing passenger loyalty towards public transport services: Does public transport providers’ commitment to environmental sustainability matter? Case Stud. Transp. Policy 2020, 8, 627–638. [Google Scholar] [CrossRef]
- Cruz, I.S.; Katz-Gerro, T. Urban public transport companies and strategies to promote sustainable consumption practices. J. Clean. Prod. 2016, 123, 28–33. [Google Scholar] [CrossRef]
- UITP. Metro. Available online: https://www.uitp.org/topics/metro/ (accessed on 8 May 2023).
- Kerkhof, A. Bus. Available online: https://www.uitp.org/topics/bus/ (accessed on 5 May 2023).
- UITP. Electric and Innovative BRT for Green Cities: UITP Coordinates eBRT2030 as New Flagship Project on Electric Mobility. Available online: https://www.uitp.org/news/electric-and-innovative-brt-for-green-cities-uitp-coordinates-ebrt2030-as-new-flagship-project-on-electric-mobility/ (accessed on 8 May 2023).
- Amicci, A.G.N.; Fernandes, A.; Malburg, C.H.R.; Santos, D.V.; Araldi, F.; Souza, F.d.O.; Di Pierro, L.F.; Nakazaki, M.; Silva, N.A.A.d.; Santana, O.; et al. Guia TPC: Orientações Para Seleção de Tecnologias e Implementação de Projetos de Transporte Público Coletivo. Technical Report, BNDES. 2018. Available online: https://web.bndes.gov.br/bib/jspui/handle/1408/14921 (accessed on 8 May 2023).
- Institute for Transportation and Development Policy—ITDP. The BRT Standard; ITDP: Rio de Janeiro, Brazil, 2016. [Google Scholar]
- Lindau, L.A.; Senna, L.A.D.S.; Strambi, O.; Martins, W.C. Alternative financing for Bus Rapid Transit (BRT): The case of Porto Alegre, Brazil. Res. Transp. Econ. 2008, 22, 54–60. [Google Scholar] [CrossRef]
- Hidalgo, D.; Gutiérrez, L. BRT and BHLS around the world: Explosive growth, large positive impacts and many issues outstanding. Res. Transp. Econ. 2013, 39, 8–13. [Google Scholar] [CrossRef]
- Nikitas, A.; Karlsson, M. A Worldwide State-of-the-Art Analysis for Bus Rapid Transit: Looking for the Success Formula. J. Public Transp. 2015, 18, 1–33. [Google Scholar] [CrossRef]
- Shyr, O.F.; Andersson, D.E.; Cheng, Y.-H.; Hsiao, Y.-H. What explains rapid transit use? Evidence from 97 urbanized areas. Transp. Res. Part A Policy Pract. 2017, 100, 162–169. [Google Scholar] [CrossRef]
- Krelling, C.; Badami, M.G. Operational and financial performance of Delhi’s natural gas-fueled public bus transit fleet: A critical evaluation. Transp. Policy 2016, 47, 178–188. [Google Scholar] [CrossRef]
- Mahdavi, S.M.H.; Bhouri, N.; Scemama, G. Dynamic Resilience of Public Transport Network: A Case Study for Fleet-Failure in Bus Transport Operation of New Delhi. Transp. Res. Procedia 2020, 47, 672–679. [Google Scholar] [CrossRef]
- Goedeking, N. What political institutions support Bus Rapid Transit? Evidence from a survival analysis of 92 cities in low- and middle-income countries. Energy Res. Soc. Sci. 2023, 100, 103084. [Google Scholar] [CrossRef]
- Attard, M. Planning for Bus Rapid Transit in an island context. The challenges of implementing BRT in Malta. Res. Transp. Econ. 2023, 100, 101309. [Google Scholar] [CrossRef]
- Samerei, A.; Aghabayk, K.; Soltani, A. Occupational Health and Job Satisfaction Assessment of Bus Rapid Transit (BRT) Drivers. J. Public Transp. 2022, 24, 100002. [Google Scholar] [CrossRef]
- Dzikuć, M.; Miśko, R.; Szufa, S. Modernization of the Public Transport Bus Fleet in the Context of Low-Carbon Development in Poland. Energies 2021, 14, 3295. [Google Scholar] [CrossRef]
- BRT Appreciated Worldwide. What Does This Mean for Wrocław? Available online: https://www.transport-publiczny.pl/wiadomosci/brt-doceniane-na-swiecie-co-to-oznacza-dla-wroclawia-47255.html (accessed on 1 June 2023).
- Metrobus—A Great Opportunity or a Way to Get Rid of Trams? Available online: https://www.transport-publiczny.pl/wiadomosci/metrobus--wielka-szansa-czy-sposob-na-pozbycie-sie-tramwajow-2528.html (accessed on 1 June 2023).
- A City Where BRT Ends in Failure. Available online: https://www.transport-publiczny.pl/wiadomosci/miasto-w-ktorym-brt-konczy-sie-fiaskiem-53948.html (accessed on 1 June 2023).
- Volvo Bus Rapid Transit. Available online: https://www.volvobuses.com/pl/city-and-intercity/innovation/bus-rapid-transit.html (accessed on 1 June 2023).
- Levinson, T.C.H.S.; Zimmerman, D.S.; Clinger, D.J.; Rutherford, H.S.C. Bus Rapid Transit: An Overview. J. Public Transp. 2002, 5, 1–30. [Google Scholar] [CrossRef]
- EMT Madrid Launches a BRT. 10 Irizar ie Tram on a Line with Traffic Light Priority. Available online: https://www.sustainable-bus.com/news/emt-madrid-brt-line-irizar/ (accessed on 1 June 2023).
- Solaris to Supply 14 Double Articulated Electric Buses to Tide Bus Danmark. Available online: https://www.solarisbus.com/pl/biuro-prasowe-solaris-bus-coach-sp-z-o-o/solaris-dostarczy-14-dwuprzegubowych-autobusow-elektrycznych-do-tide-bus-danmark-1649 (accessed on 1 June 2023).
- Hydrogen Buses Base BRT in Pau. Available online: https://transinfo.pl/infobus/wodorowe-autobusy-podstawa-brt-w-pau-_more_120123/ (accessed on 1 June 2023).
- Citea Slfa Electric Brt. Available online: https://www.vdlbuscoach.com/pl/produkty/citea/citea-slf-slfa-electric (accessed on 1 June 2023).
- VDL Delivers a Citea Electric to Postbus Switzerland. Go with the Electric Pilot! Available online: https://www.sustainable-bus.com/news/vdl-bus-coach-electric-pilot-electric-bus-to-postbus-switzerland/ (accessed on 1 June 2023).
- OECD. Cities and Climate Change: National Governments Enabling Local Action; OECD: Paris, France, 2014; Available online: https://www.oecd.org/env/cc/Cities-and-climate-change-2014-Policy-Perspectives-Final-web.pdf (accessed on 5 May 2023).
- Ferreira, E.R. Trólebus, Espaço e Sociedade. Ph.D.Thesis, Universidade de São Paulo, São Carlos, Brazil, 1995. [Google Scholar] [CrossRef]
- Zaparolli, D. Electric Buses on the Horizon. Available online: https://www.ipea.gov.br/portal/index.php?option=com_content&view=article&id=9567 (accessed on 4 April 2023).
- São Paulo Transporte S/A—SPTrans. Relatorio de Administracao 2018; São Paulo Transporte S/A—SPTrans: São Paulo, Brazil, 2018; p. 477. [Google Scholar]
- De França, R.; Fleury, A.d.T. Implementation of buses with greater energy efficiency as an evolution for public transport in the city of São Paulo. Rev. IPT Tecnol. Inovação 2023, 7, 7–26. [Google Scholar]
- Macedo, J.E.J. Estudo de Linha de Trólebus em Natal. Ph.D. Thesis, Universidade Federal do Rio Grande do Norte, Natal, Brazil, 2017. [Google Scholar]
- NTU. Centro de Documentação e Memória Eurico Divon Galhardi, 1st ed.; Associação Nacional das Empresas de Transportes Urbanos—NTU: Brasília, Brazil, 2019. [Google Scholar]
- Vaz, L.F.H.; Barros, D.C.; Castro, B.H.R.d. Veículos híbridos e elétricos: Sugestões de políticas públicas para o segmento. BNDES Set. 2015, 41, 295–344. [Google Scholar]
- Summit Mobilidade. Em Shenzhen, na China, 100% dos Ônibus e Táxis São Elétricos. Available online: https://summitmobilidade.estadao.com.br/ir-e-vir-no-mundo/em-shenzhen-na-china-100-dos-onibus-e-taxis-sao-eletricos/ (accessed on 6 November 2022).
- Radar, E. Relatório Ebus Radar. Available online: http://lookerstudio.google.com/reporting/2884db9f-149e-41de-b13f-1e55ad434335/page/gr8lB?feature=opengraph (accessed on 1 November 2022).
- Ministério das Cidades. Manual de BRT (Bus Rapid Transit) Guia de Planejamento; Ministério das Cidades: Brasília, Brazil, 2008.
- Harrington; Kelker; Leuw, D. Transit Plans—1937 Plan. Available online: https://www.chicago-l.org/plans/1937plan.html (accessed on 1 July 2022).
- McQueen, J.T.; Waksman, R. Increasing the People-Moving Capability of Shirley Highway. Available online: https://onlinepubs.trb.org/Onlinepubs/trr/1977/626/626-006.pdf (accessed on 31 May 2023).
- Lesley, L. Runcorn A Rapid Transit New Town? Built Environ. 1983, 9, 232–244. [Google Scholar]
- Mejía-Dugand, S.; Hjelm, O.; Baas, L.; Ríos, R.A. Lessons from the spread of Bus Rapid Transit in Latin America. J. Clean. Prod. 2013, 50, 82–90. [Google Scholar] [CrossRef]
- Cottrell, W.D. Transforming a Bus Station into a Transit-Oriented Development: Improving Pedestrian, Bicycling, and Transit Connections. Transp. Res. Rec. J. Transp. Res. Board 2007, 2006, 114–121. [Google Scholar] [CrossRef]
- Vasconcellos, E.A.; Mendonça, A. Política nacional de transporte público no Brasil: Organização e implantação de corredores de ônibus. Rev. Transp. Públicos ANTP 2010, 33, 73–95. [Google Scholar]
- Lopez, R. El Corredor de Trolebuses de Quito. Carret. Rev. Técnica Asoc. Española Carret. 2003, 133, 99–115. [Google Scholar]
- TransMilenio. Estadísticas de Oferta y Demanda del Sistema Integrado de Transporte Público SITP. Available online: https://www.transmilenio.gov.co/publicaciones/149180/estadisticas-de-oferta-y-demanda-del-sistema-integrado-de-transporte-publico-sitp/ (accessed on 1 July 2022).
- Global BRT Data. Available online: https://brtdata.org/ (accessed on 12 April 2023).
- Saaty, T.L. Decision making with the analytic hierarchy process. Int. J. Serv. Sci. 2008, 1, 83–98. [Google Scholar] [CrossRef]
- Wolff, C.S. O Método AHP: Revisão Conceitual e Proposta de Simplificação. Master’s Thesis, PUC Rio de Janeiro, Rio de Janeiro, Brazil, 2008. [Google Scholar]
- Peinado, H. Método AHP Para Tomada de Decisão Multicritério; Number 103 in Coleção Fundamentum; EDUEM: Maringá, Brazil, 2016. [Google Scholar]
- Lucena, A.F.E.; Mori, L.M.D. Uso do Analytic Hierarchy Process (AHP) para Hierarquização de Métodos de Mensuração do Grau de Aplicação da Construção Enxuta. Rev. Gestão Ind. 2018, 14, 48–69. [Google Scholar] [CrossRef]
- Campo Grande, P. BYD D11B: Dirigimos o Ônibus Elétrico de 22 m Fabricado no Brasil. Available online: https://quatrorodas.abril.com.br/carros-eletricos/byd-d11b-dirigimos-o-onibus-eletrico-de22-m-fabricado-no-brasil/ (accessed on 12 April 2023).
- Ferreira, M. Teste: Dirigimos um Ônibus Superarticulado da Mercedes-Benz e não Pagamos a Passagem | Ônibus e Caminhões | Autoesporte. Available online: https://autoesporte.globo.com/testes/review/2021/03/teste-dirigimos-um-onibus-superarticulado-da-mercedes-benz-e-nao-pagamos-a-passagem.ghtml (accessed on 12 April 2023).
- Rebouças, A.B.; Daniel, J. Análise Operacional de Ônibus Elétricos a Bateria em São Paulo. Available online: https://theicct.org/wp-content/uploads/2022/11/brazil-hvs-ZEBRA-analise-operacion-onibus-eletricos-Sao-Paulo-nov22-1.pdf (accessed on 12 May 2023).
- Enel. Enel Brasil. Available online: https://enel.com.br/content/enel-br/pt-saopaulo.html (accessed on 12 April 2023).
- Agência Nacional de Petróleo—ANP. Preços de Revenda e de Distribuição de Combustíveis. Available online: https://www.gov.br/anp/pt-br/assuntos/precos-e-defesa-da-concorrencia/precos/precos-revenda-e-de-distribuicao-combustiveis/levantamento-de-precos-de-combustiveis (accessed on 12 April 2023).
- Edital Completo da Prestação e Exploração do Serviço de Transporte Coletivo Público de Passageiros na Capital. Available online: http://www.antp.org.br/noticias/clippings/edital-completo-da-prestacao-e-exploracao-do-servico-de-transporte-coletivo-publico-de-passageiros-na-capital.html (accessed on 21 June 2023).
- Raymundo, H.; Reis, J.G.M. How to Measure Performance Evaluation in Urban Passenger Transportation by Disutilities: Model and Application in the Ten Largest US Cities. J. Urban Plan. Dev. 2023, 149, 04023007. [Google Scholar] [CrossRef]
- Empresa de Pesquisa Energética—EPE. Matriz Energética. Available online: https://www.epe.gov.br/pt/abcdenergia/matriz-energetica-e-eletrica (accessed on 12 April 2023).
- Ishizaka, A.; Labib, A. Analytical hierarchy process and expert choice: Benefits and limitations. Oper. Res. Insight 2009, 22, 201–220. [Google Scholar] [CrossRef]
- Bagheri, M.; Lonik, K.A.T.; Jaafar, M.; Adam, R.; Talaat, W.I.A.W.; Wolf, I.D. Integrating Social, Economic, and Environmental Factors to Evaluate How Competitive Urban Landscapes Are for the Development of Sustainable Cities: Penang Island in Malaysia as a Case Study. Land 2023, 12, 104. [Google Scholar] [CrossRef]
- Xu, L.; Kumar, D.T.; Shankar, K.M.; Kannan, D.; Chen, G. Analyzing criteria and sub-criteria for the corporate social responsibility-based supplier selection process using AHP. Int. J. Adv. Manuf. Technol. 2013, 68, 907–916. [Google Scholar] [CrossRef]
- de Araújo, F.A.; dos Reis, J.G.M.; da Silva, M.T.; Aktas, E. A Fuzzy Analytic Hierarchy Process Model to Evaluate Logistics Service Expectations and Delivery Methods in Last-Mile Delivery in Brazil. Sustainability 2022, 14, 5753. [Google Scholar] [CrossRef]
- Carvalho, C.H.R.d. Mobilidade Urbana Sustentável: Conceitos, Tendências e Reflexões; Instituto de Pesquisa Econômica Aplicada: Rio de Janeiro, Brazil, 2016.
- Machado, N. Enel X Estuda Eletrificação de Frotas de Ônibus em Cidades Brasileiras. Available online: https://epbr.com.br/enel-x-estuda-eletrificacao-de-frotas-de-onibus-em-cidades-brasileiras/ (accessed on 12 April 2023).
- Rodrigues, G.S.; dos Reis, J.G.M.; Machado, S.T. Panorama da mobilidade elétrica no transporte público da Região Metropolitana de São Paulo—Brasil. In Proceedings of the VII Congresso Internacional de Logística e Operações do IFSP—Suzano; IFSP: Suzano, Brazil, 2021; Volume 1. [Google Scholar]
- Barassa, E.; Cruz, R.F.d.; Moraes, H.B. 1° Anuário Brasileiro da Mobilidade Elétrica; Plataforma Nacional da Mobilidade Elétrica: Rio de Janeiro, Brazil, 2020. [Google Scholar]
- Hanson, S. Introducing Urban Transportation. In The Geography of Urban Transportation, 4th ed.; Giuliano, G., Hanson, S., Eds.; Guilford Press: New York, NY, USA, 2017; pp. 15–57. [Google Scholar]
- Yang, Y.; Han, X.; Jiang, R.; Jia, B.; Gao, Z.-Y. Competition and coordination in public transport: A mode choice experiment. Transp. Res. Part C Emerg. Technol. 2022, 143, 103858. [Google Scholar] [CrossRef]
- Raymundo, H.; Reis, J.G.M.d. Measures for Passenger-Transport Performance Evaluation in Urban Areas. J. Urban Plan. Dev. 2018, 144, 04018023. [Google Scholar] [CrossRef]
- Williams, R.V.; Excell, P. Crossrail—London’s new underground railway. In Proceedings of the 2018 25th International Workshop on Electric Drives: Optimization in Control of Electric Drives (IWED), Moscow, Russia, 31 January–2 February 2018; pp. 1–9. [Google Scholar] [CrossRef]
- Dallmann, T. Benefícios de Tecnologias de Ônibus em Termos de Emissões de Poluentes do ar e do Clima em São Paulo; Technical Report; International Council of Clean Transportation: Washington, DC, USA, 2019; p. 572. [Google Scholar]
- UITP. Transforming Cities with Bus Rapid Transit (BRT) Systems: How to Integrate BRT? Technical Report; UITP: Brussels, Belgium, 2019. [Google Scholar]
- Sousa, M.S. José dos Campos (SP) Assume o Transporte e Anuncia Frota Elétrica. Available online: http://www.mobilize.org.br/noticias/13061/s-jose-dos-campos-sp-assume-o-transporte-e-%20576%20anuncia-frota-eletrica.html (accessed on 31 May 2023).
- Albuquerque, C.; Tavares, V.; Siqueira, E.; Corrêa, F. Ônibus Elétricos: Um Guia de Eletromobilidade Para Cidades Brasileiras. Available online: https://www.wribrasil.org.br/noticias/como-implementar-onibus-eletricos-um-guia-de-eletromobilidade-para-cidades-brasileiras (accessed on 31 May 2023).
- Mavi, R.K.; Zarbakhshnia, N.; Khazraei, A. Bus rapid transit (BRT): A simulation and multi criteria decision making (MCDM) approach. Transp. Policy 2018, 72, 187–197. [Google Scholar] [CrossRef]


Disclaimer/Publisher’s Note: The statements, opinions and data contained in all publications are solely those of the individual author(s) and contributor(s) and not of MDPI and/or the editor(s). MDPI and/or the editor(s) disclaim responsibility for any injury to people or property resulting from any ideas, methods, instructions or products referred to in the content. |
© 2023 by the authors. Licensee MDPI, Basel, Switzerland. This article is an open access article distributed under the terms and conditions of the Creative Commons Attribution (CC BY) license (https://creativecommons.org/licenses/by/4.0/).