Abstract
The main target is the maximization of the output power of PEM “proton exchange membrane” fuel cell via fuzzy modelling and optimization. In the beginning, using the experimental data, a robust fuzzy model is designed for simulating the PEM fuel cell using the relative humidity (%) and stoichiometric ratio at the anode and cathode. Then, the artificial ecosystem optimiser (AEO) is applied to determine the best values of the controlling input parameters. During the optimization process, the four controlling input parameters of the PEMFC are used as the decision variables, whereas as the cost function is required to be at the maximum of the output power density of the PEMFC. For the fuzzy model of the power, the RMSE values are 1.5588 and 3.1906, respectively, for training and testing data. The coefficient of determination values are 0.9826 and 0.8743 for training and testing, respectively. This confirms a successful modelling phase. Finally, the integration between fuzzy and AEO boosted the power of the PEMFC from 57.95 W to 78.44 W (by around 35%). Under this optimal condition, the controlling input parameters values are 26.65%, 56.77%, 1.14, and 1.68, respectively, for anode relative humidity, cathode relative humidity, anode stoichiometric ratio and cathode stoichiometric ratio. The present study, however, intends to highlight the importance of fuzzy modelling and metaheuristic algorithms in the development of digital twins to accelerate the commercialization of fuel cells as well as its applicability in diverse global economic sectors where a higher power requirement is needed. It is also aimed at informing the fuel cell research community and policy makers on strategies that could be adopted in boosting fuel cell performance and therefore could be a good reference source in decision-making for fuel cell commercialization and its practical implementation.
1. Introduction
Climate change continues to be one of the topical issues discussed across the globe. The lessons learnt from the industrial revolution era due the quest of living a comfortable life, hence leading to higher energy demand, is one of the focal points accelerating the call for a paradigm shift from fossil commodities. Despite public sensitization regarding the global impact of fossil fuel commodities on the environment, it is still one of the leading sources of energy for most global economies [1]. There have been diverse programmes organised by the EU mainly to guard again the sudden upsurge on the reliance on fossil fuel commodities. An example of such a programme is the European Green Deal [2]. The goal for this project is to ensure carbon neutrality for Europe in 2050. These projections are made with anticipation that renewable medium of harnessing energy dominates all the notable means of producing energy. The last 20 years has seen the evolution of fuel cells, an energy converting device that is promising in augmenting existing energy generation mediums. PEMFCs are often preferred as a replacement for fossil-based products [3,4]. Some of the merits associated with PEMFCs includes lower operational conditions, simplified method of scaling up, quicker start up as well as higher power density, hence why it is ideal for the automotive industry and stationary purposes [5,6,7]. PEMFCs are designed to transform energy in fuel to electricity via an electrochemical process. The end product for the entire electrochemical reactions is water and heat. The flow of the fuel occurs on the anodic electrode, while the cathodic electrode serves as the medium for the passage of air, as depicted in Figure 1. Through the hydrogen oxidation reaction (HOR), there is the production of hydroxonium ions and electrons. The passage of electrons via an external circuit from the anodic to the cathodic electrode leads to the production of electricity [8]. The membrane for PEM fuel cells is, however, designed to ensure the easy movement of hydroxonium ions, leading to its combination with oxygen to produce water via the oxygen reduction reaction (ORR). Equations (1) to (3) capture the reactions within the cell. Equation (1) presents the hydrogen oxidation reaction.
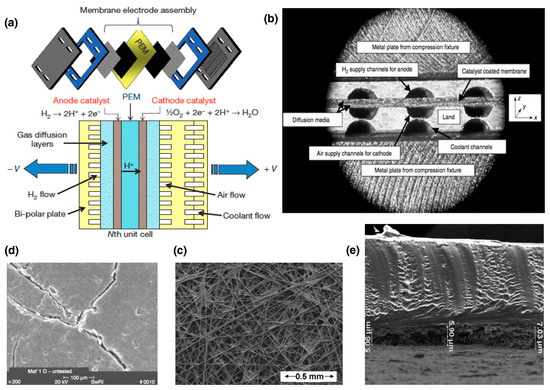
Figure 1.
(a) PEMFCs composition. (b) Sectional view of the cell. (c) SEM of a gas diffusion layer. (d) SEM of microporous layer. (e) SEM of catalyst layer and electrolyser, with permission to reproduce from [4] (License number: 5533720610377).
By using electrothermal mapping, some researchers have evaluated the physiochemical as well as electrochemical behaviour of PEMFCs mainly to characterise the cell. The characterization of the cell occurred via the variation of the flowrate of the reductant [9]. A technical diagnostic approach in comprehending the operating mechanism for air-cooled PEMFCs has also been reported [10]. A study into the operation of PEMFCs in dead-end mode has also been reported in the literature. The conclusion of the study was a reduction in cell performance with time [11]. Delving into the structure of the cell, these energy converting devices comes with flow plates that are usually made up of graphite or any conductive material that can support the easy flow of electrons [12]. The flow plates come with channels that serves as a platform for the easy passage of the reacting species. Beyond the flow plates providing the cell’s structural rigidity, they also contribute to the total weight of the cell. There are other parts of the cell, such as the gas diffusion layer, that plays a critical role, serving as the platform for the passage of the reactant to the catalyst layers. It has been reported in the literature that PEMFCs are a multivariable, dynamic as well as nonlinear device. The operation of the fuel cell can be represented mathematically using partial differential equations. The application of the conventional approach are challenging, especially when identifying the model parameters. Metaheuristics are therefore recommended as ideal methods when identifying these optimal parameters. Several papers from the literature have always argued about challenges pertaining to the identification of ideal parameters for PEMFCs since this information is usually not found as part of the manufacturers information. Accuracy in terms of the mathematical modelling of fuel cells has improved since the evolution of metaheuristics algorithms. For instance, a genetic algorithm has been adopted in modelling pr PEMFCs, but there were issues pertaining to the computational efficiency being low compared to other algorithms [13,14]. It shows, however, that finding the optimal solutions using a genetic algorithm is always going to be problematic in terms of the accuracy of the model. Other authors reported the usage of a particle swarm optimiser (PSO) [15], but there are other algorithms that can yield better results compared to those by PSO. The application of HADE has also been presented in the literature [16]. Improving the evolution algorithm via HADE comes with some limitations in terms of controlling the parameter sensitivity as well as reduced neighbourhood search efficiency. The salp swarm algorithm [17] is also another type of optimiser explored in the literature. There are others such as the grey wolf optimiser, which is reported as being ideal for the parametric estimation of unknown fuel cell parameters [18]. Modified artificial ecosystem optimisers coupled with the LSHADE-EpSin optimisers have all been experimented as suitable options in terms of parametric investigation into unknown parameters for fuel cell estimation [19]. A marine predator optimiser as well as political optimisers have also been reported [20]. Similarly improved fluid search optimisers [21] have also been presented as most ideal in estimating the unknown parameters of the cell. One of the key traits that cuts across each of these optimisers is the fact that they all come with their peculiar accuracy, rate of convergence, complexity, etc. The application of a Bayesian regularised neural network for the extraction of the unknown parameters have also been reported in the literature [22]. The identification of these parameters was also explored using barnacles mating optimiser [23]. Zhu et al. [24] used adaptive sparrow optimiser to find the unknown fuel cell parameters. A heap-based optimiser was also used for the parametric estimation of cell performance [25]. Mossa et al. [26] used both the Harris Hawk as well as the atom optimiser in finding the ideal PEMFC parameters. The slime mould [27] as well as the chaos swarm optimiser have also been proposed for exploring these unknown parameters [28].
Mathematical Modelling of Fuel Cells
Figure 2 captures the equivalent circuit diagram for PEMFCs. The fuel cell behaviour being nonlinear [29] can best be expressed using Equation (4). From Equation (4), Va represents the activation polarization, VO represents ohmic polarization, and Vc represents mass concentration. The thermodynamic voltage is also represented as ENerst.

Figure 2.
Diagrammatic representation of PEMFC structure, with permission to reproduce from [30] (License number: 5533730012115).
The fuel cell temperature is denoted as , while the hydrogen pressure values are represented as , and that of oxygen is represented as . Equation (6) is used for the calculation of the activation losses [31]. The calculation for the ohmic losses is also achieved using Equation (7).
The membrane ohmic resistance is represented as , and this parameters has a correlation with the specific resistivity of the membrane ), membrane thickness as well as the surface area as depicted in Equation (8), but Equation (9) is used in the determination of the specific resistivity of the membrane . The membrane water content is denoted as , while Equation (10) is adopted in the determination of the mass concentration losses. The maximum current density is , while is current density. is the current deduced from the fuel cell. The adjustable parameter is from Equation (10). Figure 3 highlights the nonlinear behaviour of fuel cells. It highlights the various losses in the cell, i.e., activation, ohmic and mass concentration losses.
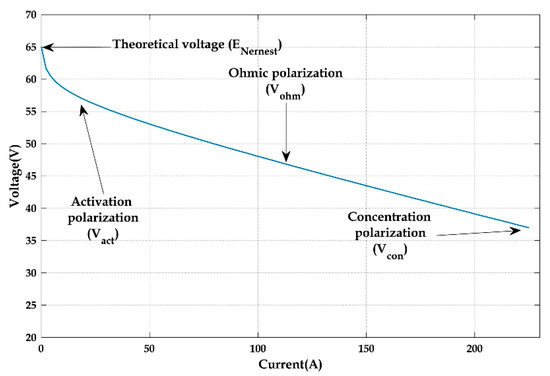
Figure 3.
Nonlinear characteristics of PEM fuel cells.
The present investigation is aimed to maximize the power output of PEMFCs and, more importantly, exploring the importance of fuzzy modelling and metaheuristic algorithms in advance the digital twin in accelerating the commercialization of PEMFCs. To meet this target, the study is structured into five main sections. Section 1 presents a broader overview of fuel cells, their operating mechanisms and the mathematical equation depicting the various electrochemical reactions within the cells. This is then followed by Section 2, where the materials and experimental approach used for the investigations is critically evaluated and summarised accordingly. Section 3 presents the modelling approach and the artificial ecosystem optimiser used in the present study. The outcome of the modelling processes is captured in the results and discussion in Section 4. An overall scope of work and reflection on the results gathered is highlighted in Section 5 as conclusion.
2. Materials and Methods
The data obtained for the present study come from a 50 cm2 PEMFC obtained from ElectroChem Inc in the study by [32]. The flow plate of the cell was made up of graphite and had a serpentine flow channel geometry. The anodic electrode was made up of the horizontal flow plate geometry design, while the cathodic electrode was made up of the vertical flow plate geometry design, as depicted in Figure 4. The experiment was conducted based on the detailed protocol from the Joint Research Centre (JRC) [32]. Nafion 112 was utilised as the electrolyte for the cell, while the catalyst loading was 1.0 mg Pt/cm2. There was the absence of microporous layers within the cell, but the gas diffusion layer was Toray TGP–H–060. To curb the leakage of reactant, silicon gaskets were used. The cell test bench is captured in Figure 5. The key operating conditions deduced from the experimental procedure were the relative humidity and stoichiometric ratio. Further information about the test rig is obtainable from [32].
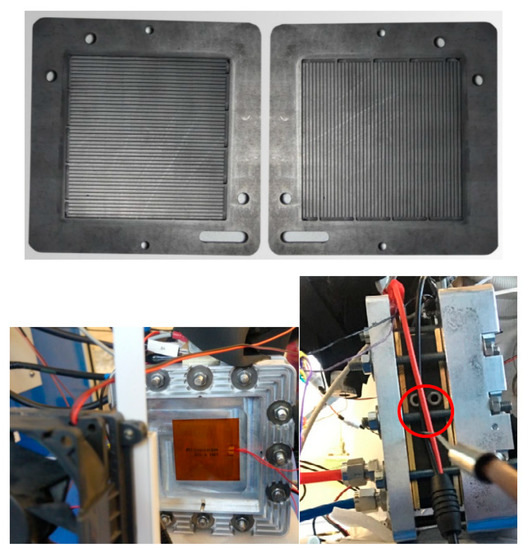
Figure 4.
Flow plate of the fuel cell used for the investigation [31].
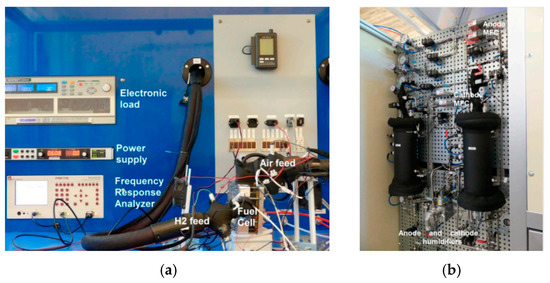
Figure 5.
Experimental setup. (a) Various components in the experimental test rig. (b) Balance of plant backend [32].
3. Methodology
3.1. Fuzzy-Modelling
The stages of fuzzy modelling typically include: (1) Problem formulation: Identify the problem to be solved, determine the input/output variables, and define the objectives of the fuzzy model. (2) Fuzzification: Convert the crisp inputs into fuzzy sets using membership functions to represent the degree of membership of each value in the input variable [33,34]. (3) Rule creation: Define fuzzy if-then rules that relate the inputs to the outputs. These rules can be created based on expert knowledge or automated methods. (4) Inference: Evaluate the rules to determine the output fuzzy sets given the input fuzzy sets. This involves combining the rules’ antecedents and aggregating the output sets. (5) Defuzzification: Convert the fuzzy output sets to crisp outputs using a defuzzification method to obtain a meaningful and useful solution. (6) Model validation: Evaluate the model’s performance using test data and refine the model’s parameters and rules as necessary [35].
The role of the fuzzification layer is to map the inputs to their corresponding membership values using membership functions (MFs). In the inference engine phase, the fuzzy rules defined in the knowledge base are evaluated using the rule’s antecedents, and their outputs are combined to obtain a fuzzy output in the product layer. The normalised layer then aggregates the fired rules to obtain the final fuzzy output, which can be further processed to obtain a crisp output if necessary. The if-then rules are used in the fuzzy modelling for simulating the input–output mapping, such as:
IF x is A1 and y is B1 then f1 = g1(x, y)
IF x is A2 and y is B2 then f2 = g2(x, y)
As and Bs are the membership functions of x and y inputs, respectively:
are the MF values of the two inputs.
3.2. Artificial EcoSystem Optimiser
AEO is a nature-inspired optimizer used energy flow in a terrestrial eco-system. This algorithm replicates three biological behaviours: production, consumption and decomposition. The production operator’s primary goal is to improve exploration and exploitation balancing. The consumption operator is utilised to boost the algorithm’s exploration. It is recommended to increase algorithm exploitation for the decomposition operator [36]. To find a solution, AEO typically uses the following guidelines. The production operator can be modelled as follows:
where n represents population size, r1 and r are random factors, and xrand is a random position. The consumption operator can be modelled as follows:
The decomposition operator can be modelled as follows:
The AEO flowchart is presented in Figure 6.

Figure 6.
AEO flowchart.
4. Results and Discussion
4.1. Modelling Phase
A total of 29 measured points were used to build the model (fuzzy), where 20 points used in training the model, and the rest in testing the model. The training of the model is developed through the utilization of a hybrid strategy that makes use of LSE in the forward path. The SC is utilised in the process of constructing the rules for the system, which were included in [19]. After that, these models were trained until an RMSE that was significantly lower was achieved. The statistical metrics that were generated by the fuzzy model are presented in Table 1.

Table 1.
Statistical metrics of fuzzy model.
In respect to Table 1, for the model of the power, the RMSE values are 1.5588 and 3.1906, respectively, for training and testing data. The R-squared values are 0.9826 and 0.8743, respectively for training and testing. The R-squared for all data is 0.96. This confirms a successful modelling phase due to the fact that it is close to 1. Figure 7 displays the four-input single-output construction of the fuzzy model. However, the outlines of the Gaussian-shaped MFs are expressed in Figure 8.
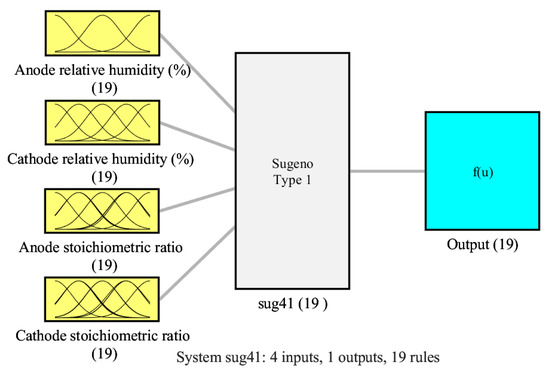
Figure 7.
Arrangement of fuzzy based model of power of PEMFCs.
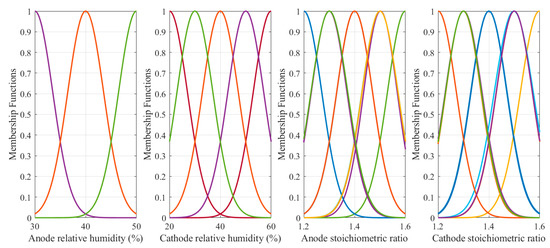
Figure 8.
Inputs’ MFs of the fuzzy model.
Figure 9 shows the spatial description in a 3D point of view with contours of the system’s input–output function for every two inputs. The peak value of the output is represented by dark red, and the smallest value is represented by dark blue.

Figure 9.
Three-dimensional plot of the controlling parameters. (a) Cathode relative humidity (CRH) and Anode relative humidity (ARH), (b) Anode stoichiometric ratio (ASR) and ARH, (c) Cathode stoichiometric ratio (CSR) and ARH, (d) ASR and CRH, (e) CSR and CRH, and (f) CSR and ASR.
Fuzzy model predictions for PEMFC output power are more reliable when the right relationship between input and output parameters is used during model construction. This can be seen in Figure 10, in which the predicted outputs of the fuzzy model are compared to the those of the experimental data. As can be seen, there is a good agreement between the estimated and measured values. Figure 11 also displays the results of the training and testing phases, showing the plots of the predictions that are centred around the line, indicating 100% precision.
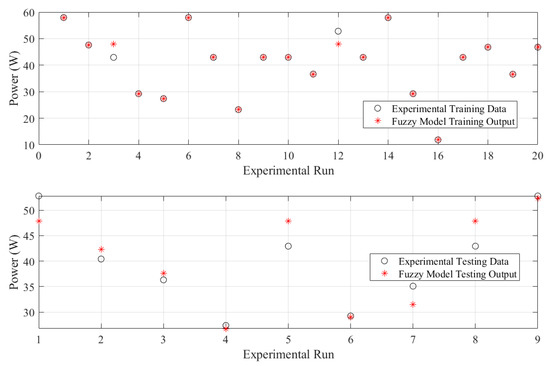
Figure 10.
Predicted versus experimental data of the fuzzy model.
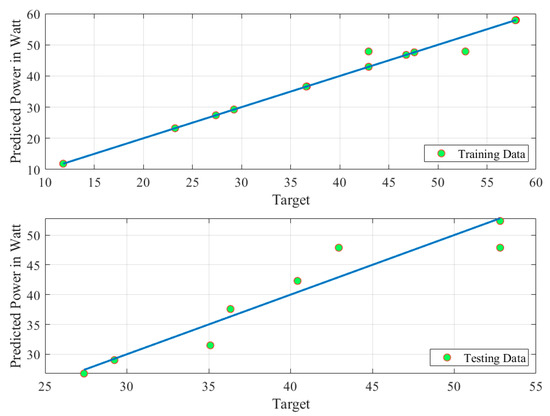
Figure 11.
Prediction accuracy of the fuzzy model.
4.2. Optimization Phase
The goal of this subsection is determining the optimum values of ARH, CRH, ASR and CSR for boosting the output power of PEMFCs. Accordingly, after constructing a reliable fuzzy model, the AEO is applied to define the optimum values for the input parameters. The argument of objective function can be stated by (20).
where x is the four controlling input variables, and y is output power of the PEMFC.
Table 2 presents the best parameters using the experimental data and the AEO. The suggested method boosted the power of the PEMFC from 57.95 W to 78.44 W (by around 35%). The particle convergence during parameter identification is presented in Figure 12. The optimal controlling input parameters values are 26.65%, 56.77%, 1.14 and 1.68, respectively, for ARH, CRH, ASR and CSR.

Table 2.
Optimal parameter values using measured data and proposed strategy.
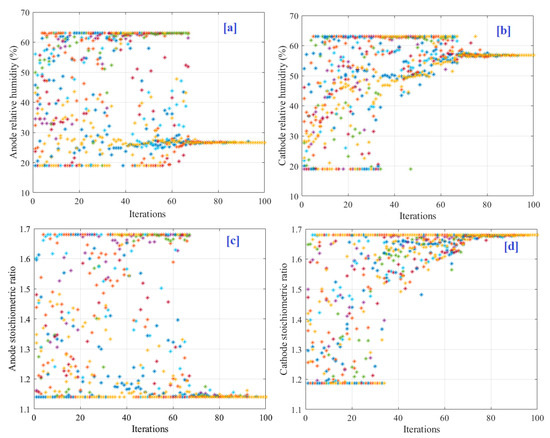
Figure 12.
Particles convergence during parameter identification. (a) ARH. (b) CRH. (c) ASR. (d) CSR.
To confirm the superiority of AEO, the results are compared with a PSO and SMA. To be fair in the comparison, the number of particles and maximum number of iterations are fixed at 10 and 100, respectively. All optimisers are executed for 30 runs to avoid the random results. The statistical analysis for the 30 runs is demonstrated in Table 3. The highest average cost function of 77.238 W is obtained by the AEO followed by SMA (74.304 W), whereas the lowest average cost function of 73.97 W is obtained by the PSO. The details of cost function values and the optimal parameters every run is presented in Table 4 and Figure 13.

Table 3.
Statistical evaluation of the AEO, PSO and SMA.

Table 4.
Details of the 30 runs.
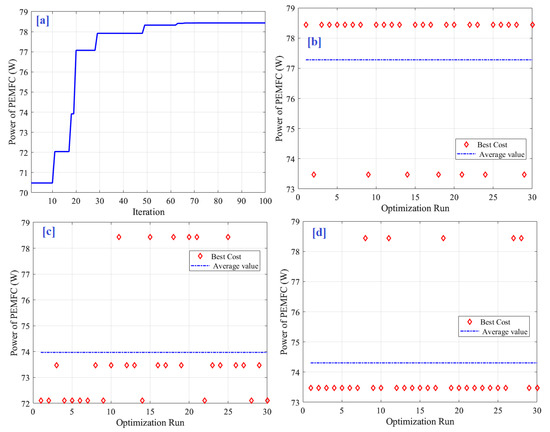
Figure 13.
(a) Best cost function found over 30 runs of the (b) AEO, (c) PSO and (d) SMA.
To confirm the superiority of the AEO, ANOVA and Tukey statistical tests are carried out. The use of ANOVA and Tukey tests can help determine if there are statistically significant differences between multiple groups. ANOVA does this by analysing the variation within each group and comparing it to the variation between the groups. ANOVA can be used to determine if the means of the groups are statistically significant and if there are any interactions between the groups. The results provided in Table 5 confirm the difference in the results between the algorithms. The ANOVA ranking presented in Figure 14 confirms that the AEO’s performance is the best, as it provided the higher mean fitness and lowest variations.

Table 5.
ANOVA results.

Figure 14.
ANOVA ranking.
The results of the ANOVA test are approved by the Tukey test. It is a post hoc test often used in conjunction with ANOVA. It is used to determine which groups have significant differences between their means. Tukey’s test compares the means of all possible pairs of groups and produces a confidence interval for the difference between them. If the confidence interval does not contain zero, it indicates that the difference between the means is statistically significant, as illustrated in Figure 15. The mean of the AEO group is significantly better than that of the PSO and SMA groups, confirming its ability to perform better.
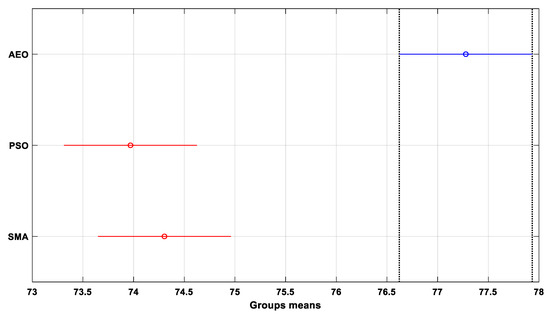
Figure 15.
Tukey test.
5. Conclusions
By utilizing fuzzy modelling and optimization, the purpose of this study is to achieve the greatest possible increase in the output power of a PEM fuel cell. To begin, the experimental data are used to construct a robust fuzzy model, which is then used to simulate the PEM fuel cell in terms of the anode stoichiometric ratio, cathode stoichiometric ratio, anode relative humidity (%) and cathode relative humidity (%). The artificial ecosystem optimiser, abbreviated as AEO, is then applied to the problem in order to ascertain the values that are ideal for the controlling input parameters. During the process of optimization, the four controlling input parameters of the PEMFC are used as decision variables. At the same time, the cost function works toward increasing the output power density of the PEMFC as much as possible. The fuzzy model of the power has an RMSE value of 1.5588 and 3.1906 for training and testing data, respectively, while the coefficient of determination values are 0.9826 and 0.8743, respectively for training and testing, demonstrating successful model development. Finally, by integrating fuzzy modelling and the AEO, the power output of the PEMFC increased from 57.95 W to 78.44 W (an increase of approximately 35%). Under these optimal conditions, the values for the controlling input parameters were 26.65%, 56.77%, 1.14, and 1.68, respectively, for anode relative humidity, cathode relative humidity, anode stoichiometric ratio and cathode stoichiometric ratio.
Author Contributions
Conceptualization, H.R, T.W., M.A.A. and E.T.S.; methodology, R.M.G.; software, H.R.; validation, A.G.O., T.W. and M.A.A.; formal analysis, H.R.; investigation, A.G.O.; resources, T.W.; data curation, M.A.A.; writing—original draft preparation, H.R.; writing—review and editing, T.W.; visualization, H.R.; supervision, H.R.; project administration, A.G.O. All authors have read and agreed to the published version of the manuscript.
Funding
Princess Nourah bint Abdulrahman University Researchers Supporting Project number (PNURSP2023R138), Princess Nourah bint Abdulrahman University, Riyadh, Saudi Arabia.
Data Availability Statement
Data will be made available upon request.
Acknowledgments
We acknowledge the support from Princess Nourah bint Abdulrahman University Researchers Supporting Project number (PNURSP2023R138), Princess Nourah bint Abdulrahman University, Riyadh, Saudi Arabia.
Conflicts of Interest
The authors declare no conflict of interest.
References
- Olabi, A.G.; Wilberforce, T.; Elsaid, K.; Sayed, E.T.; Maghrabie, H.M.; Abdelkareem, M.A. Large scale application of carbon capture to process industries—A review. J. Clean. Prod. 2022, 362, 132300. [Google Scholar] [CrossRef]
- European Union. Energy Prices, the European Green Deal and EU Foreign and Security Policy. 2021. Available online: https://www.eeas.europa.eu/eeas/energy-prices-european-green-deal-and-eu-foreign-and-security-policy_en (accessed on 15 February 2023).
- Aminudin, M.; Kamarudin, S.; Lim, B.; Majilan, E.; Masdar, M.; Shaari, N. An overview: Current progress on hydrogen fuel cell vehicles. Int. J. Hydrogen Energy 2023, 48, 4371–4388. [Google Scholar] [CrossRef]
- Wang, Y.; Diaz, D.F.R.; Chen, K.S.; Wang, Z.; Adroher, X.C. Materials, technological status, and fundamentals of PEM fuel cells—A review. Mater. Today 2020, 32, 178–203. [Google Scholar] [CrossRef]
- Musa, M.T.; Shaari, N.; Kamarudin, S.K.; Wong, W.Y. Recent biopolymers used for membrane fuel cells: Characterization analysis perspectives. Int. J. Energy Res. 2022, 46, 16178–16207. [Google Scholar] [CrossRef]
- Fadzillah, D.M.; Kamarudin, S.K.; Zainoodin, A.M. Design and simulation for improved performance via pump-less direct ethanol fuel cell for mobile application. Int. J. Energy Res. 2022, 46, 15683–15695. [Google Scholar] [CrossRef]
- Azni, M.A.; Khalid, R.M.; Hasran, U.A.; Kamarudin, S.K. Review of the Effects of Fossil Fuels and the Need for a Hydrogen Fuel Cell Policy in Malaysia. Sustainability 2023, 15, 4033. [Google Scholar] [CrossRef]
- Raduwan, N.F.; Shaari, N.; Kamarudin, S.K.; Masdar, M.S.; Yunus, R.M. An overview of nanomaterials in fuel cells: Synthesis method and application. Int. J. Hydrogen Energy 2022, 47, 18468–18495. [Google Scholar] [CrossRef]
- Meyer, Q.; Himeur, A.; Ashton, S.; Curnick, O.; Clague, R.; Reisch, T.; Adcock, P.; Shearing, P.R.; Brett, D.J.L. System-level electro-thermal optimisation of air-cooled open-cathode polymer electrolyte fuel cells: Air blower parasitic load and schemes for dynamic operation. Int. J. Hydrogen Energy 2015, 40, 16760–16766. [Google Scholar] [CrossRef]
- Meyer, Q.; Ashton, S.; Jervis, R.; Finegan, D.P.; Boillat, P.; Cochet, M.; Curnick, O.; Reisch, T.; Adcock, P.; Shearing, P.R.; et al. The Hydro-electro-thermal Performance of Air-cooled, Open-cathode Polymer Electrolyte Fuel Cells: Combined Localised Current Density, Temperature and Water Mapping. Electrochim. Acta 2015, 180, 307–315. [Google Scholar] [CrossRef]
- Meyer, Q.; Ashton, S.; Torija, S.; Gurney, C.; Boillat, P.; Cochet, M.; Engebretsen, E.; Finegan, D.P.; Adcock, P.; Shearing, P.R.; et al. Nitrogen Blanketing and Hydrogen Starvation in Dead-Ended-Anode Polymer Electrolyte Fuel Cells Revealed by Hydro-Electro-Thermal Analysis. Electrochim. Acta 2016, 203, 198–205. [Google Scholar] [CrossRef]
- Tzelepis, S.; Kavadias, K.A. Theoretical simulation model of a proton exchange membrane fuel cell. AIP Conf. Proc. 2019, 2190, 020052. [Google Scholar]
- Zhang, L.; Wang, N. Application of coRNA-GA based RBF-NN to model proton exchange membrane fuel cells. Int. J. Hydrogen Energy 2018, 43, 329–340. [Google Scholar] [CrossRef]
- QZhu, Q.; Wang, N.; Zhang, L. Circular genetic operators based RNA genetic algorithm for modeling proton exchange membrane fuel cells. Int. J. Hydrogen Energy 2014, 39, 17779–17790. [Google Scholar]
- Salim, R.; Nabag, M.; Noura, H.; Fardoun, A. The parameter identification of the Nexa 1.2 kW PEMFC’s model using particle swarm optimization. Renew. Energy 2015, 82, 26–34. [Google Scholar] [CrossRef]
- Sun, Z.; Wang, N.; Bi, Y.; Srinivasan, D. Parameter identification of PEMFC model based on hybrid adaptive differential evolution algorithm. Energy 2015, 90, 1334–1341. [Google Scholar] [CrossRef]
- El-Fergany, A.A. Extracting optimal parameters of PEM fuel cells using Salp Swarm Optimizer. Renew. Energy 2018, 119, 641–648. [Google Scholar] [CrossRef]
- Ali, M.; El-Hameed, M.; Farahat, M. Effective parameters’ identification for polymer electrolyte membrane fuel cell models using grey wolf optimizer. Renew. Energy 2017, 111, 455–462. [Google Scholar] [CrossRef]
- Fathy, A.; Aleem, S.H.E.A.; Rezk, H. A novel approach for PEM fuel cell parameter estimation using LSHADE-EpSin optimization algorithm. Int. J. Energy Res. 2021, 45, 6922–6942. [Google Scholar] [CrossRef]
- Diab, A.A.Z.; Tolba, M.A.; El-Magd, A.G.A.; Zaky, M.M.; El-Rifaie, A.M. Fuel Cell Parameters Estimation via Marine Predators and Political Optimizers. IEEE Access 2020, 8, 166998–167018. [Google Scholar] [CrossRef]
- Qin, F.; Liu, P.; Niu, H.; Song, H.; Yousefi, N. Parameter estimation of PEMFC based on Improved Fluid Search Optimization Algorithm. Energy Rep. 2020, 6, 1224–1232. [Google Scholar] [CrossRef]
- Yang, B.; Li, D.; Zeng, C.; Chen, Y.; Guo, Z.; Wang, J.; Shu, H.; Yu, T.; Zhu, J. Parameter extraction of PEMFC via Bayesian regularization neural network based meta-heuristic algorithms. Energy 2021, 228, 120592. [Google Scholar] [CrossRef]
- Yang, Z.; Liu, Q.; Zhang, L.; Dai, J.; Razmjooy, N. Model parameter estimation of the PEMFCs using improved Barnacles Mating Optimization algorithm. Energy 2020, 212, 118738. [Google Scholar] [CrossRef]
- Zhu, Y.; Yousefi, N. Optimal parameter identification of PEMFC stacks using Adaptive Sparrow Search Algorithm. Int. J. Hydrogen Energy 2021, 46, 9541–9552. [Google Scholar] [CrossRef]
- Abdel-Basset, M.; Mohamed, R.; Elhoseny, M.; Chakrabortty, R.K.; Ryan, M.J. An efficient heap-based optimization algorithm for parameters identification of proton exchange membrane fuel cells model: Analysis and case studies. Int. J. Hydrogen Energy 2021, 46, 11908–11925. [Google Scholar] [CrossRef]
- Mossa, M.A.; Kamel, O.M.; Sultan, H.M.; Diab, A.A.Z. Parameter estimation of PEMFC model based on Harris Hawks’ optimization and atom search optimization algorithms. Neural Comput. Appl. 2021, 33, 5555–5570. [Google Scholar] [CrossRef]
- Zheng, J.; Xie, Y.; Huang, X.; Wei, Z.; Taheri, B. Balanced version of Slime Mold Algorithm: A study on PEM fuel cell system parameters identification. Energy Rep. 2021, 7, 3199–3209. [Google Scholar] [CrossRef]
- Özdemir, M.T. Optimal parameter estimation of polymer electrolyte membrane fuel cells model with chaos embedded particle swarm optimization. Int. J. Hydrog. Energy 2021, 46, 16465–16480. [Google Scholar] [CrossRef]
- Rezk, H.; Wilberforce, T.; Sayed, E.T.; Alahmadi, A.N.; Olabi, A. Finding best operational conditions of PEM fuel cell using adaptive neuro-fuzzy inference system and metaheuristics. Energy Rep. 2022, 8, 6181–6190. [Google Scholar] [CrossRef]
- Rezk, H.; Ferahtia, S.; Djeroui, A.; Chouder, A.; Houari, A.; Machmoum, M.; Abdelkareem, M.A. Optimal parameter estimation strategy of PEM fuel cell using gradient-based optimizer. Energy 2022, 239, 122096. [Google Scholar] [CrossRef]
- Wilberforce, T.; Olabi, A.G.; Rezk, H.; Abdelaziz, A.Y.; Abdelkareem, M.A.; Sayed, E.T. Boosting the output power of PEM fuel cells by identifying best-operating conditions. Energy Convers. Manag. 2022, 270, 116205. [Google Scholar] [CrossRef]
- Ramírez-Cruzado, A.; Ramírez-Peña, B.; Vélez-García, R.; Iranzo, A.; Guerra, J. Experimental Analysis of the Performance and Load Cycling of a Polymer Electrolyte Membrane Fuel Cell. Processes 2020, 8, 608. [Google Scholar] [CrossRef]
- Mohammadzadeh, A.; Sabzalian, M.H.; Zhang, C.; Castillo, O.; Sakthivel, R.; El-Sousy, F.F.M. Modern Adaptive Fuzzy Control Systems; Springer: Cham, Switzerland, 2022. [Google Scholar] [CrossRef]
- Sabzalian, M.H.; Alattas, K.A.; Aredes, M.; Alanazi, A.K.; Abo-Dief, H.M.; Mohammadzadeh, A.; Mobayen, S.; Franca, B.W.; Fekih, A. A New Immersion and Invariance Control and Stable Deep Learning Fuzzy Approach for Power/Voltage Control Problem. IEEE Access 2021, 10, 68–81. [Google Scholar] [CrossRef]
- Inayat, A.; Nassef, A.M.; Rezk, H.; Sayed, E.T.; Abdelkareem, M.A.; Olabi, A. Fuzzy modeling and parameters optimization for the enhancement of biodiesel production from waste frying oil over montmorillonite clay K-30. Sci. Total Environ. 2019, 666, 821–827. [Google Scholar] [CrossRef] [PubMed]
- Zhao, W.; Wang, L.; Zhang, Z. Artificial ecosystem-based optimization: A novel nature-inspired meta-heuristic algorithm. Neural Comput. Appl. 2020, 32, 9383–9425. [Google Scholar] [CrossRef]
Disclaimer/Publisher’s Note: The statements, opinions and data contained in all publications are solely those of the individual author(s) and contributor(s) and not of MDPI and/or the editor(s). MDPI and/or the editor(s) disclaim responsibility for any injury to people or property resulting from any ideas, methods, instructions or products referred to in the content. |
© 2023 by the authors. Licensee MDPI, Basel, Switzerland. This article is an open access article distributed under the terms and conditions of the Creative Commons Attribution (CC BY) license (https://creativecommons.org/licenses/by/4.0/).