1. Introduction
The transition to sustainable and carbon-neutral energy technologies is motivating researchers to find alternative approaches allowing an increased penetration of renewable energies in the mobility sector. Green hydrogen is expected to serve a major role in this transition, being an alternative sustainable fuel that can be directly converted to power with high efficiency and power density by means of fuel cell technologies. Proton exchange membrane fuel cells (PEMFC) are electrochemical devices that adopt perfluorosulfonic acid-based polymer membranes [
1,
2] and generally operate below the boiling point of water, i.e., between 60 °C and 110 °C. Differently from conventional low-temperature PEMFCs, in high-temperature proton exchange membrane fuel cells (HT-PEMFC), the ionic conductivity is provided by phosphoric acid that is present in the membrane thanks to the acid/base complexation that results from the interaction of the phosphoric acid with the basic sites available in the imidazole group of the polymer chain [
3]. A blended structure is thus achieved in which ion transport is achieved by proton hopping across the phosphoric acid dispersed in the membrane structure. As a benefit, an extremely low dependence of the membrane conductivity on relative humidity is achieved, thus allowing for extremely dry operation at temperatures up to 200 °C. The high temperature, however, can only be sustained for a limited time to avoid material degradation [
4,
5,
6].
Major issues were encountered in the development of HT-PEMFC technology, mainly related to the presence of phosphoric acid that adsorbs over platinum active sites [
7] available for oxygen reduction reaction (ORR) [
8]. Phosphoric acid also occupies the porous structure of the catalyst layer, hindering oxygen diffusion [
9,
10]. These problems are of paramount importance and are the object of scientific research and material development aiming to accelerate the development of HT-PEMFCs. The aim of this work is to provide a complete analysis of an optimized material with a complete experimental dataset able to discriminate between the major physical phenomena that limit fuel cell performance. The experimental tool adopted for this purpose is electrochemical impedance spectroscopy (EIS). EIS is a non-invasive in situ technique [
11] that excites the electrochemical system with a small sinusoidal current signal in order to measure the linear response over a wide frequency range. EIS is a powerful tool that separates Ohm, kinetic, and mass transport contributions, and thus it is applied in the present analysis to study in operando mass transport mechanisms in a commercial HT-PEMFC.
Characterization of commercial HT-PEMFC by means of electrochemical impedance spectroscopy has been carried out in the literature, briefly reviewed here. In many cases, the analysis of EIS is limited to the high-frequency resistance that is a well-established indicator of membrane ionic resistance [
12], but in several other cases, a more comprehensive analysis is carried out. N. H. Jalani et al. [
13] tested a 44 cm
2 commercial HT-PEMFC (PEMEAS Fuel Cell Technologies) in a wide range of operating conditions. The effects of temperature, anode dew point, cathode stoichiometry, oxygen concentration, and fuel starvation were investigated. The authors observed the onset of mass transport limitations already at 0.2 A cm
−2 (180 °C) and 0.4 Acm
−2 (160 °C). J. Zhang et al. [
14] investigated a 2.6 cm
2 commercial MEA (PEMEAS Fuel Cell Technologies) in pure hydrogen and air with the aid of EIS. The authors reported a significant dependence of performance on cathode stoichiometry, which was recognized to affect the low frequency capacitive feature in EIS, thus linked to mass transport phenomena. Sensitivity analysis of operating temperature indicated a positive effect of temperature on kinetics and performance, but a detrimental effect on mass transport resistance, not expected for gas-phase transport. J. J. Jespersen [
15] conducted a similar study on 45 cm
2 MEA (BASF Celtec
®-P Series 1000) investigating the effect of temperature, air, and hydrogen stoichiometry, and S. J. Andreasen et al. [
16] characterized a 1 kW HT-PEMFC stack with EIS (45 cm
2 MEA BASF Celtec
®-P Series 1000) running on hydrogen. Chen and Lai [
17] studied the effect of inlet relative humidity on 24 cm
2 MEA (Celtec
®-P Series 1000 BASF Fuel Cells). All works that were mentioned analyzed commercial MEAs made via the sol–gel process, which results in a very high phosphoric acid doping level [
18].
Dedicated EIS investigations of non-optimized MEAs have also been performed, revealing interesting results. J. Lobato et al. [
19], in their pioneering work, applied EIS to the optimization of the cathode catalyst layer, with special focus on phosphoric acid loading in CL, Pt/C, and binder content. M. Mamlouk and K. Scott [
20] reported a detailed study of EIS performed on several non-optimized electrodes in a wide range of operating conditions. M. S. Kondratenko et al. [
21] tested different membrane materials coupled with commercial GDEs (BASF Fuel Cells) at low current density (<0.4 A cm
−2). EIS is a powerful tool when supported by a theoretical understanding of the main features when interpreting the results. The general approach for the interpretation of the spectra relies on electrochemical equivalent circuits, in which each element of the circuit is associated with a physical phenomenon [
22]. To provide physical consistency, the authors developed an innovative methodology based on analytical model for HT-PEMFC, as described in [
23]. Additional valuable information is also achieved by comparing EIS data with other techniques, i.e., the polarization curve and cyclic and linear voltammetry.
In this work, an original and systematic experimental analysis of EIS is carried out on a PBI-based HT-PEMFC, aiming to understand the role of phosphoric acid in the catalyst layer. In a previous work, the authors carried out an innovative experimental characterization of transport properties of the porous media of HT-PEMFC [
24] using a novel ex situ technique. To complete the previous analysis, the focus of which was on gas-phase mass transport in porous media, in situ data are collected to obtain evidence of the ion, water, and oxygen transport limitations occurring in phosphoric acid-doped, PBI-based HT-PEMFCs. With reference to the previous activities, all transport mechanisms occurring in the Membrane Electrode Assembly (MEA) are considered in this work. To maintain continuity with the previous study, a gas diffusion electrode (GDE)—the gas-phase transport properties of which have been determined ex situ—is coupled with a phosphoric acid-doped PBI membrane, and the MEA is tested in a wide range of operating conditions and configurations.
2. Materials and Methods
2.1. Membrane Electrode Assembly
Two Dapozol
® (Danish Power Systems) MEAs with an active area of 23.04 cm
2 are the object of the present investigation. Glass PTFE gaskets were cut to a proper thickness to guarantee a compression of the gas diffusion layer (GDL) of 85%. Properties of the gas diffusion layer, micro-porous layer (MPL), and catalyst layer were obtained and reported in [
24]. The analysis was carried out on two MEA samples, which showed good reproducibility, within the measurement uncertainty.
2.2. Experimental Setup
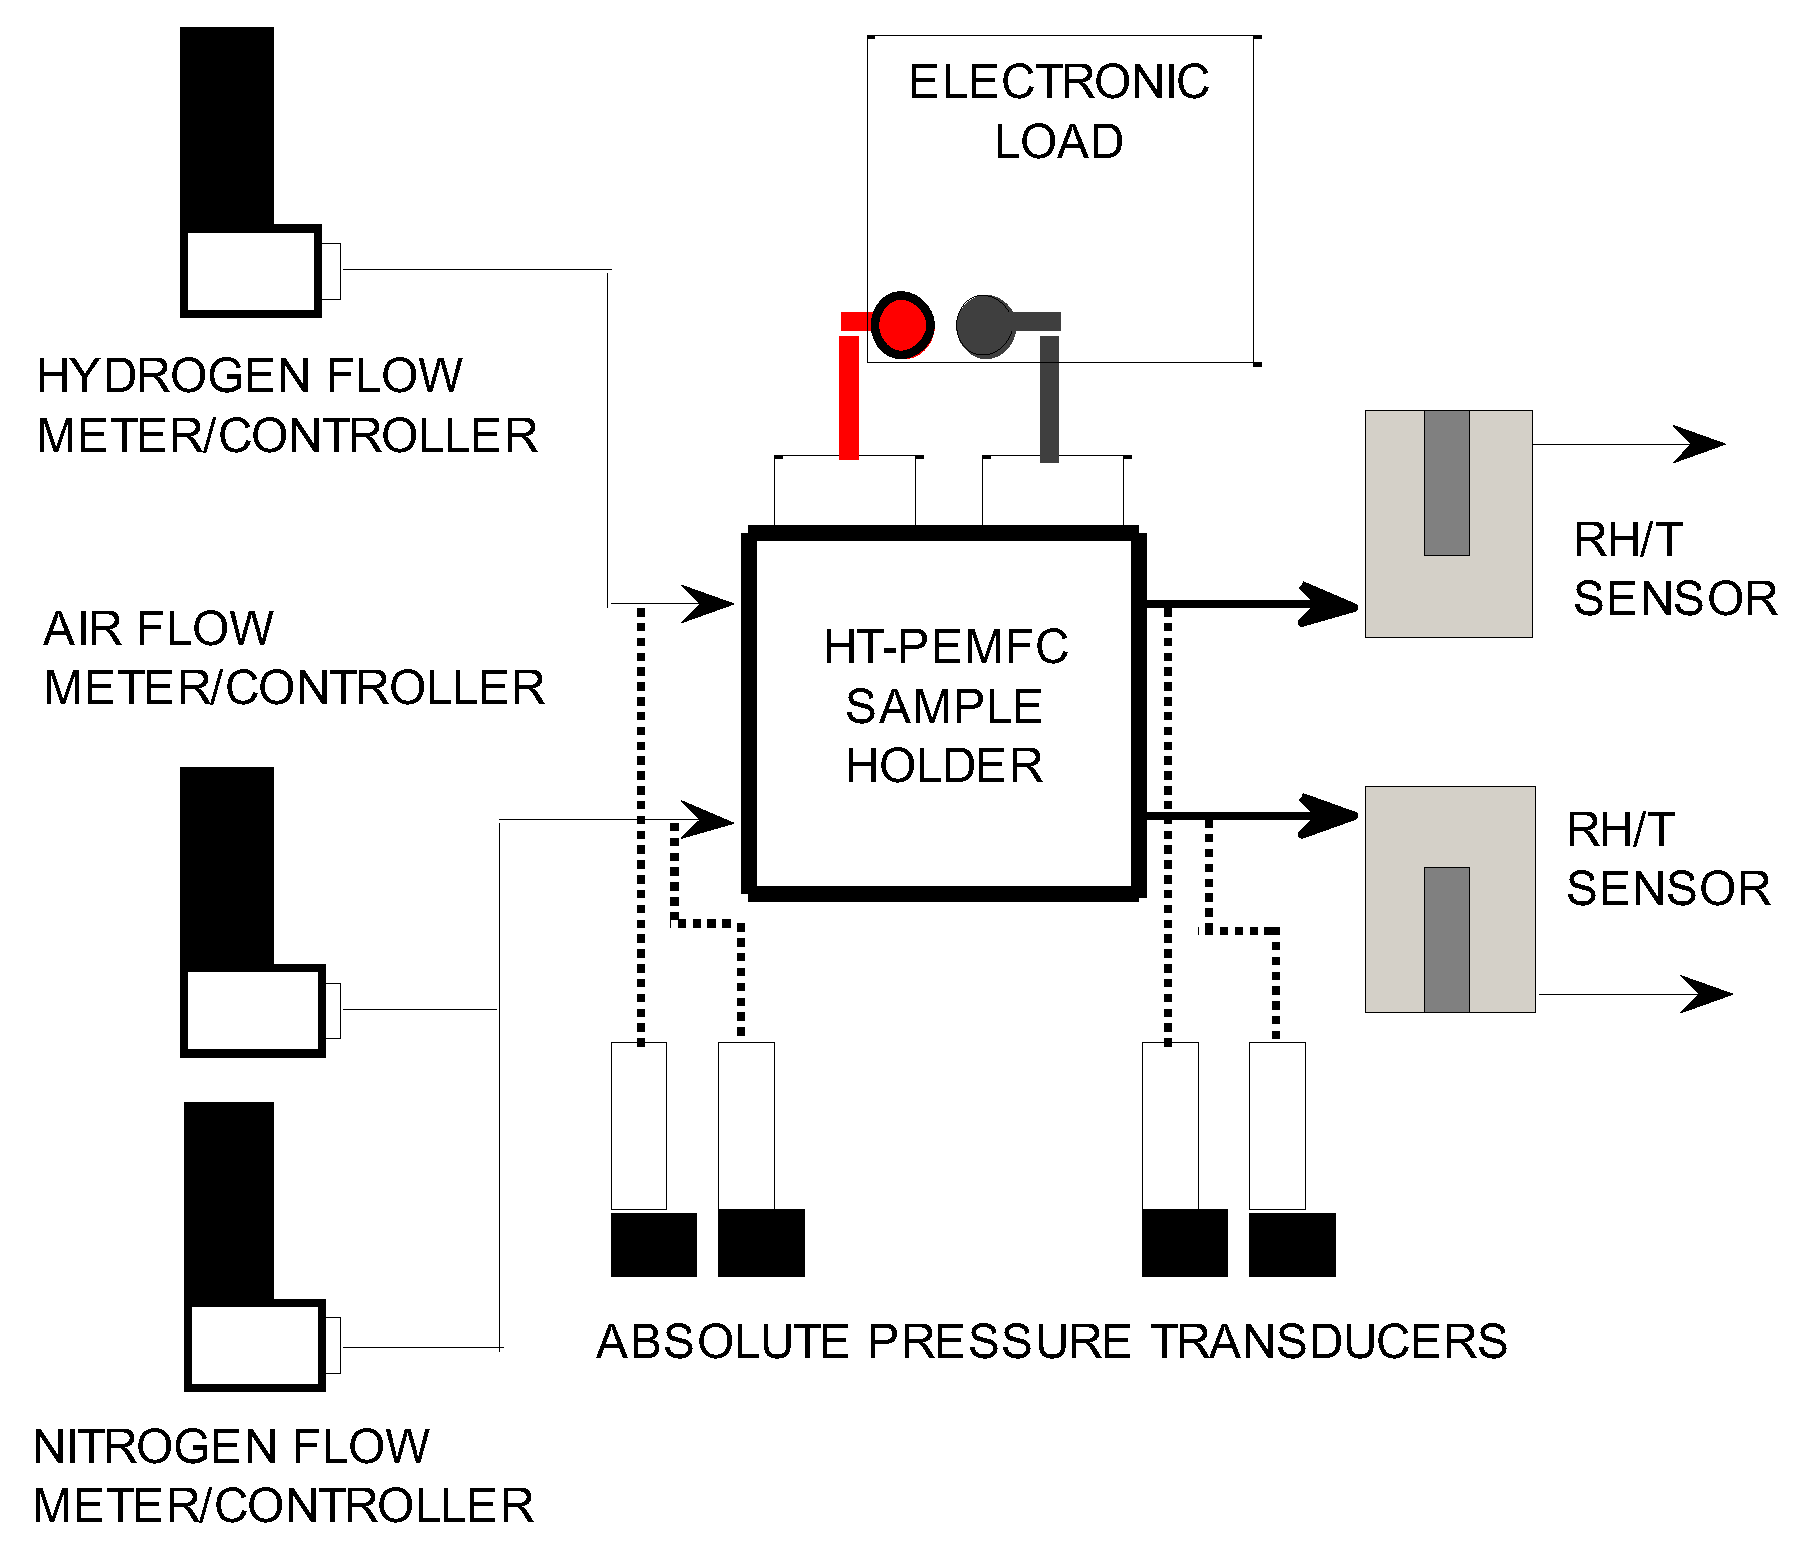
The experimental setup for HTPEMFC testing is depicted schematically in
Figure 1 and was described in previous works [
25]. The reactants are high-purity compressed hydrogen (>99.9999%) and filtered dehydrated compressed air. On both gas lines, a pressure regulator guarantees a 5 bar pressure gauge at the digital flow meter/controllers (Brooks Instruments, Hatfield, PA, USA, model 5850S), hydrogen full scale 200 Nml min
−1, air full scale 2 Nl min
−1). The HT-PEMFC sample was tested in a 25 cm
2 cell hardware assembly (Fuel Cell Technologies Inc., Albuquerque, NM, USA) with a triple serpentine graphite distributor at the cathode side and a single serpentine one at the anode side. The temperature of the single-cell hardware was measured by a K-type thermocouple connected to a data acquisition board equipped with cold junction compensation circuit (National Instruments Corp., Austin, TX, USA, model 9211); a PID controller implemented in Labview kept the temperature of the assembly constant during the test. Pressure was measured at the inlet and outlet both at the anode and cathode sides (pressure transducers Druck, Leicester UK, model PMP 4100). A modular DC electronic load (Chroma Systems Solutions Inc., Foothill Ranch, CA, USA, model 63640-80-80) dissipated the electrical power in Galvanostatic operation and measured the fuel cell current and voltage. Two temperature/relative humidity sensors (Vaisala, Vantaa Finland, model HMT 333) are placed at the anode and cathode outlet, respectively, to measure the water concentration in the effluents, as described in [
26]. A data acquisition board (National Instruments Corp., Austin, TX, USA, model 6218) is needed to convert the analogue voltages of the temperature/humidity sensors and the pressure transducers to digital data. A personal computer controlled the equipment and recorded the experimental data at 1 Hz sampling frequency. When the MEA was tested with low oxygen feed, a nitrogen flow (>99.9999%) was set by a flow meter/controller (Brooks SLA 5850S, full scale 2 Nl min
−1).
Electrochemical impedance spectroscopy in HT-PEMFC configuration was performed by the electronic load that superimposes a sinusoidal AC signal to the DC current. The impedance is computed as the ratio of the Fourier-transformed voltage to the Fourier-transformed current signals.
In the hydrogen pumping configuration, the DC electronic load is substituted with a DC power supply (Chroma Systems Solutions Inc., Foothill Ranch, CA, USA, model 62012P-80-60), and the air flow meter/controller is replaced by a hydrogen flow meter/controller (hydrogen full scale 50 Nml min−1). Humidified hydrogen (humidity bottle saturation temperature 30 °C) is provided at the anode in order to prevent the electrolyte from dehydrating.
In hydrogen pumping, electrochemical impedance spectroscopy was performed by connecting a potentiostat (Metrohm Italiana Srl, Oggiono, Italy, model Autolab PGSTAT 30 equipped with FRA2 module) to the current collectors. Cyclic voltammetry and linear sweep voltammetry were performed by means of the same potentiostat equipped with SCAN250 module. Hydrogen at (30 Nml min−1) is flown at the counter/reference electrode, while humidified nitrogen (100 Nml min−1) is flown at the working electrode. The voltage is swept from 0.05 V to 0.5 V at a sweep rate of 50 mV s−1 for cyclic voltammetry and 1 mV s−1 for linear sweep voltammetry.
Pure oxygen operation was performed by switching the flow meter feed to pure oxygen (>99.98%). The oxygen polarization was performed with an oxygen stoichiometry of 9.52.
2.3. Experimental Methodology
A break-in procedure was applied at the beginning of the test that consisted of maintaining the MEA at 0.2 A cm−2 in reference condition (temperature 160 °C, anode stoichiometry 1.2, cathode stoichiometry 2, dry reactants) until the voltage peaks. After the break-in period, the testing schedule starts. This condition represents the reference case for the parametric analysis carried out in this work.
The polarization curves were performed according to the PEM fuel cell testing standards [
27]: air and hydrogen flow rates were set constant below 0.2 A cm
−2 and equal to values imposed at 0.2 A cm
−2. At any current density higher than 0.2 A cm
−2, stoichiometric flows were set accordingly to the testing conditions. The tested current densities were 0.05, 0.1, 0.15, 0.2, 0.4, 0.6, 0.8, and 1.0 A cm
−2. Each current density was maintained for 300 s to ensure steady state and, if EIS was performed, after 300 s, impedance measurement was carried out from 10 kHz to 50 mHz frequency. Impedance spectra were recorded at 0.05, 0.1, 0.2, 0.4, 0.8, and 1.0 A cm
−2. If the voltage fell below 0.3 V or the pressure difference between cathode and anode is higher than 200 mbar, the polarization was stopped. Operating conditions were investigated by changing each parameter (temperature, stoichiometry, oxygen concentration, and relative humidity) and keeping the reference value for the other parameters.
Data analysis consisted of the elimination of the transient and the outliers resulting from electrical noise by means of a robust algorithm. The dataset was then processed to compute the mean value and the measurement uncertainty. The uncertainty was calculated accounting for the intrinsic measurement uncertainty provided in the instrument manual, the standard deviation of the sample, and the propagation of uncertainty of correlated quantities, according to the standard regulation [
28].
3. Results and Discussion
A discussion of the experimental results obtained is reported in the next sections. A reference condition is defined at 160 °C operating temperature, dry air (stoichiometry 2) and dry hydrogen (stoichiometry 1.2), and under atmospheric pressure. A sensitivity analysis is performed by varying the operating parameters one by one, keeping the others at their reference values. The analysis focuses on operating temperature, cathode and anode stoichiometry, inlet oxygen mole fraction, and inlet relative humidity.
3.1. Effect of Temperature
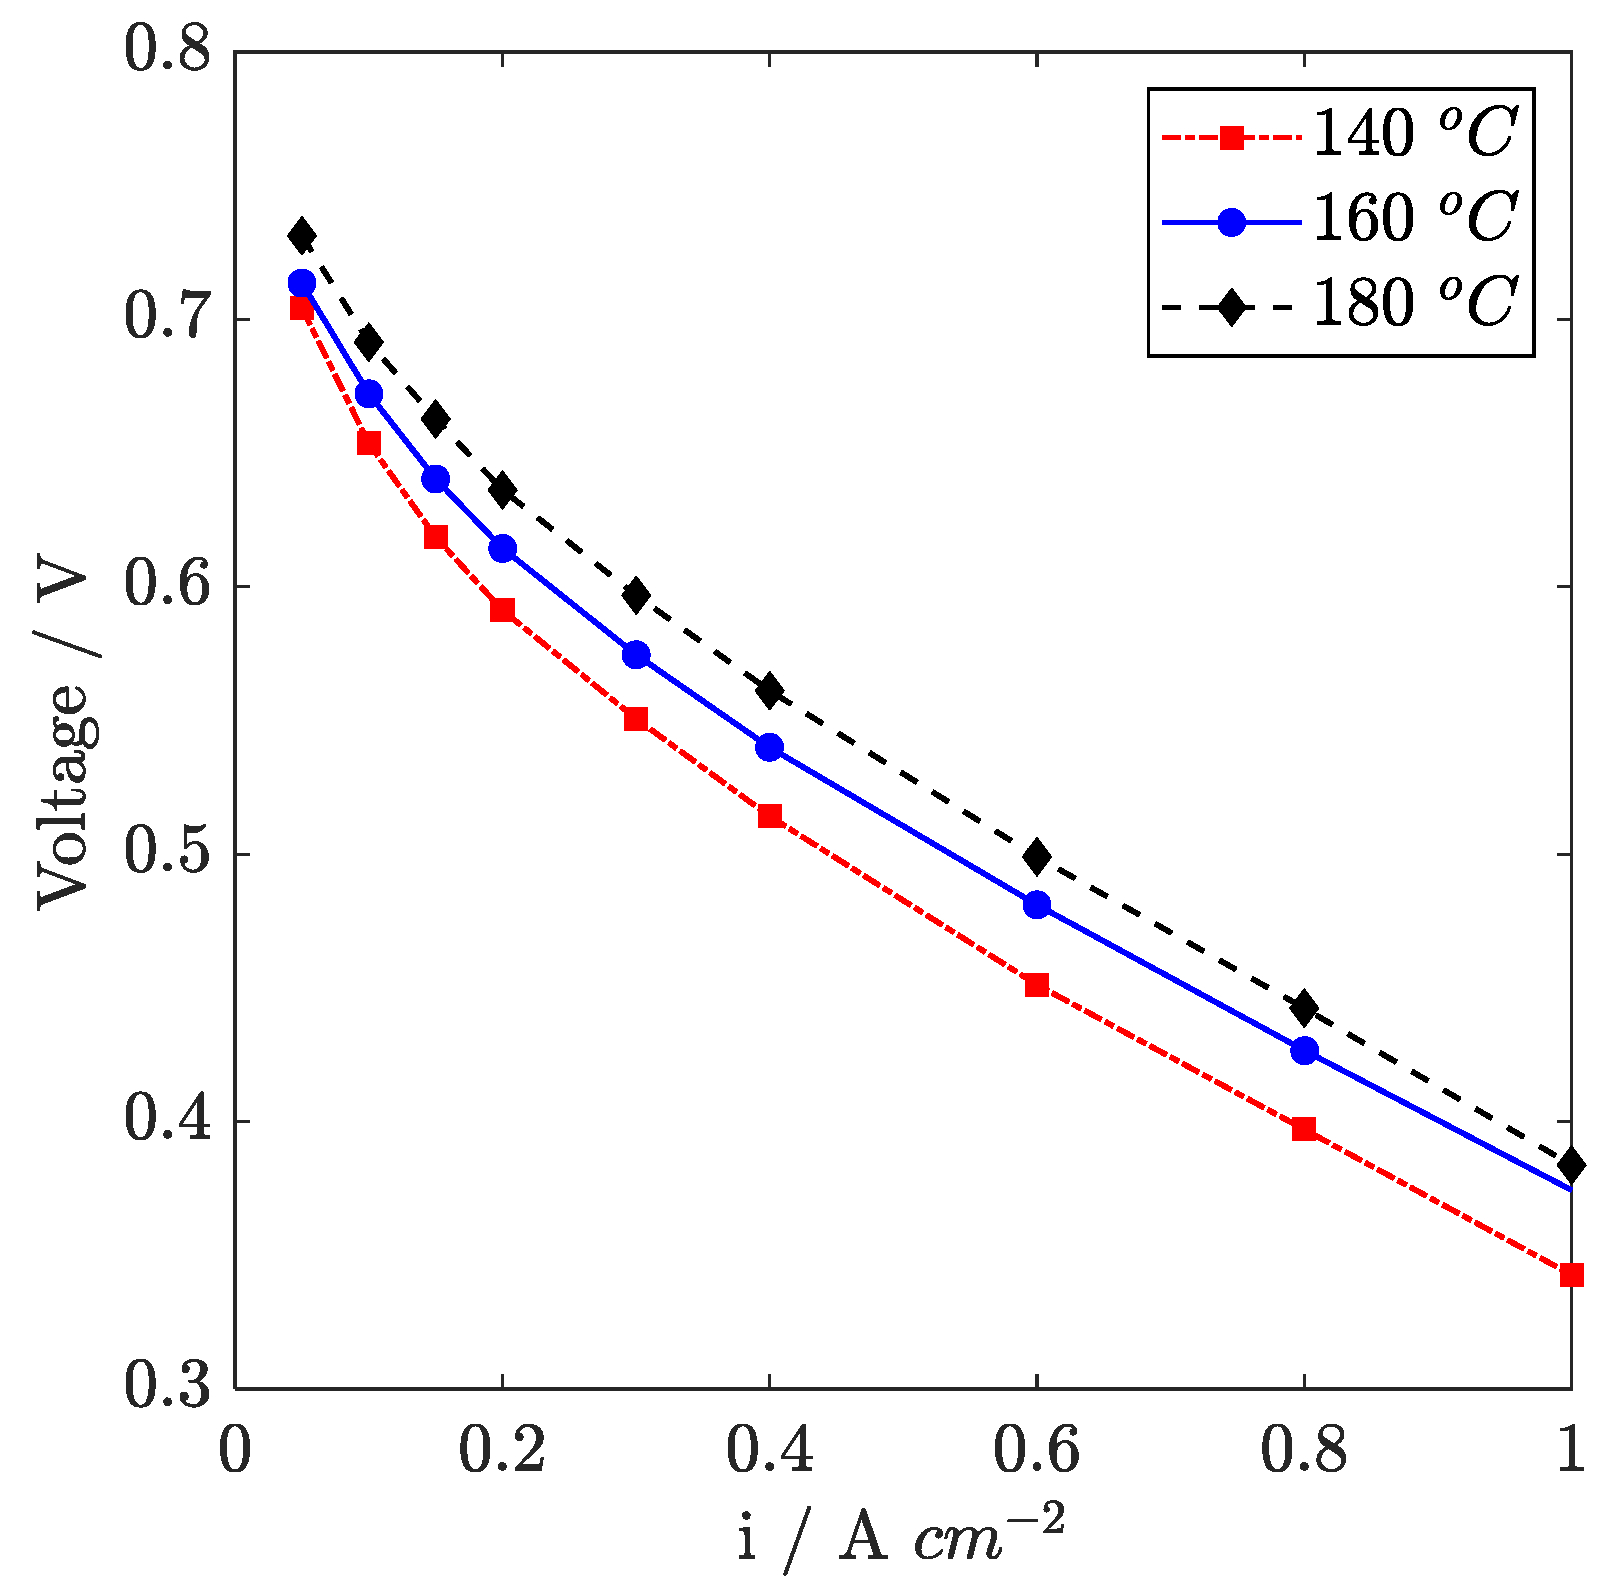
In
Figure 2, polarization curves recorded at 140 °C, 160 °C, and 180 °C are presented. The temperature values are chosen to be consistent with previous works [
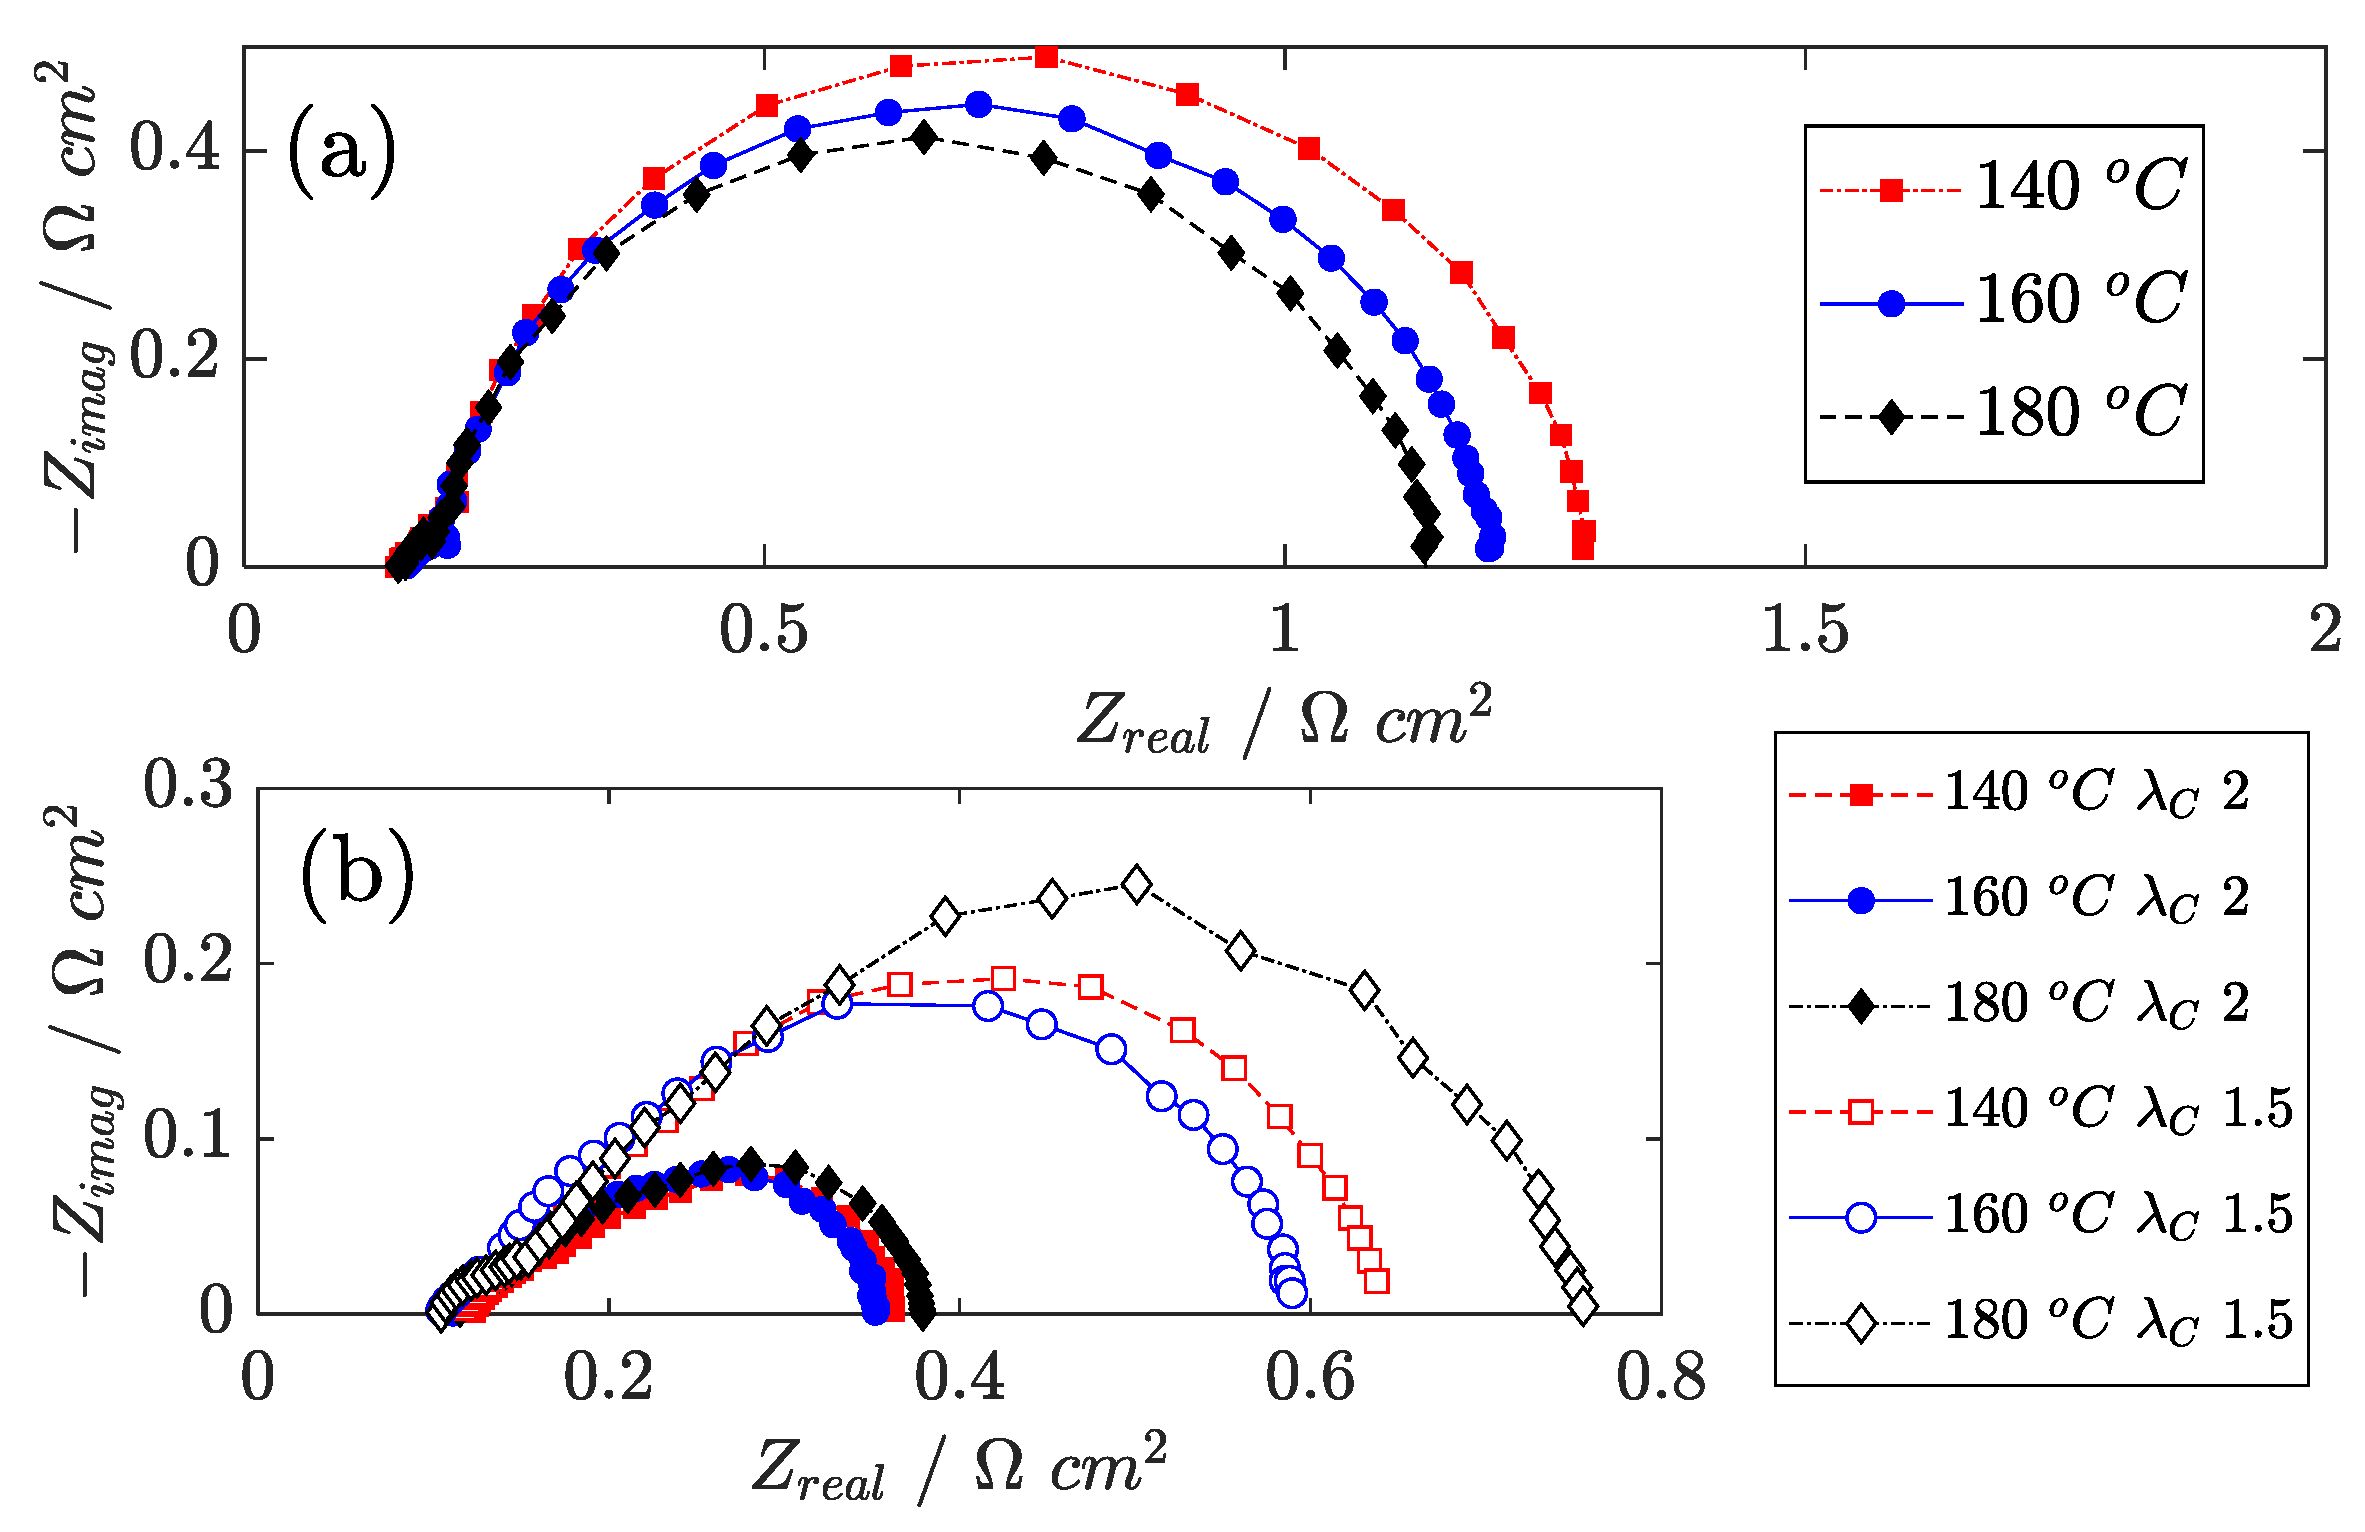
26]. The effect of cell temperature is always advantageous in the considered range, even though not uniformly at high and low current density. To have a detailed understanding of temperature’s effect on overpotential, in
Figure 3, impedance spectra recorded at 0.05 A cm
−2 and 1.0 A cm
−2 are reported. As a general comment on the EIS spectra reported, at low current density, a circular feature is observed that is associated with the charge transfer impedance at the cathode side and provides quantitative indication on the derivative of the ORR overpotential. In the high current density region, more features appear and partly overlap, but the most significant one is associated with channel impedance, as visible in
Figure 3b at 1.0 A cm
−2. Channel impedance is a result of the application of an AC current that induces dynamic oscillation of the oxygen mole fraction along the channel because of the oscillation in oxygen consumption. In both cases, a linear branch is observed in the high-frequency region that is associated with ion transfer. Further information on the interpretation of EIS for HT-PEMFC is available in the references [
23,
29,
30].
In the activation region, at 0.05 A cm
−2, the polarization curve is dominated by ORR overpotential and, accordingly, the measured charge transfer impedance from EIS constitutes about 80% of the low-frequency resistance. It is known in the literature [
14] that the main effect of the temperature at low current density is to reduce the activation overpotential, thanks to the higher activity of the electrocatalyst at higher temperature.
In the high current range, a positive effect of temperature on the high-frequency-resistance (HFR) is observed between 140 °C and 160 °C; conversely, between 160 °C and 180 °C, the high-frequency resistance increases. The variations observed in HFR are attributed to a change in the ionic resistance of the membrane and are due to a complex balance between the improvement associated to temperature increase, counterbalanced by a detrimental effect of humidification occurring because the vapor pressure of water exponentially increases with temperature. Additionally, under very low relative humidity conditions, phosphoric acid self-dissociation occurs, which leads to the formation of pyrophosphoric acid that has a poor ionic conductivity [
31].
A detailed analysis of the polarization curve in the high current region evidences a voltage drop at 180 °C that suggests the onset of performance limitations. Consistently, the zero-frequency resistance measured at 1.0 A cm
−2 on EIS is higher at 180 °C than 160 °C. In
Figure 3b, it is observed that the 45° linear branch at high frequency is longer at a cell temperature of 180 °C than of 160 °C, and this is even more evident if comparison is made between spectra at low cathode stoichiometry (
1.5). Since relative humidity drops at 180 °C, electrolyte conductivity is supposed to become critical not only in the membrane but also in the catalyst layers. Limitations in proton transport across the cathode catalyst layer thus forces the reaction to occur in a thin layer in the proximity of the membrane, thus emphasizing the oxygen mass transport issue and reducing catalyst utilization.
3.2. Effect of Stoichiometry and Oxygen Inlet Concentration
The effect of air stoichiometry on the polarization curve is reported in
Figure 4, and the related impedance spectra at 0.2 A cm
−2 and 1.0 A cm
−2 are reported in
Figure 5a,b. The increase in air stoichiometry generates a positive effect on the polarization curve in the medium-high current density range, while roughly no effect is observed at the low current density, probably because of the constant flow operation in this region (below 0.2 A cm
−2, see the
Section 2.3). By reducing the air stoichiometry, the reaction is forced to occur at the channel inlet region where oxygen partial pressure is higher. Thus, the distribution of the current density is expected to be highly nonuniform on the MEA surface. Conversely, the relative humidity of the gas increases along the channel direction because of the water vapor produced by ORR. EIS is thus necessary to distinguish between the contributions of oxygen transport and ohmic phenomena.
The analysis of the EIS highlights that the air stoichiometry has an important effect on the mass transport impedance, as widely reported in the literature [
14,
15], and affects the high-frequency resistance because of relative humidity changes along the channel. Similarly, at high cathode stoichiometry (
), electrolyte dehydration occurs, and this is confirmed to increase both the high-frequency resistance and 45° linear branch in comparison with the reference condition, as observed in
Figure 5a,b. It is observed from Bode plots (not shown) that the characteristic frequency of the mass transport impedance is proportional to the flow rate and attributed to the oscillation of oxygen partial pressure along the channel, consistent with what is discussed in [
29]. The performance loss observed in the high current density region can thus be attributed to oxygen transfer limitations on the cathode catalyst layer, while improvement in the ohmic loss shows only a minor impact.
The effect of a low oxygen partial pressure is further tested by diluting air with nitrogen until a 10.5% oxygen mole fraction is reached. The polarization curve (
Figure 4) shows a voltage offset at low current density, due to decreased exchange current density, consistent with the fact that the ORR reaction order is unitary on oxygen concentration [
7]. At an intermediate current density, voltage loss is much higher, and the operation is interrupted at 0.6 A cm
−2. EIS at 0.05 A cm
−2 and 0.4 A cm
−2 are reported in
Figure 6a,b, respectively. It is observed that the high-frequency resistance increases at any current density, which is reasonably due to the higher flow rate consequent to oxygen dilution, which dehydrates the membrane. For the same reason, the 45° high-frequency linear branch increases, but this could also be an indication that the reaction rate in the catalyst layer is shifted to the GDL side as a result of oxygen transport limitations arising under a low oxygen mole fraction.
Oxygen concentration mainly affects the ORR kinetics, which is clearly the most relevant loss in HT-PEMFCs at low current, as well as the gas phase transport resistance in the catalyst layer. Since no limiting current is observed up to 0.6 A cm−2, high GDL and MPL diffusion coefficients are expected. From the analysis of EIS, an increase in mass transport impedance is reported, as expected at a low oxygen concentration at a current near the limiting current.
The effect of the anode stoichiometry is very limited, and the results are not reported for conciseness. Since pure hydrogen is employed, the anode kinetics is extremely fast and has negligible effects both on the polarization curve and EIS, consistently with what found in the literature [
3].
3.3. Oxygen Operation
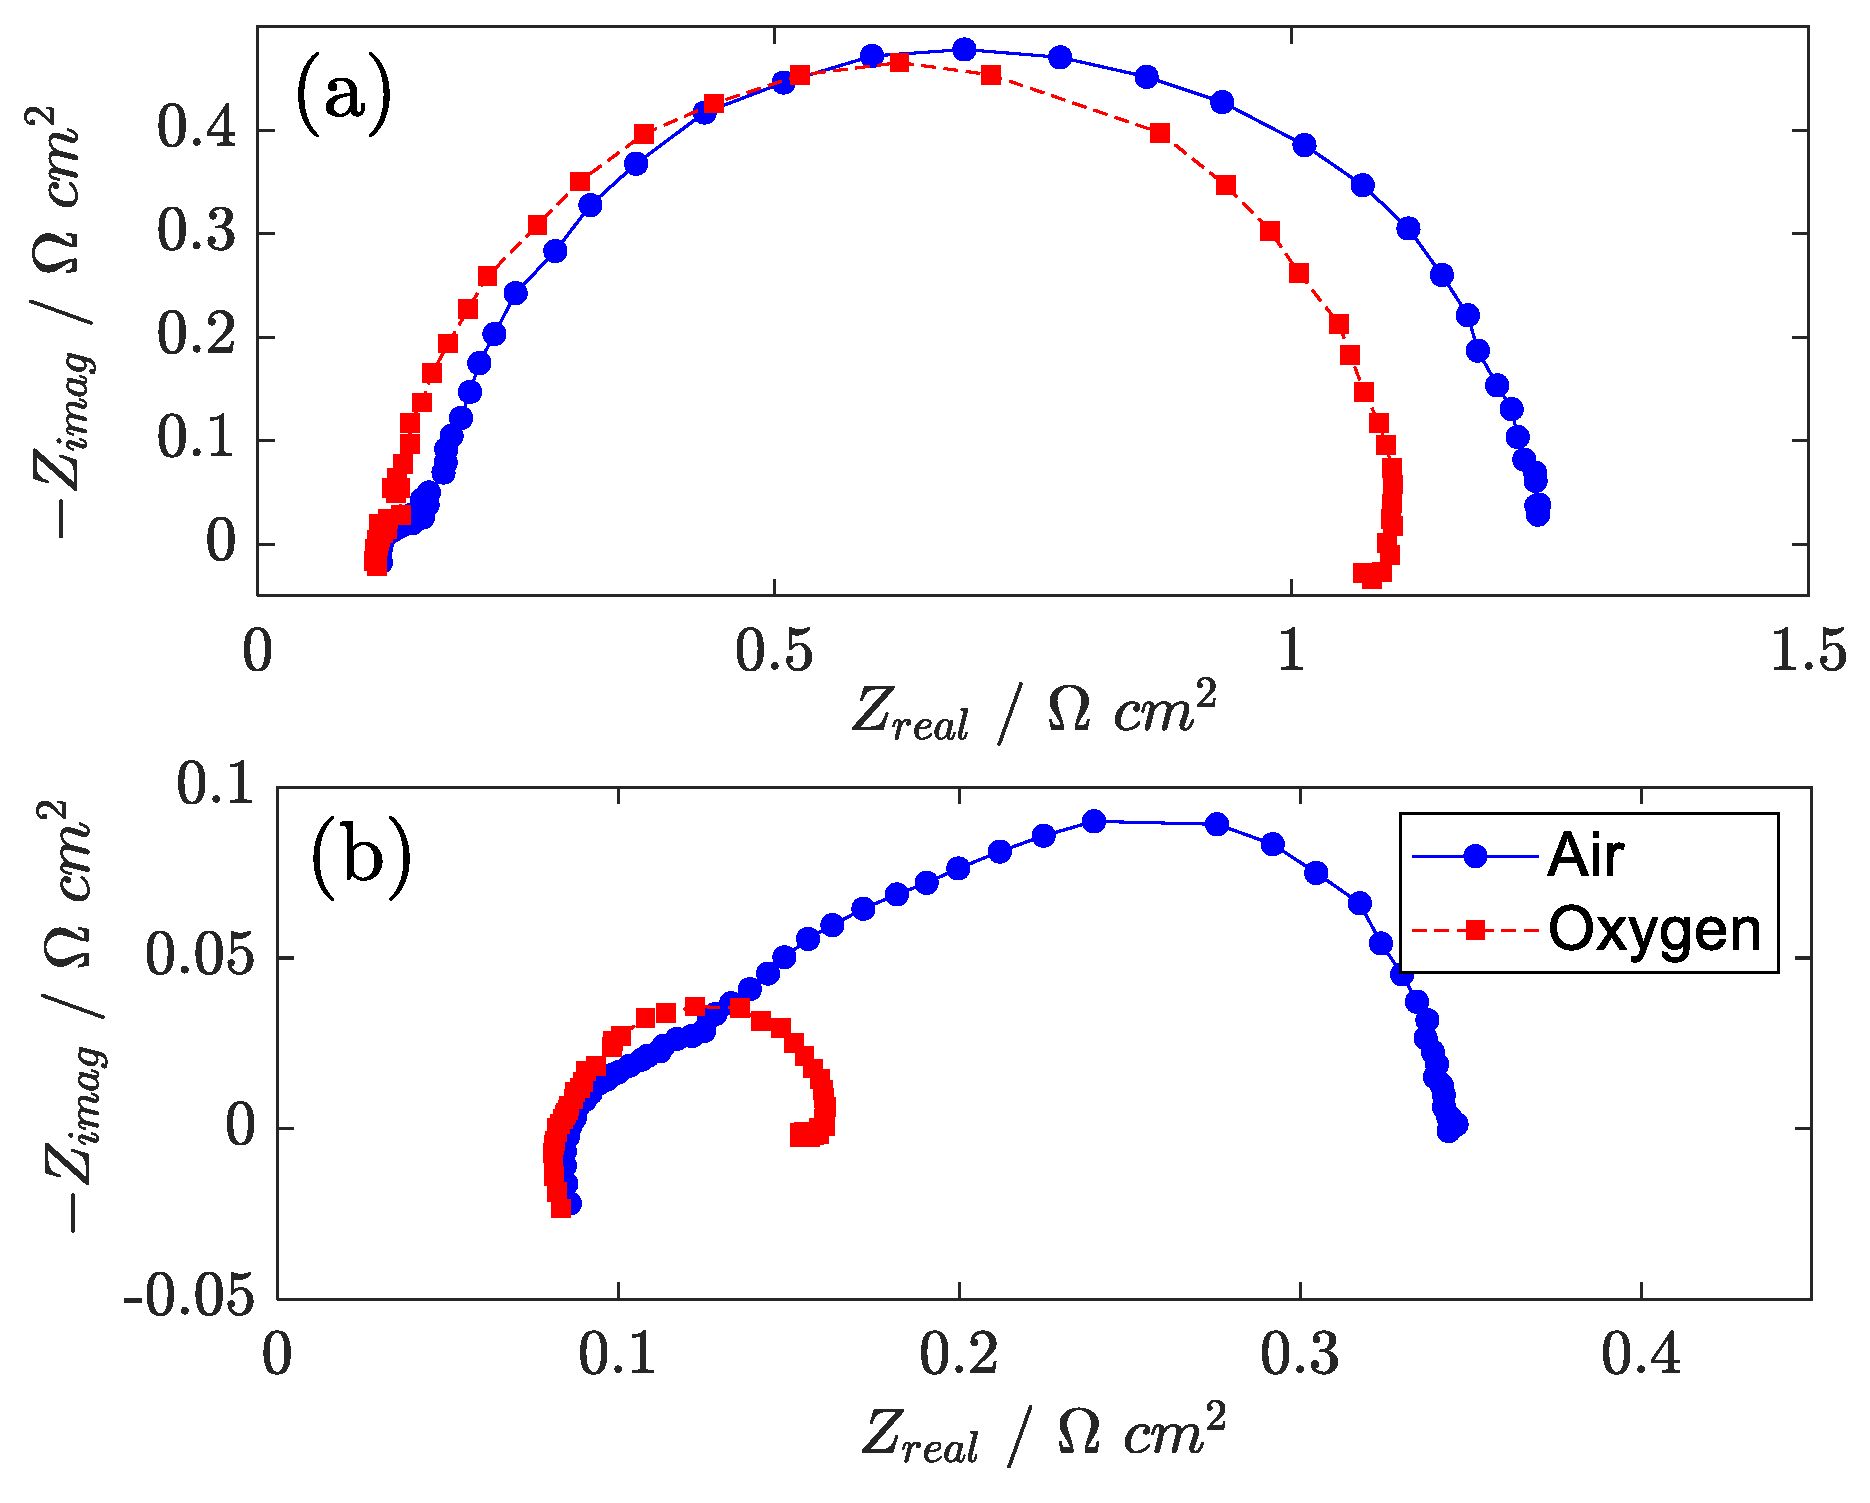
Oxygen operation under high oxygen concentration was also investigated. In pure oxygen, several positive effects arise: the exchange current density increases, and the oxygen concentration is virtually uniform in the catalyst layer, GDL, and channel. On EIS, it is clearly seen from
Figure 7 that mass transport impedance disappears (consistent with the fact that oxygen oscillation becomes minor with no diluting gas and high stoichiometry). At a low current density, no significant effect is observed on EIS, indicating that in this condition, mass transfer effects are negligible. At a high current density, instead, oxygen operation shows very small charge transfer impedance, confirming that transport phenomena across the catalyst layer and GDL dominate the EIS spectrum under air operation.
3.4. Effect of Air Humidification
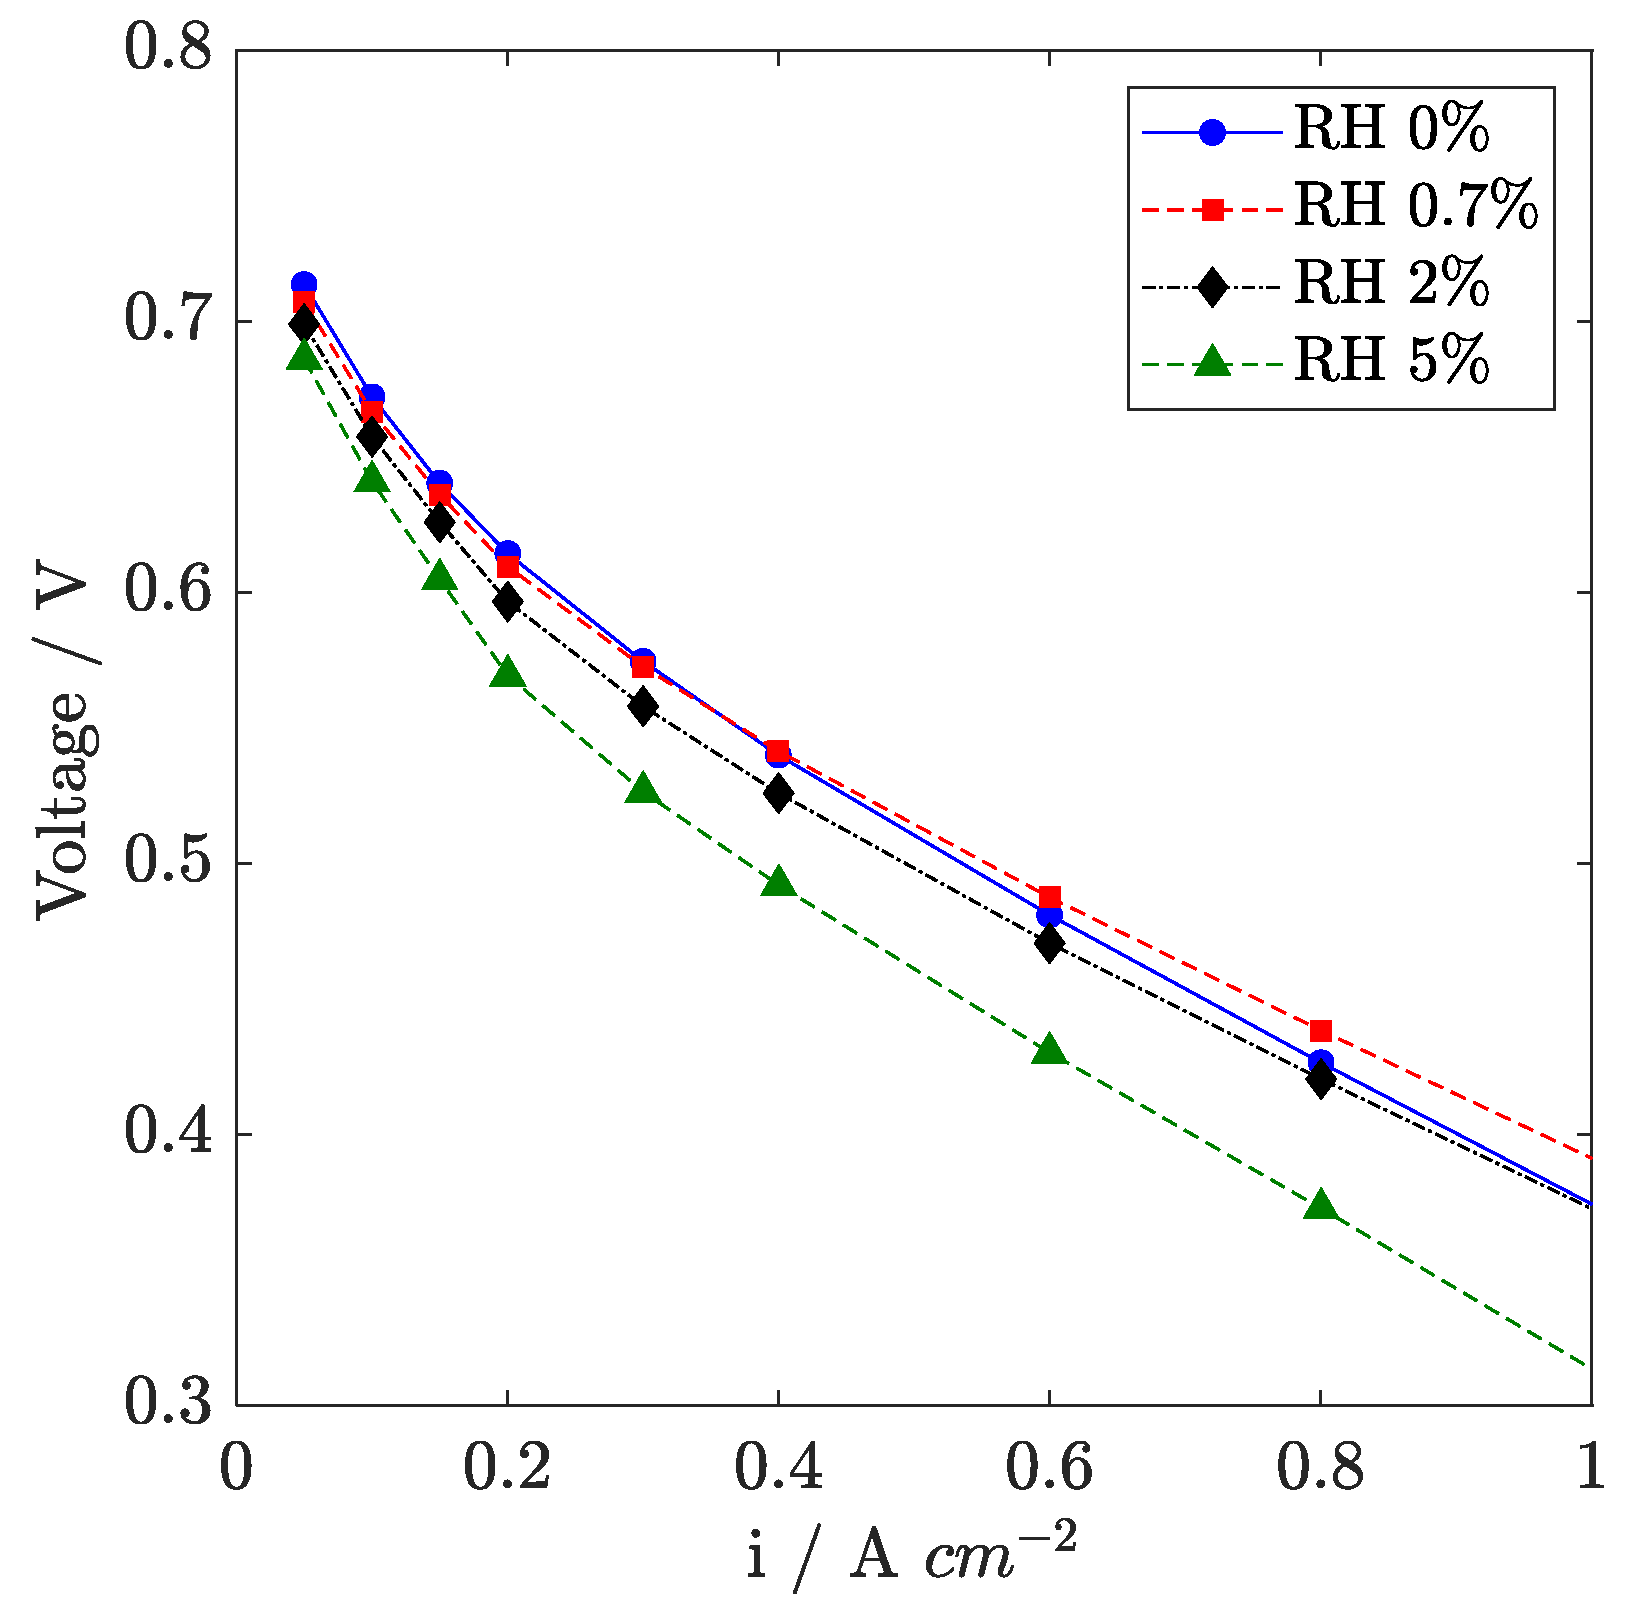
In
Figure 8, the effect of air humidification on the polarization curve in reference condition is reported for RH ranging from 0 to 5% (160 °C). At low current density, a voltage loss is observed when humidification is introduced, consistent with oxygen dilution, as found in
Section 3.2. Conversely, at high current density, an optimum in inlet air humidification is detected between 0% and 0.7% RH, where a beneficial effect is reported at a high current density, while from 2 to 5% RH, a significant loss appears.
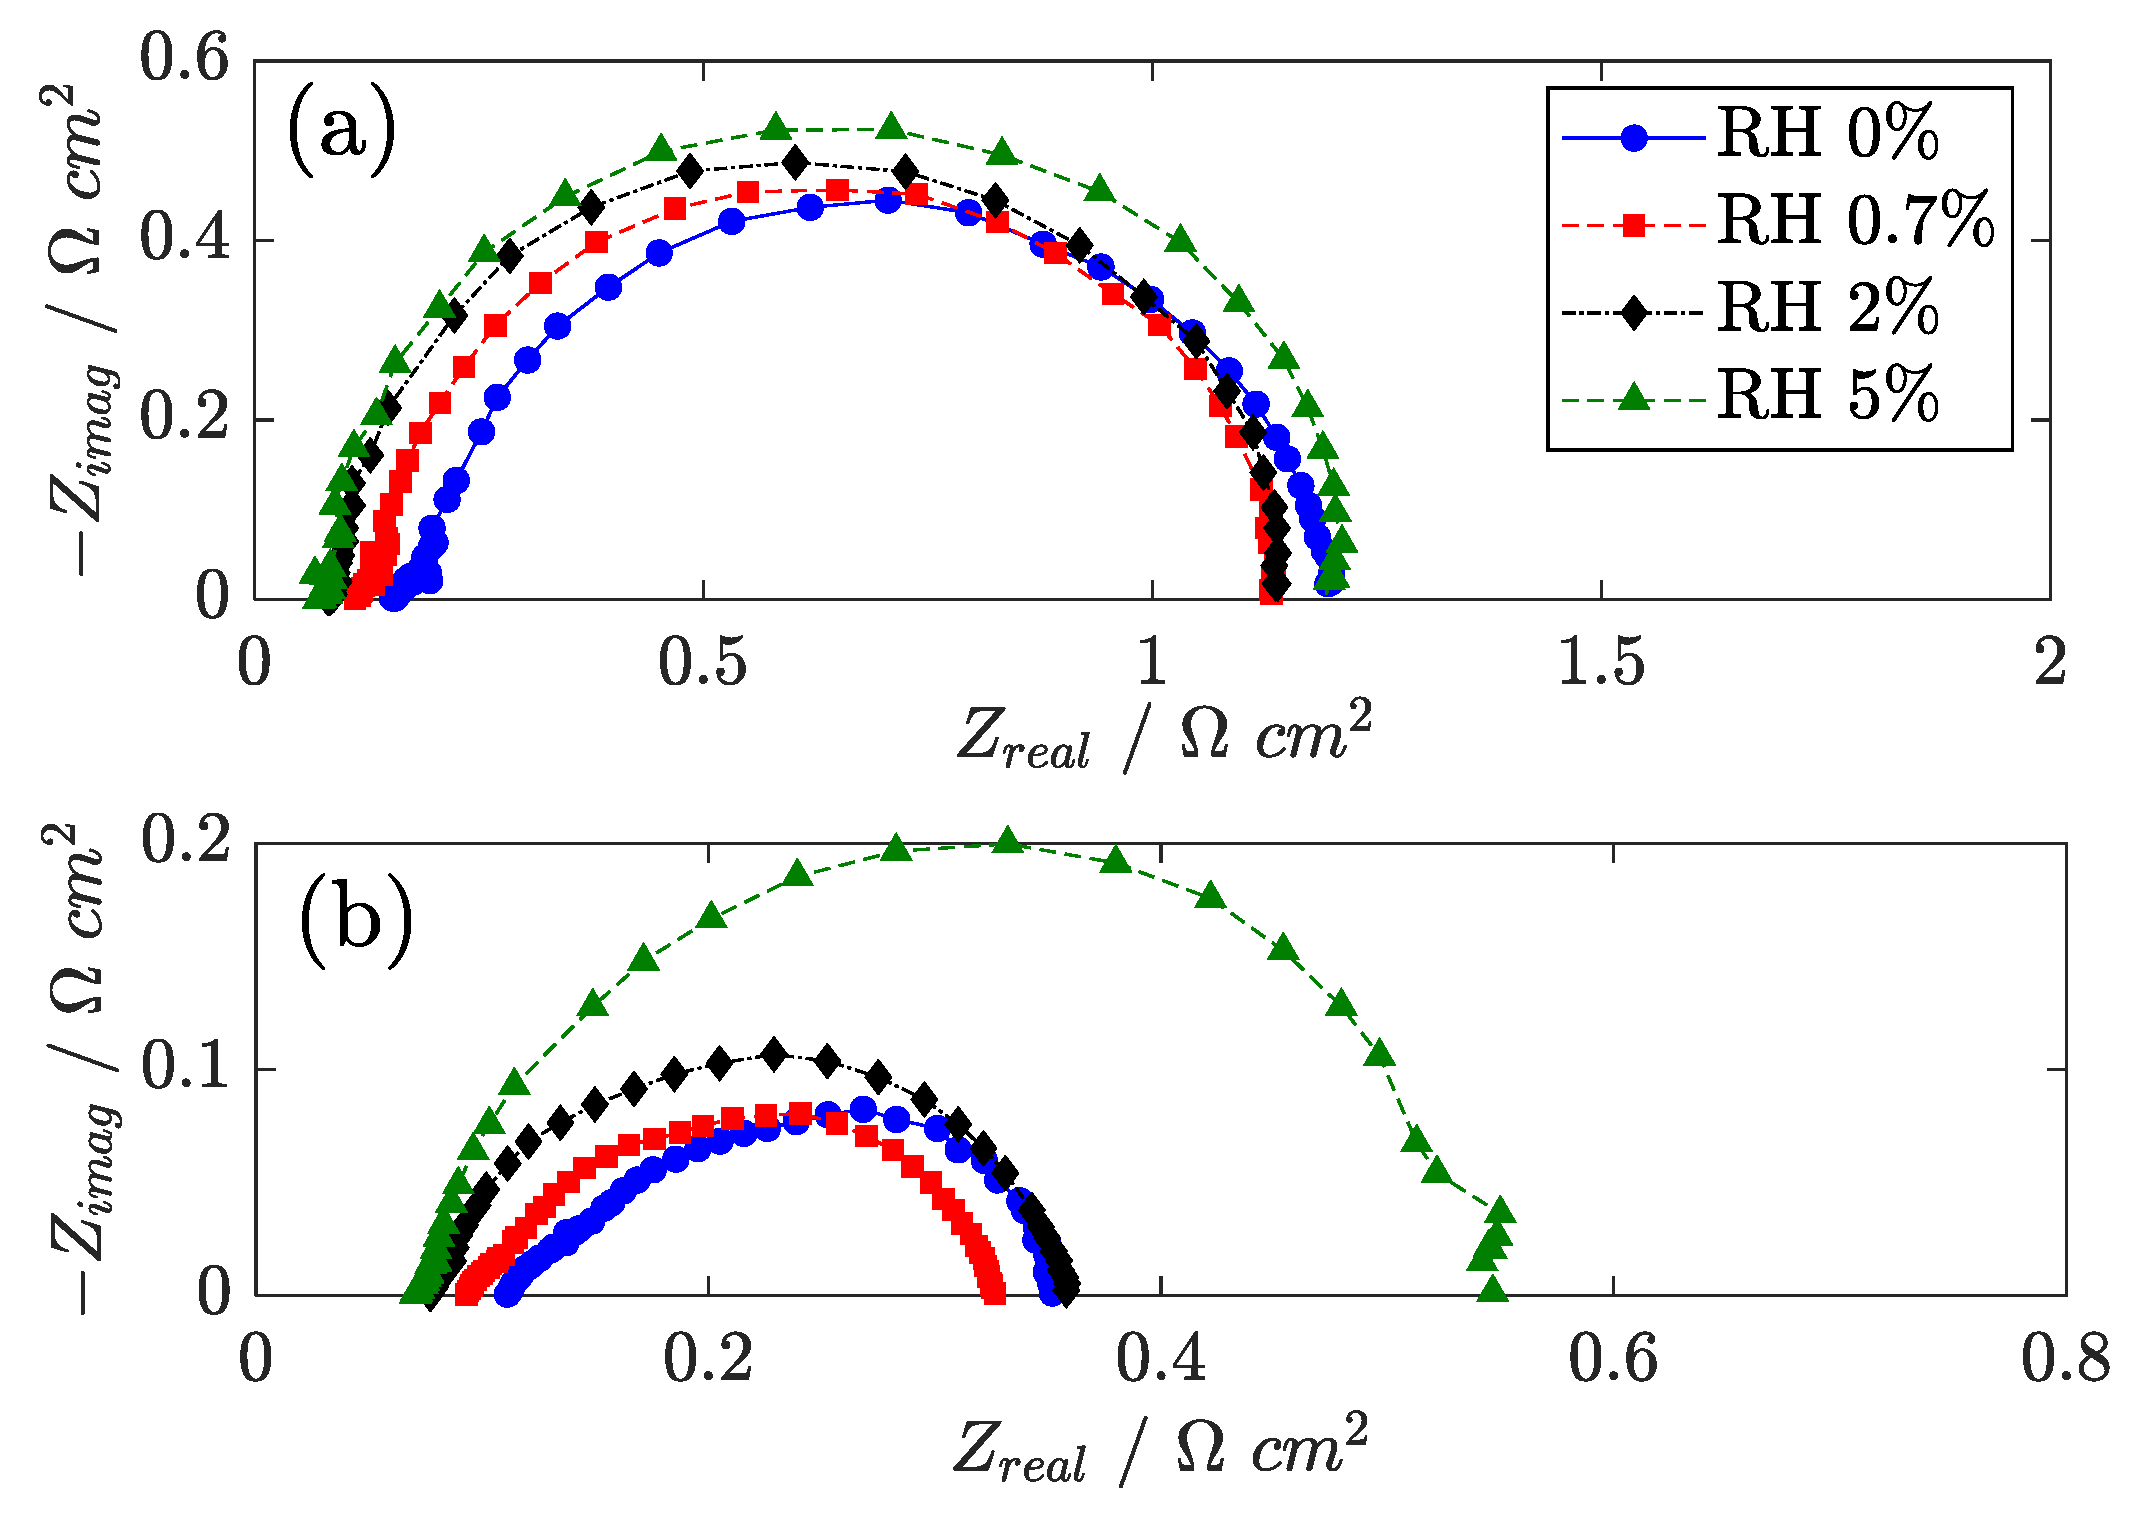
Further understanding of this optimum is achieved by analyzing the EIS results. In
Figure 9, the impedance spectra recorded at 0.05 A cm
−2 and 1.0 A cm
−2 are presented. The water vapor in the air feed has a positive effect on Ohm loss, both in the membrane and in the catalyst layer: the high-frequency resistance and the 45° linear branch are reported to decrease at high RH. Further confirmation is obtained by H
2/N
2 EIS, reported in
Figure 10. If ORR is eliminated, the Ohm contribution in EIS is easy to distinguish, and the positive effect of humidification in the high-frequency region of the spectrum becomes more evident.
To counterbalance the improvement in the Ohm loss, the charge transfer impedance from EIS is observed to increase, a trend that is also consistent with the measurements of the electrocatalyst active surface (ECSA) that is obtained from cyclic voltammetry (see
Section 3.5). The ORR kinetics on platinum is known to be affected by phosphoric acid anion adsorption, and this result suggests that the anion concentration on the Pt surface may increase with RH. The mass transport impedance is also reported to increase with humidification, which might be attributed to both oxygen dilution and increased mass transport resistance in the catalyst layer. The optimum RH is thus justified by a trade-off between a beneficial improvement in electrolyte conductivity and a detrimental effect on mass transport and electrode kinetics.
The same trend is observed if air humidification is performed at high cathode stoichiometry ( 3 not shown), with secondary differences. At high stoichiometry, mass transport effects become less important, while performance is affected by electrolyte dehydration. As a consequence, at 3, air humidification leads to higher performance improvements up to 2% RH in the high current density range. Consistently, at low cathode stoichiometry ( 1.5 not shown), the opposite effect is observed.
A further step is performed to gain insight into the effects of humidification on EIS on a new MEA sample. Oxygen dilution with nitrogen, or alternatively with water, is performed at high cathode stoichiometry (9.52) and a constant inlet oxygen mole fraction (80%). EIS recorded at 1.0 A cm
−2 is reported in
Figure 11. Interestingly, water and nitrogen show different behaviors as dilutants on the cathode charge transfer impedance at high current density: 20% water dilution shows a similar effect as 50% nitrogen dilution.
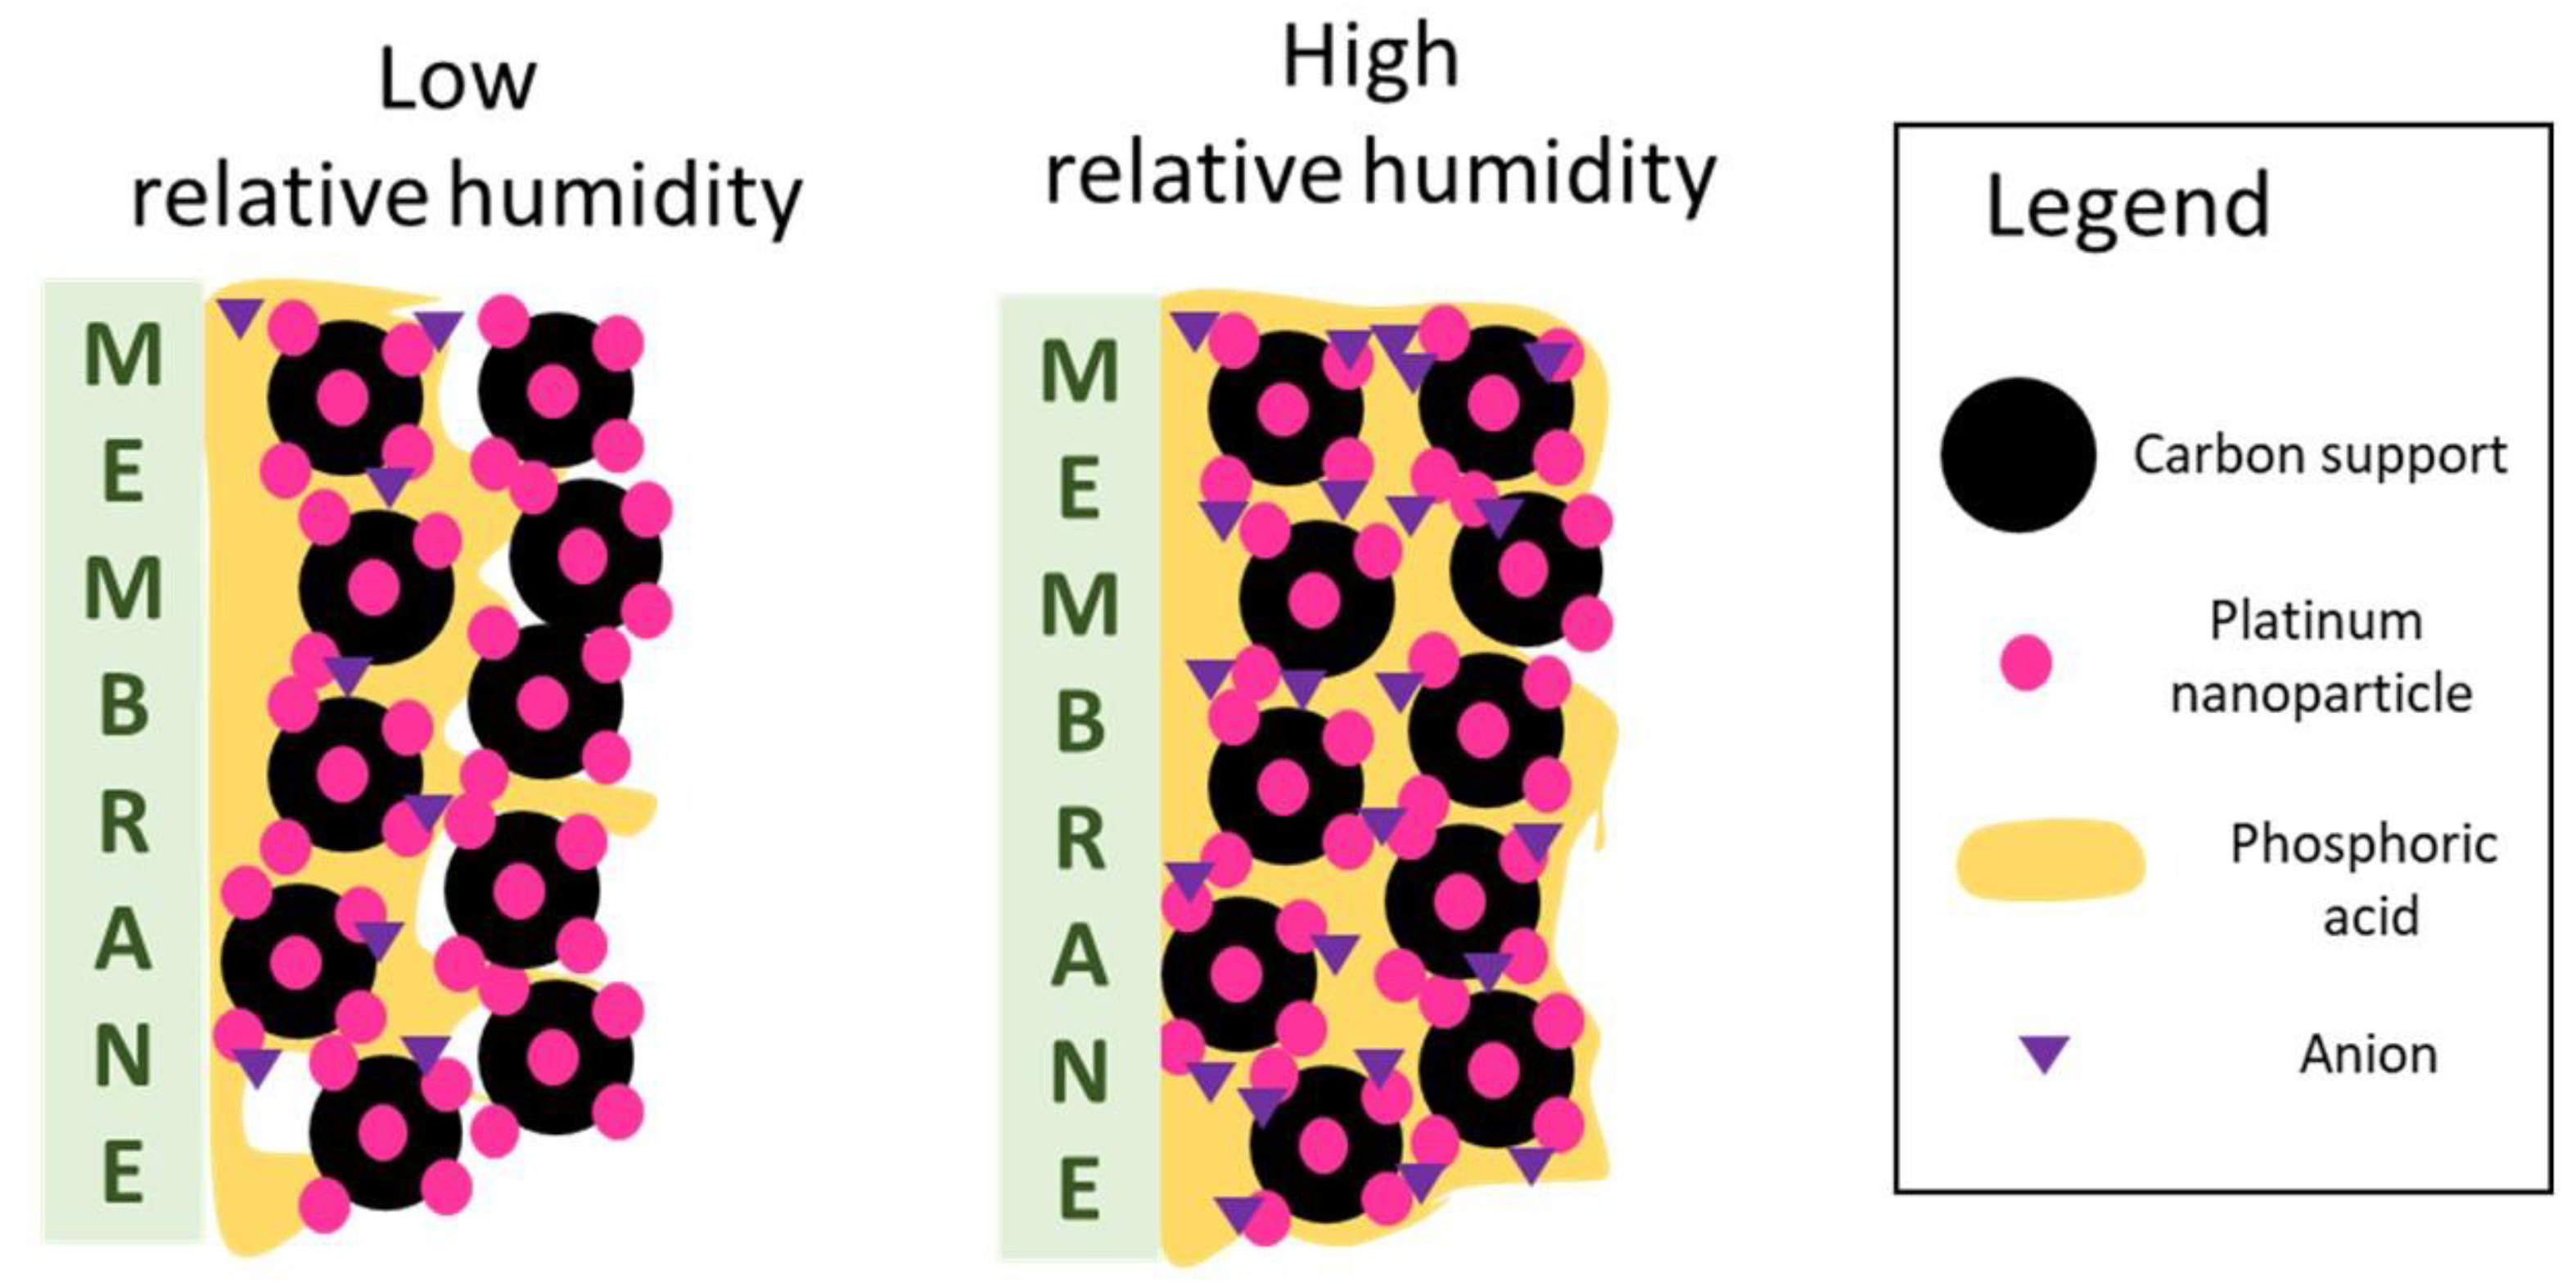
A possible explanation, consistent with the literature [
14], could be the onset of phosphoric acid flooding in the CL with increasing RH: humidification reduces phosphoric acid density, and phosphoric acid from the membrane could theoretically flood the anode and cathode CLs, impeding the access of oxygen or hydrogen to the catalyst active sites and thus increasing the charge transfer impedance. This mechanism is simplified in
Figure 12, which describes the interpretation provided of the observations of this paper.
3.5. In Situ Measurement of Water Concentration in Effluents
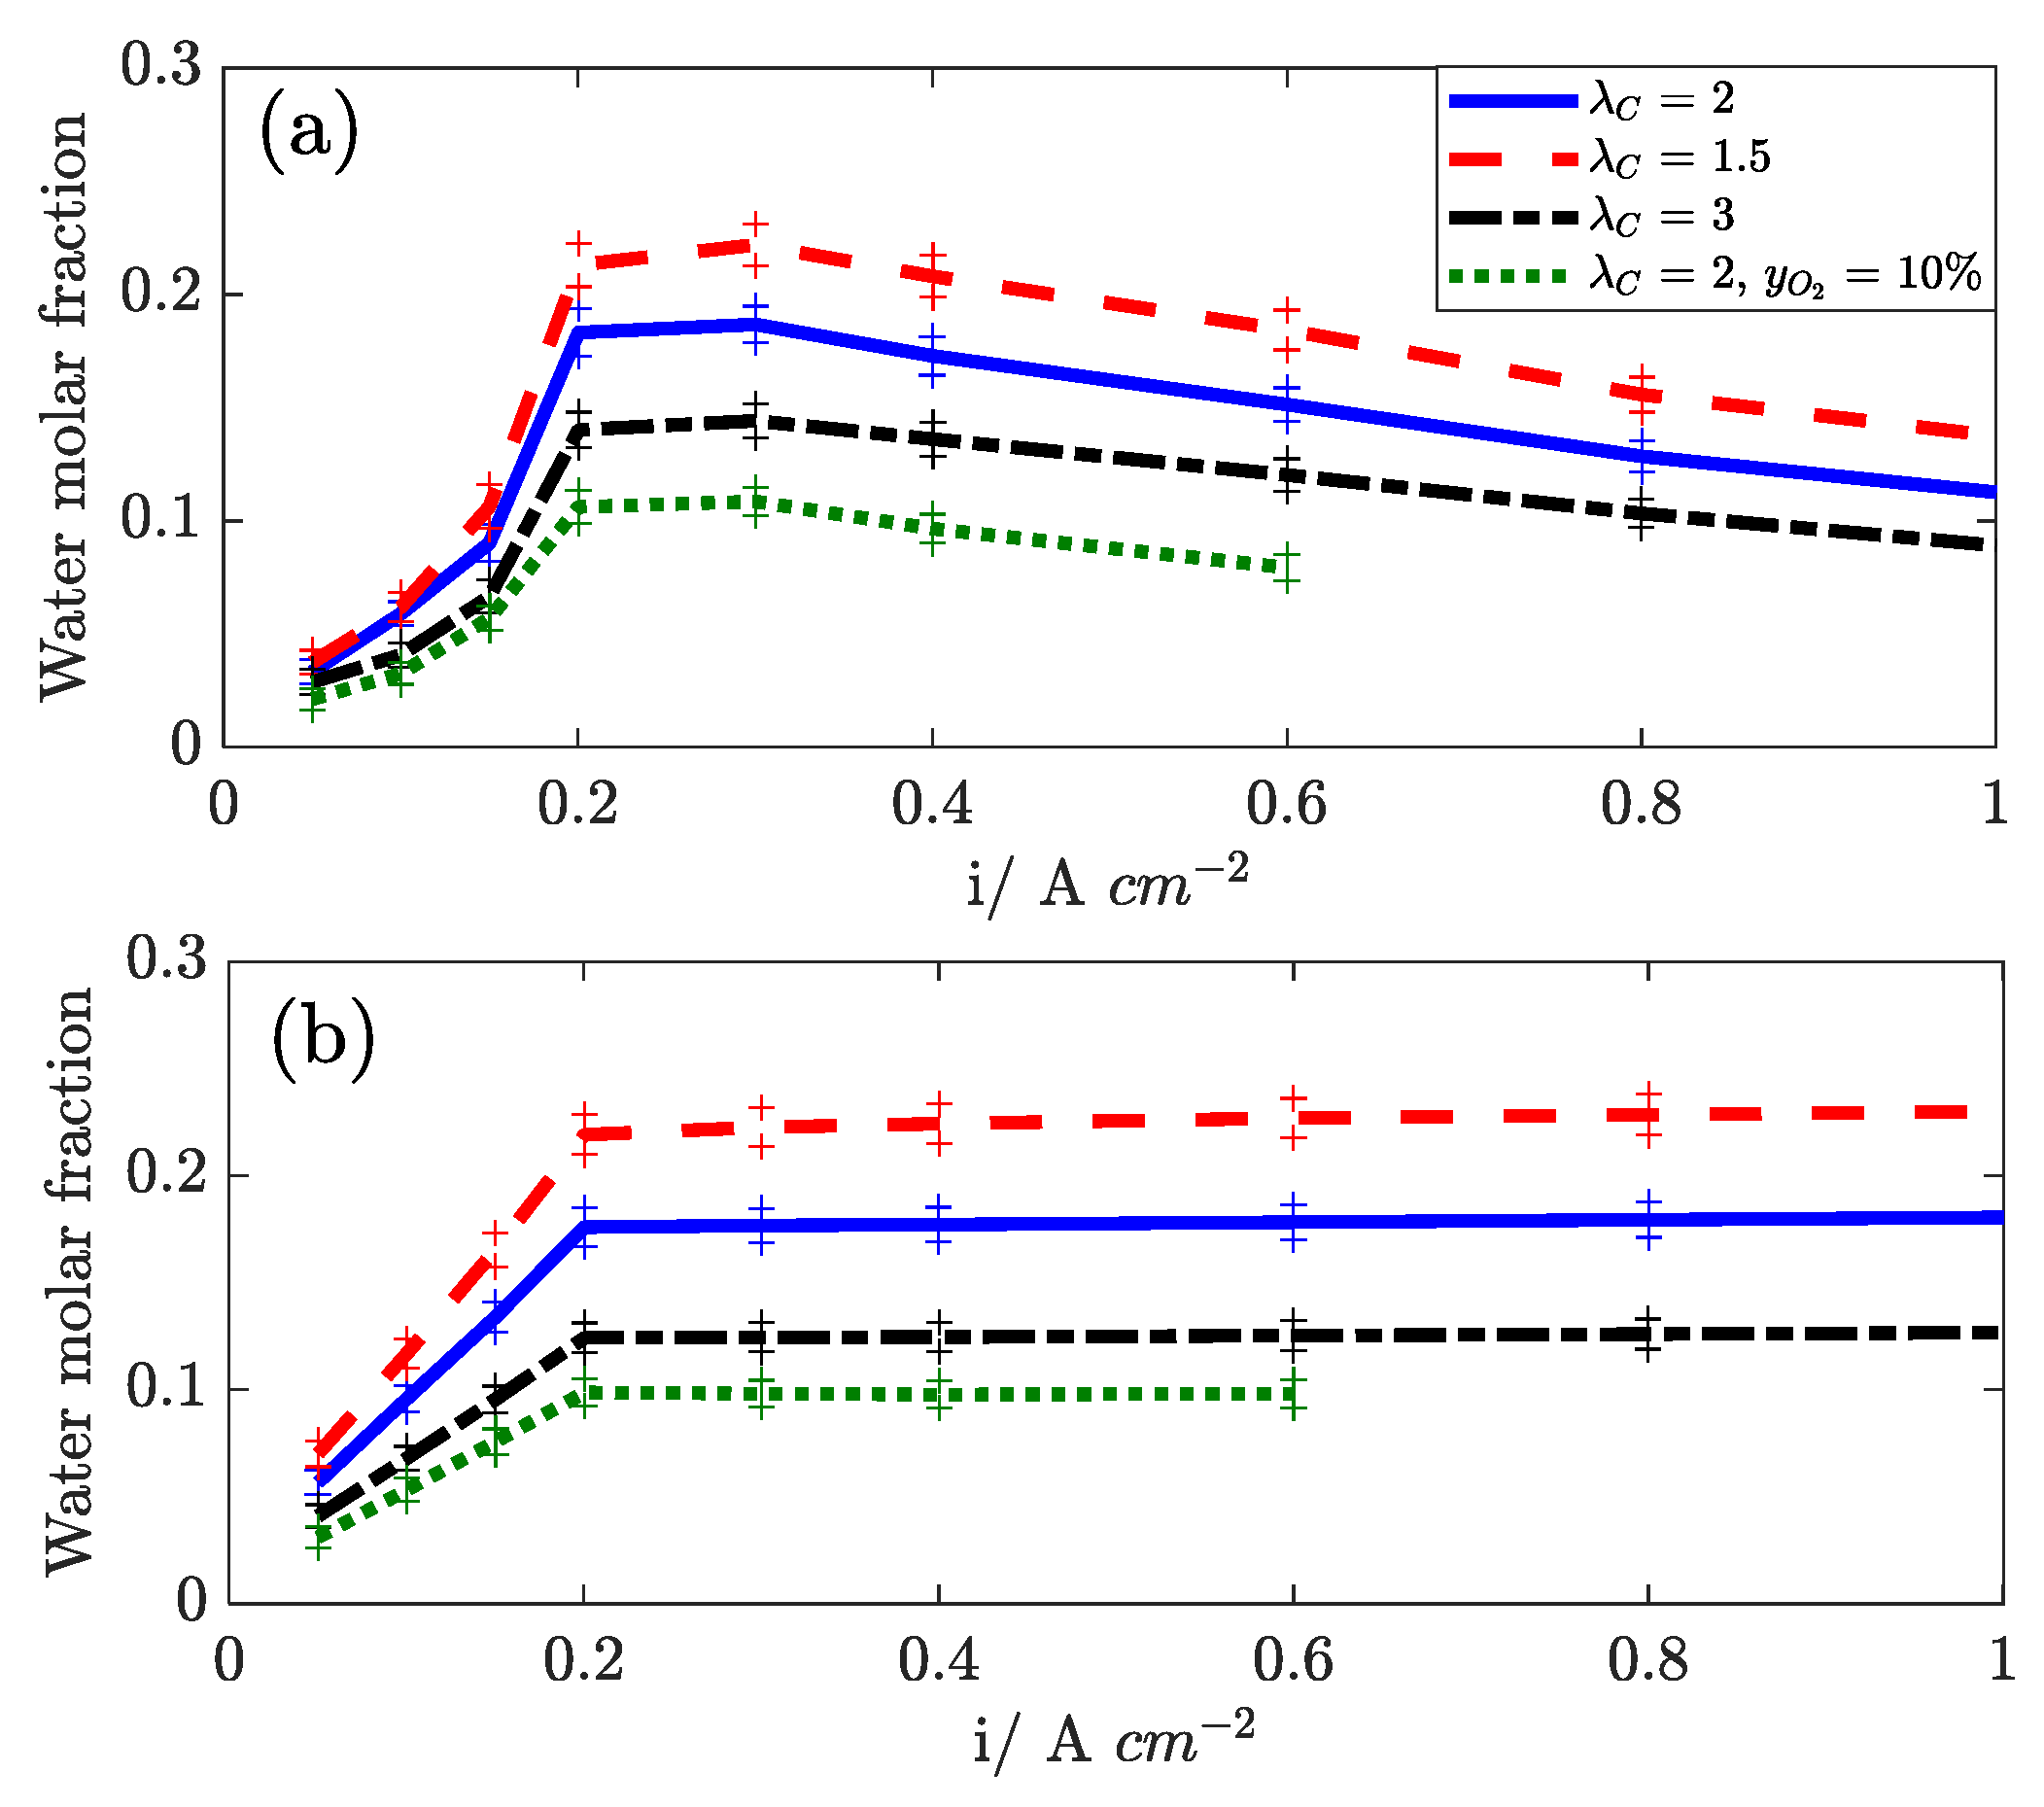
In
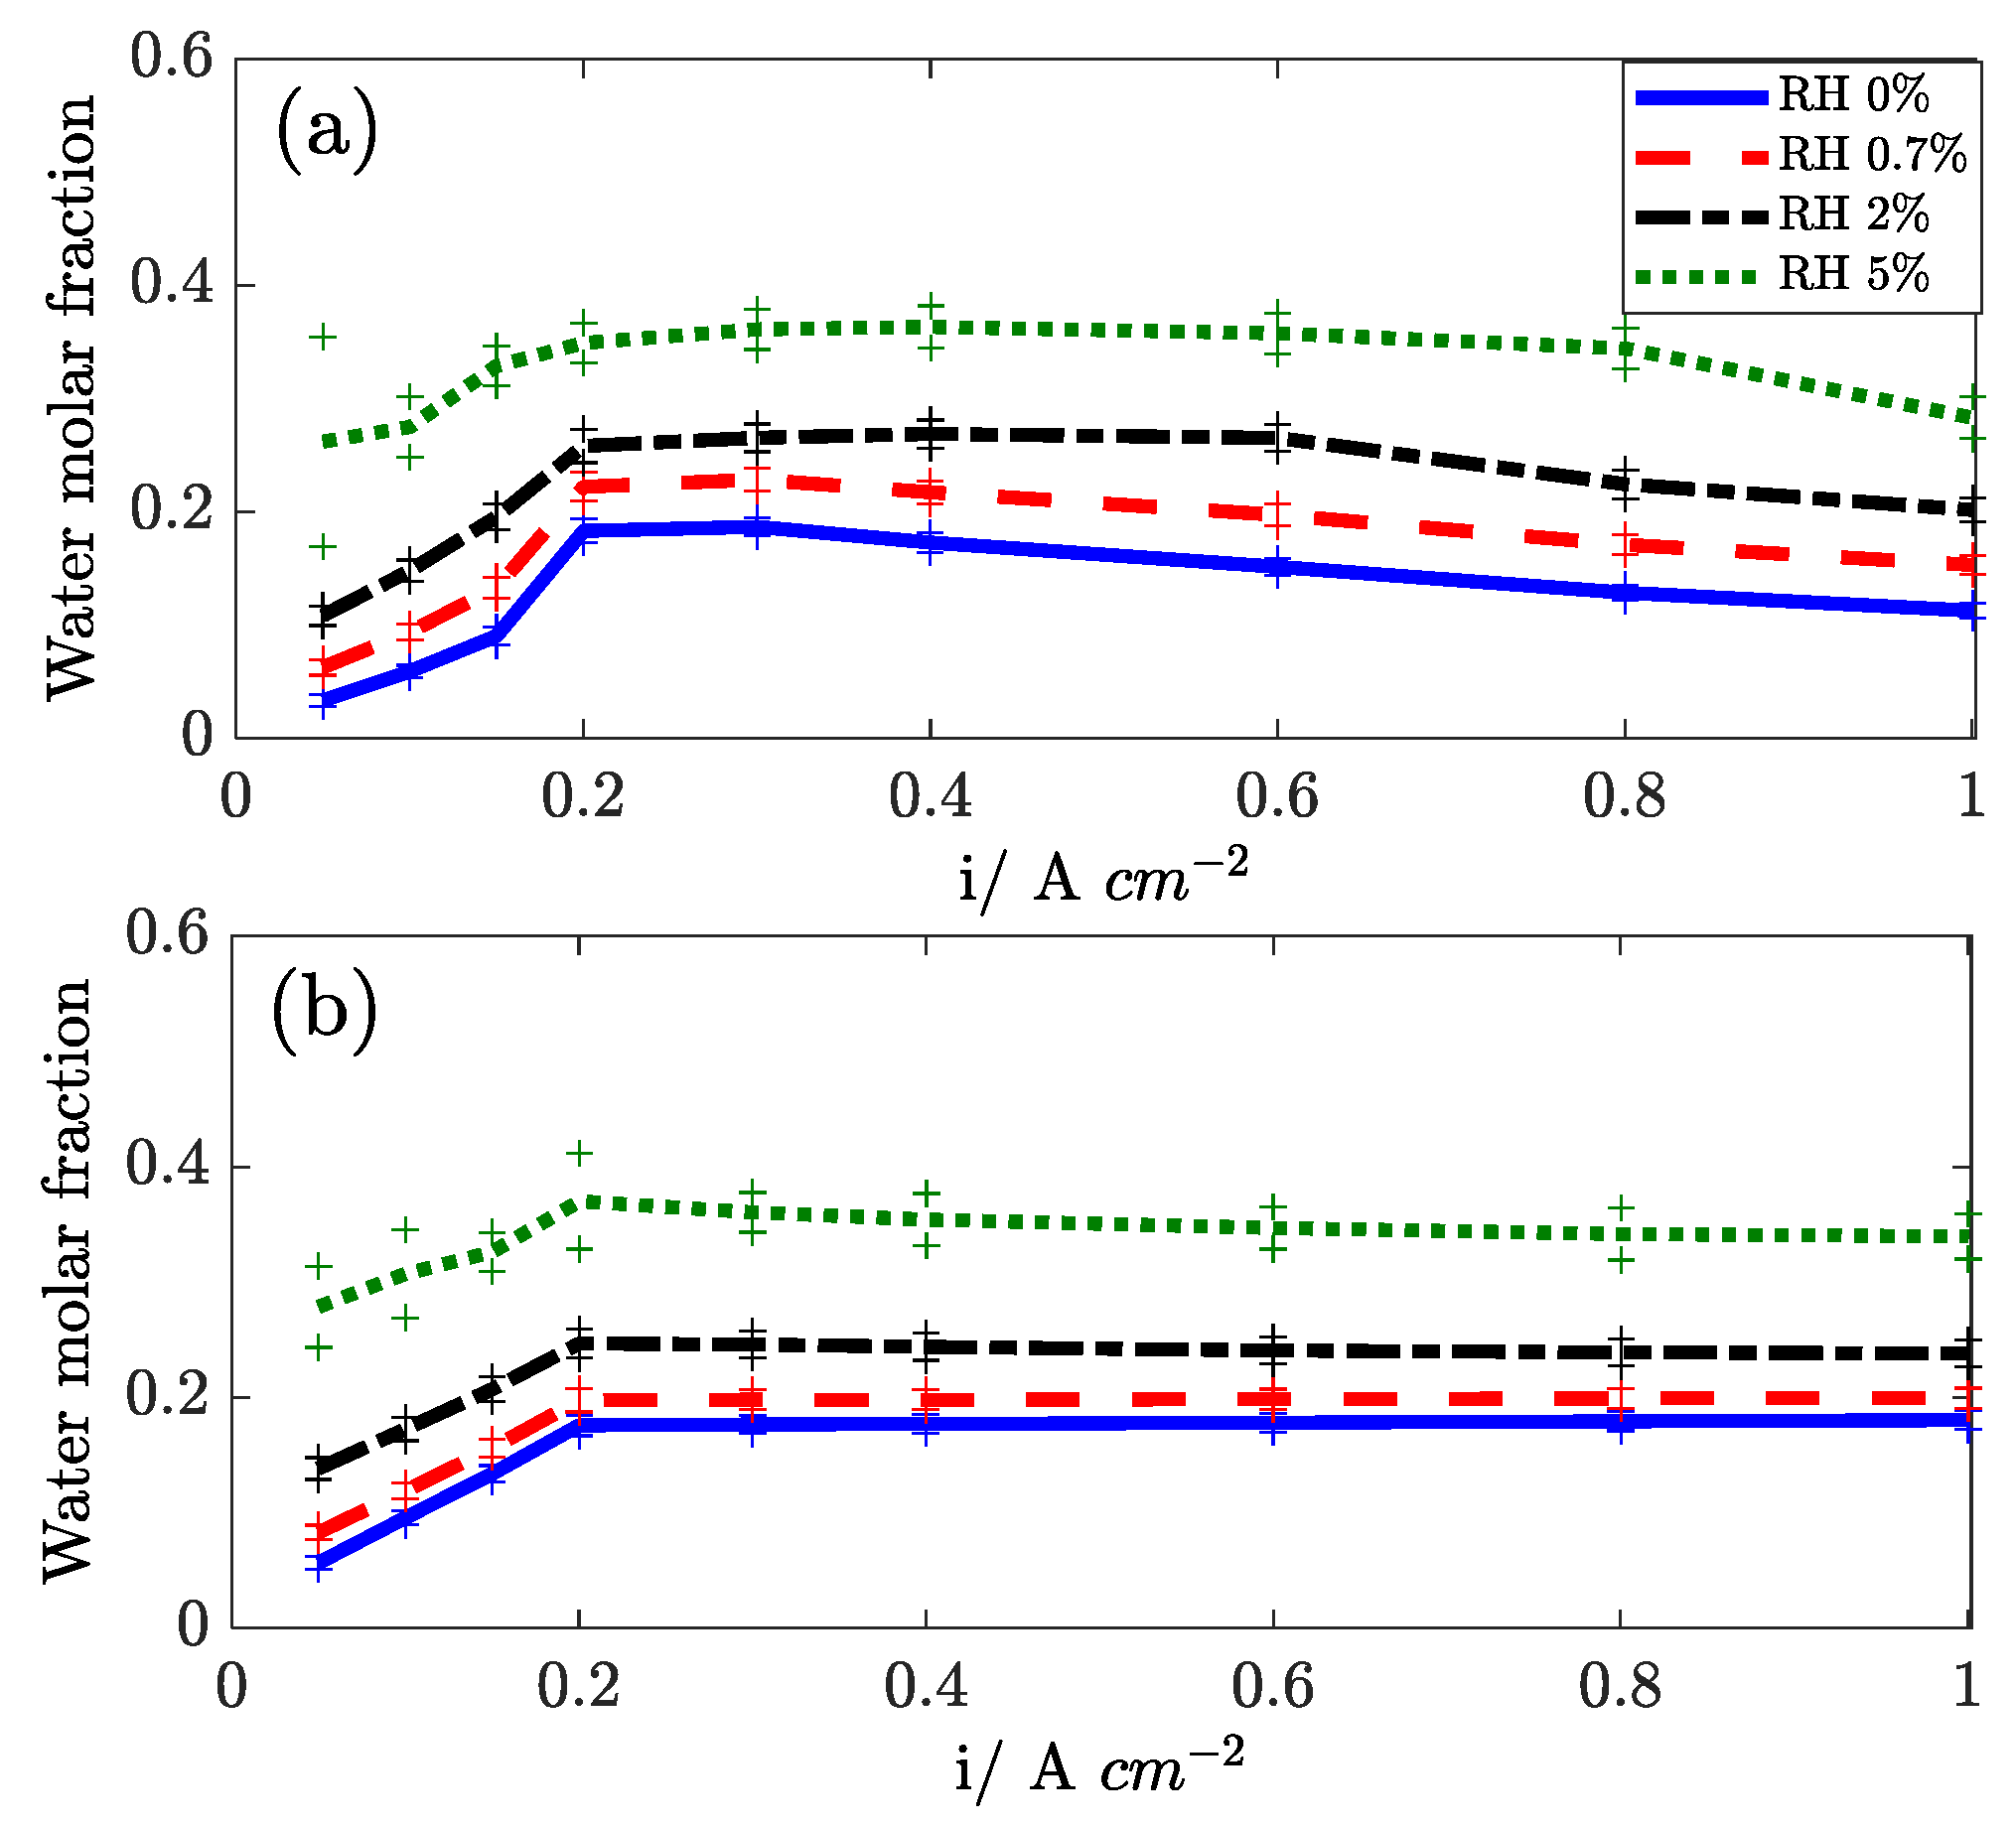
Figure 13, the water mole fraction, as measured at the anode and cathode outlets, are reported versus the current density. The effect of cathode stoichiometry is presented. At low current density, the water outlet mole fraction increases with current density at both sides because of the constant flow operation. Above 0.2 A cm
−2, the test is run at constant stoichiometry, and the mole fraction is roughly constant at the cathode outlet, while it slightly decreases at the anode outlet. The water content in the stream depends strongly on the cathode stoichiometry: both at the cathode side (because of dry flow dilution) and at the anode side, confirming that diffusion is the driving force for water transport across the membrane [
29].
Water transport is found to be influenced by temperature (not shown): with increasing temperature, the water transport flux decreases, and this suggests that the solubility of water into the electrolyte is strongly influenced by temperature. Air humidification, as reported in
Figure 14, enhances the back diffusion of water to the anode, confirming the diffusive nature of the water transport mechanism.
3.6. Voltammetric Analysis
In
Figure 15, linear sweep voltammetry is presented with increasing RH. The crossover current is quantified as 3 mA cm
−2, while the short circuit current is estimated at 133 Ω cm
2. Humidification is supposed to dilute hydrogen and decrease its partial pressure, thus hindering crossover, but this effect is limited. It is possible that increased water content in the membrane can promote the permeation of hydrogen across the membrane, which offsets hydrogen dilution.
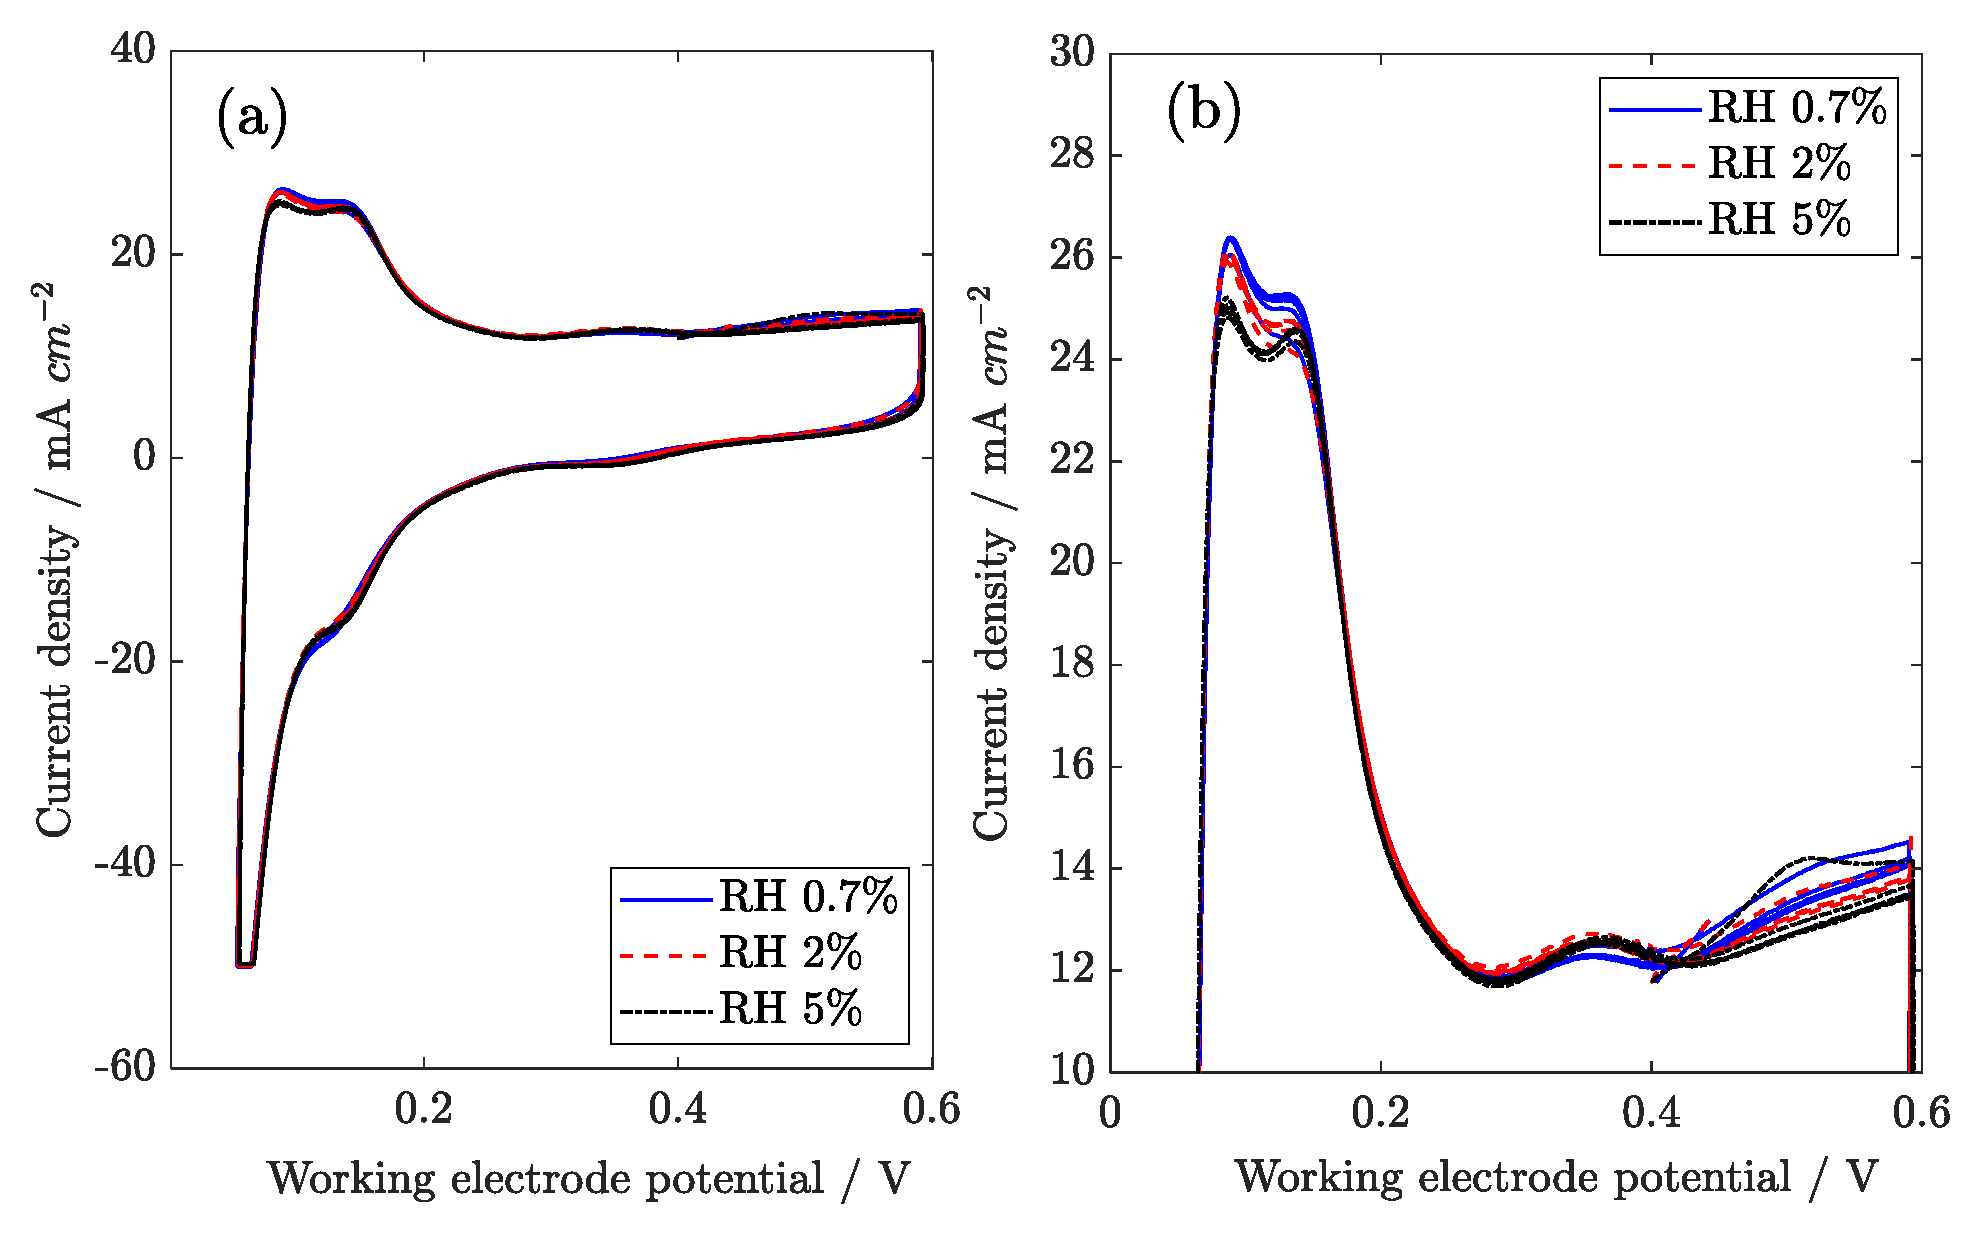
The cyclic voltammetry performed with a sweep rate of 0.05 V s
−1 is reported in
Figure 16. The catalyst active area was estimated by integrating the hydrogen oxidation peak. The obtained values are 15.9 m
2 g
Pt−1, 15.4 m
2 g
Pt−1, and 15.2 m
2 g
Pt−1 at 0.7%, 2%, and 5% RH, respectively. The active surface is thus roughly independent of relative humidity, slightly decreasing with an increase in RH. Interestingly, a small peak is observed in the voltammogram around 400 mV vs. DHE, a potential range where phosphoric acid adsorption on platinum was observed in previous works [
32,
33]. In this sense, a small change in platinum active surface that is observed at higher humidity could be ascribed to adsorption of anions, but further data should be collected to confirm this hypothesis.
3.7. Analysis of Hydrogen Pumping
In hydrogen pumping configuration, the oxygen reduction reaction at cathode side is replaced by hydrogen evolution. When an inert sweep gas (N
2) is used at the cathode in place of hydrogen, a positive voltage is observed. The ideal thermodynamic potential is determined by the Nernst Law and depends on hydrogen partial pressure:
After a current density is drawn, the anode potential increases because of Ohm, cathode, and anode activation losses. In the tested range, hydrogen pumping shows a linear polarization [
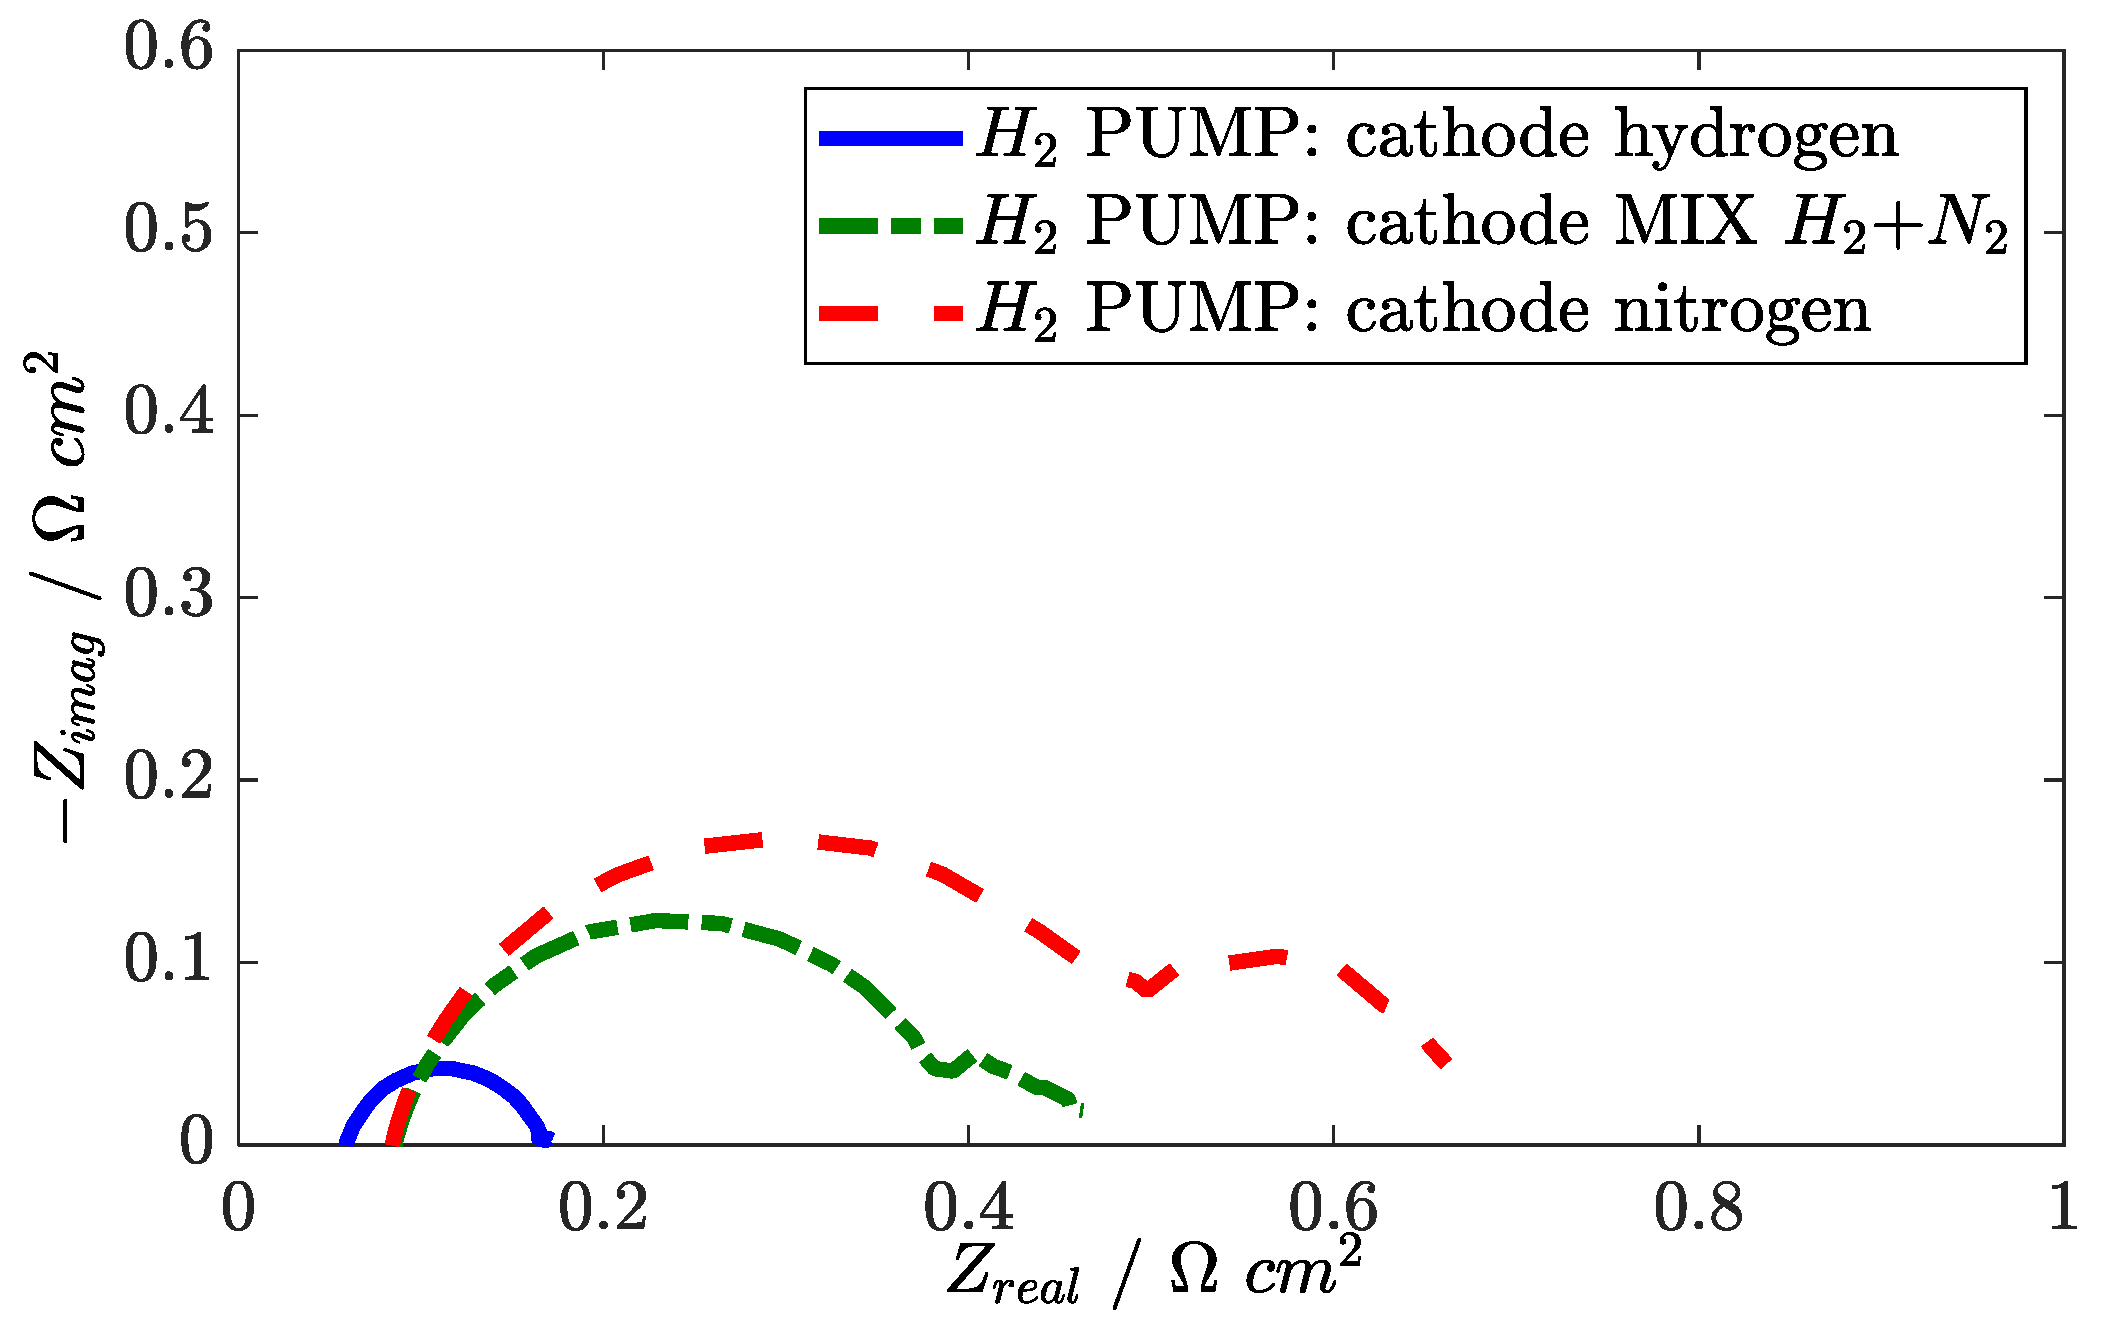
34]. EIS measurements in hydrogen pumping are reported in the Nyquist plane in
Figure 17. A capacitive feature appears in the Nyquist plot that contains both anode and cathode activation processes. This statement is proven by changing the mixture at the cathode side from hydrogen to nitrogen: two capacitive features appear in the Nyquist plot, the low frequency one probably associated with the oscillation of hydrogen partial pressure along the channel at the cathode. Since the high-frequency capacitive feature is affected by the cathode flow, it is likely that both anode and cathode kinetics are included there.
In
Figure 18, the real and imaginary parts of the spectrum are plotted as a function of frequency. The anode impedance is shown to be a small capacitive feature at high frequency, around 100 Hz. This feature is difficult to distinguish in the HT-PEMFC complete spectrum in the Nyquist plane, e.g.,
Figure 6.
