Article

Sewage Sludge Gasification Process Optimization for Combined Heat and Power Generation

1
Dipartimento di Ingegneria, Università degli Studi di Napoli “Parthenope”, 80143 Napoli, Italy
2
Department of Heating, Ventilation and Dust Removal Technology, Silesian University of Technology, Stanisława Konarskiego St. 20, 44100 Gliwice, Poland
3
Department of Thermal Technology, Silesian University of Technology, Konarskiego 22, 44100 Gliwice, Poland
*
Authors to whom correspondence should be addressed.
Energies 2023, 16(12), 4742; https://doi.org/10.3390/en16124742
Submission received: 31 March 2023 / Revised: 23 May 2023 / Accepted: 13 June 2023 / Published: 15 June 2023

Abstract

:
This work aims to assess the effect of the operating parameters of the gasifying agent preheating temperature and equivalence ratio (ER) on the conversion of sewage sludge (SS) to syngas through gasification and combined heat and power (CHP) generation. A novel gasification model was simulated in Aspen Plus to represent a fixed-bed updraft gasifier to generate syngas from SS through an equilibrium approach restricted by temperature. The novelty of this work is that the model was developed by applying the gasifying agent preheating temperature as an operating variable instead of the gasification temperature. It was calibrated by using a set of experimental values and then validated by comparing the numerical results with the experimental outcomes related to nine different operating conditions of air preheating temperatures and ER. A good agreement between the simulation and experimental results was observed. The optimum gasification process parameters of the air preheating temperature and ER were predicted to be 150 °C and 0.2, respectively. The CHP generation potentiality of SS was assessed to be 2.54 kW/kg SS as dry solids (DS), of which 0.81 kW was electrical and the remainder was thermal power. The conversion of SS to CHP through the proposed treatment can reduce 0.59 kg CO₂/kg SS as DS emissions compared with that of natural gas combustion to generate a similar quantity of energy.

1. Introduction

Global primary energy demand increased at an average rate of 2.2% per year from 1990 (9128 Mtoe/yr) to 2018 (14,421 Mtoe/yr) due to the rapid growth in population, urbanization, and industrial productivity. The major contributor to meeting the global primary energy demand are fossil sources, accounting for around 78–82%, and the remainder comes from nuclear power and renewable sources, such as solar, wind, geothermal, biomass, hydropower, tide, and ocean energy [1,2]. The energy demand is expected to reach around 17,100 Mtoe/yr by 2030 based on the current energy consumption and population growth rate [3]. The ease of extraction and cost-effective processing make fossil fuels cheaper compared with renewable energy and are responsible for their choice as the prime source to meet the global primary energy demand [4]. However, excessive dependency on fossil fuels exerts tremendous pressure on finite reserves, with consequent rapid depletion [5]. Thus, a severe global energy crisis will be observed within the next few decades [6]. Furthermore, greenhouse gases (GHGs), including CO2, CO, N2O, NOx, SOx, hydrofluorocarbons, and sulfur hexafluoride, are generated continuously and emitted into the atmosphere during energy utilization from fossil sources in the residential, commercial, transportation, and industrial sectors [4,7]. The CO₂ emissions rate due to primary energy consumption reached 33.5 Gt/yr in 2018 from 20.5 Gt/yr in 1990 [8].
Among the potential sources of GHGs, waste management, including sewage sludge (SS) plays a significant role. Currently, the most common practices for SS management are use in agriculture as fertilizer (either preparing compost or directly), landfilling, and incineration [9]. SS managed through agricultural land spreading [10,11] and landfilling is decomposed continuously by the microbial activities of aerobic and anaerobic bacteria on the carbonaceous matter and nutrients present in SS. As a result of decomposition, CO, CO2, N2O, CH4, NO, SO2, and acetate are emitted to the atmosphere [12]. CO2, CO, HCl, SOx, NOx, dioxins, furan, polychlorinated biphenyls, and polycyclic aromatic hydrocarbons are formed and emitted into the environment during the incineration of SS due to excessive air use [12]. CO2 is recognized to be the highest contributor (74.4%) to the global GHGs, followed by CH4 (17.3%) [4]. The rise in GHG levels has caused a global average temperature increase of 0.62 °C above the reference value between 1990 and 2020 [13].
Research on the identification of potential sources for renewable energy generation and the development of cost-effective conversion techniques is an attractive field to reduce the pressure on finite fossil fuel reserves and GHG emissions. For these aims, in 2021 the European Union (EU) announced a new green deal that set different targets for the member states to be achieved by 2030, such as 40% of primary energy required to be covered by renewable sources and the reduction of GHG emissions by 55% compared with the 1990 level [14]. In this framework, energy recovery from waste containing SS offers two benefits for reducing GHG emissions: a reduction in waste transportation and disposal and an increase in renewable energy production.
The application of stringent wastewater treatment directives drives the improvement of existing wastewater treatment facilities, causing a global increase in the SS generation rate. Moreover, the rate of increase in the population connected to sewage systems is increasing worldwide to fulfill the wastewater treatment directives. For instance, a continuous increase in the SS generation rate has been observed from 6.10 to 8.50 Mt as dry solids (DS) per year in the period of 2010 to 2018 in 27 EU countries (EU–27) [15]. By considering the most recently updated value of the per capita SS generation rate by Eurostat 2022 [15,16] and that, in the future, the sewage system will be improved to collect and treat all the generated wastewater, the SS generation rate is expected to reach about 10 Mt DS/yr by 2030.
The characteristics of generated SS strongly depend on the living standards of the population of a country, which control the quality of wastewater, and the treatment techniques (physical, chemical, or biological) utilized in wastewater treatment plants (WWTPs). The energy content present in SS depends on the composition of organic and inorganic constituents present in it and fluctuates in terms of a lower heating value (LHV) in the range of 11 to 20 MJ/kg SS as DS [9,17,18].
As mentioned above, producing adsorbent materials or energy from SS could reduce the problems associated with the current SS management strategies [19,20,21]. As an example, Miricioiu et al. (2021) [19] estimated a CO₂ adsorption capacity of 11.87 cm3/g under operating conditions of a −196 °C temperature and 1 bar pressure for the char derived from SS through pyrolysis treatment. Regarding energy recovery from SS, thermal treatment techniques are more advantageous due to their contribution to global primary energy demand, as well as their higher conversion efficiency (more than 80%) [22,23] and lower processing time (from 30 to 70 min) compared with biological methods (from 30 to 60% and between 7 and 105 days, respectively) [24].
Gasification is considered a promising thermal treatment for energy recovery from SS over other thermal routes due to its capability to produce products with higher energy content. Additionally, gasification offers higher conversion efficiency (carbon conversion efficiency (CCE) and cold gas efficiency (CGE)), and mild operating parameters, leading to lower operating costs and GHG emissions [9,25]. Gasification is the thermal decomposition of SS by supplying limited oxygen through a gasifying agent to ensure incomplete combustion to form carbon monoxide, hydrogen, carbon dioxide, methane, and other lighter hydrocarbons. The mixture of gaseous components that exits the gasifier during the gasification of biomass or SS is commonly known as syngas. The LHV of syngas obtained through gasification of SS or biomass varies from 3 to 9.73 MJ/Nm3 of raw syngas, based on the quality of the feed materials and operating conditions [26,27]. The oxygen required to complete the gasification process is commonly supplied through air due to its low cost and better availability. Depending on the final syngas specifications, other potential candidates as gasifying agents are pure O2, steam, CO2, and mixtures of air–steam, O2–steam, and CO2–steam [20].
The performance of the gasification process using air as a gasifying agent depends on the operating variables of the temperature and equivalence ratio (ER) [28,29]. The weight ratio of the actual air fed into the reactor to the stoichiometric amount of air essential for biomass combustion is the ER [30]. The gasification process performance may be estimated by assessing the syngas LHV, CCE, CGE, and net power ( P ˙ n e t ) obtained from the transformation process. Several authors identified optimum gasification operating parameters of temperature in the range of 770–850 °C and ER between 0.15 and 0.21 for energy recovery from SS. To complete the optimization, researchers have to conduct numerous experimental tests, in the range of 4 to 23 [30,31,32,33,34,35]. Carrying out these experimental campaigns makes the optimization process time-consuming and costly. In this context, numerical modeling may significantly reduce the time and cost of biomass gasification process optimization, including SS, as the experimental outcomes under two different conditions are sufficient to develop a model in chemical process simulation software, such as Aspen Plus. One set of gasification experimental conditions (temperature and ER) with the generated syngas composition is used for model calibration, whereas another set is applied for the validation [9].
However, gasification has some drawbacks of tar formation during syngas generation from biomass, including SS, and requires their complete removal before further application [36]. The operating conditions influence tar formation. As an example, syngas generated from pine sawdust at 900 °C temperature and with an ER of 0.21 contains 1.19 g/Nm3 of tar, whereas the tar content raises to 1.89 g/Nm3 for the gasification conditions of 800 °C and ER of 0.39 [37].
The syngas produced from biomass, including SS, can be employed to power internal combustion engines (ICEs) to produce combined heat and power (CHP) or be used as feed materials for the generation of chemicals (methanol, acetic acid, formaldehyde, etc.), hydrogen, and alternative fuel (gasoline, kerosene, and diesel through the Fischer–Tropsch reaction) [38,39]. CHP generation from SS through the thermal treatment of gasification offers two advantages:
  • It reduces the pressure on finite fossil fuel reserves to generate electricity to run WWTPs, as the electrical energy can support a fraction of the demand to complete the wastewater treatment;
  • Thermal power may be used to dry mechanically dewatered SS to a moisture content lower than 10 wt.%, as suggested for carrying out gasification in the pertinent literature [9,40,41].
The prediction of CHP generation from biomass through gasification integrated with an ICE by numerical process simulation is limited. Electrical and thermal efficiencies between 19.9–27% and 17.8–39%, respectively, have been estimated for a cogeneration system powered by syngas generated through wood gasification [36,42], whereas a thermal efficiency of 33.5% has been predicted for the use of olive kernels [43]. Concerning SS, the electrical and thermal efficiencies have been estimated in the ranges of 19.3–29.2% and 44.93–48.7% respectively [9,20,44]. Finally, considering waste paper and deinking sludge blends, electrical, thermal, and system efficiencies of 18.32, 46.86, and 72.87%, respectively, have been assessed [27].
In the current research, the conversion of SS to syngas by simulating a fixed-bed updraft air-gasifier considering an autothermal mode of operation is simulated. The variation in syngas quality and gasification process performances with differences in the operating conditions of air preheating temperature and ER are examined. The gasification process is numerically analyzed in the Aspen Plus V8.8 software (Bedford, MA, USA) by developing a model based on experimental outcomes. Considering the available literature, gasification models are mainly employed to assess the effect of temperature and ER as operating variables on syngas generation by analyzing different feedstocks, such as kitchen waste [45], sawdust [46], Napier grass [47], and SS [9,20,48]. Differently, this paper focuses on the effect of air preheating temperature on the autothermal gasification process. To the best of the authors’ knowledge, this analysis is carried out here for the first time. During gasification model calibration, a temperature-restricted chemical equilibrium approach is applied, as proposed in some studies available in the literature [9,28,29,49]. The calibrated model is validated against nine distinct sets of experimental outcomes based on distinct ER and air preheating temperatures. Differently, in the literature, a maximum of five distinct gasification temperatures at unique ER have been used [20]. The optimum operating points are estimated through the developed model by analyzing the variations in syngas composition, LHV, CGE, CCE, and P ˙ n e t with variations in the gasifying agent preheating temperature and ER. Finally, the use of the produced syngas to power an ICE system is considered to estimate the:
-
Energy recovery potential of SS as CHP;
-
CO2 emission reduction over a gas turbine system;
-
Emission profile to assess the pollutant concentration.

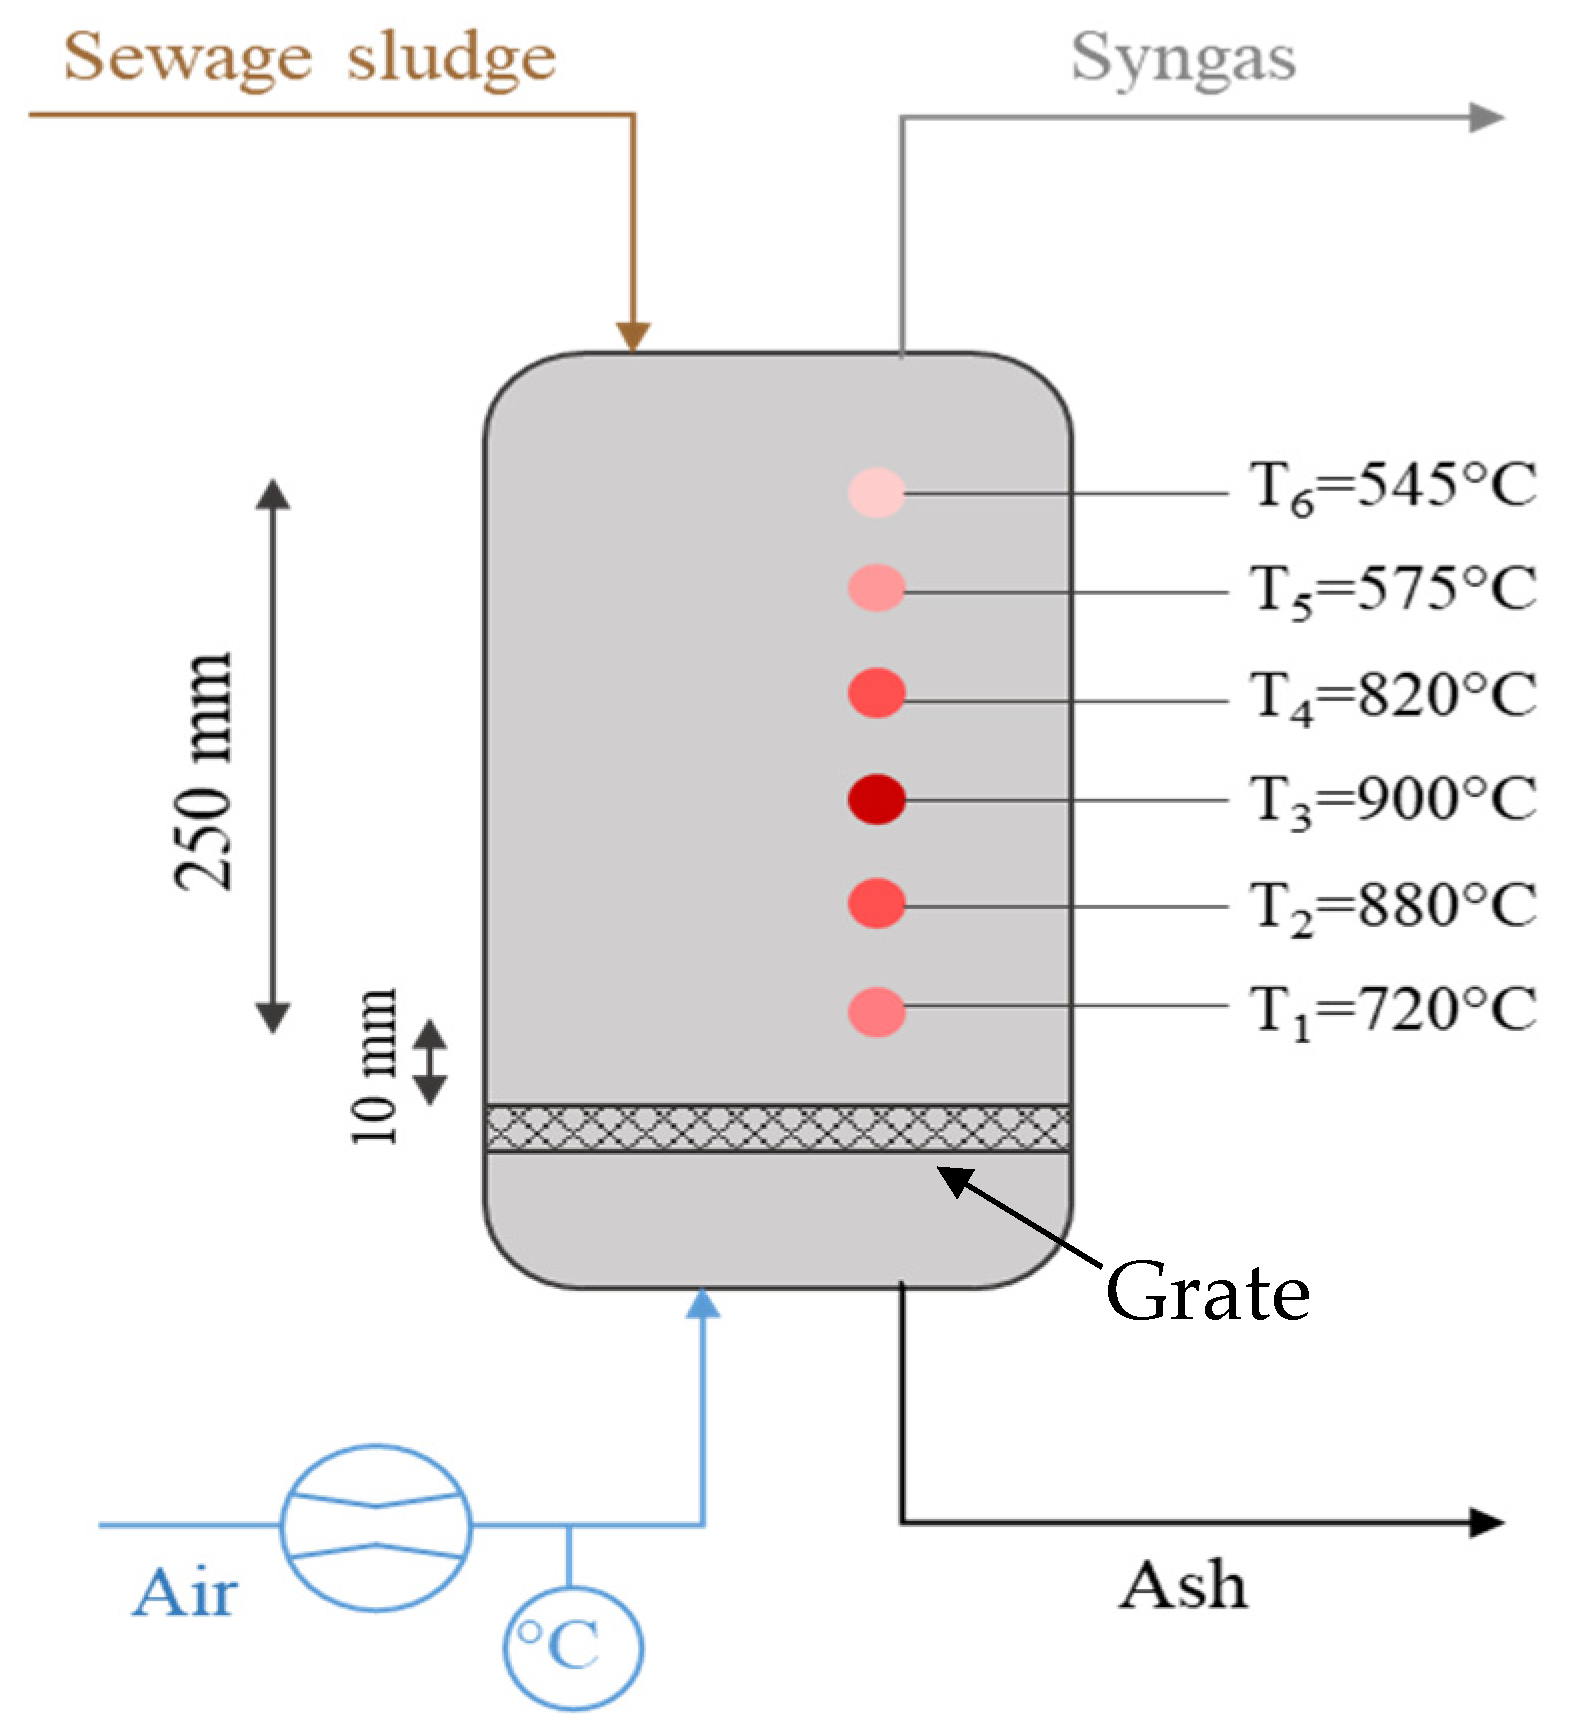
2. Experimental Analysis: Sewage Sludge to Syngas

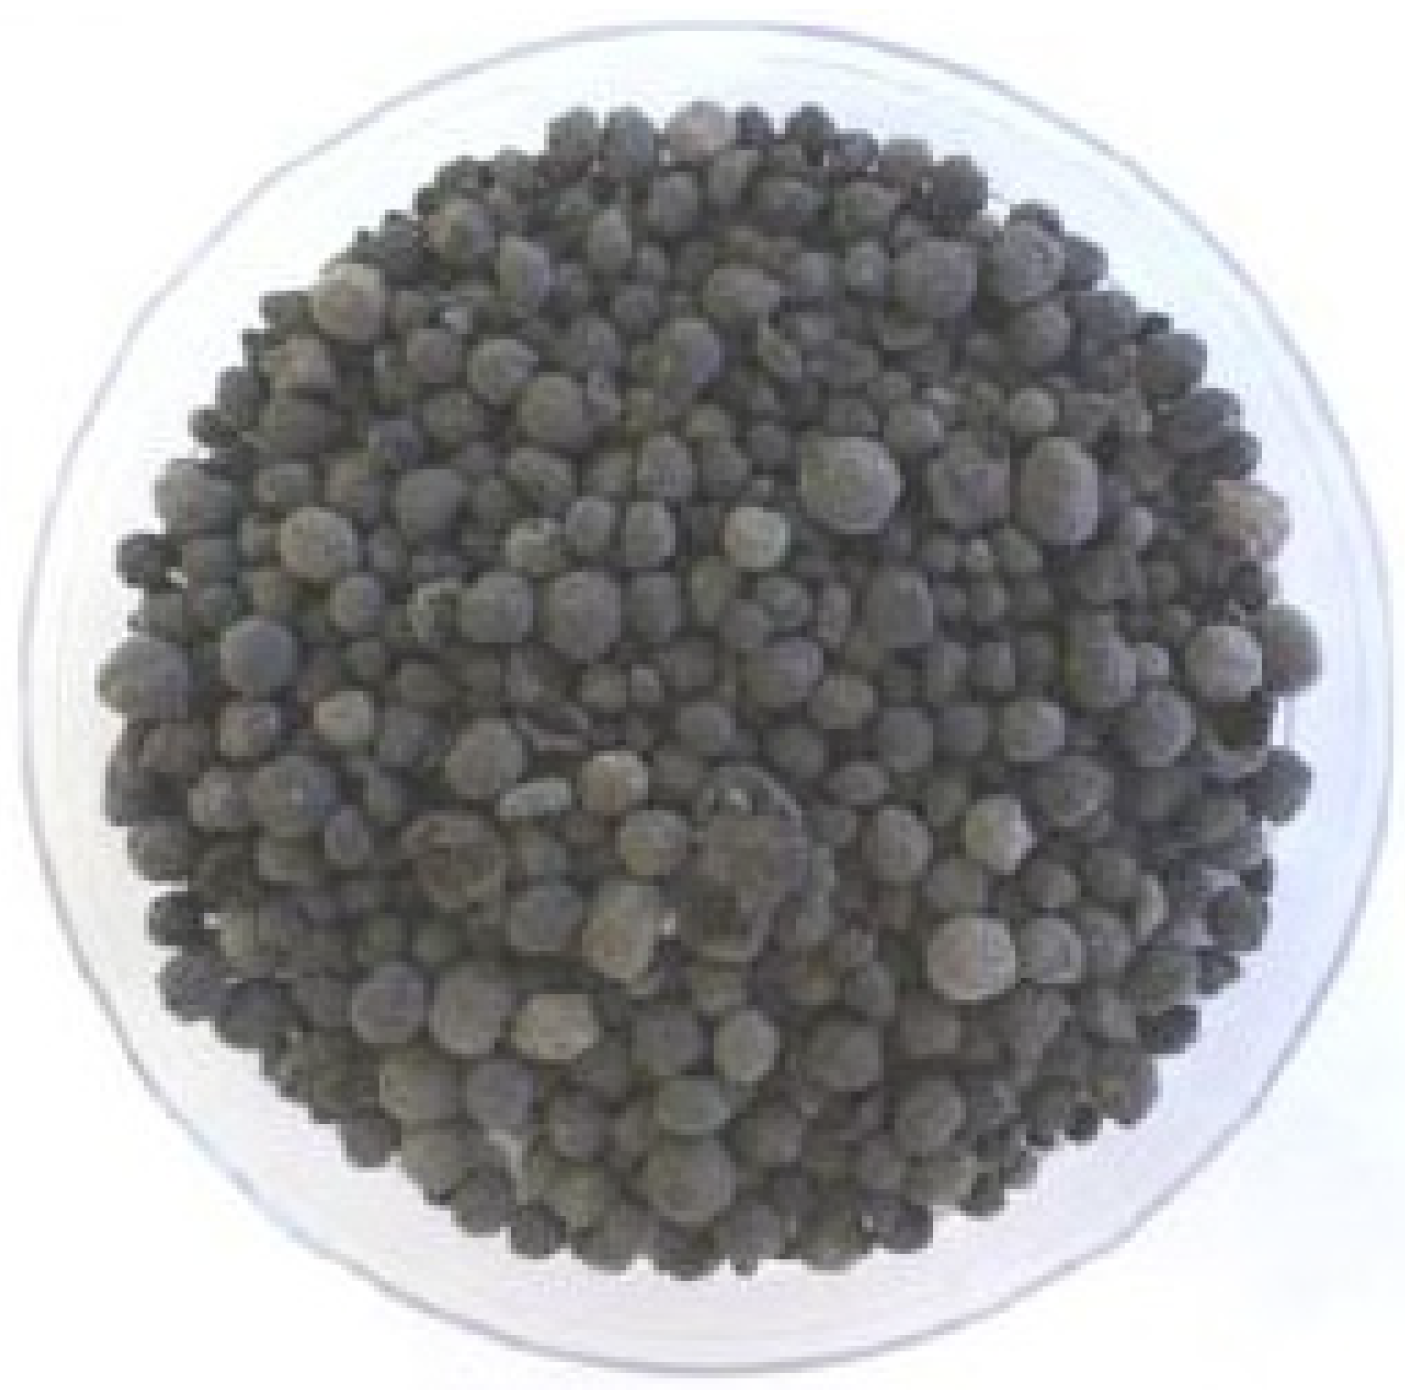
2.1. Sewage Sludge Collection and Characterization

A description of the experimental campaign of SS gasification used to develop the numerical model presented in this study is available in other publications [50,51].
Dry SS was obtained from a WWTP in Poland where wastewater is treated by applying a combination of mechanical and biological processes with stabilization by anaerobic digestion. Anaerobically digested SS is dewatered through a mechanical belt press and drying is completed in a convective dryer by applying hot air with a temperature of 260 °C in the WWTP. The thermally dried SS presented a granulated form due to the application of air with high temperatures as a drying agent. A picture of the analyzed SS sample is presented in Figure 1.
Standard methods of PN-EN 14774-3:2010, PN-EN 15402:2011, and PN-EN 15403:2011 were applied to quantify the moisture, volatile matter, and ash content, respectively, available in the thermally dried SS used in the current analysis. The major chemical constituents present in SS were measured by an infrared analyzer. Proximate and ultimate elemental analysis of the SS was completed on a dry basis (db). A description of the analysis techniques employed to characterize the SS used in the present study can be found in a previous publication [52]. The characteristics of the SS are illustrated in Table 1.

2.2. Energy Recovery from Sewage Sludge

The energy content of the SS was transformed into syngas through a gasification experimental campaign conducted in a fixed-bed updraft reactor made of stainless steel with dimensions of a 150 mm internal diameter and 300 mm height. The gasifier had a maximum capacity of 1.39 g/s and was insulated properly to avoid energy loss as heat to the atmosphere. The gasifier had 6 thermocouples combined with an Agilent recording system placed every 50 mm from the bottom to the top, with the initial one placed 10 mm above the grate, to record the temperature in different zones inside the reactor. The SS was directed downward from the top and the gasifying agent (air) passed in the opposite direction of the feed flow from the bottom. Four consecutive distinct zones of drying (for moisture removal), pyrolysis (volatile matter, char, and ash formation through the decomposition of SS), reduction (volatile matter and carbon transformed to syngas), and combustion zones (ignition of char to supply energy to the above three regions to ensure autothermal gasification) inside the reactor from top to bottom. Air passed through a heater with a control system to ensure a specific air preheating temperature. A schematic view of the system considered for the gasification of the SS with a temperature profile at an ER of 0.16 is shown in Figure 2. Every experiment was conducted three times to check the reproducibility of the results. Average results with uncertainties for the gasification of SS under certain operating conditions of air preheating temperature and ER are illustrated in Table 2.
Fixed-bed gasifiers have low operating costs and generate syngas with a lower quantity of tar, which significantly reduces the cleaning costs before being used in further processes [53,54].
The experimental campaigns were completed by varying the incoming gasifying agent preheating temperatures (25, 100, 150, 200, and 250 °C) at two different ERs (0.16 and 0.27). The ER values were chosen based on previous experimental analysis to test the alteration in the syngas composition and LHV with operating parameters. The generated syngas was collected in a Tedlar gas bag for offline measurement. The syngas composition was measured using a calibrated gas chromatograph Agilent 6980N series. The experimental campaign was performed by maintaining a SS flow rate of 1.11 g/s. The tar content of the produced syngas was not analyzed due to the limitations of the analyzer.

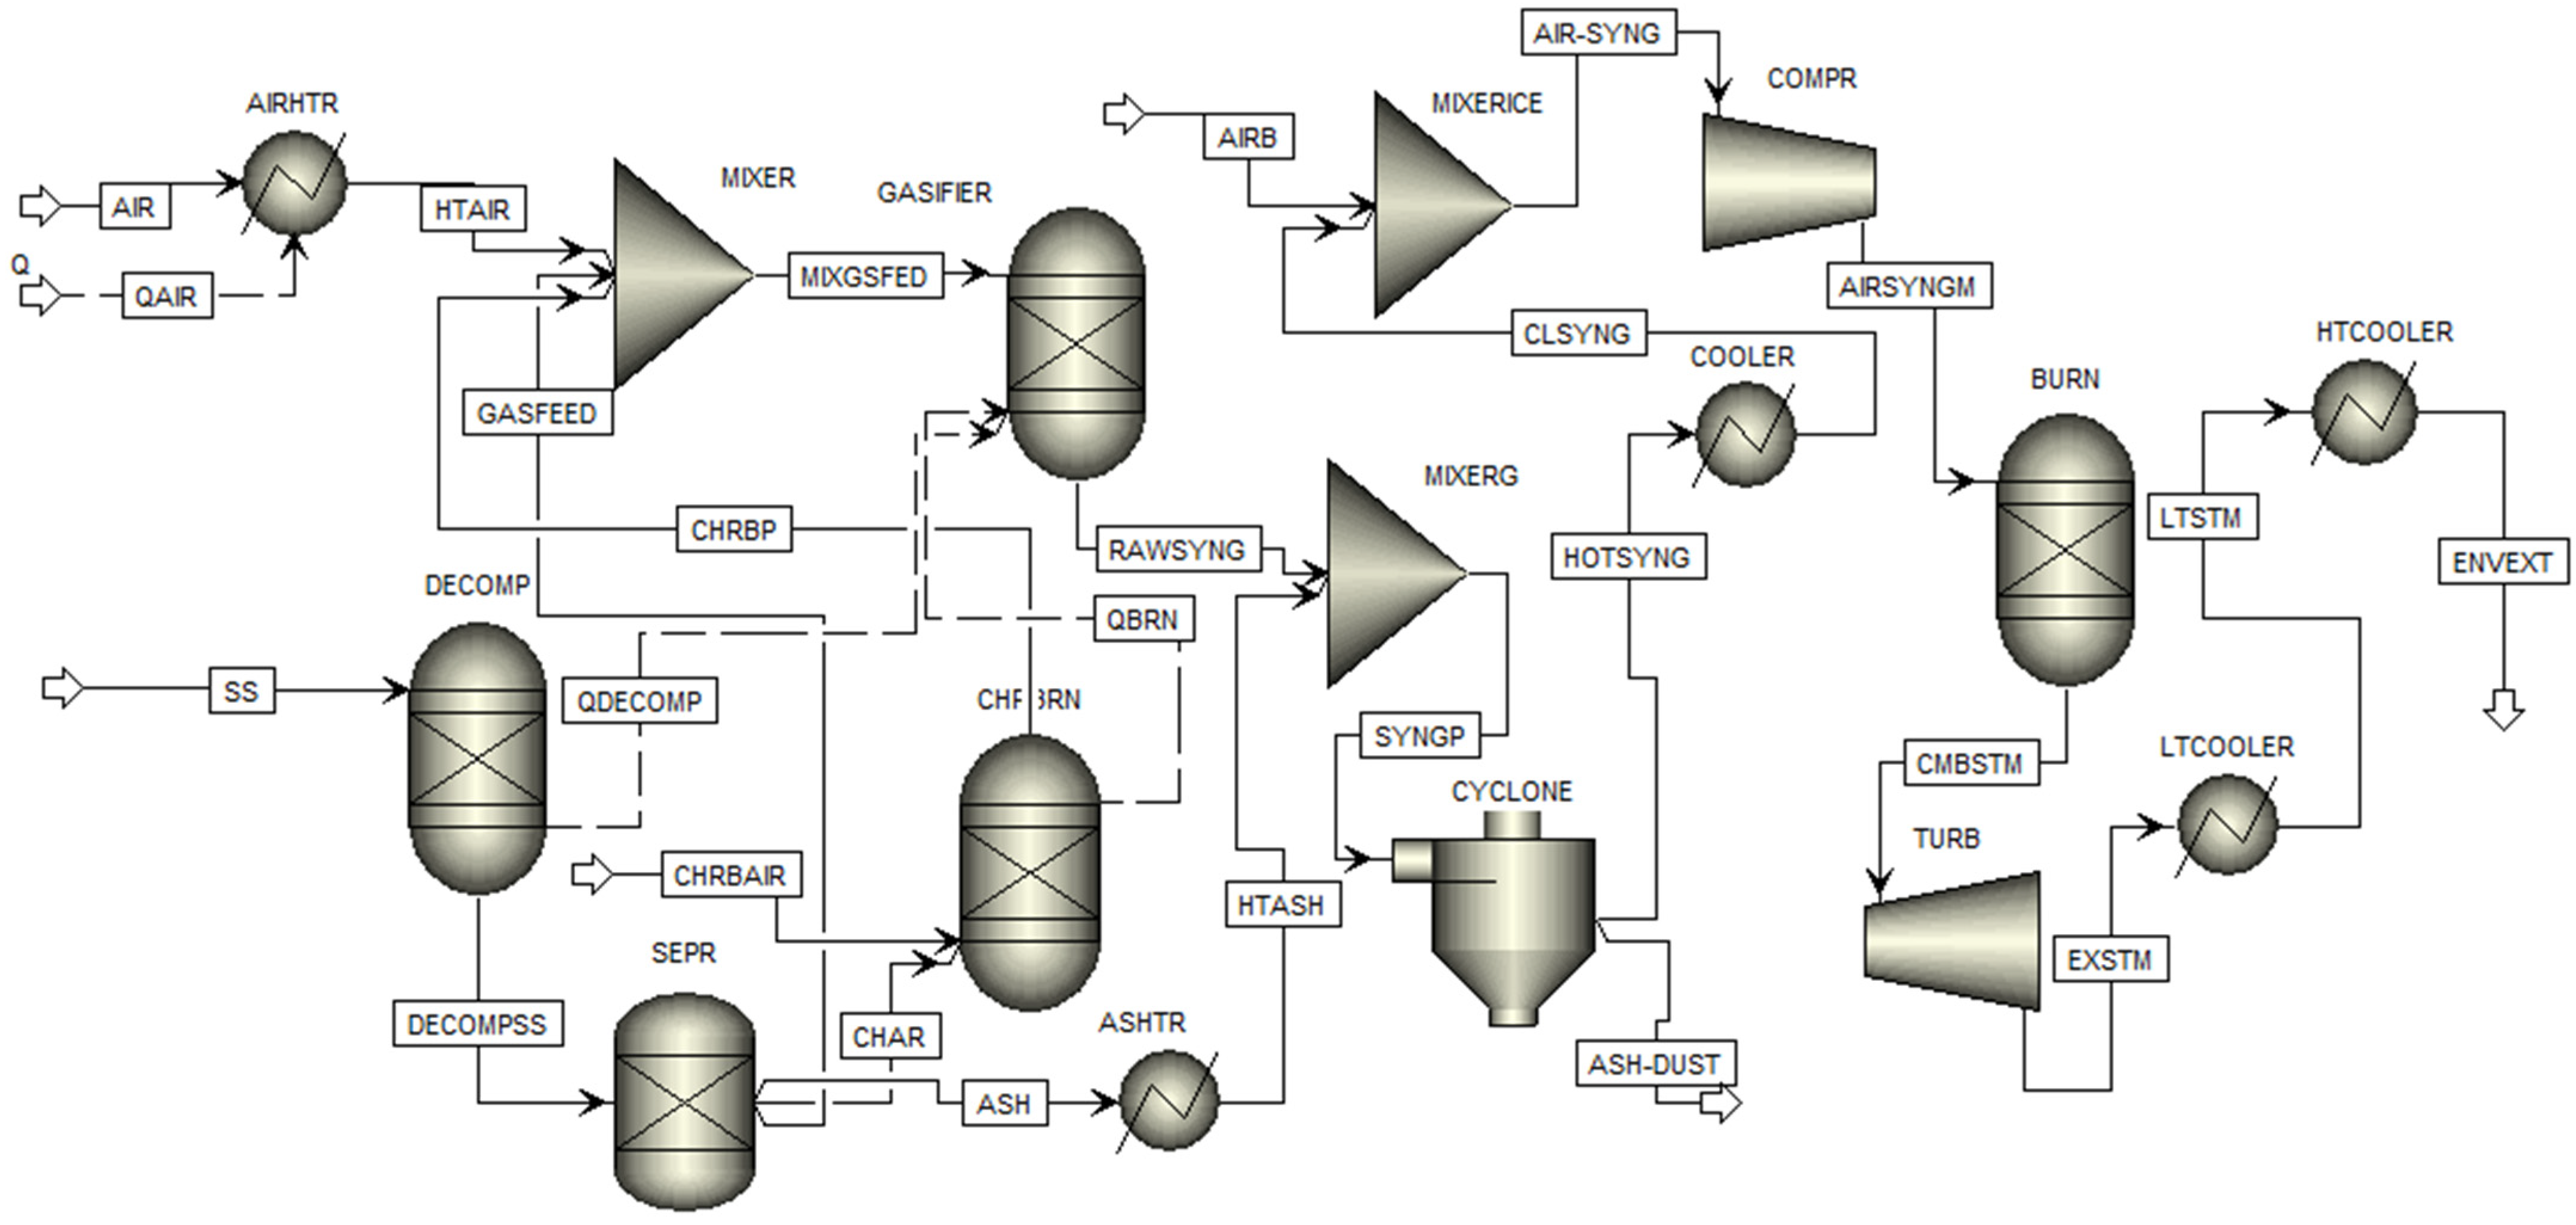
3. Aspen plus Simulation on the Transformation of Sewage Sludge Energy Content to Combined Heat and Power

The simulation of the SS conversion to CHP was completed by integrating gasification in a fixed-bed updraft reactor with an ICE system in Aspen Plus V8.8 software. The model was developed through the sequential connection of different unit operation blocks for specific tasks, as unique blocks for either gasification or ICE were not available in the Aspen Plus library. The block diagram related to the cogeneration of electrical and thermal energy from SS through the proposed route is illustrated in Figure 3.
The raw material used to generate electrical and thermal energy in the current analysis was SS, which, in Aspen Plus, was treated as a non-conventional component. SS was decomposed into the conventional components of C, H2, N2, H2O, S, and O2, and the non-conventional component of ash in the pyrolysis step. A Boston–Matthias-modified Peng–Robinson (PR-BM) equation of state was chosen to assess the thermodynamic properties of all conventional components involved in the simulation [43], whereas the enthalpy and density of non-conventional components (SS and Ash) were estimated through some of the models available in Aspen Plus (HCOALGEN and DCOALIGT, respectively).
In the following text, the simulated system is described by referring to the blocks and streams illustrated in Figure 3.
The drying, pyrolysis, combustion, and reduction of SS to generate syngas in the gasification process were simulated by integrating different blocks. The drying and pyrolysis of SS were completed in an RYield reactor (DECOMP) at a temperature of 545 °C, which was measured in the experimental campaign (presented in Figure 2). The separation of the decomposed SS stream exiting the RYield reactor was completed in a separator block (SEPR) to three streams: CHAR (the fraction of carbon that was combusted to supply thermal energy to complete the gasification process in autothermal mode), GASFEED (the remaining fraction of carbon with other conventional components), and ASH. The simulation of the combustion of char with ambient air (CHRBAIR stream) to ensure the autothermal gasification mode was completed in an RGibbs reactor (CHRBRN). Gasification reactions were simulated by minimizing the Gibbs’s free energy and were completed in another RGibbs reactor (GASIFIER). The preheating of the incoming gasifying agent to the reactor based on ER was completed in a heat exchanger (AIRHTR) by supplying thermal energy from an external source (QAIR stream). Preheated air was mixed with the conventional components coming from the SEPR block and the product exiting the char combustion reactor (CHRBP stream) in a MIXER prior to the entrance of the gasifier. The thermal energy of the char combustion and pyrolysis reactor was integrated with the gasifier, similar to the experimental campaign. The difference between the numerical results evaluated from the simulated model and the experimental campaign was reduced to an acceptable limit of less than ±20% through the restriction of the equilibrium position of individual gasification reactions to a specific temperature [9,55]. The product exiting the gasifier (RAWSYNG stream) was mixed with the ash (HTASH stream), whose temperature was fictitiously increased to the gasification temperature by passing through a heater (ASHTR). Ash and dust from the syngas were separated by passing through an SSplit (CYCLONE). The syngas exiting the gasifier was cooled down to a temperature of 30 °C, suitable for ICE operation, by passing through a heat exchanger (COOLER). The thermal energy could be recovered for other processes, e.g., air preheating in the gasification or other purposes based on the production capacity [36].
The ICE system was simulated in Aspen Plus by considering three consecutive thermodynamic processes of isentropic compression, constant volume combustion, and isentropic expansion to generate mechanical energy from the potential energy of syngas [20,36]. The potential energy of the syngas and air mixture was raised through isentropic compression, whereas combustion at a constant volume generated thermal energy through the ignition of syngas. Finally, isentropic expansion produced mechanical energy from the thermal energy of the air–syngas combustion streams to drive a generator and produce electrical energy [36,43,56,57,58,59].
Thermal energy recovery from the ICE exhaust was simulated by considering two steps of cooling in two heat exchangers. The first stage (LTCOOLER) simulated the recovery of low-temperature (LT) thermal energy available from the engine coolant stream that was cooled down from 90 °C to 80 °C [36]. The exhaust stream from ICE passed through a heat exchanger (HTCOOLER) to extract the high-temperature (HT) thermal energy. Both the LT and HT thermal energies could be used to reduce the moisture content of mechanically dewatered SS to a gasification standard of <10 wt.% or for district heating based on the production capacity of the plant [20].

3.1. Gasification Modeling

Biomass gasification simulation by using the chemical equilibrium method had a better agreement with the experimental outcomes compared with the kinetic model [59]. The following assumptions were taken into account to simplify the gasification model’s development [9,59,60,61].
  • The model was zero-dimensional;
  • The stream fed to the pyrolysis zone was instantaneously disintegrated;
  • There was no temperature gradient inside the gasifier in the radial direction, which ensured isothermal conditions;
  • The hydrodynamic features of the gasifier were neglected;
  • Equilibrium conditions were reached by all the considered gasification reactions;
  • Intermediate product formation pathways during the gasification process were not considered;
  • Char was full of carbon and combusted to generate thermal energy;
  • Ideal behavior was shown by all the gaseous components;
  • Gasification was completed under atmospheric pressure;
  • Tar formation was not assessed as assumed by other researchers during SS gasification model development [9,28,29,44,49]. The LHV of syngas generated from biomass, including SS deposition, changed with the tar content deposition due to the alteration in the operating conditions. The tar content was deposited at higher temperatures and lower ER. However, the effect on syngas LHV alteration was less than 5% [37,62]. Therefore, neglecting tar formation did not significantly affect the potentiality of electrical and thermal energy cogeneration, which was the main aim of the current research.
Seven reactions were considered to simulate the SS gasification process through the Rgibbs reactor (GASIFIER block of Figure 3) and are listed in Table 3 with the heat of the reaction (ΔH) [63,64].
The Boudouard reaction ( CO 2 + C 2 CO ) is not able to achieve the equilibrium point due to the shorter holding time of the reactants in the Rgibbs reactor of block GASIFIER [65]. For this reason, such a reaction was not taken into account in the formulation of the gasification model in the present analysis.

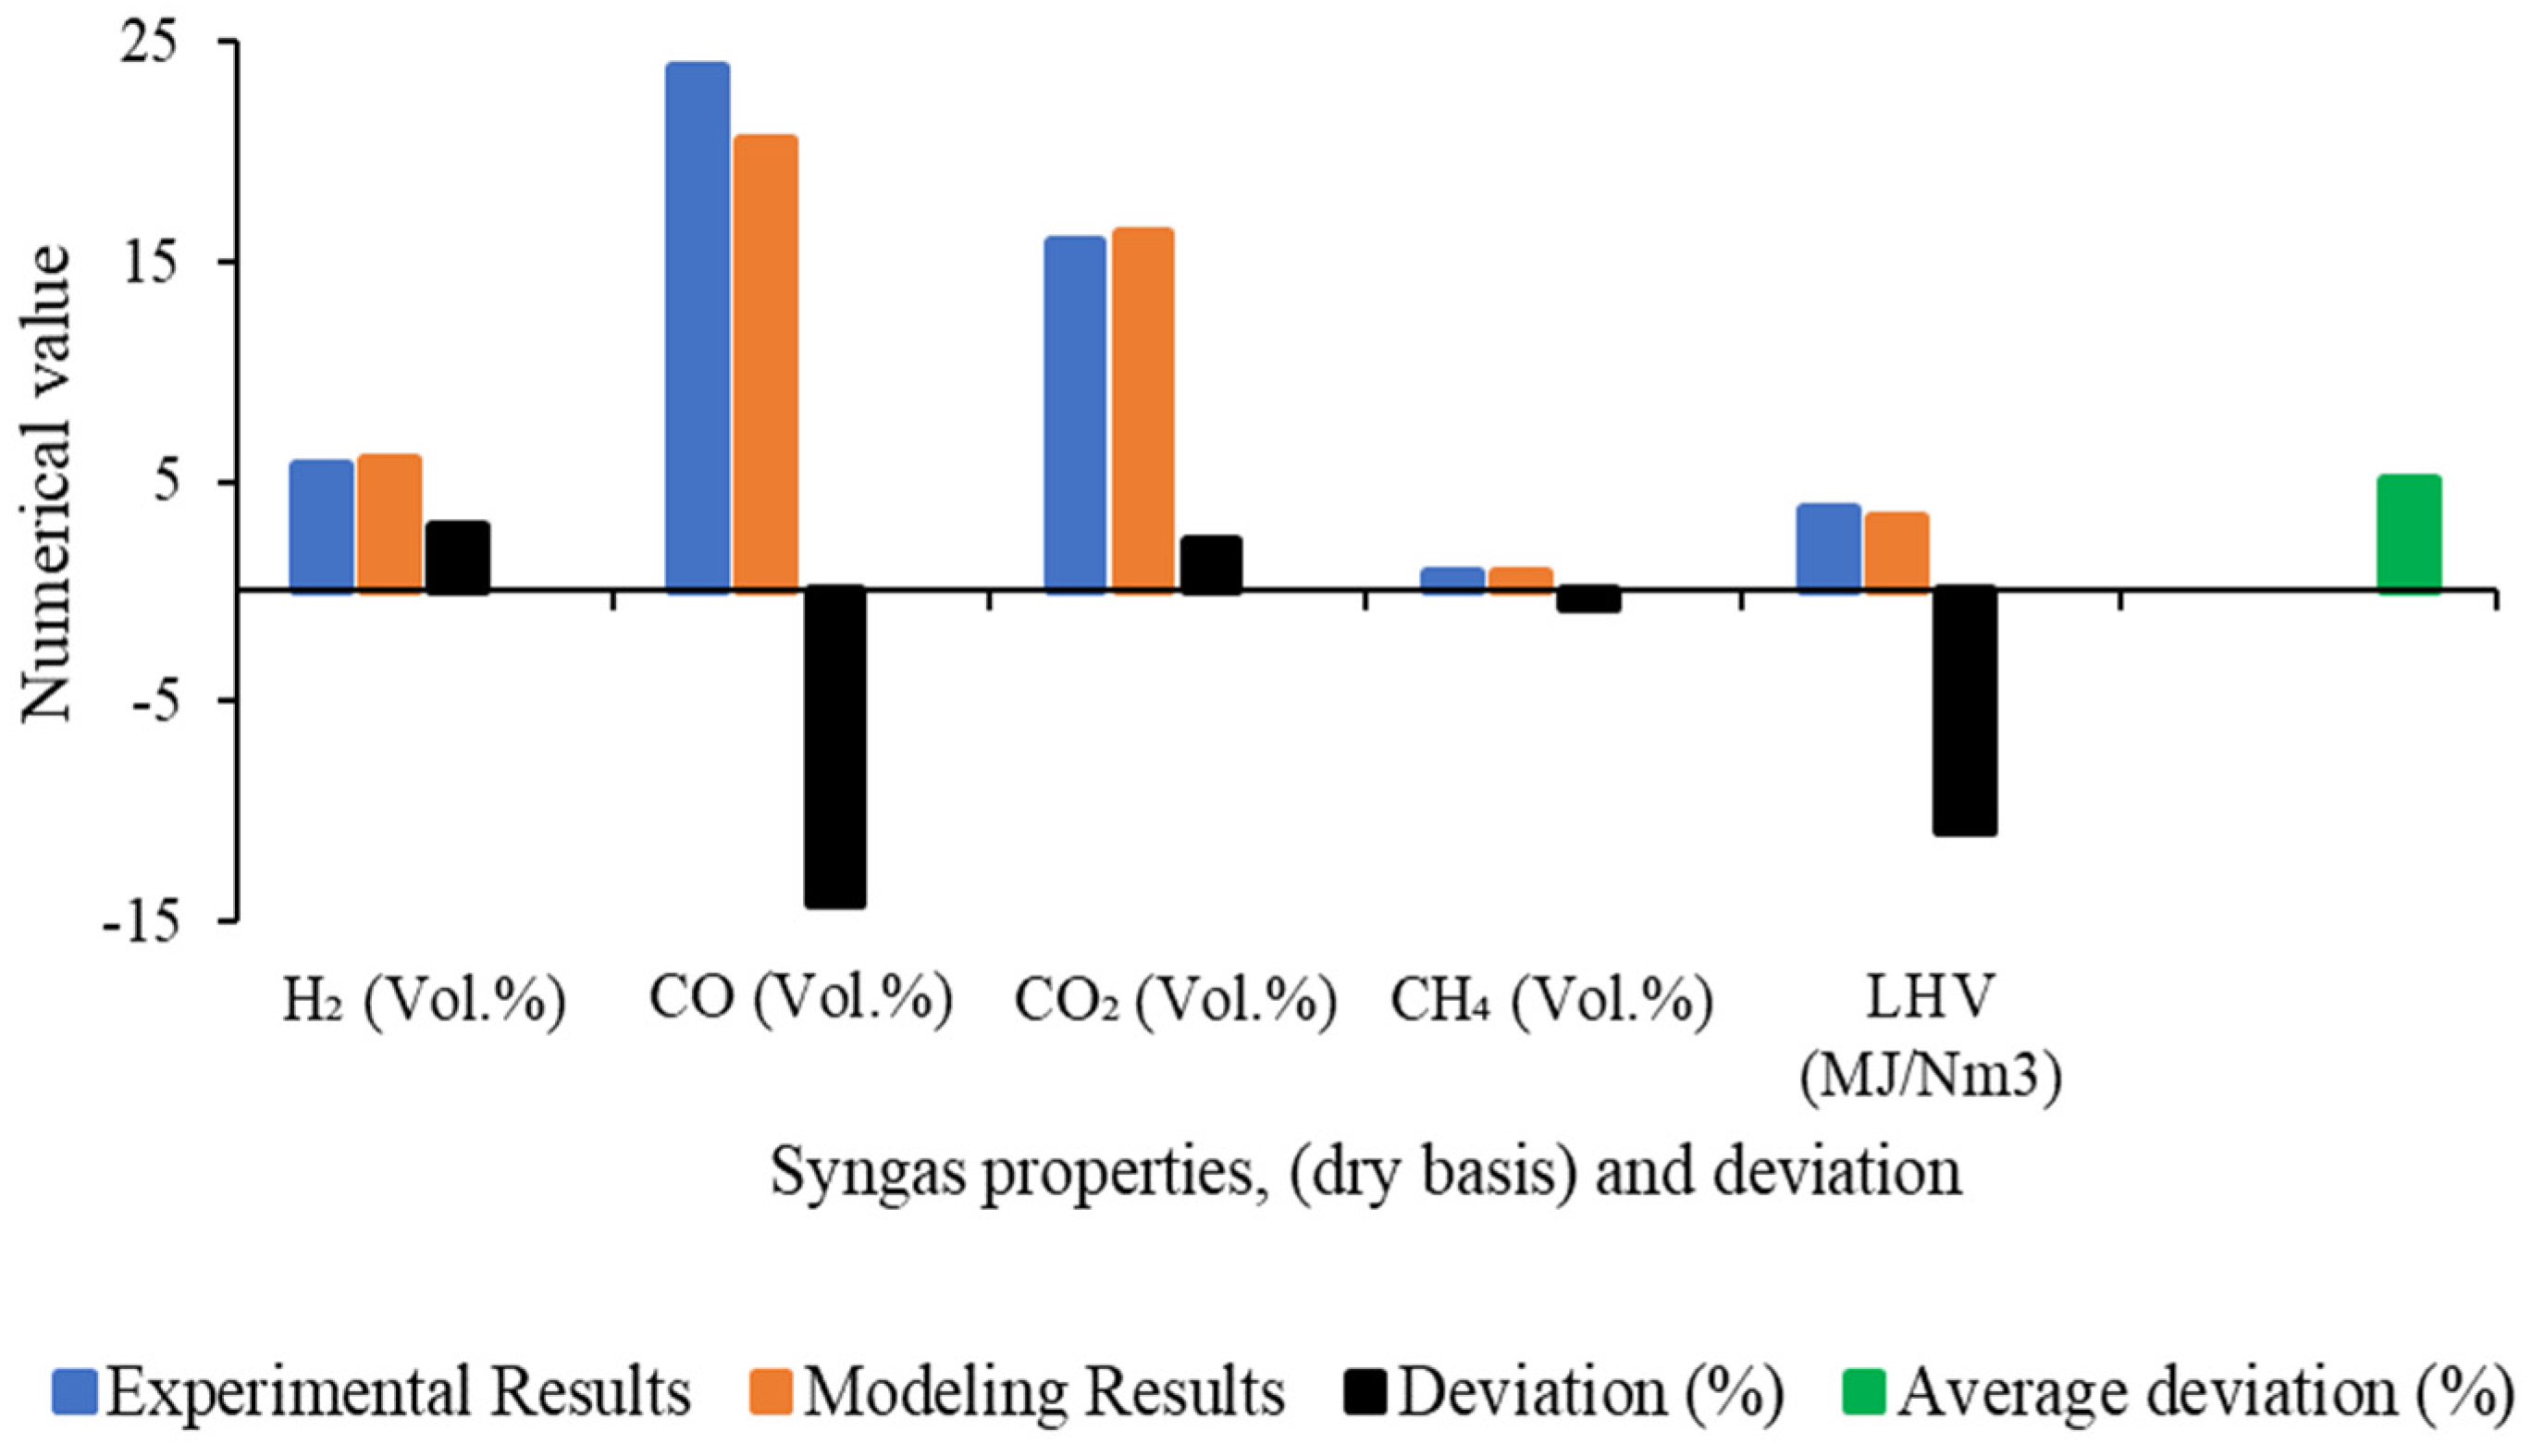
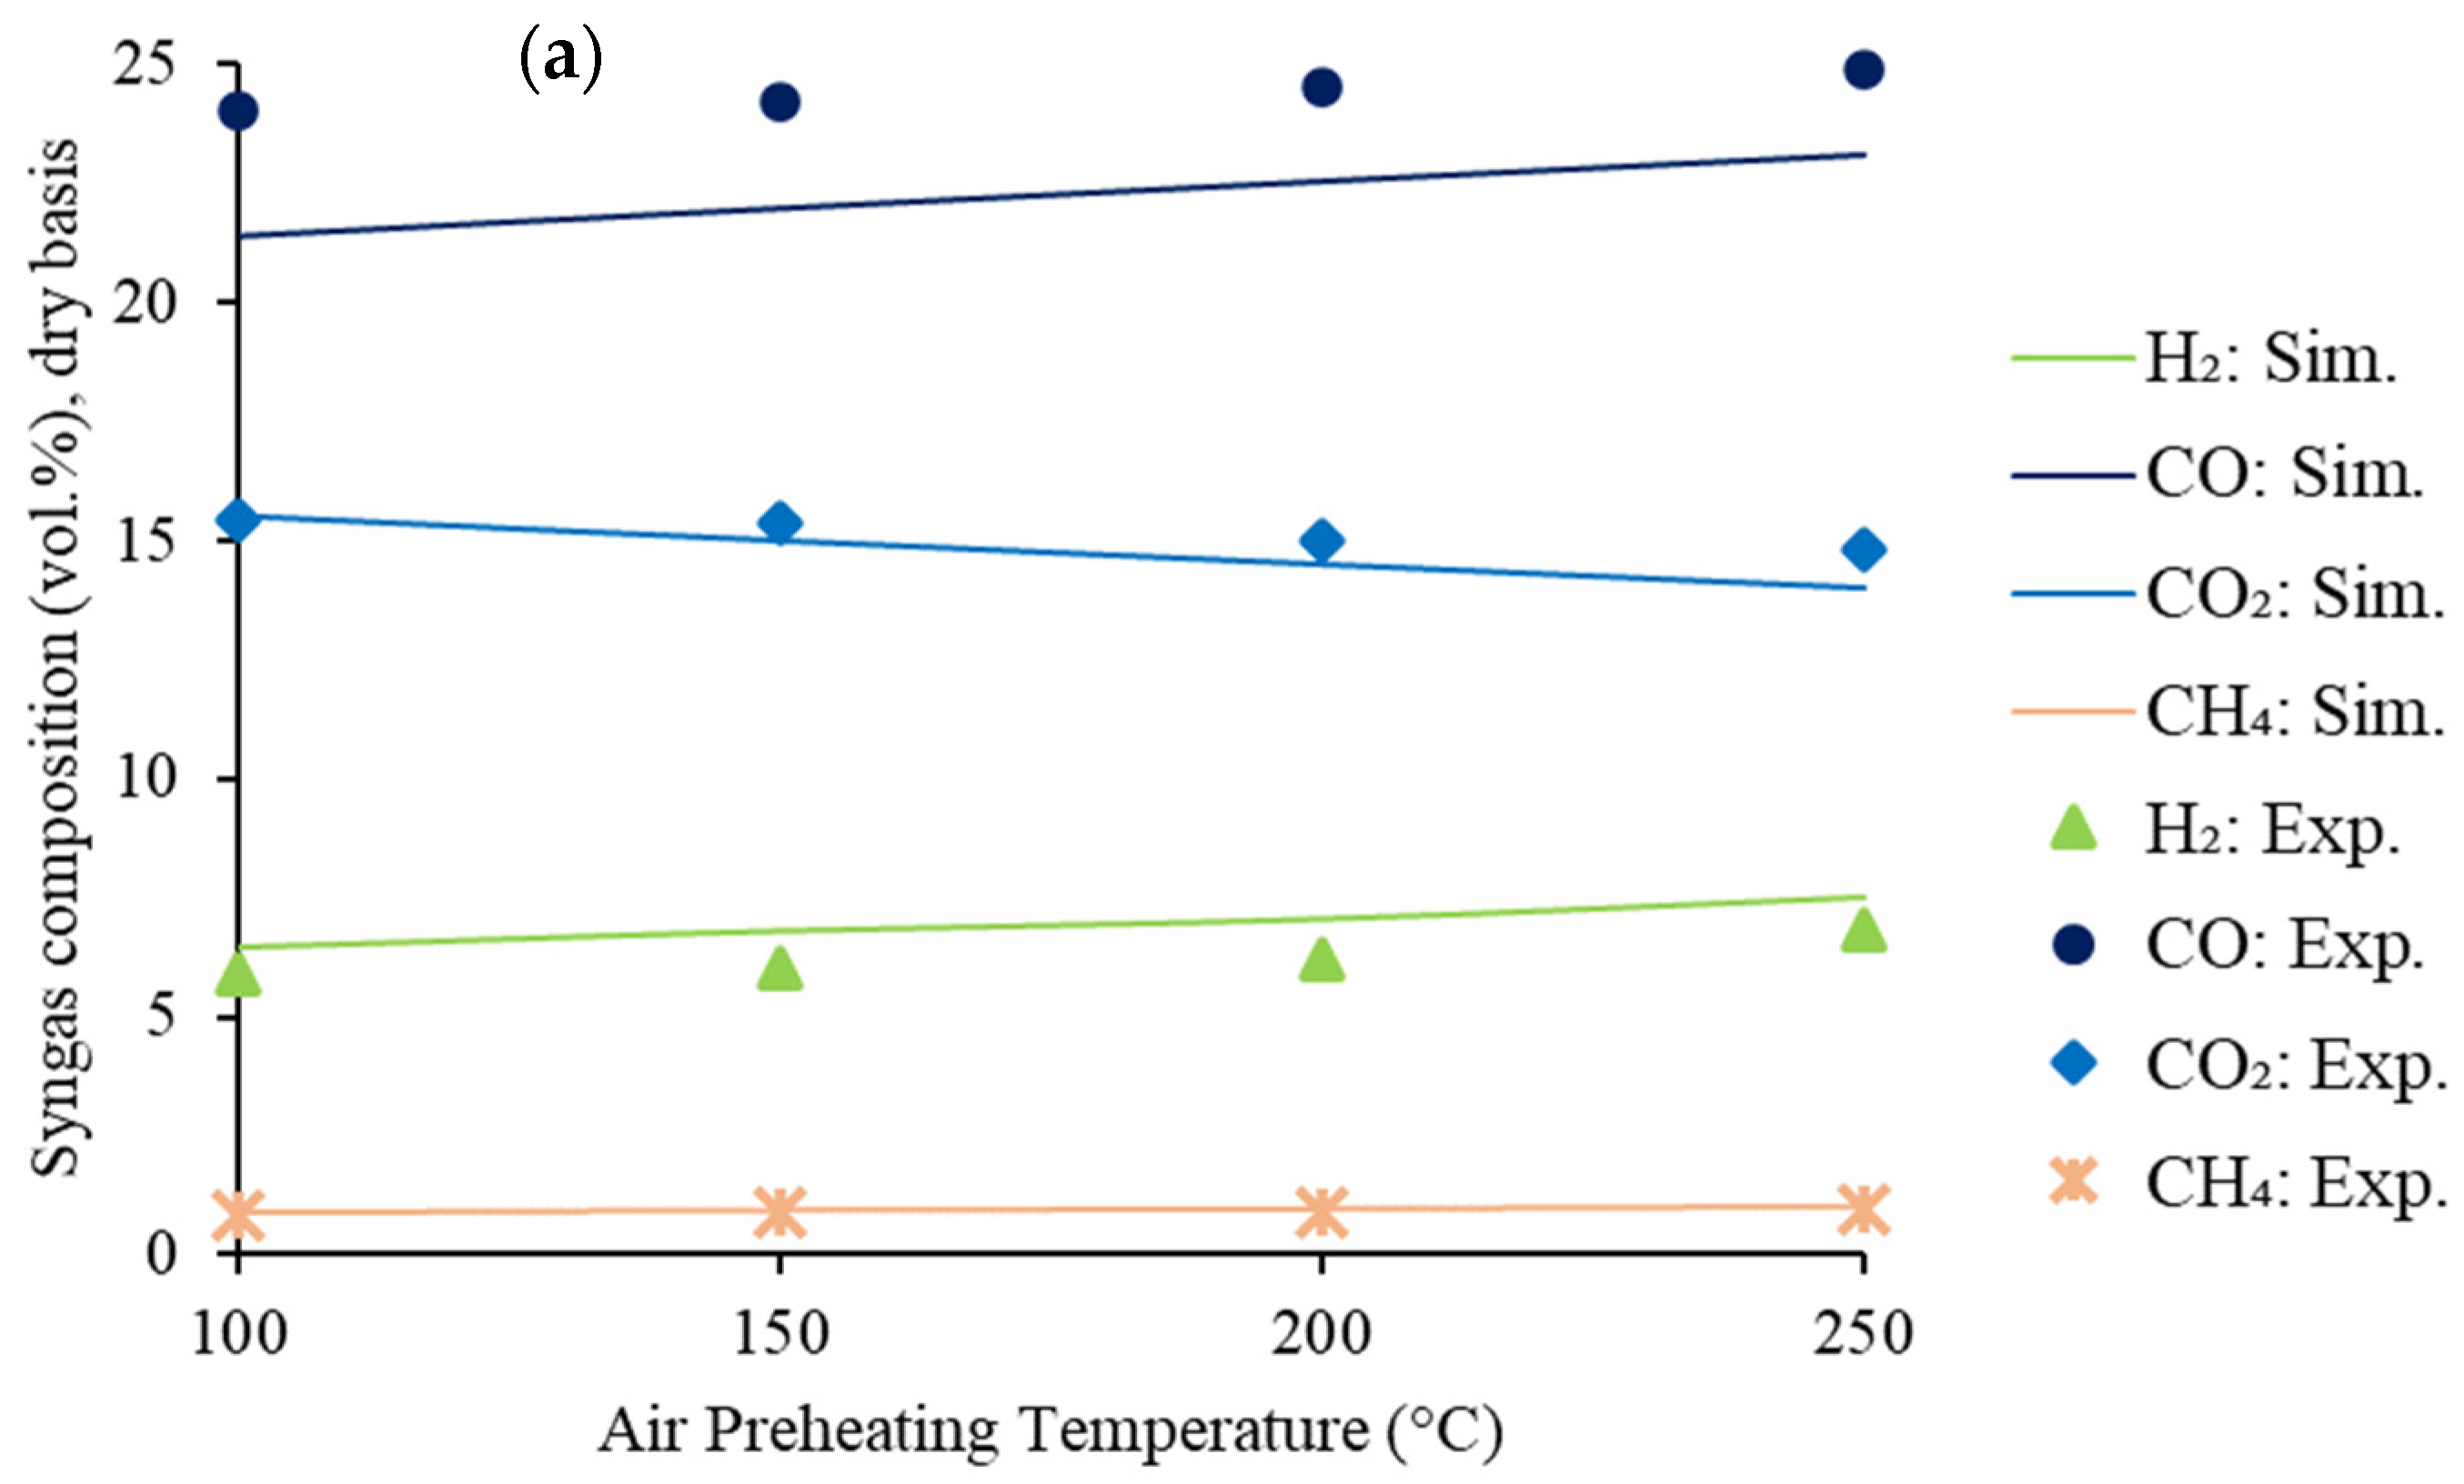
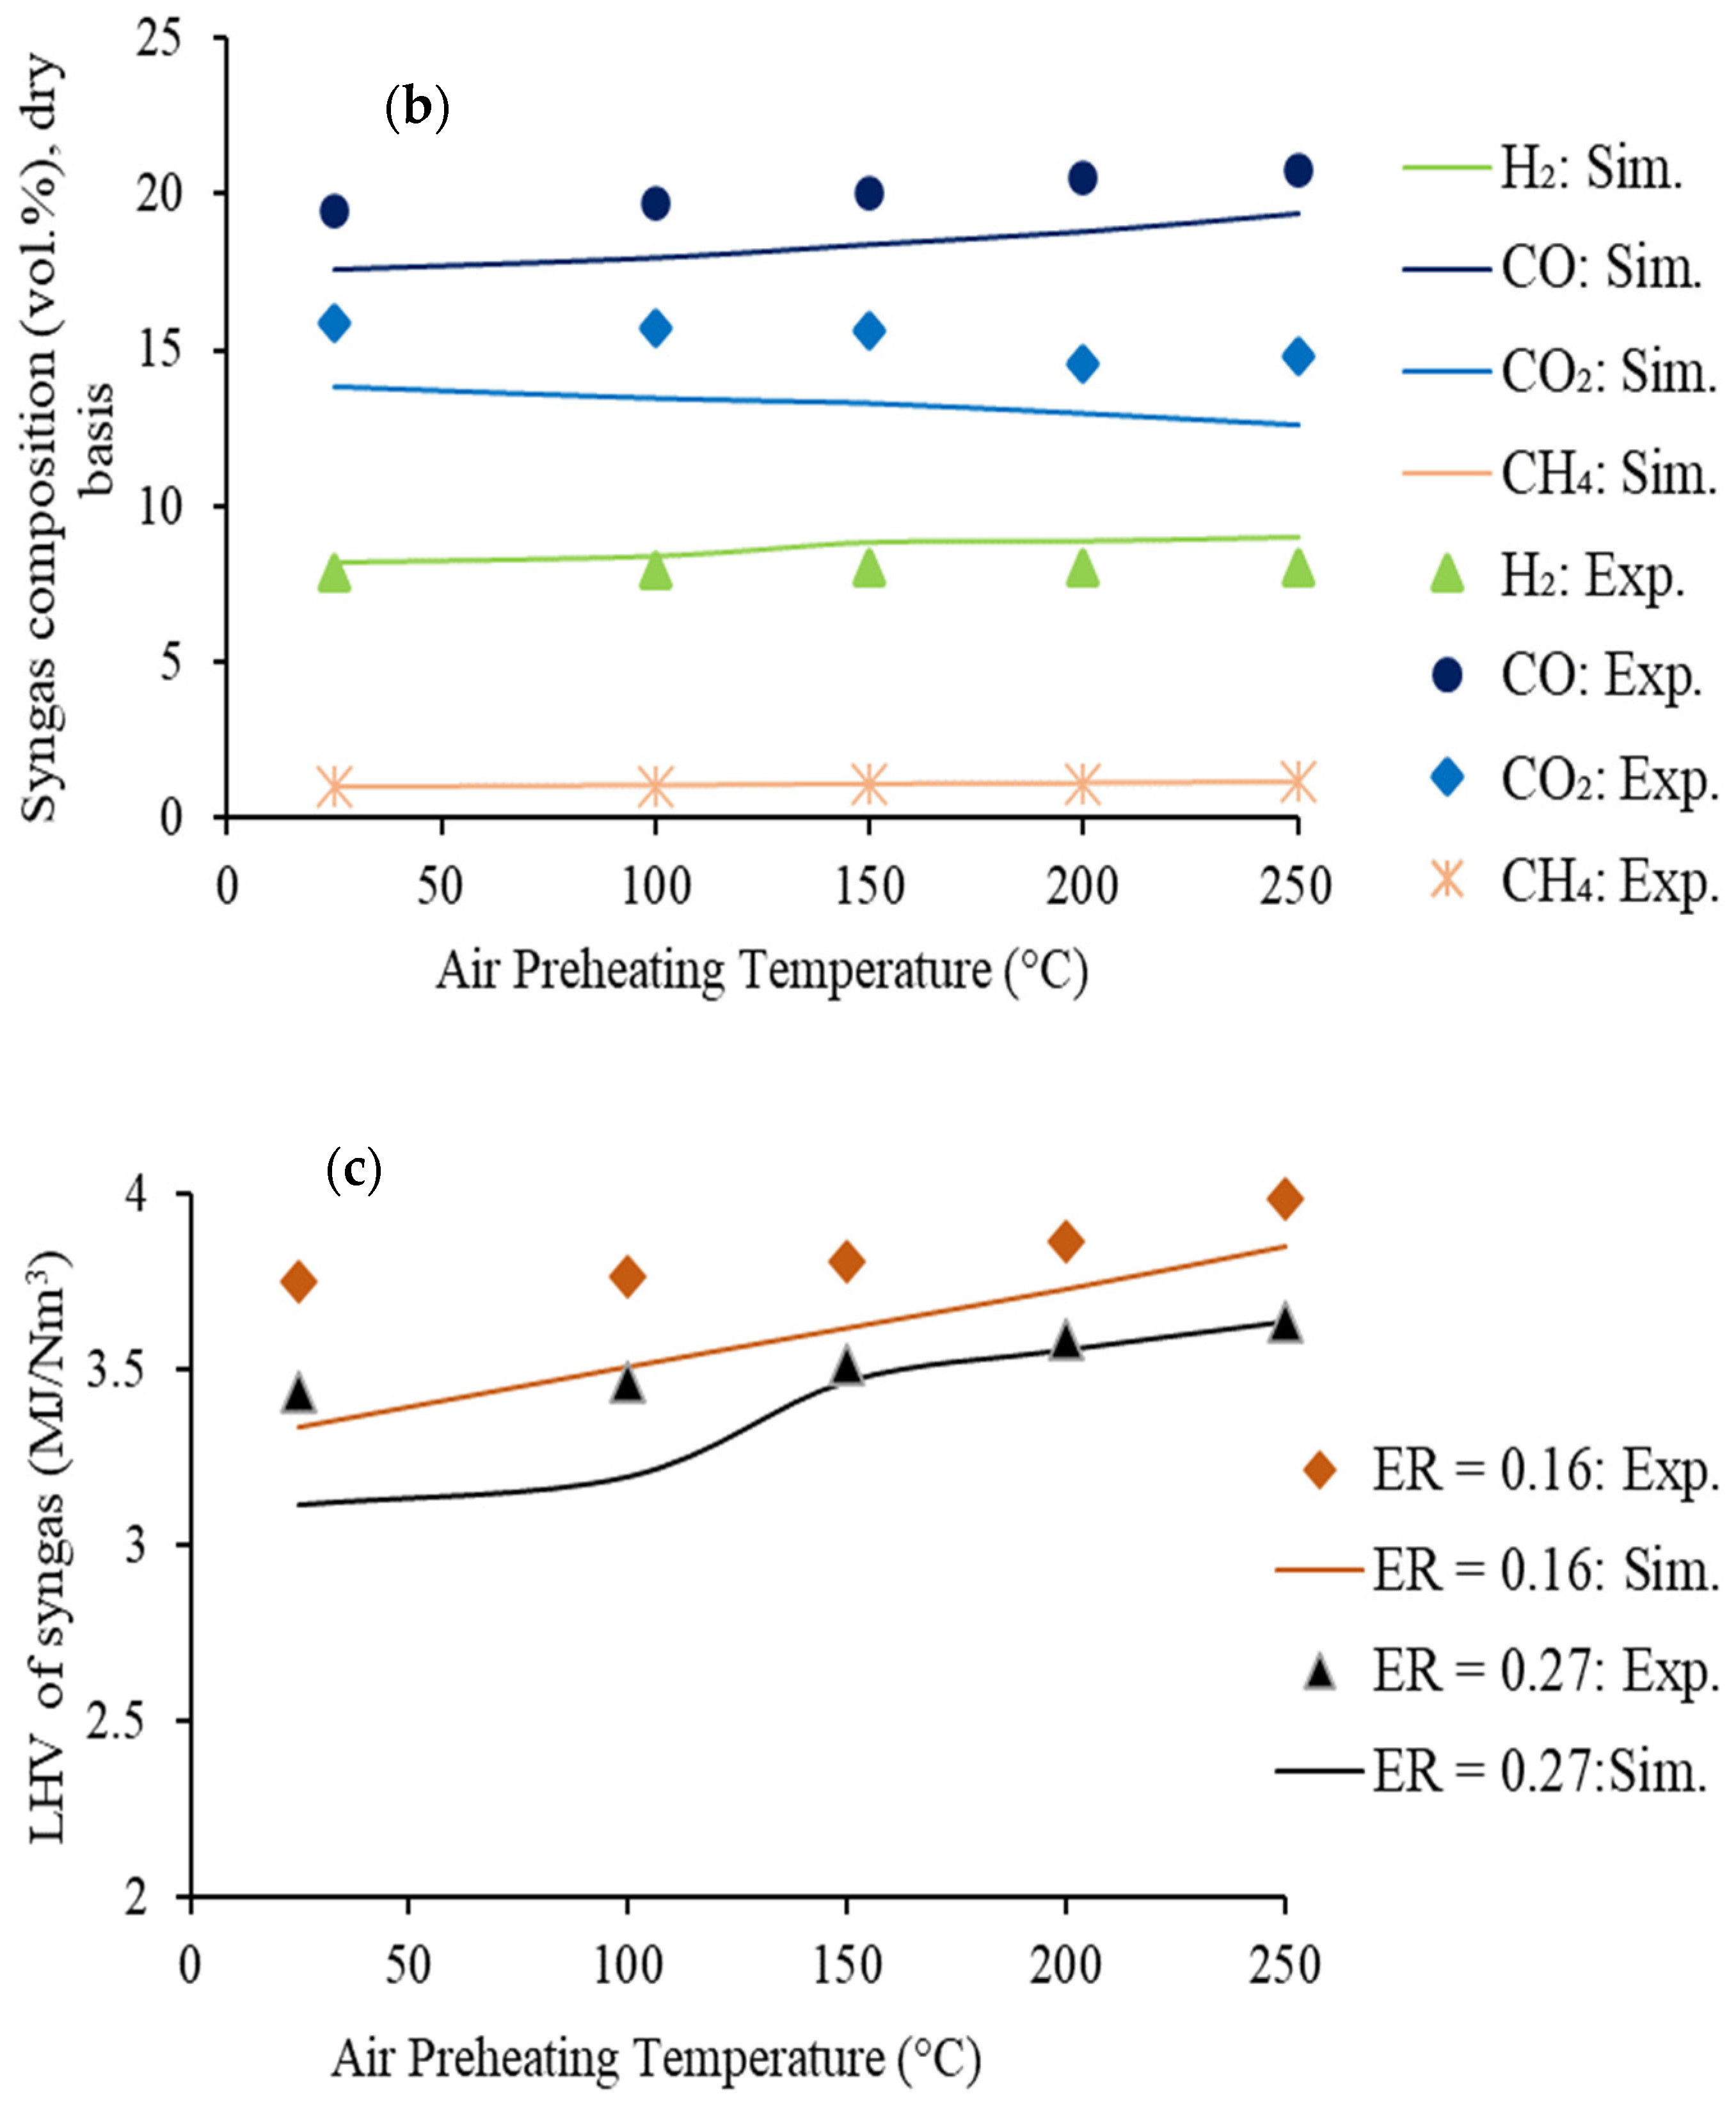
Calibration and Validation of Gasification Model

The reactions mentioned in Table 3, considered for the simulation of SS gasification, did not reach equilibrium for a unique temperature (gasification temperature) due to the distinct value of the equilibrium constants for each reaction. The movement of the equilibrium point of a chemical reaction in the forward or backward directions highly depends on temperature [66]. For this reason, the results related to syngas quality (composition), energy content (LHV), and conversion efficiencies (CCE and CGE), estimated through the equilibrium approach, significantly deviated from the experimental data [28,67]. However, the maximum deviation suggested for a model to argue for a reliable representation of experimental outcomes is ±20% [9,28,64]. As mentioned above, this condition was fulfilled by controlling the equilibrium position of individual gasification reactions to a particular temperature. The new equilibrium temperature assigned for each reaction completed in the block GASIFIER of the proposed conversion route illustrated in Figure 3 was calculated through a restricted chemical equilibrium approach according to Equation (1):
T E q l m = T G a s f + Δ T A p p r
where T E q l m   stands for the equilibrium temperature in °C, T G a s f   denotes gasification the temperature in °C, and Δ T A p p r   represents an approximate value of temperature in °C to inhibit the equilibrium position of each gasification reaction.
The deviation of the numerical results from experimental outcomes was calculated according to Equation (2):
D e v i a t i o n   % = S i m u l a t i o n   r e s u l t E x p e r i m e n t a l   r e s u l t E x p e r i m e n t a l   r e s u l t · 100
As the syngas was composed of different constituents, calculating its average deviation may have been of interest and was calculated as reported in Equation (3):
A v e r a g e   D e v i a t i o n   % = 1 N i = 1 N D e v i a t i o n  
where N is the number of the considered syngas component.
The gasification model was calibrated by considering the operating points and syngas properties under condition I depicted in Table 2, whereas conditions II to X were employed for the validation of the model.
The numerical value of Δ T A p p r (see Equation (1)) for each gasification reaction was identified by allocating a 5% standard deviation for each syngas component compared with the experimental campaign. The measured gasification (reduction zone) temperature for test condition I was 900 °C. The gasification temperature was used to identify the fraction of carbon converted to char that was burnt in the combustion zone to ensure autothermal operation. This was implemented in the model through an external Fortran subroutine.
Pearson’s correlation coefficient was evaluated according to Equation (4) to examine the strength of the linear relationship between the air preheating temperature (x) and gasification process response (y) of the syngas composition and LHV [68].
r x y = n x y x y n x 2 x 2 n y 2 y 2
where r x y is the correlation coefficient, x is the air preheating temperature, and y is the composition of the considered syngas components and the LHV of syngas.

3.2. Cogeneration Modeling

CHP cogeneration was simulated by counting the following assumptions [69]:
  • Steady-state condition;
  • Potential and kinetic energy remains unchanged, and pressure drops in the different blocks connected to complete the ICE system are neglected

3.3. Process Performance Evaluation

3.3.1. Gasification System

The parameters of the syngas LHV, CGE, CCE, and P ˙ n e t gained from the products generated through SS gasification were considered to predict the gasification process performance.
The LHV of syngas was assessed from the composition corresponding to Equation (5) [70]:
L H V s y n g ( MJ / Nm 3 ) = 0.108 y H 2 + 0.126 y CO + 0.358 y CH 4
where y H 2 ,   y CO ,   and   y CH 4   are the fractions of H₂, CO, and CH₄ by volume available in the syngas, respectively.
The ratio of the available energy exiting from the gasification reactor as syngas to the investment as SS was designated by CGE and was calculated based on Equation (6) [71]:
C G E   % = L H V s y n g   ·   V ˙ s y n g L H V S S   ·   m ˙ S S   · 100
where L H V s y n g   and   L H V S S   correspond to the LHV of the syngas in MJ/Nm3 and SS in MJ/kg, respectively, whereas V ˙ s y n g   and   m ˙ S S   are the syngas volumetric flow rate in Nm3/h and mass flow rate of SS in kg/h.
The fractional transformation by weight of the carbon content from the feed materials of SS to the product of syngas during the gasification process is CCE, and is expressed by Equation (7) [23]:
C C E % = 12 22.4   · V ˙ s y n g m ˙ S S   ·   C %   ·     i = 1 5 n i ·   y i   · 100
where i   represents the syngas carbon-containing component (CO, CO₂, and CH₄), C % represents the SS carbon portion by weight, n i represents the carbon number, and y i is the volume fraction of compound i   that exists in the syngas.
The discrepancy between the summation of primary power available in syngas and offered during syngas cooling and investment to complete air preheating to reach a specific temperature is P ˙ n e t , and is described in Equation (8):
P ˙ n e t = P ˙ s y n g + P ˙ s y n g c l P ˙ p r h t
where P ˙ s y n g and P ˙ s y n g c l are the primary power in kW offered by syngas and syngas cooling to the useable temperature for ICE, respectively, and P ˙ p r h t represents the thermal power demand in kW for air preheating.

3.3.2. Cogeneration System

The electrical ( η e l ) , thermal ( η t h ), and system ( η s y s ) efficiencies of the CHP system were determined according to Equations from (9) to (11), respectively.
η e l % = P ˙ E f f _ e l L H V S y n g   .     V ˙ s y n g   ·   100
η t h % = P ˙ t h L H V S y n g   .     V ˙ s y n g   ·   100      
η s y s % = P ˙ E f f _ e l + P ˙ s y n g c l + P ˙ t h L H V S S   .     m ˙ S S + P ˙ p r h t   ·   100
where P ˙ E f f _ e l represents the effective rate of electric power obtained from the ICE in kW, L H V S y n g   is the syngas LHV in kWh/Nm3, P ˙ t h is the rate of thermal power available (summation of both LT and HT thermal energy) in kW, P ˙ s y n g c l denotes the thermal power generation from syngas cooling in kW, L H V S S is the LHV of SS in kWh/kg, and P ˙ p r h t is the rate of power invested to complete air preheating in kW.

3.4. Cogeneration Process Simulation: Operating Parameters

The simulation of the CHP system fueled by syngas was completed by collecting the operating conditions of a real biomass gasification-based cogeneration plant, i.e., CMD–ECO20x where the gasification process was integrated with an ICE with a capacity of 20.0 kWel. These operating data are presented in Table 4 [36].

4. Results and Discussion

4.1. Development of Gasification Model

The gasification model was calibrated to identify the Δ T A p p r for each gasification reaction of test condition I by using built-in Aspen Plus regression tools, and the outcomes are shown in Table 5.
Considering the model calibration findings shown in Table 5, four reactions of those considered in the current simulations (R1, R3, R5, and R7) were stopped below the equilibrium temperature, whereas the other three (R2, R4, and R6) moved to above the equilibrium point. Finally, 8.79% of the carbon from SS moved to the combustion zone as char to ensure autothermal gasification.
The difference between the predicted syngas composition with the corresponding energy content (LHV) and experimental results is presented in Figure 4 for model calibration and in Figure 5 for validation.
The Pearson’s correlation between the air preheating temperature and composition of the syngas components for gasification at ER of 0.16 and 0.27 with syngas LHV is presented in Table 6.
Considering the results depicted in Table 6, the variables of the gasifying agent preheating temperature, the considered syngas components, and LHV had a strong correlation, as the correlation coefficient was higher than 0.8 for all cases [68,72].
The predicted ethane and propane are not presented in Figure 4 and Figure 5, as these two components were not identified during the experimental campaign.
As clearly shown from the comparative results predicted from the simulated model and experimental campaign presented in Figure 4 and Figure 5a–c, the numerical model represented the experimental outcomes with good agreement, as the deviation for the concentration of individual syngas components (varied in the range of −0.77% to 14.97%), as well as LHV (between 5.46% and 11.23%) of syngas, was lower than ± 15 % during model calibration and validation, satisfying the tolerable limit mentioned in the available literature of less than ± 20 % [9,64]. Hence the developed gasification model represented the experimental campaign accurately and efficiently. The syngas LHV was underpredicted due to the underestimation of the concentration of the syngas components of CO and CH4 from the experimental campaign outcomes, as these two constituents were the major contributors to the syngas LHV [70,73]. The higher ash content present in the examined SS sample was the main reason for the highest deviation in terms of CO and CO2 prediction through the formulated gasification model from the experimental campaign results [74]. However, the deviation of the individual syngas components with LHV from the experimental data was in the range of −0.77% to 14.97%, which was substantially lower compared with the other relevant literature, between 5.94 to 31.69% for the gasification model development related to SS, oil sludge, and Almond Shell [9,28,55,75,76].

4.2. Sensitivity Analysis

The alteration in syngas quality in terms of the composition, LHV, and gasification process performances of CGE, CCE, and P ˙ n e t with air preheating temperature and ER were analyzed to determine the optimum parameters for the examined SS sample. A mass flow rate of 27.78 g/s was considered in the analysis.

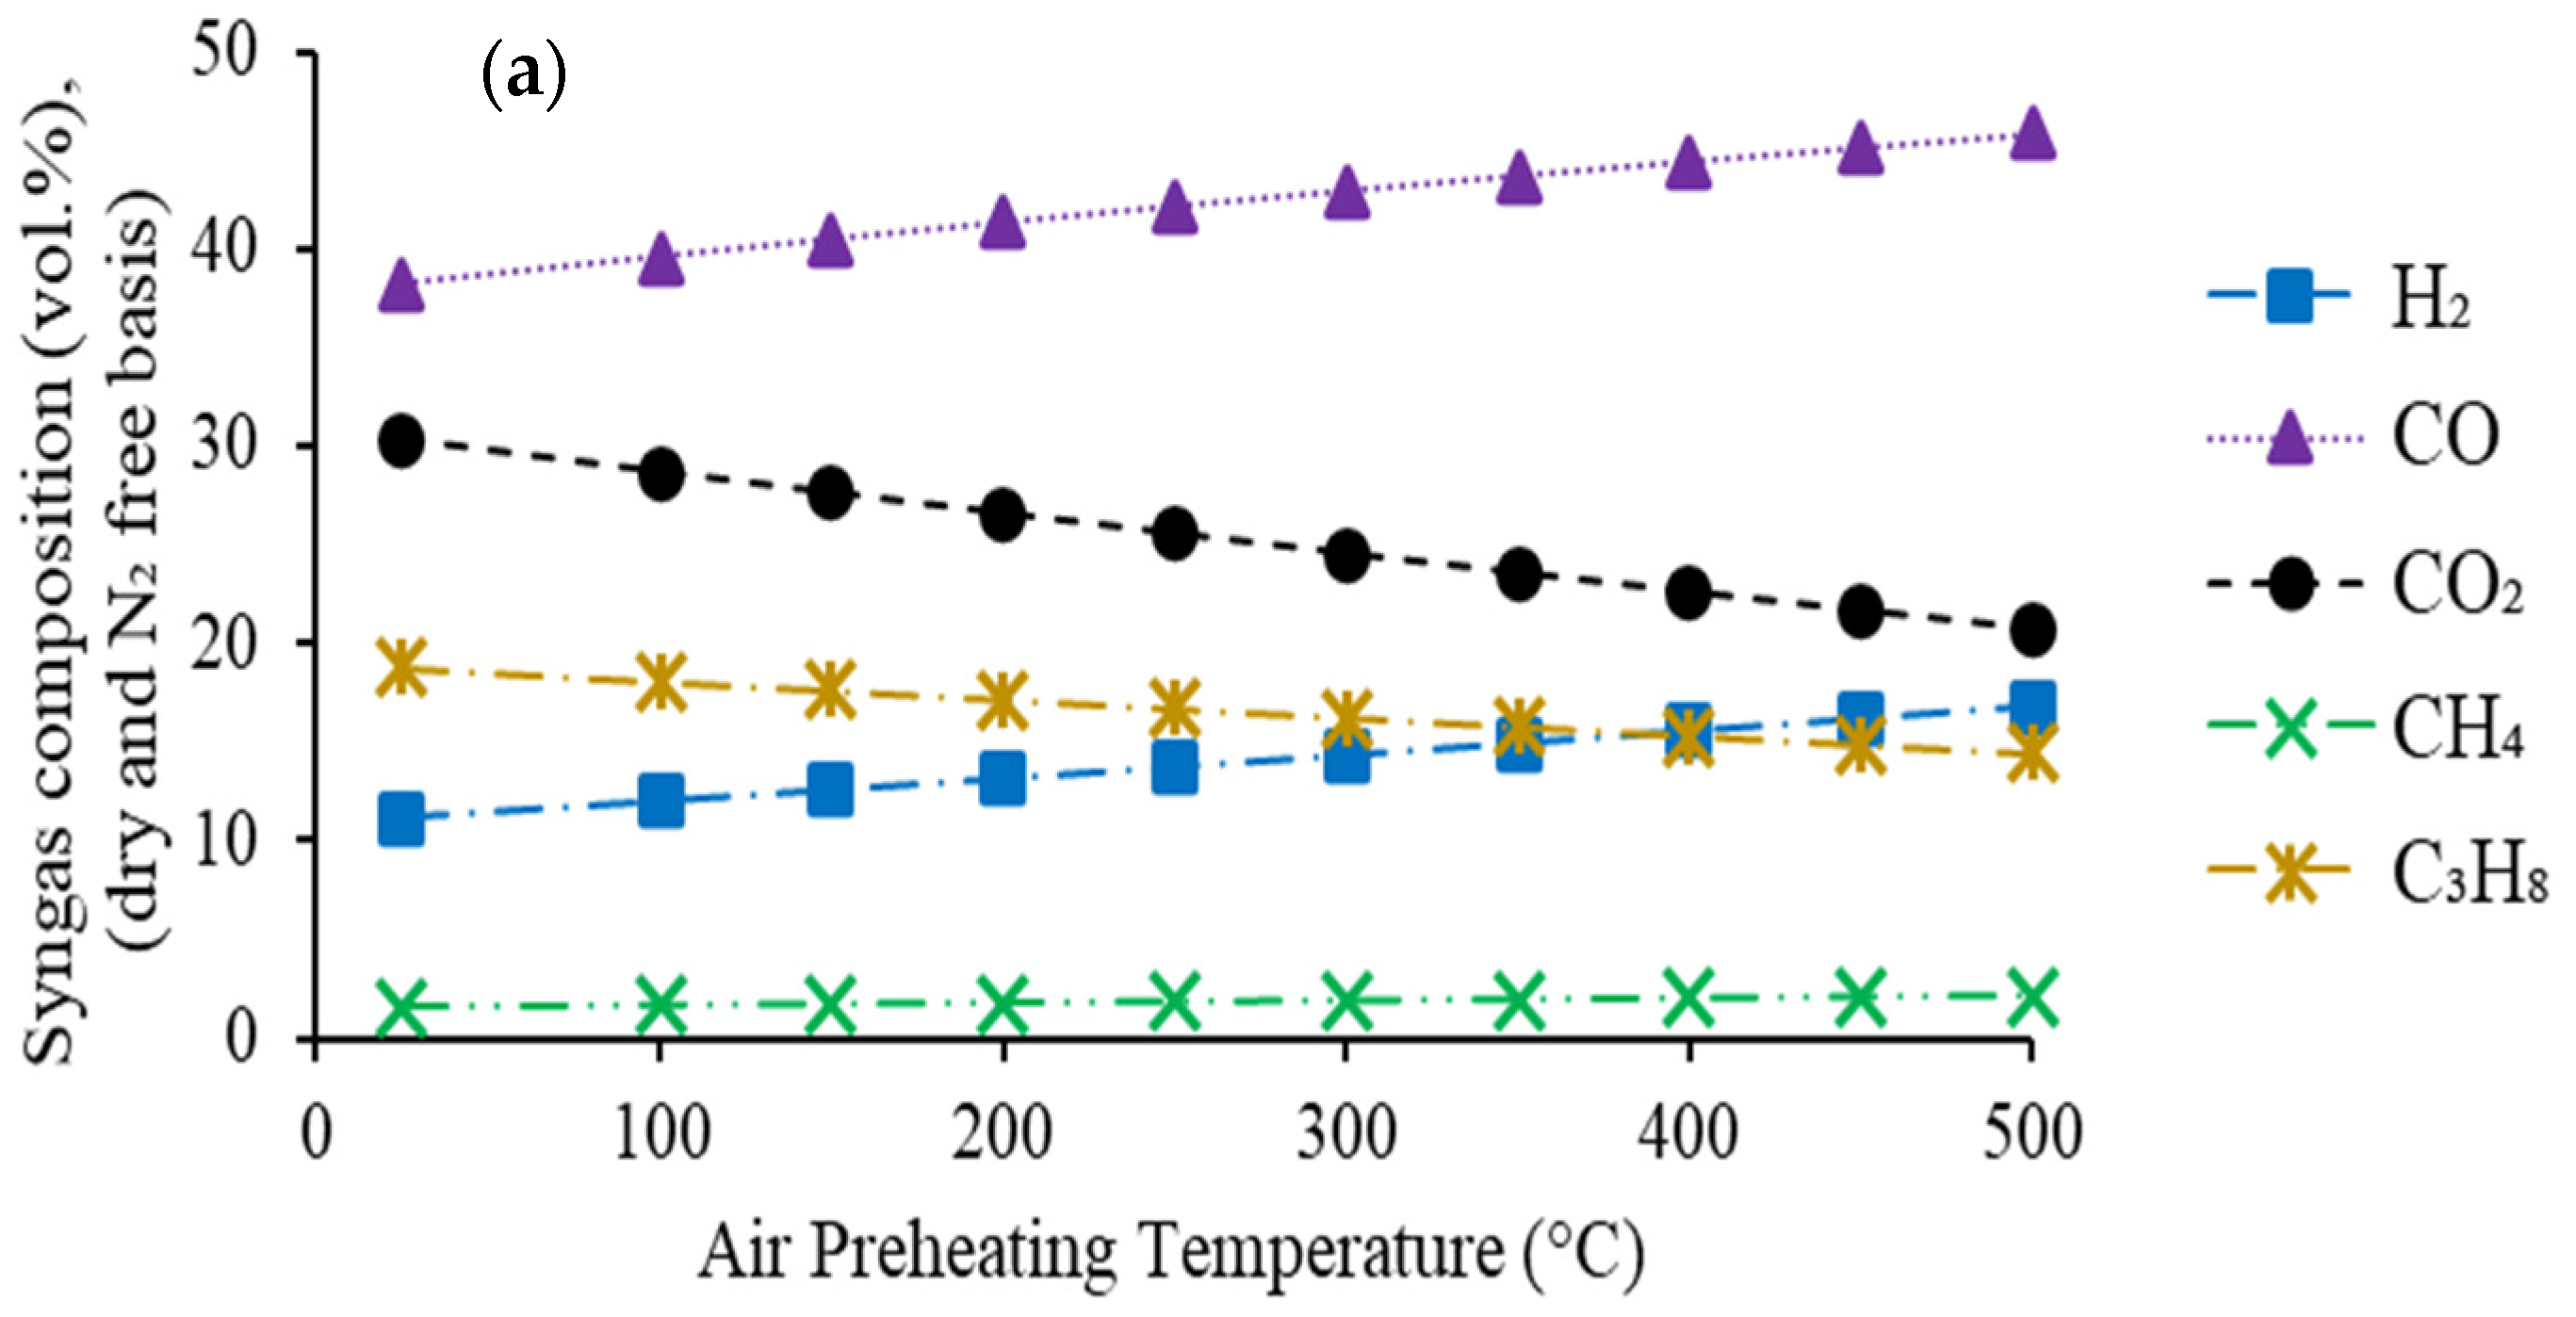
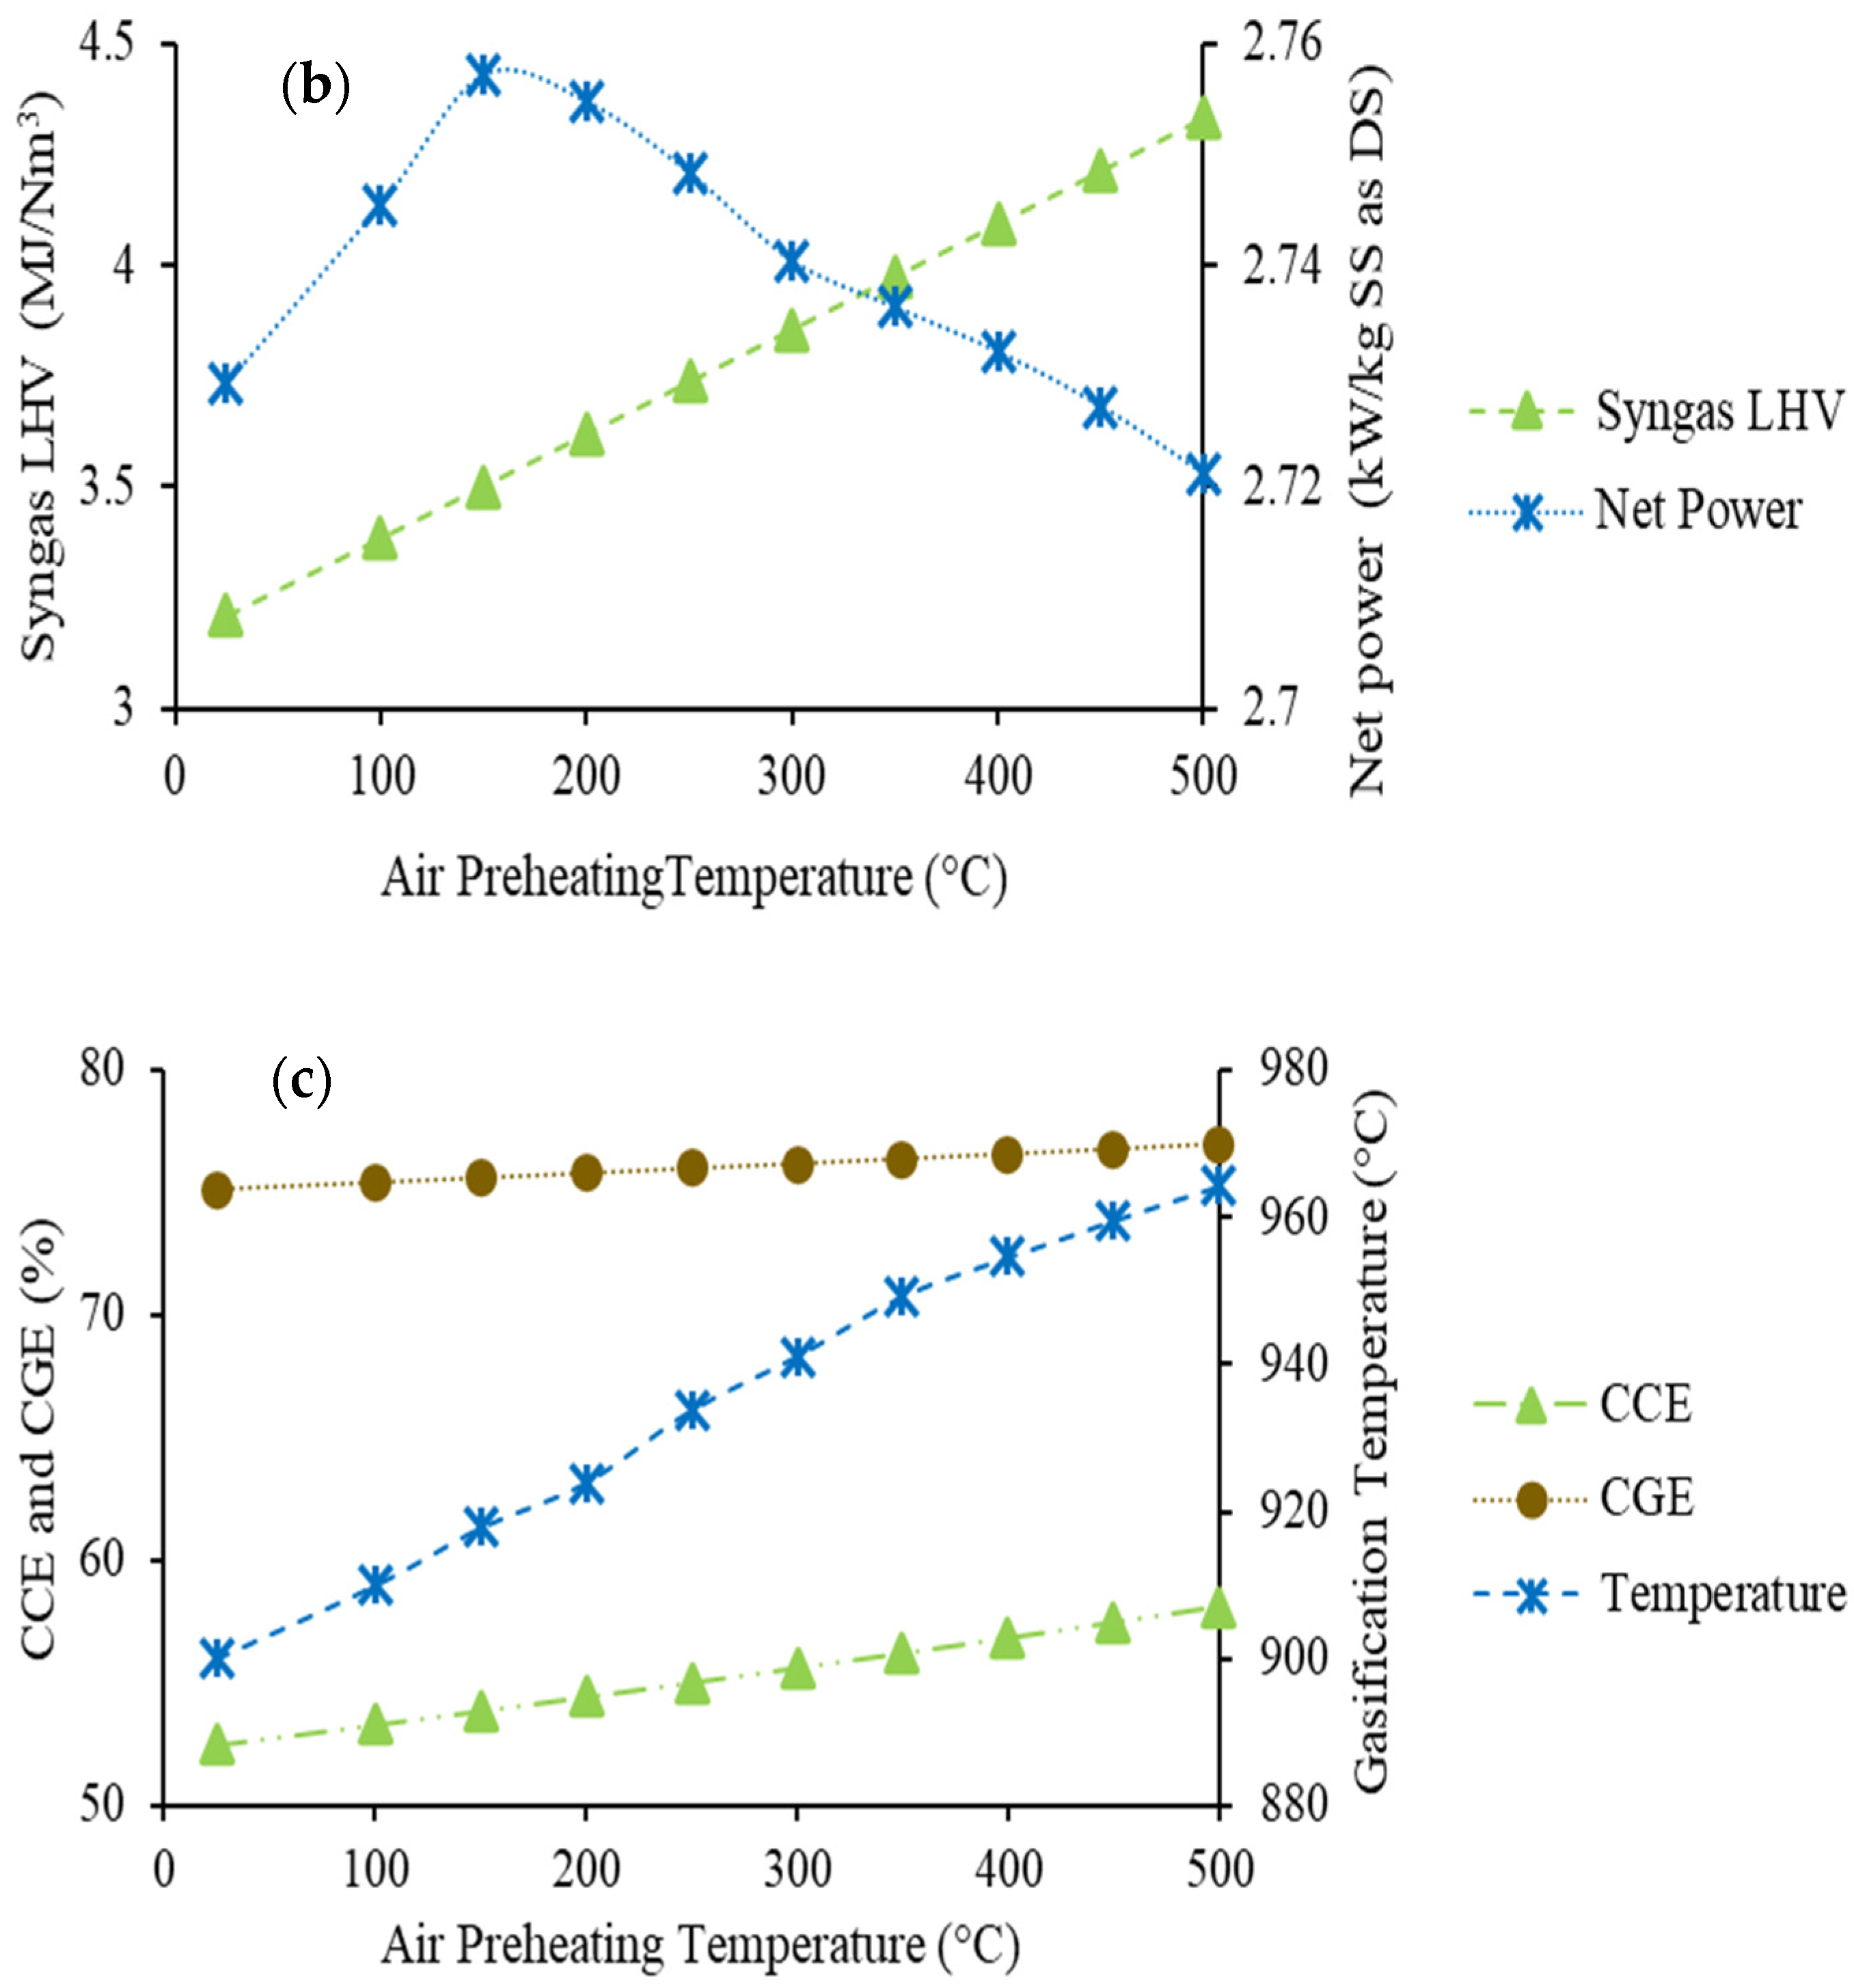
4.2.1. Effect of Air Preheating Temperature

The trend of syngas quality (composition and LHV) and gasification process performance ( P ˙ n e t , CCE, and CGE) with the air preheating temperature from room temperature (25 °C) to 500 °C was examined at a constant ER of 0.16. The results are illustrated in Figure 6.
As air preheating temperature increases:
-
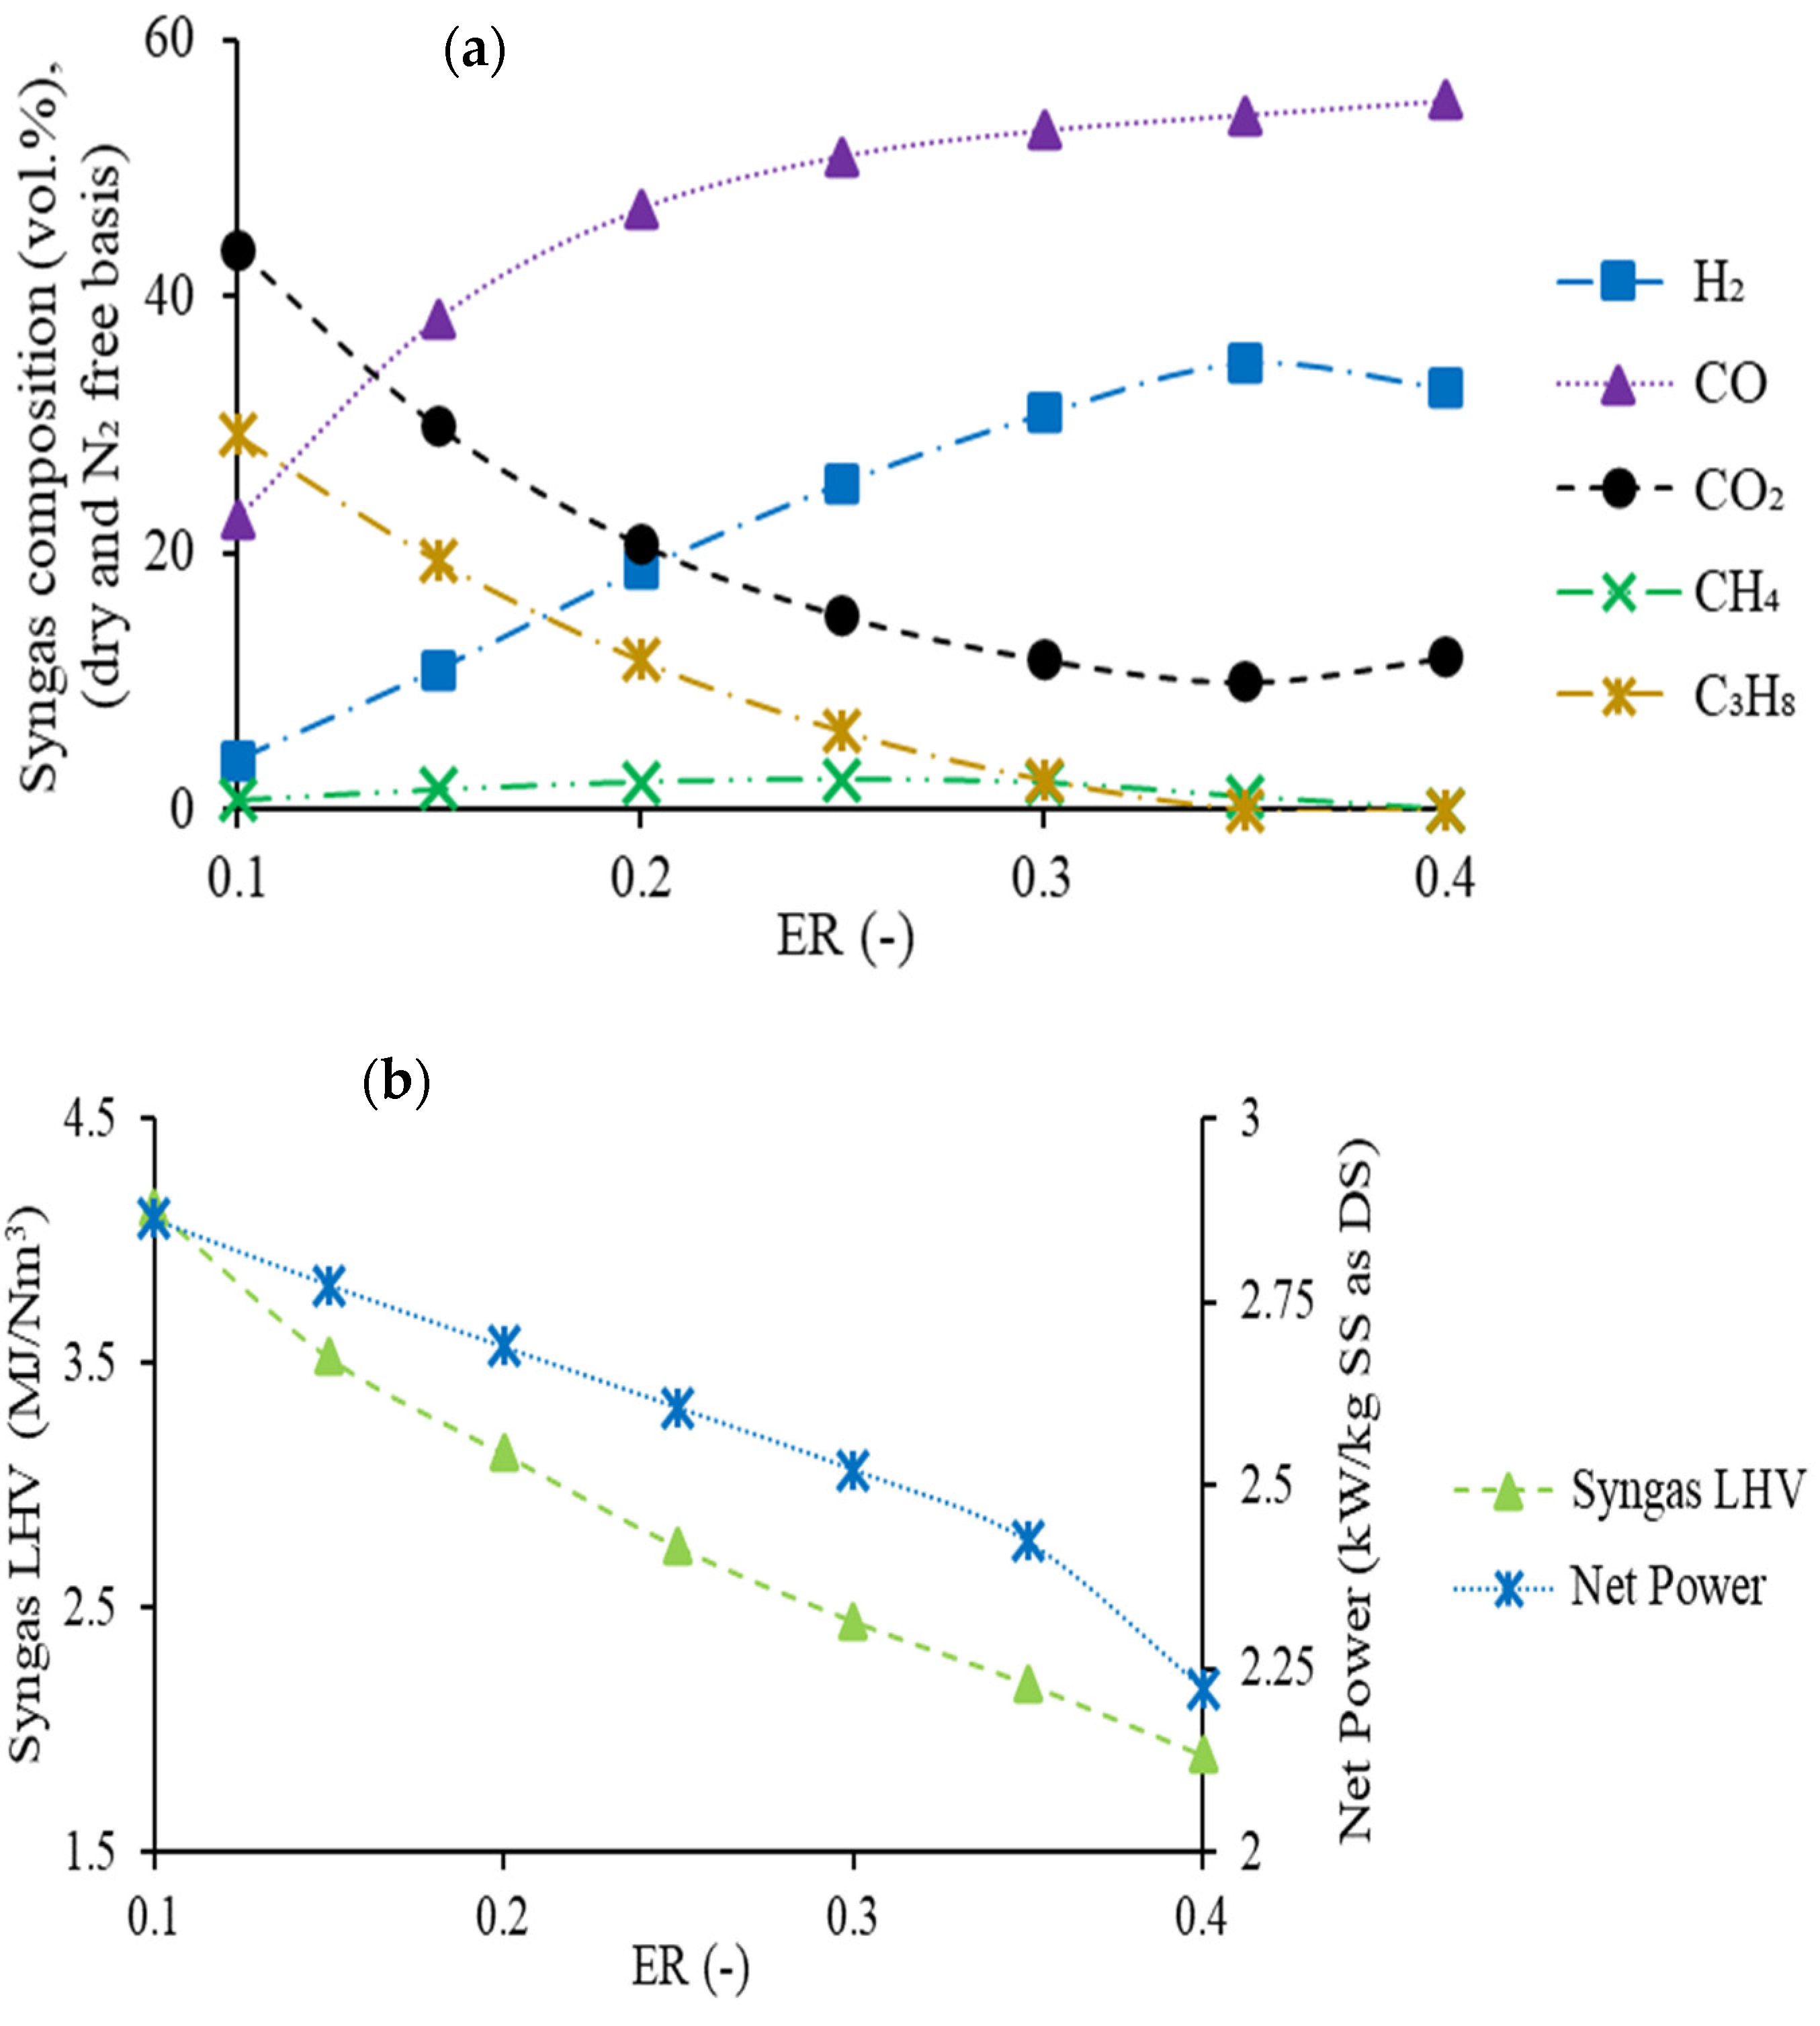
the concentration of two syngas components (CO and H2) in syngas increases continuously
-
the concentration of other two components (CO2 and C3H8) shows a decreasing trend
-
the concentration of CH4 shows a slowly increasing trend.
The fluctuation of syngas composition with incoming air temperature is explained by the change in exothermic and endothermic reaction rates [9,55,76,77]. The uninterrupted reduction of CO2 and C3H8 composition is explained by the backward movement of exothermic reactions (propane formation and combustion reactions) with air preheating temperature. This occurs due to a fixed quantity of char (8.79% of carbon present in SS) combusted to ensure the autothermal mode of gasification which is independent of operating parameters. On the other hand, the endothermic reactions (water gas and water gas shift) rate raises with air preheating temperature, causing the increase of CO and H₂ composition in syngas [33,78].
Syngas LHV continuously increases with air preheating temperature as the concentration of H2, CO, and CH4 raises as shown in Figure 6a [70,73]. Consequently, the energy content of syngas increases as well as gain from syngas cooling to ambient temperature (30 °C), and the thermal power needed for air preheating also increases. The trend of P ˙ n e t   reflects these three aspects, thus it increases up to an air preheating temperature of 150 °C and decreases further. Indeed, the increase in energy gain for air preheating temperatures from 150 to 200 °C does not compensate for the increase in thermal power demand.
CGE increased with air preheating temperature due to the increase in syngas energy content [23], as presented in Figure 6b. The cumulative increment in the carbon fractions of the syngas through the formation of CO and CH4 with air preheating temperature was greater compared with the decrement by CO2 and C3H8 concentration decrement, as illustrated in Figure 6a. Subsequently, a continuous increment in CCE was observed with air preheating temperature. The gasification temperature increased continuously with the air preheating temperature due to the increase in the endothermic reaction rate [55,76,77]. This was due to the fixed quantity of char being combusted to ensure the autothermal mode of gasification.
Based on the simulation results presented in Figure 6, the predicted optimum air preheating temperature was 150 °C because a further increase caused a reduction in the available P ˙ n e t during energy recovery from SS through gasification treatment in the autothermal operation mode.

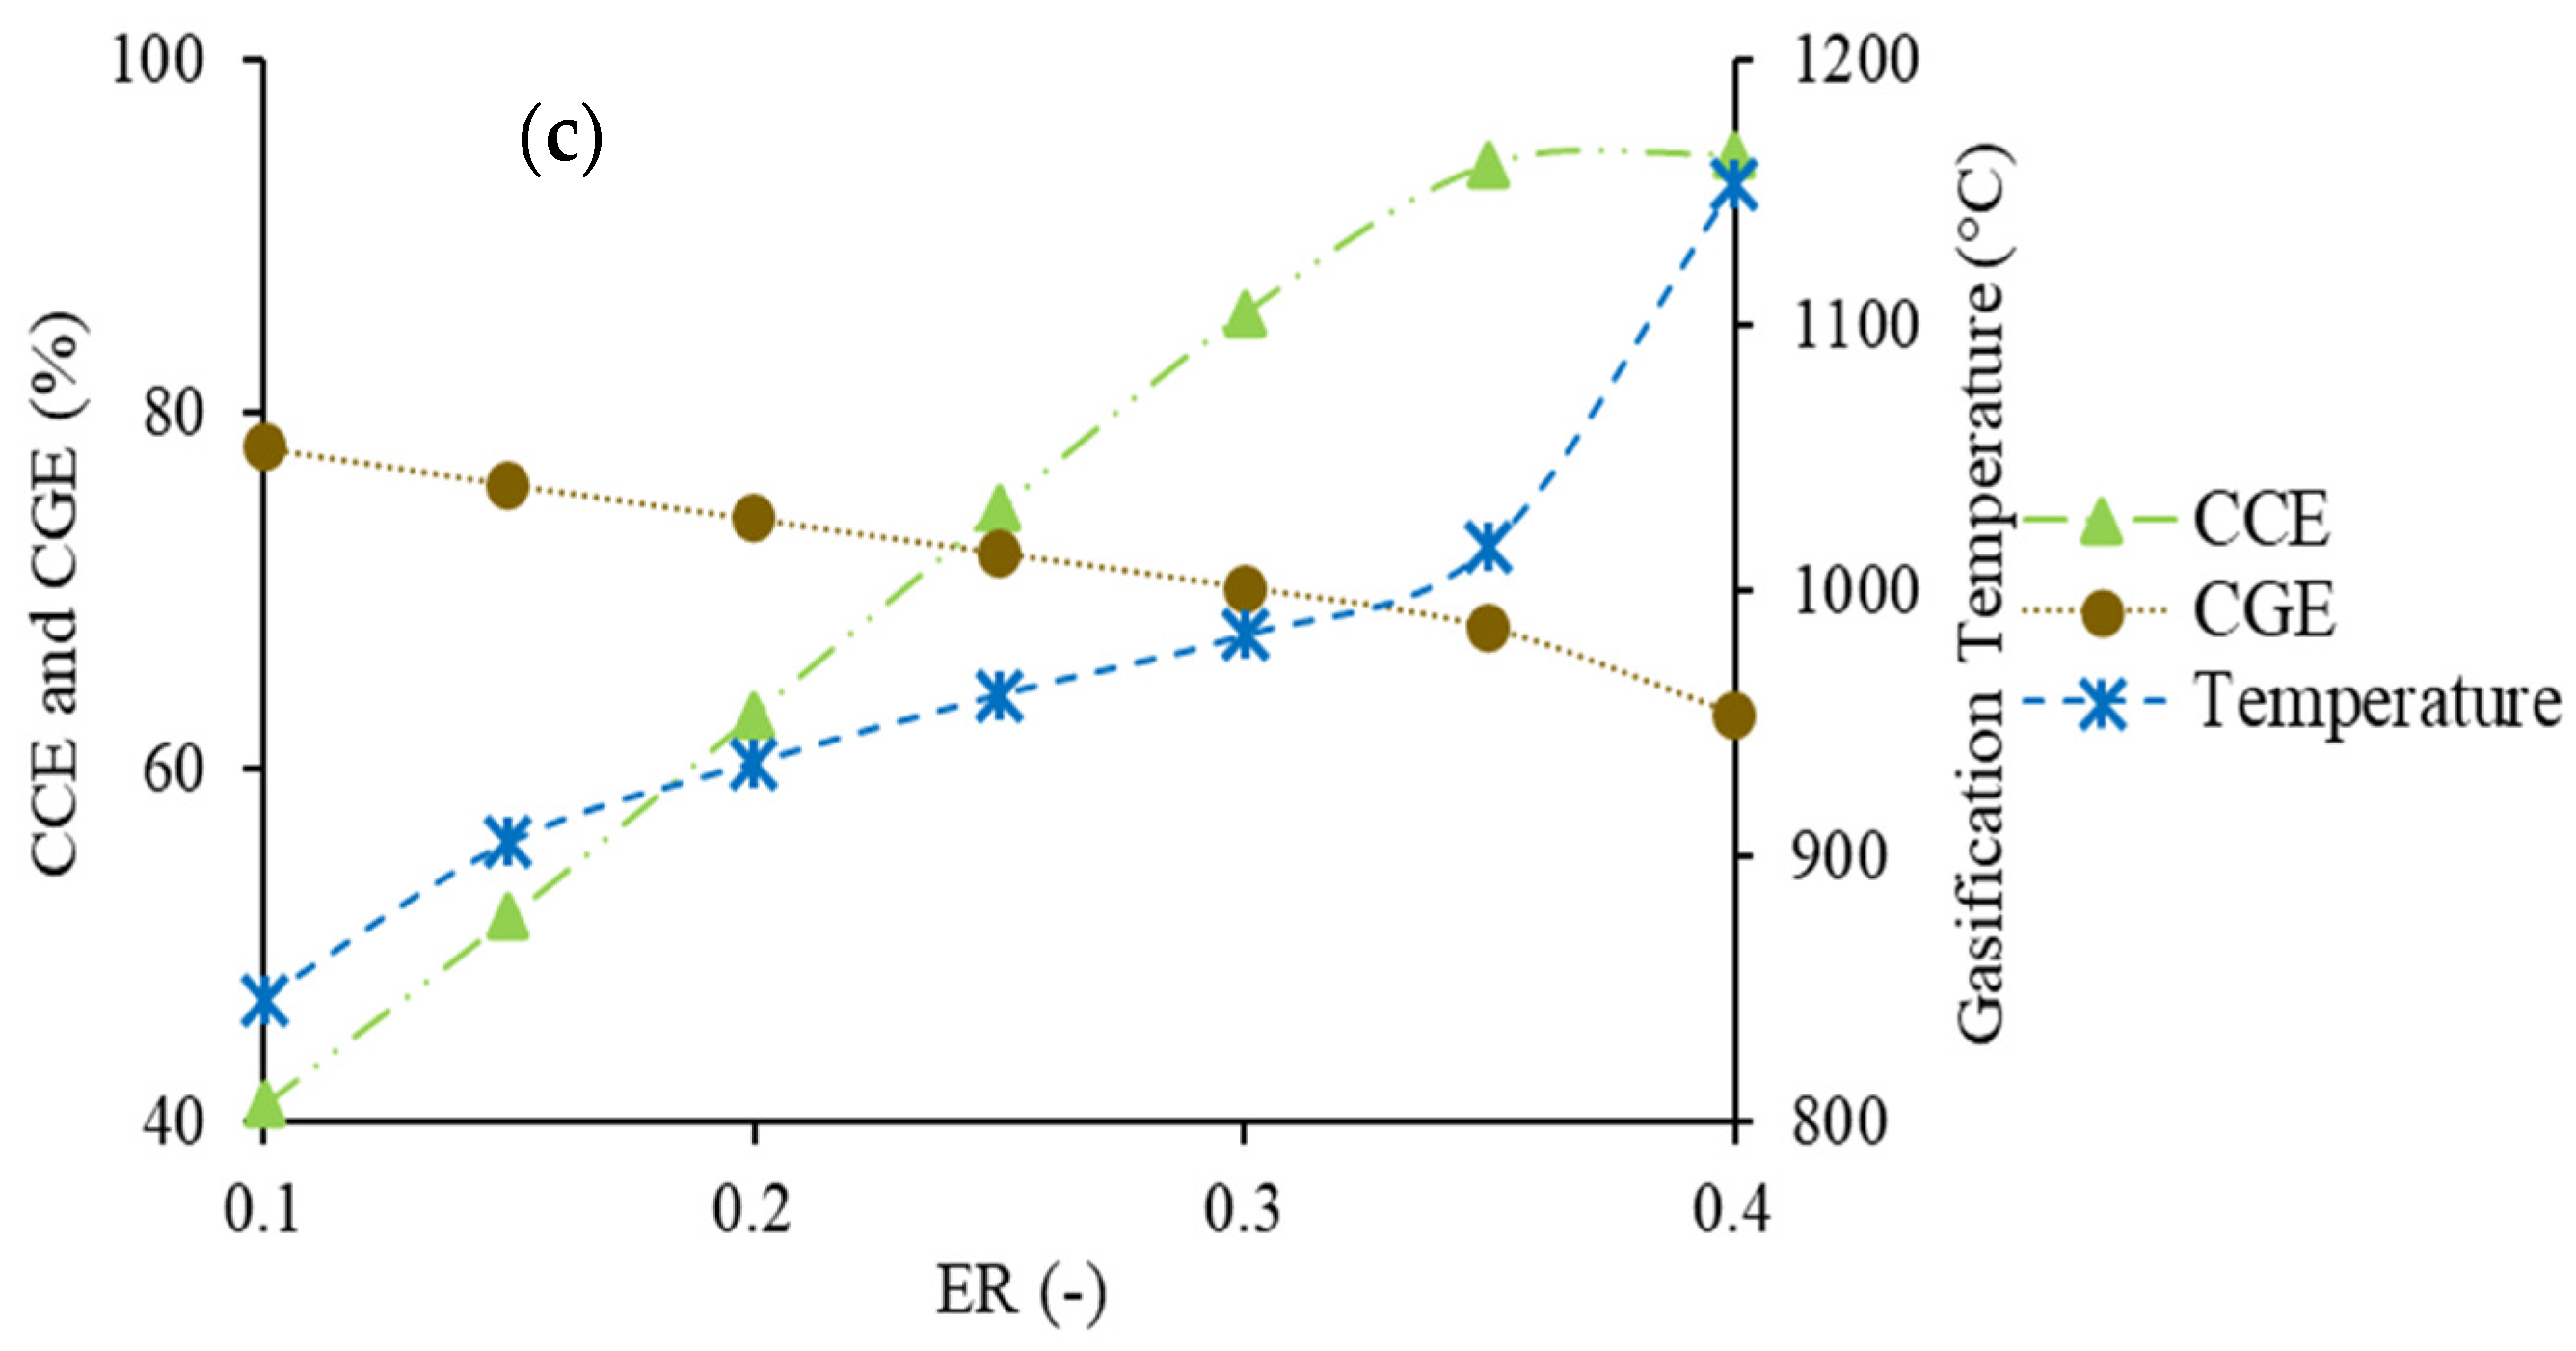
4.2.2. Influence of the Equivalence Ratio

The effect of varying ER between 0.1 and 0.4 of the individual syngas components’ concentration, LHV, CCE, CGE, P ˙ n e t , and gasification temperature was examined at an estimated ideal air preheating temperature of 150 °C. The outcomes are depicted in Figure 7.
Increasing the ER caused a continuous increase in the oxygen concentration inside the gasifier, which drives drove the onward movement of the combustion reaction to lessen the impact, which was fully described by Le Chatelier’s principle [60]. Consequently, the product concentration involved in the combustion reactions (CO2 and H2O) grew continuously, whereas a reverse pattern was visible for the reactant concentrations of C3H8, H2, and CH4. The reaction rate of the water gas, water gas shift, and steam methane reforming reactions increased with an increase in the CO2 and H2O concentrations, which drove the increase in the concentrations of the syngas components of CO, H2, CH4, [33,65,78]. A reverse trend was observed for CO2.
The syngas LHV decreased steadily with ER as N₂ entrance to the gasifier increased, which created a dilution effect and was responsible for the continuous decrease in the syngas energy content [60,79,80]. On the other hand, P ˙ n e t decreased continuously with ER due to the decrease in the available primary power (LHV) obtained from the syngas. At the same time, the thermal power needed to complete air preheating increased due to the increase in the incoming air volume. Although the incoming air volume increased, the power obtained from syngas cooling increased very slowly with ER. The gasification efficiency in terms of CGE decreased with ER due to the decrease in the syngas energy content [23]. The combustion reaction rate increased with ER; consequently, more carbon was transformed from the feed to the products, causing an increase in CCE. The increase in ER during SS gasification in the autothermal mode was responsible for the increase in the gasification temperature due to the forward movement of oxidation reactions, which were exothermic and generated more heat inside the gasifier [55,76,77].
A minimum value of 0.2 was predicted as an ideal ER to generate syngas from SS via gasification, although the syngas LHV, P ˙ n e t , and CGE were higher at an ER of 0.15. However, the conversion of SS to syngas at an ER of <0.20 favored the pyrolysis reaction, instead of gasification, and was liable for the formation of more tar, ash, and other impurities [9,31,76]. The complete removal of these pollutants from syngas, which is mandatory before further utilization in ICEs or chemical synthesis, would be more costly compared with the net power increase for the gasification of SS at ER of 0.15, instead of 0.20 [38].
The effect of air preheating temperature and ER on syngas quality in terms of composition, LHV, and process performances (CCE and CGE) predicted in the present analysis was in accordance with the available literature related to syngas generation from SS or waste biomass [9,28,29,30,31,43,55,60,75,76,79,80,81,82,83].

4.3. Cogeneration Process Performances

The evaluated electrical and thermal power generation potentiality of the SS used in the current study were 0.81 kWel/kg SS as DS and 1.73 kWth/kg SS as DS (of which 0.39 kW was HT and 1.34 kW was LT thermal power), respectively. The comparison between CGE, η e l , η t h , and η s y s predicted from the present analysis with the available literature on similar simulation studies is presented in Table 7.
The predicted emission profile from ICE contained pollutants, as follows: CO₂ = 1.36 kg/kWel; SO2 = 0.039 kg/kWel, and NOx = 0.015 kg/kWel.
The conversion of SS to electrical and thermal energy through the proposed system could reduce the use of fossil fuels to generate CHP for the wastewater treatment sector, which is highly energy-consuming, especially in terms of electricity.
According to the International Energy Agency data, the national electrical energy demand in Poland in 2019 was equal to 166 TWh. WWTPs consume around 1% of the national electricity demand in EU countries [86]. The transformation of the energy content present in all of the produced SS in Poland in 2019 (575 kt as DS, according to the Eurostat data) to CHP through the proposed treatment scheme would allow supplying 30% of the electrical energy consumption of wastewater treatment and 54% of the thermal energy required for the drying of mechanically dewatered SS [9]. Thus, in terms of environmental impact, 1.97 Mt of equivalent CO₂/yr would be saved over a similar amount of CHP generation using natural gas.
Such an aspect appears to be particularly important in Poland, where the national energy demand is mainly supplied by coal and the share of renewables in the gross final energy consumption is only 16.1% against 22.1% of EU–27.
The main challenge of the energy generation from SS through the proposed system is decreasing organic (tar) and inorganic (hydrogen sulfide, hydrogen chloride, and alkali metals) pollutants formation or their removal from the generated syngas through a gasification process. The tar, HCl, H₂S, and alkali metal contents in the syngas produced in the gasification of SS could be further reduced by selecting a suitable catalyst, optimizing the operating parameters and reactor configuration, or the filtration of the syngas [87,88,89]
Life-cycle assessment and the economic analysis of the proposed system were not within the scope of the present work; however, these aspects will be investigated in future analysis to evaluate the environmental and economic benefits of the proposed plant for the valorization of SS to energy products. Moreover, the gasification simulation model will be extended to account for the tar content.

5. Conclusions

An experimental campaign was conducted in a fixed-bed updraft gasifier to complete the energy recovery from SS as syngas through air gasification in the autothermal mode. SS gasification was carried out at two different ERs of 0.16 and 0.27 and five distinct air preheating temperatures of 25, 100, 150, 200, and 250 °C. A computer-aided numerical model in Aspen Plus V8.8 was calibrated based on the experimental data obtained at an air preheating temperature and ER of 25 °C and 0.16, respectively, and validated at nine different operating conditions. The impact of air the preheating temperature and ER on the syngas composition and energy content, as well as on the process performances of CCE, CGE, and P ˙ n e t obtained from the gasification treatment, was analyzed to identify the optimum operating parameters, which were found to be 150 °C and at least 0.2, respectively. Further, an ICE fueled by the produced syngas was modeled to assess the CHP generation potential, finding 0.81 kWel/kg SS as DS and 1.73 kWth/kg SS as DS of electrical and thermal power, respectively. The ICE emission profiles were predicted to estimate the concentration of pollutants.
The work carried out allows assessing syngas production from SS that, as a renewable source, may contribute to decreasing fossil fuel dependency. Considering Poland as an example, if all the produced SS in 2019 was used for energy recovery, it would cover 30% of the electricity demand of the wastewater treatment sector and 54% of the thermal energy required to decrease the moisture content of mechanically dewatered SS to the gasification standard (from 70 wt.% to 10 wt.%), saving 1.97 Mt of equivalent CO2/yr over the natural gas power CHP-generation technique needed to cover the same energy loads.

Author Contributions

Conceptualization, A.C., S.D.F., N.M., S.S., M.R.U. and L.V.; methodology, S.D.F. and M.R.U.; validation, S.D.F. and M.R.U.; formal analysis, S.D.F. and M.R.U.; investigation, S.D.F., N.M. and M.R.U.; resources, S.D.F. and M.R.U.; data curation, S.D.F. and M.R.U.; writing—original draft preparation, M.R.U.; writing—review and editing, A.C., S.D.F., N.M., S.S., L.V. and S.W.; visualization, S.D.F. and M.R.U.; supervision, S.D.F. and N.M. All authors have read and agreed to the published version of the manuscript.

Funding

This research received no external funding.

Conflicts of Interest

The authors declare no conflict of interest.

References

  1. IEA Key World Energy Statistics 2021, IEA, Paris. Available online: https://www.iea.org/reports/key-world-energy-statistics-2021 (accessed on 12 December 2022).
  2. Ritchie, H.; Roser, M. Energy. Available online: https://ourworldindata.org/energy (accessed on 10 January 2022).
  3. Roser, M. Future Population Growth. Available online: https://ourworldindata.org/future-population-growth (accessed on 13 December 2022).
  4. Londoño-Pulgarin, D.; Cardona-Montoya, G.; Restrepo, J.C.; Muñoz-Leiva, F. Fossil or bioenergy? Global fuel market trends. Renew. Sustain. Energy Rev. 2021, 143, 110905. [Google Scholar] [CrossRef]
  5. Sharma, P.; Sivaramakrishnaiah, M.; Deepanraj, B.; Saravanan, R.; Reddy, M.V. A novel optimization approach for biohydrogen production using algal biomass. Int. J. Hydrogen Energy 2022, in press. [CrossRef]
  6. Hossain, M.S.; ul Karim, T.; Onik, M.H.; Kumar, D.; Rahman, M.A.; Yousuf, A.; Uddin, M.R. Impact of temperature, inoculum flow pattern, inoculum type, and their ratio on dry anaerobic digestion for biogas production. Sci. Rep. 2022, 12, 6162. [Google Scholar] [CrossRef]
  7. Uddin, M.N.; Salam, M.A.; Uddin, M.R.; Khan, M.R. Biodiesel from Nahor Seed Oil: Synthesis, Evaluation, and Compatibility with Petrodiesel. Pet. Chem. 2022, 62, 1211–1222. [Google Scholar] [CrossRef]
  8. IEA Global Energy Review: CO2 Emissions in 2020, IEA, Paris. Available online: https://www.iea.org/articles/global-energy-review-co2-emissions-in-2020 (accessed on 12 December 2022).
  9. Di Fraia, S.; Massarotti, N.; Uddin, M.R.; Vanoli, L. Conversion of Sewage Sludge to combined heat and power: Modeling and optimization. Smart Energy 2021, 5, 100061. [Google Scholar] [CrossRef]
  10. European Commission Environmental, Economic and Social Impacts of the Use of Sewage Sludge on Land. Consult. Rep. Options Impacts, Rep. by RPA. Milieu Ltd. WRc Eur. Comm. DG Environ. Under Study Contract DG ENV.G.4/ ETU/2008/0076r. 2009, pp. 1–20. Available online: https://www.efar.be/wp-content/uploads/Draft-Impact-Assessment-Sludge-Directive.pdf (accessed on 10 December 2022).
  11. Mininni, G.; Mauro, E.; Piccioli, B.; Colarullo, G.; Brandolini, F.; Giacomelli, P. Production and characteristics of sewage sludge in Italy. Water Sci. Technol. 2019, 79, 619–626. [Google Scholar] [CrossRef] [PubMed]
  12. Monte, M.C.; Fuente, E.; Blanco, A.; Negro, C. Waste management from pulp and paper production in the European Union. Waste Manag. 2009, 29, 293–308. [Google Scholar] [CrossRef] [Green Version]
  13. Lenssen, N.J.L.; Schmidt, G.A.; Hansen, J.E.; Menne, M.J.; Persin, A.; Ruedy, R.; Zyss, D. Improvements in the GISTEMP Uncertainty Model. J. Geophys. Res. Atmos. 2019, 124, 6307–6326. [Google Scholar] [CrossRef]
  14. European Commission. European Green Deal : Commission Proposes Transformation of EU Economy and Society to Meet Climate Ambitions. 2021. Available online: https://commission.europa.eu/strategy-and-policy/priorities-2019-2024/european-green-deal/delivering-european-green-deal_en (accessed on 15 December 2022).
  15. Eurostat Sewage Sludge Generation and Management. Available online: https://appsso.eurostat.ec.europa.eu/nui/submitViewTableAction.do (accessed on 30 January 2022).
  16. Eurostat Population Projection. Available online: https://ec.europa.eu/eurostat/statistics-explained/index.php?oldid=497115#Population_projections (accessed on 27 July 2022).
  17. Liu, X.; Chang, F.; Wang, C.; Jin, Z.; Wu, J.; Zuo, J.; Wang, K. Pyrolysis and subsequent direct combustion of pyrolytic gases for sewage sludge treatment in China. Appl. Therm. Eng. 2018, 128, 464–470. [Google Scholar] [CrossRef]
  18. Zaker, A.; Chen, Z.; Zaheer-Uddin, M. Catalytic pyrolysis of sewage sludge with HZSM5 and sludge-derived activated char: A comparative study using TGA-MS and artificial neural networks. J. Environ. Chem. Eng. 2021, 9, 105891. [Google Scholar] [CrossRef]
  19. Miricioiu, M.G.; Zaharioiu, A.; Oancea, S.; Bucura, F.; Raboaca, M.S.; Filote, C.; Ionete, R.E.; Niculescu, V.C.; Constantinescu, M. Sewage sludge derived materials for CO2 adsorption. Appl. Sci. 2021, 11, 7139. [Google Scholar] [CrossRef]
  20. Carotenuto, A.; Di Fraia, S.; Massarotti, N.; Sobek, S.; Uddin, M.R.; Vanoli, L.; Werle, S. Predictive modeling for energy recovery from sewage sludge gasification. Energy 2023, 263, 125838. [Google Scholar] [CrossRef]
  21. Vishwajeet; Pawlak-Kruczek, H.; Baranowski, M.; Czerep, M.; Chorążyczewski, A.; Krochmalny, K.; Ostrycharczyk, M.; Ziółkowski, P.; Madejski, P.; Mączka, T.; et al. Entrained Flow Plasma Gasification of Sewage Sludge–Proof-of-Concept and Fate of Inorganics. Energies 2022, 15, 1948. [Google Scholar] [CrossRef]
  22. Seggiani, M.; Vitolo, S.; Puccini, M.; Bellini, A. Cogasification of sewage sludge in an updraft gasifier. Fuel 2012, 93, 486–491. [Google Scholar] [CrossRef]
  23. Jeong, Y.S.; Choi, Y.K.; Park, K.B.; Kim, J.S. Air co-gasification of coal and dried sewage sludge in a two-stage gasifier: Effect of blending ratio on the producer gas composition and tar removal. Energy 2019, 185, 708–716. [Google Scholar] [CrossRef]
  24. Martínez, E.J.; Sotres, A.; Arenas, C.B.; Blanco, D.; Martínez, O.; Gómez, X. Improving Anaerobic Digestion of Sewage Sludge by Hydrogen Addition: Analysis of Microbial Populations and Process Performance. Energies 2019, 12, 1228. [Google Scholar] [CrossRef] [Green Version]
  25. Costa, M.; Buono, A.; Caputo, C.; Carotenuto, A.; Cirillo, D.; Costagliola, M.A.; Di Blasio, G.; La Villetta, M.; Macaluso, A.; Martoriello, G.; et al. The “INNOVARE” project: Innovative plants for distributed poly-generation by residual biomass. Energies 2020, 13, 4020. [Google Scholar] [CrossRef]
  26. Werle, S.; Wilk, R.K. A review of methods for the thermal utilization of sewage sludge: The Polish perspective. Renew. Energy 2010, 35, 1914–1919. [Google Scholar] [CrossRef]
  27. Di Fraia, S.; Uddin, M.R. Energy Recovery from Waste Paper and Deinking Sludge to Support the Demand of the Paper Industry: A Numerical Analysis. Sustainability 2022, 14, 4669. [Google Scholar] [CrossRef]
  28. Abdelrahim, A.; Brachi, P.; Ruoppolo, G.; Di Fraia, S.; Vanoli, L. Experimental and Numerical Investigation of Biosolid Gasification: Equilibrium-Based Modeling with Emphasis on the Effects of Different Pretreatment Methods. Ind. Eng. Chem. Res. 2020, 59, 299–307. [Google Scholar] [CrossRef]
  29. de Andrés, J.M.; Vedrenne, M.; Brambilla, M.; Rodríguez, E. Modeling and model performance evaluation of sewage sludge gasification in fluidized-bed gasifiers using Aspen Plus. J. Air Waste Manag. Assoc. 2019, 69, 23–33. [Google Scholar] [CrossRef] [Green Version]
  30. De Andrés, J.M.; Narros, A.; Rodríguez, M.E. Air-steam gasification of sewage sludge in a bubbling bed reactor: Effect of alumina as a primary catalyst. Fuel Process. Technol. 2011, 92, 433–440. [Google Scholar] [CrossRef] [Green Version]
  31. Freda, C.; Cornacchia, G.; Romanelli, A.; Valerio, V.; Grieco, M. Sewage sludge gasification in a bench scale rotary kiln. Fuel 2018, 212, 88–94. [Google Scholar] [CrossRef]
  32. Mun, T.Y.; Kim, J.W.; Kim, J.S. Air gasification of dried sewage sludge in a two-stage gasifier: Part 1. the effects and reusability of additives on the removal of tar and hydrogen production. Int. J. Hydrogen Energy 2013, 38, 5226–5234. [Google Scholar] [CrossRef]
  33. Mun, T.Y.; Kim, J.S. Air gasification of dried sewage sludge in a two-stage gasifier. Part 2: Calcined dolomite as a bed material and effect of moisture content of dried sewage sludge for the hydrogen production and tar removal. Int. J. Hydrogen Energy 2013, 38, 5235–5242. [Google Scholar] [CrossRef]
  34. Mun, T.Y.; Cho, M.H.; Kim, J.S. Air gasification of dried sewage sludge in a two-stage gasifier. Part 3: Application of olivine as a bed material and nickel coated distributor for the production of a clean hydrogen-rich producer gas. Int. J. Hydrogen Energy 2014, 39, 5634–5643. [Google Scholar] [CrossRef]
  35. Chen, Y.H.; Lan Thao Ngo, T.N.; Chiang, K.Y. Enhanced hydrogen production in co-gasification of sewage sludge and industrial wastewater sludge by a pilot-scale fluidized bed gasifier. Int. J. Hydrogen Energy 2021, 46, 14083–14095. [Google Scholar] [CrossRef]
  36. Cirillo, D.; Di Palma, M.; La Villetta, M.; Macaluso, A.; Mauro, A.; Vanoli, L. A novel biomass gasification micro-cogeneration plant: Experimental and numerical analysis. Energy Convers. Manag. 2021, 243, 114349. [Google Scholar] [CrossRef]
  37. Tian, Y.; He, D.; Zeng, Y.; Hu, L.; Du, J.; Luo, Z.; Ma, W.; Zhang, Z. Experimental research on hydrogen-rich syngas yield by catalytic biomass air-gasification over Ni/olivine as in-situ tar destruction catalyst. J. Energy Inst. 2023, 108, 101263. [Google Scholar] [CrossRef]
  38. Chae, H.J.; Kim, J.; Lee, S.C.; Kim, H.; Jo, S.B.; Ryu, J.; Kim, T.Y.; Lee, C.H.; Kim, S.J.; Kang, S. Catalytic Technologies for CO Hydrogenation for the Production of Light Hydrocarbons and Middle Distillates. Catalysts 2020, 10, 99. [Google Scholar] [CrossRef] [Green Version]
  39. Wibowo, H.; Susanto, H.; Grisdanurak, N.; Hantoko, D.; Yoshikawa, K.; Qun, H.; Yan, M. Recent developments of deep eutectic solvent as absorbent for CO2 removal from syngas produced from gasification: Current status, challenges, and further research. J. Environ. Chem. Eng. 2021, 9, 105439. [Google Scholar] [CrossRef]
  40. Di Fraia, S.; Massarotti, N.; Vanoli, L.; Costa, M. Thermo-economic analysis of a novel cogeneration system for sewage sludge treatment. Energy 2016, 115, 1560–1571. [Google Scholar] [CrossRef]
  41. Singh, V.; Phuleria, H.C.; Chandel, M.K. Estimation of energy recovery potential of sewage sludge in India : Waste to watt approach. J. Clean. Prod. 2020, 276, 122538. [Google Scholar] [CrossRef]
  42. Francois, J.; Abdelouahed, L.; Mauviel, G.; Patisson, F.; Mirgaux, O.; Rogaume, C.; Rogaume, Y.; Feidt, M.; Dufour, A. Detailed process modeling of a wood gasification combined heat and power plant. Biomass Bioenergy 2013, 51, 68–82. [Google Scholar] [CrossRef]
  43. Damartzis, T.; Michailos, S.; Zabaniotou, A. Energetic assessment of a combined heat and power integrated biomass gasification-internal combustion engine system by using Aspen Plus®. Fuel Process. Technol. 2012, 95, 37–44. [Google Scholar] [CrossRef]
  44. Brachi, P.; Di Fraia, S.; Massarotti, N.; Vanoli, L. Combined heat and power production based on sewage sludge gasification: An energy-efficient solution for wastewater treatment plants. Energy Convers. Manag. X 2022, 13, 100171. [Google Scholar] [CrossRef]
  45. Fatema, J.; Ahmed, T.; Islam, M.M.; Sakib, M.N.; Chowdhury, A.M.S.; Haque, P. Gasification of kitchen wastes in an updraft fluidized bed gasifier and simulation of the process with Aspen Plus. J. Clean. Prod. 2022, 371, 133670. [Google Scholar] [CrossRef]
  46. Singh, M.; Salaudeen, S.A.; Gilroyed, B.H.; Dutta, A. Simulation of biomass-plastic co-gasification in a fluidized bed reactor using Aspen plus. Fuel 2022, 319, 123708. [Google Scholar] [CrossRef]
  47. Hoo, K.K.; Md Said, M.S. Simulation of air gasification of Napier grass using Aspen Plus. Sustain. Energy Technol. Assess. 2022, 50, 101837. [Google Scholar] [CrossRef]
  48. Carotenuto, A.; Di Fraia, S.; Massarotti, N.; Uddin, M.R.; Vanoli, L. Combined Heat and Power Generation from Mechanically Dewatered Sewage Sludge: Numerical Modelling. Chem. Eng. Trans. 2022, 92, 283–288. [Google Scholar] [CrossRef]
  49. Migliaccio, R.; Brachi, P.; Montagnaro, F.; Papa, S.; Tavano, A.; Montesarchio, P.; Ruoppolo, G.; Urciuolo, M. Sewage Sludge Gasification in a Fluidized Bed: Experimental Investigation and Modeling. Ind. Eng. Chem. Res. 2021, 60, 5034–5047. [Google Scholar] [CrossRef]
  50. Werle, S.; Dudziak, M. Gaseous fuels production from dried sewage sludge via air gasification. Waste Manag. Res. 2015, 32, 601–607. [Google Scholar] [CrossRef] [PubMed]
  51. Werle, S. Impact of feedstock properties and operating conditions on sewage sludge gasification in a fixed bed gasifier. Waste Manag. Res. 2014, 32, 954–960. [Google Scholar] [CrossRef] [PubMed]
  52. Werle, S. Gasification of a dried sewage sludge in a laboratory scale fixed bed reactor. Energies 2015, 8, 8562–8572. [Google Scholar] [CrossRef] [Green Version]
  53. Giltrap, D.L.; McKibbin, R.; Barnes, G.R.G. A steady state model of gas-char reactions in a downdraft biomass gasifier. Sol. Energy 2003, 74, 85–91. [Google Scholar] [CrossRef]
  54. Zainal, Z.A.; Ali, R.; Lean, C.H.; Seetharamu, K.N. Prediction of performance of a downdraft gasifier using equilibrium modeling for different biomass materials. Energy Convers. Manag. 2001, 42, 1499–1515. [Google Scholar] [CrossRef]
  55. Acar, M.C.; Böke, Y.E. Simulation of biomass gasification in a BFBG using chemical equilibrium model and restricted chemical equilibrium method. Biomass Bioenergy 2019, 125, 131–138. [Google Scholar] [CrossRef]
  56. Villarini, M.; Marcantonio, V.; Colantoni, A. Sensitivity Analysis of Different Parameters on the Performance of a CHP Internal Combustion Engine System Fed by a Biomass Waste Gasifier. Energies 2019, 12, 688. [Google Scholar] [CrossRef] [Green Version]
  57. Lan, W.; Chen, G.; Zhu, X.; Wang, X.; Liu, C.; Xu, B. Biomass gasification-gas turbine combustion for power generation system model based on ASPEN PLUS. Sci. Total Environ. 2018, 628–629, 1278–1286. [Google Scholar] [CrossRef]
  58. François, J.; Abdelouahed, L.; Mauviel, G.; Feidt, M.; Rogaume, C.; Mirgaux, O.; Patisson, F.; Dufour, A. Estimation of the energy efficiency of a wood gasification CHP plant using Aspen Plus. Chem. Eng. Trans. 2012, 29, 769–774. [Google Scholar] [CrossRef]
  59. Násner, A.M.L.; Lora, E.E.S.; Palacio, J.C.E.; Rocha, M.H.; Restrepo, J.C.; Venturini, O.J.; Ratner, A. Refuse Derived Fuel (RDF) production and gasification in a pilot plant integrated with an Otto cycle ICE through Aspen plusTM modelling: Thermodynamic and economic viability. Waste Manag. 2017, 69, 187–201. [Google Scholar] [CrossRef]
  60. Niu, M.; Huang, Y.; Jin, B.; Wang, X. Simulation of syngas production from municipal solid waste gasification in a bubbling fluidized bed using aspen plus. Ind. Eng. Chem. Res. 2013, 52, 14768–14775. [Google Scholar] [CrossRef]
  61. Chen, C.; Jin, Y.Q.; Yan, J.H.; Chi, Y. Simulation of municipal solid waste gasification in two different types of fixed bed reactors. Fuel 2013, 103, 58–63. [Google Scholar] [CrossRef]
  62. Roche, E.; De Andrés, J.M.; Narros, A.; Rodríguez, M.E. Air and air-steam gasification of sewage sludge. The influence of dolomite and throughput in tar production and composition. Fuel 2014, 115, 54–61. [Google Scholar] [CrossRef]
  63. Sreejith, C.C.; Muraleedharan, C.; Arun, P. Performance prediction of steam gasification of wood using an ASPEN PLUS thermodynamic equilibrium model. Int. J. Sustain. Energy 2014, 33, 416–434. [Google Scholar] [CrossRef]
  64. Pala, L.P.R.; Wang, Q.; Kolb, G.; Hessel, V. Steam gasification of biomass with subsequent syngas adjustment using shift reaction for syngas production: An Aspen Plus model. Renew. Energy 2017, 101, 484–492. [Google Scholar] [CrossRef]
  65. Franco, C.; Pinto, F.; Gulyurtlu, I.; Cabrita, I. The study of reactions influencing the biomass steam gasification process. Fuel 2003, 82, 835–842. [Google Scholar] [CrossRef]
  66. Barman, N.S.; Ghosh, S.; De, S. Gasification of biomass in a fixed bed downdraft gasifier—A realistic model including tar. Bioresour. Technol. 2012, 107, 505–511. [Google Scholar] [CrossRef] [PubMed]
  67. Demirbaş, A. Carbonization ranking of selected biomass for charcoal, liquid and gaseous products. Energy Convers. Manag. 2001, 42, 1229–1238. [Google Scholar] [CrossRef]
  68. Morris, R.D. Chapter Four. In Composition with Pitch-Classes; Yale University Press: London, UK, 2018; pp. 123–183. [Google Scholar]
  69. Ruya, P.M.; Purwadi, R.; Lim, S.S. Supercritical water gasification of sewage sludge for power generation– thermodynamic study on auto-thermal operation using Aspen Plus. Energy Convers. Manag. 2020, 206, 112458. [Google Scholar] [CrossRef]
  70. Zheng, X.; Chen, W.; Ying, Z.; Huang, J.; Ji, S.; Wang, B. Thermodynamic investigation on gasification performance of sewage sludge-derived hydrochar: Effect of hydrothermal carbonization. Int. J. Hydrogen Energy 2019, 44, 10374–10383. [Google Scholar] [CrossRef]
  71. Hossain, M.S.; Kumar, D.; Paul, N.; Rahman, S.J.; Rahman, M.A.; Uddin, M.R.; Pirozzi, D.; Uddin, M.N.; Yousuf, A. Design and Development of Bubbling Fluidized Bed Gasifier for Non-Woody Biomass Gasification. Chem. Eng. Trans. 2022, 92, 289–294. [Google Scholar] [CrossRef]
  72. Turkcan, A. The effects of different types of biodiesels and biodiesel-bioethanol-diesel blends on the cyclic variations and correlation coefficient. Fuel 2020, 261, 116453. [Google Scholar] [CrossRef]
  73. Carotenuto, A.; Di Fraia, S.; Uddin, M.R.; Vanoli, L. Comparison of Combustion and Gasification for Energy Recovery from Residual Woody Biomass. Int. J. Heat Technol. 2022, 40, 888–894. [Google Scholar] [CrossRef]
  74. Moretti, L.; Arpino, F.; Cortellessa, G.; Di Fraia, S.; Di Palma, M.; Vanoli, L. Reliability of equilibrium gasification models for selected biomass types and compositions: An overview. Energies 2022, 15, 61. [Google Scholar] [CrossRef]
  75. Martínez González, A.; Silva Lora, E.E.; Escobar Palacio, J.C. Syngas production from oil sludge gasification and its potential use in power generation systems: An energy and exergy analysis. Energy 2019, 169, 1175–1190. [Google Scholar] [CrossRef]
  76. Castillo Santiago, Y.; Martínez González, A.; Venturini, O.J.; Yepes Maya, D.M. Assessment of the energy recovery potential of oil sludge through gasification aiming electricity generation. Energy 2021, 215, 119210. [Google Scholar] [CrossRef]
  77. Cavalaglio, G.; Coccia, V.; Cotana, F.; Gelosia, M.; Nicolini, A.; Petrozzi, A. Energy from poultry waste: An Aspen Plus-based approach to the thermo-chemical processes. Waste Manag. 2018, 73, 496–503. [Google Scholar] [CrossRef]
  78. Sheth, P.N.; Babu, B.V. Production of hydrogen energy through biomass (waste wood) gasification. Int. J. Hydrogen Energy 2010, 35, 10803–10810. [Google Scholar] [CrossRef]
  79. Kaewluan, S.; Pipatmanomai, S. Potential of synthesis gas production from rubber wood chip gasification in a bubbling fluidised bed gasifier. Energy Convers. Manag. 2011, 52, 75–84. [Google Scholar] [CrossRef]
  80. Skoulou, V.; Koufodimos, G.; Samaras, Z.; Zabaniotou, A. Low temperature gasification of olive kernels in a 5-kW fluidized bed reactor for H2-rich producer gas. Int. J. Hydrogen Energy 2008, 33, 6515–6524. [Google Scholar] [CrossRef]
  81. De Andrés, J.M.; Narros, A.; Rodríguez, M.E. Behaviour of dolomite, olivine and alumina as primary catalysts in air-steam gasification of sewage sludge. Fuel 2011, 90, 521–527. [Google Scholar] [CrossRef] [Green Version]
  82. Ahmed, R.; Chandra, M.S. Equilibrium modeling in updraft gasifier for refinery sludge gasification using ASPEN PLUS simulator. Appl. Mech. Mater. 2013, 393, 729–734. [Google Scholar] [CrossRef]
  83. Zhang, J.; Huo, X.; Dong, C.; Yang, Y. High-temperature oxygen gasification of sludge. In Proceedings of the 1st International Conference on Sustainable Power Generation and Supply, SUPERGEN ’09, Nanjing, China, 6–7 April 2009; IEEE: Piscataway, NJ, USA, 2009; pp. 1–5. [Google Scholar]
  84. Groß, B.; Eder, C.; Grziwa, P.; Horst, J.; Kimmerle, K. Energy recovery from sewage sludge by means of fluidised bed gasification. Waste Manag. 2008, 28, 1819–1826. [Google Scholar] [CrossRef]
  85. Elsner, W.; Wysocki, M.; Niegodajew, P.; Borecki, R. Experimental and economic study of small-scale CHP installation equipped with downdraft gasifier and internal combustion engine. Appl. Energy 2017, 202, 213–227. [Google Scholar] [CrossRef]
  86. Longo, S.; d’Antoni, B.M.; Bongards, M.; Chaparro, A.; Cronrath, A.; Fatone, F.; Lema, J.M.; Mauricio-Iglesias, M.; Soares, A.; Hospido, A. Monitoring and diagnosis of energy consumption in wastewater treatment plants. A state of the art and proposals for improvement. Appl. Energy 2016, 179, 1251–1268. [Google Scholar] [CrossRef] [Green Version]
  87. Faizan, M.; Song, H. Critical review on catalytic biomass gasification: State-of-Art progress, technical challenges, and perspectives in future development. J. Clean. Prod. 2023, 408, 137224. [Google Scholar] [CrossRef]
  88. Bocci, E.; Marcantonio, V.; Di Carlo, A. Tar and inorganic contaminant removal from syngas: Modeling and simulation. In Advances in Synthesis Gas: Methods, Technologies and Applications; Elsevier: San Diego, CA, USA, 2023; pp. 241–273. [Google Scholar]
  89. Peck, D.; Holmes, W.; Zappi, M.; Hernandez, R.; Gang, D.; Buchireddy, P. Novel nickel ceramic filter for hot gas cleanup of tars from syngas. Fuel Process. Technol. 2023, 244, 107708. [Google Scholar] [CrossRef]
Figure 1. Picture of the sewage sludge used in the current research work.
Energies 16 04742 g001
Figure 2. Representation of fixed-bed updraft gasifier with temperature profile for the SS gasification at an ER of 0.16 and air preheating temperature of 25 °C.
Energies 16 04742 g002
Figure 3. Schematic view of the Aspen Plus flow diagram for the cogeneration of electrical and thermal energy from SS by integrating gasification and ICE systems.
Energies 16 04742 g003
Figure 4. Syngas composition with LHV: deviation of numerical results from experimental outcomes during model calibration (test condition I).
Energies 16 04742 g004
Figure 5. Syngas composition with LHV: deviation of numerical results from experimental outcomes during model validation ((a) conditions II to V, (b) conditions VI to X, and (c) LHV of syngas for the gasification at ER of 0.16 and 0.27).
Energies 16 04742 g005aEnergies 16 04742 g005b
Figure 6. Fluctuation of (a) syngas composition, (b) syngas LHV and P ˙ n e t from gasification product, and (c) CCE, CGE, and gasification temperature with air preheating temperature.
Energies 16 04742 g006aEnergies 16 04742 g006b
Figure 7. Variation in the (a) composition of individual syngas components, (b) syngas LHV and P ˙ n e t obtained from SS gasification, and (c) CCE, CGE, and gasification temperature with ER.
Energies 16 04742 g007aEnergies 16 04742 g007b
Table 1. Quality of SS with energy content.
Proximate Analysis (wt.%, db)Ultimate Analysis (wt.%, db)LHV (MJ/kg, db)LHV (kWh/kg, db)
Moisture5.30 ± 0.06C31.79 ± 0.212.96 ± 0.43.60 ± 0.1
H24.36 ± 0.05
Volatile matter51.00 ± 0.96N24.88 ± 0.07
S1.67 ± 0.01
Fixed carbon7.20 ± 0.06F₂0.013 ± 0.001
Cl₂0.22 ± 0.001
Ash36.50 ± 0.1O220.57
Table 2. Operating conditions applied in the gasification campaign conducted in the current research and corresponding syngas compositions with LHV.
Test
Condition
ER (-)SS Flow Rate (g/s)Air Flow Rate (g/s)* APT (°C)Dry Syngas Composition (vol.%)LHV
(MJ/Nm3)
H₂COCO₂CH₄
I0.161.00.78255.80 ± 0.123.90 ± 0.615.90 ± 0.40.85 ± 0.043.75 ± 0.6
II1005.90 ± 0.124.00 ± 0.715.40 ± 0.50.85 ± 0.053.77 ± 0.7
III1506.00 ± 0.224.20 ± 0.715.35 ± 0.40.87 ± 0.043.81 ± 0.6
IV2006.20 ± 0.124.50 ± 0.615.00 ± 0.50.89 ± 0.033.87 ± 0.5
V2506.80 ± 0.124.90 ± 0.714.80 ± 0.60.96 ± 0.043.99 ± 0.4
VI0.271.32257.90 ± 0.219.50 ± 0.815.90 ± 0.51.00 ± 0.053.44 ± 0.5
VII1007.92 ± 0.119.70 ± 0.615.70 ± 0.41.05 ± 0.063.47 ± 0.4
VIII1508.00 ± 0.220.00 ± 0.815.65 ± 0.61.06 ± 0.053.52 ± 0.5
IX2008.02 ± 0.120.50 ± 0.714.60 ± 0.71.10 ± 0.073.59 ± 0.6
X2508.05 ± 0.220.80 ± 0.614.80 ± 0.71.21 ± 0.063.64 ± 0.5
* APT = Air preheating temperature.
Table 3. Counted chemical reactions with ΔH during SS gasification process simulation.
Reaction No.Reaction Scheme Reaction NameΔH, (kJ/mol)
R1C + H2O → H2 + COWater gas+131.0
R2C + O2 → CO2Carbon combustion−393.0
R3C + 2H2 → CH4Methanation−74.0
R4CO + H2O → H2 + CO2 Water gas shift−41.0
R52C2H6 + 7O2 → 6H2O + 4CO2Ethane combustion−1559.8
R6C3H8 + 5O2 → 4H2O + 3CO2Propane combustion−2220.0
R72H2 + O2 → 2H2OHydrogen combustion−242.0
Table 4. Operating parameters involved in the simulation of the ICE system.
Operating Parameters, UnitValue
Incoming syngas temperature to the ICE combustion chamber (°C)30.0
Incoming air temperature to the ICE (°C)20.0
Equivalence ratio used for syngas combustion (-)1.11
Pressure of ICE system for compression and combustion (bar)9.45
Energy losses during syngas combustion (% of syngas energy)10.0
Isentropic efficiency (%)Compression process85.0
Expansion process87.0
Mechanical efficiency (%)Compression process99.0
Expansion process
Exhaust stream pressure from the ICE (bar)1.0
Exhaust stream Temperature from the ICE (°C)338.0
Exhaust fume utilization temperature (°C)80.0
Cooling water temperature to the ICE radiatorInlet (°C)80.0
Exit (°C)90.0
Table 5. Limiting temperature to restrict each gasification reaction equilibrium and the fraction of carbon that moved to char formation.
Reaction No. Δ T A p p r   ( ° C )
R1−292.7
R251.1
R3−493.2
R4500
R5−320.8
R6252.2
R7−469.7
Fraction of carbon moving to char formation0.0879
Table 6. Pearson’s correlation coefficient between gasifying agent preheating temperature and process response.
ER = 0.16
Syngas componentH₂COCO₂CH₄LHV
Experimental0.930.99−0.970.950.93
Simulation0.9990.999−0.9990.9980.999
ER = 0.27
Experimental0.970.98−0.880.930.98
Simulation0.960.93−0.960.9970.97
Table 7. Comparison of CGE, η e l , η t h , and η s y s   predicted in the present study with the available literature.
BiomassCGE (%) η e l   ( % ) η t h   ( % ) η s y s   ( % ) Reference
SS74.125.751.574.9Present study
74.625.647.876.7[20]
71.924.645.976.8
72.324.846.367.4[48]
n.r.32.0n.r.n.r.[84]
69.020.0n.r.n.r.[85]
Woodn.r.27.040.067.0[58]
MSW59.019.120.040.1[59]
n.r. = mot reported, MSW = municipal solid waste.
Disclaimer/Publisher’s Note: The statements, opinions and data contained in all publications are solely those of the individual author(s) and contributor(s) and not of MDPI and/or the editor(s). MDPI and/or the editor(s) disclaim responsibility for any injury to people or property resulting from any ideas, methods, instructions or products referred to in the content.

