Article

On the Remote Calibration of Instrumentation Transformers: Influence of Temperature †

1
FEA Department EEMMeCS, Research Group EELAB Lemcko, Ghent University, Campus Kortrijk, 8500 Kortrijk, Belgium
2
Karybel B.V., 8790 Waregem, Belgium
3
School for Electrical Engineering, Potchefstroom Campus, North West University, Potchefstroom 2531, South Africa
*
Author to whom correspondence should be addressed.
This paper is an extended version of our paper published in On the Remote Calibration of Voltage Transformers: Validation of Opportunity, 2018 9th International Workshop on Applied Measurements for Power Systems (AMPS), 2018, pp. 1–6.
Energies 2023, 16(12), 4744; https://doi.org/10.3390/en16124744
Submission received: 14 May 2023 / Revised: 11 June 2023 / Accepted: 13 June 2023 / Published: 15 June 2023

Abstract

:
The remote calibration of instrumentation transformers is theoretically possible using synchronous measurements across a transmission line with a known impedance and a local set of calibrated voltage and current transformers. In this paper, an extension of the research results presented in our paper “On the Remote Calibration of Voltage Transformers: Validation of Opportunity” published in AMPS 2018 was undertaken by reporting on how temperature could increase the measurement uncertainty contributed by voltage and current transformers. This was needed to better understand if remote calibration could be realized under real-world conditions where temperatures at different geographical locations could be significantly different. This paper describes the influence of magnetic voltage, current transformers, and capacitive voltage transformers. Based on the research in this paper, one could conclude that the influence of magnetic voltage transformers (MVTs) is low, but, especially with current measurement transformers and capacitive voltage transformers, errors should be considered when performing remote calibrations on measurement transformers over long distances with different environmental conditions.

1. Introduction

A state estimation of a power system supports the power system’s security, efficiency, and economic operation. Not all nodes in a power system can be equipped with instrumentation to collect field data. As a consequence, the state of a power system is normally estimated by deriving additional voltage and current data from a set of network equations.
The performance of a state estimator benefits from input data being as accurate as possible. Field data will always be affected by measurement uncertainty, contributed to by a chain of events within the overall instrumentation system.
Instrumentation transformers first convert the primary circuit voltages and currents to an industrial instrumentation standard (i.e., 110 V and 5 A). Additional transducers could be needed to condition an input signal to the requirements of the measuring device in use. Field data are then acquired by the state estimator using some form of communication infrastructure between the state estimator and the measurement device. Collectively, all these measurement chain events contribute to measurement uncertainty.
Additional possible sources of errors are in the nominal conversion ratios, which may be different from the nameplate specification due to manufacturing reasons, drift over time and environmental conditions (temperature and humidity).
Instrumentation transformers are known to compromise the accurate measurement of higher frequency components, but this factor is not considered in this paper. Performance only at the fundamental power-system frequency is considered here.
A deviation from the nominal nameplate value can be corrected by a transformer correction factor (TCF), a complex quantity expressed as a magnitude correction factor (MCF) and a phase angle correction factor (PACF). Ideally, the MCF must be 1 and the PACF 0°. If not, the measured voltage and current data can affect o.a. the accuracy of a state estimator. This measurement uncertainty due to a TCF not being perfectly 1 0 o contributes to what is referred to as a biased measurement.
To minimize biased measurements, the calibration of voltage transformers (VTs) and current transformers (CTs) should be periodically performed as the TCF can change over time. Using traditional methods, calibration is an invasive approach performed during an out-of-service condition and cannot be used with some new types of measurement transformers. The calibration of new-generation voltage and current transformers could also require alternative approaches to the validation of the calibration status [1].
The literature describes several methods to perform the calibration of instrument transformers [1,2,3]. All of these methods are applied directly to the instrument transformer, being an invasive approach. They are time-consuming, expensive, labor-intensive and impractical to perform on a regularly basis [4,5].
The idea of remotely calibrating instrument transformers was first introduced in [4]. Remote calibration is a non-invasive and novel solution that not only saves costs, but also power-system operations can benefit when the state estimator performs better.
A mathematical solution to derive the TCF requires an error analysis of repetitive measurements across a transmission line of known impedance and is relatively simple, as reported in [5]. However, the solution is dependent on sufficient certainty about the calibration data of the local set (voltage and current) instrumentation transformers (that is, a low level of measurement uncertainty is very important).
The remote calibration of instrument transformers was initially proposed using non-synchronized measurements across a transmission line [4]. This mathematical model was improved in [6,7] by using synchronized measurements at both ends of the transmission line. Validation using synchrophasors using real-life field data was first reported in [8].
In principle, measurement uncertainty can be fully eliminated when using a computer simulation as the mathematical model can represent the ideal world. When field data are used [8,9], it is necessary to consider all factors that contribute to measurement uncertainty (such as instrumentation transformers, cabling and environmental factors, i.e., temperature) affecting the TCF.
As [8] only considered the contribution to measurement uncertainty from the synchrophasor recorder and the secondary input transducers, this paper contributes to a better understanding of the practicality of using this method in the real world by including the influence of ambient temperature. A significant temperature difference can be expected between the two ends of a transmission line. If temperature has a profound effect on the calibration status, this impact needs to be scientifically qualified.
In this paper, brief overviews of the remote calibration of instrument transformers and measurement uncertainty are first presented in the context of the relevant IEEE and IEC technical standards. The contribution of temperature to the TCF is then assessed using a controllable laboratory environment. An analysis of the results is lastly presented to show that temperature has to be taken into account if the field implementation of remote instrument transformer calibration is to be further considered.

2. Aspects of Metrology as a Context to the Calibration of Instrumentation Transformers

No measurement results can be regarded as exact. Standards documents have been developed over many decades to support scientists in estimating the certainty of any type of measurement. Probably the best-known document is the Guide to Uncertainty in Measurement (GUM) [10] that sets fundamental scientific principles to the estimation of measurement uncertainty.
Traceability is a concept in metrology that refers to a generic aspect of measured data that considers a reference value by using a documented and unbroken chain of the different aspects of calibration [11]. In a practical power system, the traceability of instrument transformer calibration can be difficult to obtain.

2.1. Different Types of Errors

Random, systemic, installation, environmental and intermittent errors can all contribute to measurement errors in a power system [4]. IEEE Std. C57.13 [12] and IEC 61869 [13,14,15] set accuracy requirements for instrument transformers and define an allowable ratio and angle error for different accuracy classes.
Random errors are contributed to by measuring instruments and vary unpredictably from one measurement and type to another. Systemic errors are considered to be the degeneration of instrument accuracy over time and have the same value for every measurement value. Both errors retain the same value and sign during repetitive measurements of a specific quantity following the same measurement process and using the same measurement instruments under the same reference conditions [16].
Systemic errors cannot be fully eliminated, but can be reduced by applying an appropriate correction factor, including compensating for temperature and other environmental factors [4,9,17].
Installation errors can be caused by the incorrect use of ratio factors and the accuracy of instrument documentation, including the errors created by the influence of the measurement equipment itself, such as the calibration status of the instrument and measurement update interval [4].
Environmental factors such as temperature, humidity, dust, wind and altitude can contribute to the measurement errors of instrument transformers. In this paper, the focus is on the influence of temperature as differences can be significant between two different geographical locations. Different types of instrument transformers, such as inductive or capacitive, are affected differently by the same environmental factors and present different readings [18,19].
Intermittent errors are defined as those errors caused by communication interference of measurements and/or the malfunction of telemetering equipment [4].

2.2. Synchrophasor Measurement Uncertainty

Phasor measurement units (PMUs) record synchronized voltage and current phasors at the fundamental frequency, known as synchrophasors. The synchrophasor measurement standard, IEEE Std. C37.118 [20], requires that the total vector error (TVE) should be less than 1%, resulting from the absolute measurement errors in the fundamental frequency voltage and current phasor (magnitude and phase angle). The TVE includes time-stamping uncertainty. A universal time reference (i.e., GPS) and sufficient certainty on the time-stamping accuracy of the two remote sets of measurements are needed for the measurement of phase angles across a transmission line.
Synchrophasor measurement errors are the result of an instrument transformer TCF (when the MCF does not equal to 1 and/or the PACF is not equal to 0), quantization noise (introduced by A/D conversion) and GPS time-stamping uncertainty [15]. Quantization errors are caused by the difference between the analog signal (real-world true value) and the closest available digital value (sampled value) at each sampling instance. These errors are considered to be negligible [21] when recording IEEE Std. C37.118-compliant synchrophasors at a resolution higher than 16 bits.

2.3. Instrument Transformer Error

An instrument transformer converts the primary quantity to a secondary standardized value such as 110 V and 5 or 1 A. A nominal nameplate value normally states the amplitude conversion factor, but not necessarily the possible phase shift introduced by the electromagnetic principle of operation (as employed in most instrument transformers).
It is impossible to manufacture an instrumentation transformer to have a perfect TCF of 1 e j 0 . The TCF could change over time (aging) and due to environmental factors such as temperature, addressed in this paper.
Knowledge of a TCF is needed when adjusting the difference between the measured and true phasors (variables). We assumed that Imeas was the measured current phasor, Itrue was the true phasor value, Vmeas was the measured voltage phasor and Vtrue was the true voltage phasor. Then, a ratio correction factor for the current (TCFI) and voltage (TCFV) could be used to compensate the measuring errors, as shown below:
I meas = T C F I I t r u e
V m e a s = T C F V V t r u e

3. Principles of Remote Calibration

An estimation of transmission-line parameters is first needed to calculate the TCF from synchrophasors recorded across a line. An accurate model was not available.
Light and heavy load conditions were used in [22] to estimate the TCF and did not require accurate instrument transformer models for calibration as these are usually difficult to obtain. It was further developed in [21] for application in a three-phase power system. Both methods required at least one pre-calibrated VT and known transmission-line parameters.
A non-iterative method was used in [23] to derive the TCF for the remote instrument transformers. This method required the CT and VT at the sending end to be pre-calibrated as well as known transmission-line parameters.
The method in [24] estimated both the TCF and the transmission-line parameters, but required that the sending-end current and voltage measurements were calibrated.
In [8], it was assumed that only the sending-end VT had reliable calibration information. The transmission-line parameters at the fundamental frequency were then derived from the synchrophasors recorded across the line.

4. Instrumentation Errors

A major contributor to a measurement uncertainty analysis is the measurement errors of the instrument transformer itself [25]. The accuracy requirements of instrument transformers are defined in IEEE Std. C57.13 [12] and IEC 61869 [13,14,15,26]. Magnitude and phase angle errors in the fundamental frequency voltage and current phasors from the latter standards are considered below.

4.1. IEEE C57.13.5-2008

This IEEE standard defines Class 1 requirements for the instrument transformers of a nominal system voltage lower than 115 kV and Class 2 requirements for voltages above 115 kV. As this paper focuses on the remote calibration of instrument transformers at transmission voltages, Class 2 specifications are discussed below [27].
The accuracy classes for revenue metering are based on the requirements that a transformer correction factor (TCF) of the voltage or current transformer is within specified limits when the power factor has a value between 0.6 and 1.0.
The TCF in this standard is a complex number consisting of an MCF and a phase angle as one number. This includes the combined effect of the ratio error (to be mitigated by the ratio correction factor (RCF) of the magnitude correction factor (MCF)) and the phase angle error (to be mitigated by the phase angle correction factor (PACF)).
Standard testing in IEEE Std. C57.13 is performed within an ambient temperature range of 0 °C to 40 °C, using a reference temperature of 20 °C. The TCF should remain within the accuracy limits (IEEE C57.13) for temperatures between 0 and 40 °C. When considering remote calibration, temperature has an important role in the accuracy of the calibration results.

4.2. IEC 61869

IEC 61869 [13,14,15,26] has multiple parts referring to the accuracy of measurement transformers. Part 1 covers the general requirements for measurement transformers. Part 2, 3 and 5 describe additional requirements for, respectively, current transformers, inductive voltage transformers and capacitive voltage transformers. According to these standards, measurements must be performed with a displacement power factor of 0.8 lagging, except for a burden less than 5 VA, in which case a power factor of 1 has to be used.
Instrument transformers are classified into three categories based on the limits of ambient temperature. Category −5/40 has a minimum temperature of −5 °C and maximum of 40 °C. Similar notations are used for the other two categories; namely, −25/40 and −40/40. The category of instrument transformers at each end of the line is important for accuracy evaluations.
IEC 61869 specifies that the average value of the ambient air temperature measured over a 24 h period should not exceed 35 °C. Although the standard also specifies humidity, vibration and solar radiation in addition to temperature, it does not specify the influence of each parameter on measurement accuracy. The influence of temperature on accuracy is addressed in this paper.

5. Contribution of Temperature to Measurement Uncertainty

Remote calibration can be useful for high-voltage systems where the distance between the ends of a transmission line is large. Different physical environments at each end can affect instrument transformer performance. For example, one instrument transformer can be subject to a high temperature due to direct sunlight, while another similar instrument transformer at the other end of the line can be in the rain, resulting in a much lower temperature. Instrument transformers use copper to a large extent, which exhibits different conductive properties at different temperatures.
The influence of temperature on the accuracy of magnetic voltage transformers (MVTs) and magnetic current transformers (MCTs) was assessed in a controllable laboratory environment. This is not practical when testing the influence of temperature on a CVT due to the physical size and is normally only studied using a computer simulation.

5.1. Test Setup

The test setup consisted of a power source, an electrical oven/freezer, a calibrated power-quality analyzer and a resistive load. Temperature was measured with fixed installed K-type thermocouples.
Comparative measurements were obtained, meaning that variations in parameters for the same measurement state (i.e., the same temperature) were of less importance, provided that all the samples were affected in the same manner. This was achieved by measuring all the samples at the same time under the same conditions with the same instruments; therefore, the measurement errors for the same temperature were equal for each sample. The only parameter that was changed during the measurements was temperature.
Voltage and current were measured with a calibrated Voltech PM6000 (Voltech Instruments Limited, Wantage, UK) precision power-quality analyzer with a basic accuracy of 0.02% in the measurand [12]. The measurement of current was conducted by means of a resistive shunt to attempt an accurate measurand as possible in terms of magnitude and phase angle. The voltage and current of the different instrumentation transformers were simultaneously measured in both the primary and secondary circuits. The measurement errors are included in Equations (3)–(6).
V magnitude   =   0.02 % rdg   +   0.05 % rng   +   ( 0.0002 % rdg 2 0.002 % F rdg   + 20   mV
Phase ° = 0.005 + 0.0003 V rng V + 0.05 V + 0.001   F
A magnitude   =   0.02 % rdg   +   0.05 % rng   +   0.002 % F rdg   + 20   µ V Z ext
Phase ° = 0.0025 + 0.0005 I rng I + 0.00004 I   Z ext + 0.0006   F
where %rdg is the percentage of the reading, %rng is the percentage of the range, F is the frequency in kHz and Vrng/Irng is the voltage/current range.
For each measurement point, multiple measurements were taken under the same condition. These samples were then averaged, reducing the overall error of the measurement. A statistical analysis was then conducted on the voltage values to determine voltage stability at the different temperature setpoints. Voltage did not change between the measurements of different instrumentation transformers; it only changed when the temperature at each was different.
Temperature was controlled in a calibrated oven, an Memmert UN30 (Memmert GmbH + Co. KG, Schwabach, Germany). The temperature stability of the oven was high. Temperatures were measured by means of a fluke 2635A (Fluke Europe BV, Eindhoven, The Netherlands), multi-channel hydra datalogger series II using K-type thermocouples. These thermocouples had an error limit of 2.2 °C or 0.75% above 0 °C [28]. The measurement accuracy for the measurement device was 0.5 °C. Temperatures were measured every minute to enable the recording of the measurements of voltage and current when temperature stability existed. Measurements were directly obtained within the closed oven. All samples were measured at the same time and the temperature measurement points were selected in 10 °C increments.

5.2. Magnetic Current Transformers

Current transformer standards ANSI/IEEE C57.13 [12] and IEC 61869-2 [7] help to better understand accuracy specifications. During a short-circuit condition, the primary and secondary quantities in the simplified equivalent circuit diagram shown in Figure 1 can be simplified by Equation (7) as the parallel branch consumes minimal current [28]:
I 1 N 1 = I 2 N 2
where I1 is the RMS value of the primary fundamental current (A), I2 is the RMS value of the secondary fundamental current (A), N1 is the primary number of windings and N2 is the secondary number of windings.
Temperature has an effect on the TCF of inductive current transformers. How accuracy classes (KL) 0.2 and 0.5 at temperatures of 5 °C, 25 °C and 45 °C are affected is described in [18]. The results obtained in [18] were amended in this paper by a comprehensive practical evaluation of how temperature affected different inductive current transformers over temperatures ranging from −20 °C to +70 °C.
Different winding ratios implied different uses of copper, possibly causing different measurement errors as a function of temperature for each type. A 75/1 (KL 0.5) CT, a 50/A (KL 0.5) CT and a 100/5 (KL 1) CT were used. As each transformer had a different nominal current, this nominal current was attained by multiple winding turns.
The IEC 61869-2 current transformer ratios and phase error limits are listed in Table 1 below.
The IEEE C57.13 error limits are listed in Table 2.
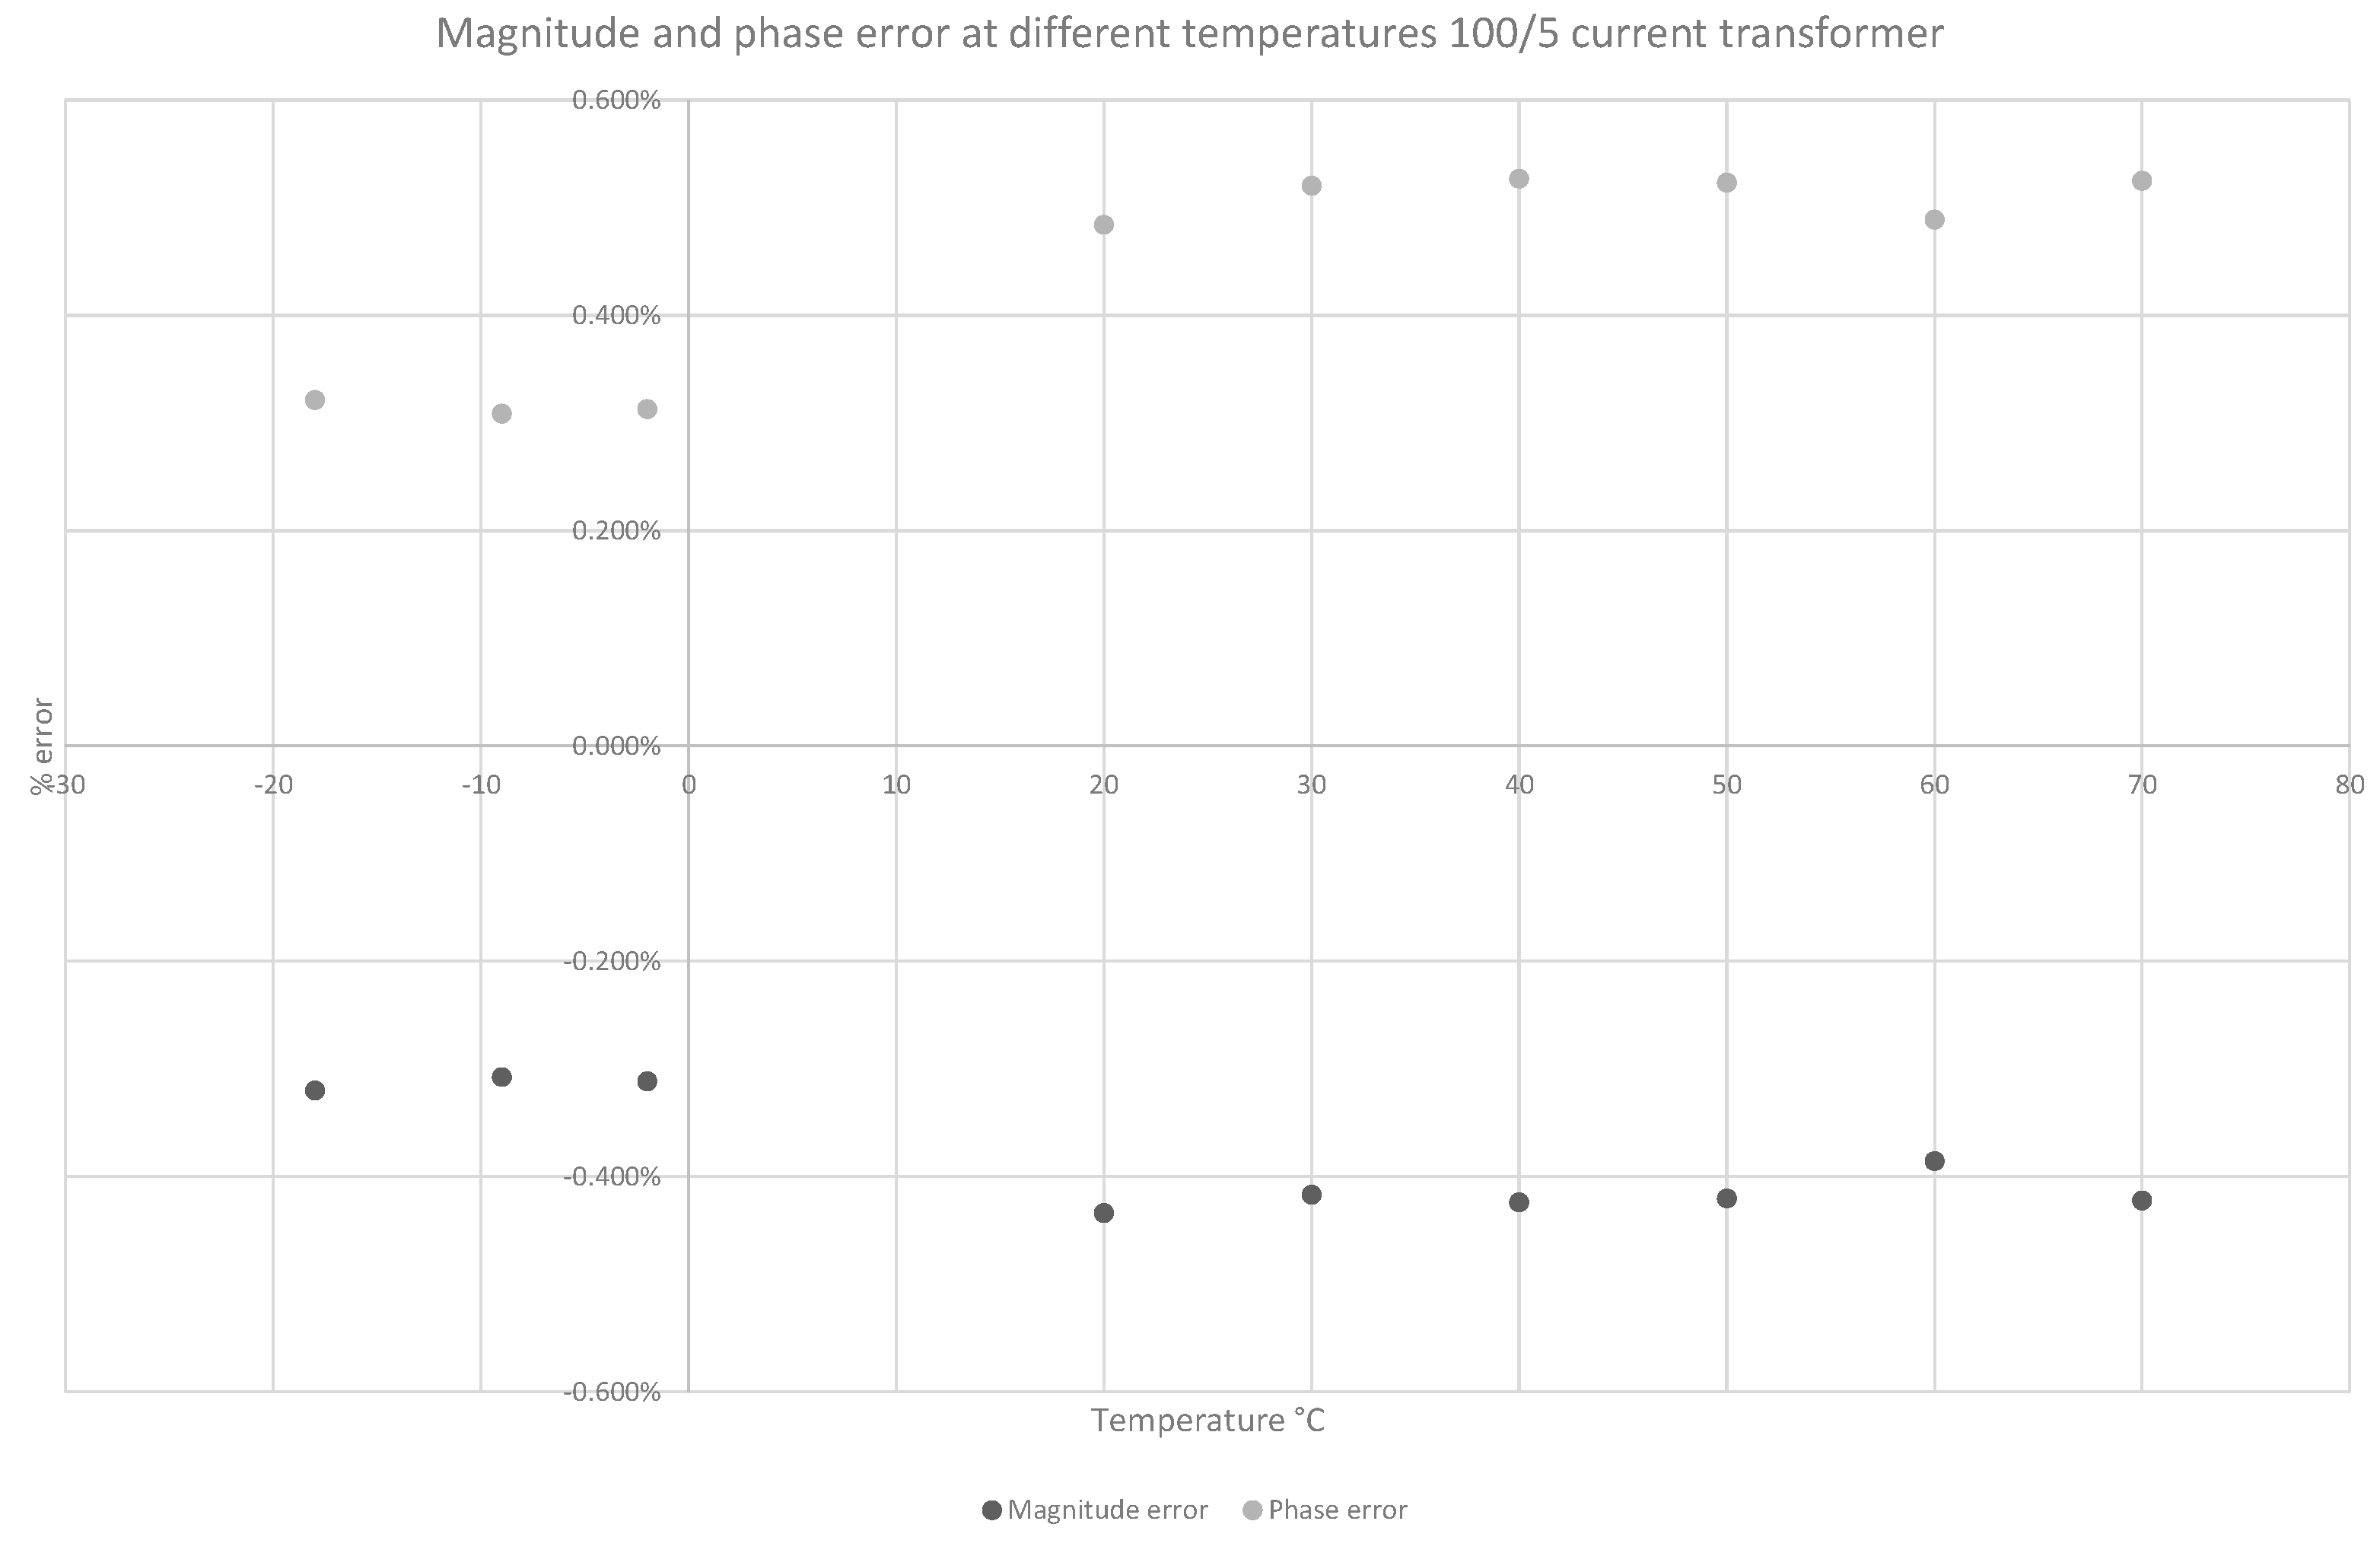
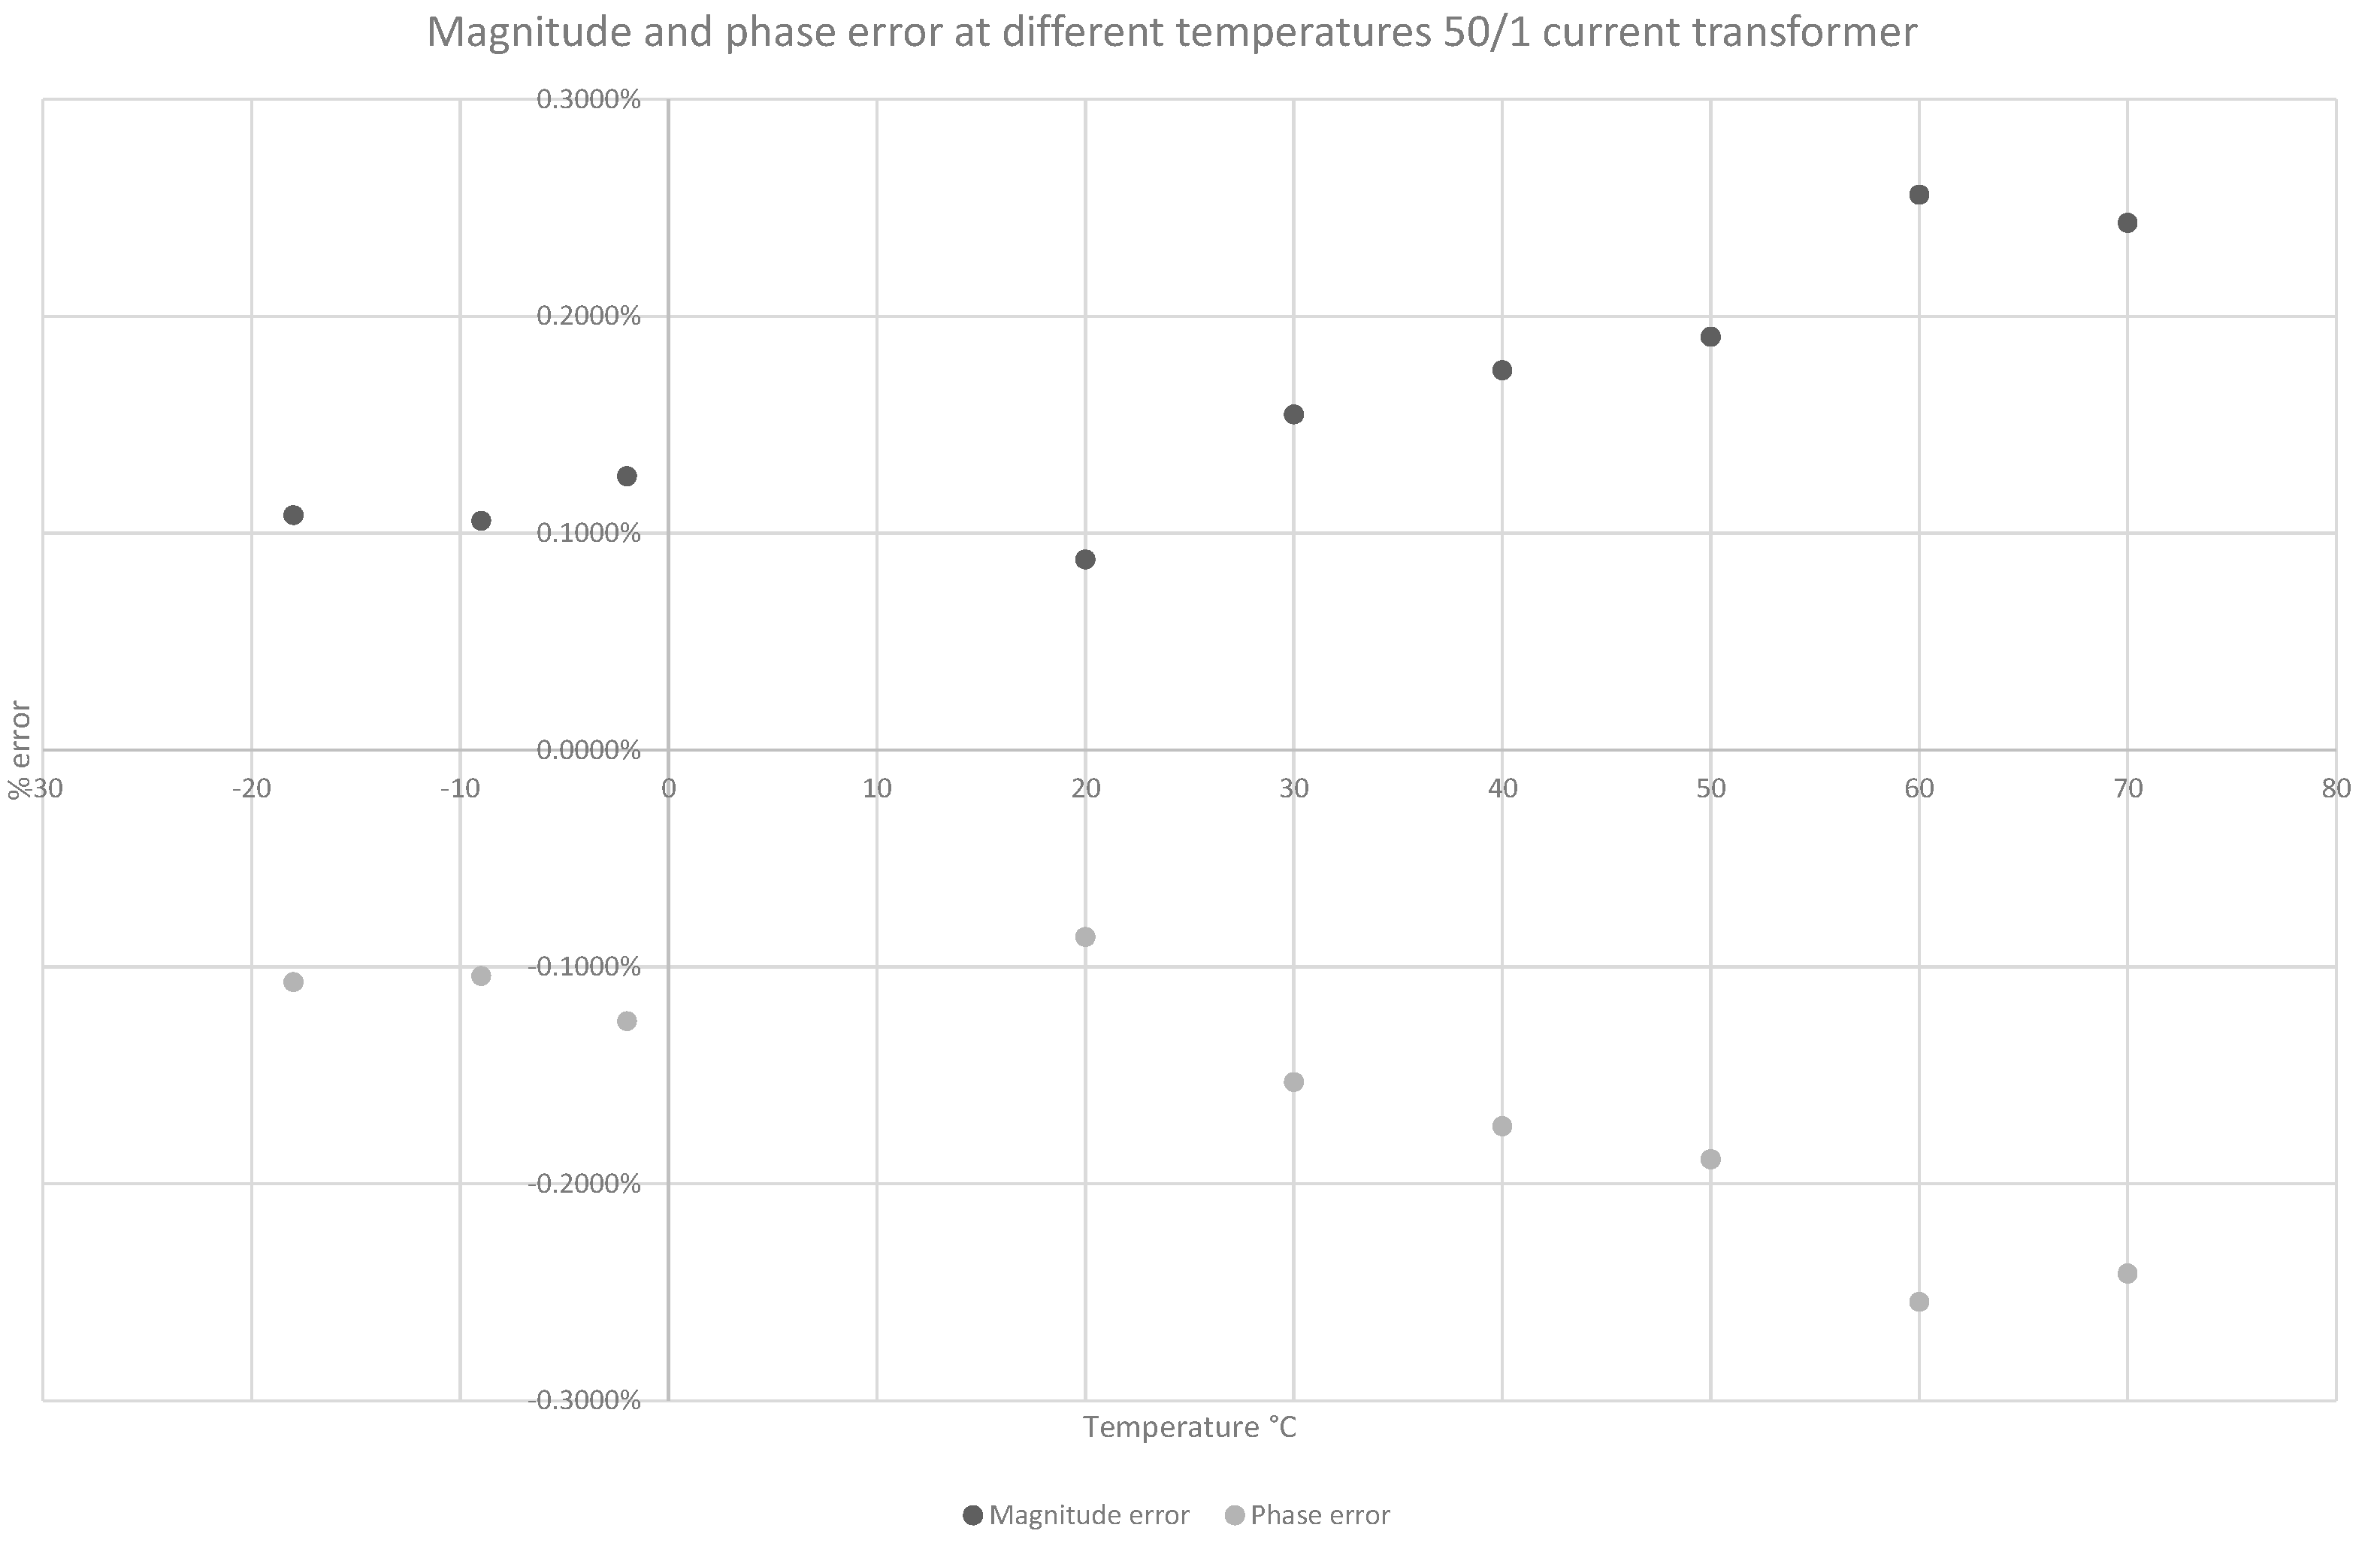
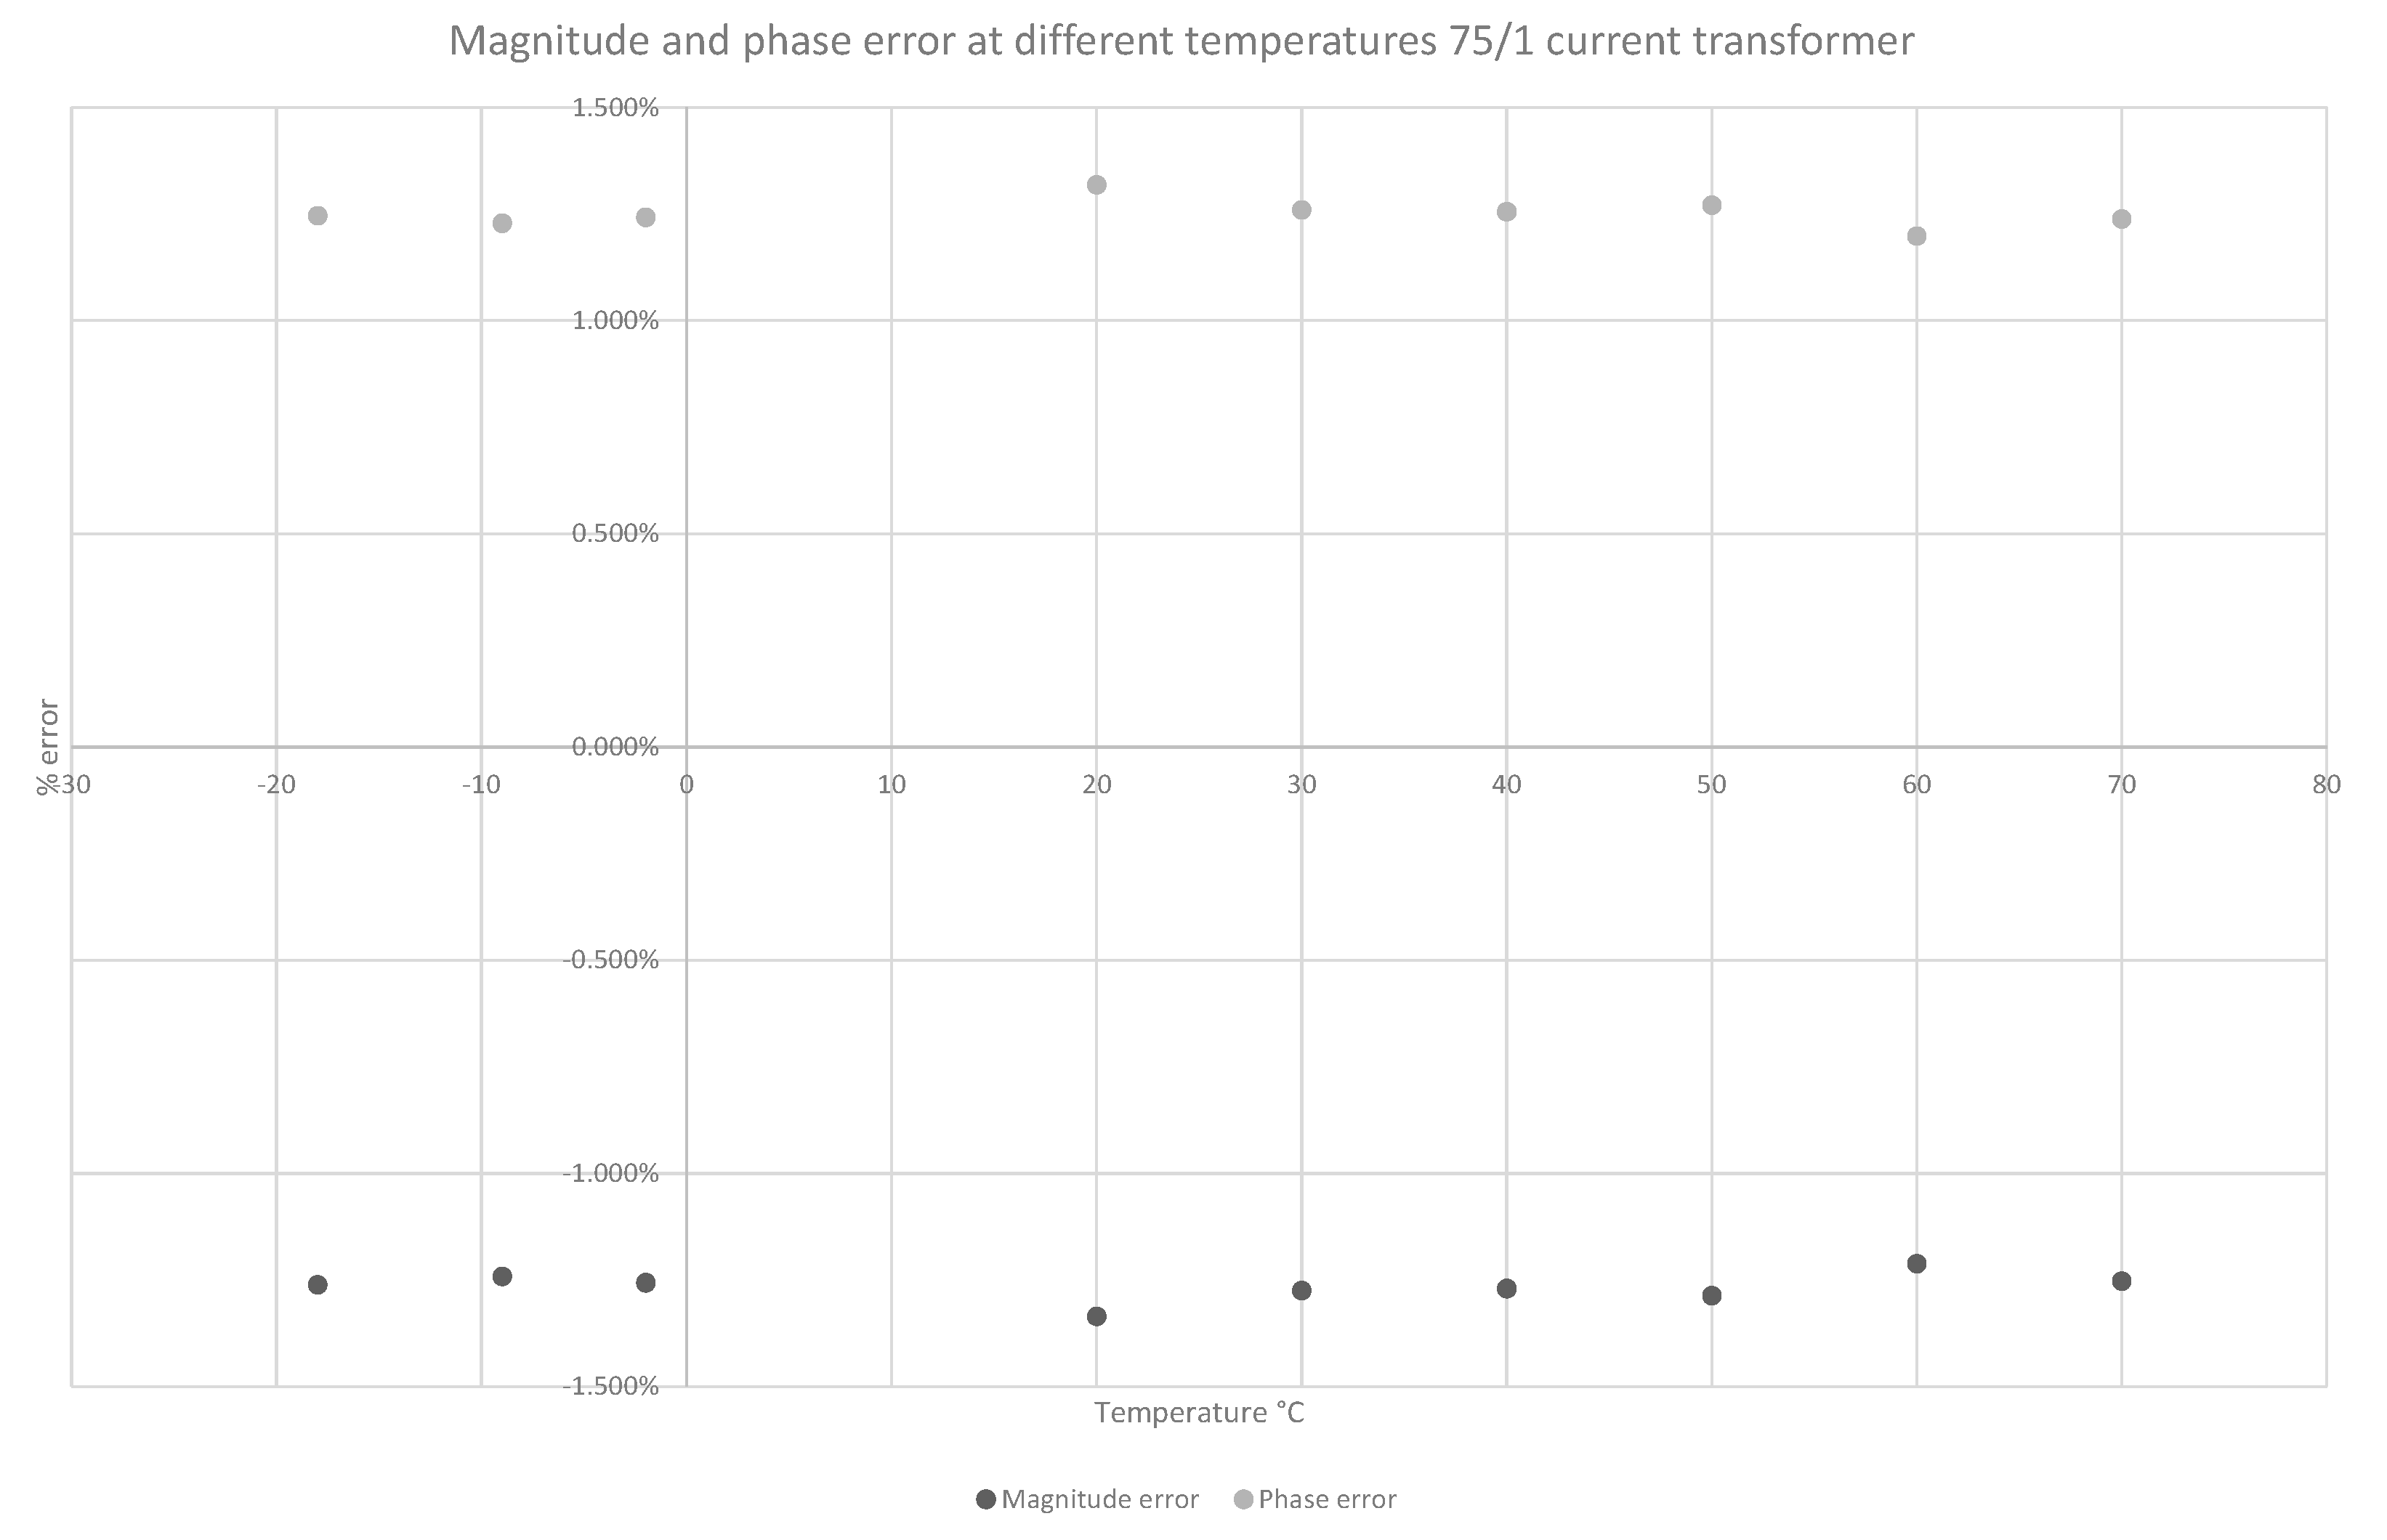
The experimental results obtained for three different CTs are shown in Figure 2, Figure 3 and Figure 4 below.
It is shown above that the influence of temperature on the magnitude and phase angle error depended on the ratio of the three CTs. Figure 2 shows how the variation in measurement error in the 100/5 A transformer depended on temperature. The magnitude error increased from 0.3% to 0.5% and was more pronounced at lower temperatures (below 20 °C) compared with the higher temperatures. The measurement error remained more stable for the magnitude and phase angle at temperatures above 20 °C. The maximum difference for amplitude was 0.043% for a temperature that increased from 20 °C to 50 °C; this was 0.031% in the phase angle.
The magnitude error was larger than the phase angle error. It caused a change of 9% for the magnitude and 8% for the phase angle in the secondary measurements. A Class 1 transformer evaluation according to IEEE limits could not be derived directly from Table 2 because there is not a standard value. As the relationship between the accuracy class and the standard transformer correction factor is linear, the transformer correction factor could be derived using both Table 1 and Table 2. Measurement errors for this CT remained within the limits of the IEEE C57.13 and IEC 61869-2 standards.
Temperature had a more pronounced impact on the measurement error for the 50/1 A CT, as shown in Figure 3 below.
The variation in the measurement error for the 75/1 A CT is shown in Figure 4 below.
From Figure 4, it can be seen that the change in measurement error was less than 0.04% for the magnitude and phase angle error for temperatures between −18 °C and 20 °C. When the temperature increased above 20 °C, the change in magnitude and phase angle error was 0.088%, remaining within the limits of IEC 61869-2 and IEEE C57.13.
We concluded from the above results that the measurement error as a function of temperature was highly dependent on the type of transformer. All three CTs remained compliant with the magnitude and phase angle error requirements of IEC 61869 and IEEE C57.13.
A temperature difference (e.g., 40 °C, as used in this paper) between two remote current transformers indicated that the measurement error was important when considering the remote calibration of current transformers. A change of 0.2 percent point may seem negligible, but it caused a percentage change between errors of 60%. Similar high percentages were observed from the measurements used in this paper, indicating a change of 9% for the 100/5 transformer.
We concluded that both the environmental temperature and transformer winding ratio affected the measurement error of a magnetic CT.
The increase in measurement error with temperature could have been related to the construction of the magnetic current transformer. All of the circuit elements in the equivalent circuit of a magnetic current transformer, as shown in Figure 1, are temperature-dependent [30,31]:
  • core losses (resistance R0);
  • magnetizing inductance (X0);
  • primary leakage resistance (R1) and reactance (Xl1);
  • secondary leakage resistance (R2);
  • secondary leakage reactance (Xl2);
  • the complex impedance of the burden (Zb).
Resistance is affected by temperature (8):
R x = R 20 1 + α Δ T
where Rx is the resistance at temperature x (Ω), R20 is the resistance at 20 °C (Ω), α is the temperature coefficient for a specific material (Cu = 0.0039 (1/°C)) and ΔT is the temperature difference between 20 °C and the temperature x (°C) where resistance Rx is of interest.
In pure metals such as copper and aluminum, resistance as a function of temperature is almost linear in the temperature range of −50 °C to 200 °C.
In Figure 1, R1, the primary winding resistance, demonstrated a minimal Ohmic resistance as only one winding was used in the magnetic current transformer. R2, the resistance of the secondary winding, was higher due to a high number of windings, while R0, which modelled the active energy losses in the core, could be affected as the temperature could increase in the core.
From (8), it followed that resistance would be higher if the temperature increased and lower when it decreased.
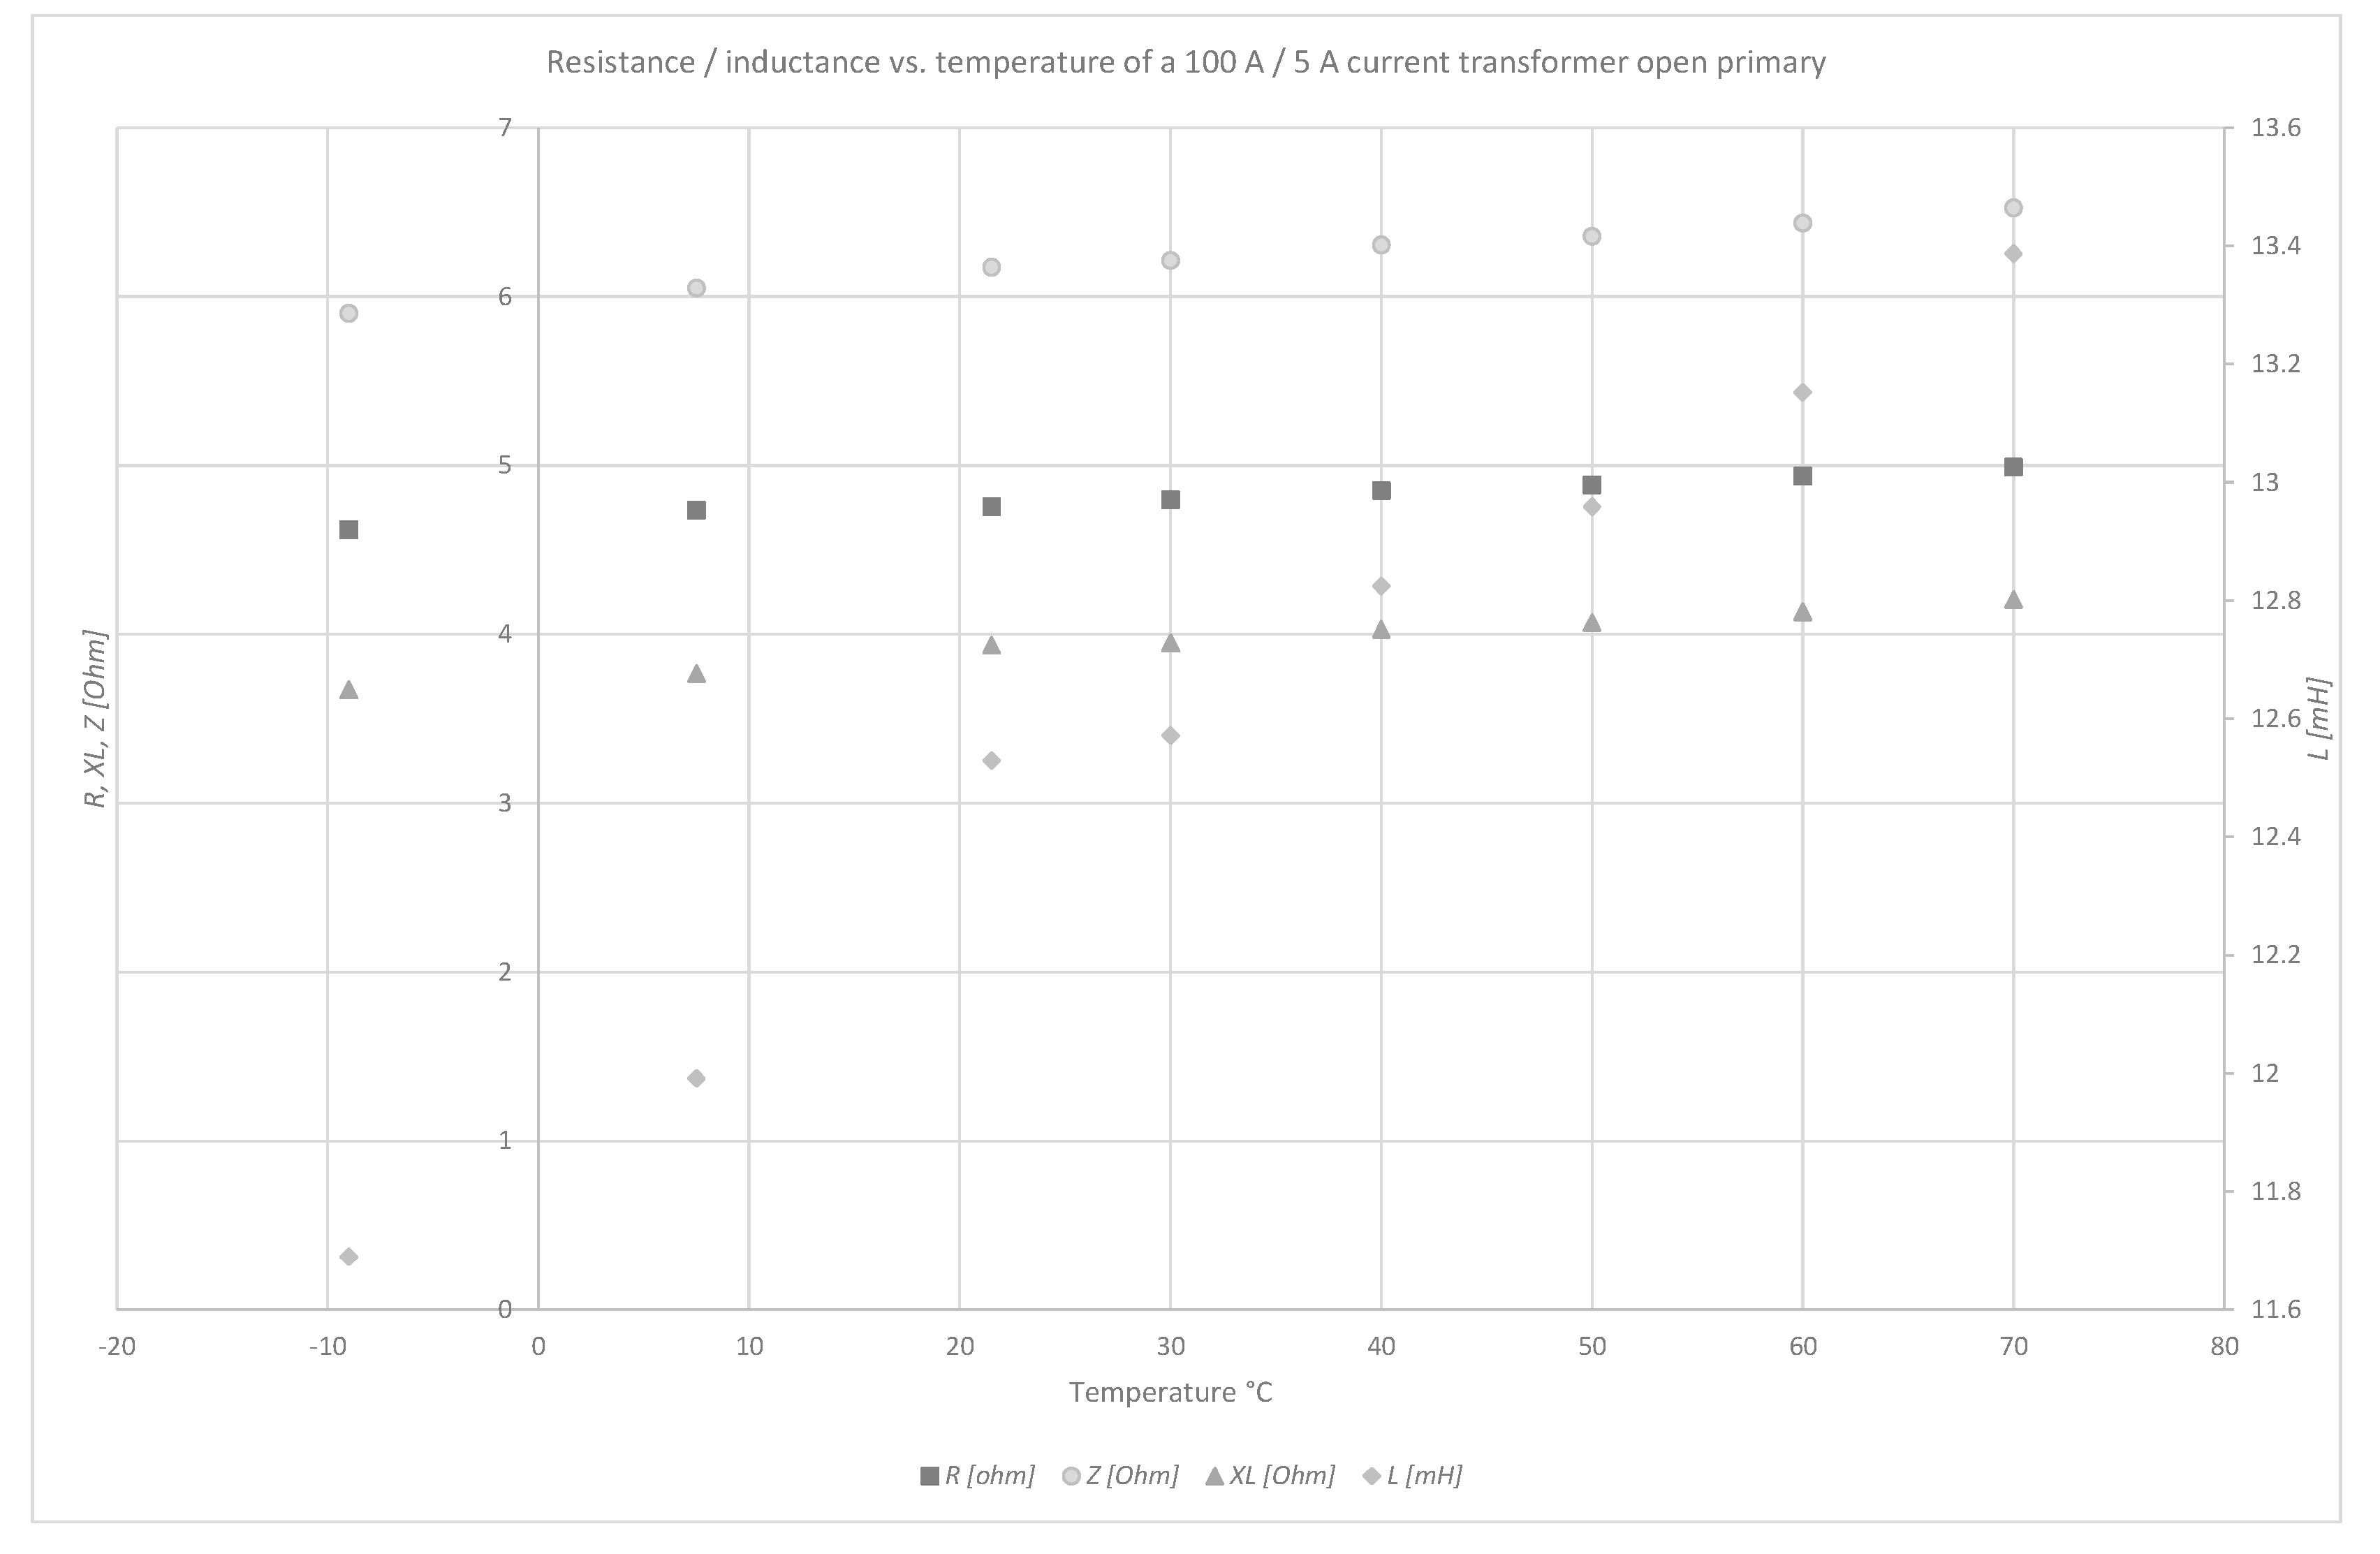
Measurements of resistance, inductance and impedance were investigated using a LCR meter (Hioki 3533, Hioki Europe GmbH, Eschborn, Germany) with a basic accuracy for impedance of ±0.05% for the reading (rdg) and of ±0.03° in the phase angle. Figure 5 and Figure 6 present the results when the primary winding was open-circuited and short-circuited (50 Hz).
We concluded from Figure 5 and Figure 6 that both resistance and inductance would have an impact on the measurement error in an MCT, with inductance contributing the most. Temperature affects the B(H) curve of a magnetic core; with an increase in temperature, the maximum magnetic flux density decreases, validating that the influence of temperature on impedance must be considered when the remote calibration of instrument transformers is of interest.
At frequencies above 50 Hz, the influence of temperature on inductance would be even more pronounced [32].

5.3. Inductive Voltage Transformer

Inductive (magnetic) voltage transformers are used at voltages up to 550 kV. Oil–paper insulation is required at high voltages, but the operating principles remain similar to a regular magnetic transformer. The high-voltage insulation requirement on the primary side is mostly reduced by 3 using a line-neutral voltage reference.
The equivalent circuit of a magnetic voltage transformer is similar to a magnetic current transformer, with the difference that the primary winding of a magnetic voltage transformer has a high number of turns on the winding compared with a magnetic current transformer having only one (Figure 7).
The influence of temperature on the measurement error of magnetic voltage transformers is reported in [19] and showed that it was less than 0.01% for both the ratio and phase errors. Measurement errors remained very small, although the magnitude error increased somewhat with temperature whereas the phase angle error decreased with temperature.

5.4. Capacitive Voltage Transformer

Capacitive voltage transformers (CVTs) are used at high voltages using a capacitive voltage divider, as shown in Figure 8.
The influence of temperature on the measurement error in a CVT is briefly described in IEC 61869-5 [15]. Three parameters of a CVT are influenced by temperature:
  • capacitance;
  • reactance;
  • impedance.
In a CVT, it is mostly capacitance that changes with temperature. This can be derived from Equations (9) and (10), as presented in [33,34,35]:
T c = Δ C Δ T . C 20
C N = C 20 1 + T c 20 T N
where ΔC is the change in capacitance, ΔT is the change in temperature, CN is the capacitance at temperature TN, C20 is the capacitance at 20 °C, Tc is the temperature coefficient and TN is the temperature at which capacitance is to be calculated.
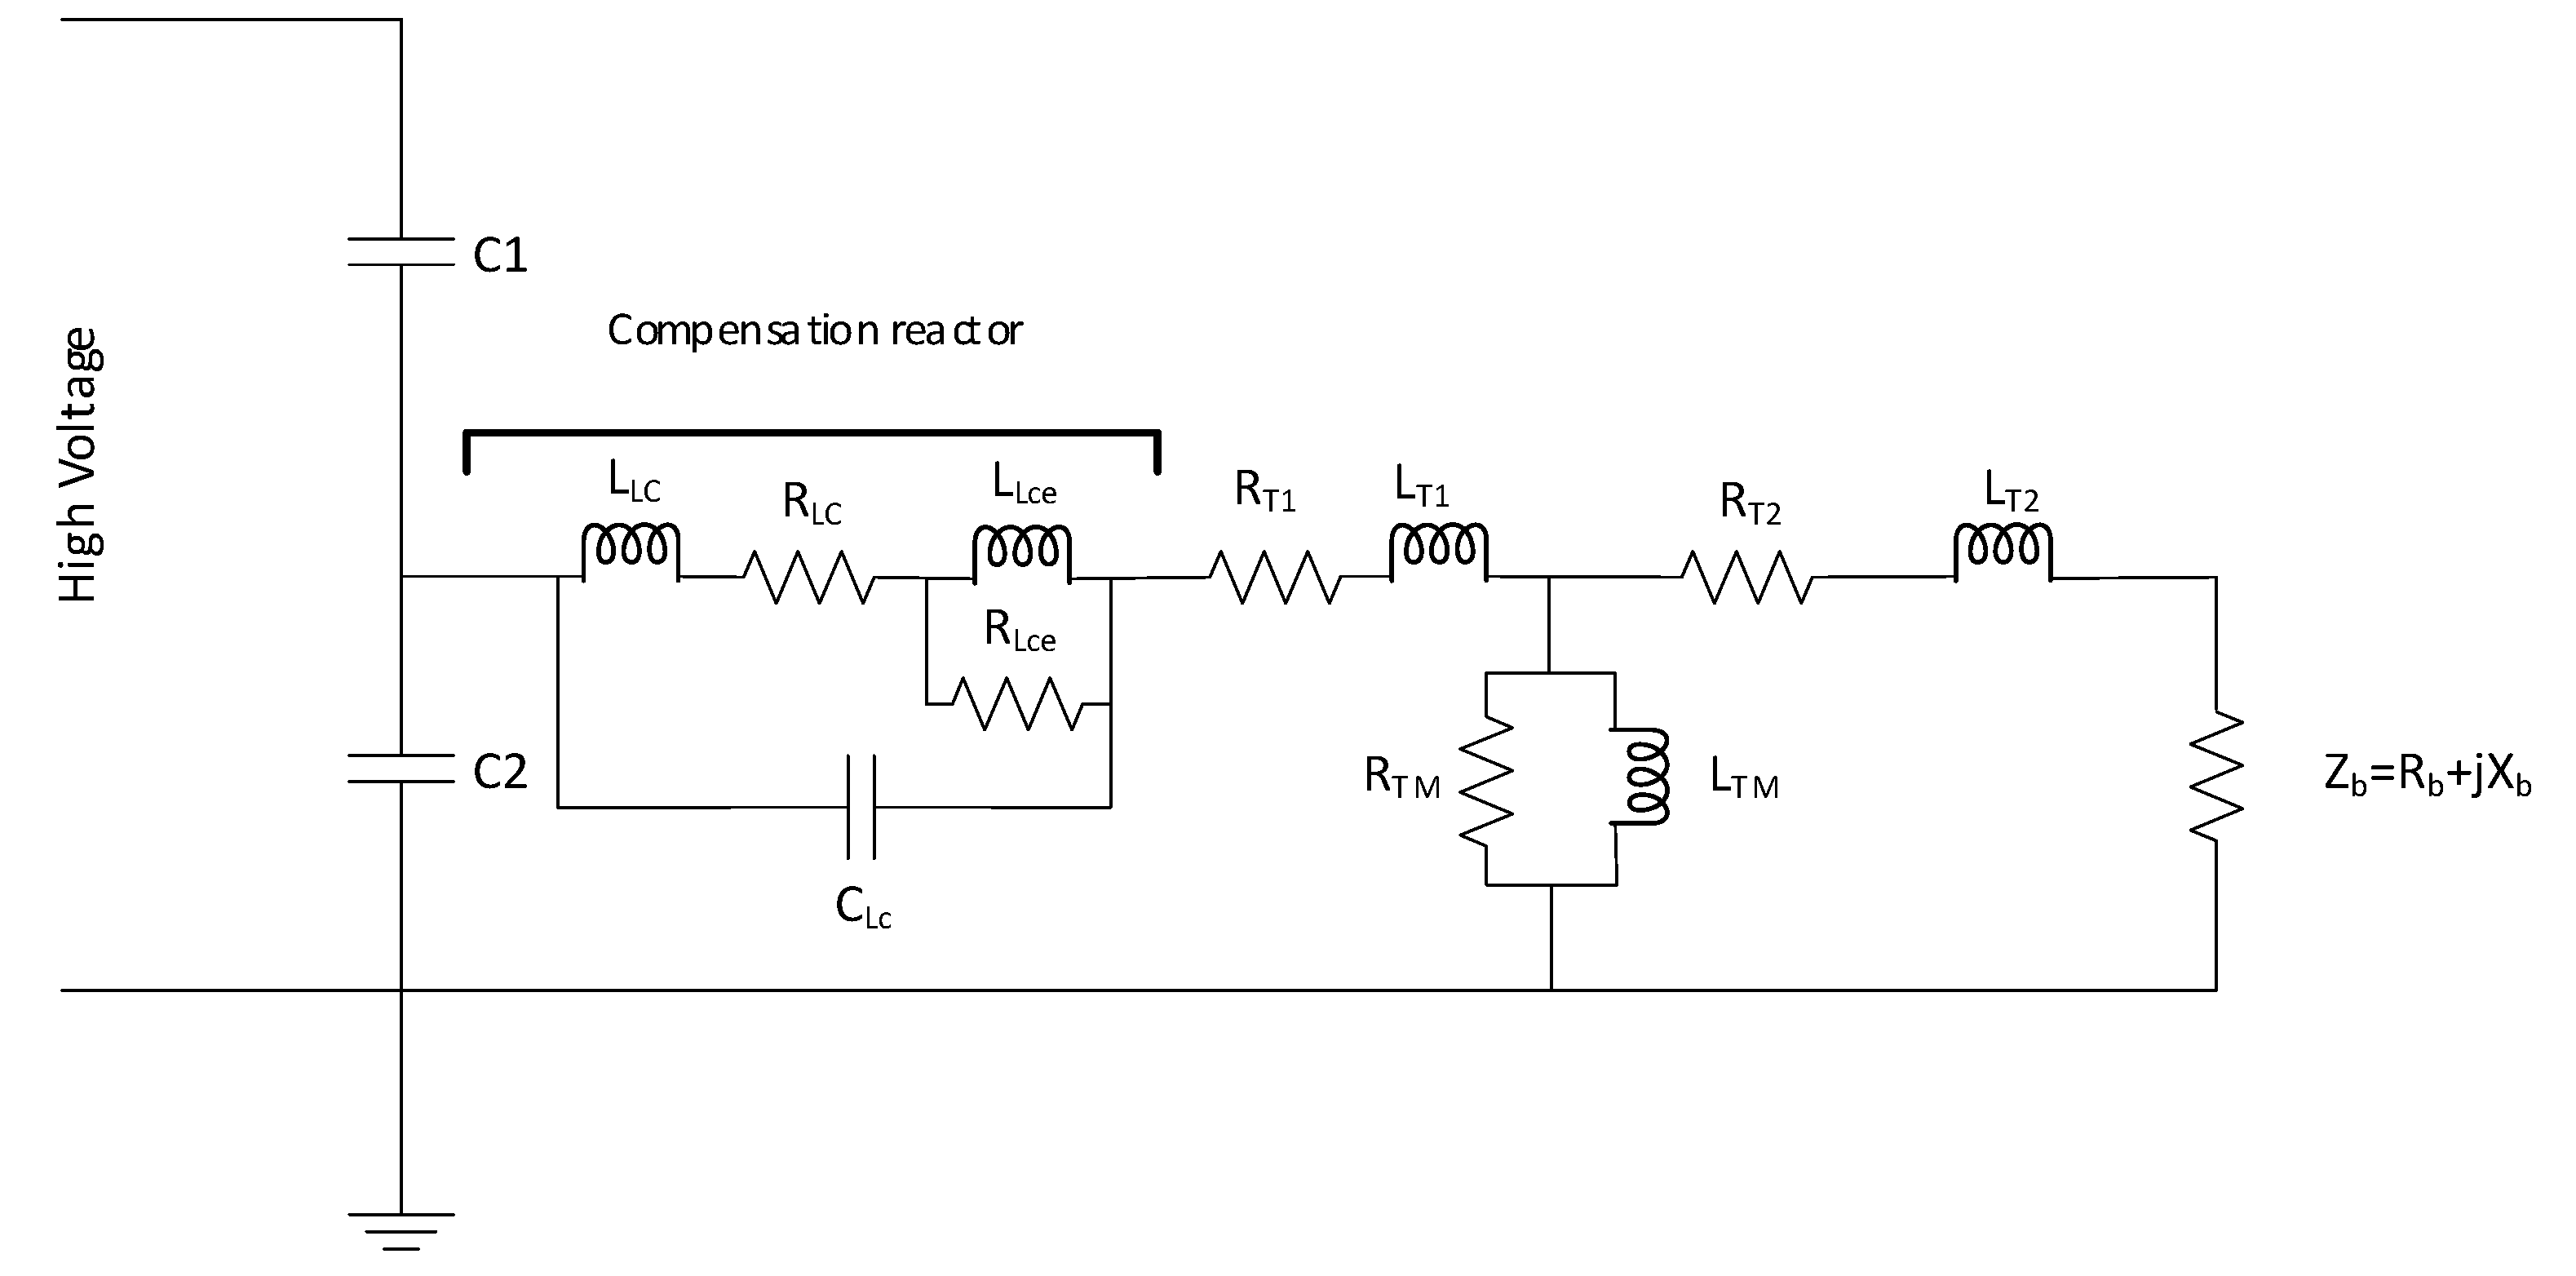
An equivalent circuit for a CVT is presented in Figure 9 and can be used [36,37] to evaluate the influence of temperature on the measurement error of a CVT.
C1 and C2 in Figure 10 represent the capacitance of the high-voltage and medium-voltage capacitors, respectively. An electromagnetic circuit exists in a CVT and is modeled by the compensation reactor of inductance LLc and resistance RLc. Included is the inductance LLce and resistance RLce of the iron core, with capacitance CLc representing the stray capacitance.
LT1, RT1, LT2 and RT2 model the inductance and resistance of the primary and secondary windings of an insulation transformer, respectively. LTM and RTM model the excitation (magnetic circuit) inductance and resistance. Zb is the burden by which it is loaded. A simulation was performed where the values for C1 and C2 were changed due to temperature and all other parameters remained fixed to evaluate the sensitivity of the capacitors.
A Thévenin equivalent circuit for the CVT in Figure 9 is derived in Figure 10, where Uth is the Thévenin equivalent voltage and C0 the Thévenin capacitance.
The parameters used in Figure 10 were derived from [36] and are listed in Table 3 below.
Capacitance changes due to both temperature TN and the temperature coefficient TC. Both parameters inflicted changes to the magnitude and phase angle of the secondary voltage and current phasor. The application of (9) and (10) in Figure 10, with the temperature changing between 0 °C and 100 °C, resulted in the results shown in Figure 11 and Figure 12 below.
From the change in the magnitude error seen in Figure 11, it was clear that when the temperature coefficient for both capacitors was the same, the influence of temperature on the error was limited. When the temperature changed by 120 °C, the capacitance changed by only 0.011%.
A more distinct effect was seen when the temperature coefficient changed. The difference in magnitude error between 0 °C and 100 °C was 1%. If, in the same voltage transformer, one capacitor had a different temperature coefficient from the other, a measurement error would be introduced. In addition, if the temperature was different for the CVTs, an additional contribution to the magnitude error would occur.
Similar results were observed for the phase angle. When the temperature coefficient was the same for both capacitors, the measurement error for the phase angle was 0.012%. When the temperature coefficient was different between the two capacitors, the measurement error between 0 °C and 100 °C in the phase angle was >1%, similar to the magnitude measurement error.
The field application of instrument transformer remote calibration implies that temperature is significantly different between the local and remote set of instrument transformers (i.e., due to a difference in rain, sun and wind). The consequence is that the capacitance values of the remote and local CVTs can be different.
The effect of temperature on the remainder of the instrumentation circuit was not taken into account above; only the influence of temperature on the capacitive voltage divider itself was considered.

6. Conclusions on the Opportunity for Instrument Transformer Remote Calibration

The principle of remotely calibrating a VT seems to be useful from the theoretical studies reported in [6,7,22]. As measurement uncertainty could constrain the field application of this novel idea, measurement uncertainty contributed to by synchrophasor recorders across a transmission line was systematically evaluated in [8]. VTs and CTs also contribute to measurement uncertainty. Only PMU measurement uncertainty from two different synchrophasor recorders was considered in [8]. This paper attempted a better understanding of the opportunity for the field application of remote instrument transformer calibration by considering the influence of temperature on measurement errors.
In [8], it was concluded that if calibration data of only the sending-end VT was available, an over-determined set of equations needed to be solved to derive a TCF for the remaining instrument transformers (one local CT, a remote VT and a CT). This was achieved by means of a least squares estimation.
It was concluded in [8] that the impact of measurement uncertainty due to time-stamping uncertainty and the quantization noise of different PMUs at both ends of the line was less than 0.5% in magnitude and less than 0.03% in the phase angle.
When including the temperature effect on the measurement transformer, the effect on the uncertainty is not neglectable and is highly dependent on the type of transformers used as well as the temperature difference between the two locations. The influence of temperature between the same magnetic current magnetic transformer could be up to 0.3%. The influence of temperature in a magnetic voltage transformer is low and less than 0.01%.
When the temperature coefficient is different between two instrumentation transformers, such as can occur with a capacitive voltage transformer, the difference could be up to 1% between the two transformers.
Measurement errors introduced by temperature should be considered when using either a current magnetic transformer or a capacitive voltage transformer in a remote calibration application. Further research on this constraint is needed, such as using real-world field data.

Author Contributions

Conceptualization, J.R. and J.D.; methodology, B.V. and S.R.; software, S.R.; validation, B.V. and S.R.; formal analysis, B.V. and S.R.; investigation, B.V. and S.R.; writing—original draft preparation, B.V.; writing—review and editing, J.R., J.K. and J.D.; supervision, J.R., J.K. and J.D. All authors have read and agreed to the published version of the manuscript.

Funding

This research received no external funding.

Data Availability Statement

The data presented in this study are available on request from the corresponding author.

Conflicts of Interest

The authors declare no conflict of interest.

References

  1. Brandolini, A.; Faifer, M.; Ottoboni, R. A Simple Method for the Calibration of Traditional and Electronic Measurement Current and Voltage Transformers. IEEE Trans. Instrum. Meas. 2009, 58, 1345–1353. [Google Scholar] [CrossRef]
  2. Suomalainen, E.P.; Hallstrom, J.K. Onsite Calibration of a Current Transformer Using a Rogowski Coil. IEEE Trans. Instrum. Meas. 2009, 58, 1054–1058. [Google Scholar] [CrossRef]
  3. Corney, A. Simple absolute method for current transformer calibration. IEEE Trans. Instrum. Meas. 2001, 50, 278–281. [Google Scholar] [CrossRef]
  4. Adibi, M.M.; Thorne, D.K. Remote Measurement Calibration. IEEE Trans. Power Syst. 1986, PWRS-1, 194–199. [Google Scholar] [CrossRef]
  5. Adibi, M.; Clements, K.; Kafka, R.; Stovall, J. Remote measurement calibration. IEEE Comput. Appl. Power 1990, 3, 37–42. [Google Scholar] [CrossRef]
  6. Pal, A. On-line Calibration of Voltage Transformers Using Synchrophasor Measurements. IEEE Trans. Power Deliv. 2016, 31, 370–380. [Google Scholar] [CrossRef]
  7. Wu, Z. Synchronized Phasor Measurement Applications in Three-phase Power Systems; Virginia Polytechnic Institute and State University: Blacksburg, VA, USA, 2013. [Google Scholar]
  8. Rens, J.; Rens, S.; Gerhard, B.; Desmet, J. On the Remote Calibration of Voltage Transformers: Validation of Opportunity. In Proceedings of the 2018 IEEE 9th International Workshop on Applied Measurements for Power Systems (AMPS), Bologna, Italy, 26–28 September 2018. [Google Scholar]
  9. Mingotti, A.; Peretto, L.; Tinarelli, R. Uncertainty Analysis of an Equivalent Synchronization Method for Phasor Measurements. IEEE Trans. Instrum. Meas. 2018, 67, 2444–2452. [Google Scholar] [CrossRef]
  10. BIPM. Evaluation of Measurement—Guide to the Expression of Uncertainty in Measurement; Bureau International des Poids et Mesures: Sèvres, France, 2008. [Google Scholar]
  11. Ferrero, A. The Pillars of Metrology. IEEE Instrum. Meas. Mag. 2015, 18, 7–11. [Google Scholar] [CrossRef]
  12. IEEE C57.13-2016; Standard Requirements for Instrument Transformers. IEEE: Piscataway, NJ, USA, 2008.
  13. IEC 61869-1:2007; Instrument Transformers—Part 1: General Requirements. IEC: Geneva, Switzerland, 2007.
  14. IEC 61869-2:2012; Instrument Transformers—Part 2: Additional Requirements for Current Transformers. IEC: Geneva, Switzerland, 2012.
  15. IEC 61869-5:2011; Instrument Transformers—Part 5: Additional Requirements for Capacitor Voltage Transformers. IEC: Geneva, Switzerland, 2011.
  16. Salicone, S. Measurement Uncertainty. In An Approach via the Mathematical Theory of Evidence; Springer Science + Business Media: New York, NY, USA, 2007; pp. 1–15. [Google Scholar]
  17. Pegoraro, P.A.; Brady, K.; Castello, P.; Muscas, C.; Meier, A.V. Compensation of Systematic Measurement Errors in a PMU-Based Monitoring System for Electric Distribution Grids. IEEE Trans. Instrum. Meas. 2019, 68, 3871–3882. [Google Scholar] [CrossRef]
  18. Mingotti, A.; Pasini, L.P.G.; Tinarelli, R. Effect of Temperature on the Accuracy of Inductive Current Transformers. In Proceedings of the IEEE International Instrumentation and Measurement Technology Conference (I2MTC), Houston, TX, USA, 4–17 May 2018. [Google Scholar]
  19. Ivano, G.; Mingotti, A.; Peretto, L.; Tinarelli, R.; Mauri, F. Assessment of Metrological Characteristics of Calibration Systems for Accuracy vs. Temperature Verification of Voltage Transformer. In Proceedings of the 2017 IEEE International Workshop on Applied Measurements for Power Systems (AMPS), Liverpool, UK, 20–22 September 2017. [Google Scholar]
  20. IEEE-C37.118; Standard for Synchrophasor Measurements for Power Systems. IEEE: Piscataway, NJ, USA, 2011.
  21. Wu, Z.; Thomas, K.; Sun, R.; Centeno, V.A.; Phadke, A.G. Three-Phase Instrument Transformer Calibration with Sunchronized Phasor Measurements; Innovative Smart Grid Technologies: Washington, DC, USA, 2012. [Google Scholar]
  22. Zhou, M. Advanced Systems Monitoring with Phasor Measurements; VT: Blacksburg, VA, USA, 2008. [Google Scholar]
  23. Hinge, T.P.; Dambhare, S.S. A novel approach for calibration of Instrument Transformers using synchro-phasors. In Proceedings of the 2016 National Power Systems Conference (NPSC), Bhubaneswar, India, 19–21 December 2016. [Google Scholar]
  24. Wu, Z.; Zora, L.T.; Phadke, A.G. Simultaneous transmission line parameter and PMU measurement calibration. In Proceedings of the 2015 IEEE Power & Energy Society General Meeting, Denver, CO, USA, 26–30 July 2015. [Google Scholar]
  25. Bell, S. A Beginner’s Guide to Uncertainty of Measurement; National Physical Laboratory: Teddington, UK, 2001. [Google Scholar]
  26. IEC 61869-3:2011; Instrument Transformers—Part 3: Additional Requirements for Inductive Voltage Transfromers. IEC: Geneva, Switzerland, 2011.
  27. IEEE C57.13.5-2009; Standard for Performance and Test Requirements for Instrument Transformers of a Nominal System Voltage of 115 kV and above. IEEE: Piscataway, NJ, USA, 2009.
  28. ABB AB High Voltage Products. Instrument Transformers Application Guide; ABB AB High Voltage Products: Ludvika, Sweden, 2015. [Google Scholar]
  29. Groszkowski, J. The temperature coefficient of inductance. Proc. Inst. Radio Eng. 1937, 25, 448–464. [Google Scholar] [CrossRef]
  30. Ansari, M.; Saxena, J.; Saxena, A.K. Comparison of Temperature Coefficent of Standard Inductor by Measuring Change in Inductance and Resistance; National Physical Laboratory India: New Delhi, India, 2010. [Google Scholar]
  31. Texas Instruments. LDC 1000 Temperature Compensation; Texas Instruments: Dallas, TX, USA, 2013. [Google Scholar]
  32. Kunde, K.; Däumling, H.; Huth, R.; Schlierf, H.-W.; Schmid, J. Frequency Response of Instrument Transformers in the kHz range. Compon. Peripher. 2012, 6, 1–4. [Google Scholar]
  33. Hu, H.-B.; Zhou, Y.; Ji, Z. The steady—State error Analyis of new type high voltage EVT and its modification. In Proceedings of the 2012 Asia-Pacific Power and Energy Engineering Conference, Shanghai, China, 27–29 March 2012. [Google Scholar]
  34. Wang, D.; Wang, J. Study on error characteristics of capacitor voltage transformer. High Volt. Appar. 2001, 37. [Google Scholar]
  35. He, M.-C.; Zhang, J.-P.; Zhao, J.-T. Influence of the Temperature Changes on CVT’s Accuracy. Power Capacit. 2006, 1, 13–17. [Google Scholar]
  36. Jian, L.; Hao, Z.; Chao, G.; Qian, Z. Harmonic voltage measurement error of the capacitor voltage transformer. PLoS ONE 2018, 13, e0205231. [Google Scholar]
  37. Chen, B.; Du, L.; Liu, K.; Chen, X.; Zhang, F.; Yang, F. Measurement error estimation for Capacitive Voltage Transformer by Insulation Parameters. Energies 2017, 10, 357. [Google Scholar] [CrossRef] [Green Version]
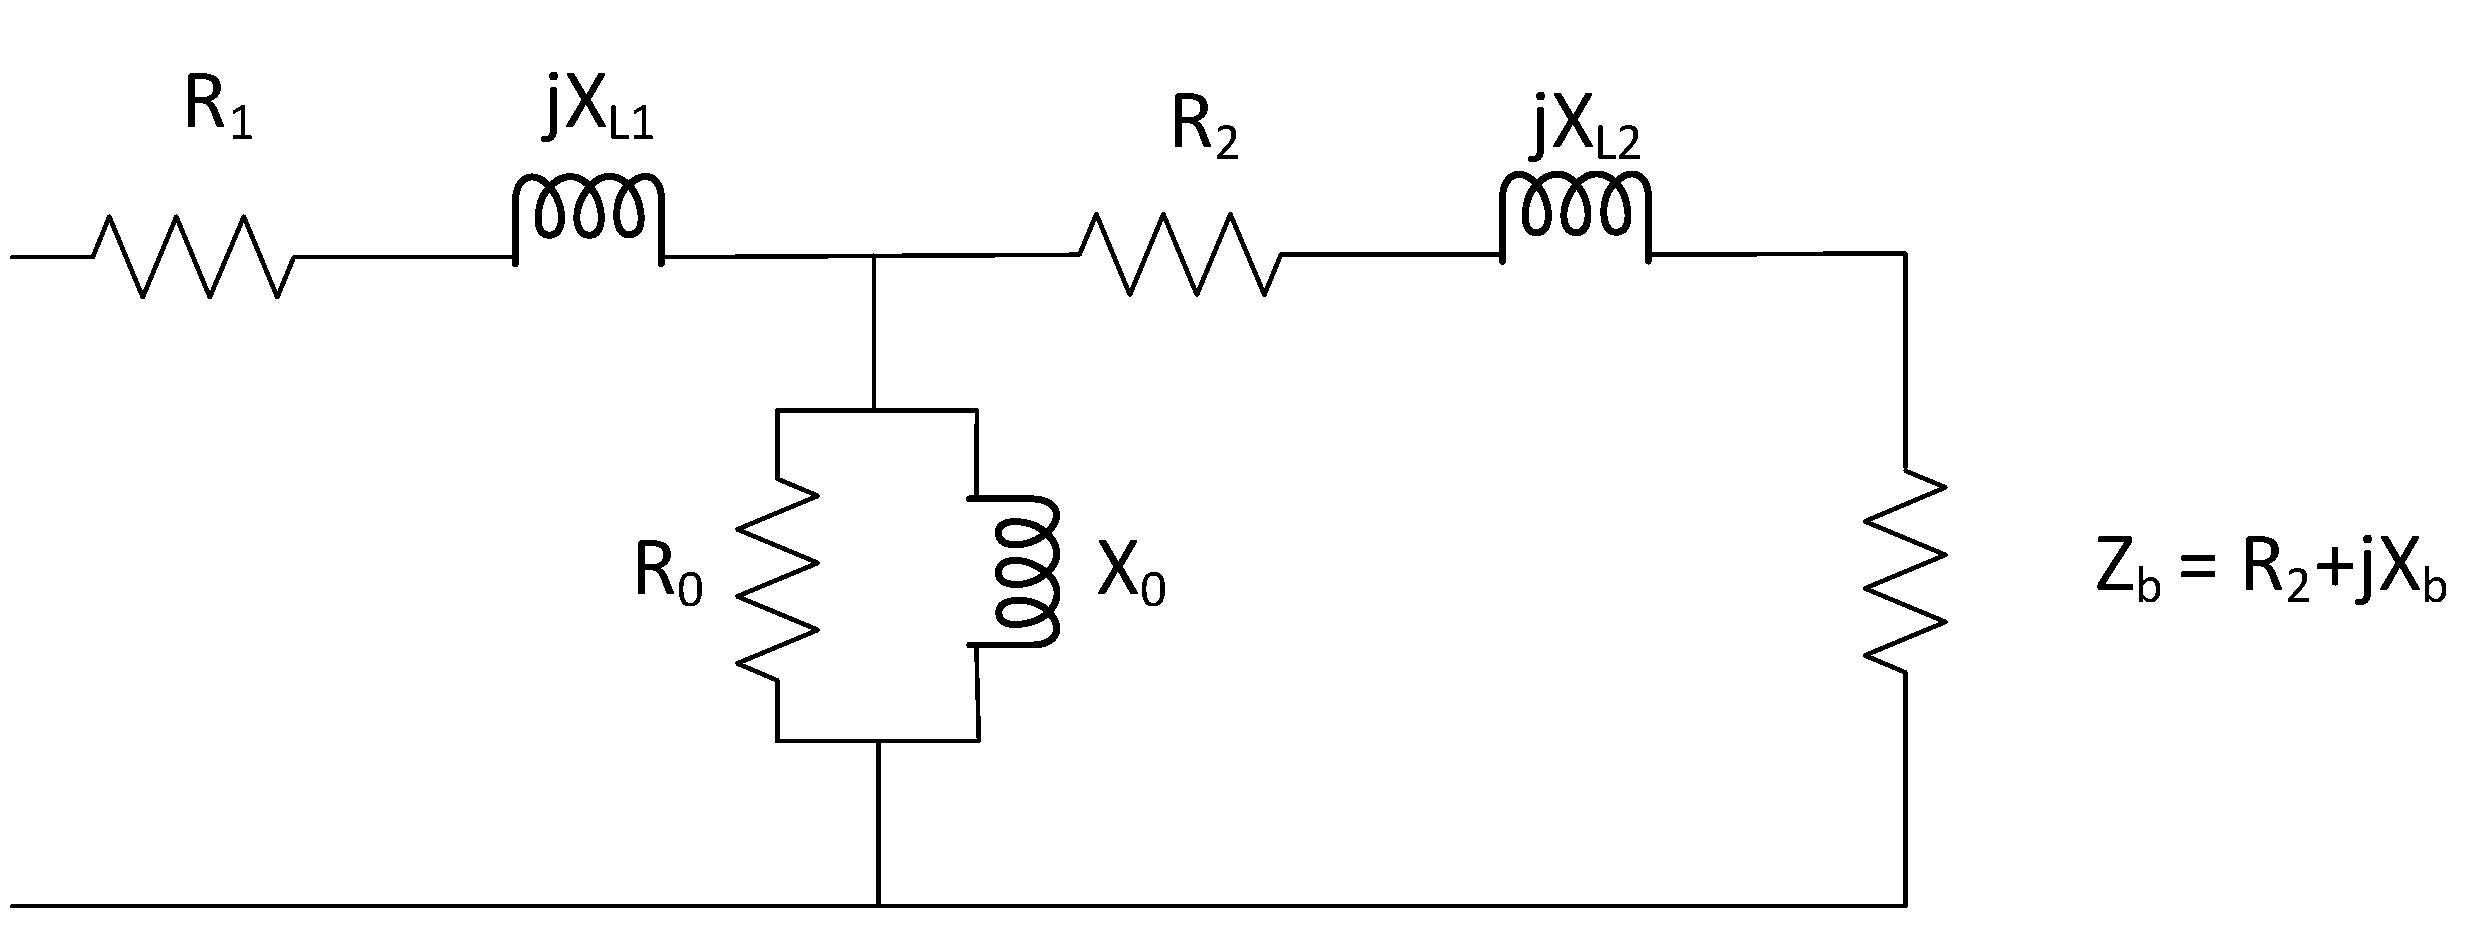
Figure 1. Simplified equivalent circuit diagram of a current transformer.
Energies 16 04744 g001
Figure 2. Magnitude and phase angle error of a 100/5 A current transformer at different temperatures.
Energies 16 04744 g002
Figure 3. Magnitude and phase angle error of a 50/1 A current transformer at different temperatures.
Energies 16 04744 g003
Figure 4. Magnitude and phase angle error of 75/1 A current transformer at different temperatures.
Energies 16 04744 g004
Figure 5. Resistance, inductance and impedance of 100/5 A current transformer at different temperatures with the primary winding open-circuited.
Energies 16 04744 g005
Figure 6. Resistance and inductance of 100/5 A current transformer at different temperatures with primary winding short-circuited.
Energies 16 04744 g006
Figure 7. Equivalent diagram of inductive voltage transformer.
Energies 16 04744 g007
Figure 8. Equivalent circuit of a CVT.
Energies 16 04744 g008
Figure 9. Equivalent circuit of a CVT with indication of components.
Energies 16 04744 g009
Figure 10. Thévenin equivalent circuit of a CVT.
Energies 16 04744 g010
Figure 11. Percent point change in magnitude error as a function of temperature and temperature factor (sensitivity analysis).
Energies 16 04744 g011
Figure 12. Percent point change in angle as a function of temperature and temperature factor.
Energies 16 04744 g012
Table 1. IEC 61869-2 limits of ratio error and phase displacement for measuring current transformers (classes 0.1 to 1) [14].
Accuracy ClassRatio Error +/− %Phase Displacement
+/− Minutes+/− Centiradians
At Current (% of Rated)At Current (% of Rated)At Current (% of Rated)
520100120520100120520100120
0.10.40.20.10.1158550.450.240.150.15
0.20.750.350.20.2301510100.90.450.30.3
0.51.50.750.50.5904530302.71.350.90.9
13.01.51.01.01809060605.42.71.81.8
Table 2. IEEE C57.13 standard accuracy class for metering service and corresponding limits of transformer correction factors and ratio correction factors (0.6 to 1.0 power factor (lagging) of metered load) [29].
Metering Accuracy ClassVoltage Transformers (at 90% to 110% Rated Voltage)Current Transformers
MinimumMaximumAt 100% Rated Current aAt 10% Rated CurrentAt 5% Rated Current
MinimumMaximumMinimumMaximumMinimumMaximum
0.15S b--0.99851.0015--0.99851.0015
0.150.99851.00150.99851.0015--0.99701.0030
0.15N--0.99851.00150.99701.0030--
0.3S--0.99701.0030--0.99701.0030
0.30.99701.00300.99701.00300.99401.0060--
0.60.99401.00600.99401.00600.98801.0120--
1.20.98801.01200.98801.01200.97601.0240--
a For Current transformers, the 100% rated current limit also applies to the current corresponding to the continuous thermal current rating factor. b Previously defined in IEEE std C57.13.6.
Table 3. Parameters used for a CVT from [36].
High-voltage capacitance C13.18 nF
Medium-voltage capacitance C254 nF
Winding resistance RLC766 Ω
Core resistance RLce9.288 MΩ
Winding inductance LLc24.71 H
Core inductance LLce148.9 H
Stray capacitance CLc61.17 pF
Leakage resistance RT11403 Ω
Leakage inductance LT11.27 H
Leakage resistance RT21054 Ω
Leakage inductance LT26.95 H
Excitation resistance RTM1070 Ω
Excitation inductance LTM53 kH
Rated burden resistance Rb645.2 kΩ
Rated burden inductance Xb1.54 kΩ
Disclaimer/Publisher’s Note: The statements, opinions and data contained in all publications are solely those of the individual author(s) and contributor(s) and not of MDPI and/or the editor(s). MDPI and/or the editor(s) disclaim responsibility for any injury to people or property resulting from any ideas, methods, instructions or products referred to in the content.