Article

Investigation of the Impact of Biochar Application on Foaming Slags with Varied Compositions in Electric Arc Furnace-Based Steel Production

Chair of Ferrous Metallurgy, Montanuniversitaet Leoben, 8700 Leoben, Austria
*
Author to whom correspondence should be addressed.
Energies 2023, 16(17), 6325; https://doi.org/10.3390/en16176325
Submission received: 10 August 2023 / Revised: 20 August 2023 / Accepted: 28 August 2023 / Published: 31 August 2023

Abstract

:
This paper investigates the influence of biochar, either as an individual component or in combination with high-temperature coke, on the slag foaming behavior. High-temperature coke serves as a reference. Three scenarios were considered to study the slag foaming behavior, each characterized by different slag chemical compositions. The results indicate that biochar can promote steady foaming for specific slags when the basicity (CaO/SiO2) falls within a range of 1.2 to 3.4. Experimental findings also reveal that stable foaming can be achieved when a mixture containing biochar and coke with a ratio of 1:1 is employed, with a minimum slag basicity of 1.0 and FeO content of 25 wt.%. The foaming range obtained using different FeO contents (15 wt.% to 40 wt.%) in the mixture surpasses the range observed with the individual application of coke or biochar. The X-ray diffraction (XRD) analysis showed that unrelated to the carbon source applied, the general pattern was that the phases larnite (Ca2SiO4) or dicalcium silicate were detected for slag foams with high basicity. Monticellite (CaMgSiO4) and magnesium iron oxide (Fe2MgO4) were predominant in slag foam samples, with the highest MgO content. The presence of monticellite and merwinite (Ca3MgSi2O8) occurred in samples with the lowest basicity. Eventually, the application of the mixture of coke and biochar showed the potential to obtain stable foaming across a wide range of slag compositions.

1. Introduction

For the electric arc furnace (EAF) process, the phenomenon of slag foaming is important because it not only improves reaction kinetics by increasing the effective surface area in electric steelmaking but also impedes the transfer of heat from the electric arc to the refractory lining [1,2,3,4,5,6]. In the slag foaming process, a carbon source is injected into the slag and reacts with FeO in the slag to form carbon monoxide (CO). In cases where CO gas bubbles cannot exit through the slag, the slag is considered to be undergoing a foaming [5]. At the same time, some iron in the slag will be reduced [2,7]. Fossil fuel carbon sources [8], namely, coal or cokes (metallurgical or petroleum), are commonly used as injected and charged carbon in the EAF process [9,10]. Applying conventional carbon sources has been extensively studied [10,11,12,13], and the main results have been analyzed in previous studies [14].
The practice of replacing fossil fuels with biomass-derived biochar by EAF has the potential to enhance environmental performance. This is because it avoids introducing additional carbon dioxide (CO2) emissions into the atmosphere [15,16]. With the increasing emphasis on sustainable practices and the utilization of alternative carbon sources [17,18,19], it has turned to studying the feasibility of biochar as a potential substitute for conventional carbon sources in slag foaming applications. Biochar is a carbon-rich material produced by torrefaction [20,21] or pyrolysis [22,23] of biomass, such as wood chips, agricultural residues, or organic waste [24]. In the past, studies have been conducted to investigate using non-conventional carbon sources for slag foaming. The purpose of these studies was to measure and evaluate the impact of these sources, both in quantitative and qualitative terms. Additionally, these studies aimed to develop strategies and approaches for effectively utilizing these non-conventional carbon sources [25,26,27]. Moreover, multiple investigations have been undertaken to study the phenomenon of slag foaming by utilizing non-conventional carbon sources either independently or in combination with conventional sources. Herein, a summary overview of the main outcomes is presented.
Robinson et al. [28] investigated two variants of biochar derived from woody biomass, along with synthetic graphite and anthracite coal. The study findings indicated that substituting a portion of conventional carbon sources with biochar from woody biomass did not lead to any deviations from the operational conditions observed when using traditional carbon sources in the EAF. Moreover, the researchers emphasized that biochar derived from biomass should possess certain characteristics, such as undergoing torrefaction and pyrolysis, to meet the specific requirements for its application in EAF.
Demus et al. [29] investigated residuals from a wood gasification plant and a product from pyrolysis of agricultural residuals as substitutes for fossil coal used in EAF steelmaking. Melting tests in the pilot EAF showed that the agglomerated biochar reacted similarly to the reference anthracite coal. Briquetting results in reduced reactivity and slower burnout compared to fine biochar.
Cirilli et al. [16] carried out long-term industrial trials employing two types of biochar, namely, biochar derived from TORR COAL (obtained in the process of torrefaction at a temperature of 300–350 °C) and biochar obtained from thermal pyrolysis (800 °C). Anthracite was used as a reference carbon source. FeO content in the slag was set to 30.5 wt.% (standard) and 29.1 wt.% (biochar). The outcomes of these trials demonstrated the practicability of incorporating biochar as a carbon source, with no significant alterations observed in the analysis of steel and slag properties.
Yunos et al. [30] investigated the interactions of palm shells with EAF slag (34.9 wt.% Fe2O3, 30.4 wt.% CaO, 6.9 wt.% Al2O3, 10.9 wt.% MgO, 11.6 wt.% SiO2, and 5.0 wt.% MnO), quantitatively estimating changes occurring in the slag volume as a function of time. In the case of palm char application, an increase in the slag volume and fluctuations has been observed. However, coke showed a low degree of fluctuations and poor volume ratios.
Hoikkaniemi et al. [31] studied slag foaming applied as carbon sources of coke dust (reference) and biochar, namely, spruce wood chips, after pyrolysis at 800 °C. The chemical composition of slag comprised 33.34 wt.% CaO, 16.59 wt.% SiO2, 7.06 wt.% Al2O3, 7.72 wt.% MgO, 0.85 wt.% MnO, 1.08 wt.% TiO2, 1.15 wt.% V2O5, and 29.02 wt.% FeO. According to the authors, biochar behaved comparably to coke dust as a foaming agent, suggesting its potential as a replacement for foaming agents derived from fossil fuels.
Contrariwise, several studies have reported that using biochar as an individual carbon source does not significantly impact slag foaming. DiGiovanni et al. [32] studied the feasibility of using biochar as an injection carbon material and establishing a methodology for ranking different injection carbon materials based on increased slag foam height. The composition of the slag was set to 23.0 wt.% FeO, 39.0 wt.% CaO, 14.0 wt.% SiO2, 10.0 wt.% MgO, and 8.0 wt.% Al2O3. This study evaluated the potential of various carbon sources, namely, industrial injection coal, loose biochar, and bio-briquettes for slag foaming. Initially, loose biochar individually did not show significant slag foaming. Therefore, it was mixed with nut coke at a ratio of 70% nut coke and 30% loose biochar, and the height of the resulting slag was measured. The results indicated that the mixture of 70% nut coke and 30% loose biochar showed a noticeable increase in slag height, suggesting effective slag foaming.
Conversely, studying the effect of using biogenic material (torrefied wood pellets) on the composition of steel and slag (30.1 wt.% CaO, 33.9 wt.% Fe2O3, 6.1 wt.% Al2O3, 10.7 wt.% MgO, 13.0 wt.% SiO2, and 6.2 wt.% MnO) using an induction melting furnace, Huang et al. [27] concluded that the potential increase in foaming when using biochar mixed with coke might be limited compared to the foaming achieved with coke individually.
Based on the analysis, it can be deduced that achieving a stable slag foam proves to be challenging when biochar is employed as the individual carbon source. Biochar shows limitations in its application compared to conventional carbon sources. Nevertheless, previous research results [14,33,34] have shown favorable effects of using a mixture of coke and biochar in slag foaming. Adding a mixture of coke and biochar to the slag has enhanced foam stability and increased slag foaming characteristics compared to applying biochar as an individual source.
The objective of this study is to quantify the foaming behavior based on the foaming characteristics of slag by analyzing foam height, foam volume, relative foam volume, and volumetric gas fraction using the slag samples prepared with different chemical compositions and carbon sources, including 100 wt.% high-temperature coke, 100 wt.% biochar, or a mixture of coke and biochar with a ratio of 1:1. Additionally, the influence of utilizing different carbon sources on the composition of the resulting slag foams is evaluated qualitatively by estimating the general chemical and phase composition of foam samples. This enables a practical explanation of the way the biochar application, either as an individual carbon source or in combination with conventional carbon sources, results in comparable outcomes to those achieved based on traditional carbon sources.

2. Materials and Methods

The slags used in this study were produced from powders consisting of specific chemical components, including FeO, CaO (at least 96% purity), SiO2 (at least 99% purity), MgO (at least 98% purity), and Al2O3 (at least 99% purity). Since the main chemical composites of EAF slags can vary and generally consist of FeO (10–40 wt.%), CaO (22–60 wt.%), SiO2 (6–34 wt.%), Al2O3 (3–14 wt.%), and MgO (3–13 wt.%) [35], this study of the application of different carbon sources considered the following three scenarios with compositions:
(1)
In the first scenario, the slags had a constant FeO content of 25 wt.%, and the basicity (B2) was varied within the range of 1.0 to 3.4. Basicity was defined as the ratio of CaO to SiO2. Additionally, another basicity (B3) was defined as the ratio of CaO to the sum of SiO2 and Al2O3, and it varied between 0.8 and 2.0. The MgO content ranged from 15.0 to 6.0 wt.%, as shown in Table 1;
(2)
In the second scenario, the slags had a constant basicity B2 of 1.4 and basicity B3 of 1.0, as well as the content of Al2O3 8 wt.%. Nevertheless, the FeO content varied between 24.0 and 30.7 wt.%, and the MgO content varied between 9.34 and 16.03 wt.%, as shown in Table 2;
(3)
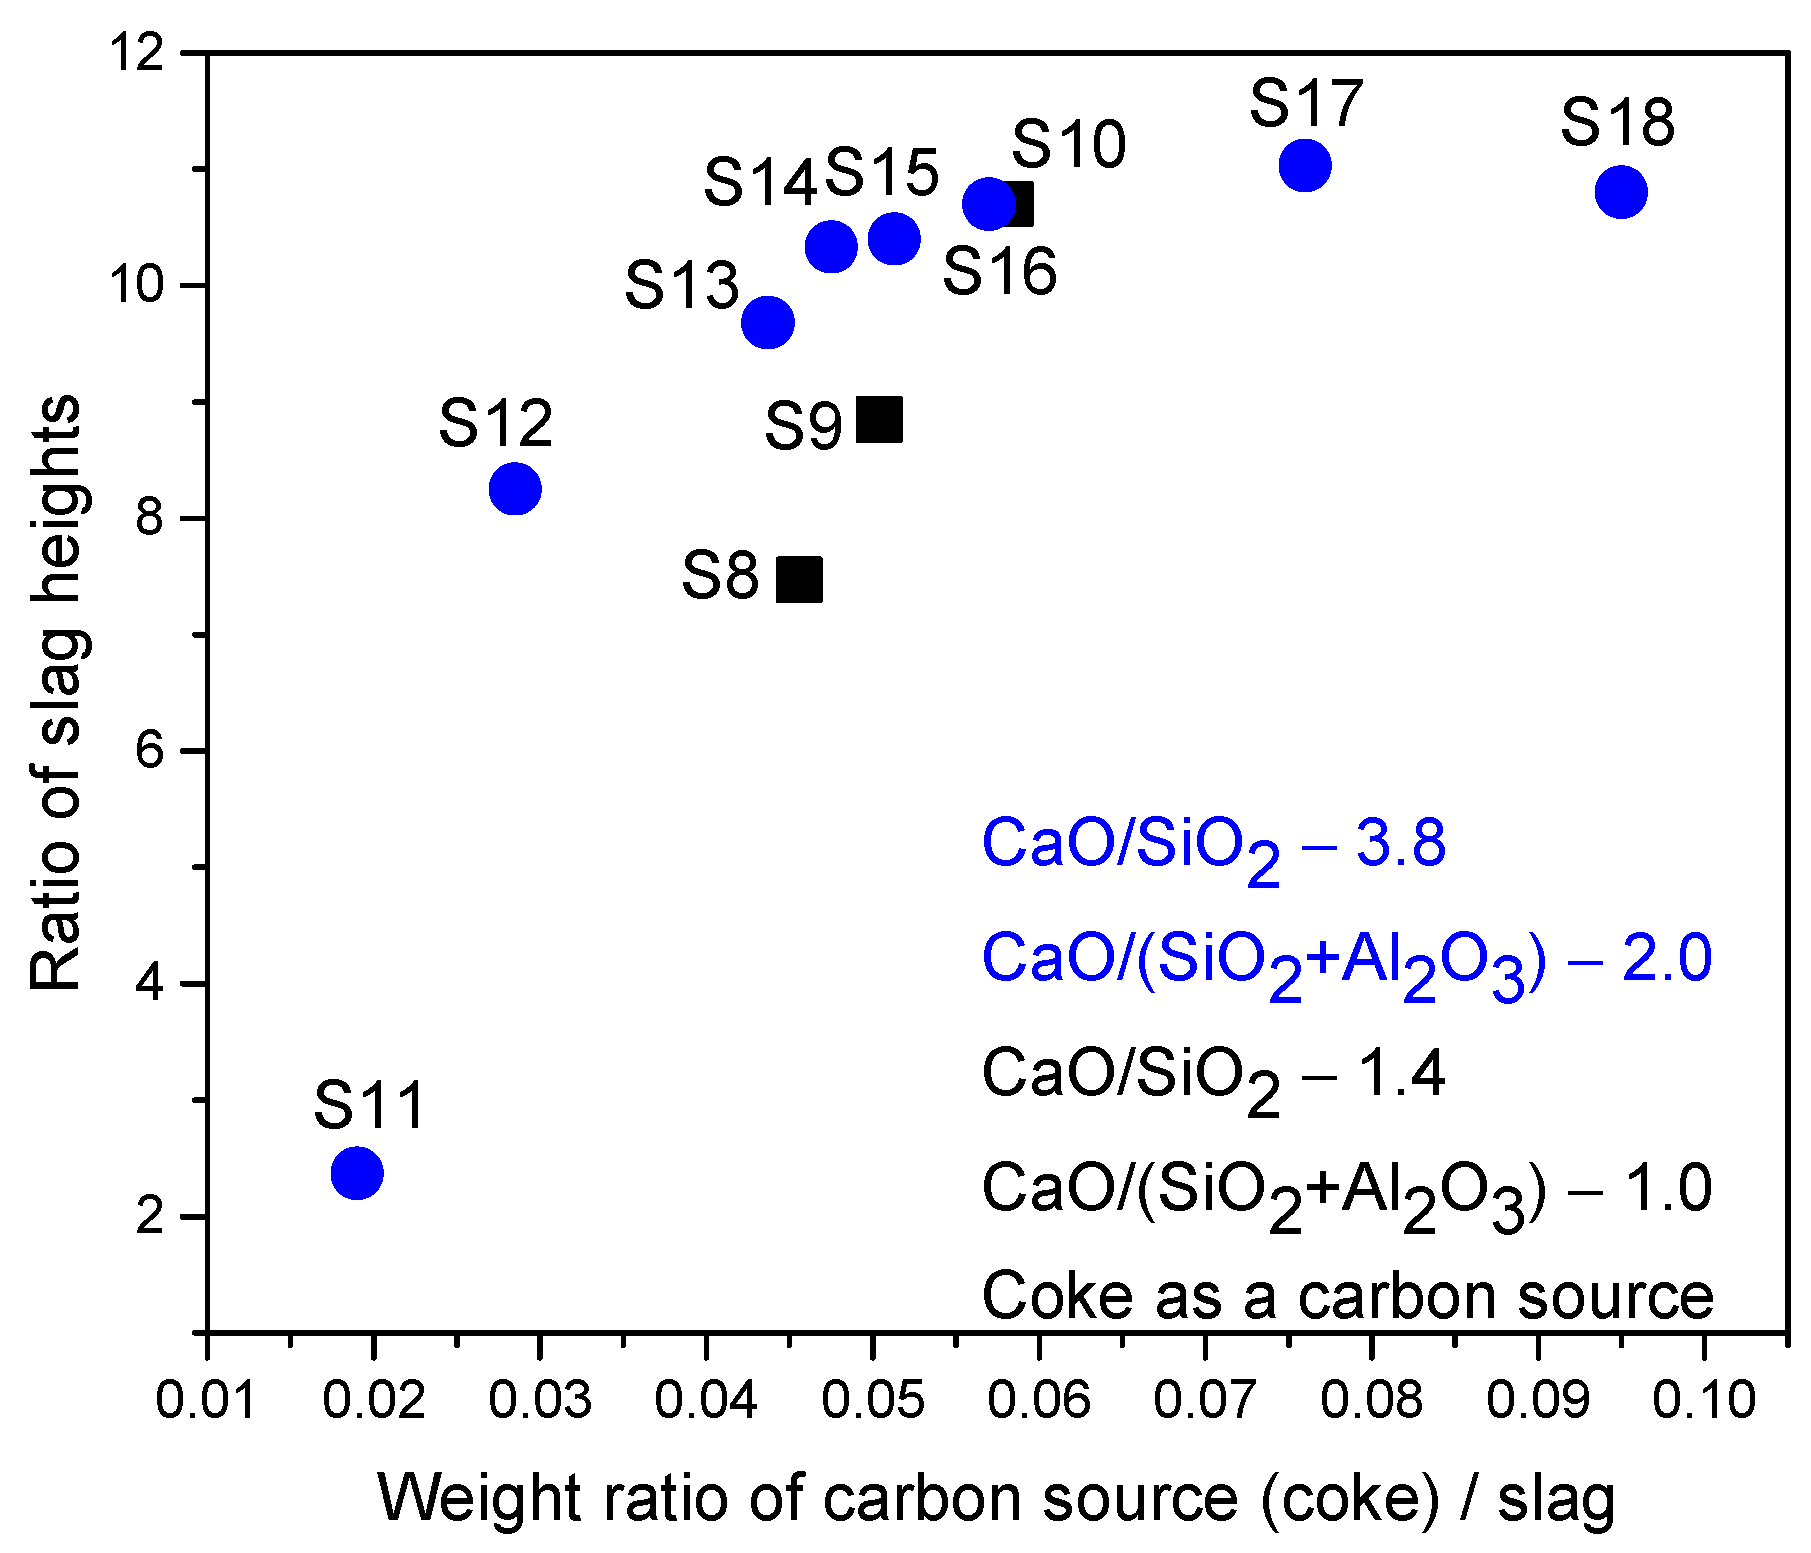
In the third scenario, the slags have a constant basicity B2 of 3.8 and a basicity B3 of 2.0. However, the FeO content varied between 10 and 50 wt.%, and the MgO content varied between 5.72 and 11.16 wt.%, as shown in Table 3.
The slag density and surface tension have been calculated according to [36]. Slag viscosity has been determined via FactSage v.8.2. Since the foaming index is supposed to be a function of the physical properties of the slag, it was calculated according to [37,38].
At the same time, two carbon sources (Table 4) were used in this study: high-temperature metallurgical coke (as a reference); wood biochar (Bch) obtained after pyrolysis at 600 °C [34]; and the mixture of coke and biochar with a ratio of 1:1 based on fixed carbon (Cfix) with stable grain size from 0.5 to 1.0 mm.
The Fourier transform infrared (FTIR) spectroscopy equipped with attenuated total reflectance (ATR) for two samples of carbon sources was performed by an Agilent Cary 630 FTIR spectrometer manufactured by Agilent Technologies, USA. The biochar or coke samples were scanned 32 times in the wavenumber range of 4000–650 cm−1 with a spectral resolution of 2 cm−1 and wavenumber accuracy of 0.05 cm−1. OriginPro 2016 (9.3) software was used to evaluate the peaks of the spectra.
Proton nuclear magnetic resonance (1H NMR) spectroscopy for coke and biochar samples was performed via Bruker Ascend 400 MHz with Automation. The 1H 90° hard pulse was optimized for each sample. The duration of the low-power pulse for mixing was 400 ms in every case. Both NMR experiments were performed at 25 °C.
For slag foaming experiments, the carbon content was determined using stoichiometric calculations based on the required reduction described by the following equation FeO(slag) + C = Fe(1) + CO [12] and is presented in Table 5.
All foaming experiments were conducted using an induction high-temperature furnace MU-900 (Indutherm Erwärmungsanlagen GmbH, Walzbachtal, Germany). Prior to experiments, approximately 5 g of ultra-low carbon (ULC) steel (containing 0.007 wt.% carbon) was placed at the bottom of the crucible of alumina (with an inner diameter of 63 mm, wall thickness of 4 mm, and height of 99 mm). Subsequently, 100 g of slag powder was added to the crucible. The filled alumina crucible was placed inside a graphite crucible (with an inner diameter of 70.3 mm, wall thickness of 20 mm, and height of 202 mm). Throughout each test, the system was continuously flushed with nitrogen at a rate of 1000 L/h. Once the temperature reached 1600 °C, it was held constant for a duration of 30 min. The height of the molten slag was measured by inserting a molybdenum stick into the slag and observing the resulting mark, which was then measured using a ruler. Afterward, a carbon source was added to the molten slag to initiate the foaming process. The carbon-slag reaction was enhanced by mixing the molten slag and carbon source using a molybdenum stick at the beginning of the foaming process. The foaming process was over after reaching a steady foam height and no subsequent changes in slag foam height, alongside a complete carbon material reaction. Following the conclusion of the test, the alumina crucible was extracted from the graphite crucible and subjected to cooling using liquid nitrogen. This cooling process served to solidify the slag foam, facilitating further investigation. The foaming continued depending on the carbon source and slag composition for 2 to 4 min in the case of biochar and 4 to 9 min for coke or a mixture of coke and biochar.
The height of the slag foam was determined by calculating the difference between the upper surface of the foam and the non-foamed layer located at the bottom of the crucible (Figure 1). This measurement was repeated at three different positions within the crucible, and the resulting values were averaged to obtain the mean height of the slag foam.
Based on the foam height, the volume of slag before (Vslag) and after foaming (Vfoam) was calculated using Equations (1) and (2):
V s l a g = d 2 · π 4 · h s l a g ,
V f o a m = d 2 · π 4 · h f o a m ,
where d is the inner diameter of the crucible, cm; hslag is slag height before foaming, cm; hfoam is slag height after foaming, cm.
Additionally, the slag weight (Table 1), the inner diameter of the alumina crucible, slag density (Table 1), and Equation (1) were used to calculate the initial slag height without foaming.
The relative foaming volume ( Δ V V 0 ) was calculated by Equation (3):
Δ V V 0 = V f o a m V s l a g V s l a g ,
The foaming height was estimated after the experiments, and the volumetric gas fraction contained in the foam ( X g a s ) was also calculated using Equation (4), according to [39,40].
X g a s = h f o a m h s l a g h f o a m ,
where hfoam is slag height after foaming, cm; hslag is slag height before foaming, cm.
The powdered slag foam samples were subjected to X-ray diffraction (XRD) analysis using a Bruker AXS D8 advance diffractometer. The XRD spectra were recorded using a lynxeye detector and a Cu X-ray tube emitting Cu Kα radiation.
General chemical compositions of powdered slag foam samples were measured using EDS.

3. Results and Discussion

3.1. Evaluation of Carbon Sources via Fourier Transform Infrared Spectroscopy and Proton Nuclear Magnetic Resonance Spectroscopy

The two carbon sources, namely, coke and biochar, are investigated using an FTIR spectroscopy, and the spectra are presented in Figure 2.
Figure 2 evidences the chemical differences between biochar and coke. It is seen that various functional groups in the FTIR spectra of coke and biochar are represented by the peaks located at 3520–3200 cm−1 -OH stretching (alcohols), 2915–2842 cm−1 C-H stretching (aliphatic), 1870–1540 cm−1 (oxygen-containing functional group), and 900–700 cm−1 C-Har out-of-plane deformation (aromatic group). In the coke samples, the stretching of –OH and other volatile groups was reduced compared to their presence in the corresponding biochar (3278 cm−1). This decrease in -OH stretching in coke is likely due to the loss of -OH during carbonization. Additionally, the C-H functional groups (2920 and 2851 cm−1) were found in biochar but were lacking in coke, as they were released as gaseous products (CO, CO2, and CH4) during carbonization. These agree with the conclusion reported by [41,42]. Nevertheless, the most pronounced peaks in coke samples were identified at 2307 cm−1 as an O=C=O stretching (carbon dioxide), at 2115 cm−1 C triple-bond (alkyne), and 1908 cm−1 C=C=C stretching (allene). In the case of biochar, approximately at position 2311 cm−1, O=C=O stretching (carbon dioxide) was found; at 2016 cm−1, C=C=N stretching (ketenimine) was identified, and at 1884 cm−1, C-H bending (aromatic compound) was determined.
Furthermore, stretching vibration peaks in the range of 1500 to 600 cm−1 were more evident in biochar compared to coke. The breakage of C-H and C-O bonds, corresponding to the formation of general gases, occurs during carbonization. The peaks related to oxygen-containing functional groups are attributed to the presence of an aromatic C double-bond and possibly other O-containing functional groups. The intensity of these peaks in coke is reduced due to the breaking of the C double-bond compared to the biochar sample (1575 cm−1) or the loss of O-containing functional groups caused by the higher carbonization temperature used in coke production. Additionally, the out-of-plane deformation of C-Har (aromatic group) stretching in biochar appeared more intense compared to coke.
Figure 3a,b present the proton nuclear magnetic resonance spectra for biochar and coke. It can be observed that nearly all peaks (A–E) are presented as singlets (s) both for biochar and coke. Only one peak F as multiplet (m) was detected for the biochar sample. Peaks (A–F) with chemical shifts in the region from 0.5 ppm to 3.0 ppm are evident, with the most common aliphatic proton [43]. Protons at the position around 1.0 ppm could be associated with alkyl groups, such as methyl (CH3) or methylene (CH2) groups, in organic compounds. The chemical shift range from 3.98 to 4.64 ppm generally corresponds to the region associated with proton signals near the region of aliphatic (saturated) hydrogens (biochar). Notably, most aliphatic groups disappeared after carbonization, as shown in the coke sample spectrum and as observed in FTIR results (Figure 2).
Protons attached to aromatic rings usually appear in the region from 6.0 ppm to 8.0 ppm. A pronounced peak at 8.0 ppm in the biochar sample suggests the presence of protons in an aromatic environment. The decrease in this peak can be observed for the coke sample.
The presence of more oxygen-containing functional groups and aliphatic groups indicates that biochar is a more reactive carbon source compared to coke, which may have an impact on the different foaming behavior of the slag.

3.2. Evaluation of Slag Foaming Behavior: The Case of 100 wt.% Coke as a Carbon Source

Before assessing the foaming of the slag, the initial height of the molten slag was estimated through calculations and measured during experiments. The slag weight, the inner diameter of the alumina crucible, and slag density were used to calculate the initial slag height without foaming. The slag volume was estimated using the calculated and measured heights obtained from the experiments. Figure 4a,b shows the combined results of comparing the difference between the calculated and measured values for slag height and the calculated and measured values for slag volume.
As has been reported in some papers [44,45], generally, foam height should decrease with the increase in the foaming index of slag and an increase in viscosity μ, a decrease in density ρ , and surface tension σ. Table 6 presents the results of evaluating the foaming characters of slags with a stable FeO content of 25 wt.%. These experiments utilized coke as the carbon source. The findings indicate that as the basicity increases, the viscosity decreases while the density and surface tension increase. Consequently, the foam height and volume of the slags also increase, ranging from 3.5 cm to 11.0 cm for foam height and from 109.05 cm3 to 342.72 cm3 for foam volume. However, for slags S6 and S7, further increases in basicity 3.1 and 3.4 resulted in a slight decrease in both the height and volume of the slag foam, measuring 8.5 cm and 8.0 cm for foam height and 264.83 cm3 and 249.25 cm3 for foam volume, respectively. Notably, the slags with basicity 1.0 had unstable foaming, with several collapses oscillating up and down. In Table 6, the value for slag with basicity 1.0 represents not so much a foam height as the highest point of oscillation after adding coke.
Since the characters of the relative volume of foaming and the volumetric gas fraction are dependent parameters on the height and volume of foam of the slag, a similar tendency was noticed for them: an increase in values and reaching the maximum value for S5 slag with basicity 2.7 and then a decrease.
All slag foam samples underwent qualitative assessment via XRD analysis, revealing different phases in each sample. Mainly, it detected such phases as silicates, namely, larnite Ca2SiO4 (00-033-0302) or dicalcium silicate (00-002-0843), gehlenite Ca2(Al(AlSi)O7) (01-079-2421), merwinite Ca3MgSi2O8 (01-074-0382), and monticellite CaMgSiO4 (01-084-1320); ferrite, namely, brownmillerite Ca2(Al,Fe)2O5 (00-030-0226); metal oxide, namely, wuestite FeO (00-046-1312); spinels, namely, magnesium iron oxide Fe2MgO4 (01-077-2367) and magnesium aluminum oxide Mg0.4Al2.4O4 (01-084-0378); and some presence of metallic iron (00-003-1050), which are the common phases [46,47,48].
Among the slag foams S1–S7, the commonly identified phase is gehlenite (Figure 5). It can be concluded that monticellite and magnesium iron oxide are predominant in slag foam samples, with the highest MgO content. The presence of monticellite is detected only for slag foam samples where the lowest basicity was applied. Additionally, merwinite occurs in samples with the lowest basicity it aligns with [49].
Slag foams S6 and S7 showed similar phases, including gehlenite, wuestite, metallic iron, and a phase identified as calcium magnesium aluminum oxide silicate CaO-MgO-Al2O3-SiO2 (00-017-0736). This phase was detected only in slag foam samples where the highest basicity was set. Furthermore, the presence of larnite was found in samples S5–S7, where basicity from 2.7 to 3.4 was the highest among other slag foams. For slag foams S6 and S7, it could be one of the reasons for a decrease in foam height.
The slag foam samples were examined using SEM/EDS analysis to understand their chemical composition. The EDS study detected the presence of various elements, including aluminum (Al), silicon (Si), calcium (Ca), magnesium (Mg), iron (Fe), and oxygen (O) (as shown in Table 7). This analysis confirmed the findings of the XRD analysis and established correlations between these elements, confirming the identified phases. The general chemical composition range of the slag foams is as follows: 35.76–39.62 wt.% O; 2.27–7.48 wt.% Mg; 6.57–14.04 wt.% Al; 4.92–10.32 wt.% Si; 15.32–30.62 wt.% Ca; and 13.11–20.30 wt.% Fe. These elements align with oxygen distribution and are consistent with the mineral phases identified through XRD, which mainly consist of oxide compounds. An apparent decrease in the Mg content characterizes this group of slag foam. The Al content is increased, which is reasonable by using Al2O3 crucibles. This is observed for all samples unrelated to the slag foams or the carbon source used.
Table 8 shows the result of slag foaming where stable basicity and Al2O3 content were applied. The highest value of the foam height and the foam volume of slag was achieved using 26.5 wt.% FeO, and the content of MgO 13.52 wt.% and were 8.5 cm and 264.83 cm3, respectively. For the other two samples, the foam height and volume differ insignificantly. However, the lowest value of foaming characters is characterized by a sample of 24.0 wt.% FeO, and 16.03 wt.% MgO was used. In all three cases, stable foaming was observed during the experiments, although the foaming time varied and was about 8, 5.5, and 4 min for samples S8, S9, and S10, respectively. The foaming was faster with increasing content of FeO.
Figure 6 illustrates detected phase patterns in slag foam samples with stable basicity and Al2O3 content. The relatively high content of MgO likely influenced the formation of two spinels (magnesium iron oxide and magnesium aluminum oxide) in all three slag foam samples.
Additionally, it was observed that merwinite is present in samples with low basicity, as mentioned earlier. Sample S10 is also distinguished by the presence of wuestite, which can be attributed to the fact that the highest FeO content was applied among this group.
Table 9 presents values of general chemical composition for slag foam obtained by applying slags with stable basicity and Al2O3 content. An increase in the content of Fe and a decrease in the content of Mg were distinctive. The rest of the elements had similar values with slight fluctuations.
Table 10 presents the results of foaming slags with consistent basicity 3.8 but varying FeO content ranging from 10 to 50 wt.%. Increasing the FeO content from 10 wt.% to 30 wt.% increased both the slag foam height, from 2.3 cm to 10.1 cm, and the slag foam volume, ranging from 71.66 cm3 to 314.68 cm3. The viscosity decreased at higher FeO content, and foaming became significant, causing a decrease in the foaming index (Table 3). Additionally, increasing the FeO content within the slag results in a notable increase in slag density. These changes induce swifter drainage of the foam bubbles [50]. However, further increases in the FeO content (50 wt.%) led to a slight loss of foaming. Moreover, an increase in the FeO content leads to a decrease in the foaming index. The last two types of slag show a notable decrease in the foaming index. However, for the foaming, this was not reflected by a sharp change in the foaming characters. Based on experimental observations, it was noted that the last two types of slag exhibited a fluid-like behavior. This observation aligns with the findings mentioned in [51], which indicates that increased FeO content in the slag leads to higher fluidity. After adding coke, several slag foam collapses occurred, and a stable foam was formed.
Conversely, at a low FeO content (10 wt.%) after adding coke to the molten slag, instead of bubbles distributed, chaotic behavior of foaming was observed where the slag surface collapsed. Indeed, the height of this slag foam represents the highest point reached by the oscillation. This could be attributed to the high viscosity of the slag, preventing significant foaming [51,52]. The foaming index decreases with increased FeO content, which aligns with this study [12].
Based on the results shown in Table 10, the critical FeO content was obtained with 30 wt.% of this oxide within slag composition, below which foaming increased with increasing FeO content and above which the slag was too fluid, the foam became less stable, and multiple collapses occurred. Nevertheless, even with an increase in FeO content from 30 wt.% to 50 wt.%, the foaming characters did not significantly deteriorate. For the slags containing 40 wt.% FeO, the foam height and volume were measured at 9.6 cm and 299.10 cm3, respectively. Similarly, for the slags containing 50 wt.% FeO, the foam height and volume were 9.4 cm and 292.87 cm3, respectively.
Figure 7 depicts the correlation between the ratio of the slag heights and the weight ratio of coke/slag for a series of slags with varying FeO content, with coke utilized as the carbon source. The data reveal a general tendency for the weight ratio of coke/slag to increase as the ratio of slag heights increases; for slag containing 50 wt.% FeO, a slight decline in this tendency is observed.
The main crystallized phases in slag foams S11–S13 and S16–S18 are gehlenite, wuestite, metallic iron, and a calcium magnesium aluminum oxide silicate phase (Figure 8). In the case of S11 and S13–S18, there is a correlation between the amounts of calcium and silica, suggesting the presence of dicalcium silicate or larnite phases. Moreover, when analyzing slag foam S11 and S12, S14, and S15, and S18, they were observed to contain spinel magnesium iron oxide. Slag foams S14 and S15 represent the following phases: gehlenite; wuestite; calcium magnesium aluminum oxide silicate; larnite; and magnesium iron oxide. The difference only in slag foam S15 also consists of brownmillerite.
Table 11 presents the general chemical composition range of the slag foams as follows: 31.72–39.74 wt.% O; 1.36–6.18 wt.% Mg; 5.75–13.72 wt.% Al; 2.53–8.25 wt.% Si; 15.30–37.56 wt.% Ca; and 6.59–31.81 wt.% Fe. A characteristic of this group is an increase in Fe content; however, it is somewhat irregular.
To quantify slag foaming as a function of basicity or FeO content and foaming characters (foam height and foaming index), graphs were plotted with different basicities and FeO content, as shown in Figure 9a,b. In the case of basicity, the foaming characters initially increased as basicity increased. The group of slags with a stable FeO content demonstrated this tendency, with the S5 slag achieving maximum height and volume values. However, beyond this point, there was a subsequent decrease in the height and volume of the slag foam.
In the case of variation of FeO content, the foaming characters initially increased until reaching maximum values for the group of slags with stable basicity. The slag with 30 wt.% FeO reached the highest height and volume values in this group. However, further increases in FeO content resulted in a decrease in the height and volume of the slag foam.
Figure 9c,d summarizes the calculation results and represents the relationship between the gas fraction indicator and the relative volume of foam.
These dependencies are presented for both groups of slags, namely, for both stable FeO content and stable basicity. It has been observed that the lower the value of the volumetric gas fraction, the lower the relative foaming volume. Additionally, when using coke with an increase in the content of FeO from 15 wt.% to 50 wt.%, a significant change in the gas fraction was not observed (Figure 9d).
When using coke as a carbon source, the most optimal foaming characters were obtained for a group of slags with different basicities from 1.2 to 2.7 and for group slags with different FeO content from 15 to 30 wt.%.

3.3. Evaluation of Slag Foaming Behavior: Case of 100 wt.% Biochar as a Carbon Source

Table 12 shows the foaming characters for 100 wt.% biochar and slag samples with different basicities. The foaming was unstable when using slag with a basicity of 1.0, and the value of 3.1 cm characterizes the highest oscillation point during the experiment. Distinctive from the coke case is that the increase in basicity did not affect the foaming behavior, and in cases with slag foams S2–S6, the foaming values did not change and were within the experimental error corresponding to the average value of the foam height of 8.7 cm (±0.12) and the average foam volume of 270.61 cm3 (±24.5). The absence of change in foam height with increasing basicity could be due to the low interaction between highly reactive biochar and slag, as was reported in [27]. Despite some disadvantages of using biochar, in this case, stable foaming was achieved when a group of slag with different basicities from 1.2 to 3.4 was applied. The highest foaming values were achieved when using slag with a basicity of 3.4 and are 10.0 cm (foam height) and 311.56 cm3 (foam volume).
To summarize, the typical phases among the given slag foam samples are gehlenite, calcium magnesium aluminum oxide silicate, merwinite, and magnesium iron oxide (Figure 10). The presence of larnite is typical for samples with higher basicity, which was also observed for samples of slag foam (coke case). Only the S1 slag foam is characterized by the vast majority of peaks assigned to monticellite since this phase is notable for slags with low basicity, as noted in the case of coke. Additionally, metallic iron is present only in sample S5.
The general chemical composition range of the slag foams obtained using biochar (Table 13) is as follows: 35.23–38.50 wt.% O; 2.09–9.08 wt.% Mg; 5.65–16.15 wt.% Al; 3.72–12.23 wt.% Si; 20.82–29.89 wt.% Ca; and 13.33–20.59 wt.% Fe. These samples of slag foam exhibit a decrease in the levels of Mg and Si, while there is an increase in the content of Ca.
Table 14 shows the result of slag foaming using slags with stable basicity and content of Al2O3. In the case of biochar, the foaming characters are lower than with coke, and it is also noteworthy that there was no significant foaming change, and it was within experimental error. Furthermore, the foaming was fast in this case and ranged from 2 to 3 min.
The XRD analysis results for slag foams indicated no difference in the phase composition when using biochar as a carbon source compared to using coke. All the detected phases observed in the coke case are also present in the samples with biochar, as shown in Figure 11.
The general chemical composition of slag foam samples (Table 15) using biochar is not much different from the point where coke was used, and the elemental contents are close to this case.
Table 16 presents the results of using 100 wt.% biochar for slag compositions with different FeO content. The lowest value of the foam height is distinctive for a sample with a FeO content of 10 wt.% and is 2.5 cm, as with coke. This is the value for the highest point of the oscillation height. Stable foaming was obtained for samples containing FeO from 15 to 27 wt.%. In cases with a FeO content of 30–50 wt.%, very fast, uncontrolled foaming was observed, which exceeded the sizes of the crucible.
Figure 12 shows the correlation between the ratio of slag heights and the weight ratio of biochar/slag for a series of slags with varying FeO content, with biochar utilized as the carbon source. The data reveal a general tendency for the weight ratio of biochar/slag to increase as the ratio of slag heights increases; however, for slags containing 40 and 50 wt.% FeO, a slight decrease in this trend is observed. Furthermore, there is a visible decrease for samples S8–S10. The overall behavior is similar in the case of coke.
The phase composition analysis (Figure 13) showed that most samples contained gehlenite, except for the slag foam sample with 10 wt.% FeO. Larnite was detected in samples S11 (10 wt.% FeO), S13 (23 wt.% FeO), S15 (27 wt.% FeO), S16 (30 wt.% FeO), and S17 (40 wt.% FeO). Remarkably, metallic iron was only found in samples S14 (25 wt.% FeO), S15, S17, and S18 (50 wt.% FeO). Out of all the samples, only sample S14 exhibited the presence of magnesium aluminum oxide along with magnesium iron oxide. Spinel magnesium iron oxide was detected in the slag foam samples with FeO content ranging from 10 to 30 wt.%.
Additionally, the phase of brownmillerite was detected in slag foams S11, S13, S15, S16, and S18. Some samples, specifically S12 and S14, were characterized by the presence of monticellite and merwinite. Peaks corresponding to wuestite were observed in samples S13, S15, S17, and S18. Furthermore, calcium magnesium aluminum oxide silicate was present in samples S11, S13, and S16–S18.
The general chemical composition range of the slag foams obtained using biochar by applying slags with different content FeO, stable basicity (Table 17) is as follows: 31.72–39.74 wt.% O; 1.36–6.18 wt.% Mg; 5.75–13.72 wt.% Al; 2.53–8.25 wt.% Si; 15.30–37.56 wt.% Ca; and 6.59–31.81 wt.% Fe. Nonetheless, with the carbon source applied, these slag foams are characterized by an increased content of Fe, as previously observed for this kind of slag group.
Figure 14a–d shows the relationship between foam height, foaming index, and basicity or FeO content of slag samples. Notably, gas formation increases despite the absence of a change in the foam height in samples S2–S6 (Figure 14c,d). It can be concluded that when applying biochar as a carbon source, the most optimal foaming characters were obtained for a group of slags with different basicities from 1.2 to 3.4.
In the case of using biochar in the group of slags in which the content of FeO changed (Figure 14b), it was noticed that with an increase in the content of this oxide and with the addition of biochar, foaming occurred faster. Most likely, this is explained by the fact that biochar is a highly reactive carbon material (judging by FTIR and 1H NMR results) with a high content of volatile matter compared to coke. These experiments were characterized by a rather high biochar reactivity with air and CO2 and, as a result, a high reactivity with FeO, which is confirmed by the results, where FeO from 30–50 wt.% were applied, and uncontrolled foaming occurred. These conclusions have also been made in [32].
A significant disadvantage when using biochar was that when this material was added, some parts burned and did not contribute to the foaming process, which indicates that this material should be granulated [32] or should be subjected to a higher pyrolysis temperature.

3.4. Evaluation of Slag Foaming Behavior: The Case of Coke and Biochar Mixture with a Ratio of 1:1 as a Carbon Source

Table 18 shows the results of slag foaming with a stable content of FeO 25 wt.% and using a mixture of coke and biochar with a ratio of 1:1 as the carbon source. Unexpectedly, the foaming behavior differed from coke or biochar when the mixture was applied as a carbon source. With increasing basicity, the height and volume of the slag foam increased from 6.4 cm and 199.40 cm3, respectively, and reached a maximum value for slag with basicity of 2.7 at 10.5 cm for the slag foam height and 327.14 cm3 for the slag height volume. A subsequent increase in basicity led to a slight decrease in these indicators for the last two slag samples. However, from experimental observations, the last two samples, S6 and S7, were characterized by fast foaming compared to other slag samples. As with the use of coke or biochar, for slag with basicity 1.0, the lowest foaming characters for this group of slags were obtained. However, foaming characters’ values are higher than coke or biochar cases. This foam was stable during the test, which, in turn, leads to the conclusion that, somehow, the use of a mixture of coke and biochar mitigates the disadvantages of using coke or biochar as individual carbon sources.
For samples of slag foam in the case of using slags with different basicities and stable FeO content, the following main phases were identified and presented in Figure 15. The typical phases among the given samples are gehlenite, metallic iron, merwinite, and larnite. Magnesium iron oxide is also present in samples S1, S2, and S6. Monticellite is present in samples S1 and S2, as previously detected for slag foam samples with the lowest basicity and high content of MgO. Wuestite is present in samples S3–S5 and S7. Calcium magnesium aluminum oxide silicate is present in samples S6 and S7. Notably, this phase was seen mainly for samples where higher basicity prevails. However, the exception is XRD patterns of slag foams by applying slags with different basicities, stable FeO content, and, in the case of using biochar, as a carbon source. The phase of larnite is detected for slag foams with high basicity. Lastly, brownmillerite is present only in sample S5.
The general chemical composition range of the slag foams obtained using a mixture of coke and biochar by applying slags with different basicities and stable FeO (Table 19) is as follows: 31.90–40.70 wt.% O; 2.16–6.16 wt.% Mg; 7.05–15.42 wt.% Al; 4.55–9.25 wt.% Si; 21.39–30.71 wt.% Ca; and 14.61–18.05 wt.% Fe. It should be noted that the Mg content is relatively stable, and only for the slag foam sample, its content is 6.16 wt.%.
Table 20 presents the results of slag foaming with stable basicity and Al2O3 content. When biochar was used along with coke in the mixture, a foaming tendency was observed to be analogous compared to using only coke. It is worth noting that the foaming characters of the slag were practically similar to those of when coke was used as the individual carbon source. The foaming time was the longest, lasting approximately 9 min when using S8 slag. This longer duration could be attributed to the higher viscosity of the S8 slag compared to the other samples. In contrast, the foaming time for the remaining two samples was around 5 min.
In all three samples, the following common phases were identified: gehlenite; merwinite; magnesium iron oxide; magnesium aluminum oxide; and metallic iron (Figure 16). The slag sample, which had the highest amount of FeO at 30.7 wt.%, also contained wuestite in the slag foam. This tendency was observed in all samples with stable basicity and Al2O3.
Table 21 shows the content of elements for slag foams obtained using a mixture of coke and biochar as a carbon source. As in the previous cases, this group is characterized by a decrease in the content of Mg and an increase in Fe.
Table 22 shows the foaming characters of slag with different FeO content. It should be noted that when using a mixture of coke and biochar with a ratio of 1:1, foaming characters were obtained that were either close to or slightly higher than those obtained using coke. A higher FeO content led to a proportional increase in the height and volume of the slag foam. Precisely when the slag contained 40 or 50 wt.%, FeO showed a maximum foam height of 10.0 cm and 10.1 cm and foam volume of 311.57 cm3 and 314.68 cm3, respectively. However, it is important to note that using 50 wt.% FeO reached a critical point in the experiment. Only this specific test lasted approximately 3 min because, after adding a mixture of coke and biochar, the foaming exceeded the capacity of the crucible in which the slag was initially placed. This behavior can be explained by the fact that, in contrast to the use of 100 wt.% coke, in this case, part of the coke was replaced by biochar, which, in terms of its physicochemical properties, is more reactive, has a greater porosity and specific surface area in comparison with high-temperature coke, which is influenced by excessive and non-controlled foaming. Along with this, according to [52], an increase in FeO content enhances gas generation, thereby increasing foam height. Combining the increase in FeO content with the use of biochar could have a notable impact on the foaming process.
The utilization of 50 wt.% FeO may be unfavorable due to two main reasons. Firstly, it results in the significant generation of a gas fraction, which may not be desirable for the specific application. Secondly, the low viscosity of the liquid resulting from this composition allows for the easy removal of the formed bubbles [53]. Slag S11 containing the smallest amount of FeO 10 wt.% had a limited foam height, as it was too viscose.
Figure 17 shows the correlation between the ratio of slag heights, the weight ratio of coke and biochar/slag, and a set of slags with different FeO content. Generally, as the ratio of slag heights increases, there is a tendency for the weight ratio of coke and biochar/slag to slag heights to also increase. However, it is noteworthy that for slags containing 50 wt.% FeO, unlike the behavior observed with coke, the weight ratio sharply increases in this case.
For samples of slag foam in the case of using slags with different content FeO and stable basicity, it was identified that slag foams S11, S13, S14, S16, and S17 consist of gehlenite, calcium magnesium aluminum oxide silicate, larnite, magnesium iron oxide, and brownmillerite (Figure 18). Additionally, the presence of the wuestite phase was detected for samples S12, S13, and S18. The peak corresponding to metallic iron was detected for slag samples S14, S15, and S18.
Noteworthy, the phase magnesium iron oxide was not found for samples of slag foam, where the FeO content was set to 40 and 50 wt.% both in the case of using biochar and a mixture of coke and biochar. These samples are characterized mainly by the presence of brownmillerite, wuestite, and metallic iron.
The general chemical composition range of the slag foams obtained by applying slags with different content FeO, stable basicity (Table 23) is as follows: 26.16–47.17 wt.% O; 1.16–4.35 wt.% Mg; 7.86–13.64 wt.% Al; 1.77–4.27 wt.% Si; 14.83–41.59 wt.% Ca; and 7.31–32.12 wt.% Fe. Unlike the previous results observed for this group, where the iron content showed a consistent change for samples S13–S17, the pattern of change was irregular in this case. Notably, slag sample S11 shows the lowest value among all the samples.
Figure 19a–d shows the summarization of the results of slag foaming using a mixture of coke and biochar. For a group of slags with a stable FeO content, the maximum values of foaming character (foam height) were achieved for slags with basicity 2.0 and 2.7, the values of which are nearly similar. Then, there was a decrease in foam height.
In contrast to the coke case, a different foaming behavior was observed for a set of slags with consistent basicity but varying FeO content (as shown in Figure 19b). As the FeO content increased, the foaming characters showed a corresponding increase, with the maximum values reached at 50 wt.% FeO. Notably, unlike the tests conducted with coke, gas formation (as shown in Figure 19d) continued to increase.
Similarly, the third group, comprising slags with different FeO content of 15 to 30 wt.%, showed optimal foaming properties. Particularly, the partial substitution of coke with biochar in the mixture showed that in the case of basicity variations, stable foaming was achieved with a minimum basicity value of 1.0 and a FeO content of 25 wt.%. For different FeO content, stable foaming was obtained from a range of 15 wt.% to 40 wt.% of this oxide, with a basicity of 3.8.
The results showed that adding biochar to the coke positively affects the foaming process. When a mixture of coke and biochar with a ratio of 1:1 was used, it produced a different foaming behavior than coke or biochar as carbon sources. Firstly, the reaction FeO + C = Fe + CO is of great importance in the slag foaming [12,53]; therefore, after adding the mixture to the molten slag, the biochar component, possessing greater porosity, surface area [34], and higher reactivity relative to coke, as evidenced by FTIR results, could react fast enough at the initial stages of foaming. It should be taken into account that the volatile matters of biochar (41.04 wt.% daf) could also contribute to the gasification C(s) + CO2(g) = 2CO(g) via the Boudouard reaction [54], as well as in the reaction of the water vapor [30] in accordance with H2O(g) + C(s) = CO(g) + H2. However, experimental results showed that the foaming time with 100 wt.% biochar was 3–4 min, indicating its fast reactivity. On the other hand, when using the mixture, the foaming time ranged from 6 to 9 min depending on the slag composition (the only exception is one test, which lasted about 3 min in the case of 50 wt.% FeO and was disregarded). This leads to the conclusion that even with a partial replacement of coke, it could have a major effect throughout the entire foaming process. Additionally, using a mixture of biochar and coke probably generated more CO/CO2 than using 100 wt.% coke or 100 wt.% biochar, resulting in a longer reaction time compared to biochar use and enhancing the foaming process.

4. Conclusions

The foaming behavior of slags with chemical composition variations and three carbon sources, namely, 100 wt.% high-temperature coke as a reference, 100 wt.% biochar and a mixture of coke and biochar with a ratio of 1:1 has been evaluated both quantitively and qualitatively. The main findings can be emphasized:
(1)
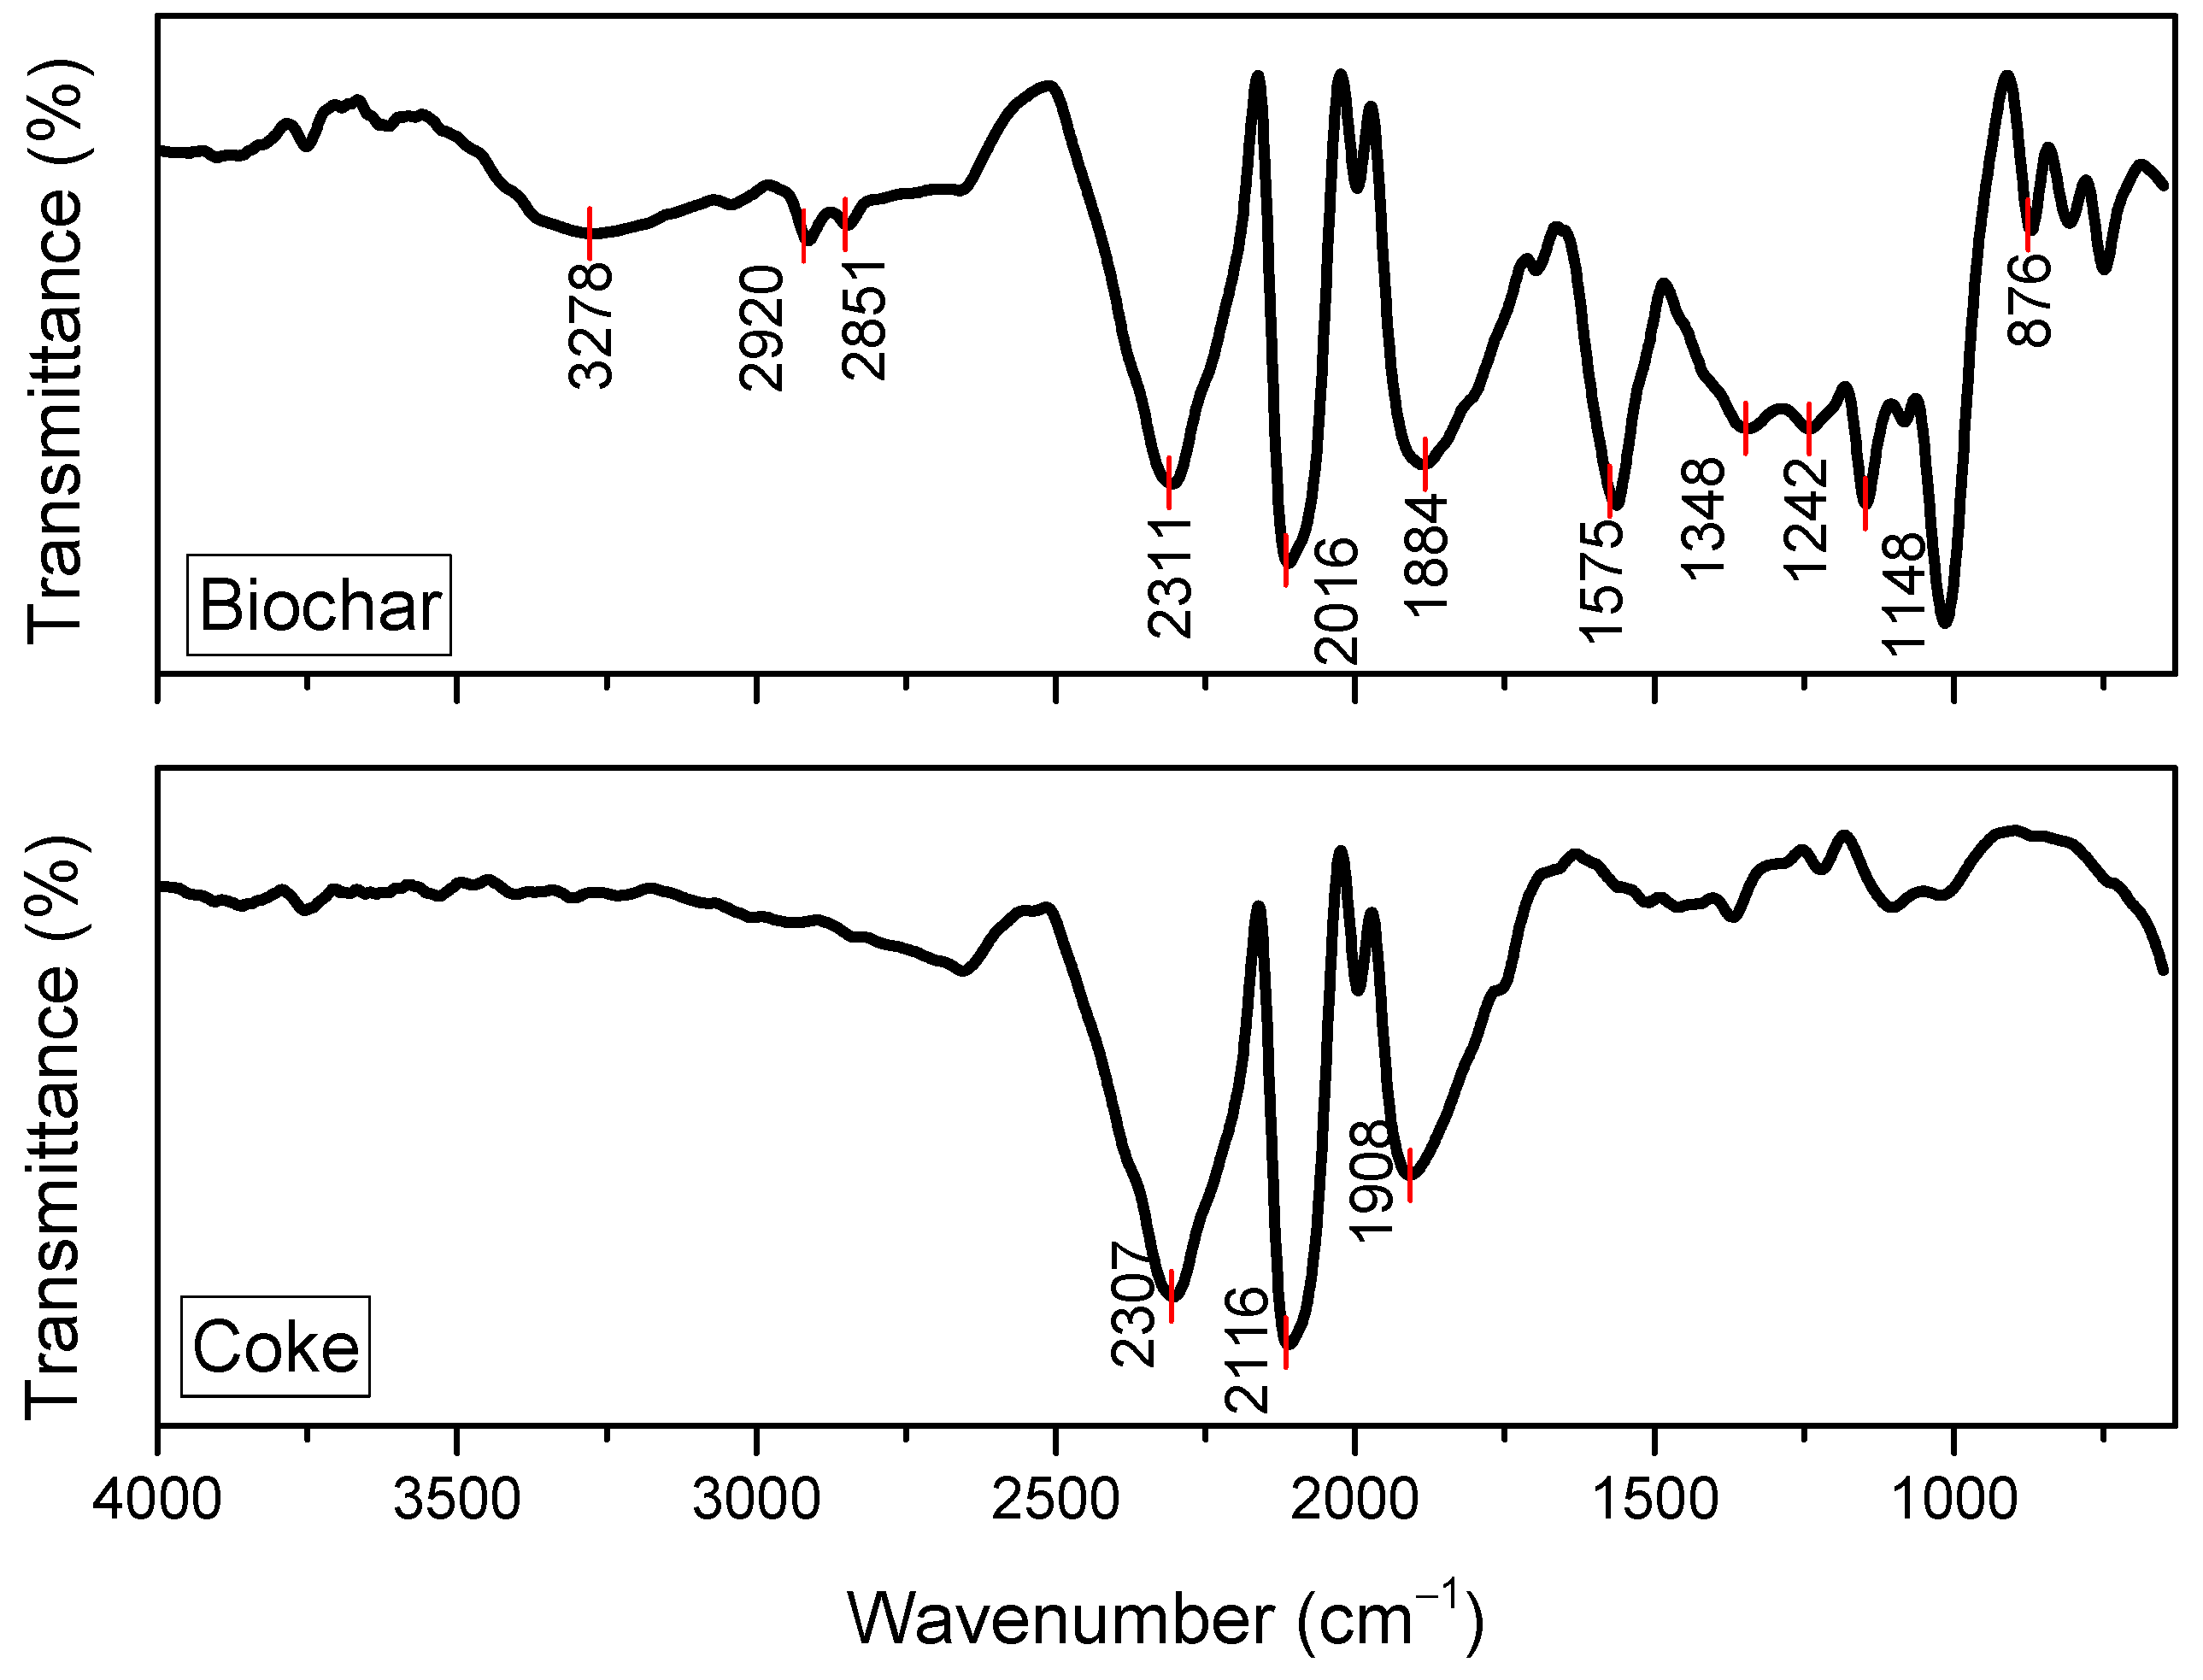
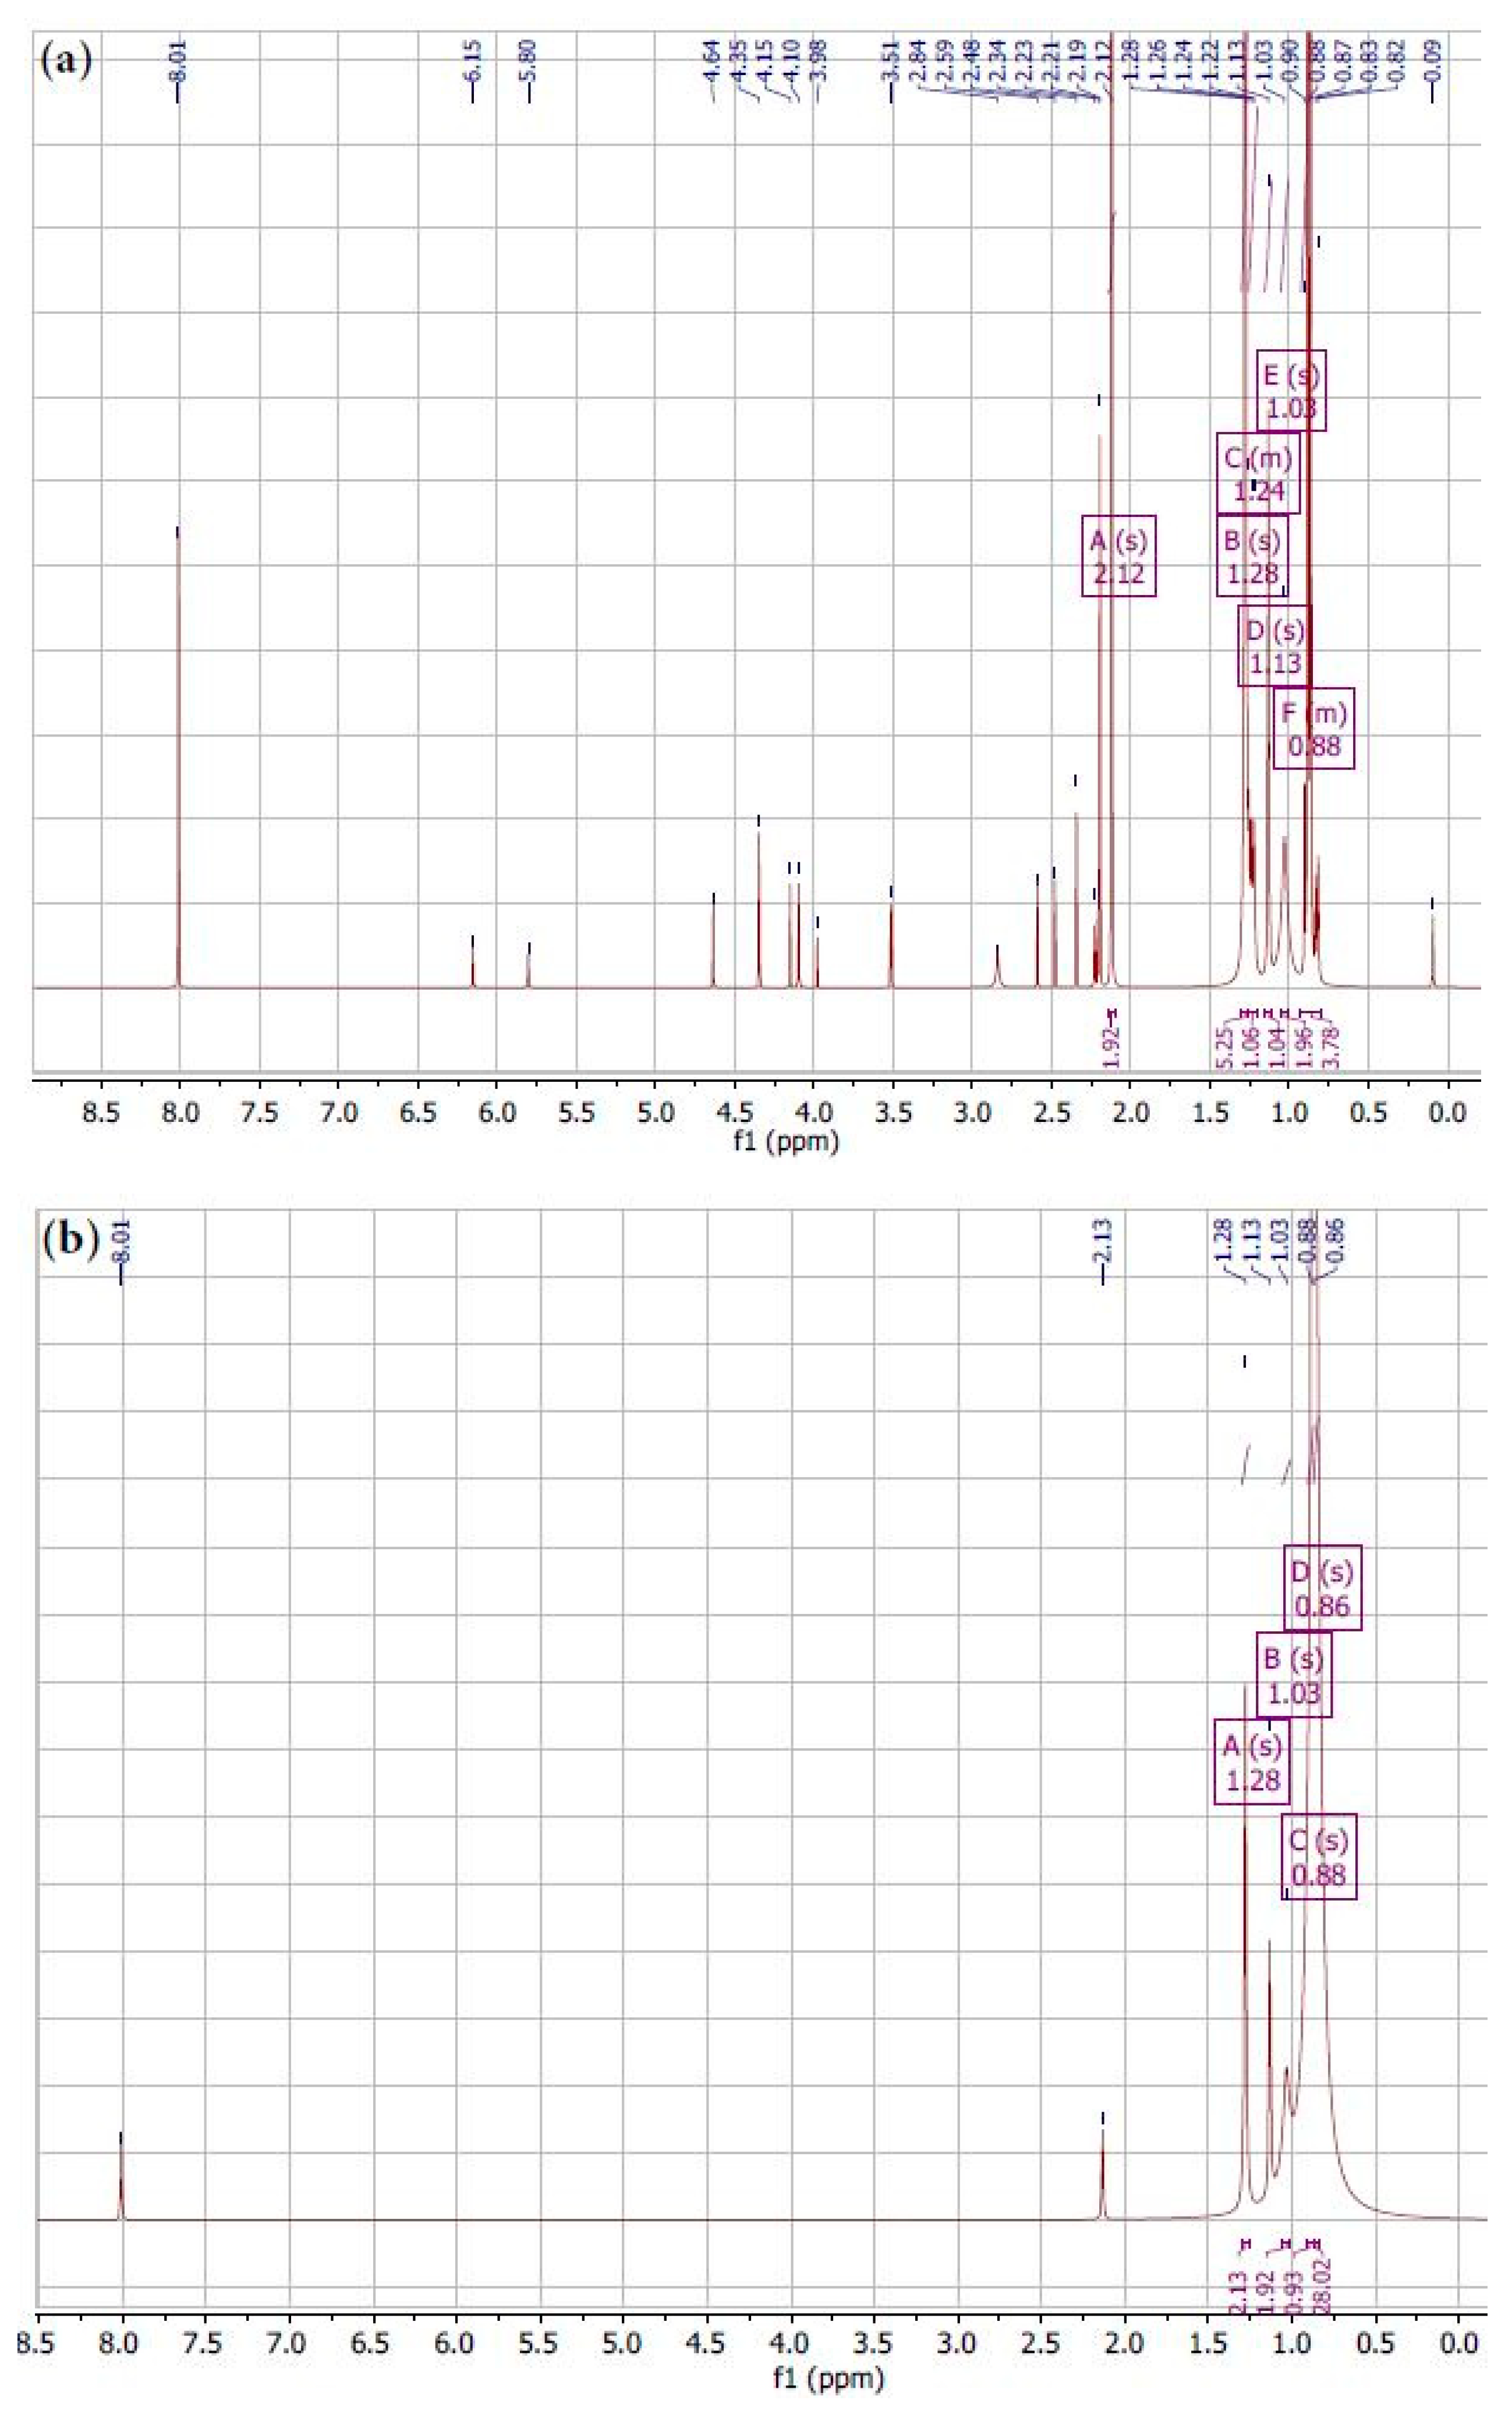
FTIR analysis indicates clear chemical distinctions between biochar and coke, with different functional groups in each carbon source. The reduction in certain functional groups of coke can be attributed to the higher carbonization temperature, leading to the loss of volatile and oxygen-containing functional groups. These results were confirmed judging by the 1H NMR spectra;
(2)
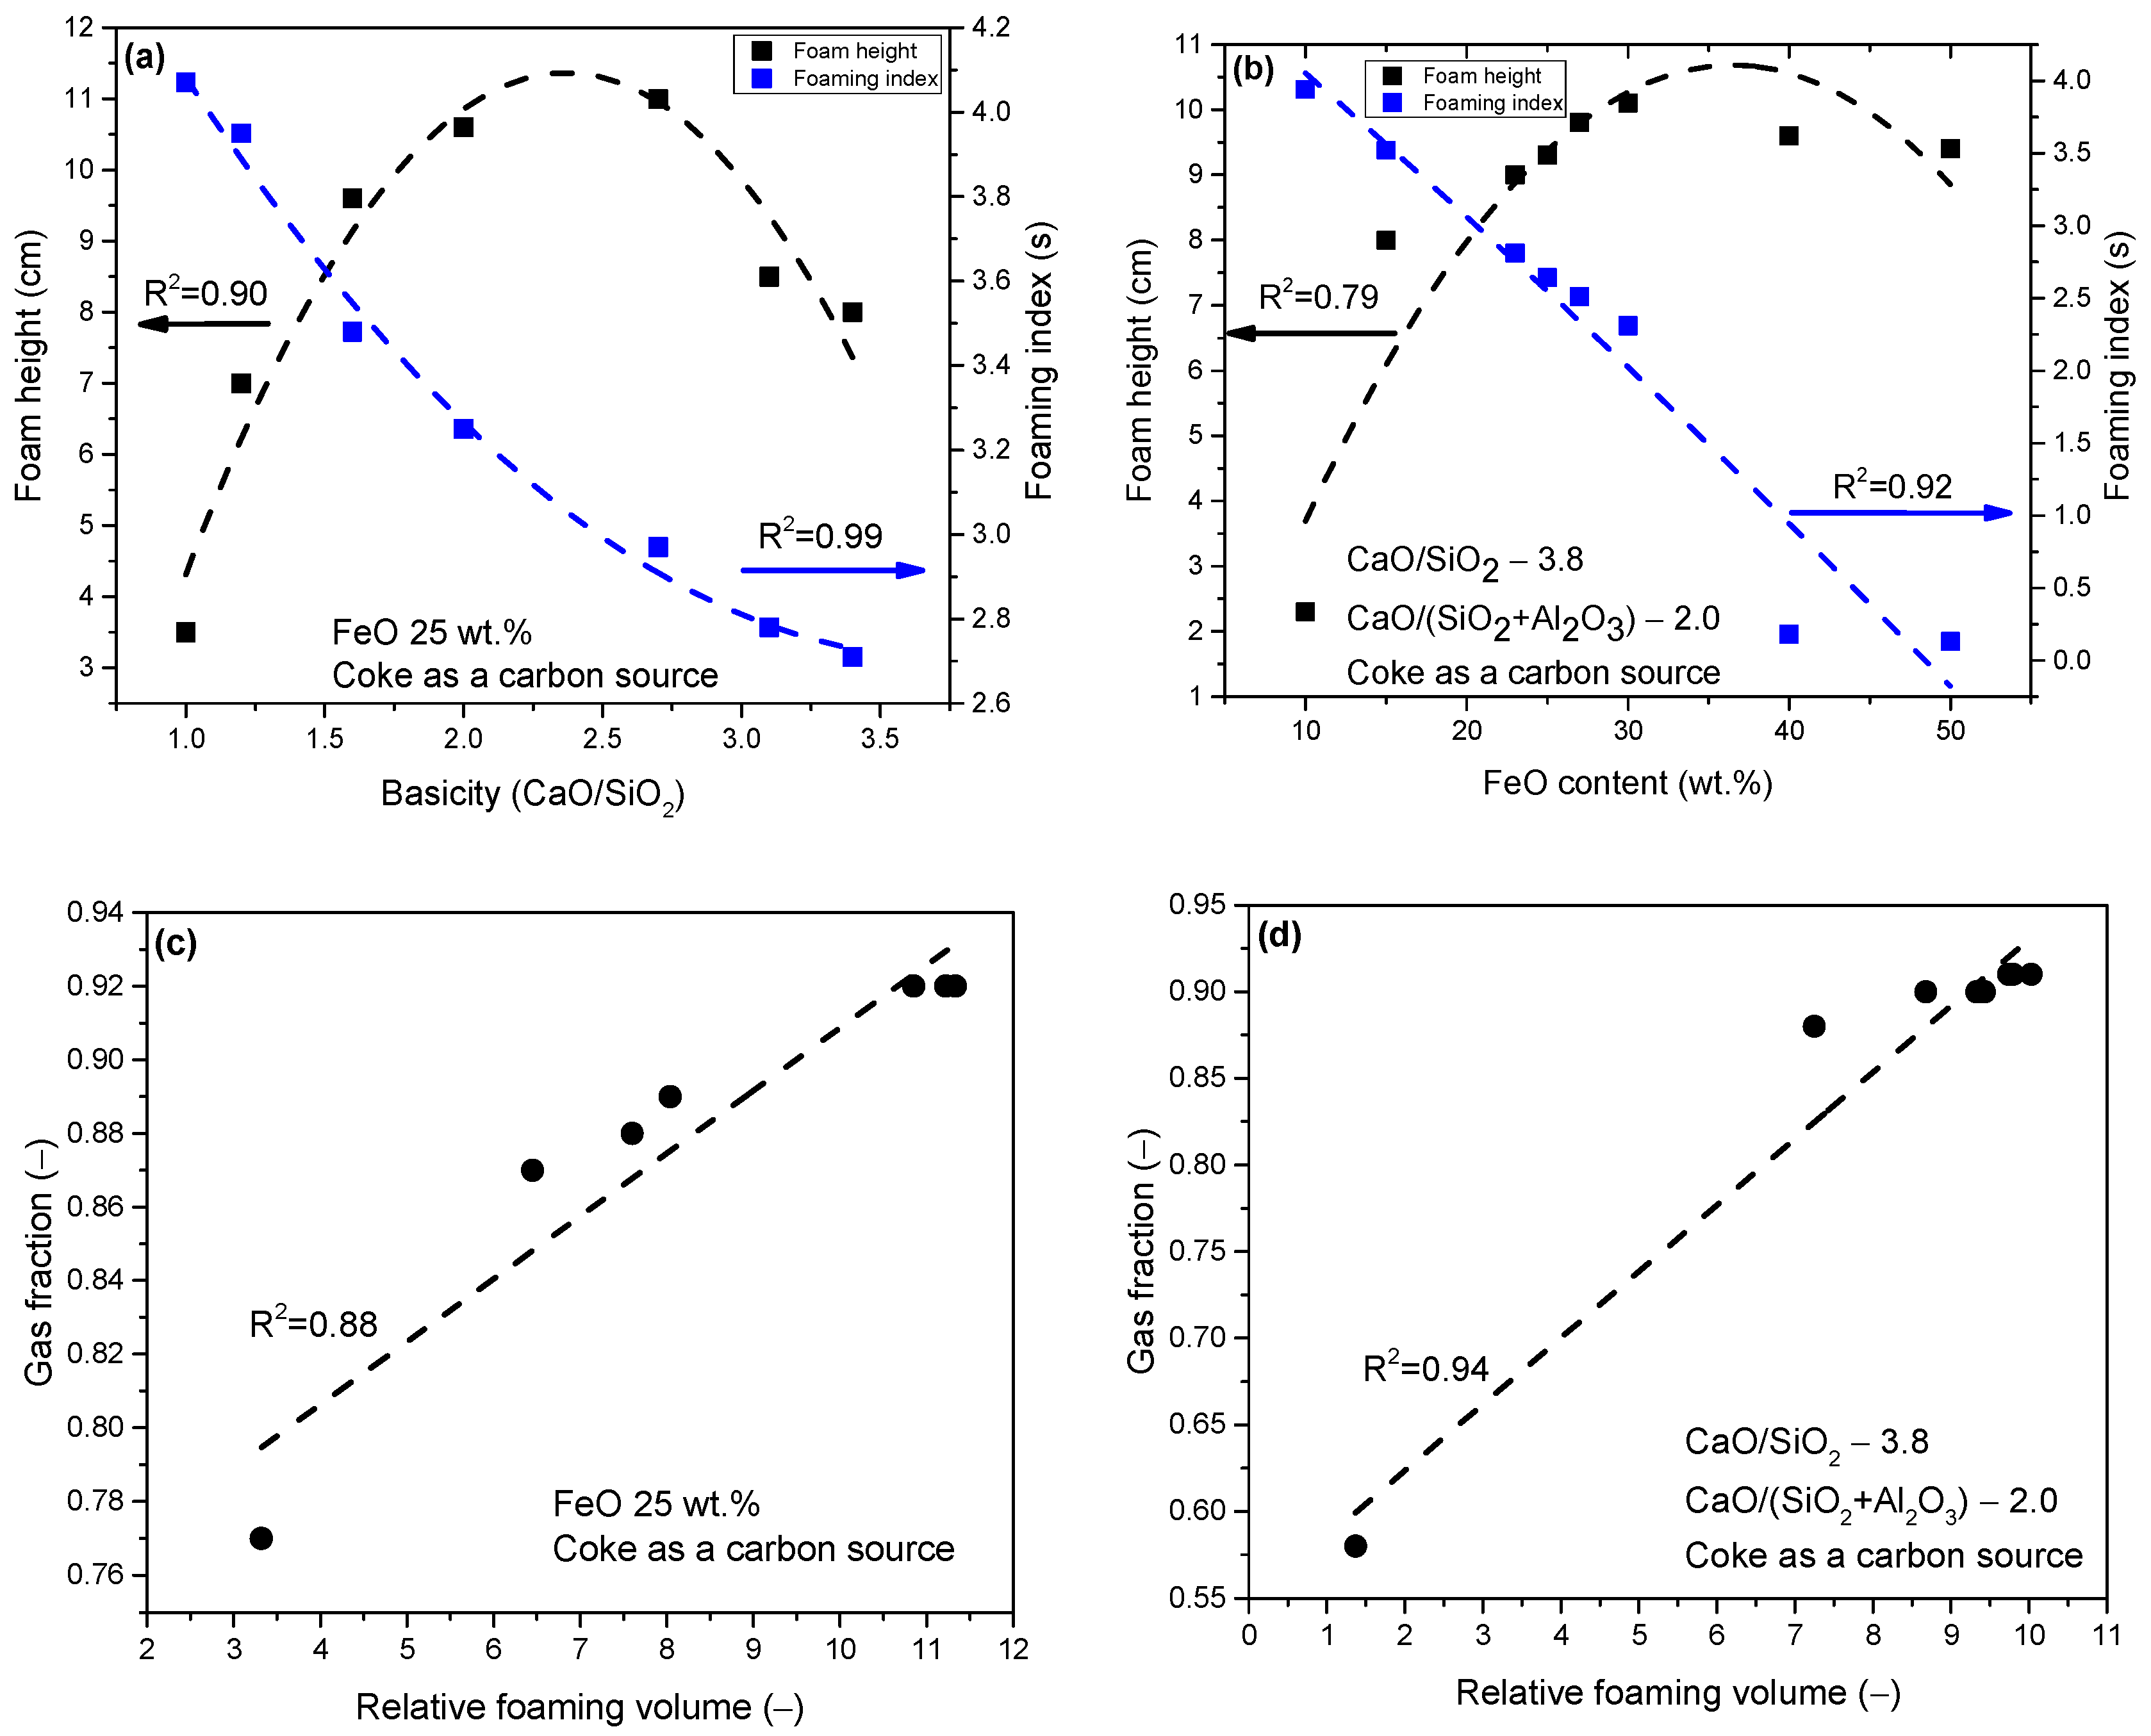
Employing 100 wt.% coke as the carbon source resulted in optimal foaming characters for slags with different basicity values ranging from 1.2 to 2.7 and FeO content from 15 to 30 wt.%. For stable basicity (B2) at 1.4 and consistent Al2O3 content, the highest foam height and volume were achieved with 26.5 wt.% FeO and 13.52 wt.% MgO;
(3)
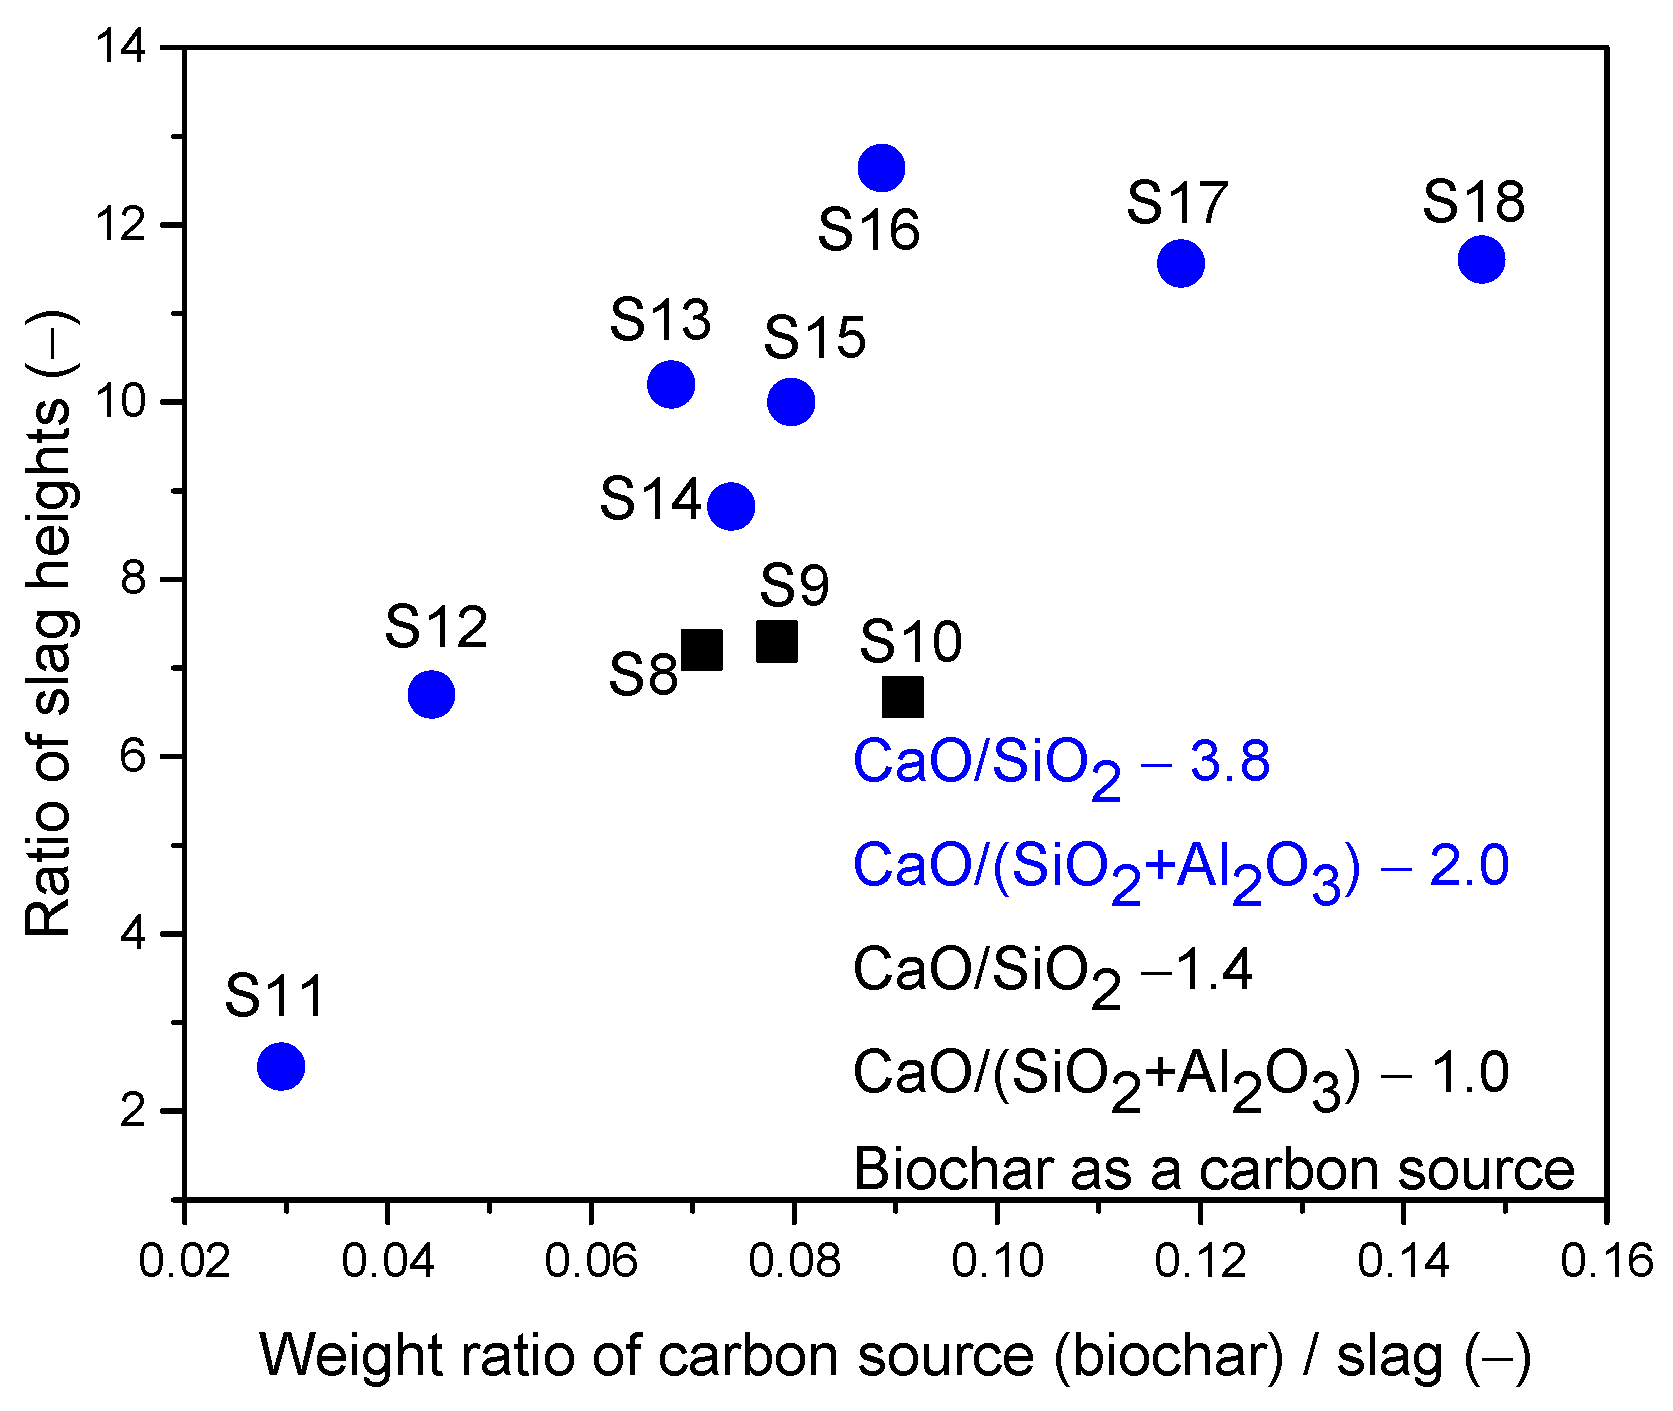
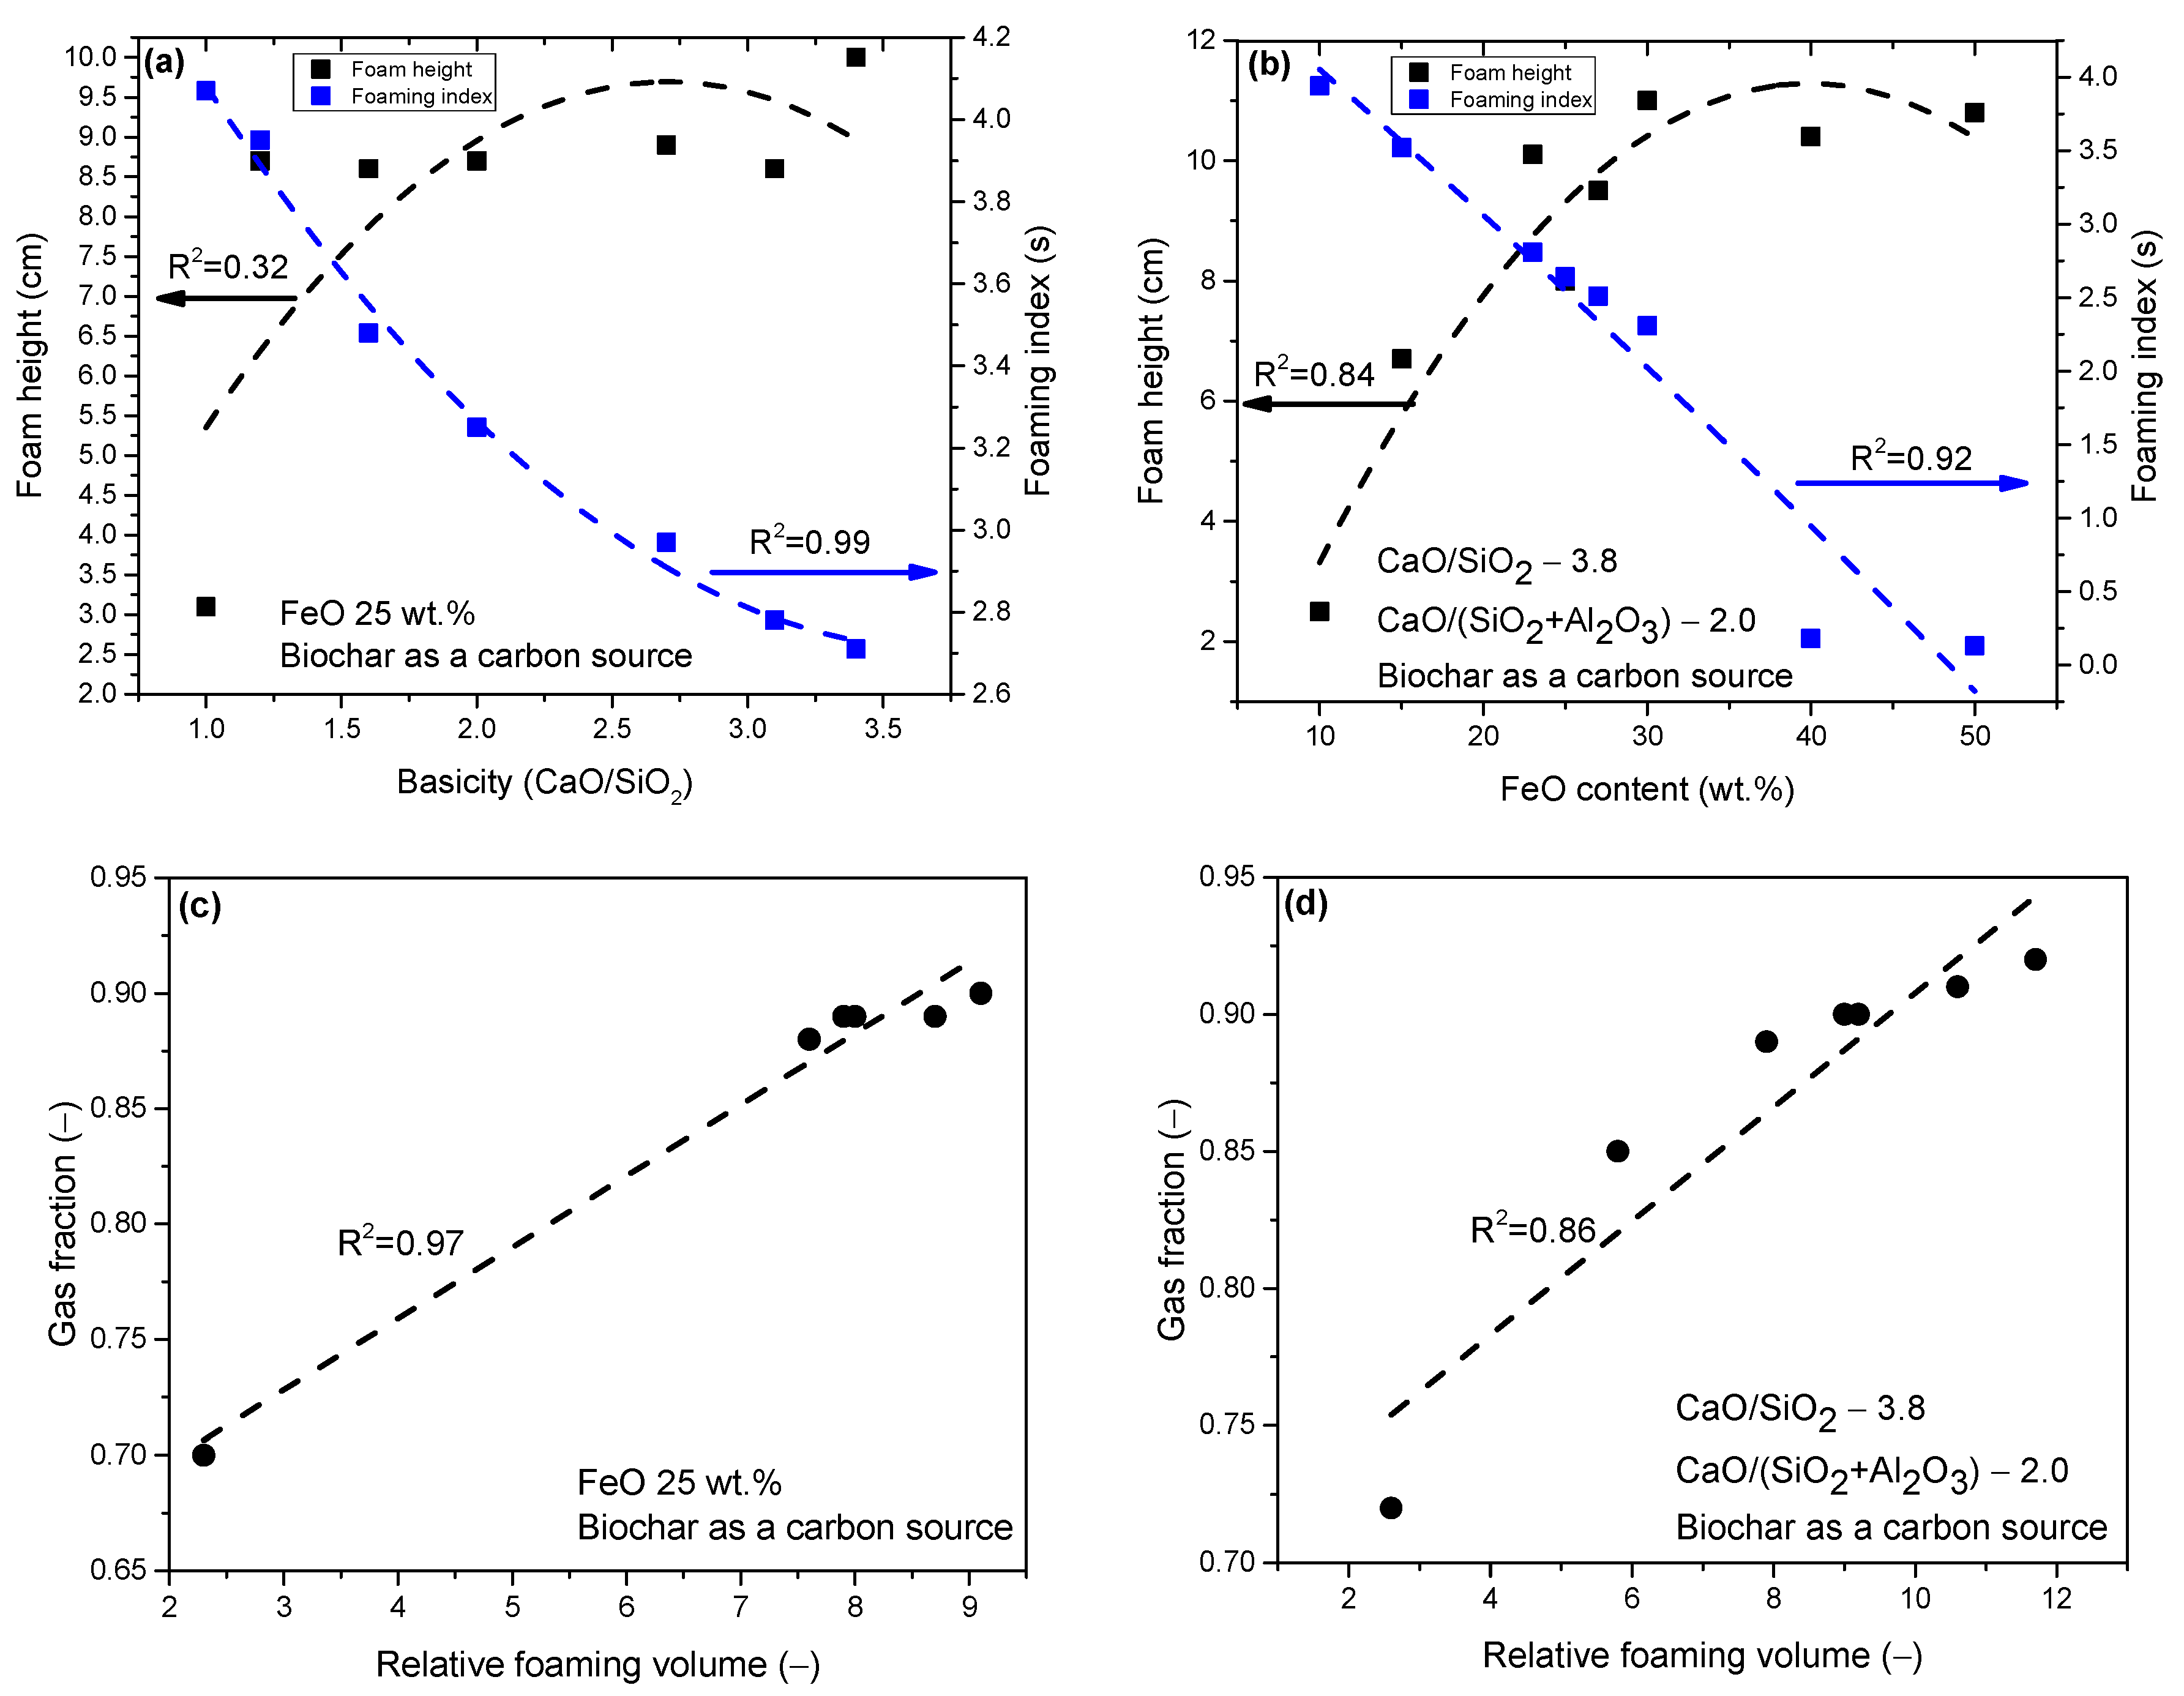
When using 100 wt.% biochar as a carbon source, the most optimal foaming characters were obtained for a group of slags with different basicities from 1.2 to 3.4. Notably, the influence on foam height was not observed with the increase in basicity B2 from 1.2 to 3.1. For group slags with different FeO content, stable foaming was obtained for samples containing this oxide from 15 to 27 wt.%. In the slag group, where stable basicity of 1.4 and Al2O3 content were used, foaming characters were lower than coke, there were no significant changes, and the characters were within experimental error;
(4)
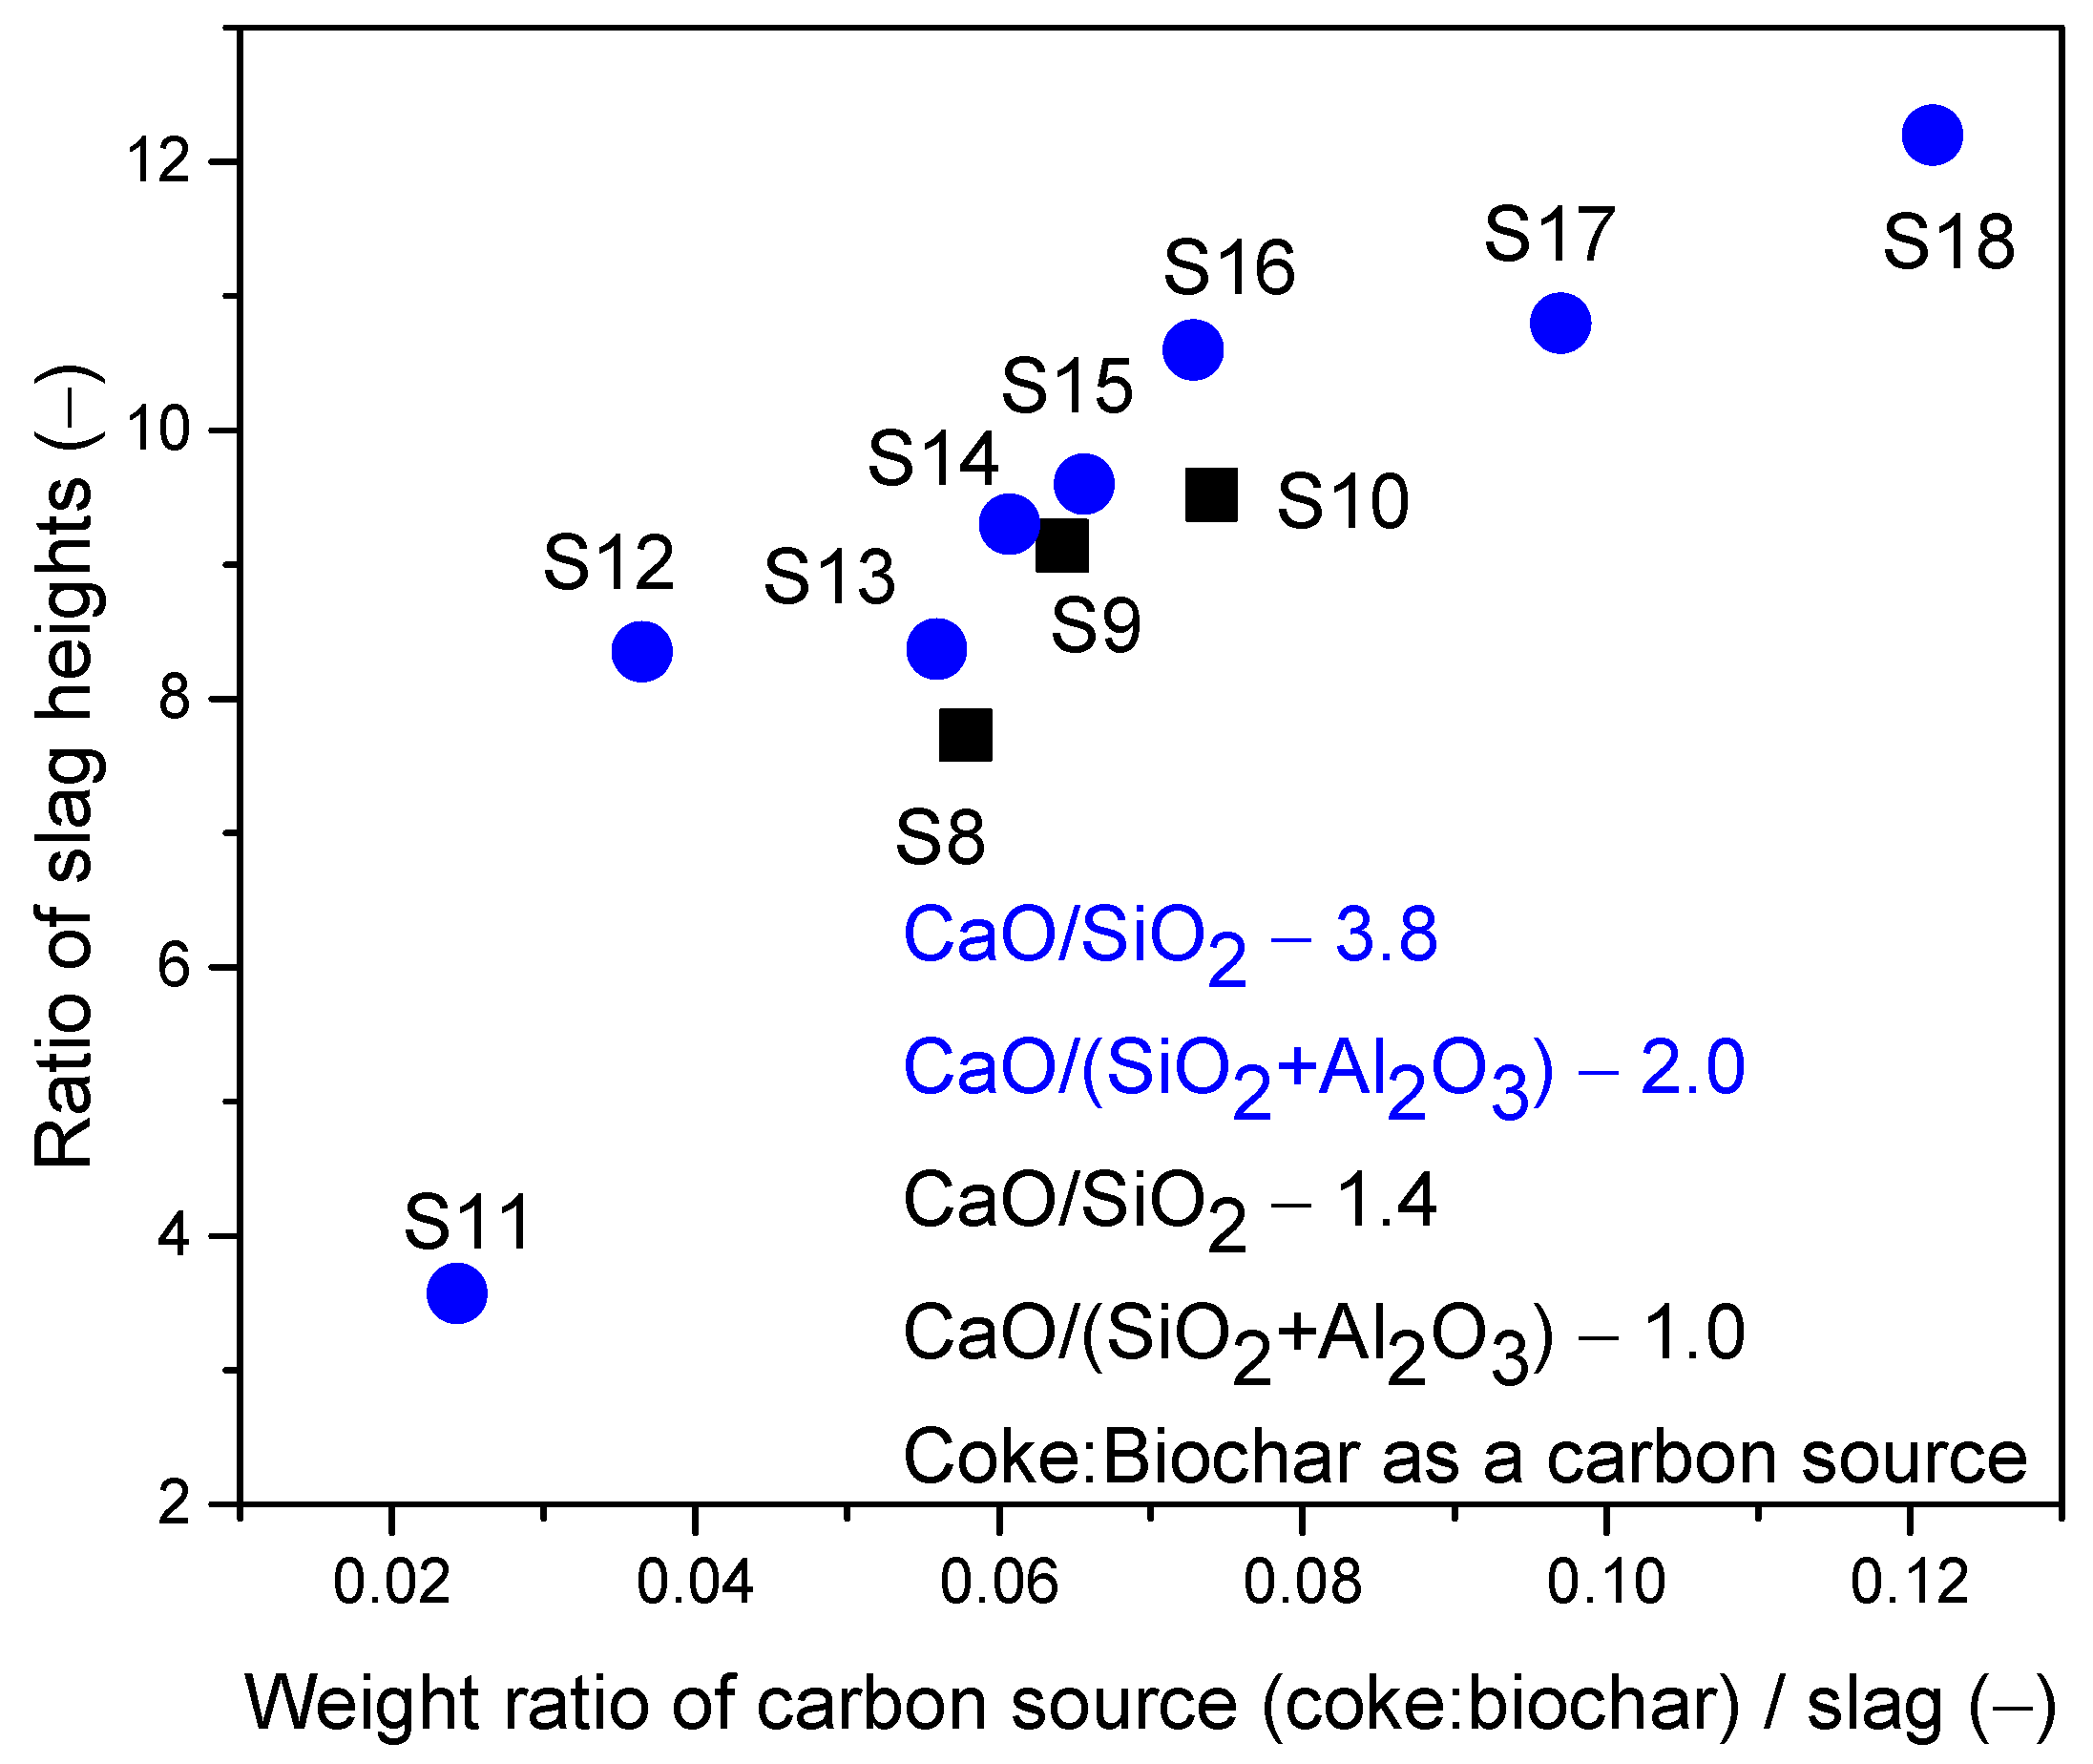
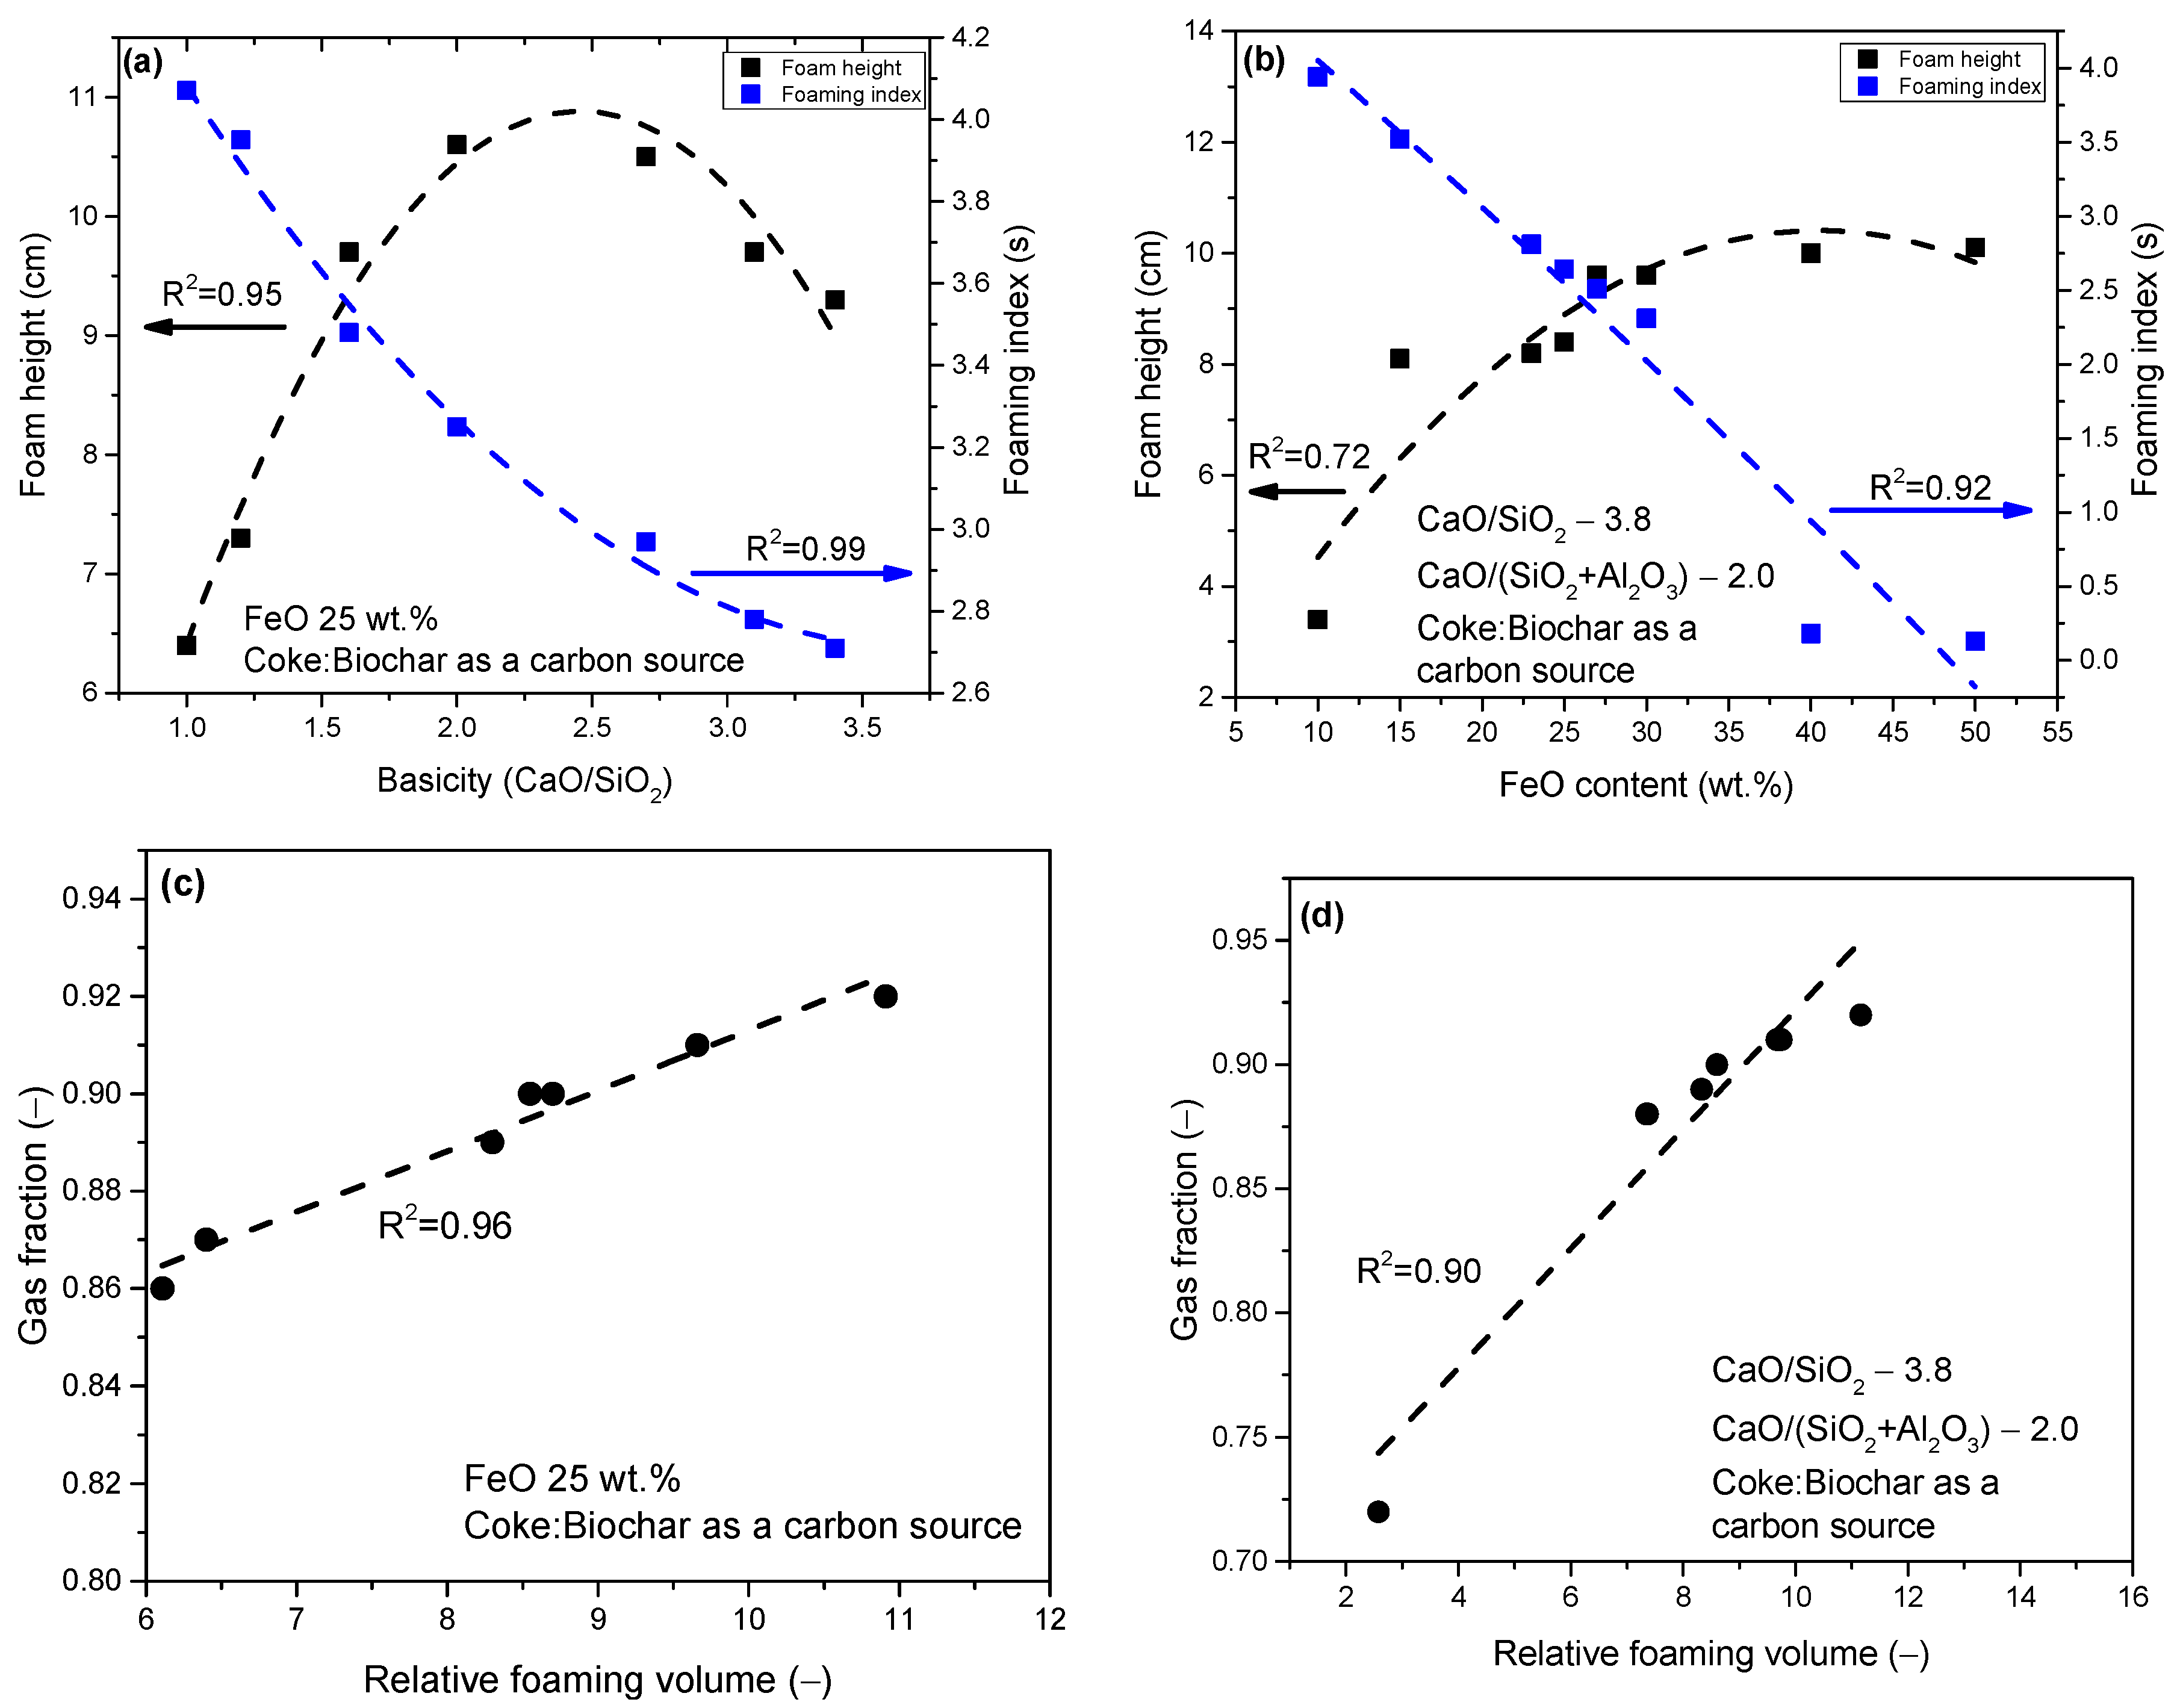
A mixture of coke and biochar led to stable foaming with a minimum basicity value of 1.0 and 25 wt.% FeO content. Unlike the other carbon sources, this mixture provided stable foaming across all slag compositions with varying basicity values. Stable foaming was observed in the presence of 15 wt.% to 40 wt.% FeO, presenting a broader range compared to individual applications of coke or biochar. For slags with stable basicity and Al2O3 content, similar foaming tendencies were observed compared to using coke.
(5)
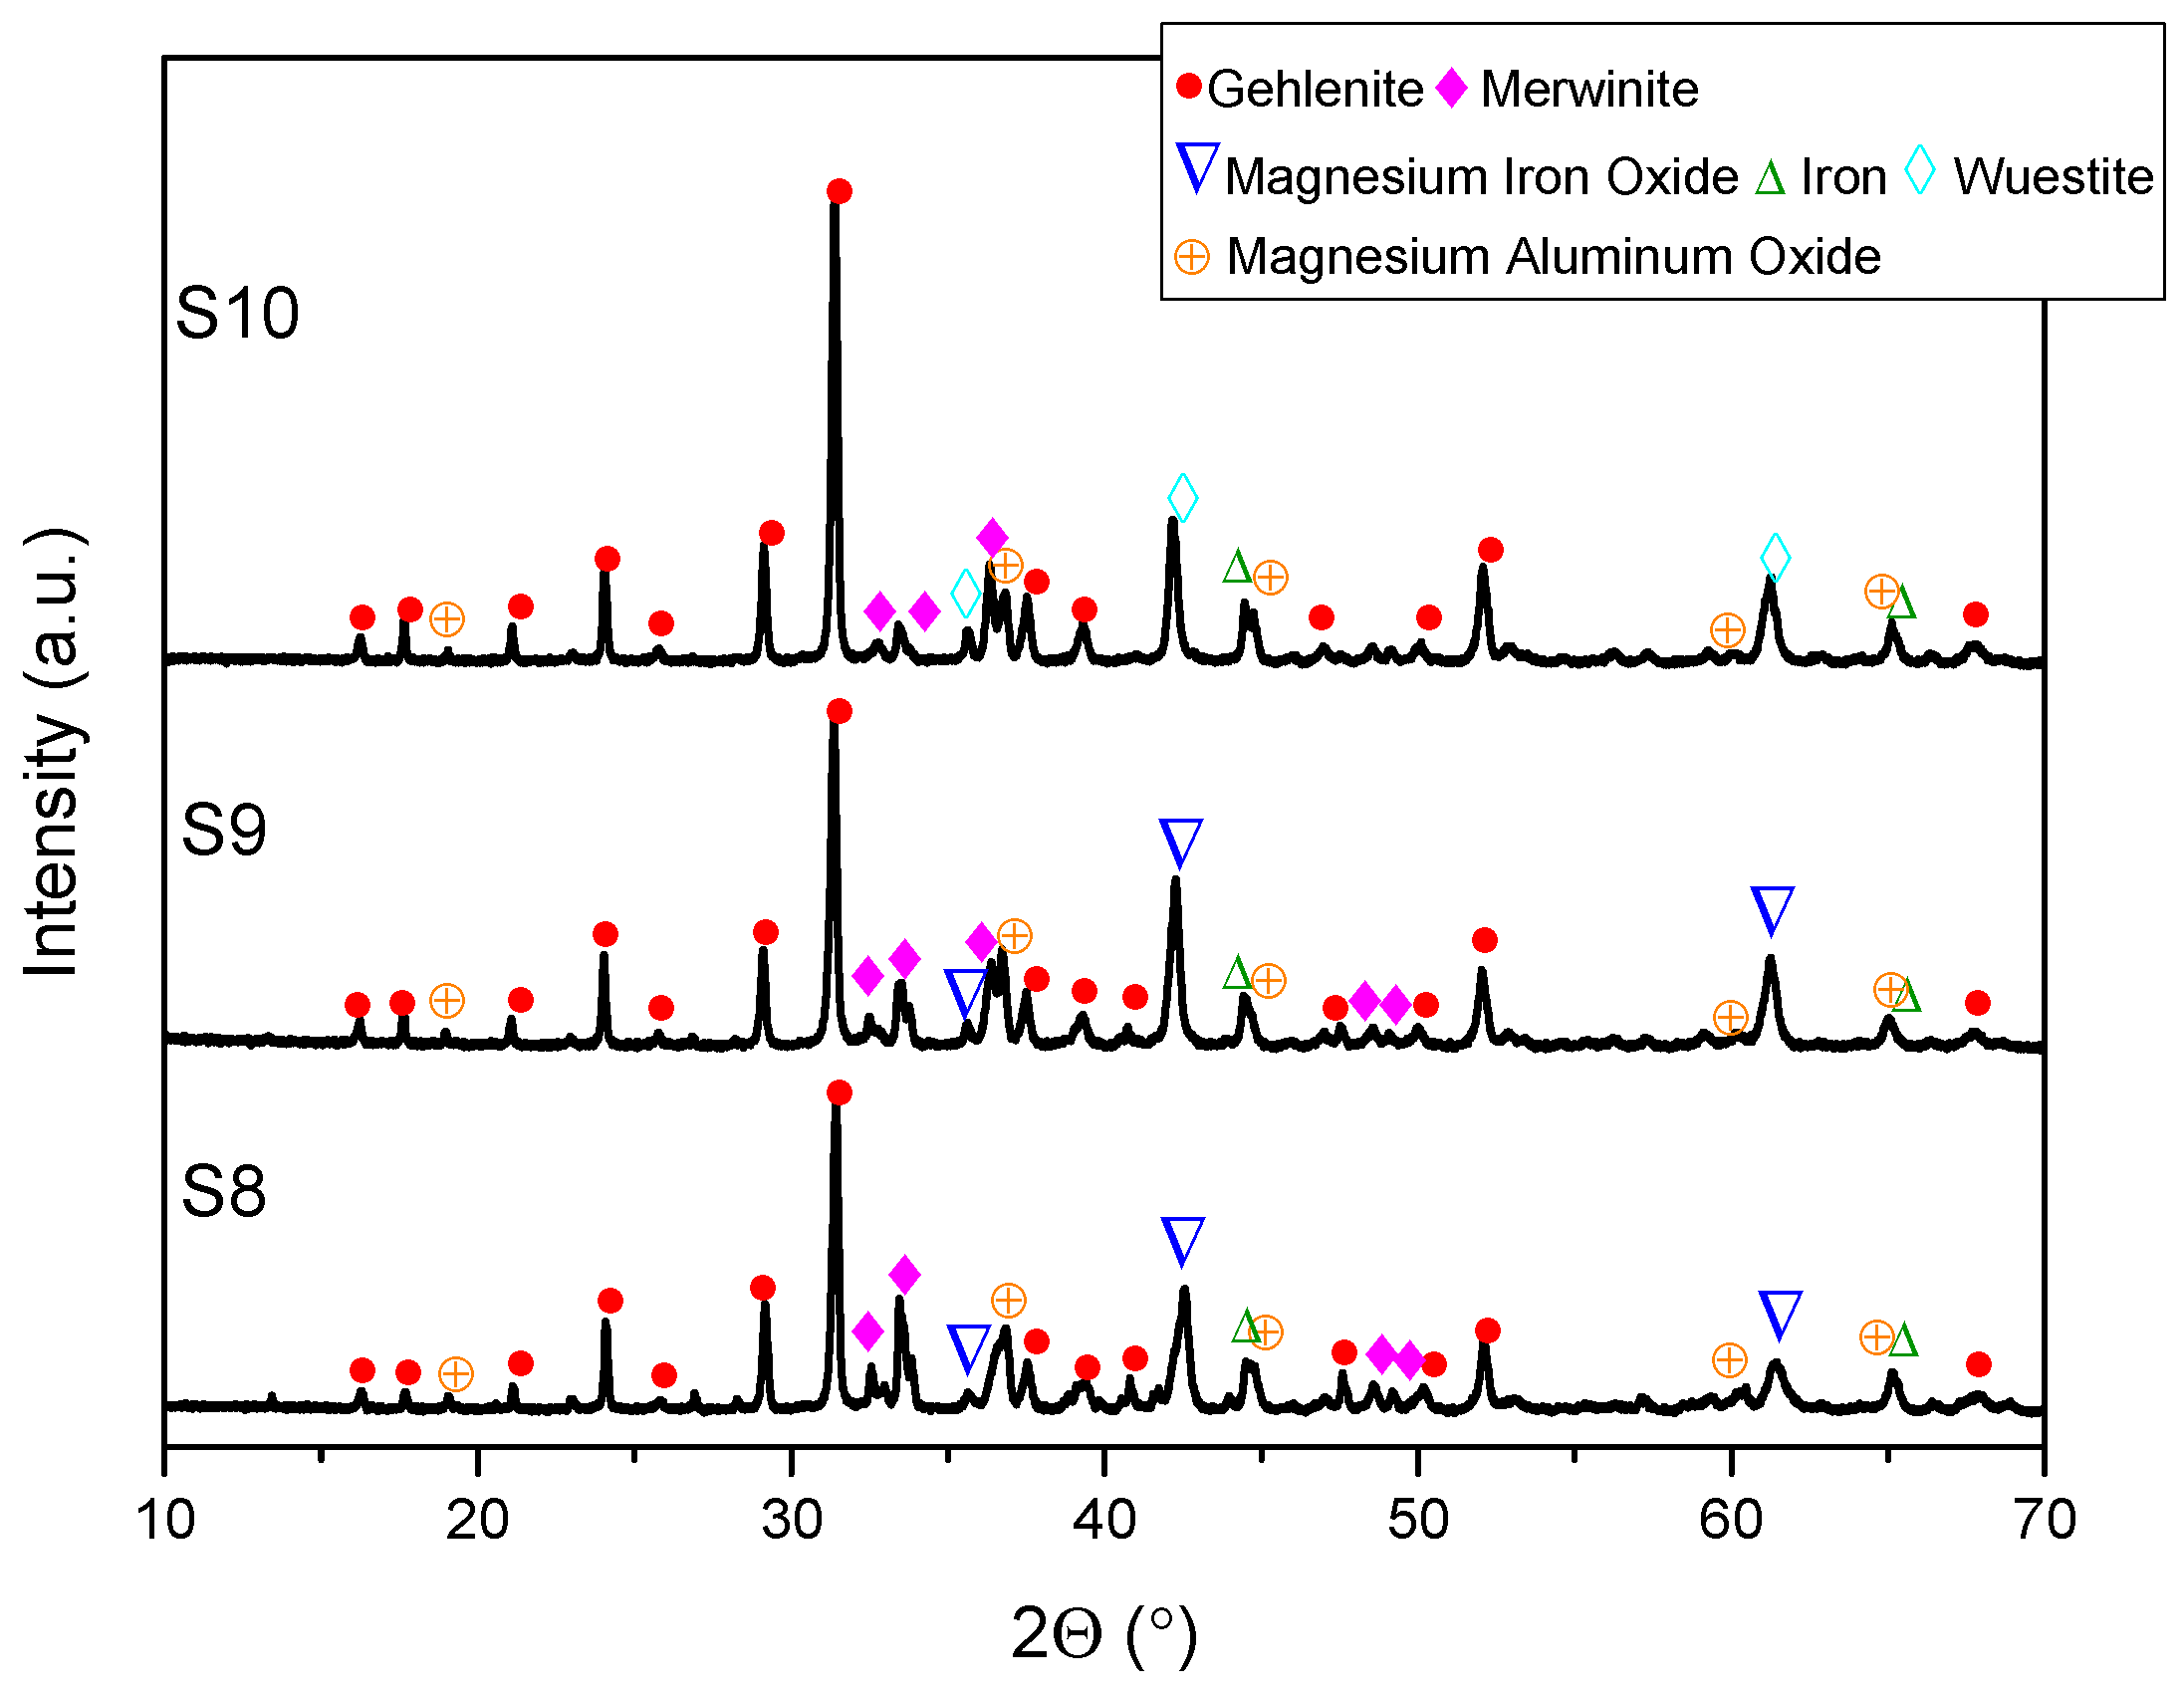
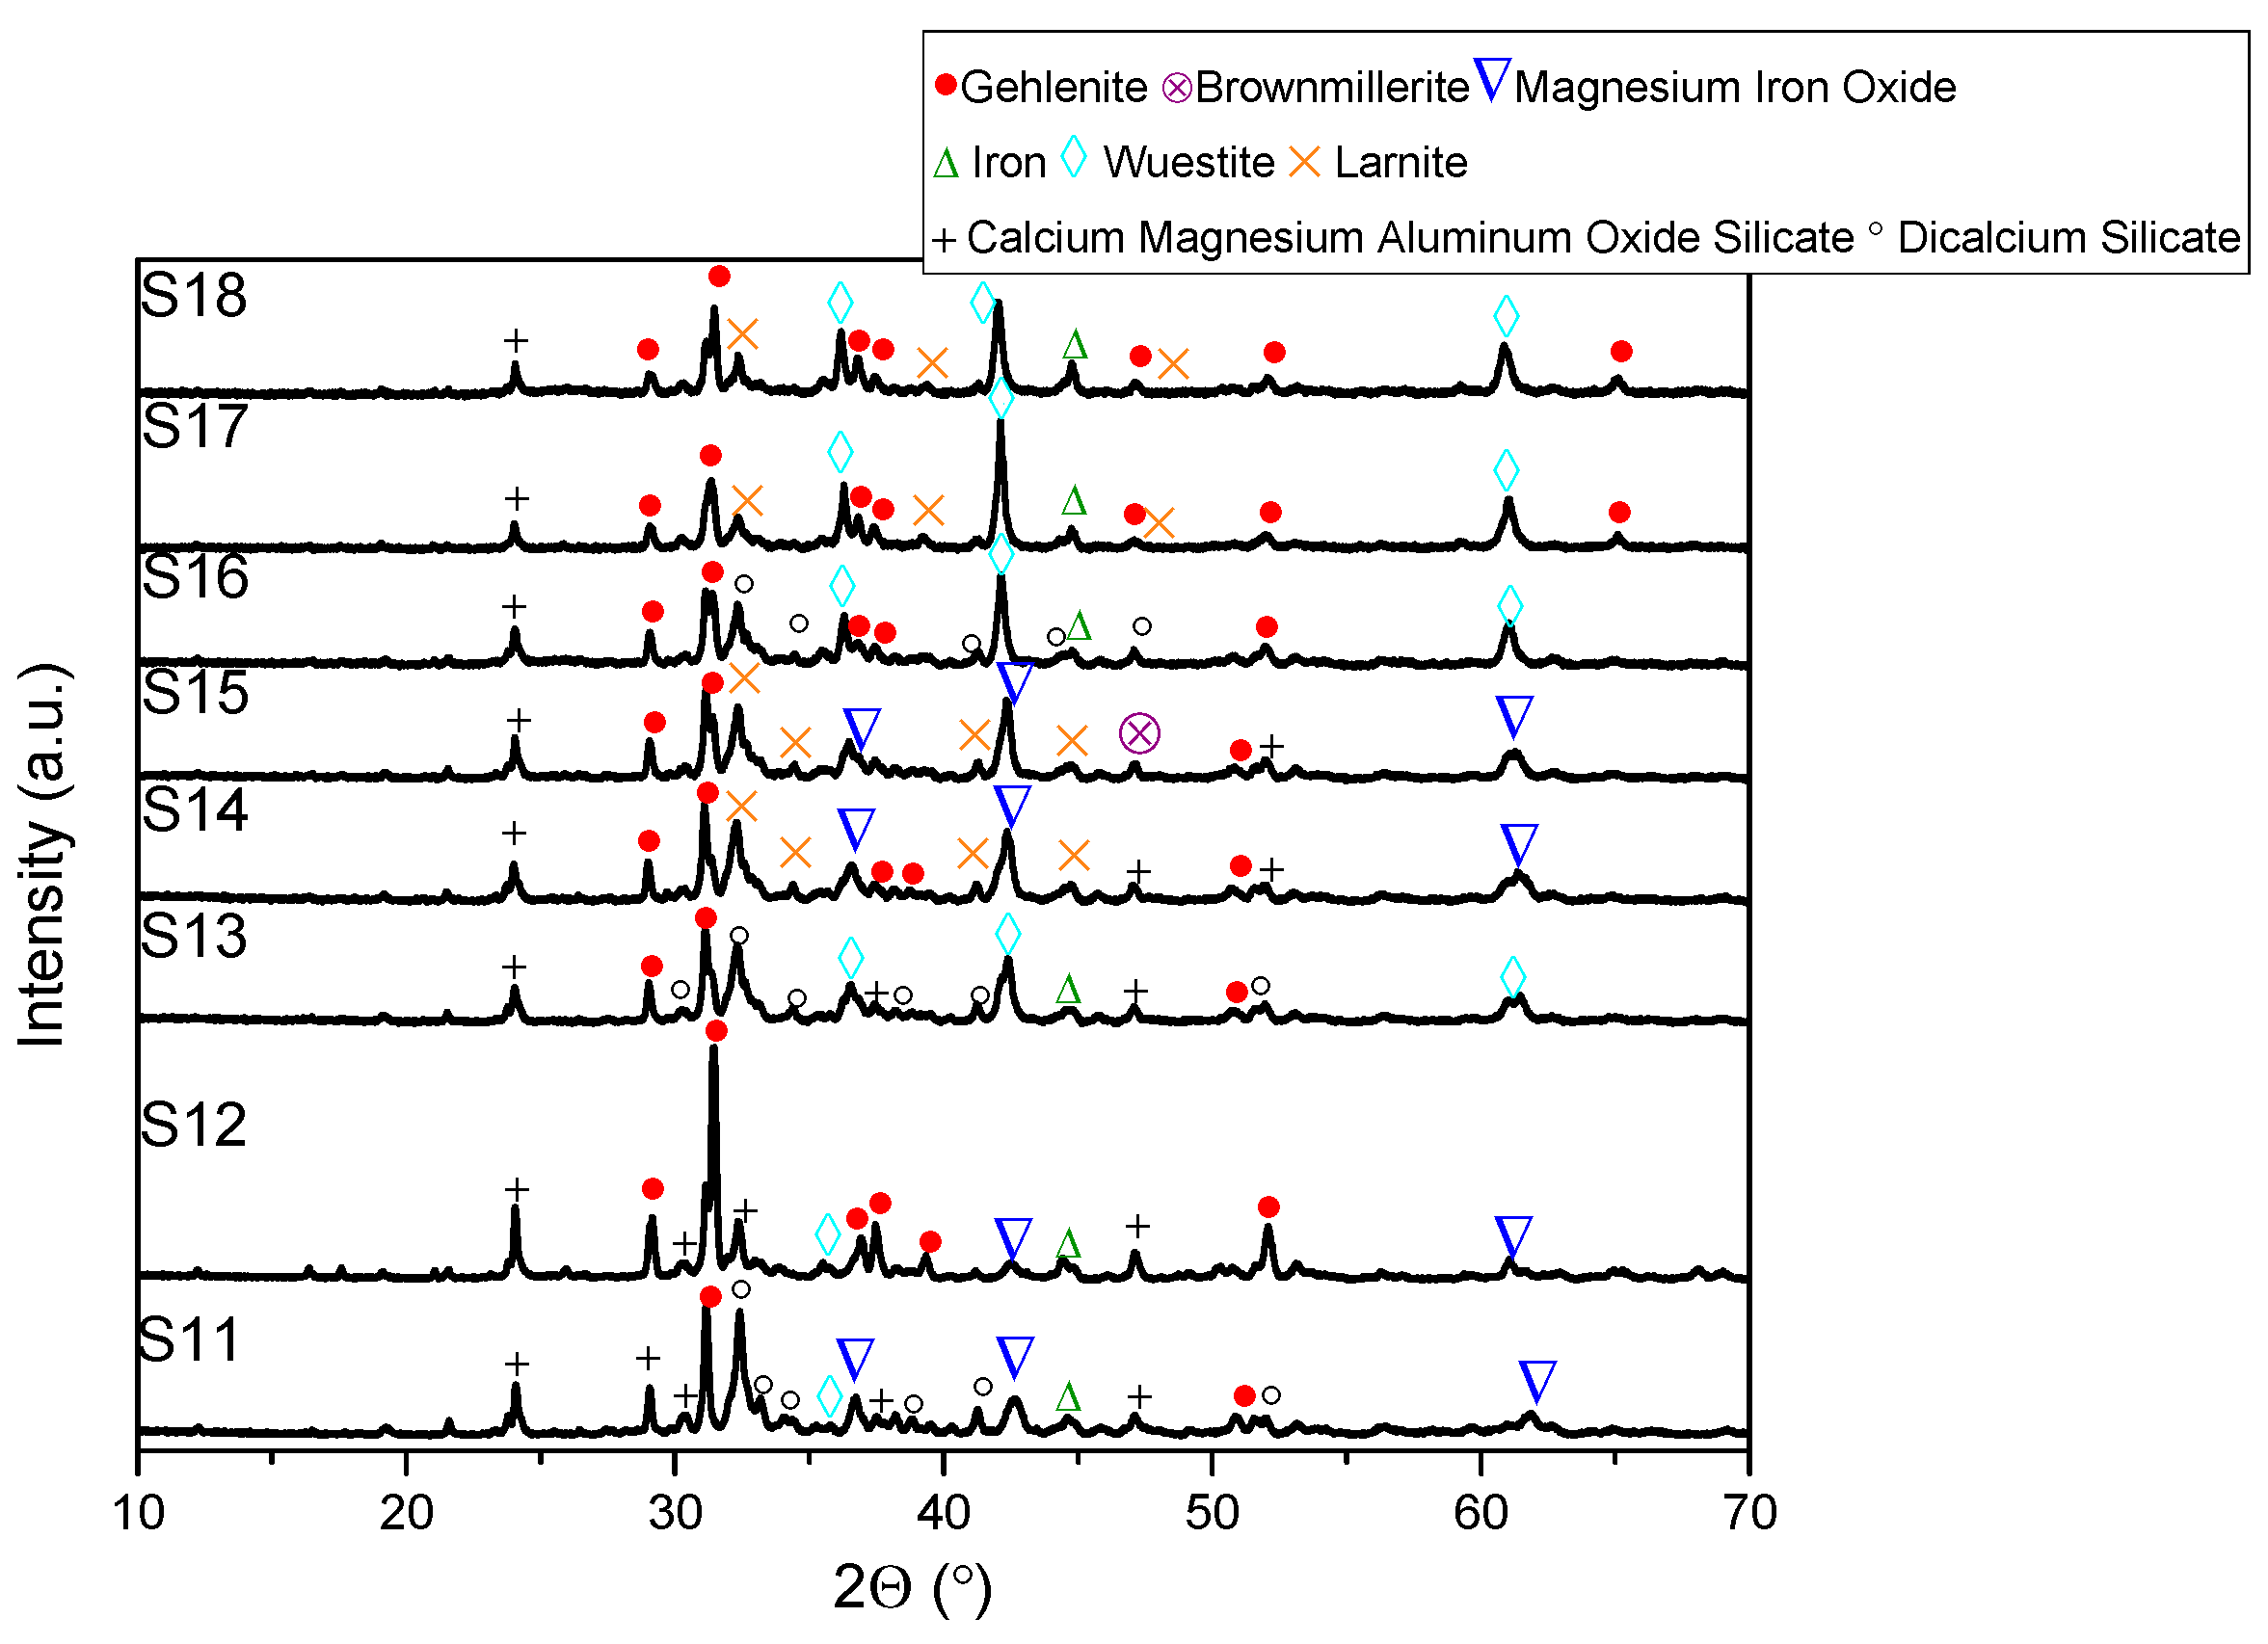
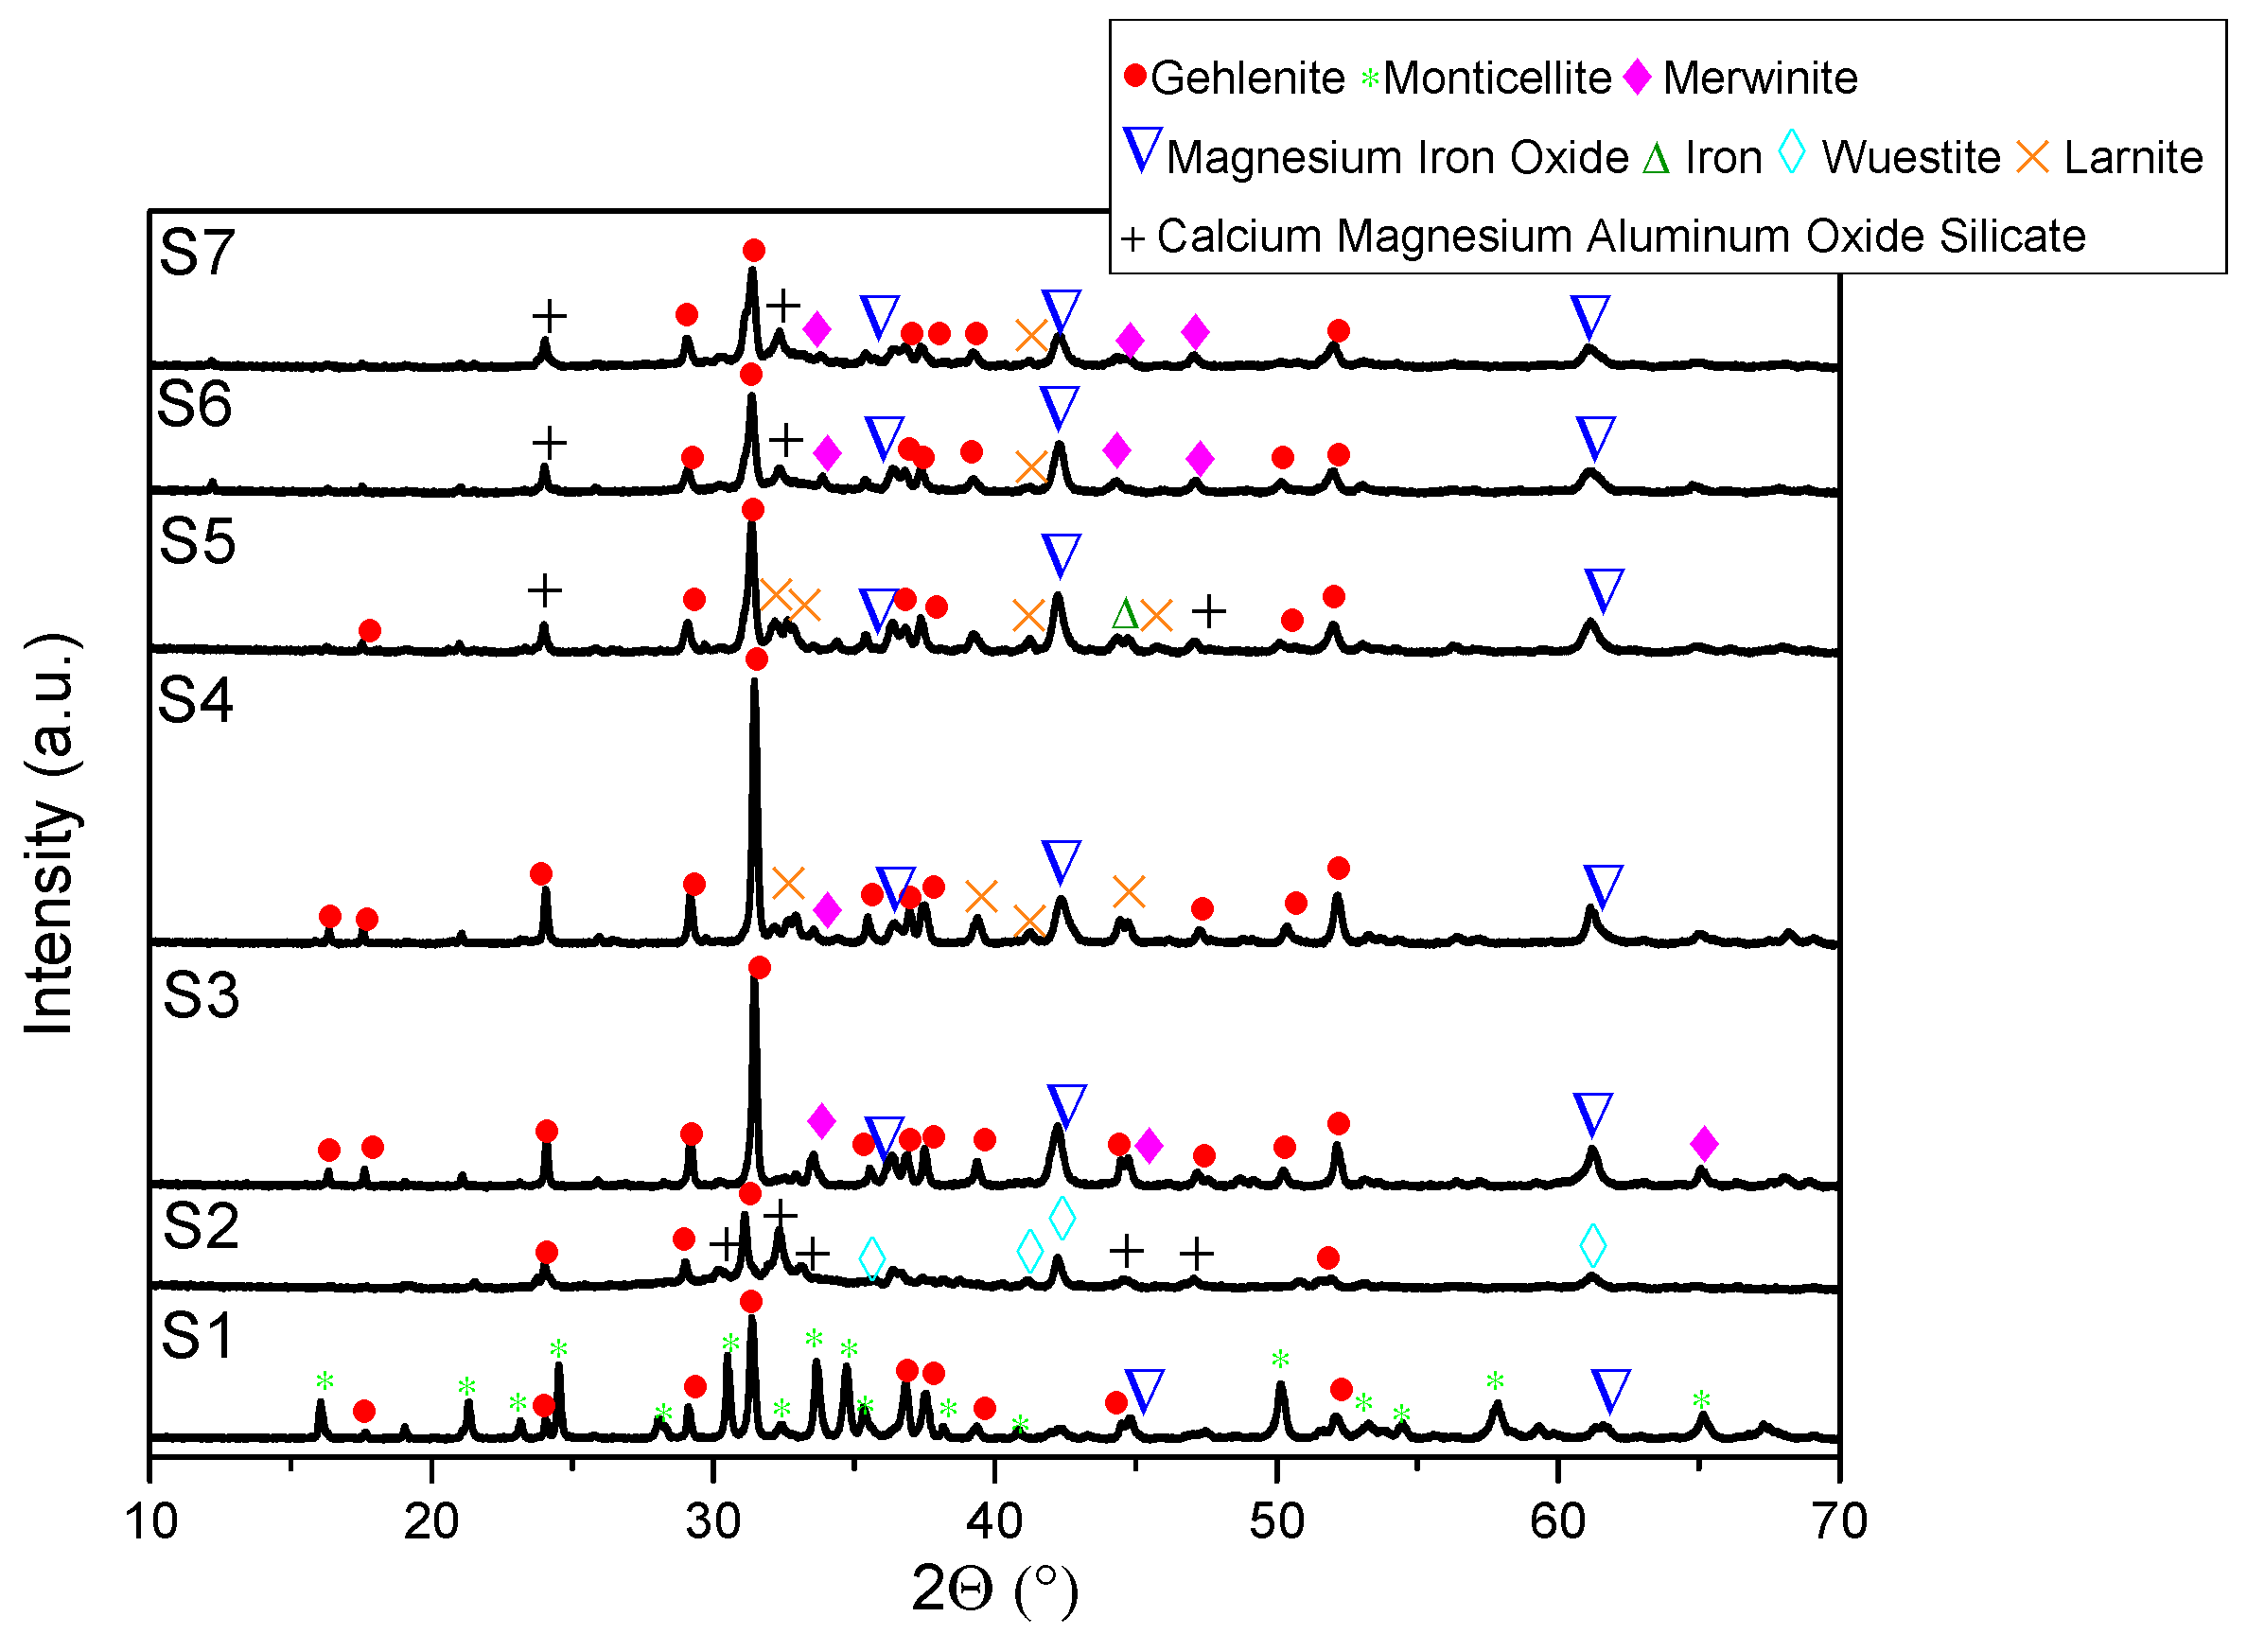
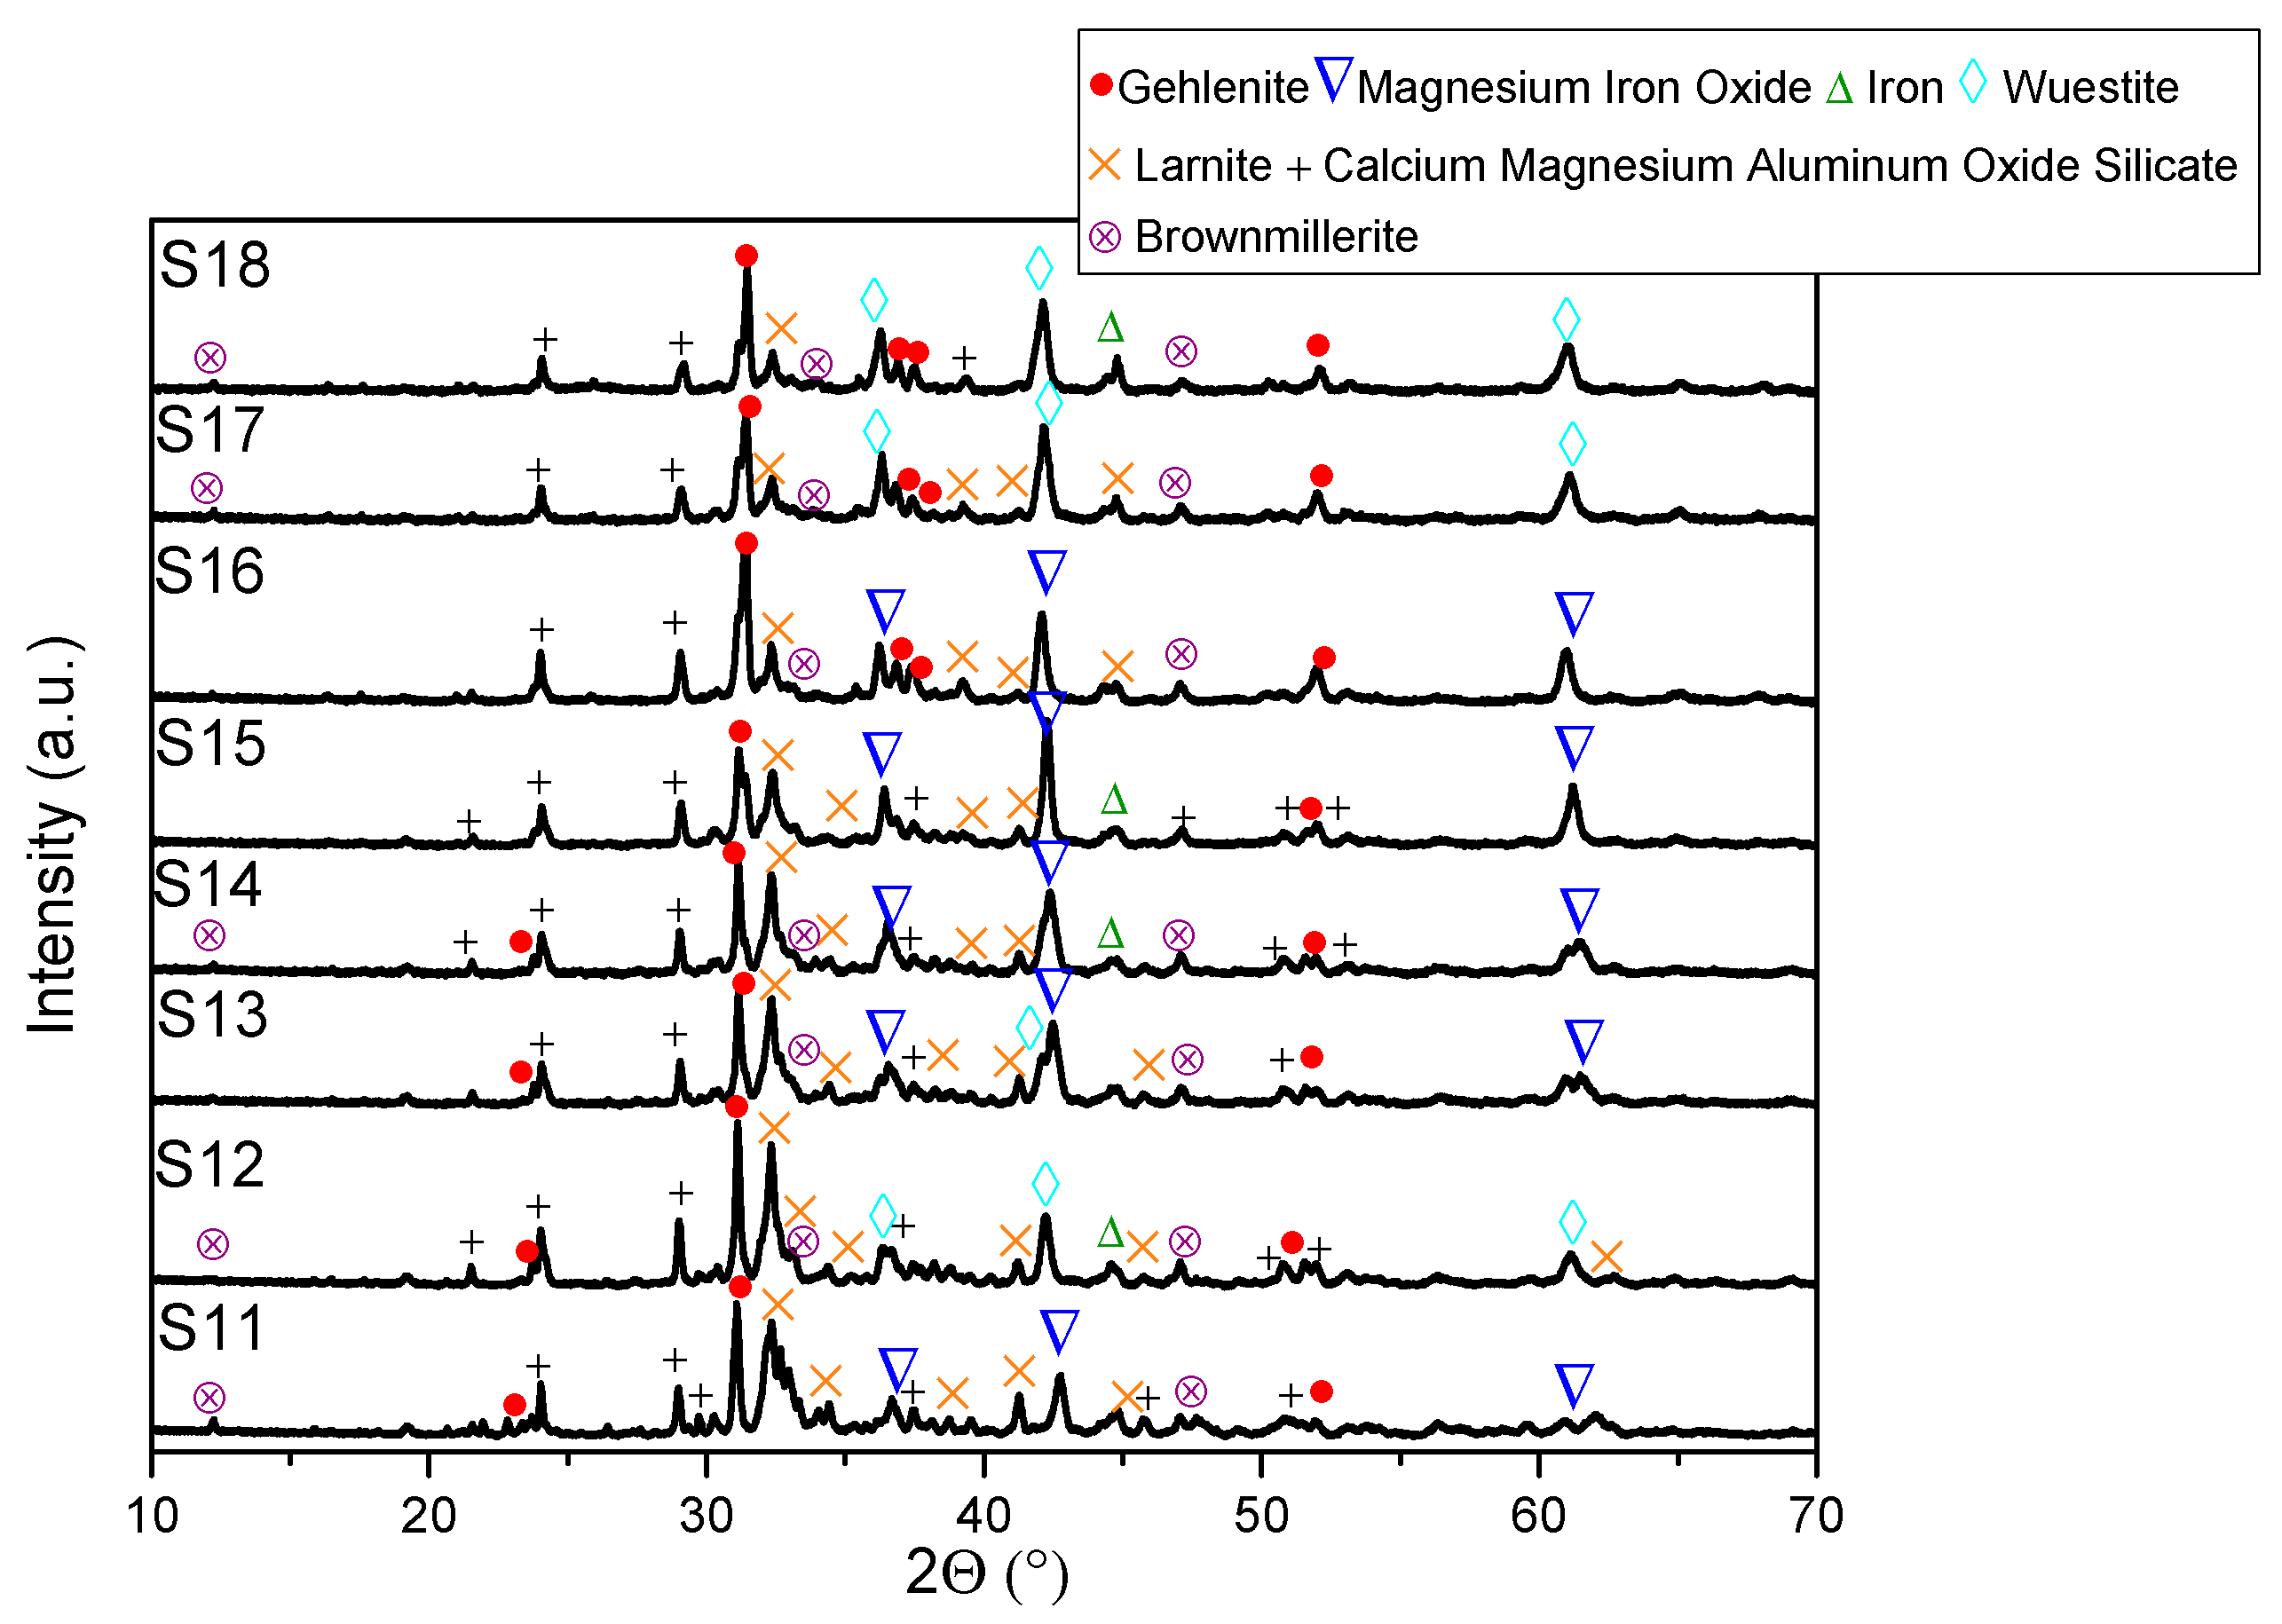
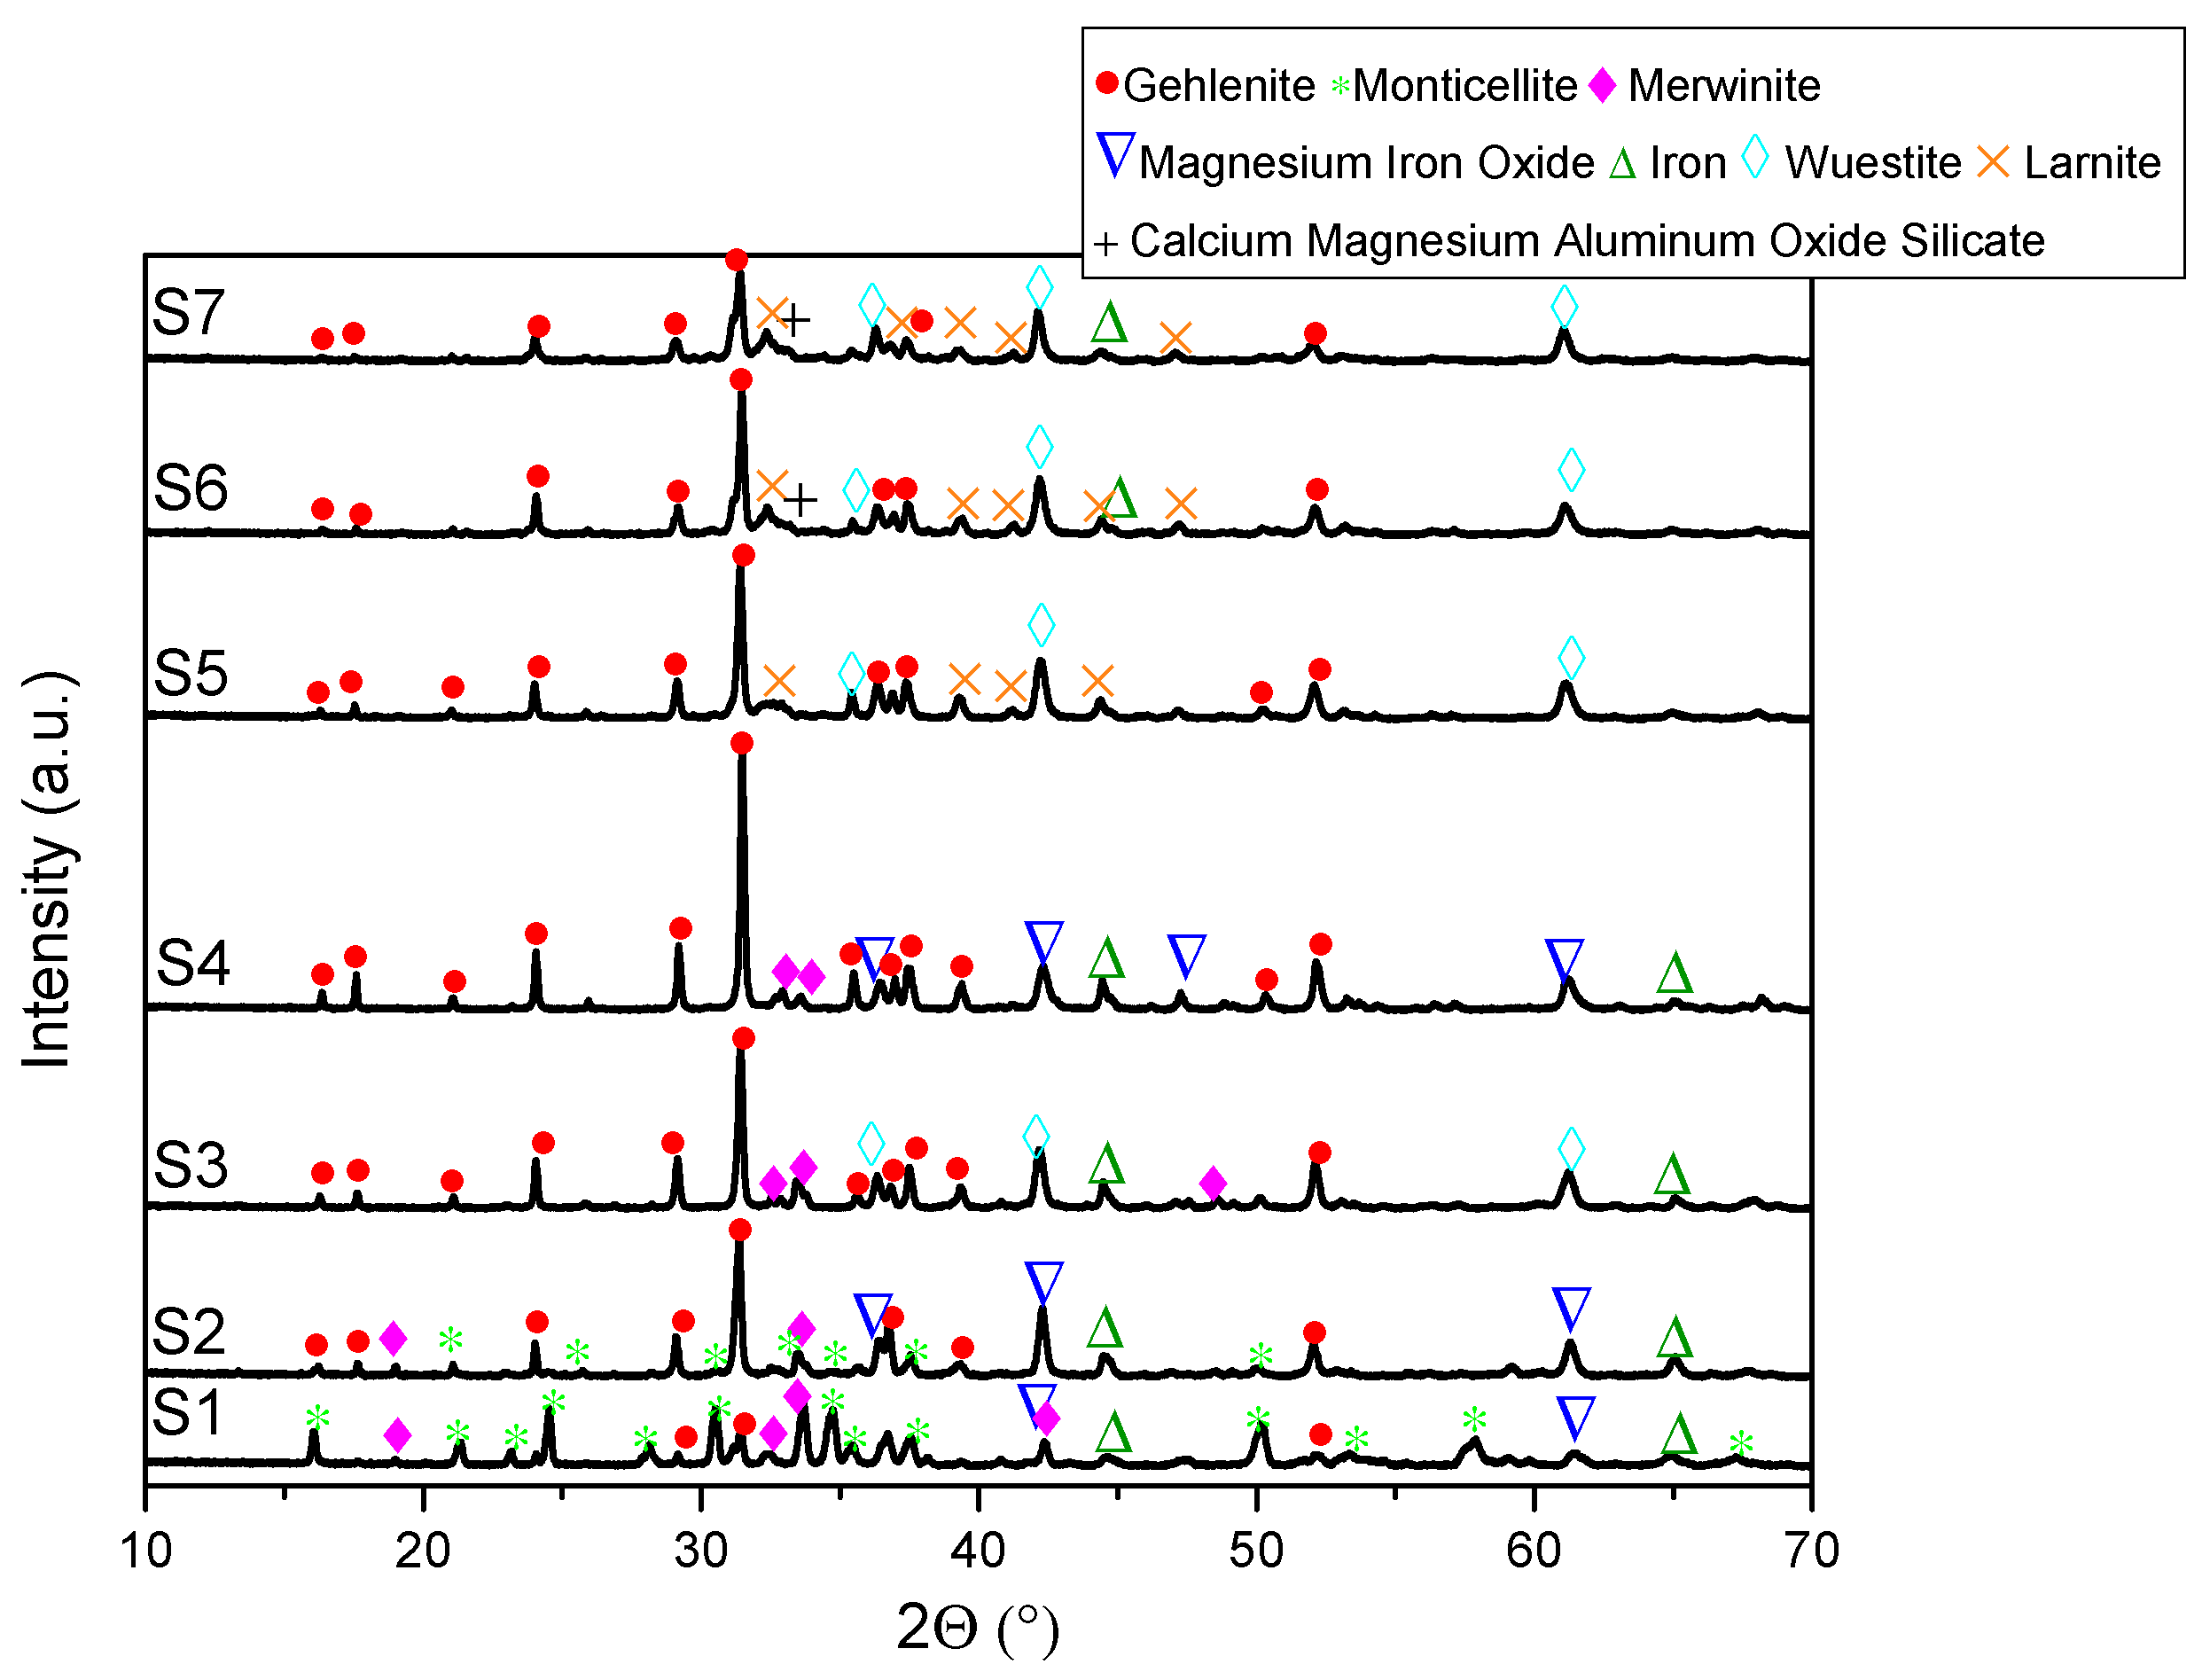
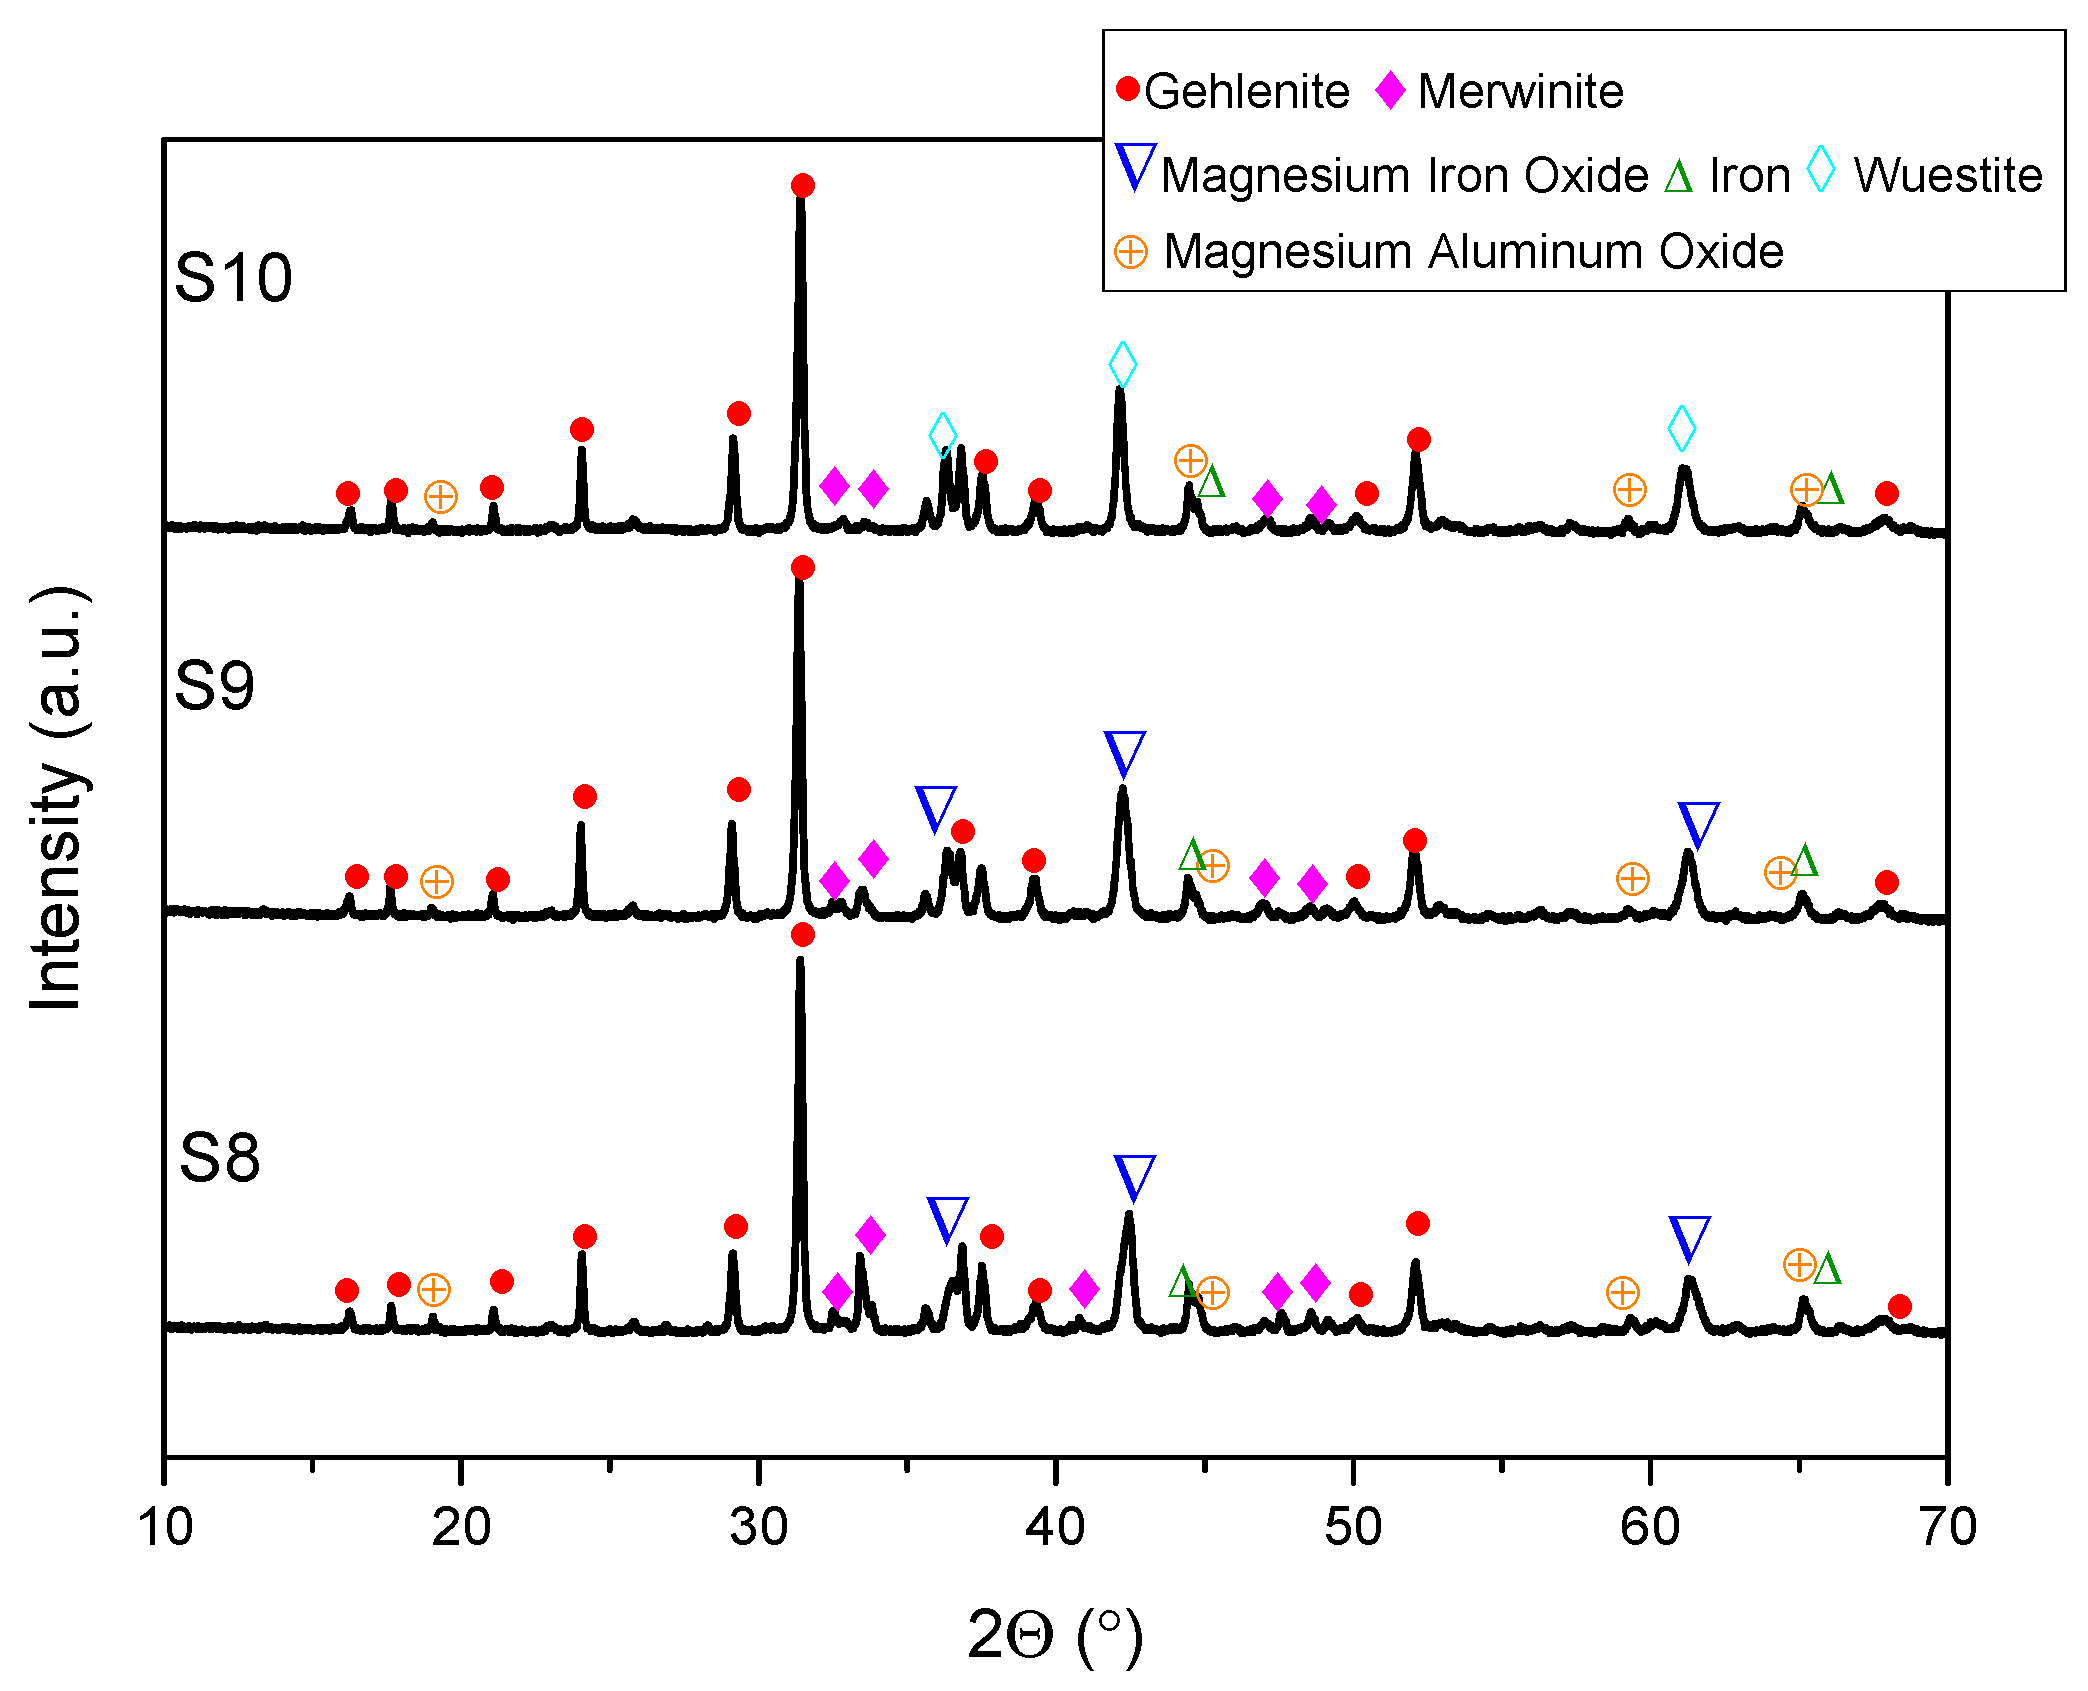
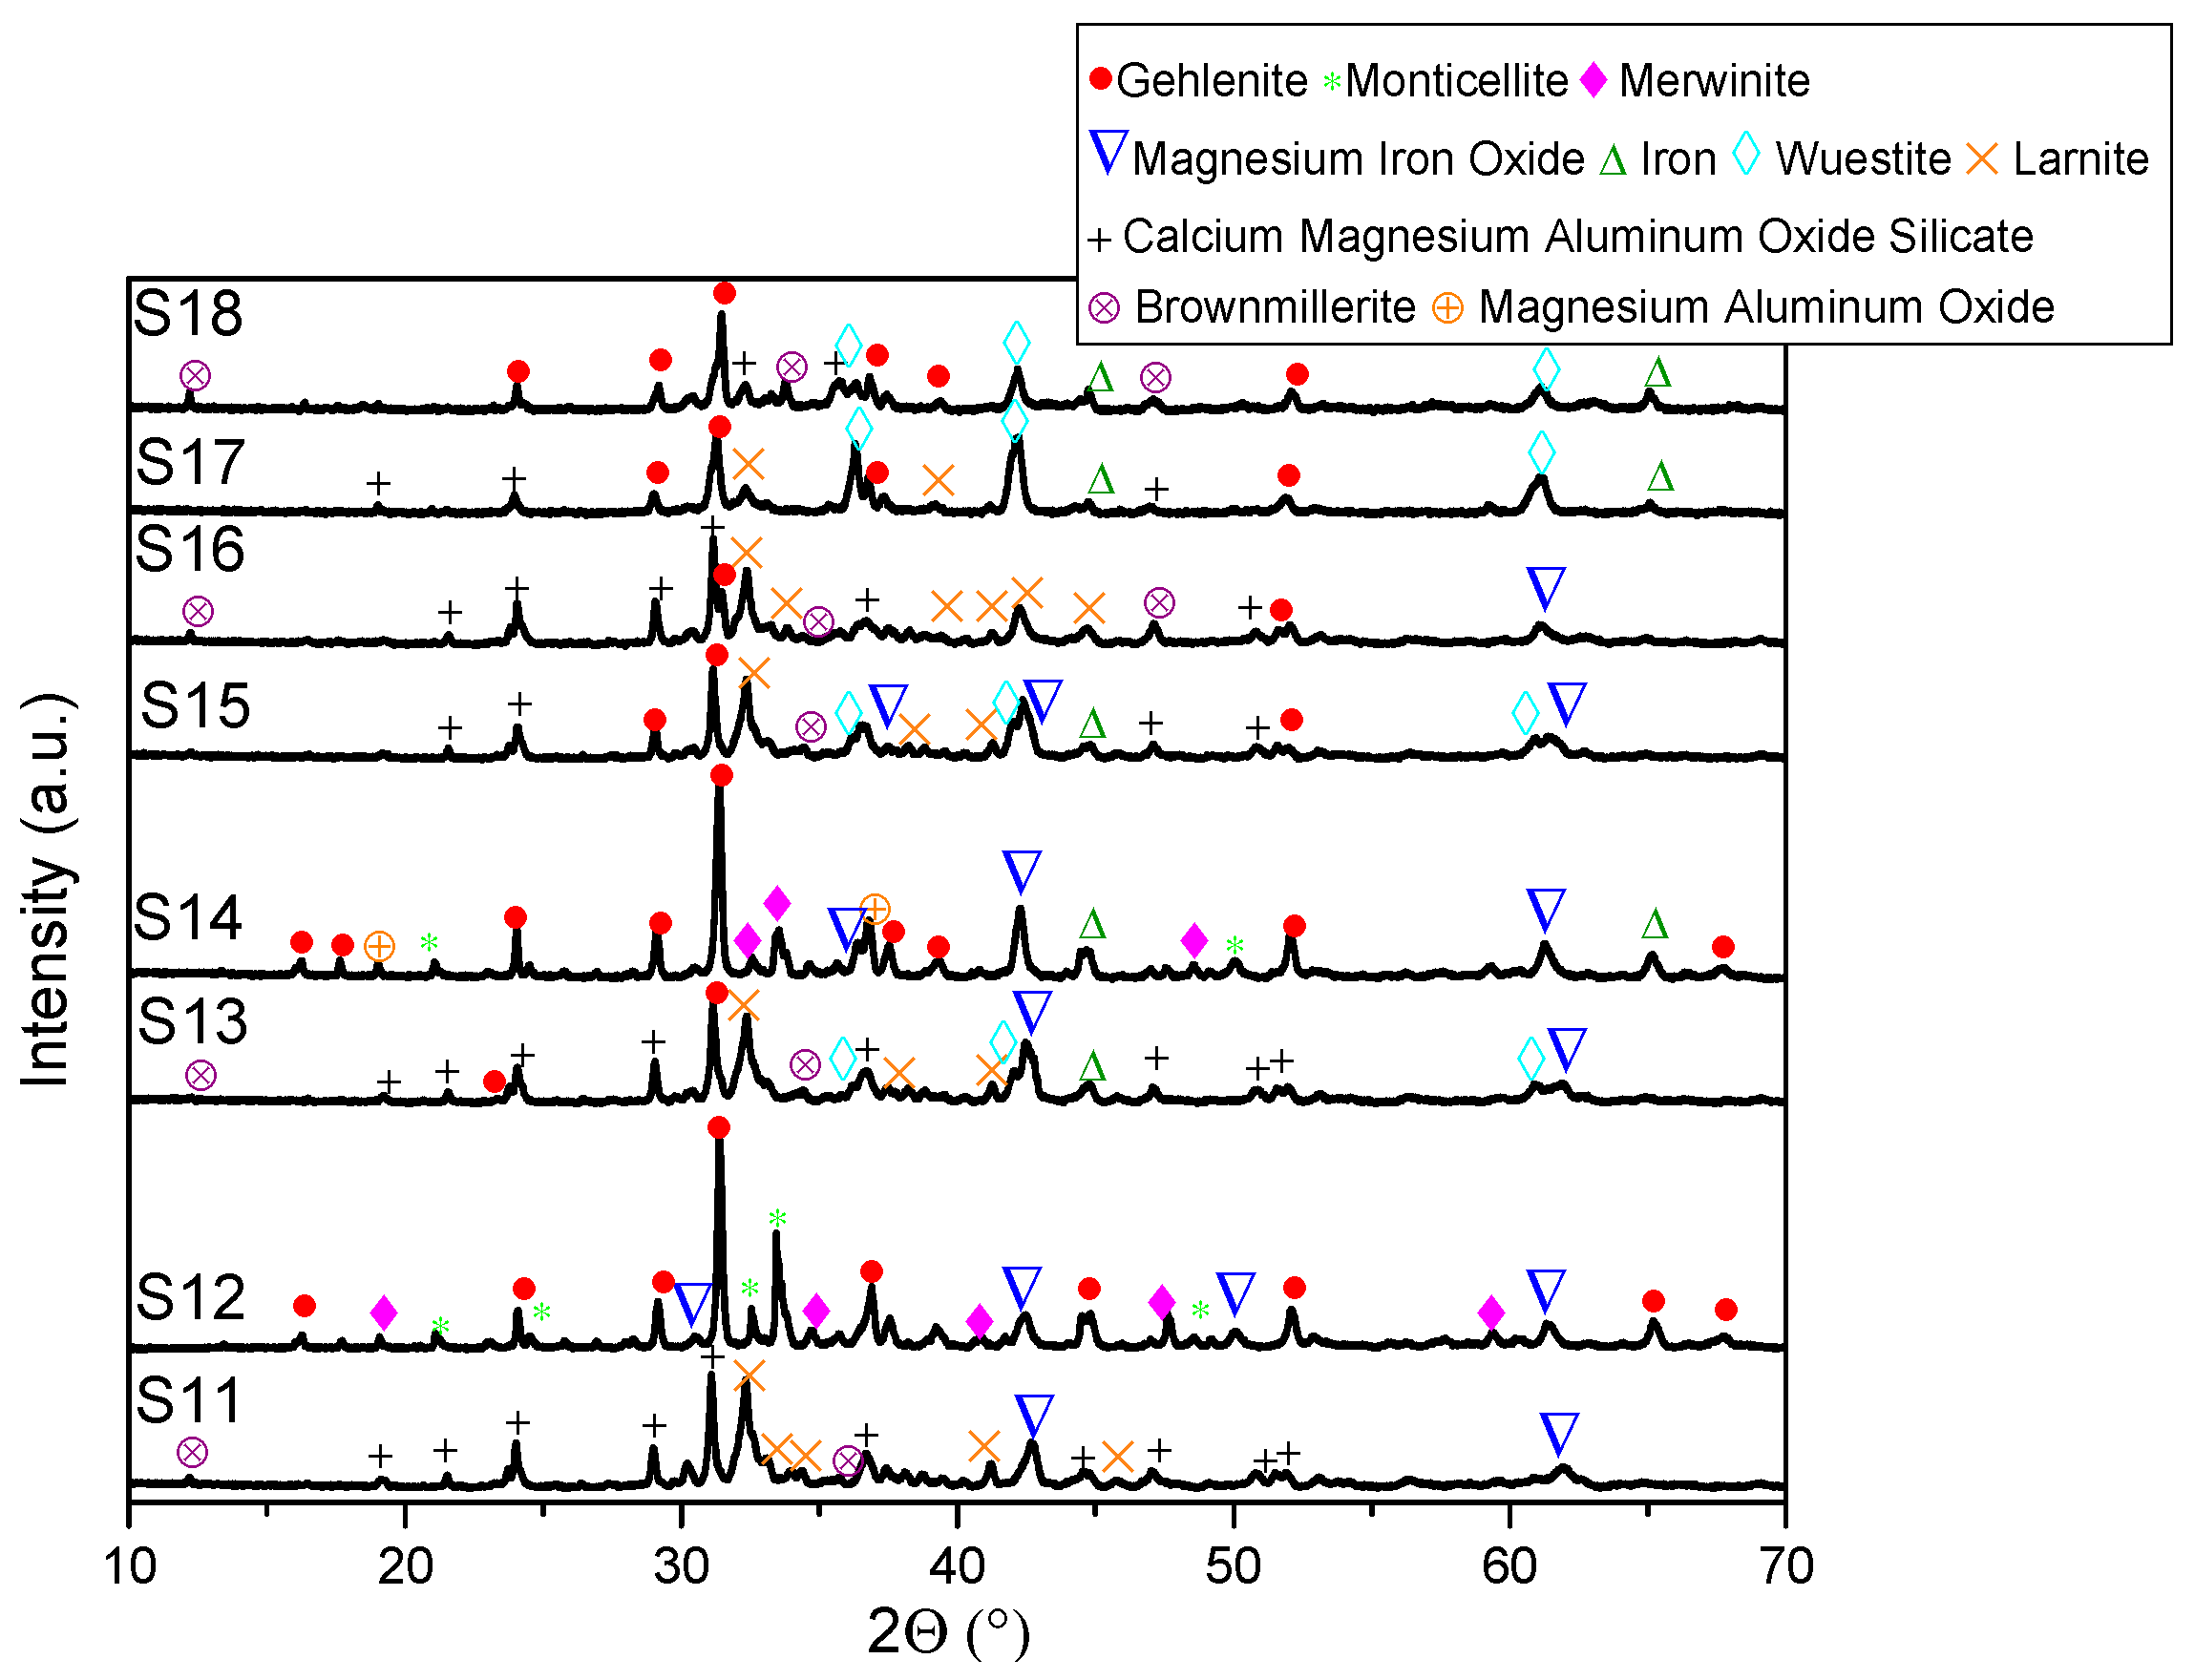
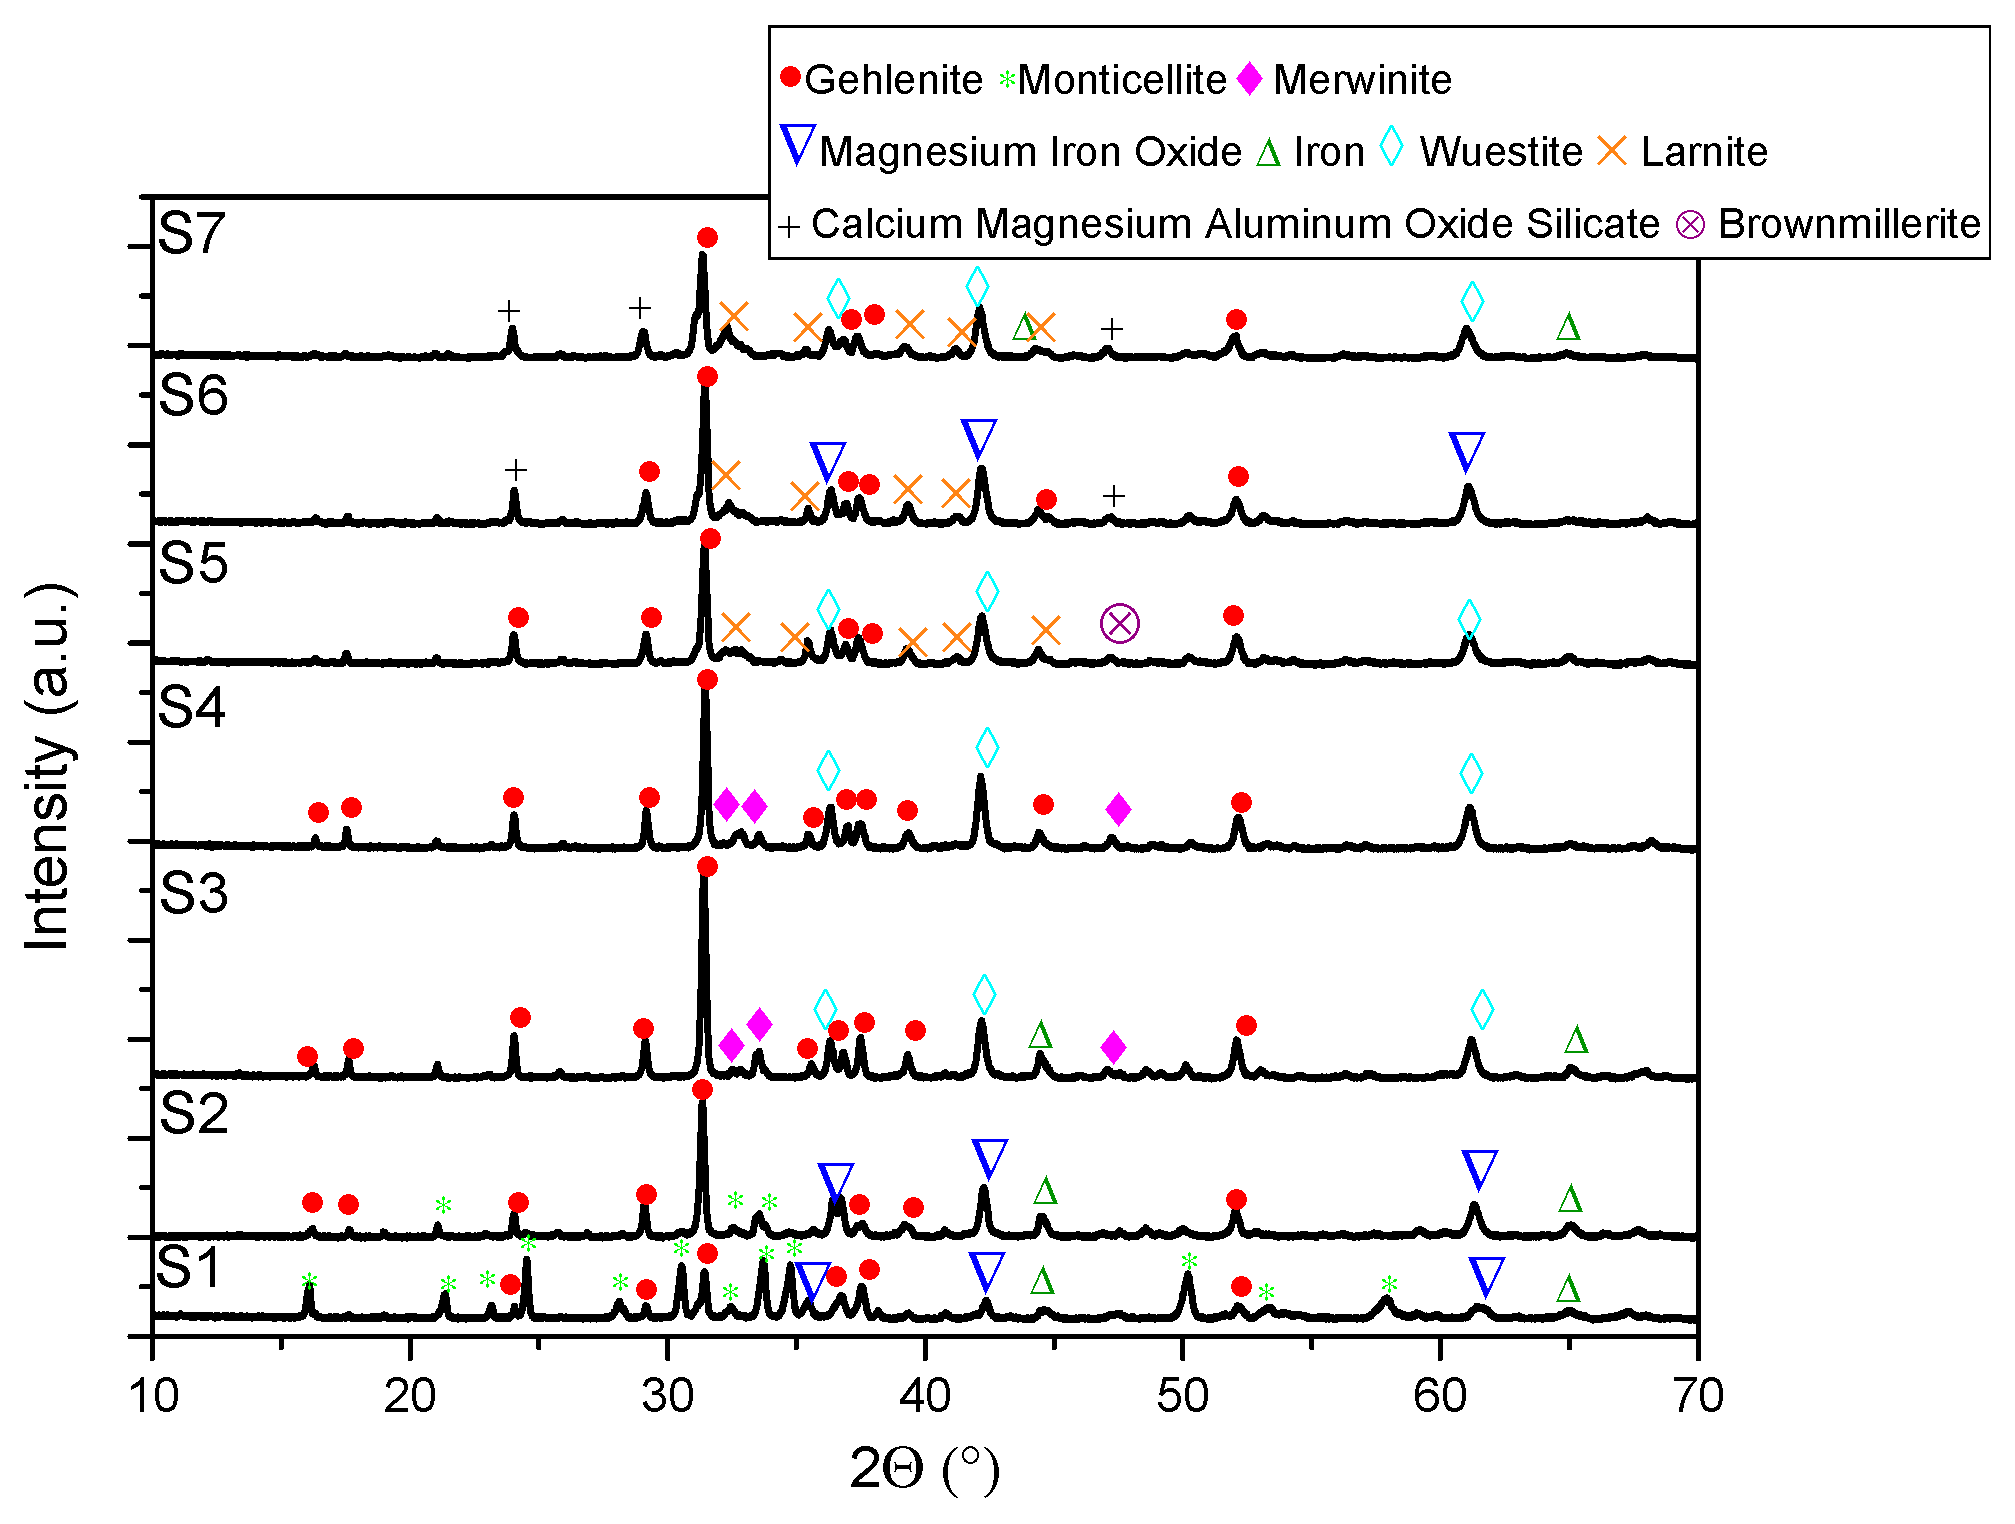
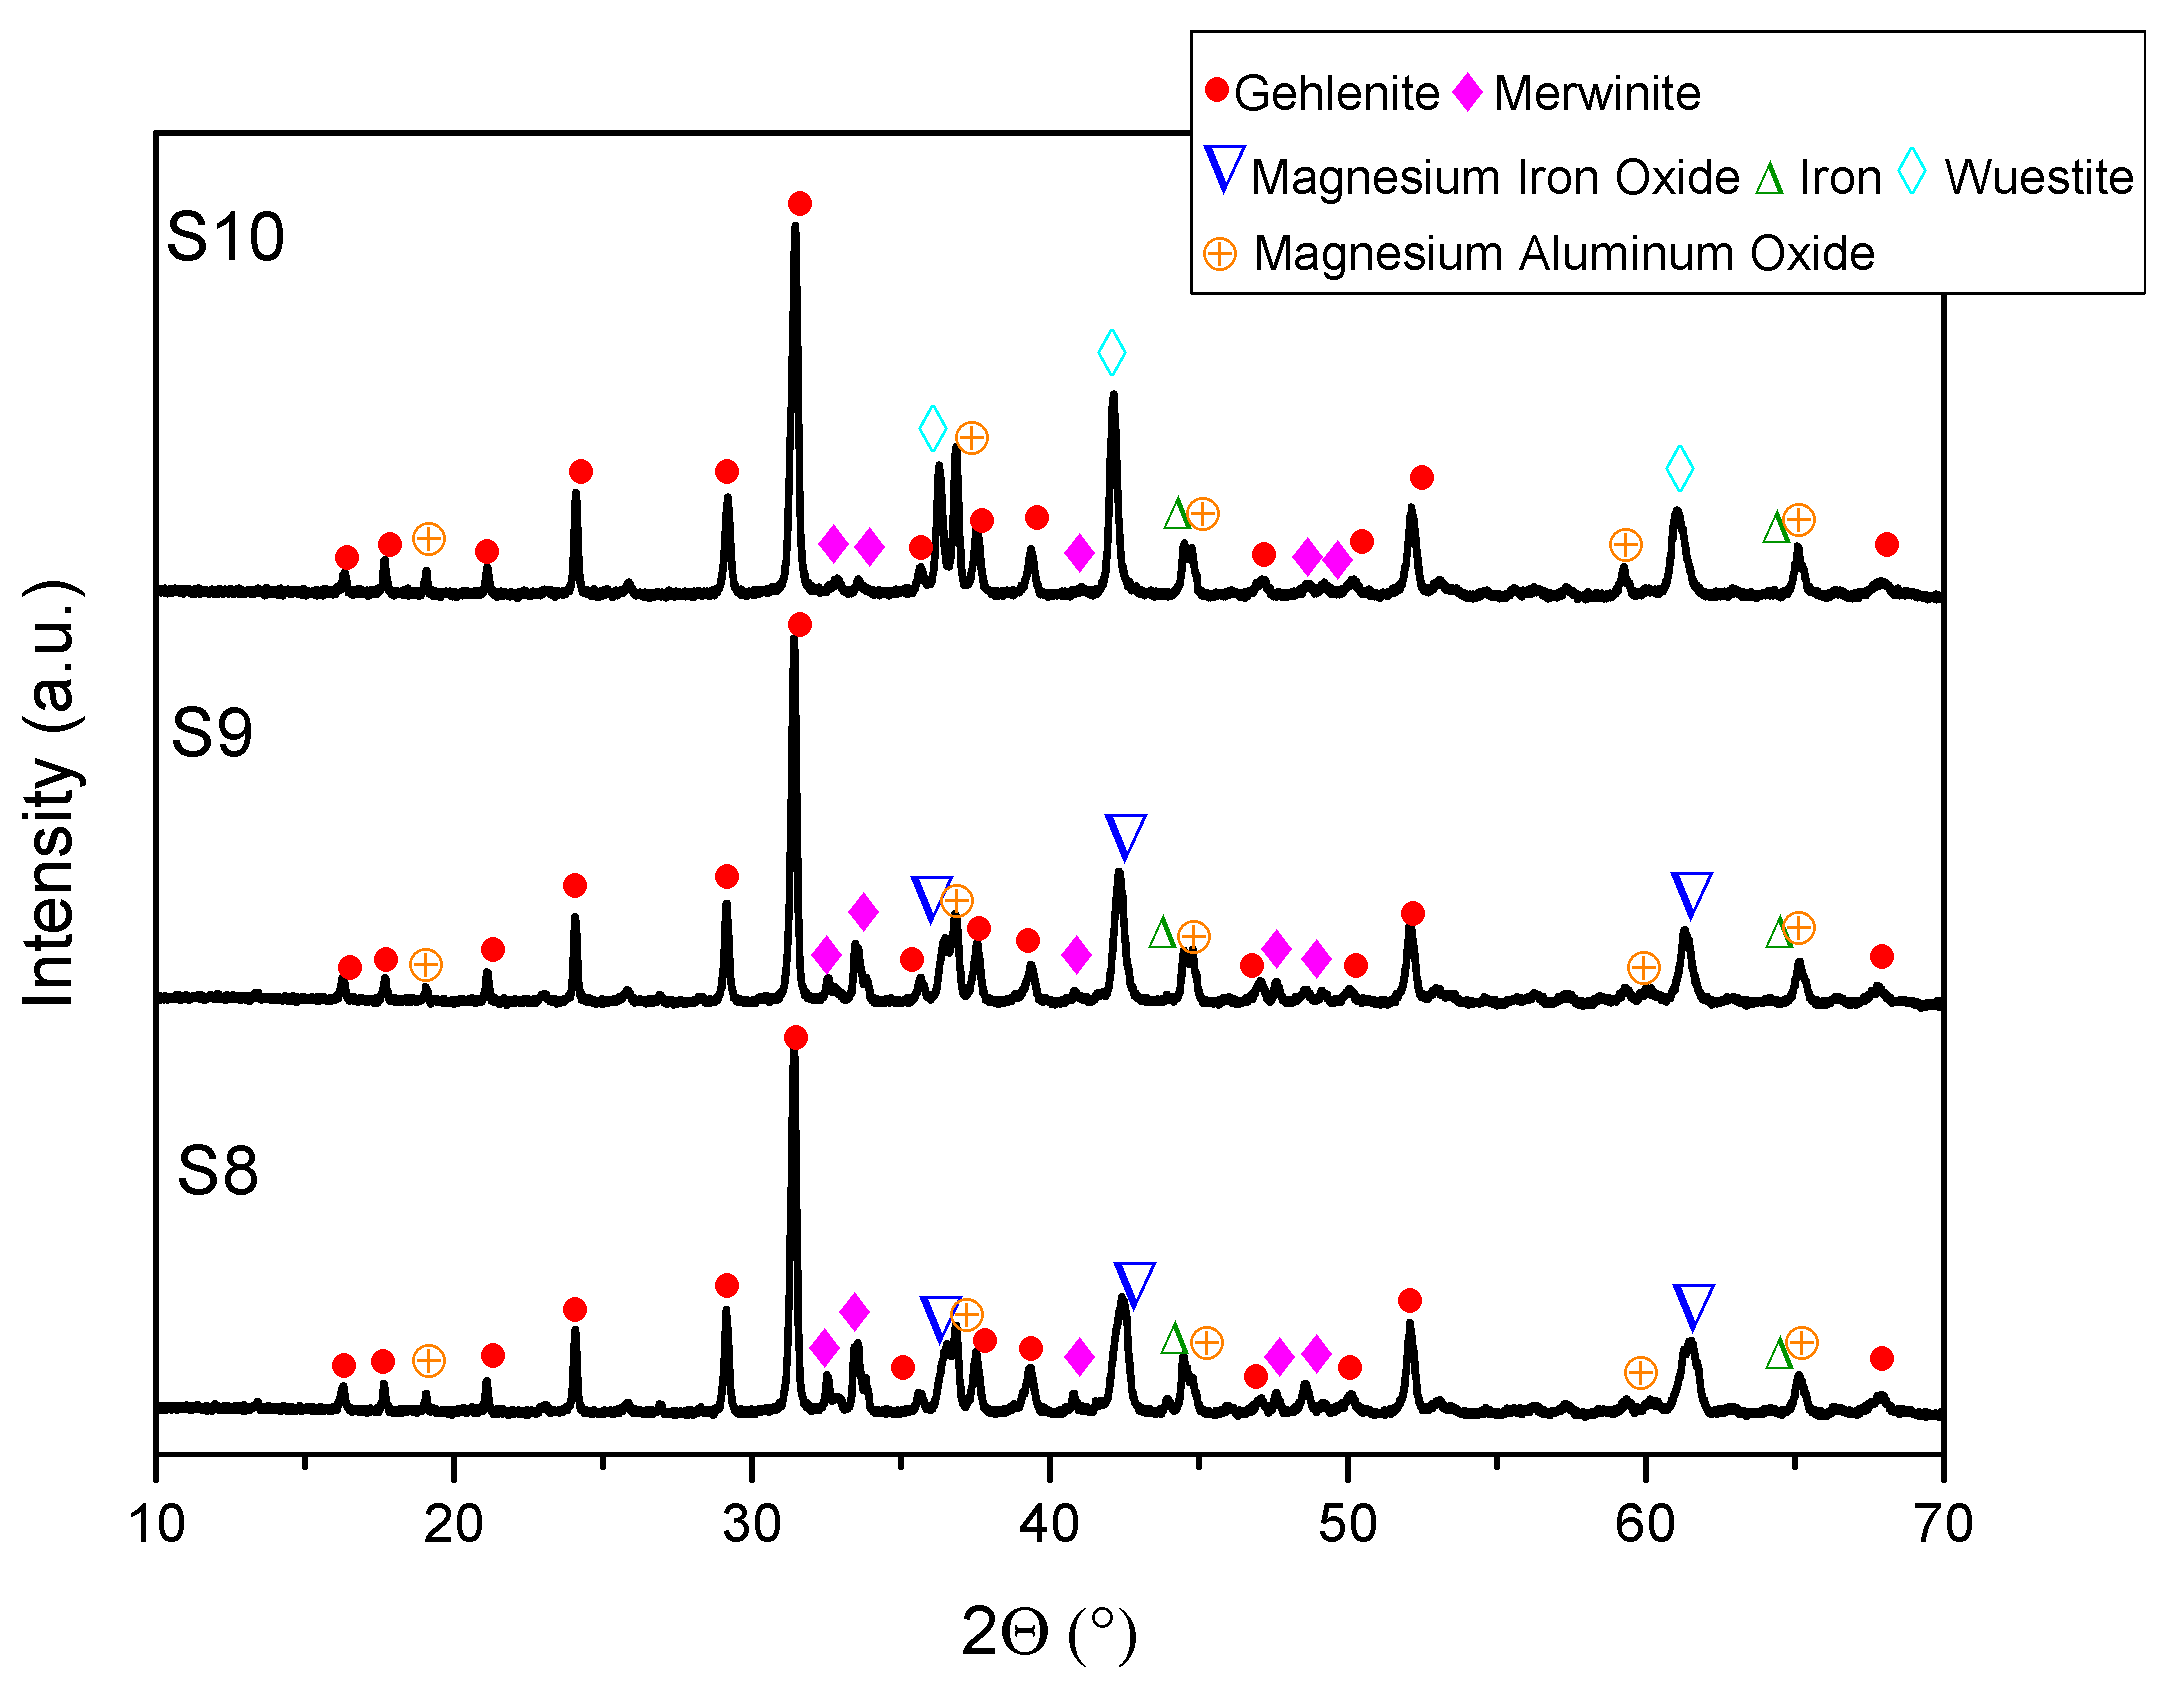
XRD analysis revealed consistent trends in the composition of slag foam samples unrelated to the carbon source used. Higher MgO content was associated with predominant phases such as monticellite and magnesium iron oxide. Slag foam samples with the lowest basicity showed the presence of monticellite and merwinite, while those with the highest basicity contained calcium magnesium aluminum oxide silicate, larnite, or dicalcium silicate;
(6)
When a mixture of coke and biochar was used, it produced different foaming behavior than coke or biochar. From experimental observation, biochar reacts fast enough at the initial stages of foaming, and, probably, coke has a major effect throughout the entire foaming process. It could be assumed that this mixture might generate more CO/CO2 than using 100 wt.% coke or 100 wt.% biochar individually. Consequently, this increased gas generation could lead to a prolonged reaction time compared to using 100 wt.% biochar, thereby enhancing the overall foaming process.
In summary, the utilization of different carbon sources influenced the foaming behavior, with the coke and biochar mixture demonstrating unique characteristics and potential for improved foaming outcomes.

Author Contributions

Conceptualization, L.K. and J.S.; methodology, L.K.; investigation, L.K.; writing—original draft preparation, L.K.; writing—review and editing, J.S.; supervision, J.S. All authors have read and agreed to the published version of the manuscript.

Funding

This research received no external funding.

Data Availability Statement

Not applicable.

Acknowledgments

Support by the scholarship program “Scholarship of the Scholarship Foundation of the Republic of Austria, Postdocs,” [MPC-2022-02241], financed by the Federal Ministry of Education, Science and Research of Austria, is gratefully acknowledged. Additionally, Voestalpine Stahl GmbH, Linz, Austria, is gratefully acknowledged for providing samples for this research. The support from Heng Zheng (Montanuniversitaet Leoben) during this research is gratefully appreciated.

Conflicts of Interest

The authors declare no conflict of interest.

References

  1. Zhu, T.X.; Coley, K.S.; Irons, G.A. Progress in Slag Foaming in Metallurgical Processes. Metall. Mater. Trans. B 2012, 43, 751–757. [Google Scholar] [CrossRef]
  2. Matsuura, H.; Fruehan, R.J. Slag Foaming in an Electric Arc Furnace. ISIJ Int. 2009, 49, 1530–1535. [Google Scholar] [CrossRef]
  3. Chychko, A.; Seetharaman, S. Foaming in Electric Arc Furnace Part I: Laboratory Studies of Enthalpy Changes of Carbonate Additions to Slag Melts. Metall. Mater. Trans. B 2011, 42, 20–29. [Google Scholar] [CrossRef]
  4. Vieira, D.; Almeida, R.A.M.D.; Bielefeldt, W.V.; Vilela, A.C.F. Slag Evaluation to Reduce Energy Consumption and EAF Electrical Instability. Mater. Res. 2016, 19, 1127–1131. [Google Scholar] [CrossRef]
  5. Ji, F.-Z.; Barati, M.; Coley, K.; Irons, G.A. Kinetics of Coal Injection into Iron Oxide Containing Slags. Can. Metall. Q. 2005, 44, 85–94. [Google Scholar] [CrossRef]
  6. Agnihotri, A.; Singh, P.K.; Singh, D.; Gupta, M. Foamy Slag Practice to Enhance the Energy Efficiency of Electric Arc Furnace: An Industrial Scale Validation. Mater. Today Proc. 2021, 46, 1537–1542. [Google Scholar] [CrossRef]
  7. de Almeida, R.A.M.; Vieira, D.; Bielefeldt, W.V.; Vilela, A.C.F. Slag Foaming Fundamentals—A Critical Assessment. Mater. Res. 2017, 20, 474–480. [Google Scholar] [CrossRef]
  8. Kieush, L.; Koveria, A.; Schenk, J.; Rysbekov, K.; Lozynskyi, V.; Zheng, H.; Matayev, A. Investigation into the Effect of Multi-Component Coal Blends on Properties of Metallurgical Coke via Petrographic Analysis under Industrial Conditions. Sustainability 2022, 14, 9947. [Google Scholar] [CrossRef]
  9. Ogawa, Y.; Katayama, H.; Hirata, H.; Tokumitsu, N.; Yamauchi, M. Slag Foaming in Smelting Reduction and Its Control with Carbonaceous Materials. ISIJ Int. 1992, 32, 87–94. [Google Scholar] [CrossRef]
  10. Wu, K.; Qian, W.; Chu, S.; Niu, Q.; Luo, H. Behavior of Slag Foaming Caused by Blowing Gas in Molten Slags. ISIJ Int. 2000, 40, 954–957. [Google Scholar] [CrossRef]
  11. Zhang, Y.; Fruehan, R.J. Effect of Carbonaceous Particles on Slag Foaming. Metall. Mater. Trans. B 1995, 26, 813–819. [Google Scholar] [CrossRef]
  12. Bhoi, B.; Jouhari, A.K.; Ray, H.S.; Misra, V.N. Smelting Reduction Reactions by Solid Carbon Using Induction Furnace: Foaming Behaviour and Kinetics of FeO Reduction in CaO–SiO2–FeO Slag. Ironmak. Steelmak. 2006, 33, 245–252. [Google Scholar] [CrossRef]
  13. Zhang, Y.; Fruehan, R.J. Effect of Gas Type and Pressure on Slag Foaming. Metall. Mater. Trans. B 1995, 26, 1088–1091. [Google Scholar] [CrossRef]
  14. Kieush, L.; Schenk, J.; Koveria, A.; Hrubiak, A.; Hopfinger, H.; Zheng, H. Evaluation of Slag Foaming Behavior Using Renewable Carbon Sources in Electric Arc Furnace-Based Steel Production. Energies 2023, 16, 4673. [Google Scholar] [CrossRef]
  15. European Commission. Directorate General for Research and Innovation. In Sustainable EAF Steel Production (GREENEAF); Publications Office: Luxembourg, 2013. [Google Scholar]
  16. Cirilli, F.; Baracchini, G.; Bianco, L. EAF Long Term Industrial Trials of Utilization of Char from Biomass as Fossil Coal Substitute. La Metall. Ital. 2017, 109, 13–17. [Google Scholar]
  17. Nwachukwu, C.M.; Wang, C.; Wetterlund, E. Exploring the Role of Forest Biomass in Abating Fossil CO2 Emissions in the Iron and Steel Industry—The Case of Sweden. Appl. Energy 2021, 288, 116558. [Google Scholar] [CrossRef]
  18. Funke, A.; Demus, T.; Willms, T.; Schenke, L.; Echterhof, T.; Niebel, A.; Pfeifer, H.; Dahmen, N. Application of Fast Pyrolysis Char in an Electric Arc Furnace. Fuel Process. Technol. 2018, 174, 61–68. [Google Scholar] [CrossRef]
  19. Kalde, A.; Demus, T.; Echterhof, T.; Pfeifer, H. Determining the Reactivity of Biochar-Agglomerates to Replace Fossil Coal in Electric Arc Furnace Steelmaking. In Proceedings of the EUBCE 2015 Online Conference Proceedings, Online, 1–4 June 2015; pp. 497–507. [Google Scholar]
  20. Chen, W.-H.; Peng, J.; Bi, X.T. A State-of-the-Art Review of Biomass Torrefaction, Densification and Applications. Renew. Sustain. Energy Rev. 2015, 44, 847–866. [Google Scholar] [CrossRef]
  21. Ru, B.; Wang, S.; Dai, G.; Zhang, L. Effect of Torrefaction on Biomass Physicochemical Characteristics and the Resulting Pyrolysis Behavior. Energy Fuels 2015, 29, 5865–5874. [Google Scholar] [CrossRef]
  22. Yang, H.; Yan, R.; Chen, H.; Zheng, C.; Lee, D.H.; Liang, D.T. In-Depth Investigation of Biomass Pyrolysis Based on Three Major Components: Hemicellulose, Cellulose and Lignin. Energy Fuels 2006, 20, 388–393. [Google Scholar] [CrossRef]
  23. Kieush, L.; Koveria, A.; Boyko, M.; Yaholnyk, M.; Hrubiak, A.; Molchanov, L.; Moklyak, V. Influence of Biocoke on Iron Ore Sintering Performance and Strength Properties of Sinter. Min. Miner. Depos. 2022, 16, 55–63. [Google Scholar] [CrossRef]
  24. Shukla, I. Potential of Renewable Agricultural Wastes in the Smart and Sustainable Steelmaking Process. J. Clean. Prod. 2022, 370, 133422. [Google Scholar] [CrossRef]
  25. Fidalgo, B.; Berrueco, C.; Millan, M. Chars from Agricultural Wastes as Greener Fuels for Electric Arc Furnaces. J. Anal. Appl. Pyrolysis 2015, 113, 274–280. [Google Scholar] [CrossRef]
  26. Echterhof, T. Review on the Use of Alternative Carbon Sources in EAF Steelmaking. Metals 2021, 11, 222. [Google Scholar] [CrossRef]
  27. Huang, X.; Ng, K.W.; Giroux, L.; Duchesne, M.; Li, D.; Todoschuk, T. Interaction Behavior of Biogenic Material with Electric Arc Furnace Slag. Fuels 2021, 2, 420–436. [Google Scholar] [CrossRef]
  28. Robinson, R.; Brabie, L.; Pettersson, M.; Amovic, M.; Ljunggren, R. An Empirical Comparative Study of Renewable Biochar and Fossil Carbon as Carburizer in Steelmaking. ISIJ Int. 2022, 62, 2522–2528. [Google Scholar] [CrossRef]
  29. Demus, T.; Reichel, T.; Schulten, M.; Echterhof, T.; Pfeifer, H. Increasing the Sustainability of Steel Production in the Electric Arc Furnace by Substituting Fossil Coal with Biochar Agglomerates. Ironmak. Steelmak. 2016, 43, 564–570. [Google Scholar] [CrossRef]
  30. Yunos, N.F.M.; Zaharia, M.; Idris, M.A.; Nath, D.; Khanna, R.; Sahajwalla, V. Recycling Agricultural Waste from Palm Shells during Electric Arc Furnace Steelmaking. Energy Fuels 2012, 26, 278–286. [Google Scholar] [CrossRef]
  31. Hoikkaniemi, E.; Sulasalmi, P.; Visuri, V.-V.; Fabritius, T. Biochar as a Slag Foaming Agent in EAF—A Novel Experimental Setup. In Proceedings of the 5th European Academic Symposium on EAF Steelmaking, Oulu, Finland, 5 June 2023; pp. 1–5. [Google Scholar]
  32. Di Giovanni, C.; Li, D.; Ng, K.W.; Huang, X. Ranking of Injection Biochar for Slag Foaming Applications in Steelmaking. Metals 2023, 13, 1003. [Google Scholar] [CrossRef]
  33. Kieush, L.; Rieger, J.; Schenk, J.; Brondi, C.; Rovelli, D.; Echterhof, T.; Cirilli, F.; Thaler, C.; Jaeger, N.; Snaet, D.; et al. A Comprehensive Review of Secondary Carbon Bio-Carriers for Application in Metallurgical Processes: Utilization of Torrefied Biomass in Steel Production. Metals 2022, 12, 2005. [Google Scholar] [CrossRef]
  34. Kieush, L.; Schenk, J.; Koveria, A.; Rantitsch, G.; Hrubiak, A.; Hopfinger, H. Utilization of Renewable Carbon in Electric Arc Furnace-Based Steel Production: Comparative Evaluation of Properties of Conventional and Non-Conventional Carbon-Bearing Sources. Metals 2023, 13, 722. [Google Scholar] [CrossRef]
  35. Menad, N.-E.; Kana, N.; Seron, A.; Kanari, N. New EAF Slag Characterization Methodology for Strategic Metal Recovery. Materials 2021, 14, 1513. [Google Scholar] [CrossRef]
  36. Heo, J.H.; Park, J.H. Assessment of Physicochemical Properties of Electrical Arc Furnace Slag and Their Effects on Foamability. Metall. Mater. Trans. B 2019, 50, 2959–2968. [Google Scholar] [CrossRef]
  37. Jiang, R.; Fruehan, R.J. Slag Foaming in Bath Smelting. Metall. Mater. Trans. B 1991, 22, 481–489. [Google Scholar] [CrossRef]
  38. Lahiri, A.K.; Seetharaman, S. Foaming Behavior of Slags. Metall. Mater. Trans. B 2002, 33, 499–502. [Google Scholar] [CrossRef]
  39. Hong, L.; Hirasawa, M.; Sano, M. Behavior of Slag Foaming with Reduction of Iron Oxide in Molten Slags by Graphite. ISIJ Int. 1998, 38, 1339–1345. [Google Scholar] [CrossRef]
  40. Xiang, J.; Wang, X.; Yang, M.; Wang, J.; Shan, C.; Fan, G.; Qiu, G.; Lv, X. Slag-Foaming Phenomenon Originating from Reaction of Titanium-Bearing Blast Furnace Slag: Continuous Monitoring of Foaming Height and Calibration. J. Mater. Res. Technol. 2021, 11, 1184–1192. [Google Scholar] [CrossRef]
  41. Ren, X.; Cai, H.; Chang, J.-M.; Fan, Y.-M. TG-FTIR Study on the Pyrolysis Properties of Lignin from Different Kinds of Woody Biomass. Mater. Sci. 2018, 3, 1–7. [Google Scholar] [CrossRef]
  42. Ben, H.; Hao, N.; Liu, Q.; Ragauskas, A.J. Solid-State NMR Investigation of Bio-Chars Produced from Biomass Components and Whole Biomasses. Bioenerg. Res. 2017, 10, 1036–1044. [Google Scholar] [CrossRef]
  43. Jennings, K.R. Spectrometric Identification of Organic Compounds (Fifth Edition). Wiley, New York. Org. Mass Spectrom. 1991, 26, 813. [Google Scholar] [CrossRef]
  44. Vidacak, B.; Arvanitidis, I.; Jönsson, P.G.; Sjöberg, P. Observation on Foaming of EAF Slags in the Production of Stainless Steel: Observation on Foaming of EAF Slags. Scand. J. Metall. 2002, 31, 321–327. [Google Scholar] [CrossRef]
  45. Zhang, Y.; Fruehan, R.J. Effect of the Bubble Size and Chemical Reactions on Slag Foaming. MMTB 1995, 26, 803–812. [Google Scholar] [CrossRef]
  46. Herbelin, M.; Bascou, J.; Lavastre, V.; Guillaume, D.; Benbakkar, M.; Peuble, S.; Baron, J.-P. Steel Slag Characterisation—Benefit of Coupling Chemical, Mineralogical and Magnetic Techniques. Minerals 2020, 10, 705. [Google Scholar] [CrossRef]
  47. Mombelli, D.; Mapelli, C.; Barella, S.; Gruttadauria, A.; Le Saout, G.; Garcia-Diaz, E. The Efficiency of Quartz Addition on Electric Arc Furnace (EAF) Carbon Steel Slag Stability. J. Hazard. Mater. 2014, 279, 586–596. [Google Scholar] [CrossRef] [PubMed]
  48. Riboldi, A.; Borgese, L.; Vassalini, I.; Cornacchia, G.; Gelfi, M.; Boniardi, M.V.; Casaroli, A.; Depero, L.E. Micro-Raman Spectroscopy Investigation of Crystalline Phases in EAF Slag. Appl. Sci. 2020, 10, 4115. [Google Scholar] [CrossRef]
  49. Gaye, H.; Lehmann, J. Steelmaking Slags. In Slag Atlas; Verlag Stahleisen GmbH: Dusseldorf, Germany, 1995. [Google Scholar]
  50. Corbari, R.; Matsuura, H.; Halder, S.; Walker, M.; Fruehan, R.J. Foaming and the Rate of the Carbon-Iron Oxide Reaction in Slag. Metall. Mater. Trans. B 2009, 40, 940–948. [Google Scholar] [CrossRef]
  51. Luz, A.P.; Avila, T.A.; Bonadia, P.; Pandolfelli, V.C. Slag Foaming: Fundamentals, Experimental Evaluation and Application in the Steelmaking Industry. Refract. Worldforum 2011, 3, 91–98. [Google Scholar]
  52. Ito, K.; Fruehan, R.J. Study on the Foaming of CaO-SiO2-FeO Slags: Part I. Foaming Parameters and Experimental Results. Metall. Trans. B 1989, 20, 509–514. [Google Scholar] [CrossRef]
  53. Luz, A.P.; Tomba Martinez, A.G.; López, F.; Bonadia, P.; Pandolfelli, V.C. Slag Foaming Practice in the Steelmaking Process. Ceram. Int. 2018, 44, 8727–8741. [Google Scholar] [CrossRef]
  54. Teasdale, S.L.; Hayes, P.C. Observations of the Reduction of FeO from Slag by Graphite, Coke and Coal Char. ISIJ Int. 2005, 45, 634–641. [Google Scholar] [CrossRef]
Figure 1. Example of foam height measurement.
Energies 16 06325 g001
Figure 2. FTIR spectra of two carbon sources. Assignments of peaks are given within the text.
Energies 16 06325 g002
Figure 3. 1H NMR spectra chemical shifts (f1, ppm) of two carbon sources: (a) biochar; (b) coke. Assignments of peaks A–F are given within the text.
Energies 16 06325 g003
Figure 4. (a) Comparison between calculated slag height and measured slag height. (b) Comparison between calculated slag volume and measured slag volume.
Energies 16 06325 g004
Figure 5. XRD patterns of slag foams obtained by applying slags with different basicity, stable content FeO 25 wt.%, and coke as a carbon source.
Energies 16 06325 g005
Figure 6. XRD patterns of slag foams obtained by applying slags with stable basicity and Al2O3 content and coke as a carbon source.
Energies 16 06325 g006
Figure 7. Correlation between the ratio of slag heights and weight ratio of coke/slag.
Energies 16 06325 g007
Figure 8. XRD patterns of slag foams obtained by applying slags with different FeO content, stable basicity, and coke as a carbon source.
Energies 16 06325 g008
Figure 9. Foam height (coke as a carbon source) and foaming index as a function of (a) basicity and (b) FeO content of slags; relationship between relative foaming volume and gas fraction of slags with stable FeO content (c) and basicity (d).
Energies 16 06325 g009
Figure 10. XRD patterns of slag foams obtained by applying slags with different basicities, stable FeO content, and biochar as a carbon source.
Energies 16 06325 g010
Figure 11. XRD patterns of slag foams obtained by applying slags with stable basicity and Al2O3 content and biochar as a carbon source.
Energies 16 06325 g011
Figure 12. Correlation between the ratio of slag heights and weight ratio of biochar/slag.
Energies 16 06325 g012
Figure 13. XRD patterns of slag foams obtained by applying slags with different FeO content, stable basicity, and biochar as a carbon source.
Energies 16 06325 g013
Figure 14. Foam height (biochar as a carbon source) and foaming index as a function of (a) basicity and (b) FeO content of slags; relationship between relative foaming volume and gas fraction of slags with stable: FeO content (c) and basicity (d).
Energies 16 06325 g014
Figure 15. XRD patterns of slag foams obtained by applying slags with different basicities, stable FeO 25 wt.%, and a mixture of coke and biochar with a ratio of 1:1 as a carbon source.
Energies 16 06325 g015
Figure 16. XRD patterns of slag foams obtained by applying slags with stable basicity and Al2O3 content and a mixture of coke and biochar with a ratio of 1:1 as a carbon source.
Energies 16 06325 g016
Figure 17. Correlation between the ratio of slag heights and weight ratio of coke and biochar/slag.
Energies 16 06325 g017
Figure 18. XRD patterns of slag foams obtained by applying slags with different FeO content, stable basicity, and a mixture of coke and biochar with a ratio of 1:1 as a carbon source.
Energies 16 06325 g018
Figure 19. Foam height (mixture of coke and biochar with a ratio of 1:1 as a carbon source) and foaming index as a function of (a) basicity and (b) FeO content of slags; relationship between relative foaming volume and gas fraction of slags with stable FeO content (c) and basicity (d).
Energies 16 06325 g019
Table 1. Slag compositions with stable FeO content.
SampleFeO, wt.%CaO, wt.%SiO2, wt.%MgO, wt.%Al2O3, wt.%TotalB2B3μ,
Pa·s
ρ,
g/cm3
σ,
N/m
Ʃ,
s
S125.027.227.215.05.5100.01.00.80.04753.330.544.07
S225.028.323.214.29.3100.01.20.90.04653.380.543.95
S325.035.622.99.76.8100.01.61.20.04123.340.563.48
S4 25.038.519.08.09.4100.02.01.40.03913.370.573.25
S525.041.515.57.510.5100.02.71.60.03633.400.582.97
S625.044.514.36.49.8100.03.11.80.03413.400.592.78
S725.045.713.56.09.8100.03.42.00.03333.400.592.71
μ, viscosity; ρ , density; σ, surface tension; Ʃ, foaming index.
Table 2. Slag compositions with stable basicity and Al2O3.
SampleFeO, wt.%CaO, wt.%SiO2, wt.%MgO, wt.%Al2O3, wt.%TotalB2B3μ,
Pa·s
ρ,
g/cm3
σ,
N/m
Ʃ,
s
S824.030.022.016.08.0100.01.41.00.0444.410.732.83
S926.530.022.013.58.0100.01.41.00.0413.400.563.42
S1030.730.022.09.38.0100.01.41.00.0383.440.563.15
μ, viscosity; ρ , density; σ, surface tension; Ʃ, foaming index.
Table 3. Slag compositions with stable basicity.
SampleFeO, wt.%CaO, wt.%SiO2, wt.%MgO, wt.%Al2O3, wt.%TotalB2B3μ,
Pa·s
ρ,
g/cm3
σ,
N/m
Ʃ,
s
S1110.0 53.114.010.912.0100.03.82.0 0.04663.20 0.58 3.94
S1215.053.114.06.112.0100.03.82.00.04203.240.583.52
S1323.043.611.611.210.6100.03.82.00.03483.430.592.81
S1425.043.311.410.310.0100.03.82.00.03283.450.592.64
S1527.043.211.48.410.0100.03.82.00.03143.470.602.51
S1630.043.111.25.710.0100.03.82.00.02913.510.602.31
S1740.033.18.810.18.0100.03.82.00.00233.720.610.18
S1850.028.17.47.57.0100.03.82.00.00183.890.620.13
μ, viscosity; ρ , density; σ, surface tension; Ʃ, foaming index.
Table 4. Characters of carbon sources used for slag foaming, wt.%.
CharactersCokeBch
Proximate analysis
M1.042.67
VM (daf)1.5741.04
Ash (db)10.884.29
Elemental analysis
S (db)0.77n.d.
C (db)86.2572.74
H (db)0.294.62
N (db)1.210.24
* Others, mainly O (db)0.6018.11
Cfix (db)87.7056.43
M, moisture; C, carbon; H, hydrogen; N, nitrogen; S, sulfur; db, dry basis; daf, dry ash-free basis; VM(daf) = VM(db)·100/(100 − ash yield (db,%)); Cfix, wt.% = 100 − (wt.% VM (db) − wt.% Ash (db)); * Calculated by difference; n.d., not detected.
Table 5. Amount of carbon source for required reduction, g.
SampleCokeBiocharCoke + Biochar
S1–S74.757.382.38 + 3.69
S84.567.092.28 + 3.55
S95.047.832.52 + 3.92
S105.839.072.92 + 4.54
S111.902.950.95 + 1.48
S122.854.431.43 + 2.22
S134.376.792.19 + 3.40
S144.757.382.38 + 3.69
S155.137.972.57 + 3.99
S165.708.862.85 + 4.43
S177.6011.813.80 + 5.90
S189.5014.774.75 + 7.40
Table 6. Slag foaming characters (coke as a carbon source; stable content of FeO 25 wt.%).
SampleFoam Height
hfoam, cm
Foam Volume
Vfoam, cm3
Relative Foaming Volume, ΔV/V0Volumetric Gas Fraction,
Xgas
S13.5 *109.053.320.77
S27.0218.106.450.87
S39.6299.1010.850.92
S410.6330.2611.330.92
S511.0342.7211.220.92
S68.5264.838.040.89
S78.0249.257.600.88
* height of oscillation.
Table 7. SEM/EDS analysis results of general chemical composition for slag foam obtained by applying slags with different basicities, stable content FeO 25 wt.%, and coke as a carbon source, wt.%.
SampleOMgAlSiCaFe
S139.627.386.5710.3215.8220.30
S237.987.4813.118.2515.3217.86
S338.264.508.569.9224.3514.41
S435.763.1710.606.4630.6213.38
S536.312.7110.685.4127.3717.52
S636.412.2714.044.9329.2313.11
S738.162.2713.724.9226.0814.85
Table 8. Slag foaming characters (coke as a carbon source; stable basicity and Al2O3 content).
SampleFoam Height
hfoam, cm
Foam Volume
Vfoam, cm3
Relative
Foaming Volume, ΔV/V0
Volumetric Gas Fraction,
Xgas
S87.1221.216.890.87
S98.5264.838.440.89
S107.9246.148.290.89
Table 9. SEM/EDS analysis results of general chemical composition for slag foam obtained by applying slags with stable basicity and Al2O3 content and coke as a carbon source, wt.%.
SampleOMgAlSiCaFe
S838.827.065.209.8721.4017.65
S935.807.804.7910.6920.7120.21
S1036.075.434.4810.5221.1822.32
Table 10. Slag foaming characters (coke as a carbon source; stable basicity).
SampleFoam Height
hfoam, cm
Foam Volume
Vfoam, cm3
Relative Foaming Volume, ΔV/V0Volumetric Gas
Fraction,
Xgas
S112.3 *71.661.370.58
S128.0249.257.250.88
S139.0280.418.680.90
S149.3289.769.330.90
S159.8305.349.430.90
S1610.1314.689.740.91
S179.6299.1010.030.91
S189.4292.879.800.91
* height of oscillation.
Table 11. SEM/EDS analysis results of general chemical composition for slag foam obtained by applying slags with different content FeO, stable basicity, and coke as a carbon source, wt.%.
SampleOMgAlSiCaFe
S1139.743.4913.014.5731.158.03
S1238.341.3612.543.6137.566.59
S1334.501.8012.555.1835.1310.83
S1433.943.619.433.2930.4419.28
S1532.262.4913.724.9530.0916.49
S1637.486.185.758.2522.3919.95
S1731.722.039.862.5327.2326.63
S1831.984.8113.242.8715.3031.81
Table 12. Slag foaming characters (100 wt.% biochar as a carbon source; stable content of FeO 25 wt.%).
SampleFoam Height
hfoam, cm
Foam Volume
Vfoam, cm3
Relative
Foaming Volume ΔV/V0
Volumetric Gas
Fraction
Xgas
S13.1 *96.592.300.70
S28.7271.068.700.89
S38.6267.947.600.88
S48.7271.068.000.89
S58.9277.297.900.89
S68.6267.947.600.88
S710.0311.569.100.90
* height of oscillation.
Table 13. SEM/EDS analysis results of general chemical composition for slag foam obtained by applying slags with different basicities, stable content FeO 25 wt.%, and biochar as a carbon source, wt.%.
SampleOMgAlSiCaFe
S137.539.085.6512.2320.8214.69
S235.232.0910.983.7227.4020.59
S338.502.7111.437.0323.0717.25
S436.154.6910.687.6226.7214.15
S537.732.3516.155.4924.9513.33
S638.252.5313.334.3523.9217.61
S737.252.2912.223.9729.8914.38
Table 14. Slag foaming characters (biochar as a carbon source; stable basicity and Al2O3 content).
SampleFoam Height
hfoam, cm
Foam Volume
Vfoam, cm3
Relative
Foaming Volume, ΔV/V0
Volumetric Gas Fraction,
Xgas
S86.7208.756.200.86
S96.9214.986.340.86
S106.8186.945.670.85
Table 15. SEM/EDS analysis results of general chemical composition for slag foam obtained by applying slags with stable basicity and Al2O3 content and biochar as a carbon source, wt.%.
SampleOMgAlSiCaFe
S836.249.084.3910.1421.2818.87
S937.656.344.7610.3720.0120.87
S1037.125.225.2310.0919.2923.05
Table 16. Slag foaming characters (100 wt.% biochar as a carbon source; stable basicity).
SampleFoam Height
hfoam, cm
Foam Volume
Vfoam,
cm3
Relative Foaming Volume ΔV/V0Volumetric Gas
Fraction,
Xgas
S112.5 *77.892.600.72
S126.7208.755.800.85
S1310.1314.689.200.90
S148.0249.257.900.89
S159.5295.999.000.90
S1611.0343.6611.700.92
S1710.4324.0310.600.91
S1810.8336.4910.600.91
* height of oscillation.
Table 17. SEM/EDS analysis results of general chemical composition for slag foam obtained by applying slags with different content FeO, stable basicity, and biochar as a carbon source, wt.%.
SampleOMgAlSiCaFe
S1139.743.4913.014.5731.158.03
S1238.341.3612.543.6137.566.59
S1334.501.8012.555.1835.1310.83
S1433.943.619.433.2930.4419.28
S1532.262.4913.724.9530.0916.49
S1637.486.185.758.2522.3919.95
S1731.722.039.862.5327.2326.63
S1831.984.7113.242.8715.3031.81
Table 18. Slag foaming characters (mixture of coke and biochar with a ratio of 1:1 as a carbon source; stable content of FeO 25 wt.%).
SampleFoam Height
hfoam, cm
Foam Volume
Vfoam, cm3
Relative Foaming Volume, ΔV/V0Volumetric Gas Fraction,
Xgas
S16.4199.406.110.86
S27.3227.446.400.87
S39.7302.229.660.91
S410.6330.2610.910.92
S510.5327.148.550.90
S69.7302.228.700.90
S79.3289.768.300.89
Table 19. SEM/EDS analysis results of general chemical composition for slag foam obtained by applying slags with different basicities, stable content FeO 25 wt.%, and mixture of coke and biochar with a ratio of 1:1 as a carbon source, wt.%.
SampleOMgAlSiCaFe
S137.803.7515.424.6222.9915.42
S238.246.1610.359.2521.3914.61
S334.723.487.058.8127.8918.05
S440.702.1612.695.3225.0814.06
S534.062.5511.217.3526.9817.84
S631.902.6813.245.5230.7115.95
S734.662.3212.134.5529.6616.68
Table 20. Slag foaming characters (mixture of coke and biochar with a ratio of 1:1 as a carbon source; stable basicity and Al2O3 content).
SampleFoam Height
hfoam, cm
Foam Volume
Vfoam, cm3
Relative Foaming Volume, ΔV/V0Volumetric Gas
Fraction,
Xgas
S87.5233.677.060.88
S98.6267.958.150.89
S108.0249.258.520.90
Table 21. SEM/EDS analysis results of general chemical composition for slag foam obtained by applying slags with stable basicity and Al2O3 content and a mixture of coke and biochar with a ratio of 1:1 as a carbon source, wt.%.
SampleOMgAlSiCaFe
S838.869.885.089.1619.1517.87
S939.797.834.6010.8418.7818.16
S1040.765.054.829.0920.2220.06
Table 22. Slag foaming characters (mixture of coke and biochar with a ratio of 1:1 as a carbon source; stable basicity).
SampleFoam Height
hfoam, cm
Foam Volume
Vfoam, cm3
Relative
Foaming Volume, ΔV/V0
Volumetric Gas
Fraction,
Xgas
S113.4 *105.932.580.72
S128.1252.377.350.88
S138.2255.487.370.88
S148.4261.728.330.89
S159.6299.108.600.90
S169.6299.109.670.91
S1710.0311.579.750.91
S1810.1314.6811.160.92
* height of oscillation.
Table 23. SEM/EDS analysis results of general chemical composition for slag foam obtained by applying slags with different content FeO, stable basicity, and mixture of coke and biochar with a ratio of 1:1 as a carbon source, wt.%.
SampleOMgAlSiCaFe
S1141.583.3511.473.8832.397.31
S1231.851.428.862.7841.5913.49
S1337.244.3510.164.2726.1417.83
S1447.173.0313.643.3914.8317.93
S1528.491.439.582.4335.4322.63
S1626.161.1613.042.8130.0526.77
S1733.612.6710.942.6524.8125.33
S1827.111.697.861.7729.4432.12
Disclaimer/Publisher’s Note: The statements, opinions and data contained in all publications are solely those of the individual author(s) and contributor(s) and not of MDPI and/or the editor(s). MDPI and/or the editor(s) disclaim responsibility for any injury to people or property resulting from any ideas, methods, instructions or products referred to in the content.

