


Evaluation of Slag Foaming Behavior Using Renewable Carbon Sources in Electric Arc Furnace-Based Steel Production

 ,
,  ,
,  , ,
, ,
Abstract
1. Introduction
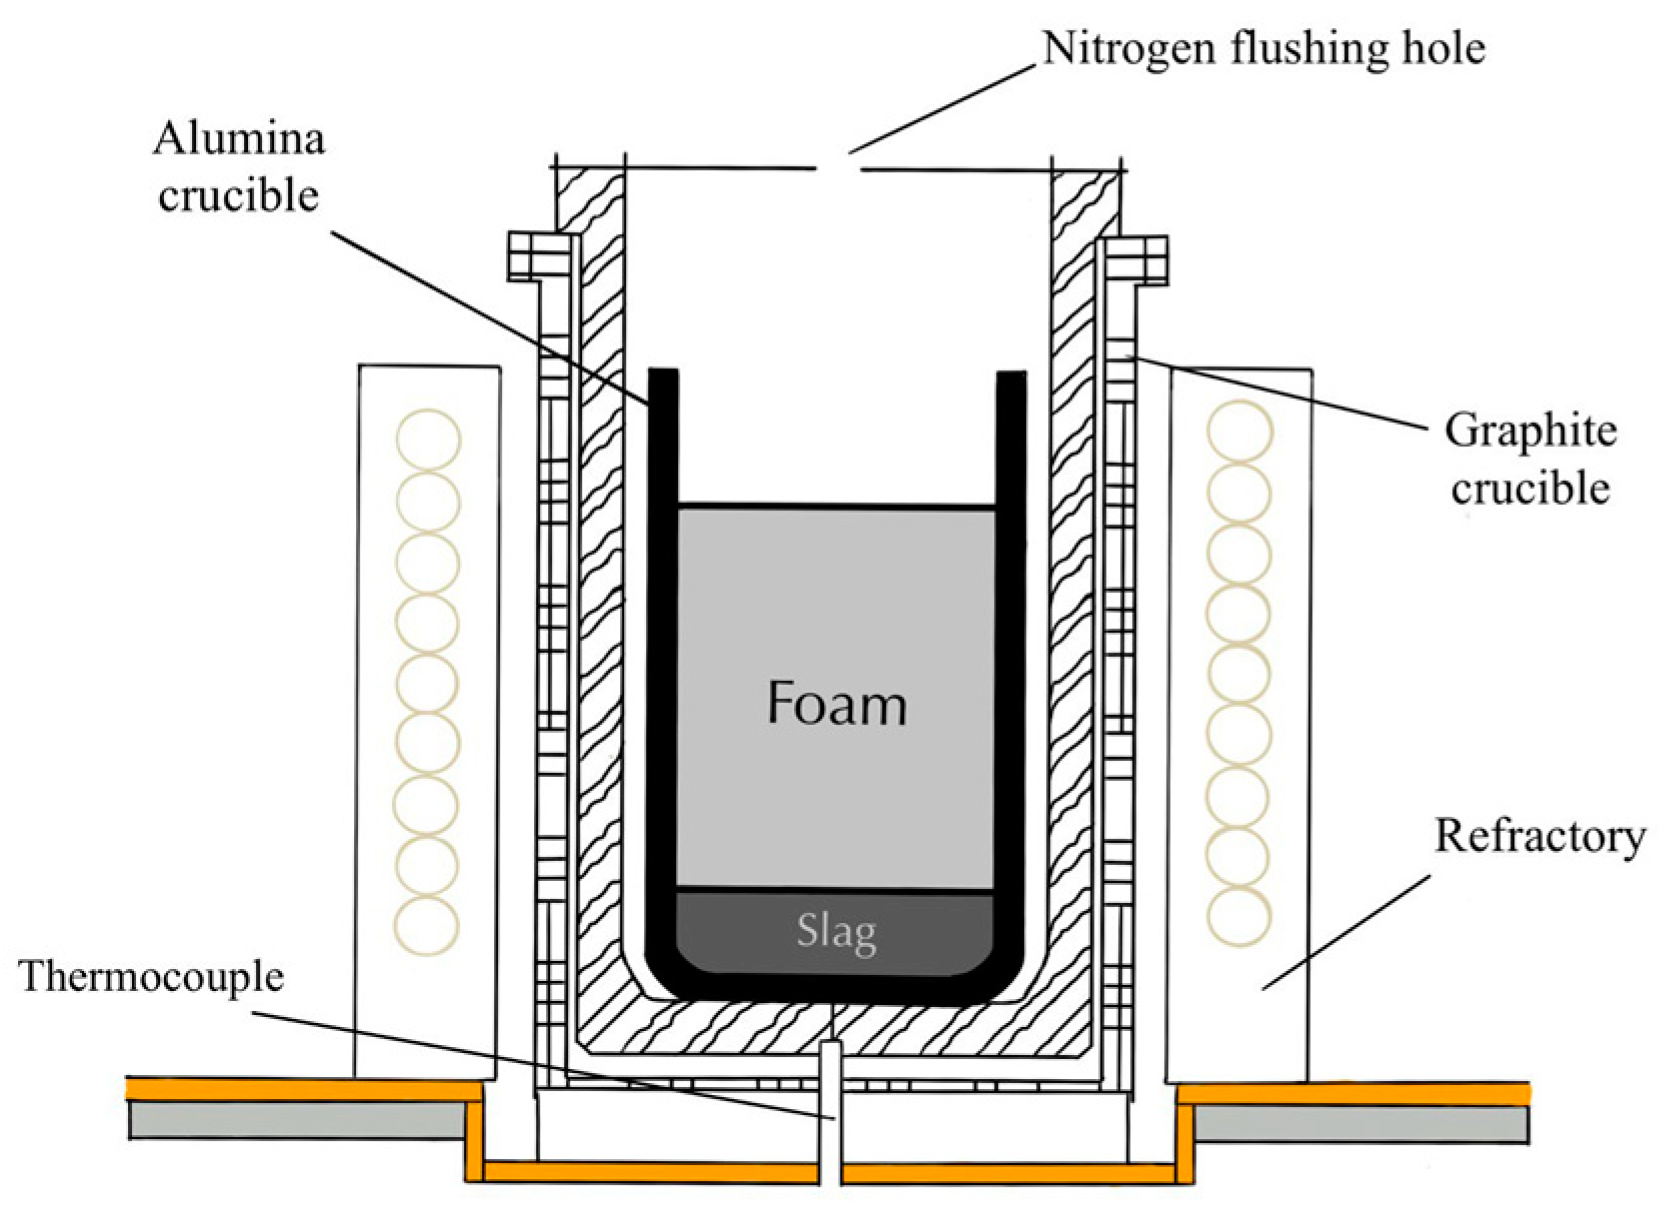
2. Materials and Methods
3. Results and Discussion
4. Conclusions
- −
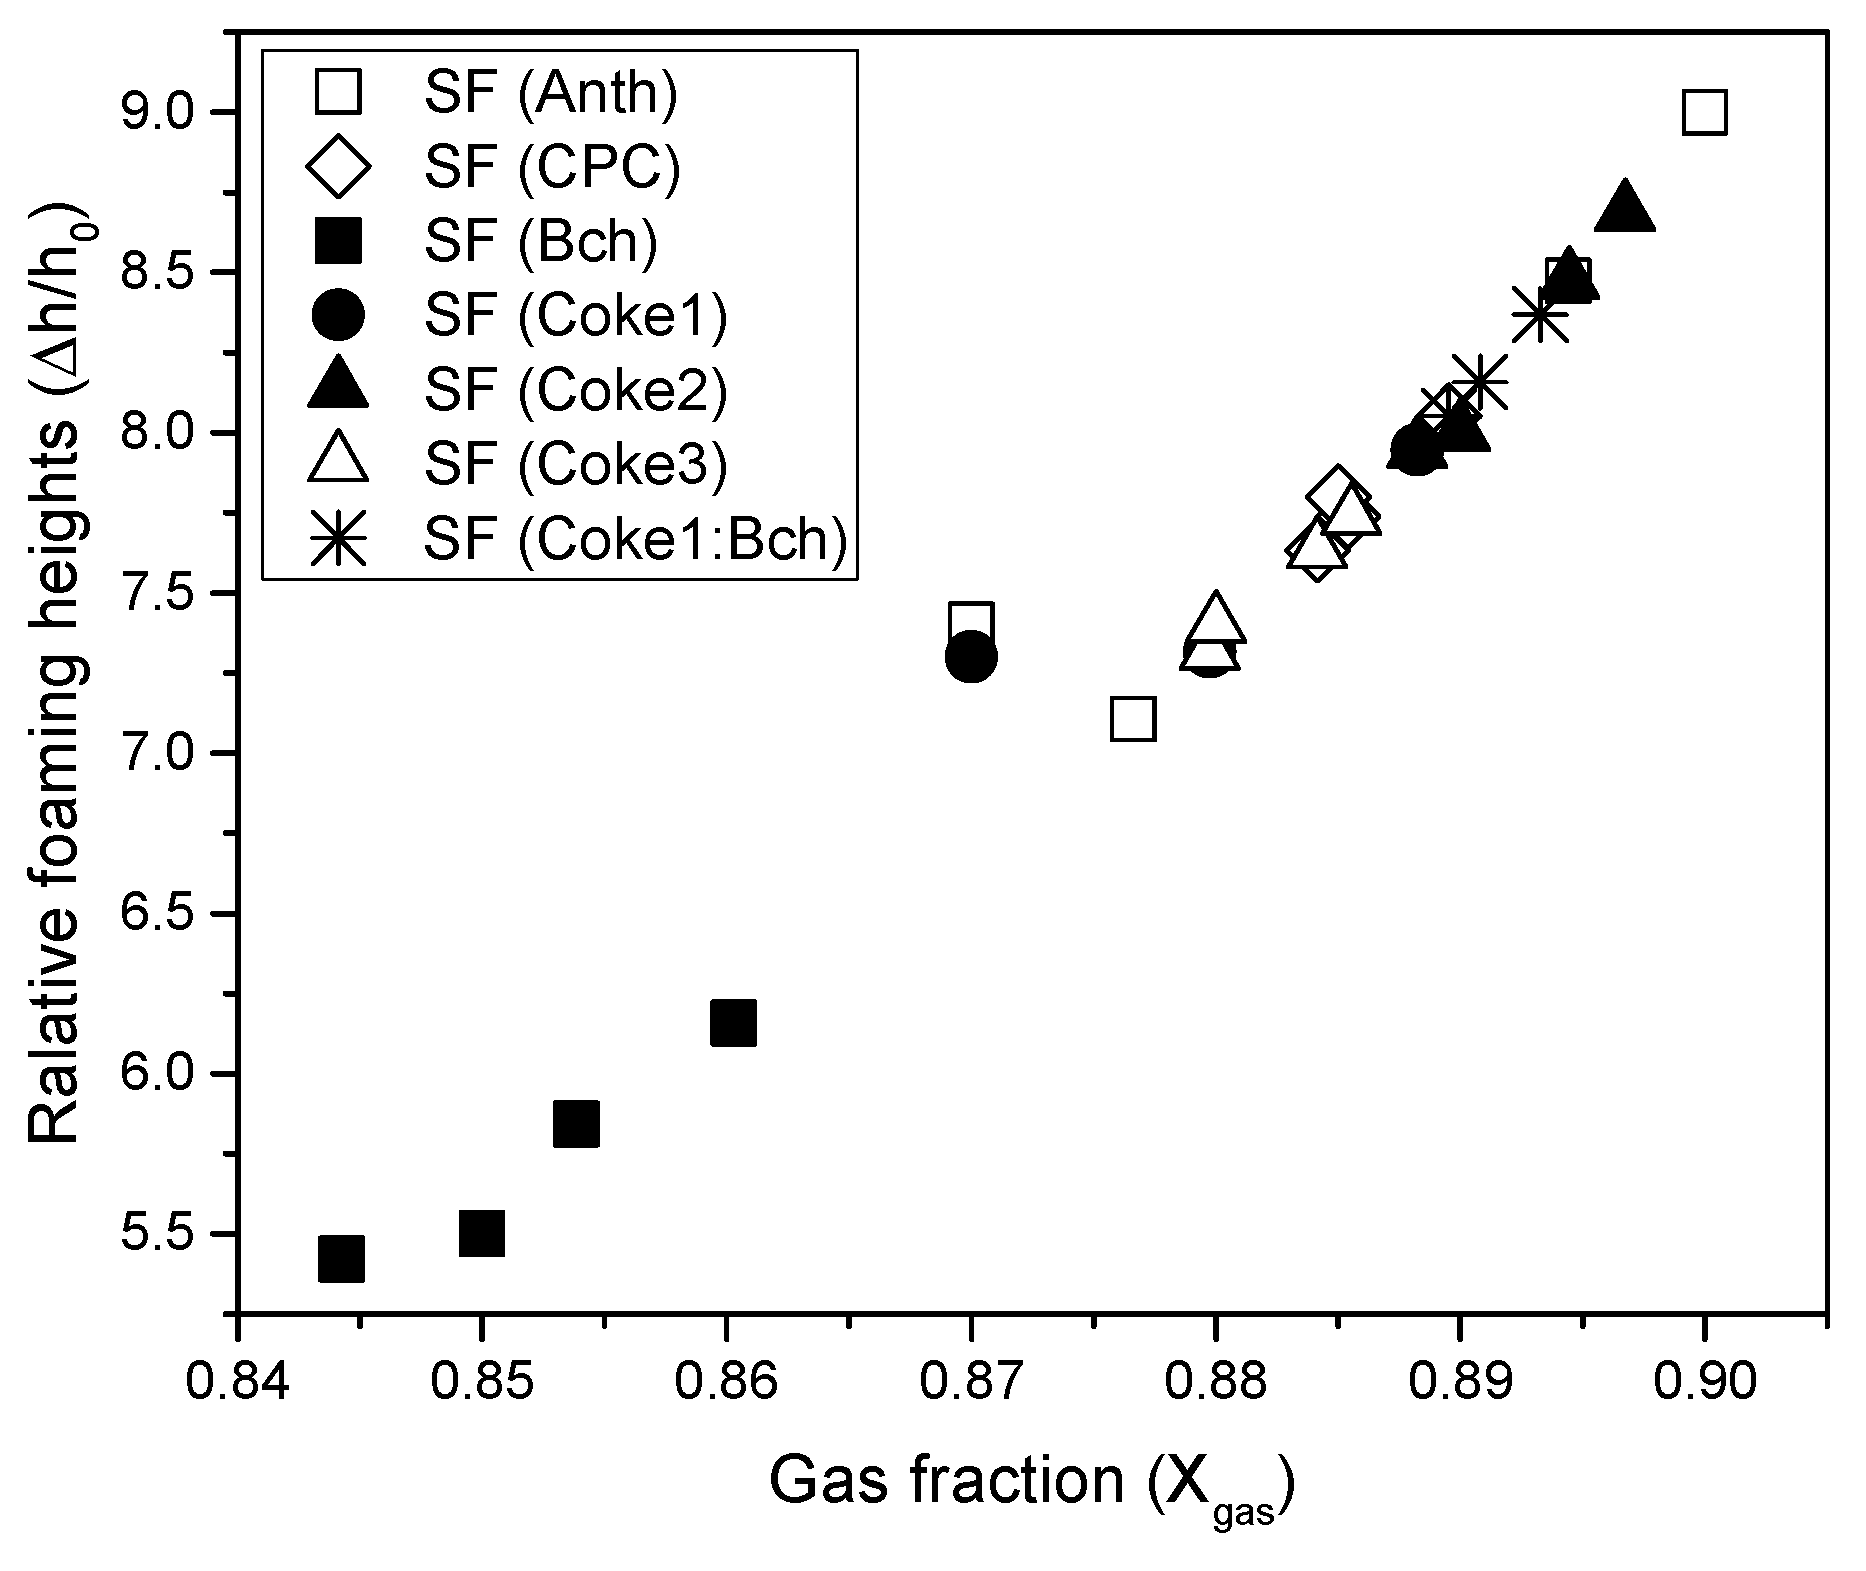
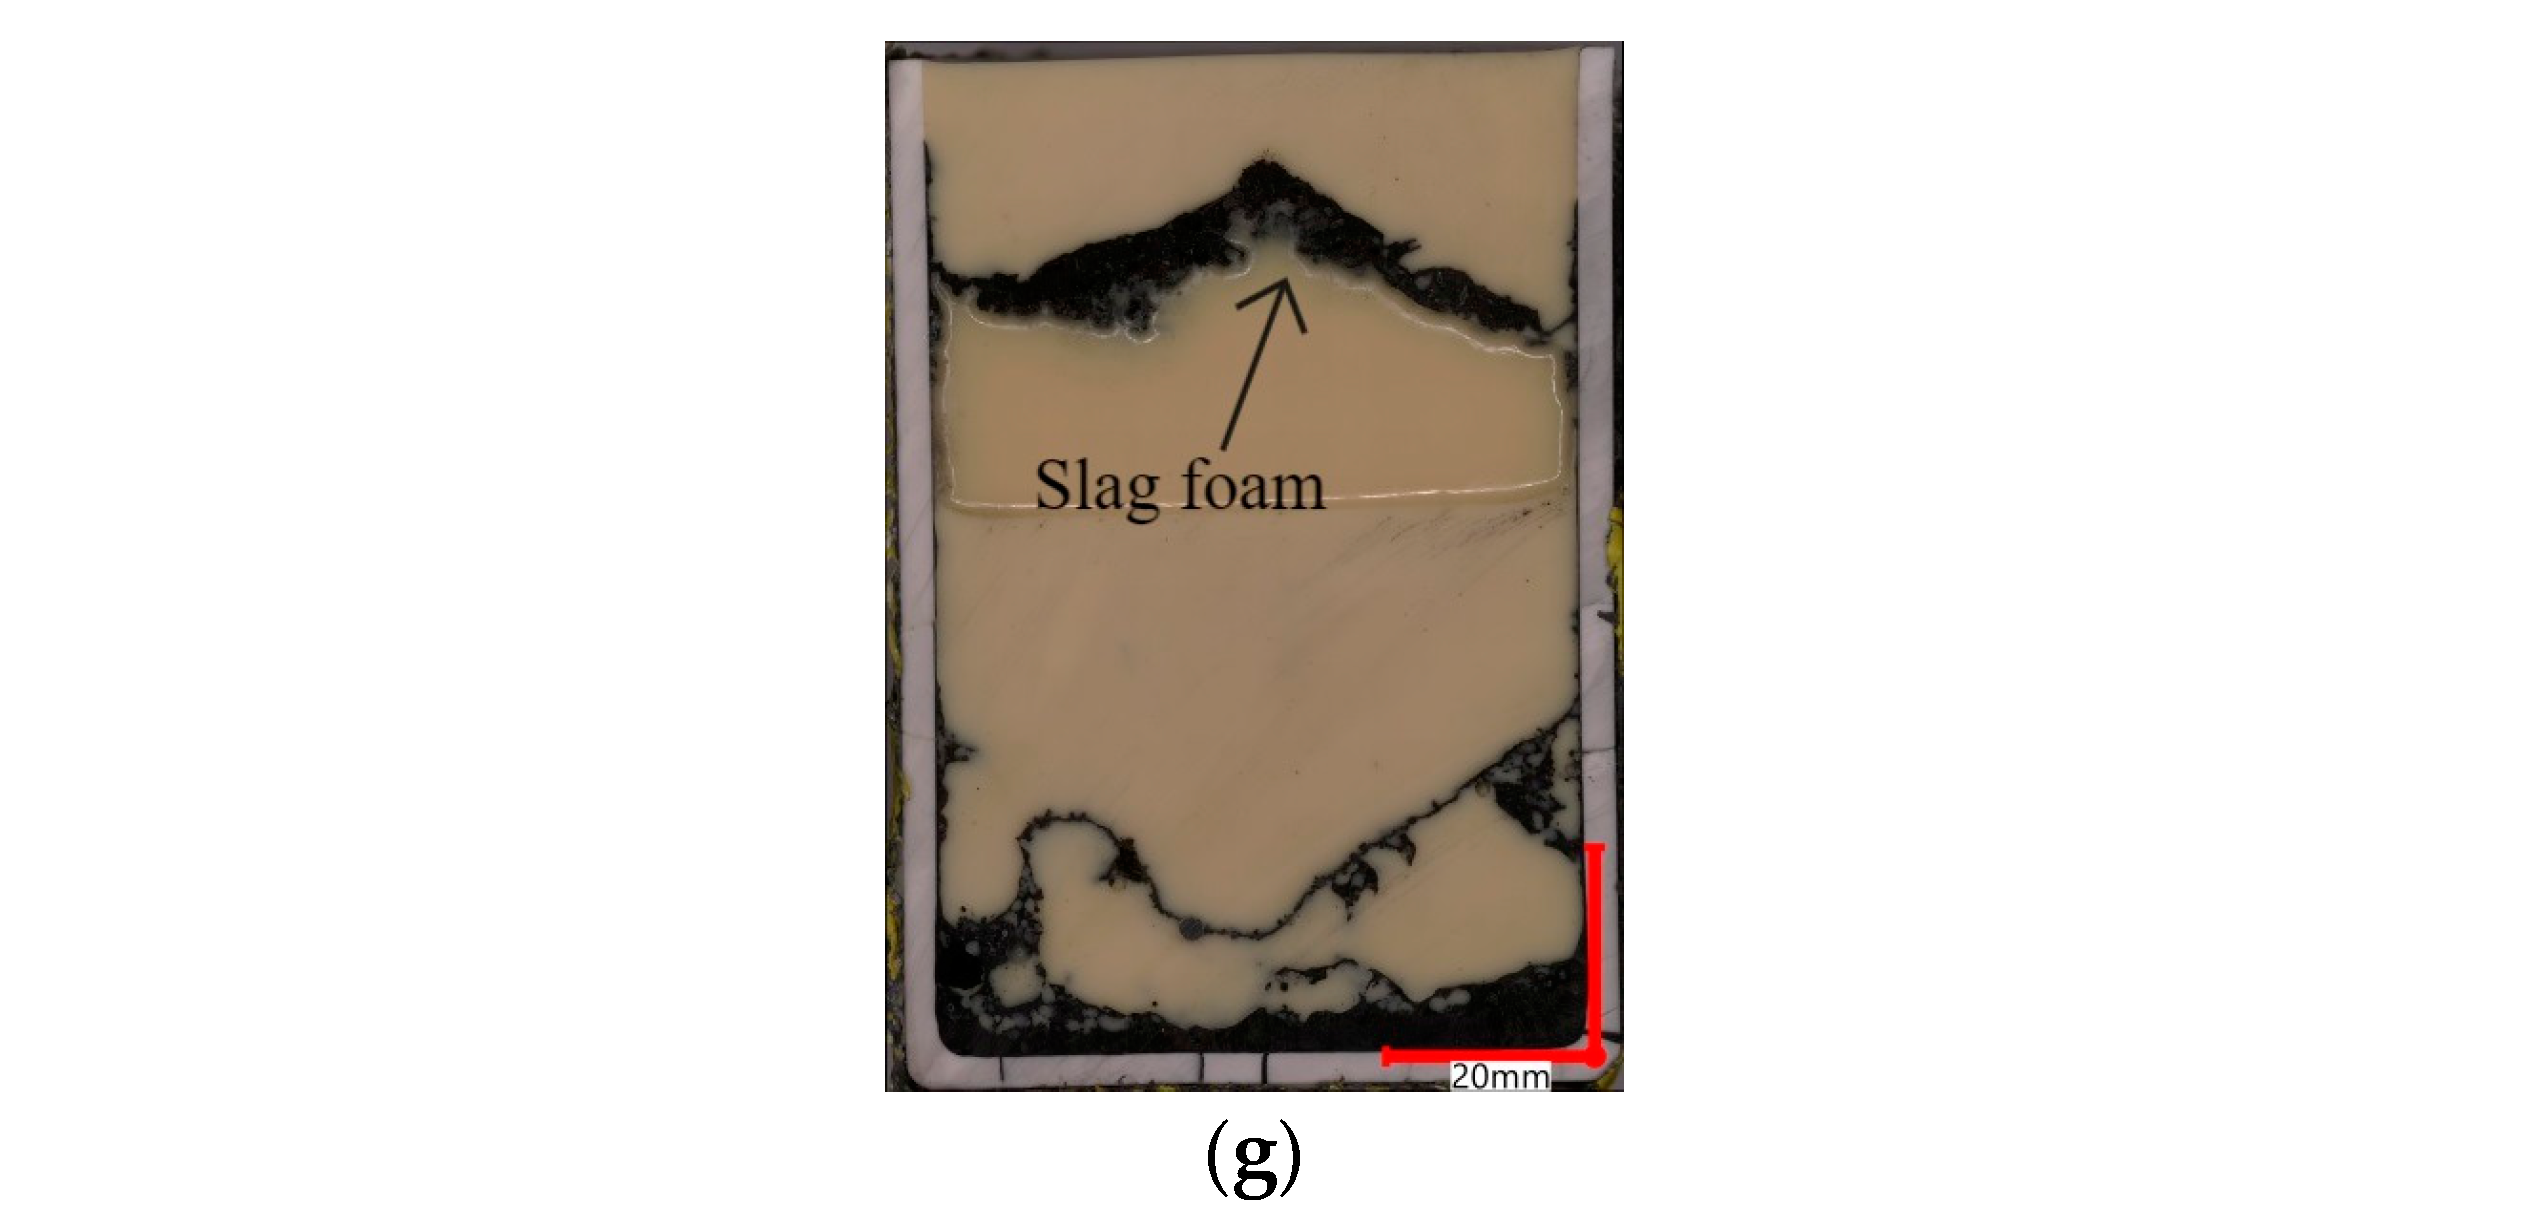
- Biochar showed the most inferior foaming characteristics due to the following. The low wettability of biochar by liquid slag prevents the reaction of carbon with FeO. The high reactivity of the biochar meant that FeO did not have time to react completely, and a smaller amount of CO was released, as evidenced by the value of the gas fraction (0.85). The low density meant that when adding biochar particles, they covered only the surface of slag foam and burned out on the slag foam surface very fast.
- −
- Using the mixture of 50 wt.% coke and 50 wt.% biochar, the slag foaming process was improved and showed slag foaming characteristics similar to results obtained using conventional carbon sources. Based on the results obtained, it can be concluded that biochar as a single carbon source cannot be recommended for use in slag foaming; however, when mixed with a conventional source, namely, coke, it showed promising results in EAF practice. Utilizing a biochar and coke1 mixture led to enhanced foaming compared to using biochar as the individual carbon source. Additionally, the observed foaming results obtained from the biochar and coke1 mixture were at a similar level as those achieved using other coke samples.
- −
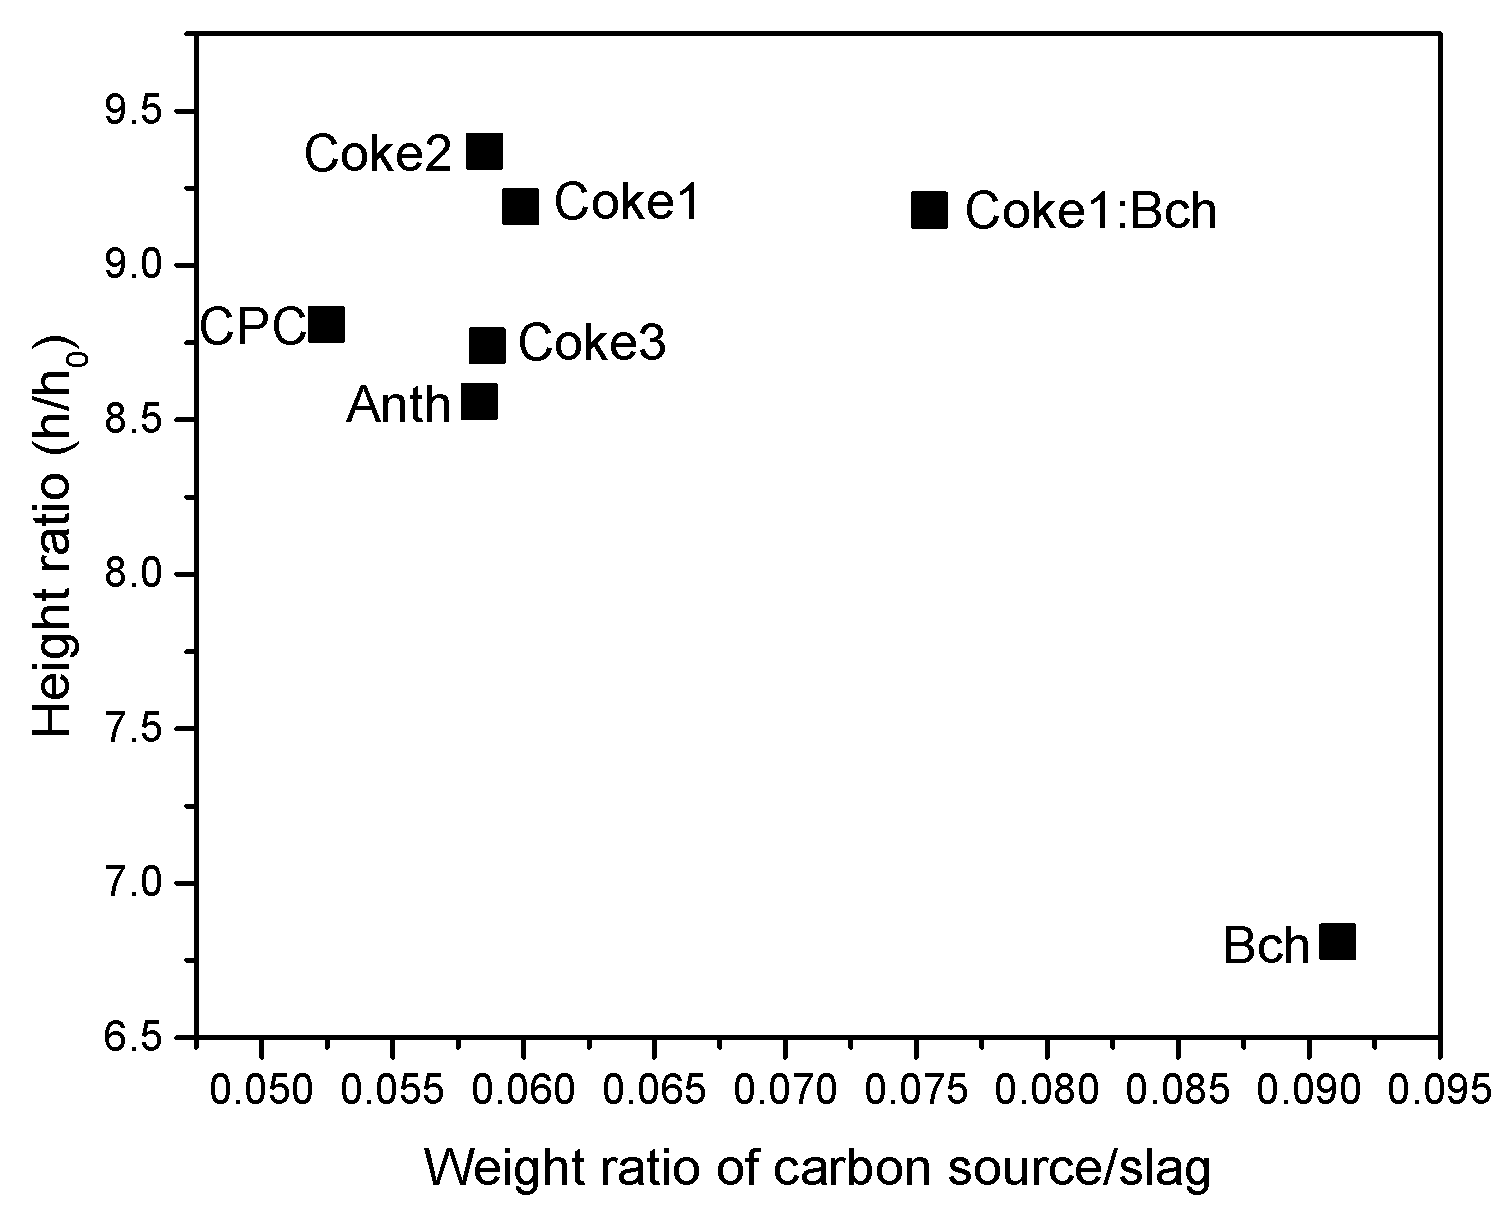
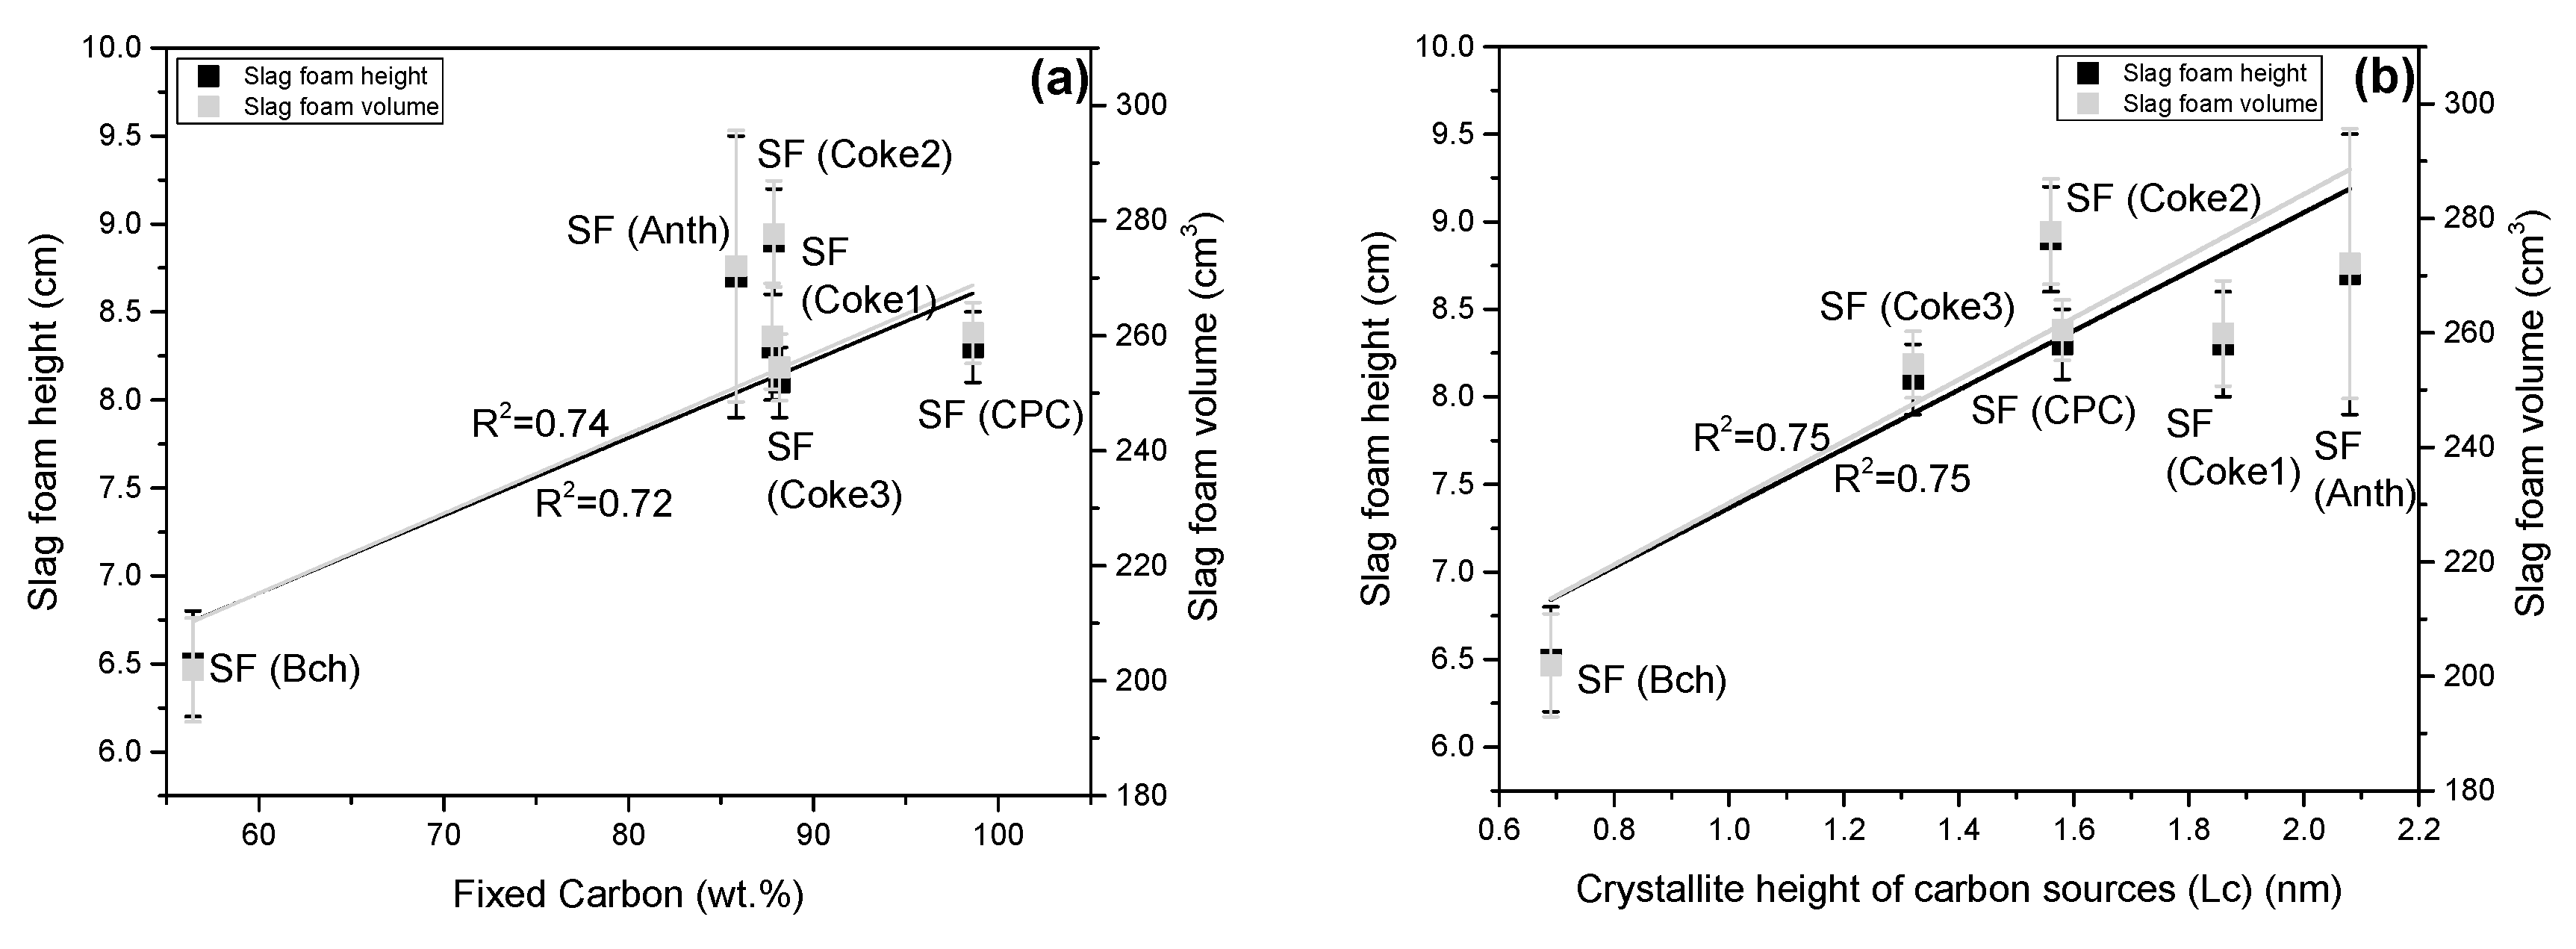
- A relationship was noticed between the XRD structural parameter crystallite height (Lc) of carbon sources and slag foaming characteristics (height and volume of slag foam). An increase in the structural ordering of the carbon material contributed to obtaining better slag foaming.
- −
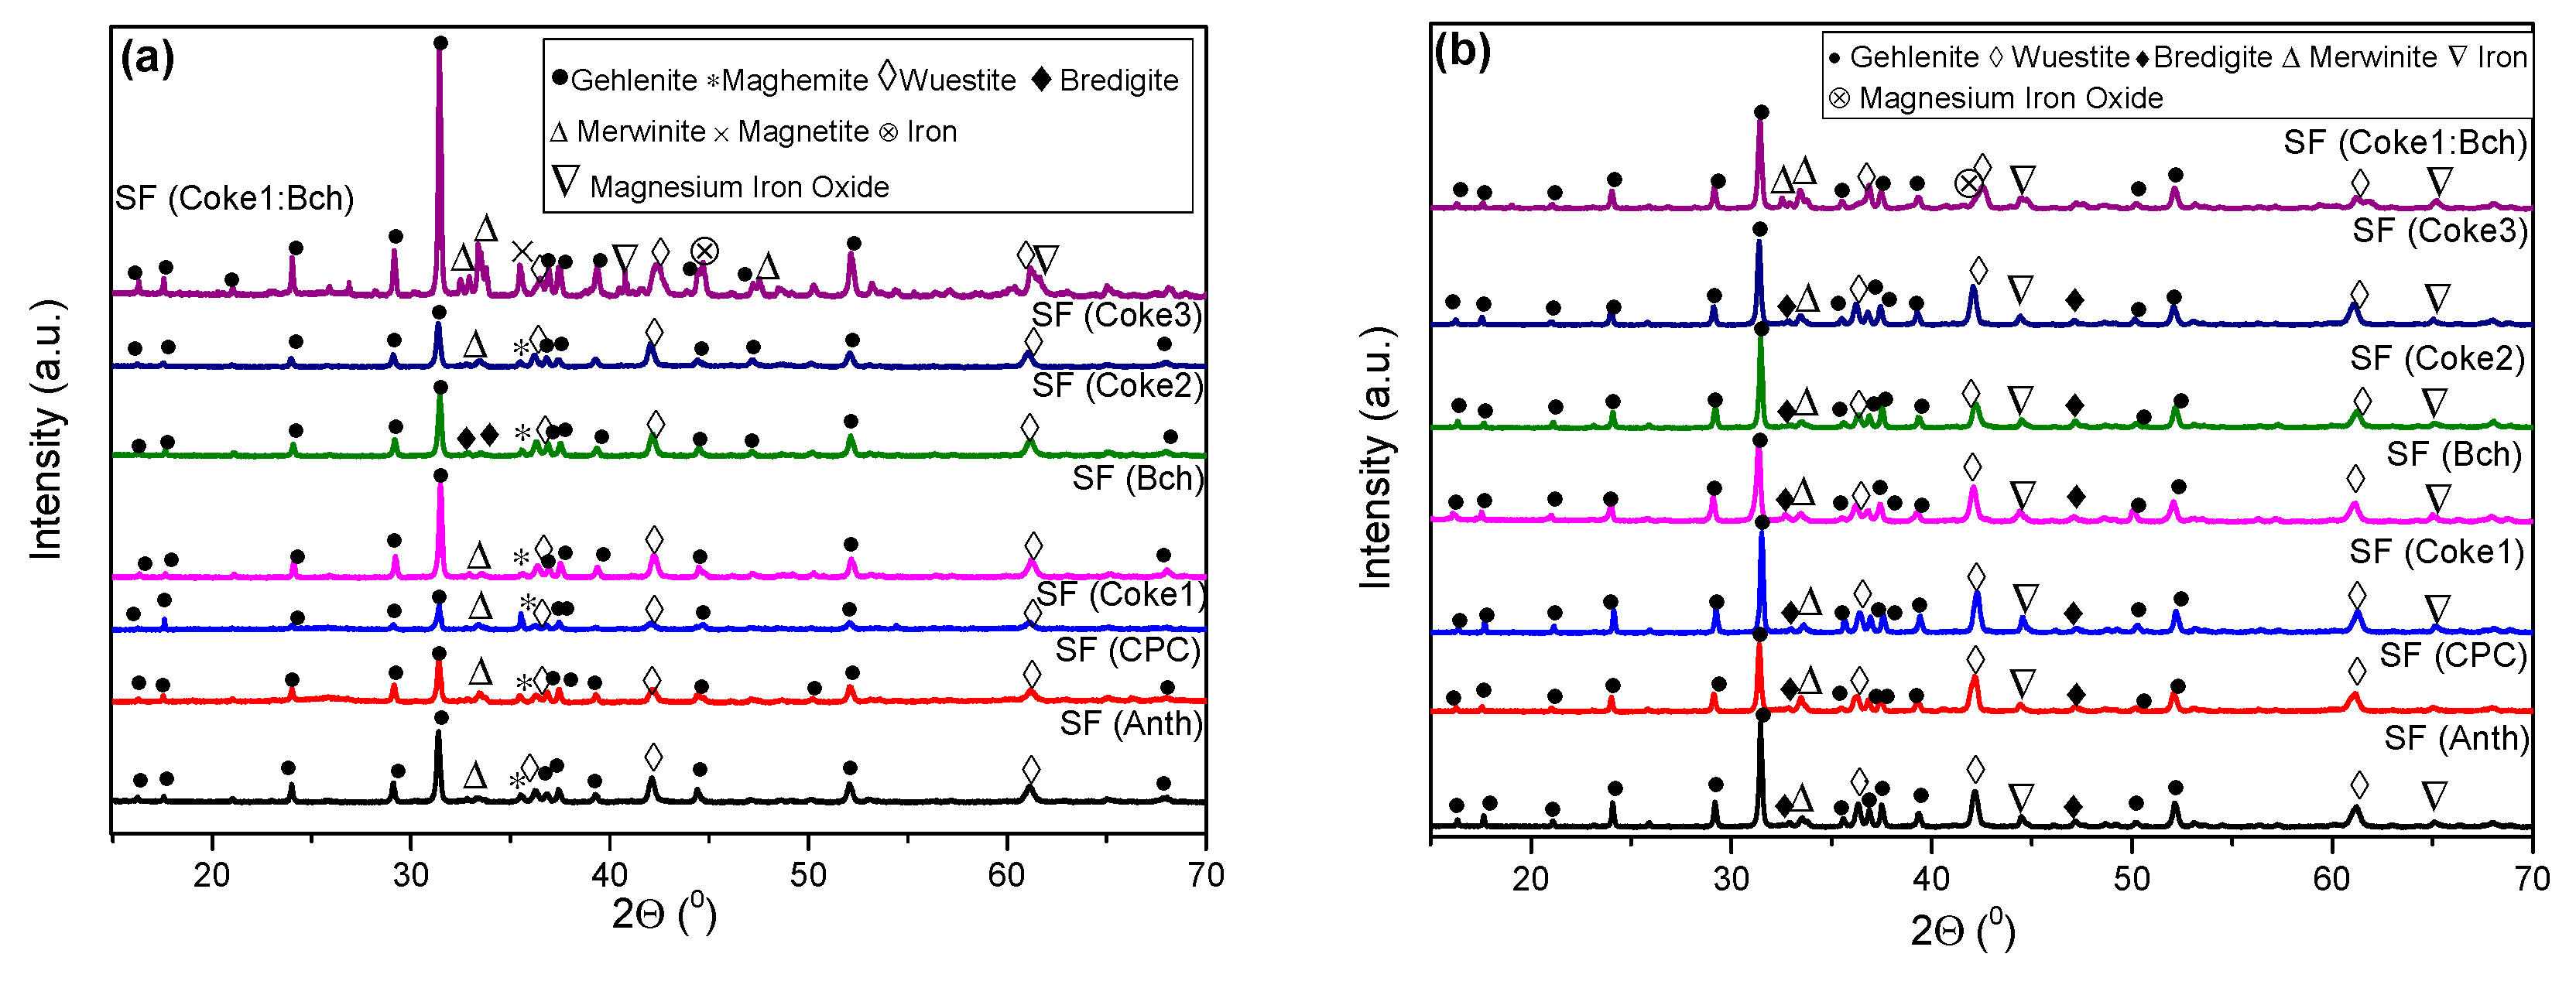
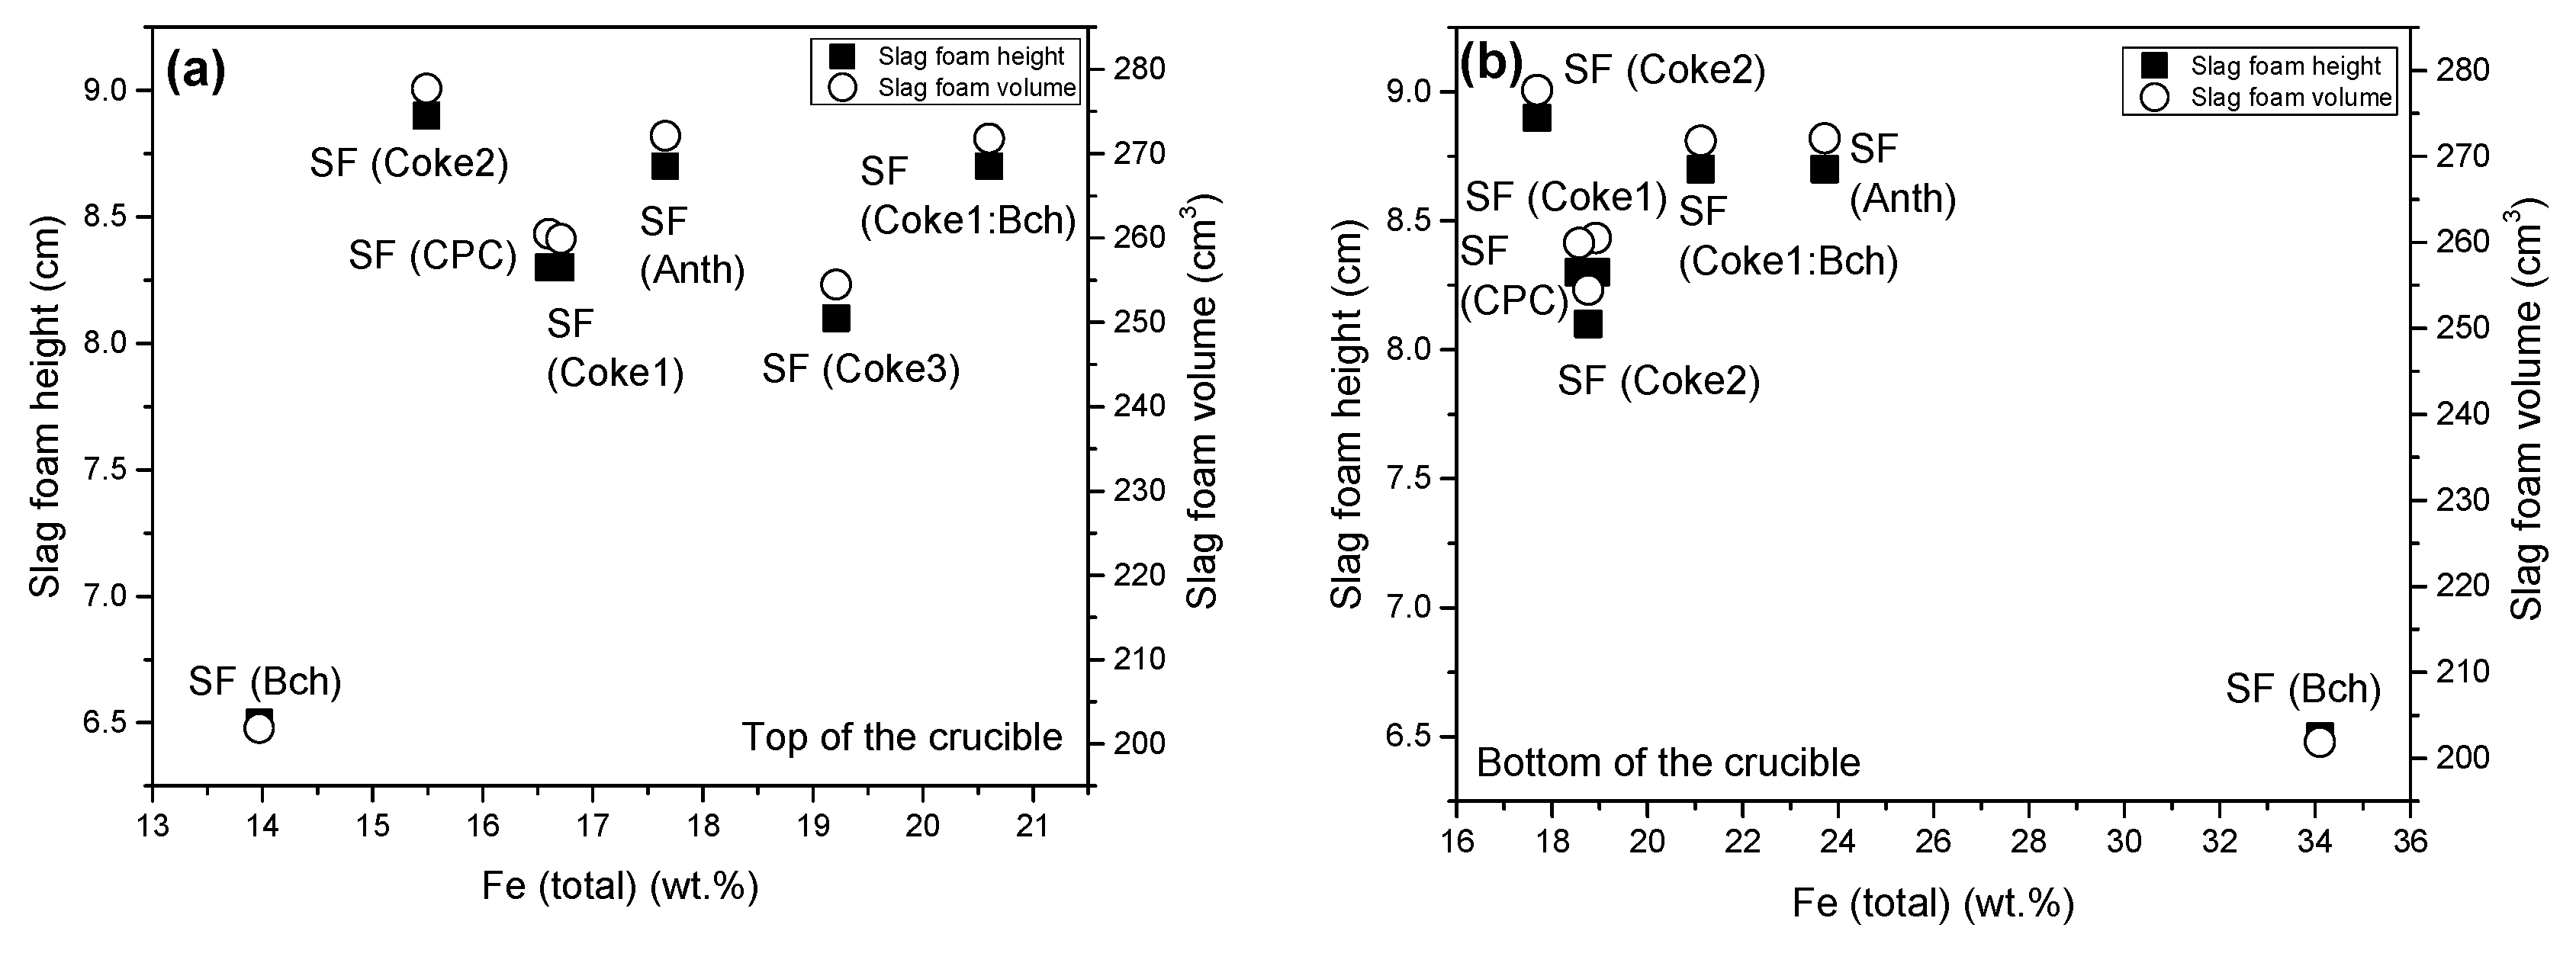
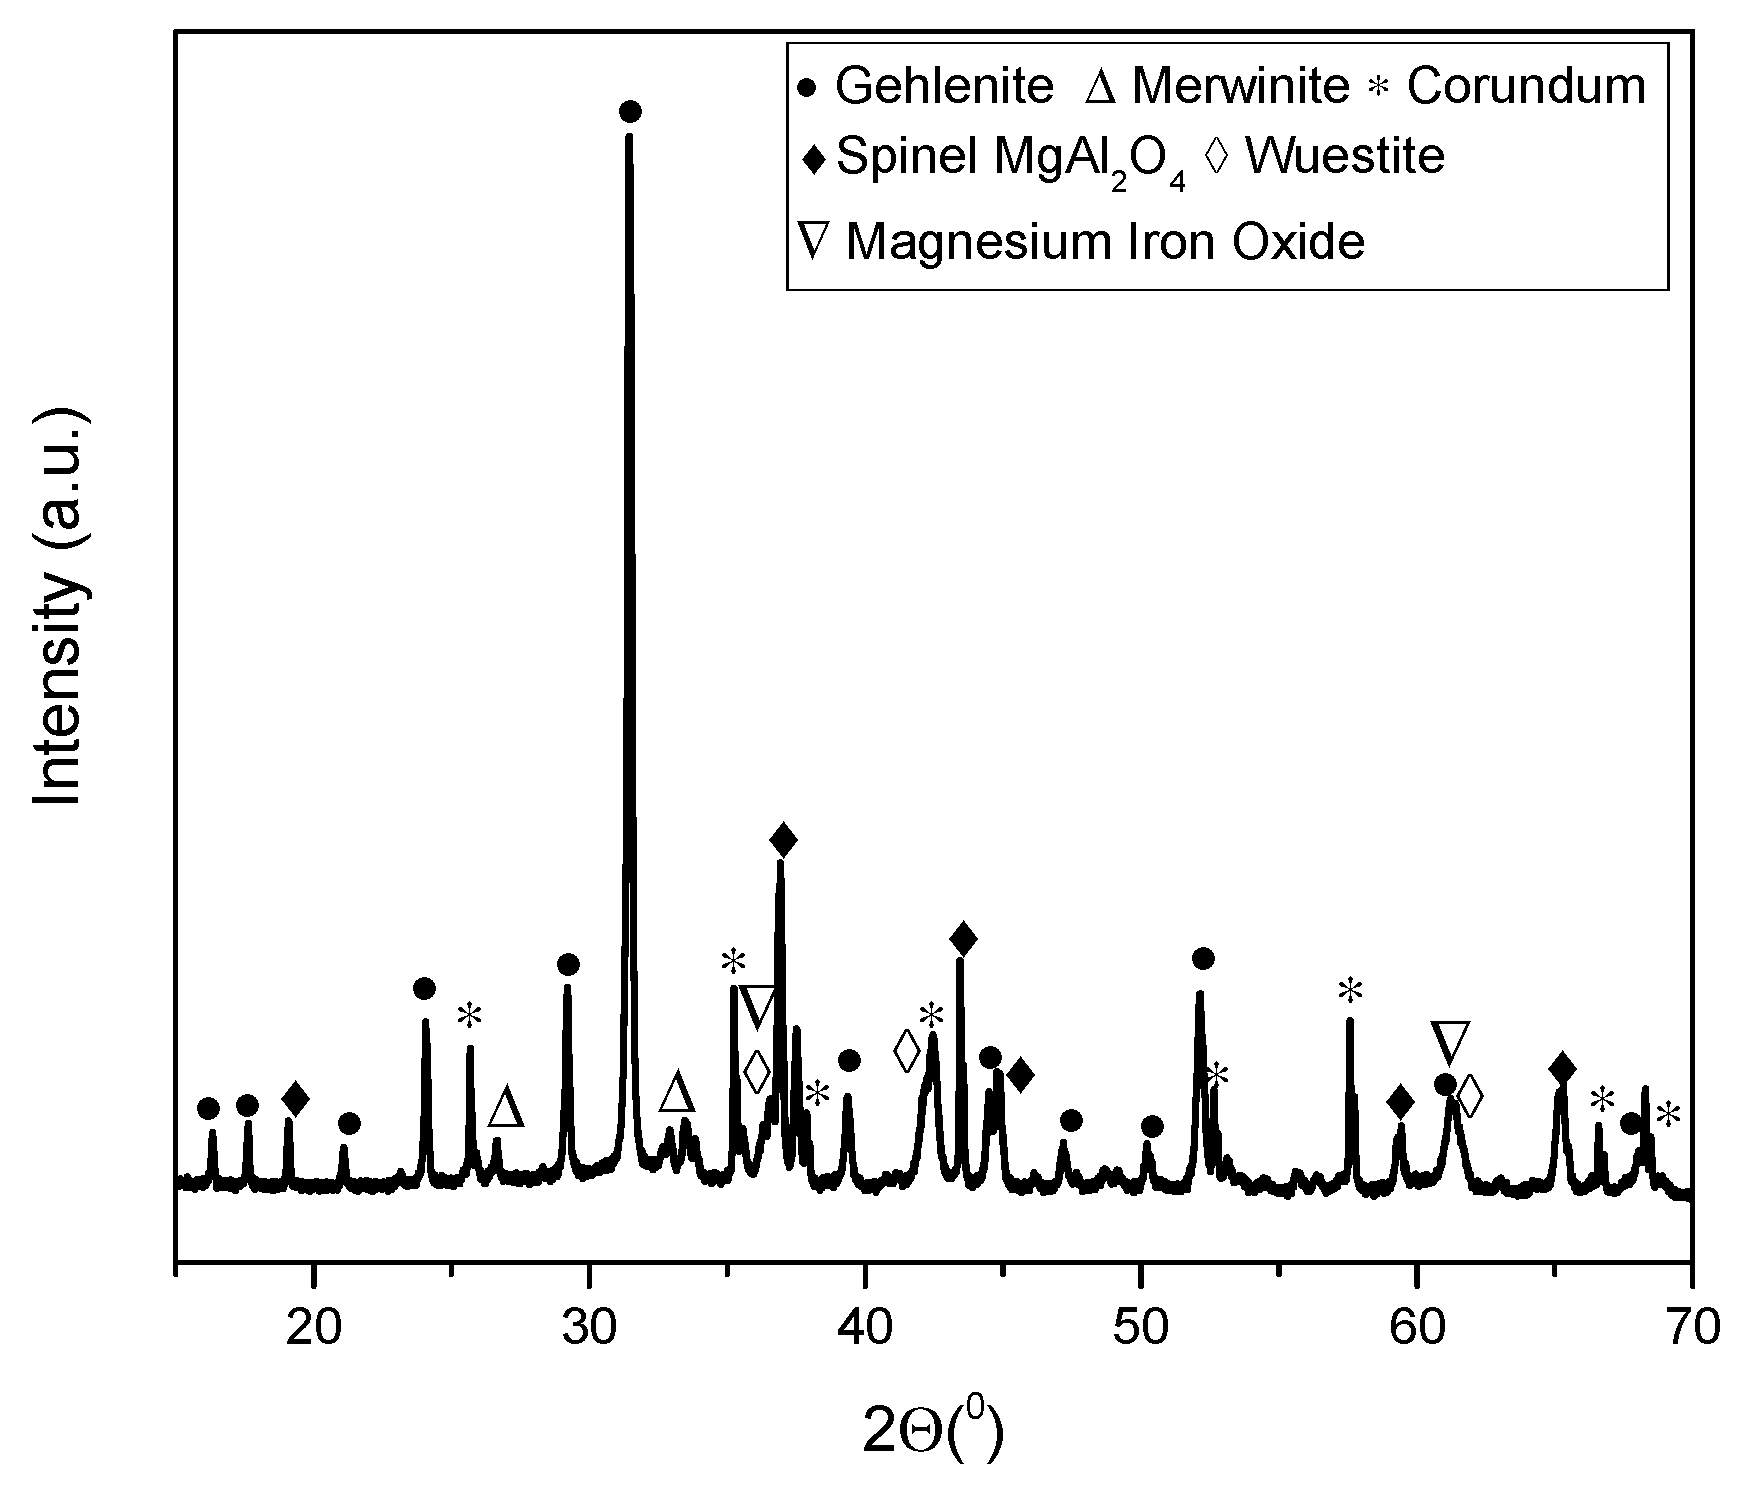
- The chemical composition of all slag foam samples showed no significant influence from the type of carbon source used. The decrease in the amount of Fe2+ after the foaming of the slag indicates a reduction reaction. The difference is between the top and bottom of the slag foam, as revealed by XRD. A maghemite (Fe2O3) and magnetite (Mg0.4Fe2.96O4) crystalline phase in the top part of the slag foams is explained by the higher-valence iron oxide, probably located in the slag foam region in contact with air. At the same time, metallic iron was found at the bottom of all samples. A difference in the slag foam (mixture of coke and biochar) was found in the presence of such crystalline phases as magnesium iron oxide (Fe2MgO4) and magnetite (Mg0.4Fe2.96O4).
- −
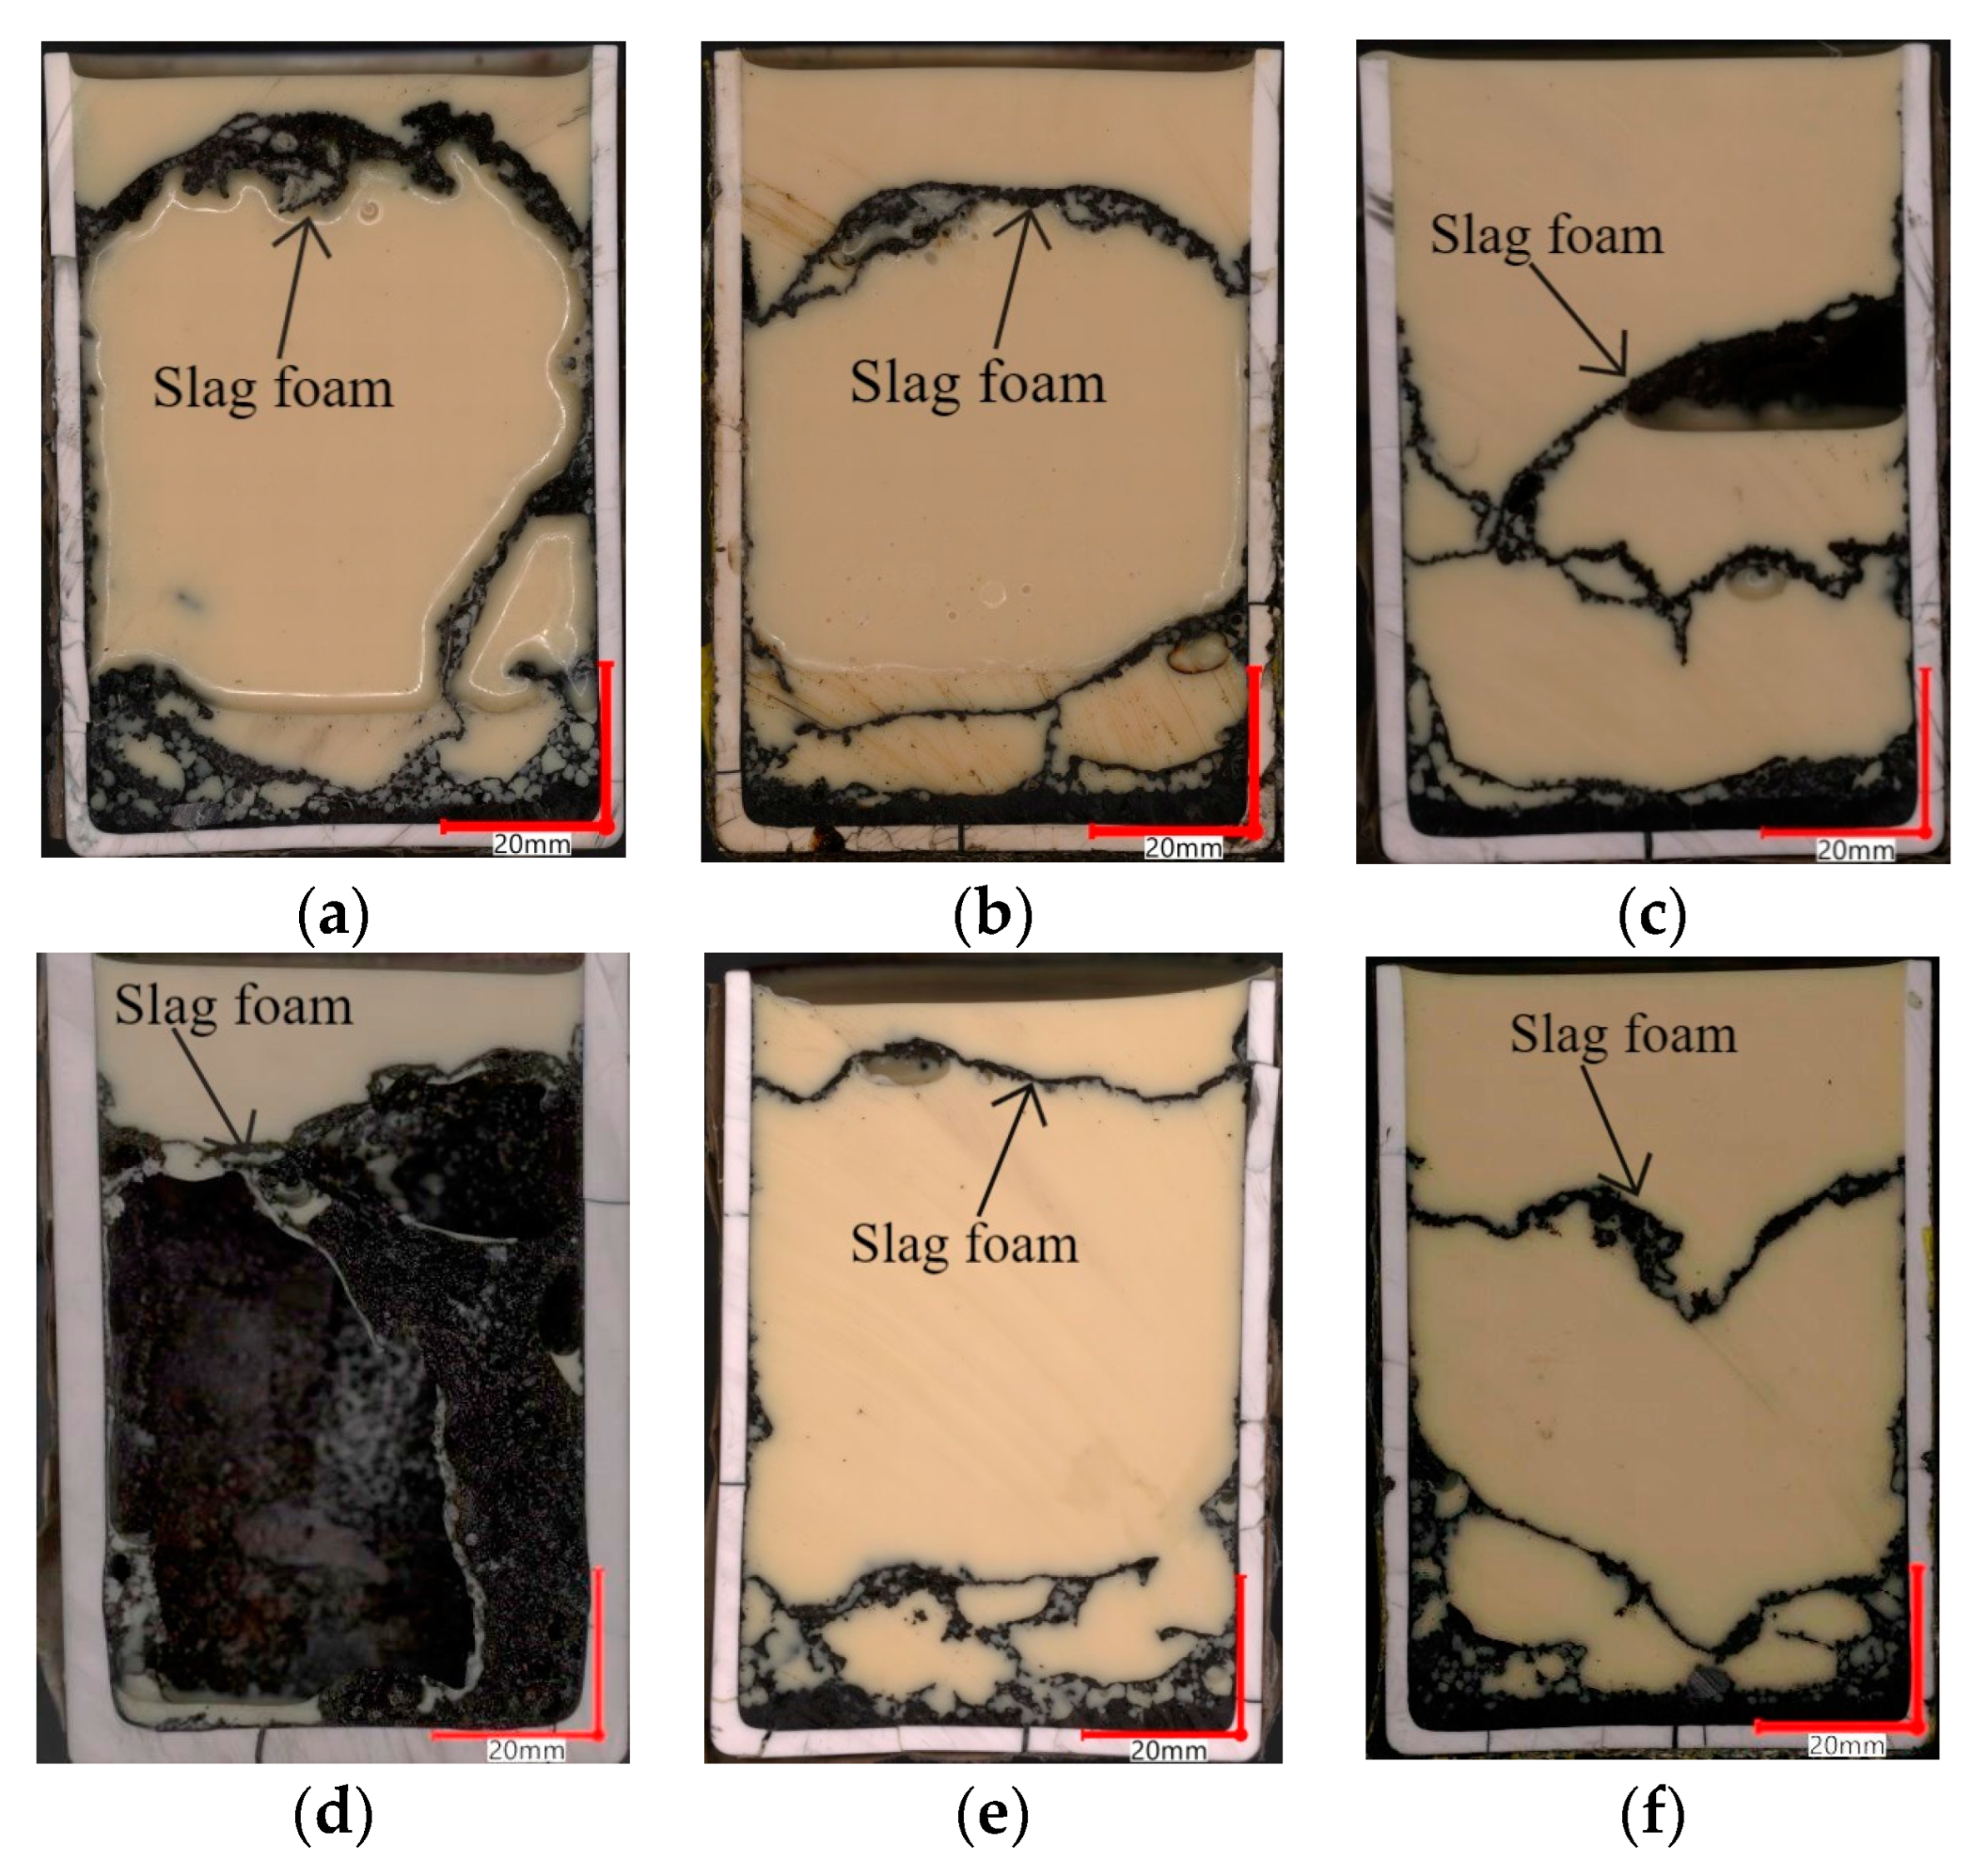
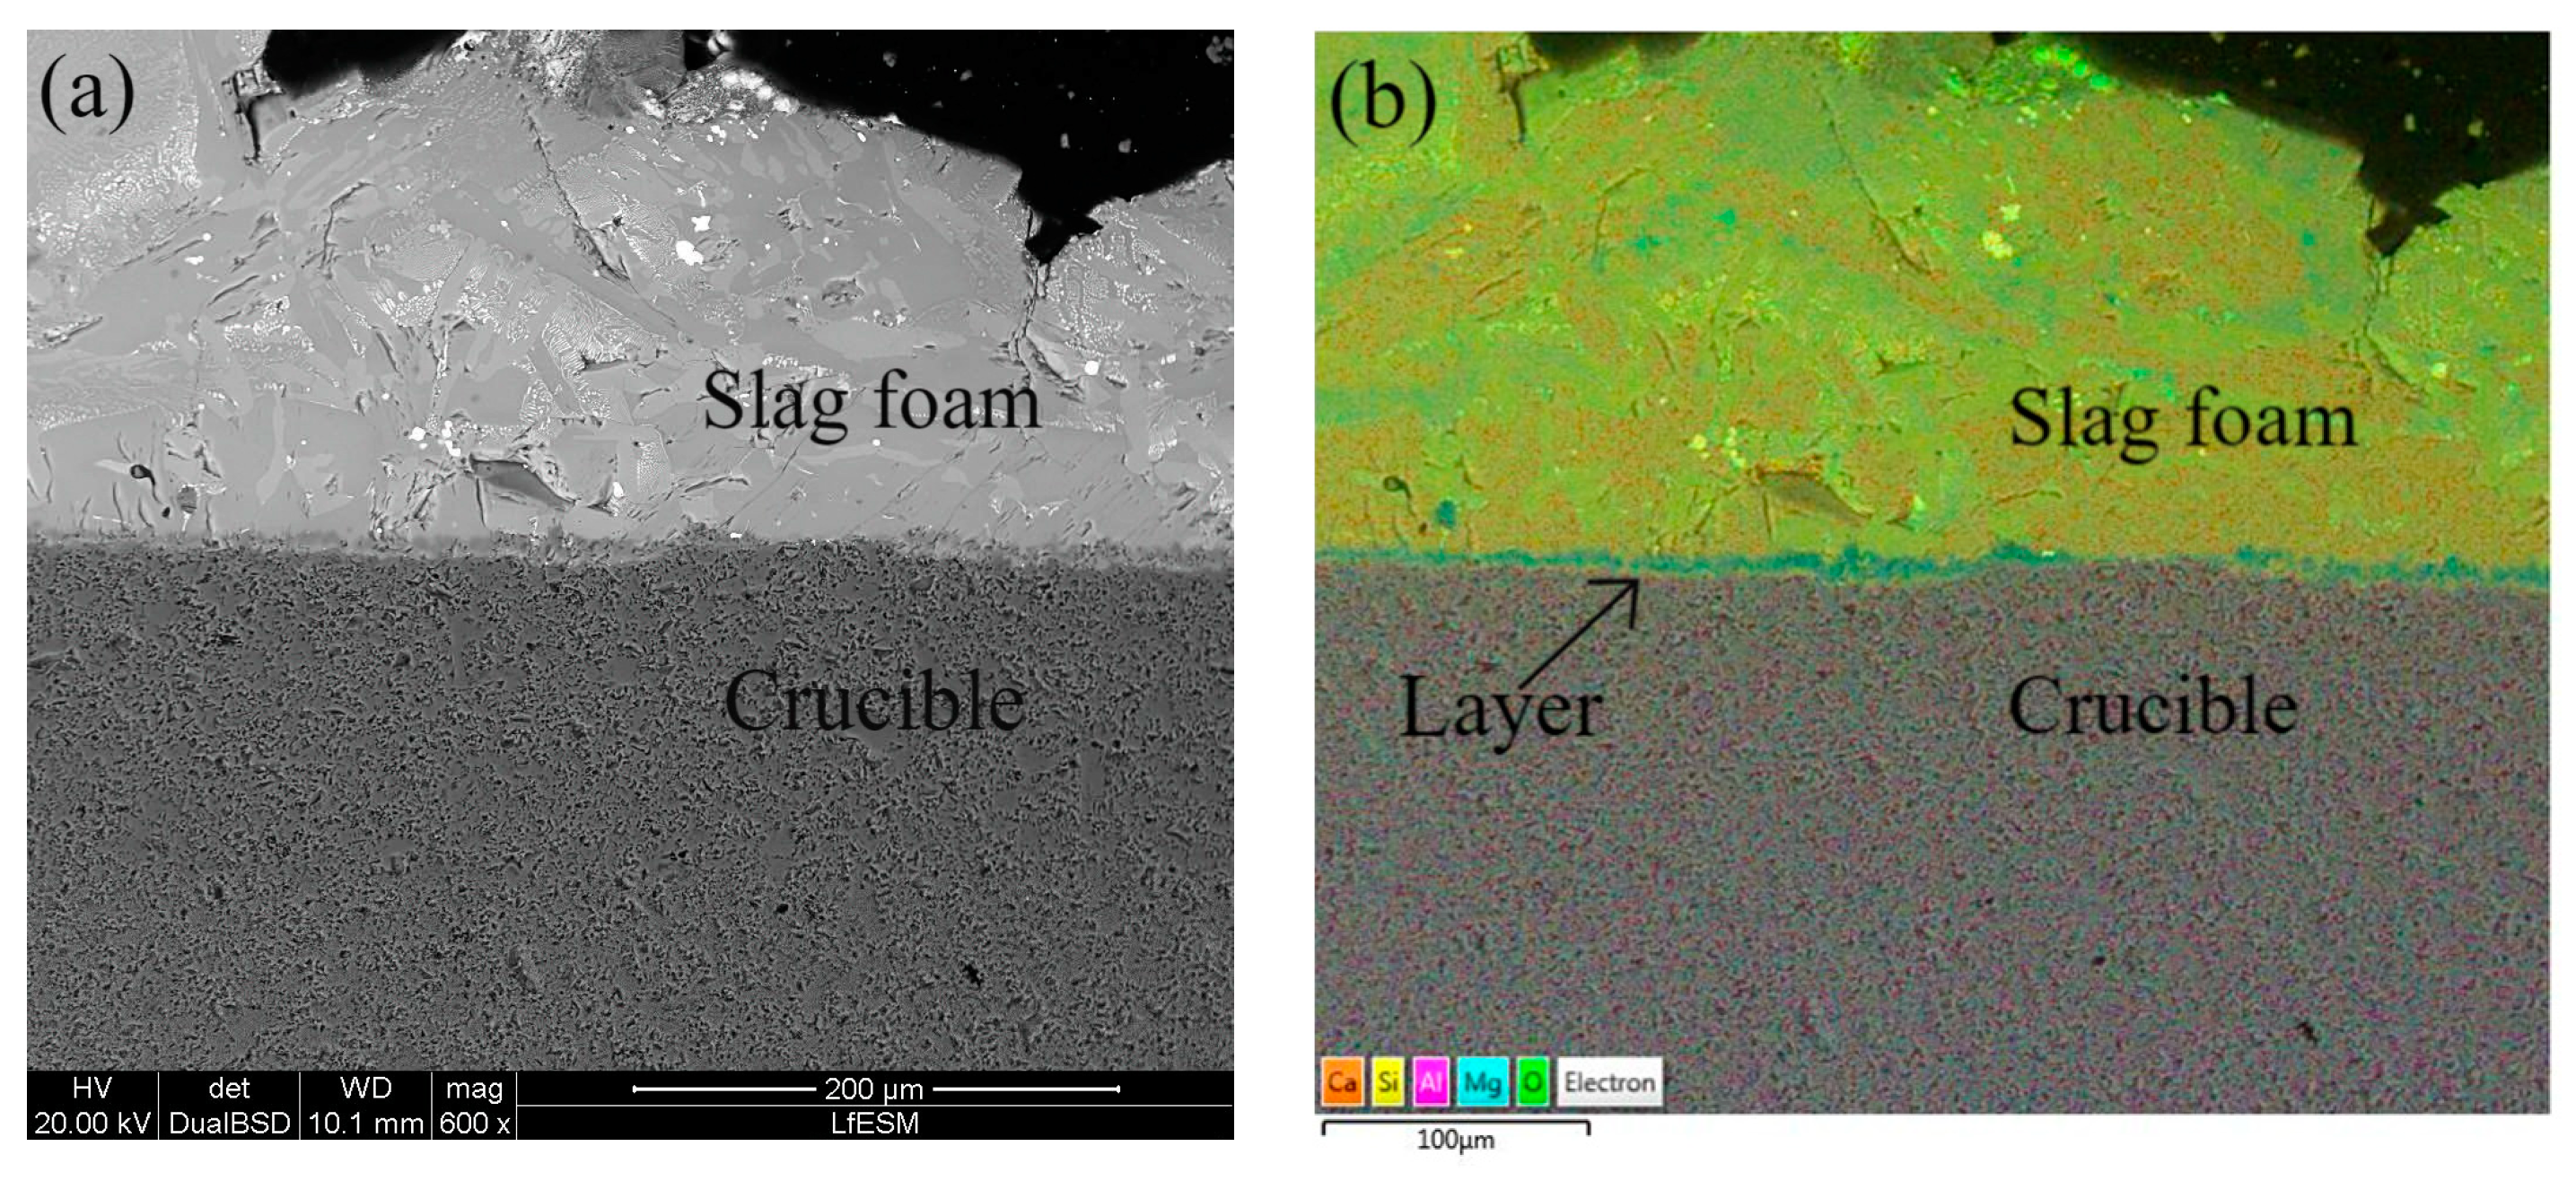
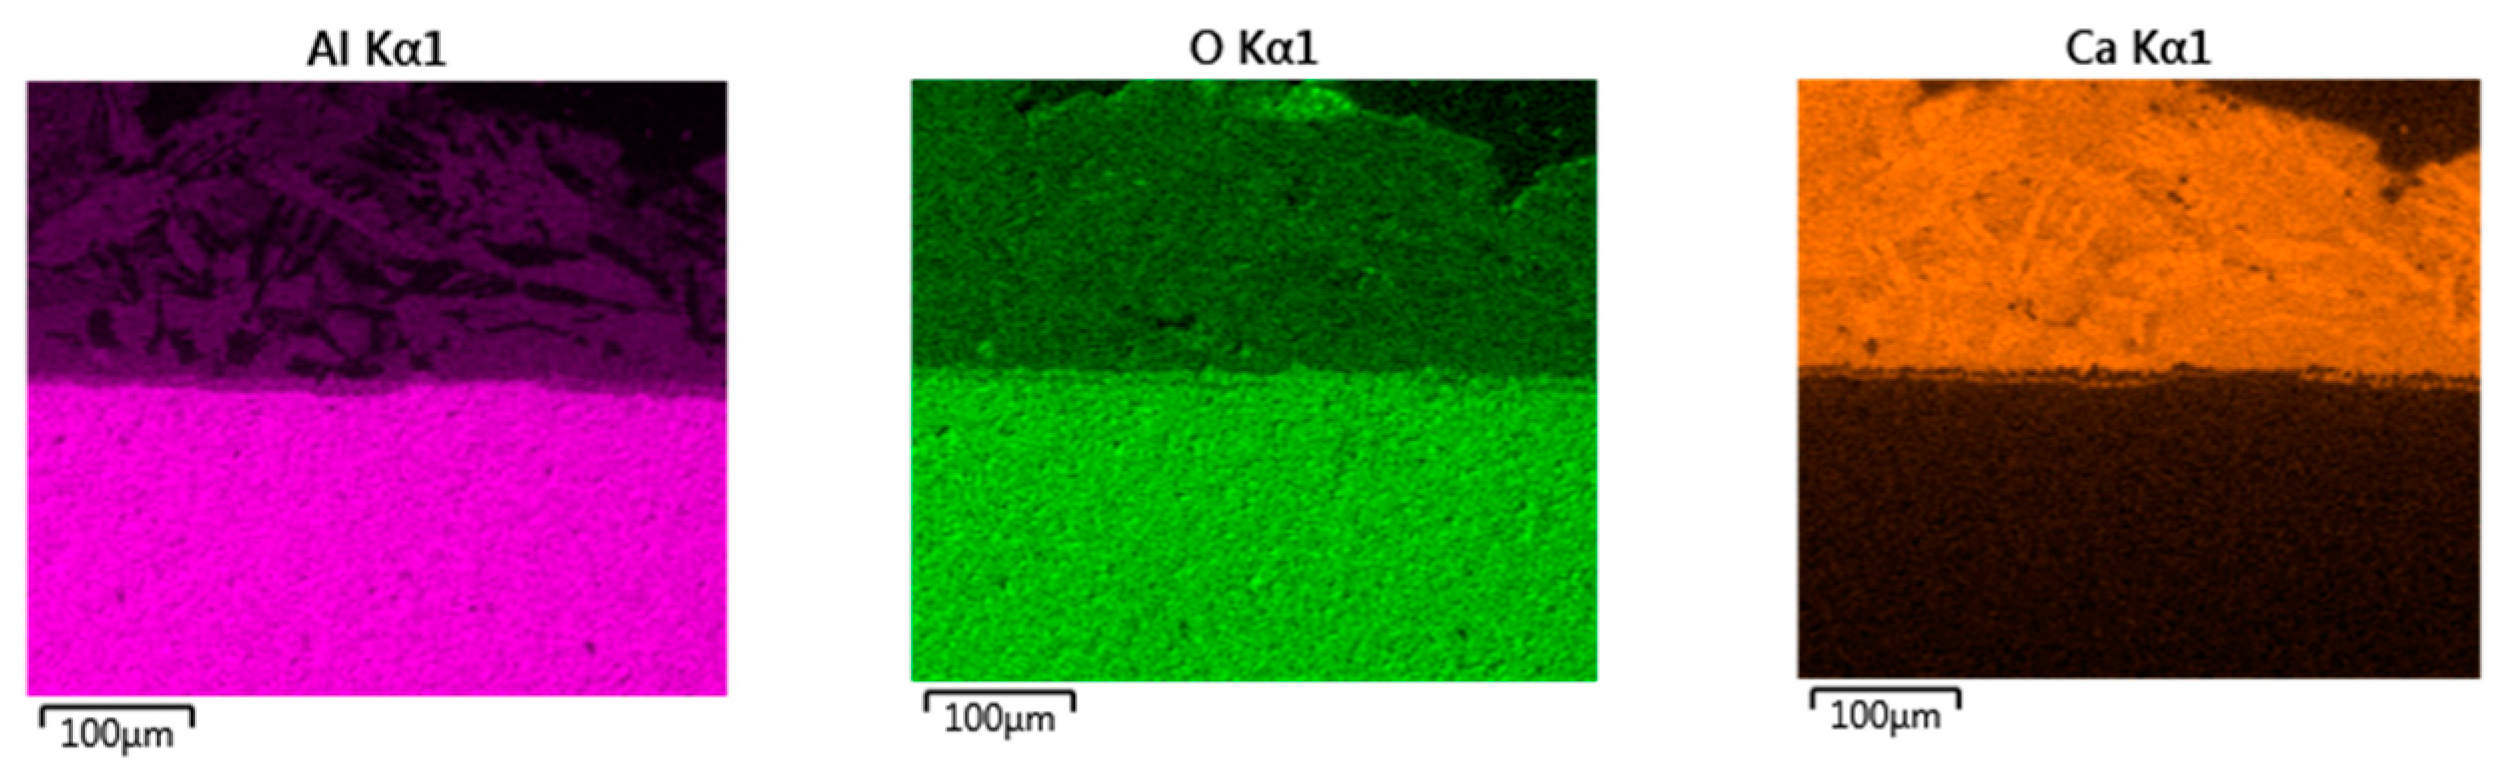
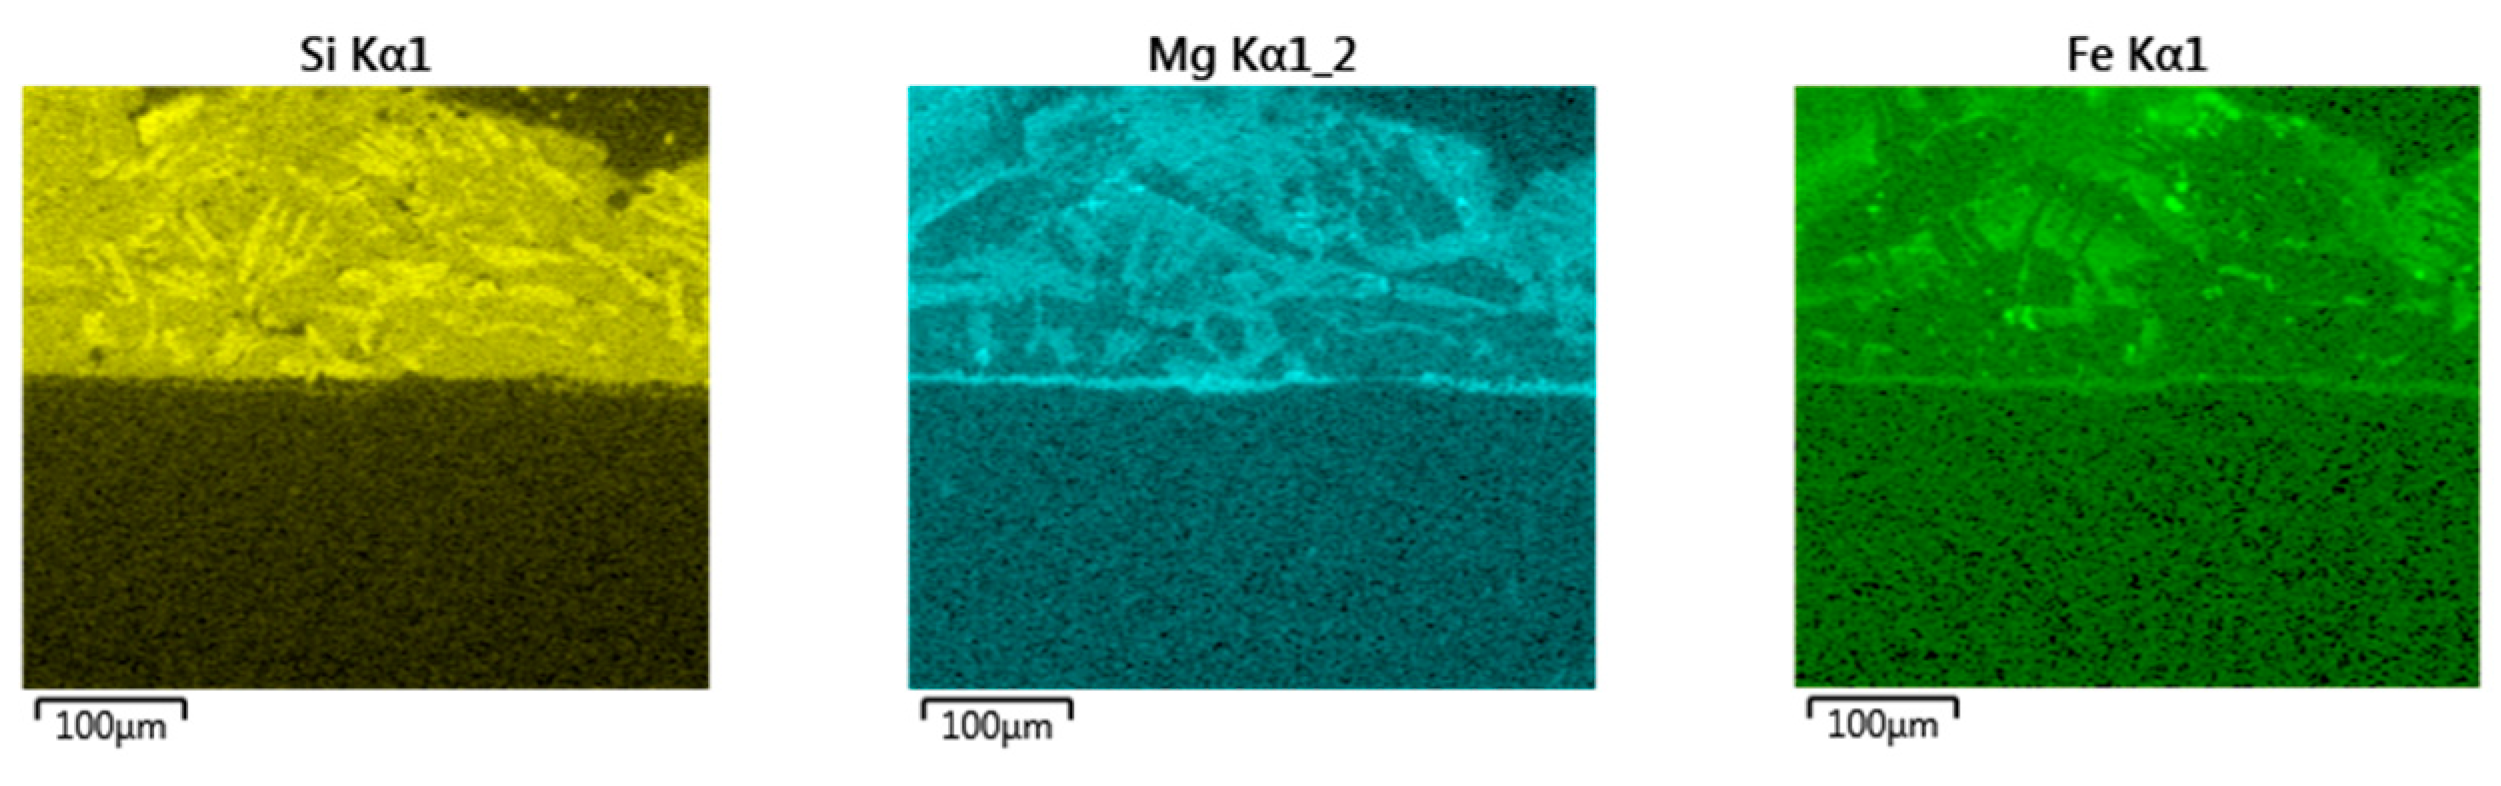
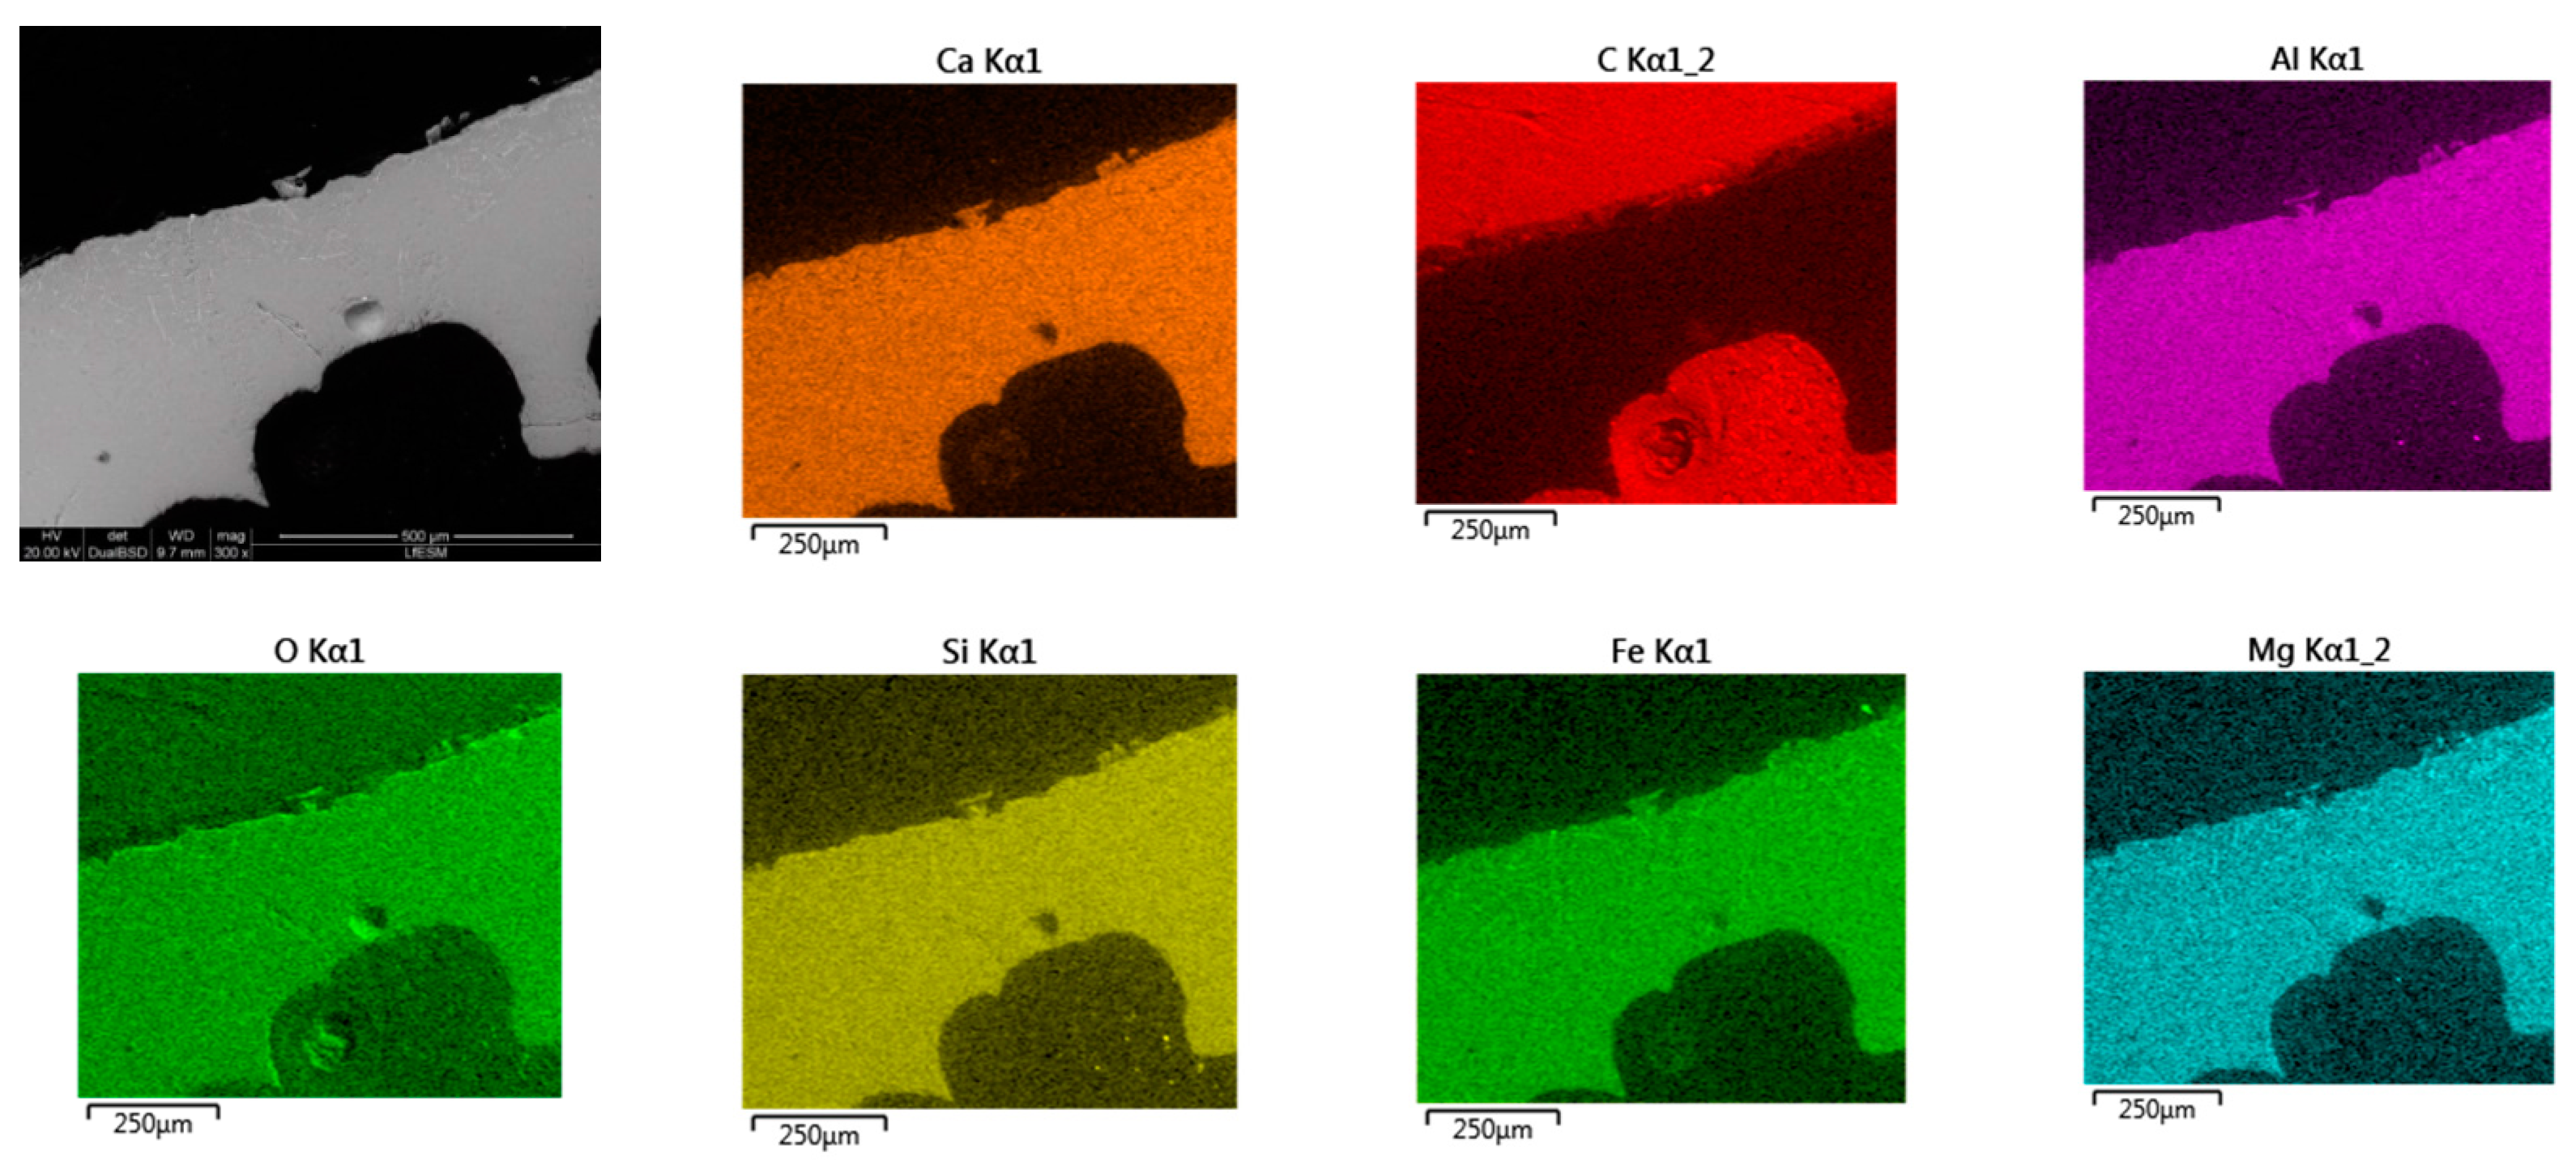
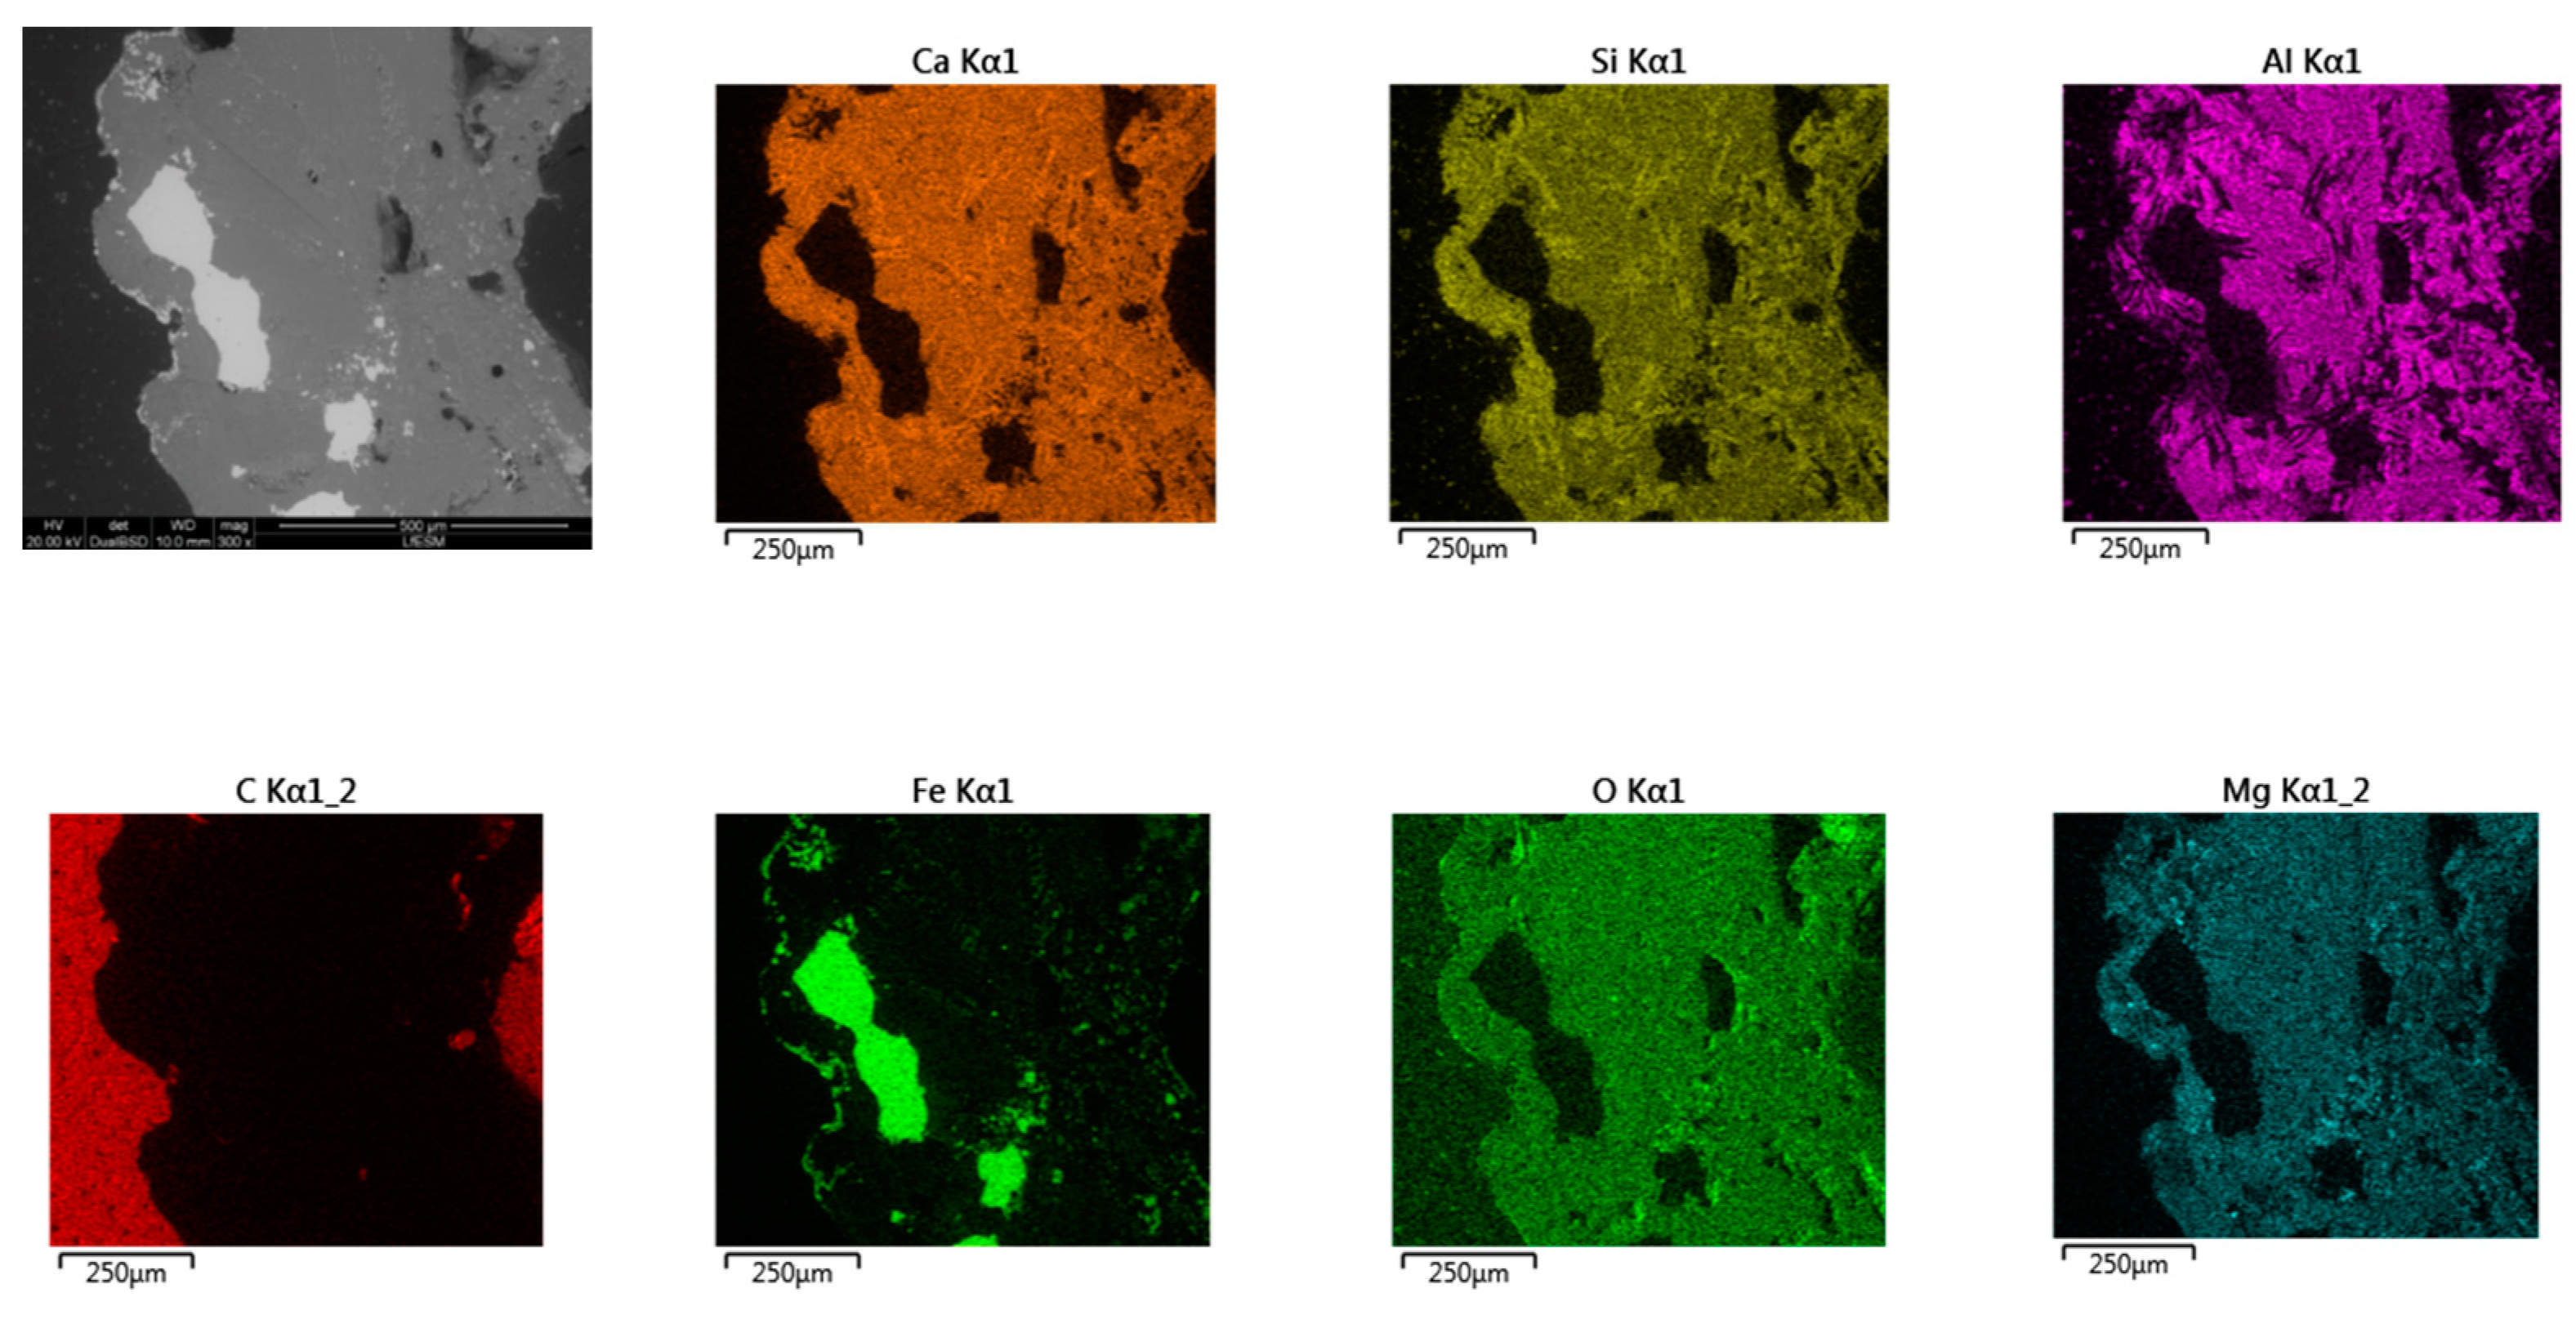
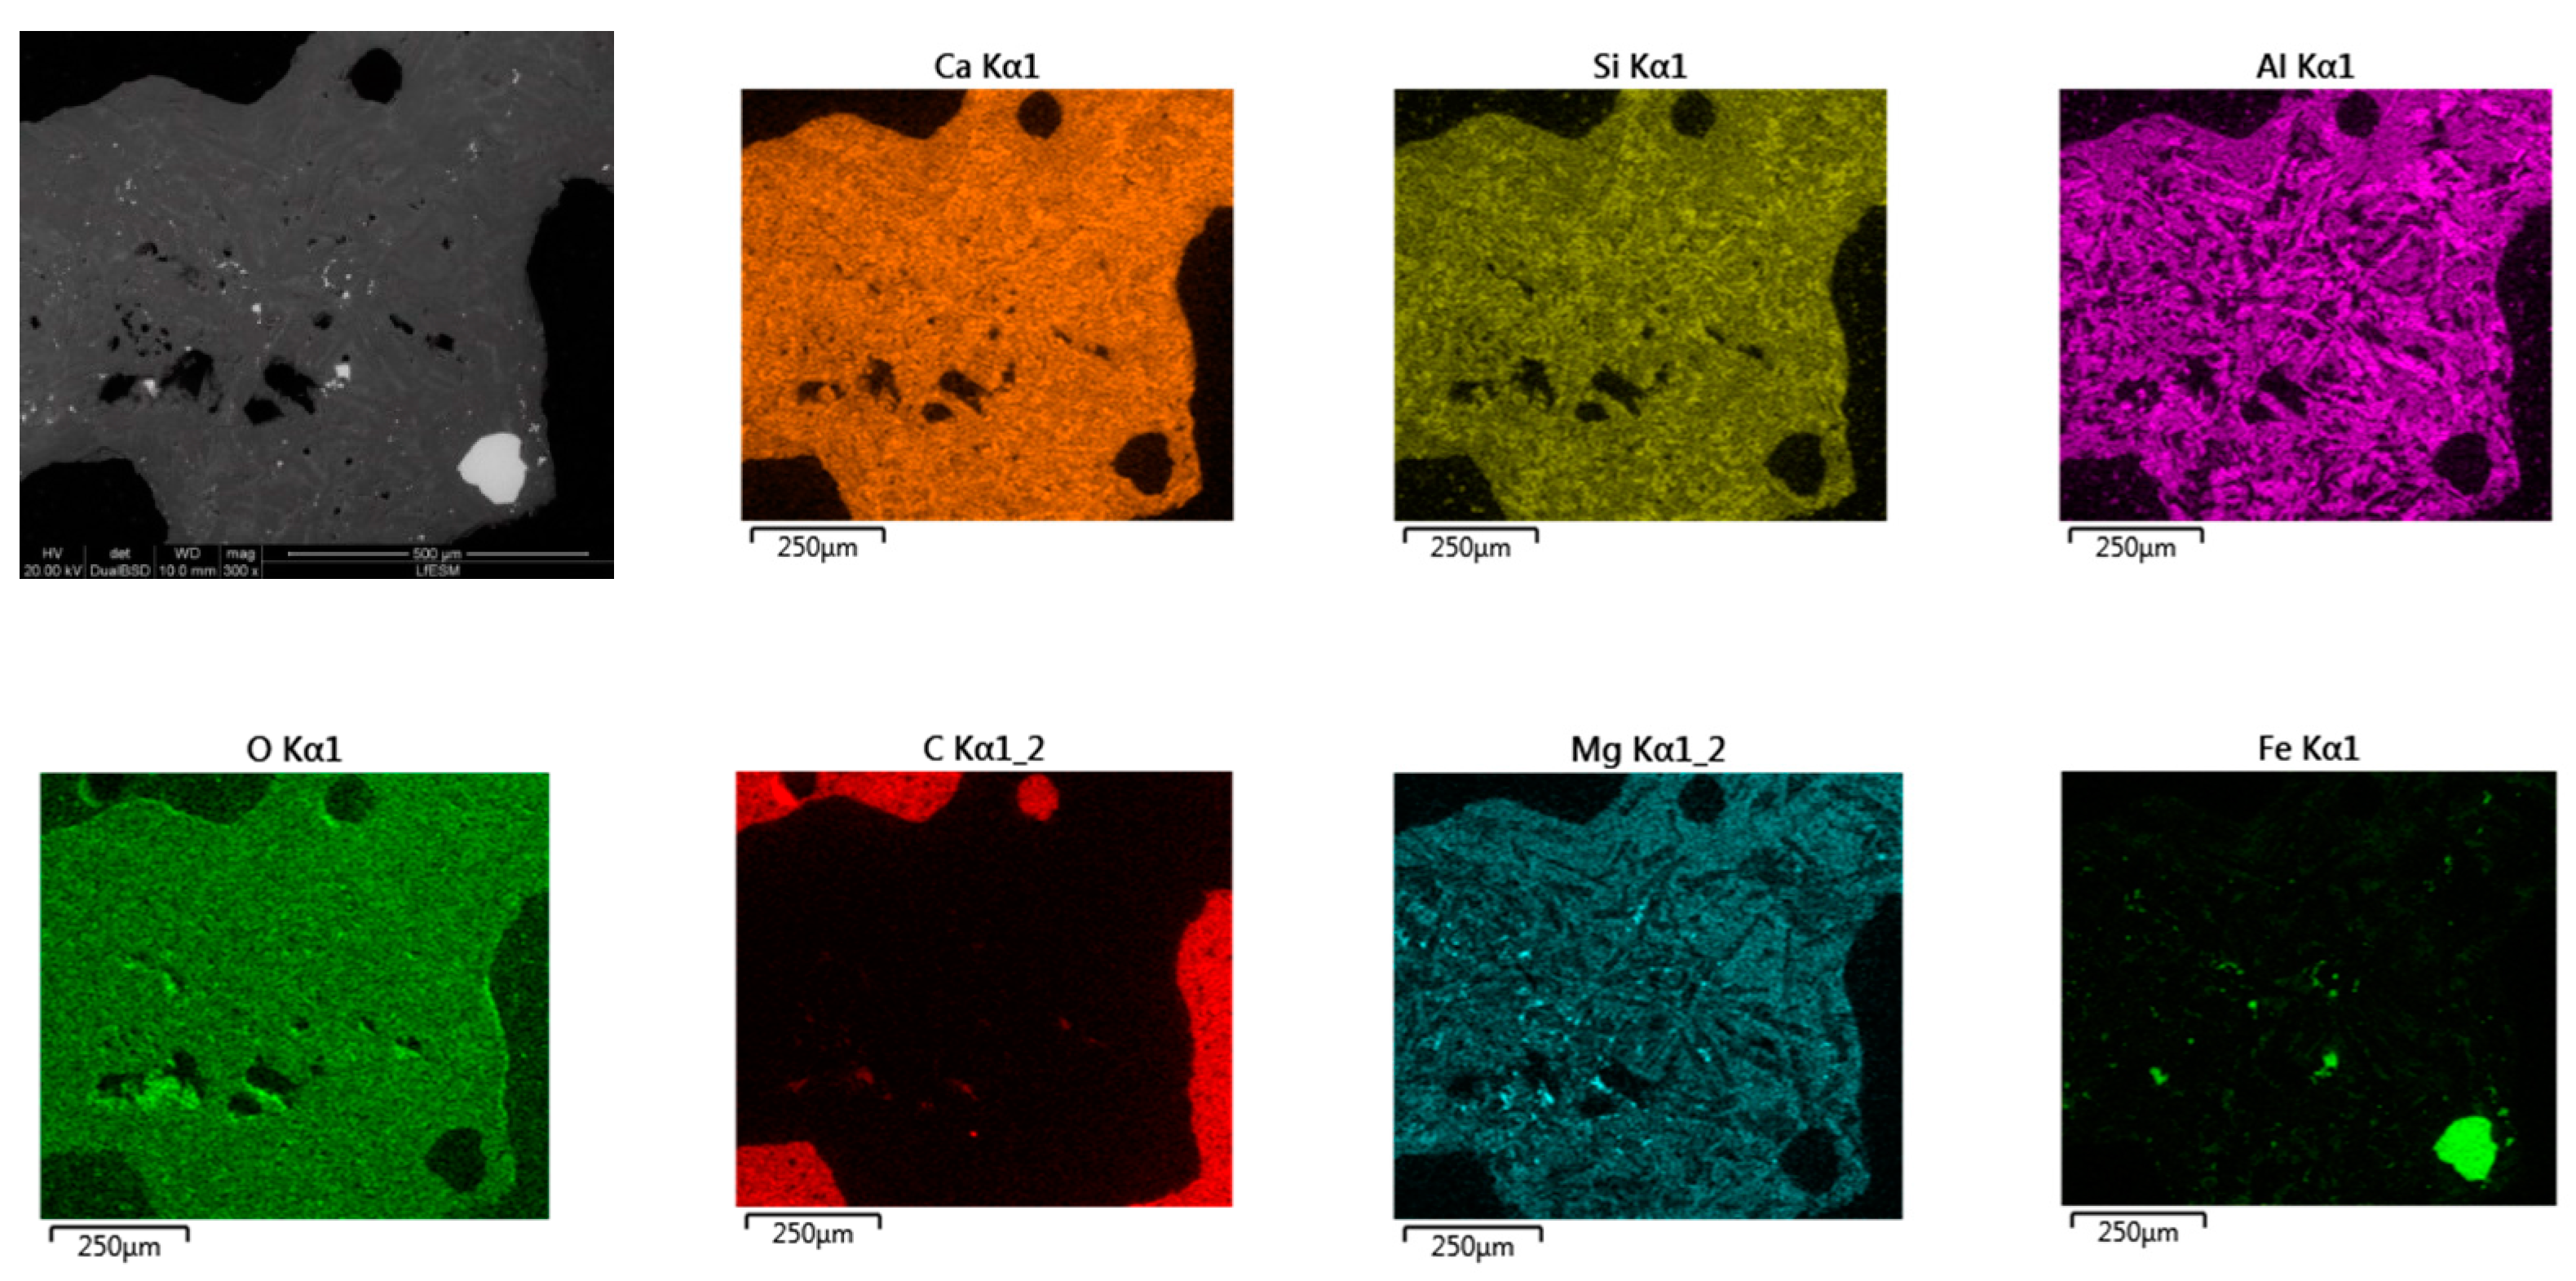
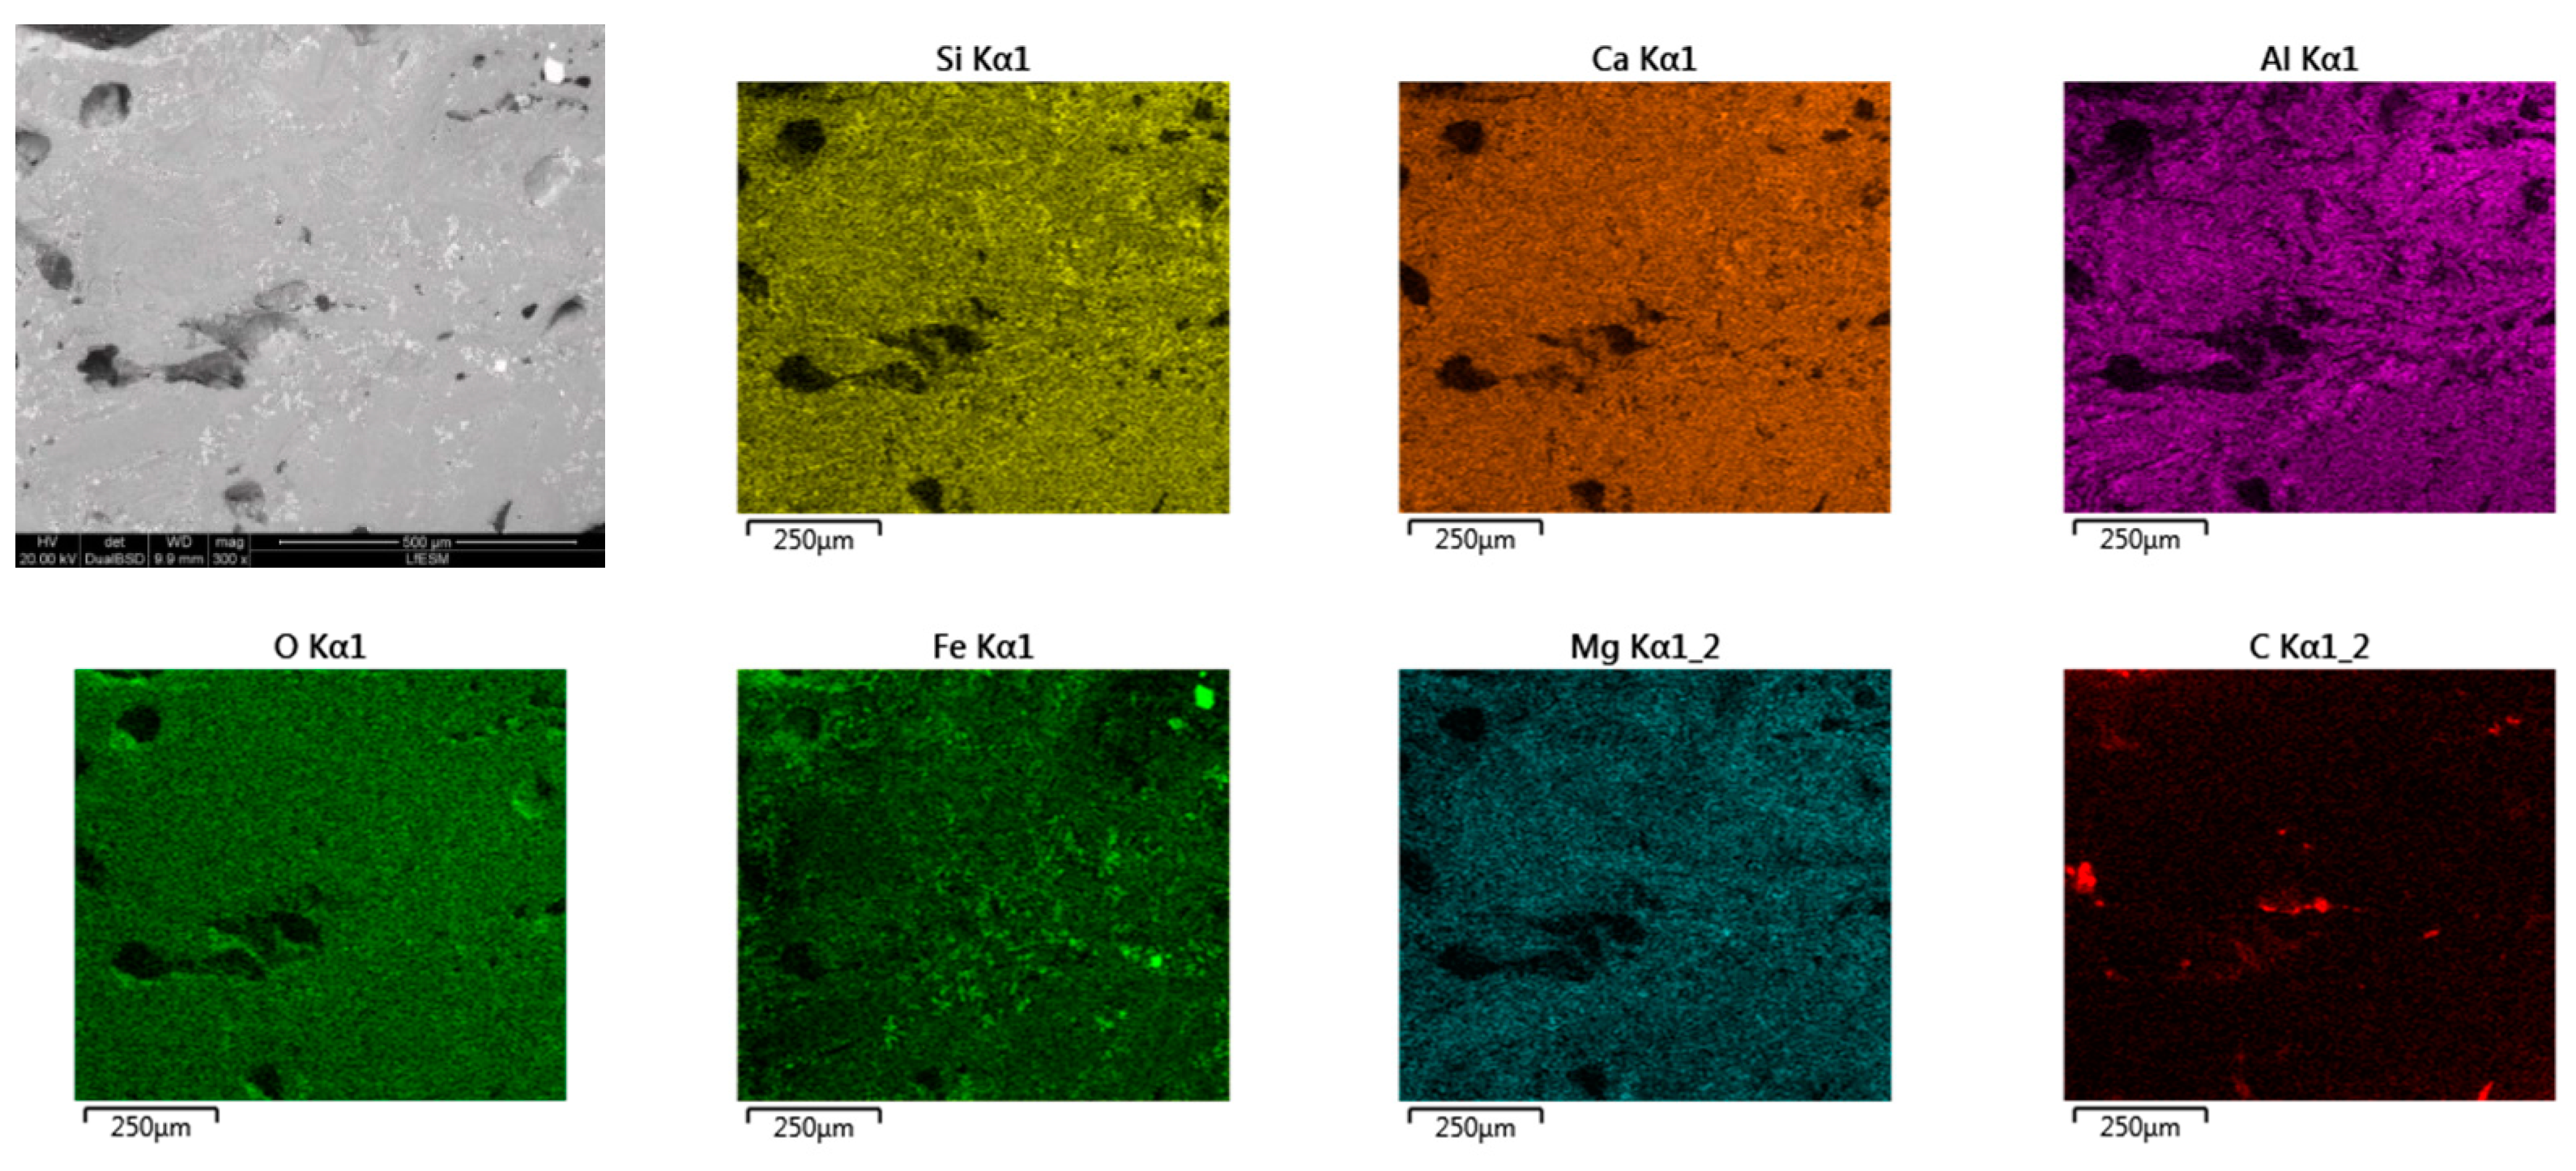
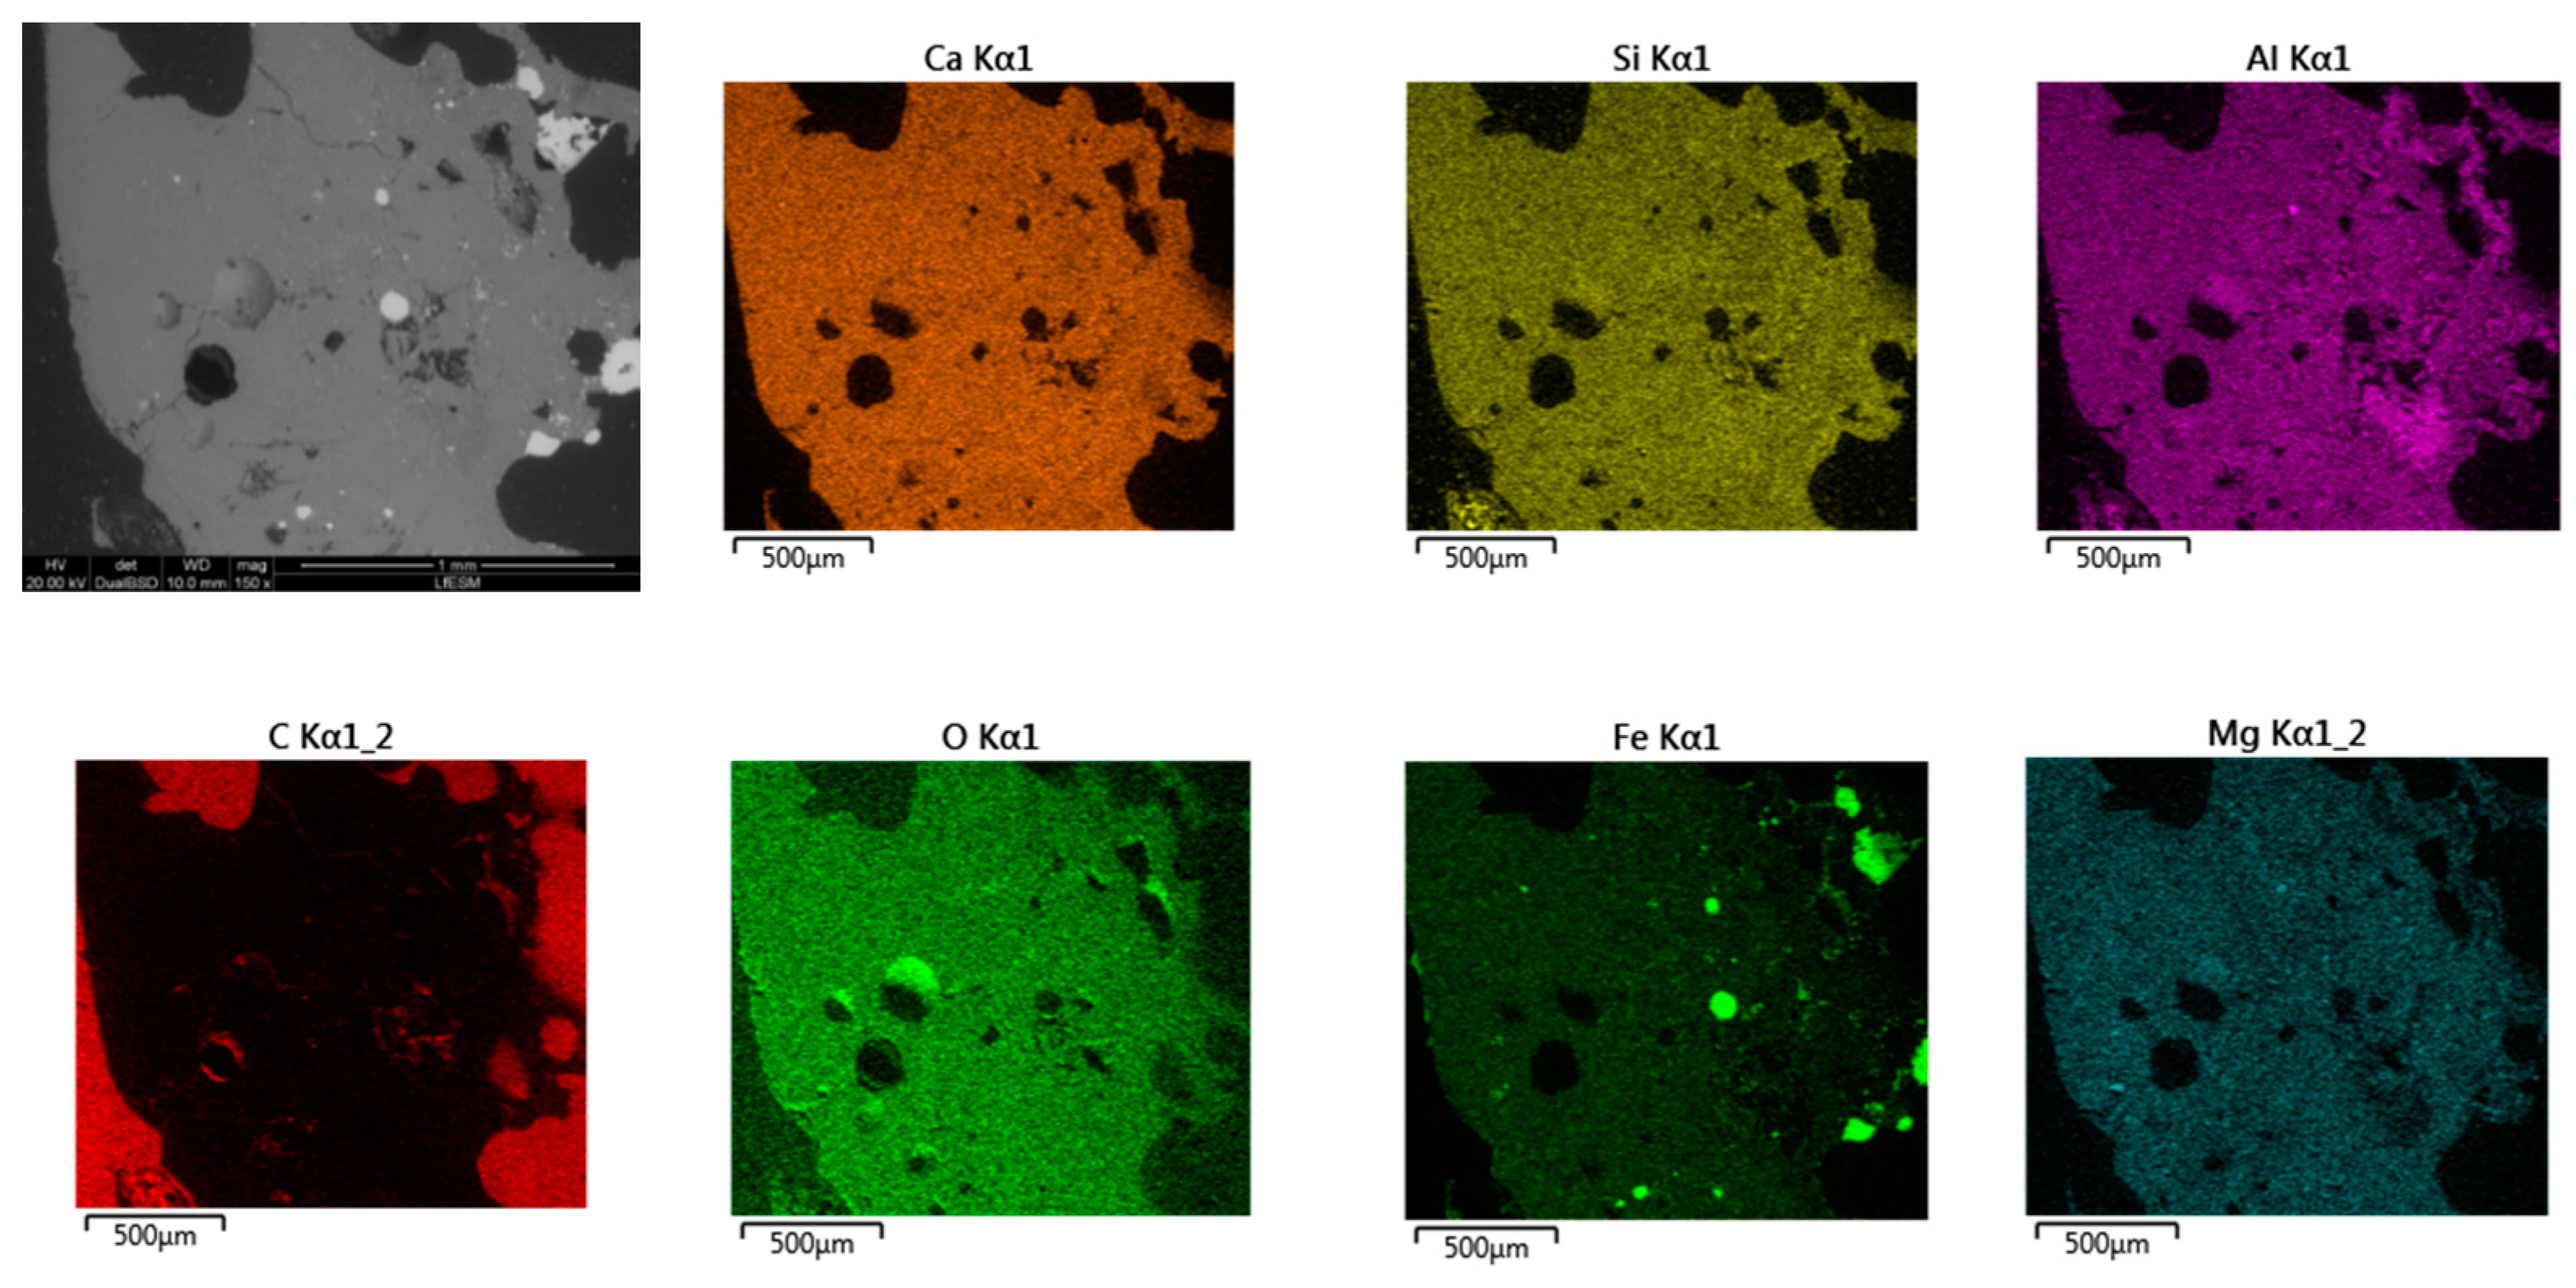
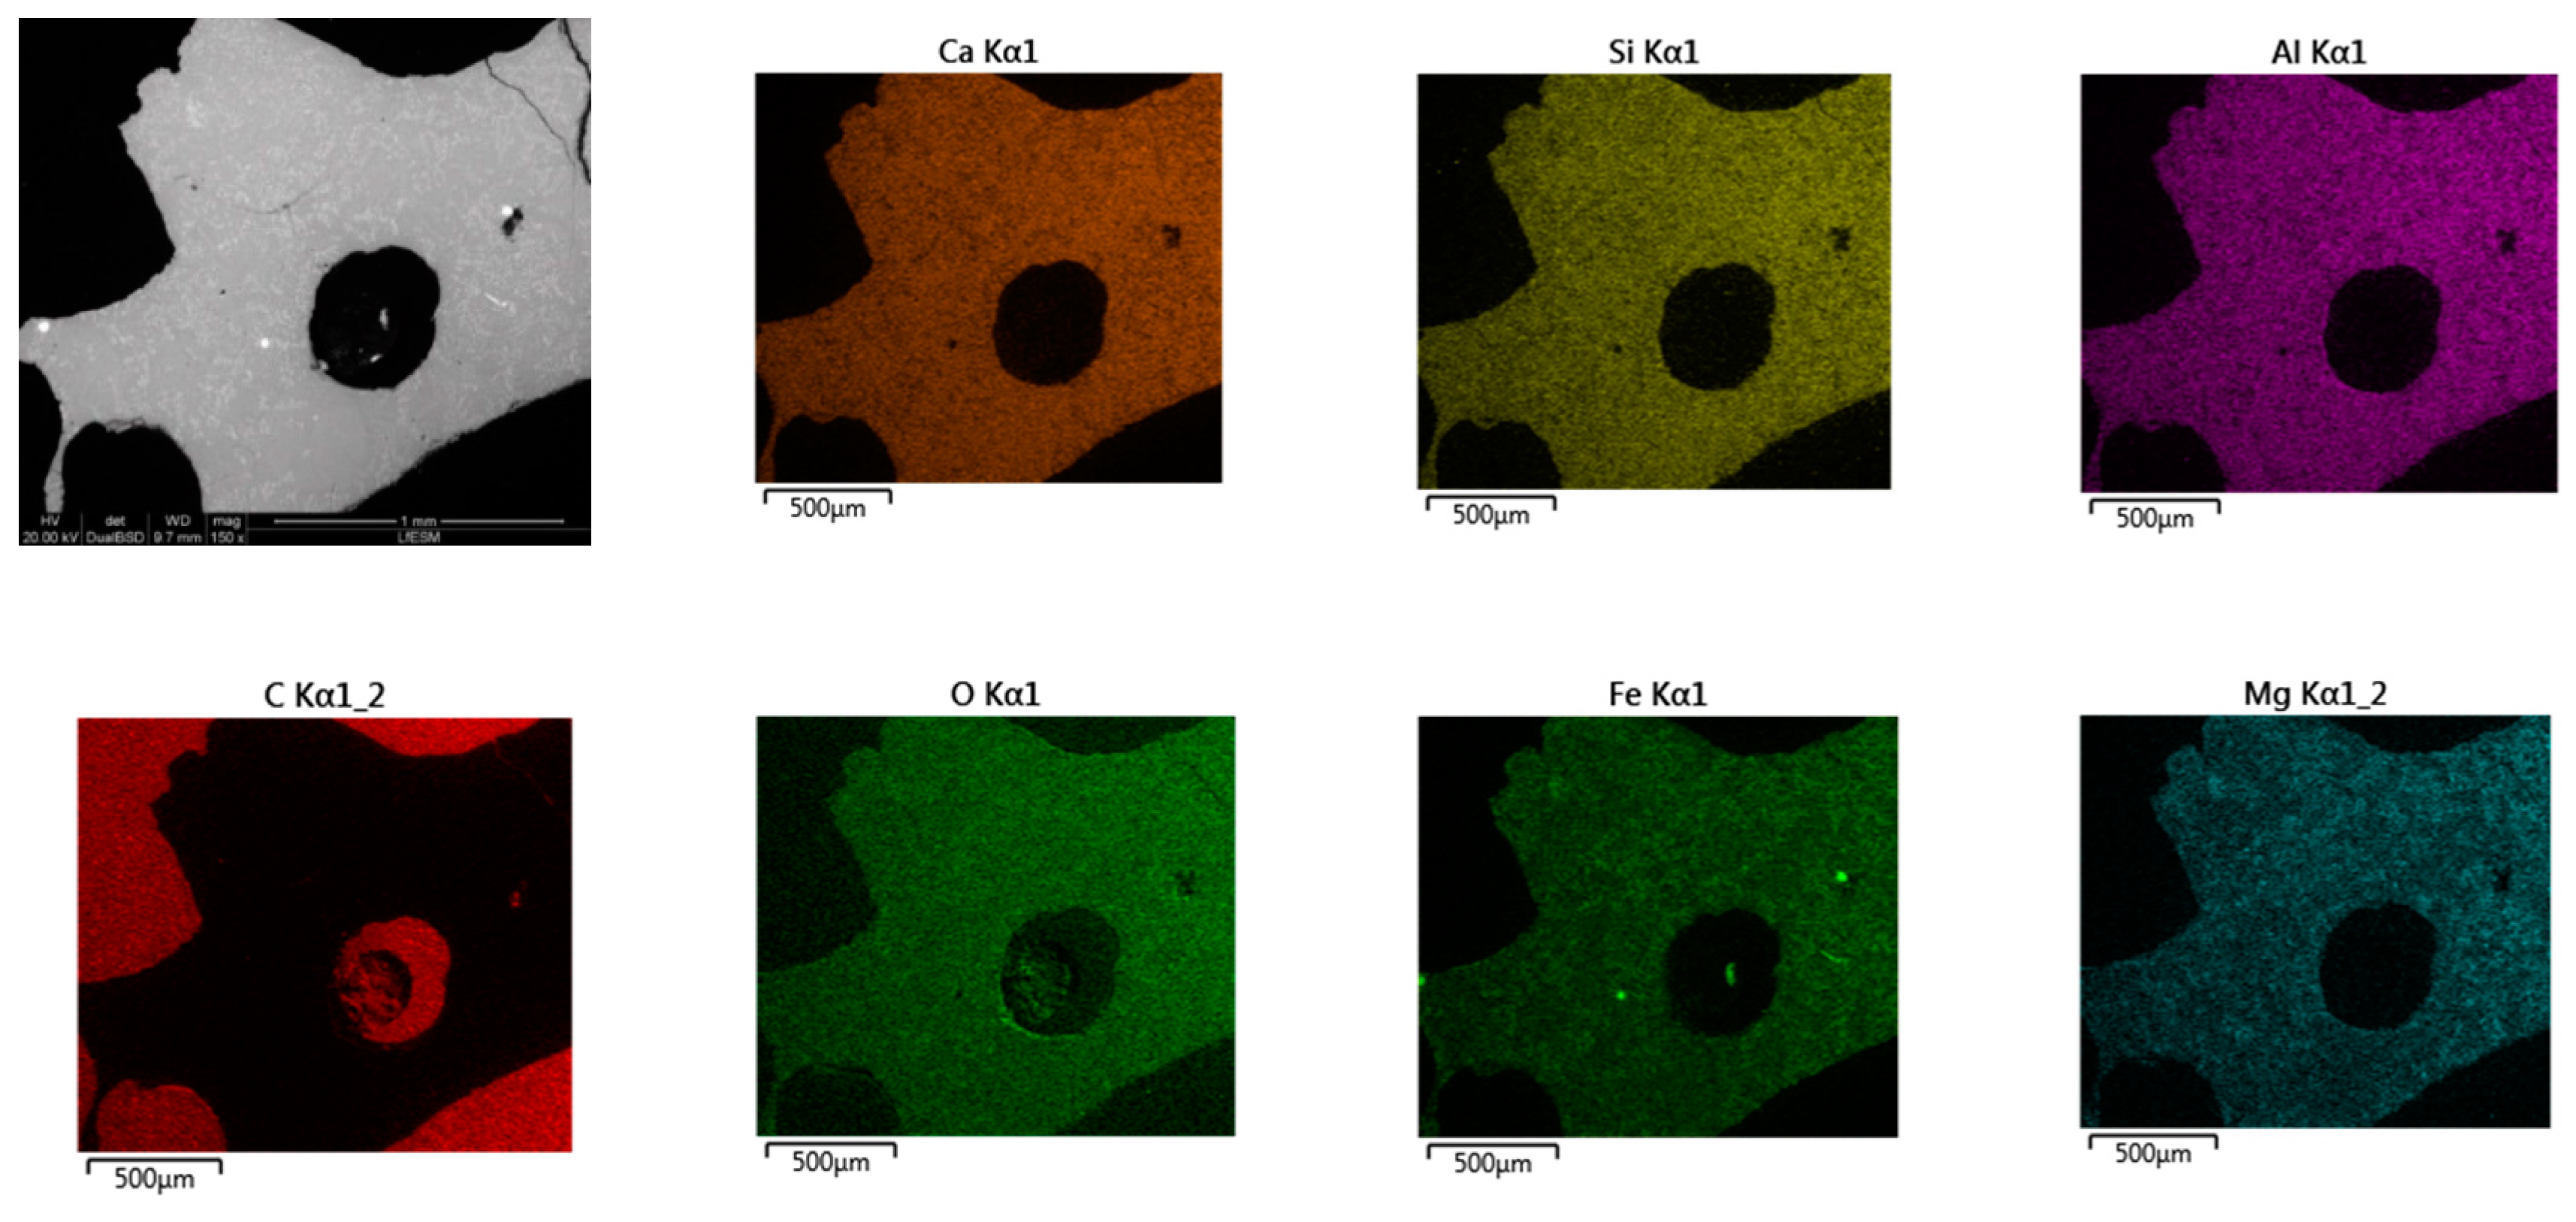
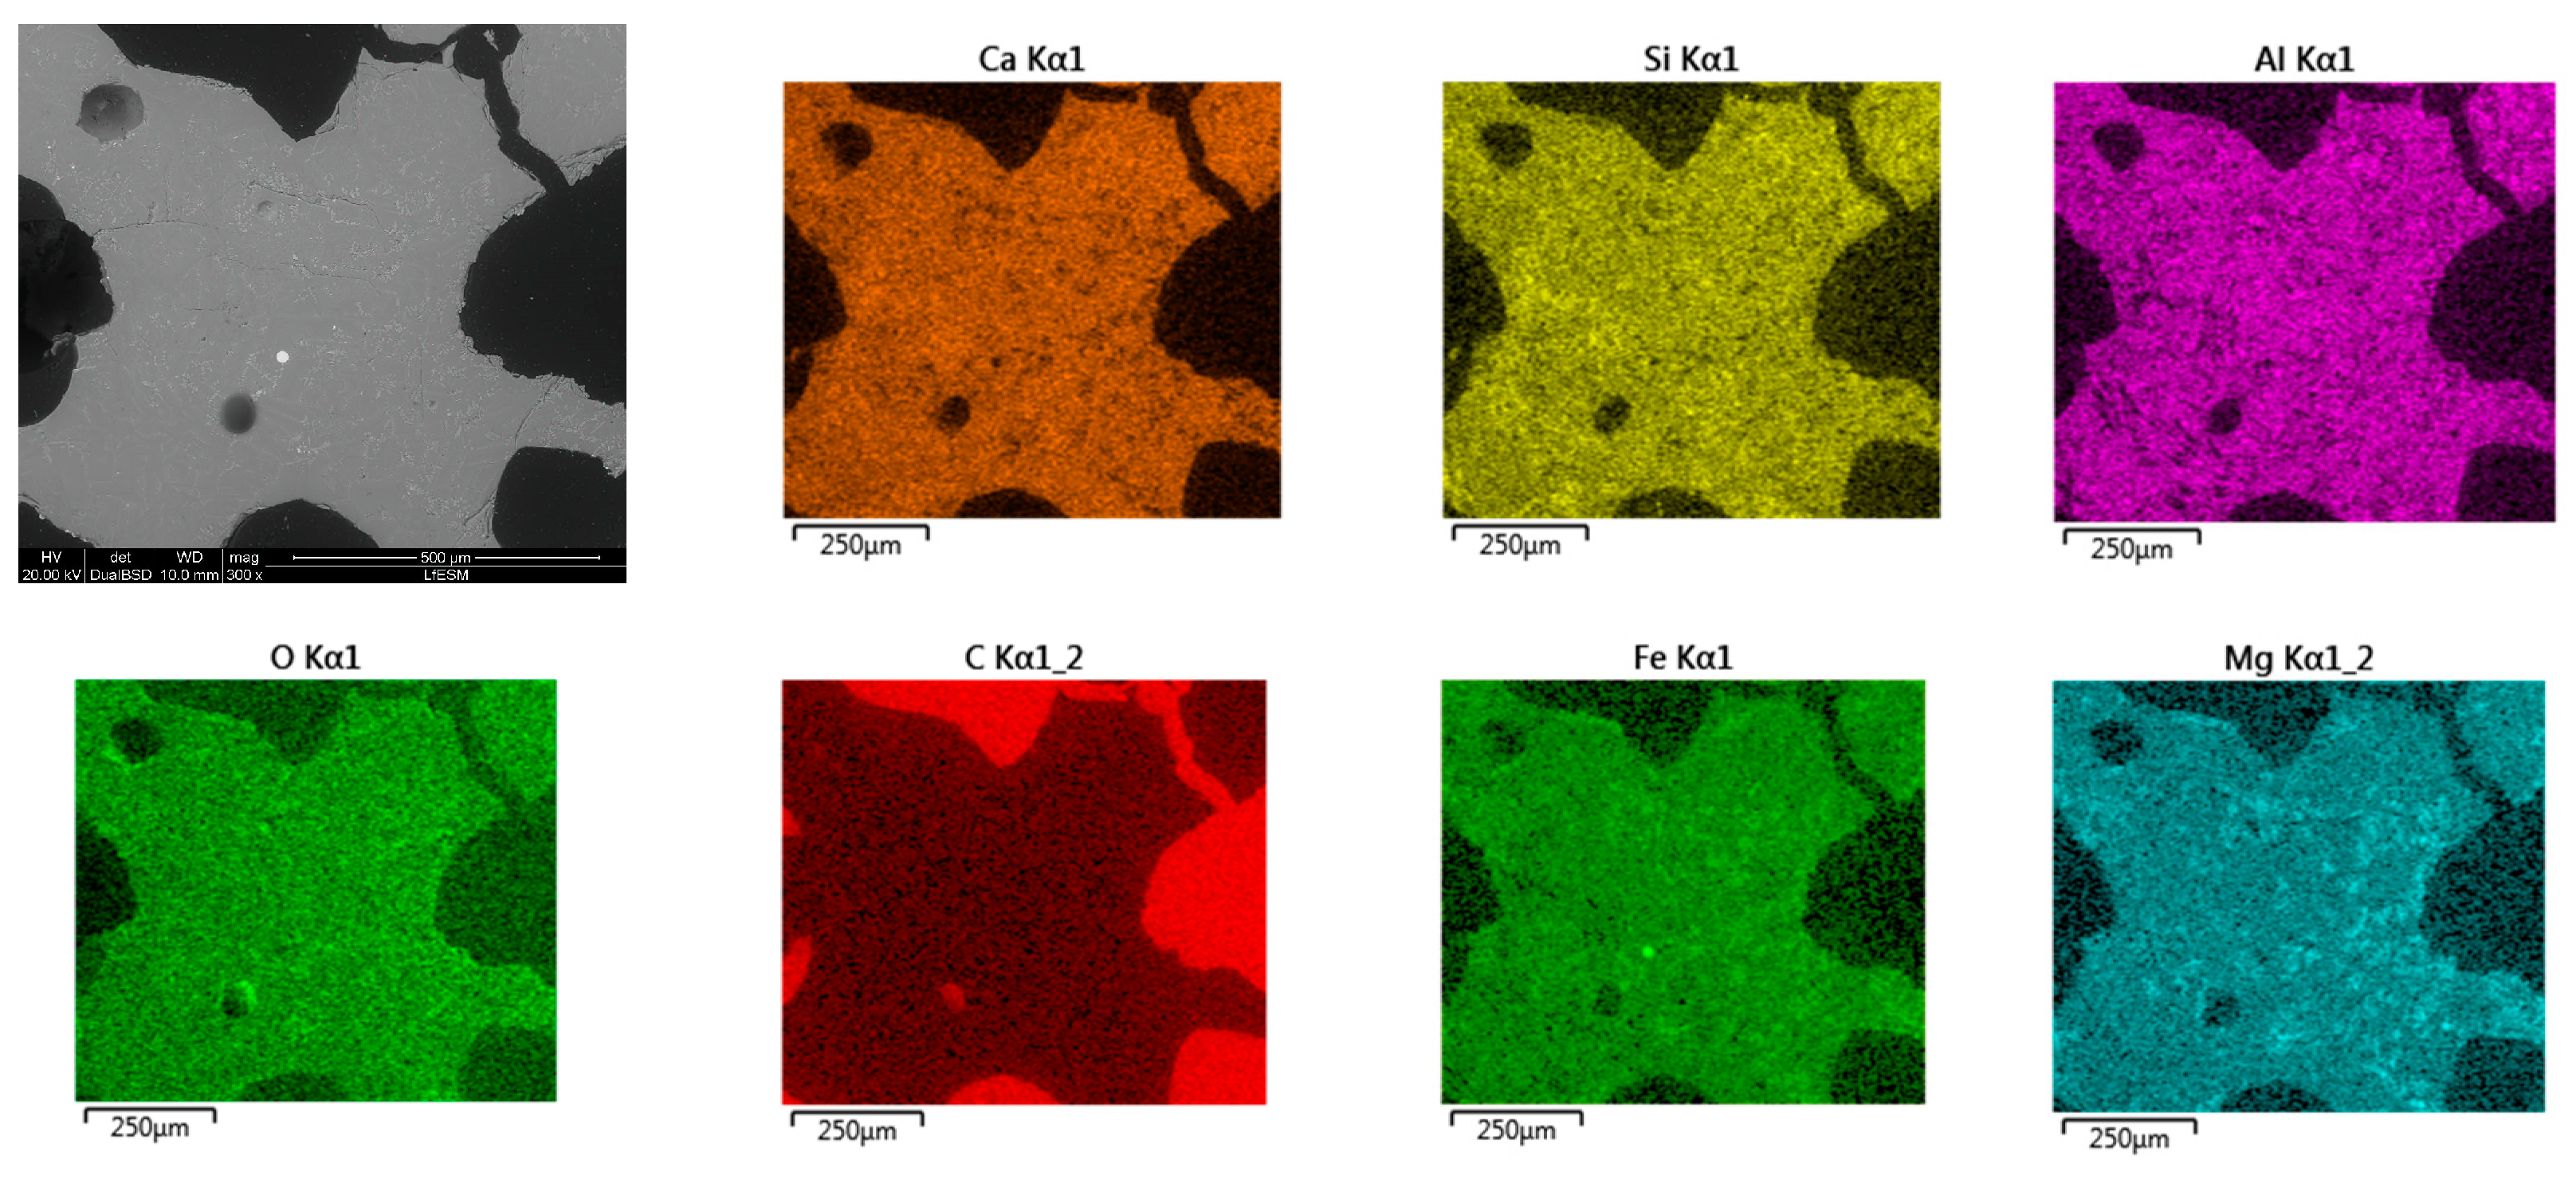
- Based on SEM/EDS, it was noticed in many samples that there was a layer between the slag foam and the crucible wall, irrespective of the type of carbon source used. XRD analysis identified the following phases: gehlenite, merwinite, corundum (Al2O3), and wuestite, as well as two spinels: magnesium aluminate (MgAl2O4) and magnesium iron oxide (Fe2MgO4). It was assumed that the gehlenite and the two spinels could be attributed to the composition of the layer based on SEM/EDS.
- −
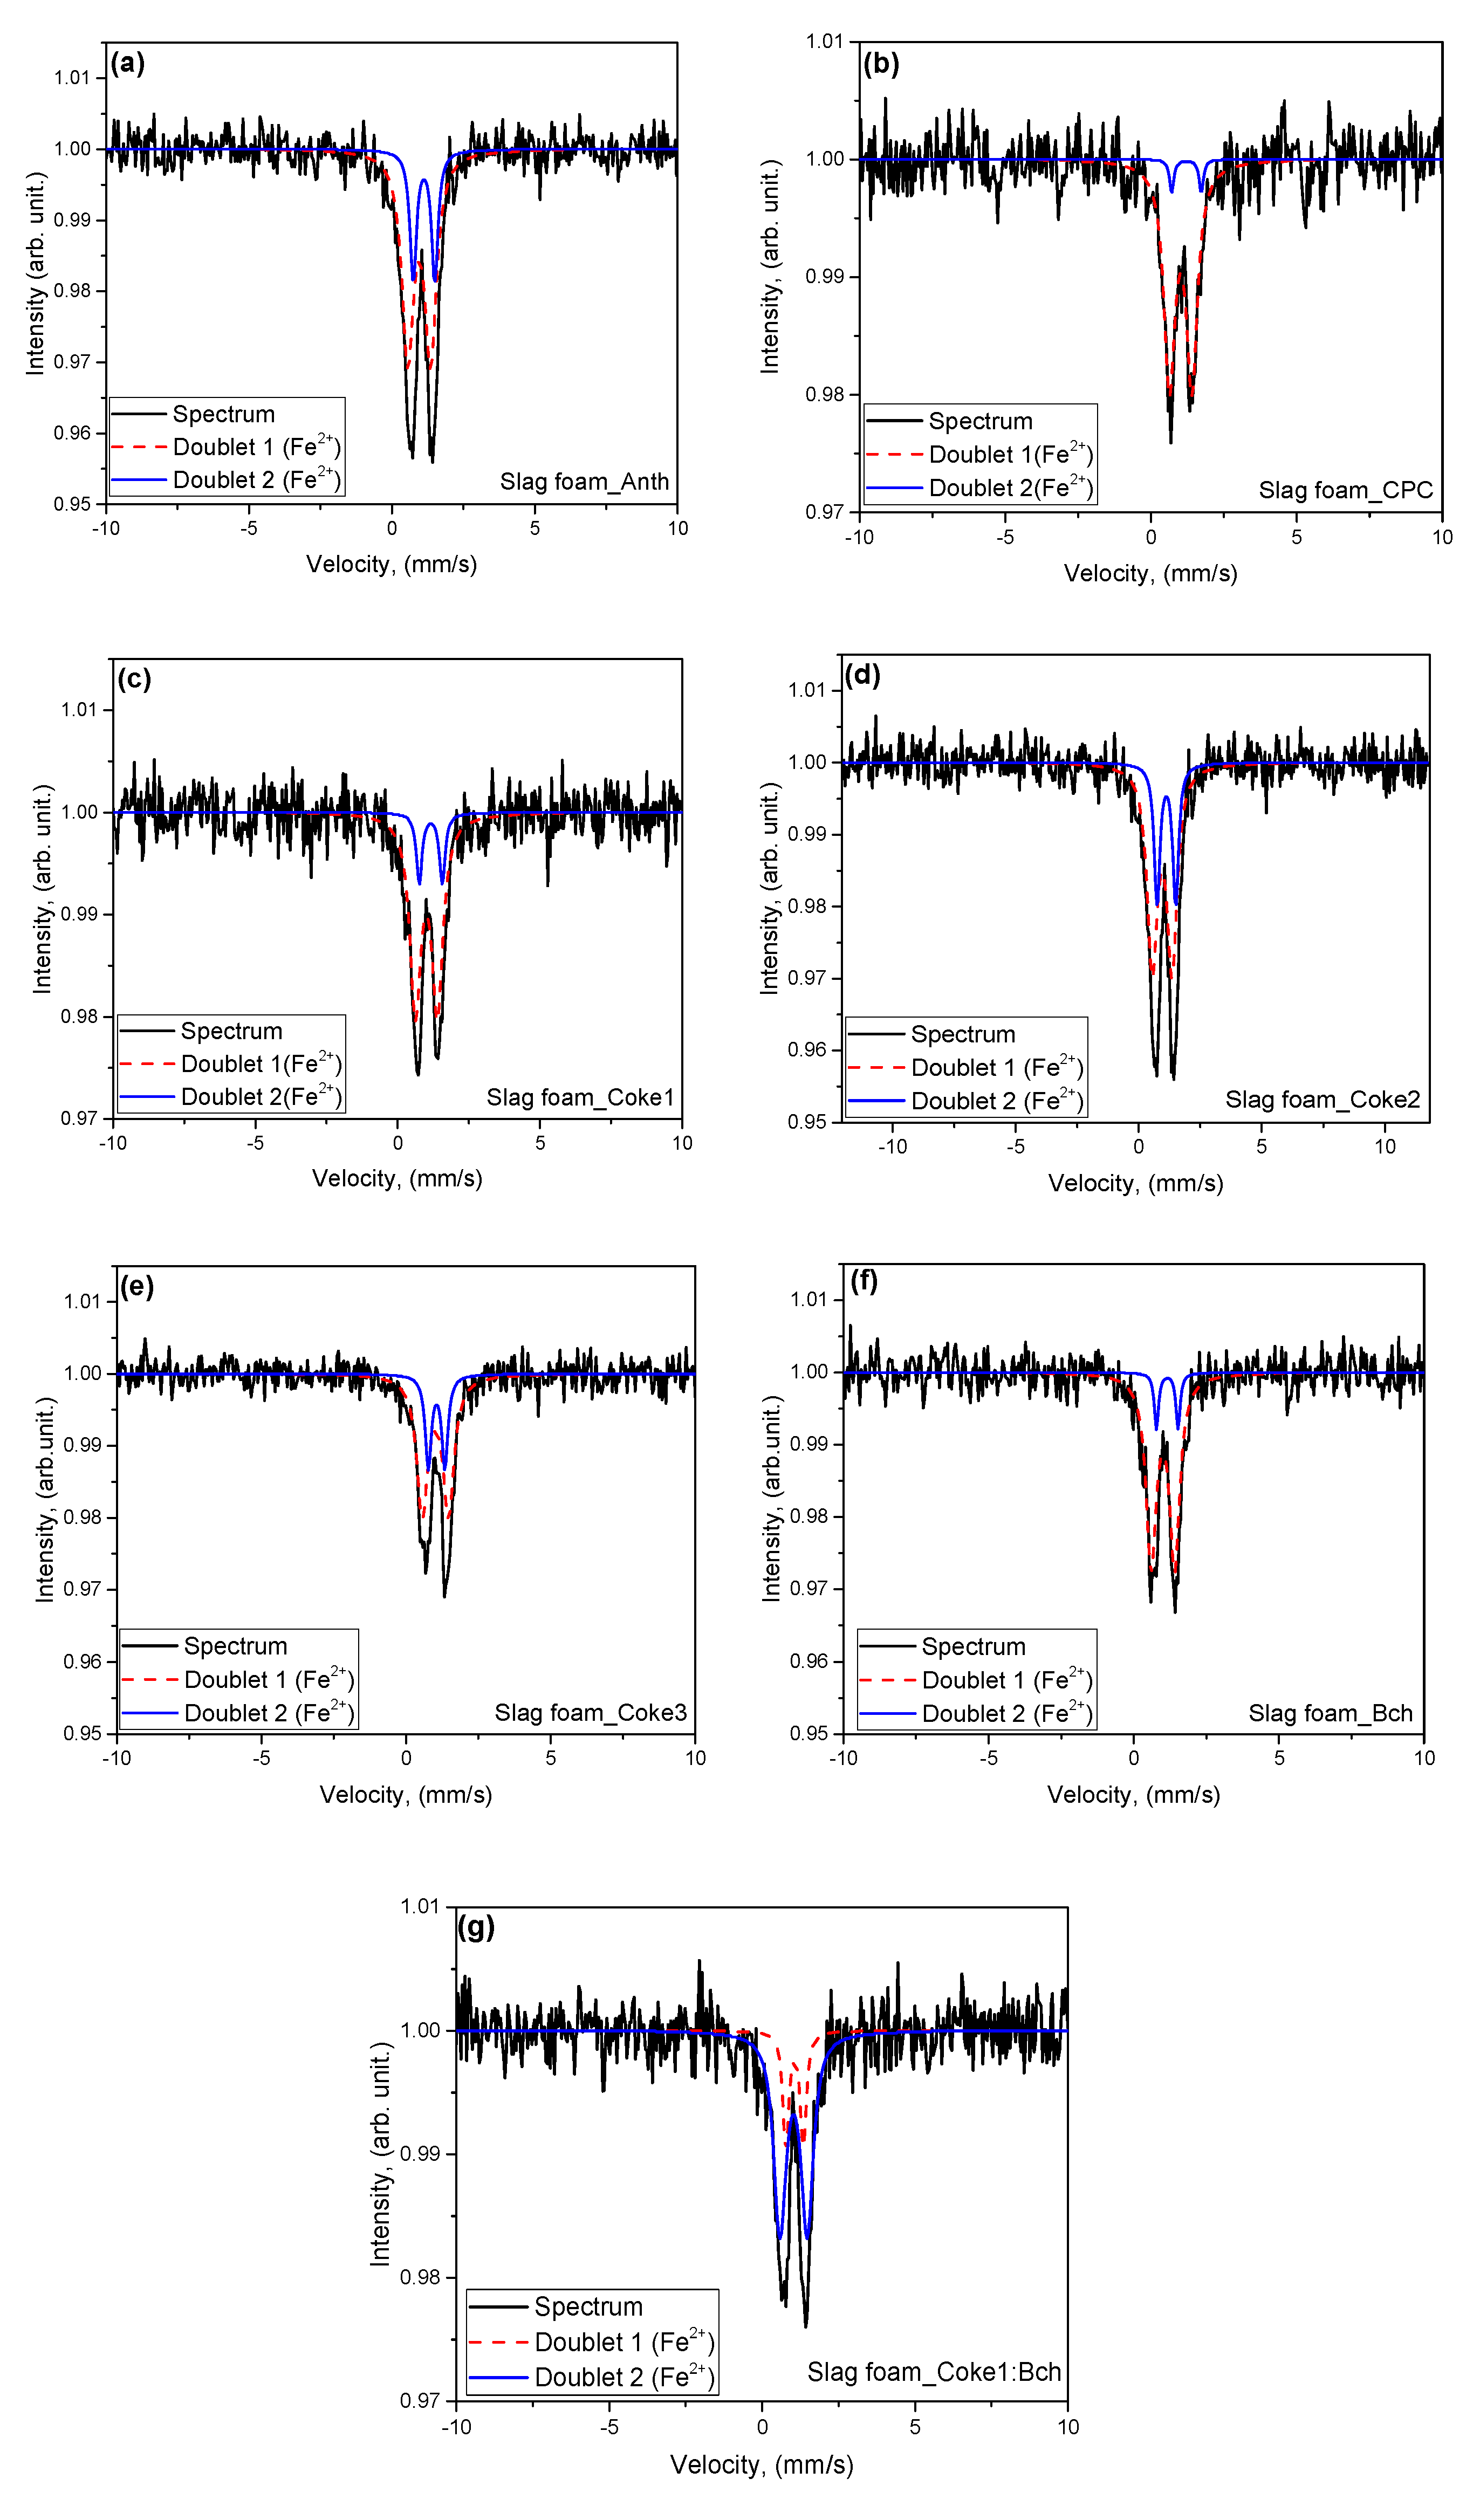
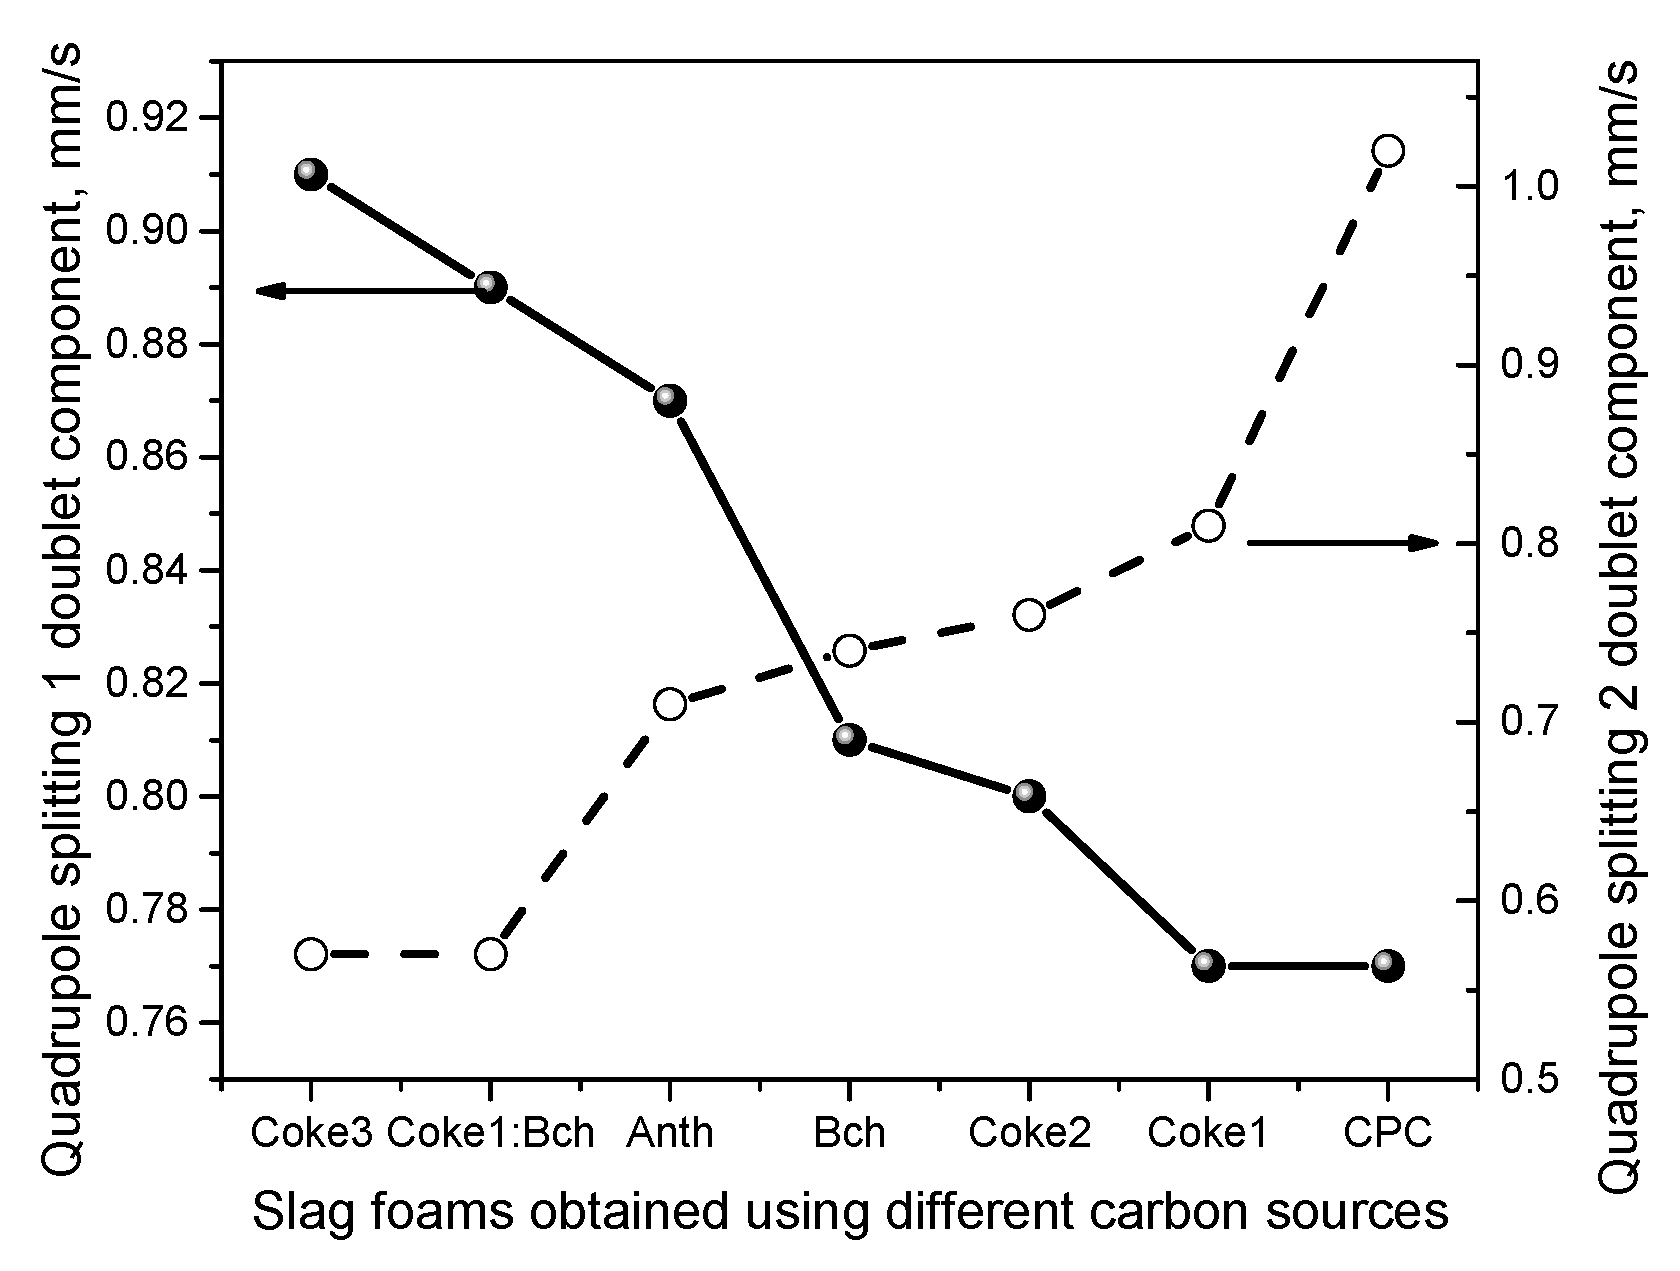
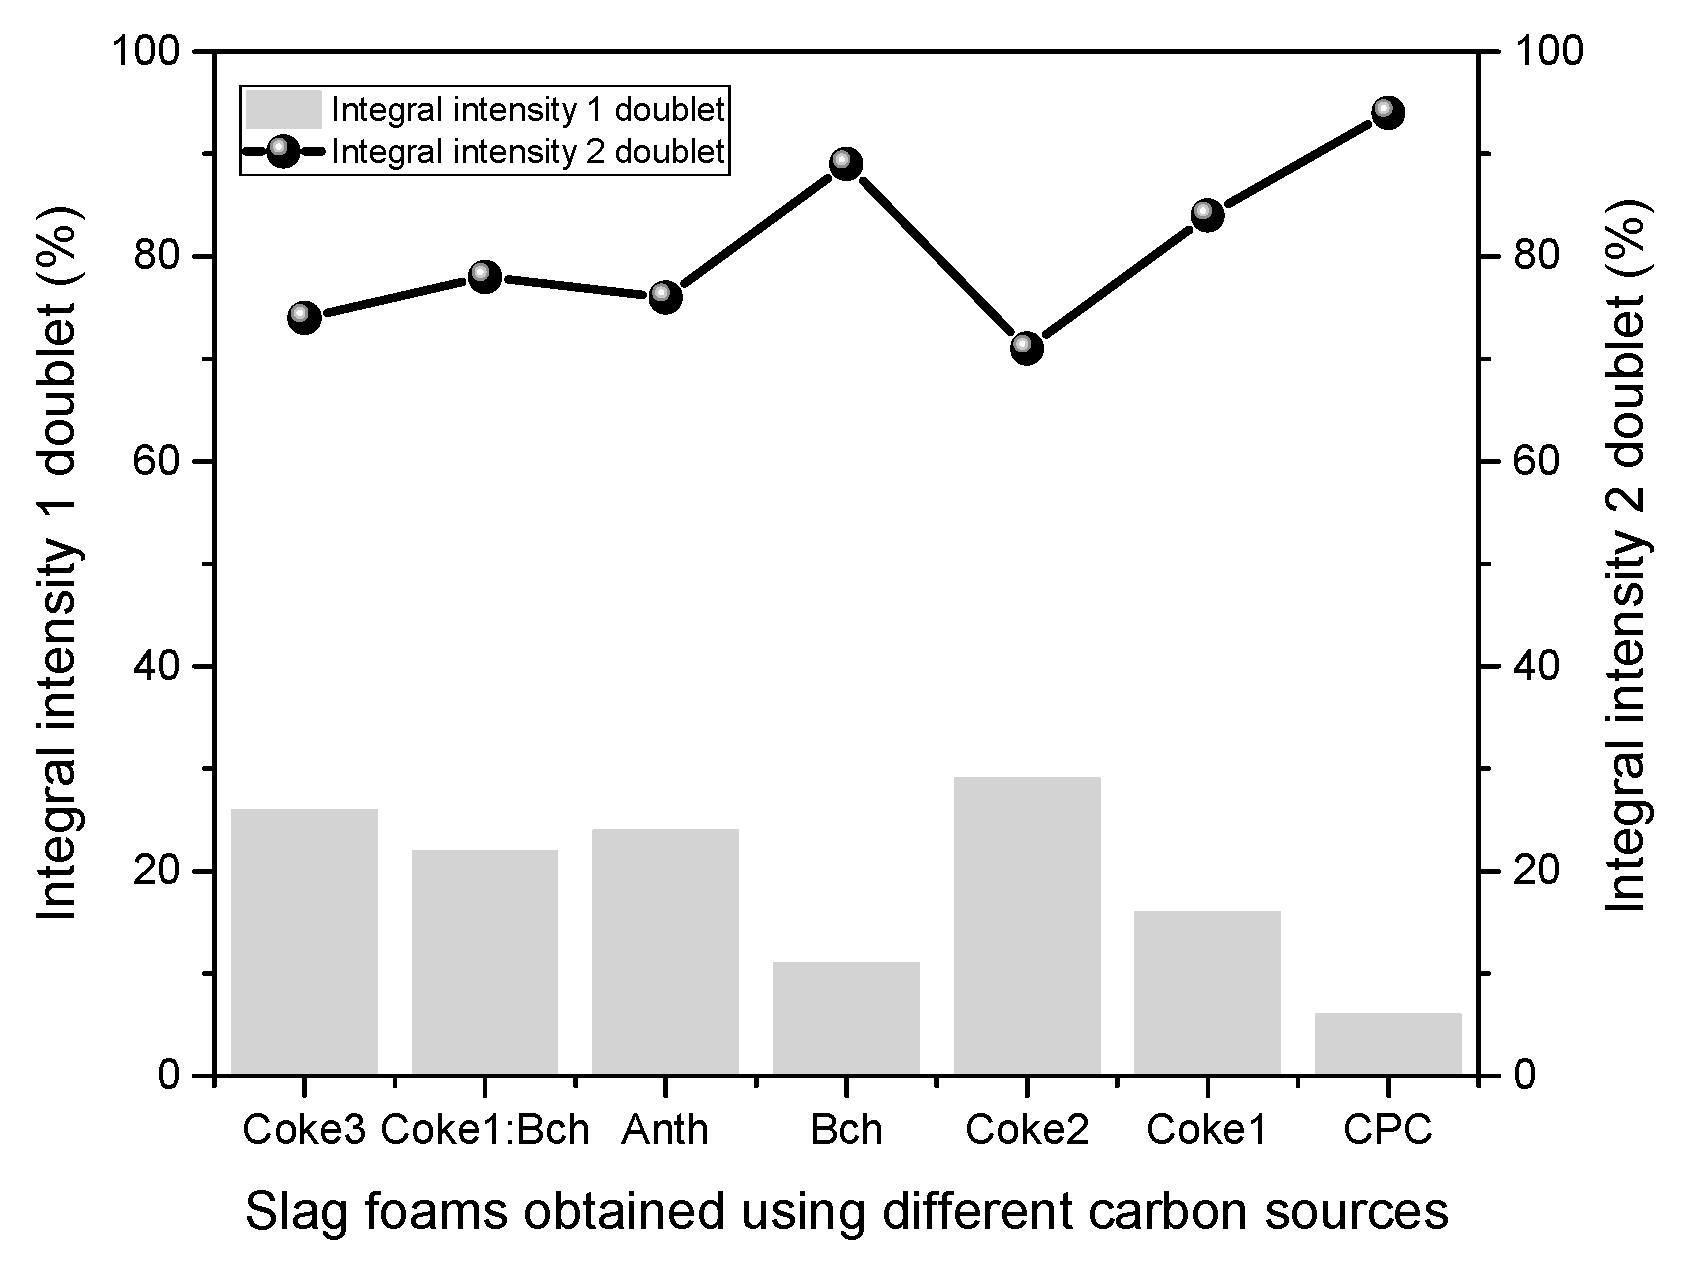
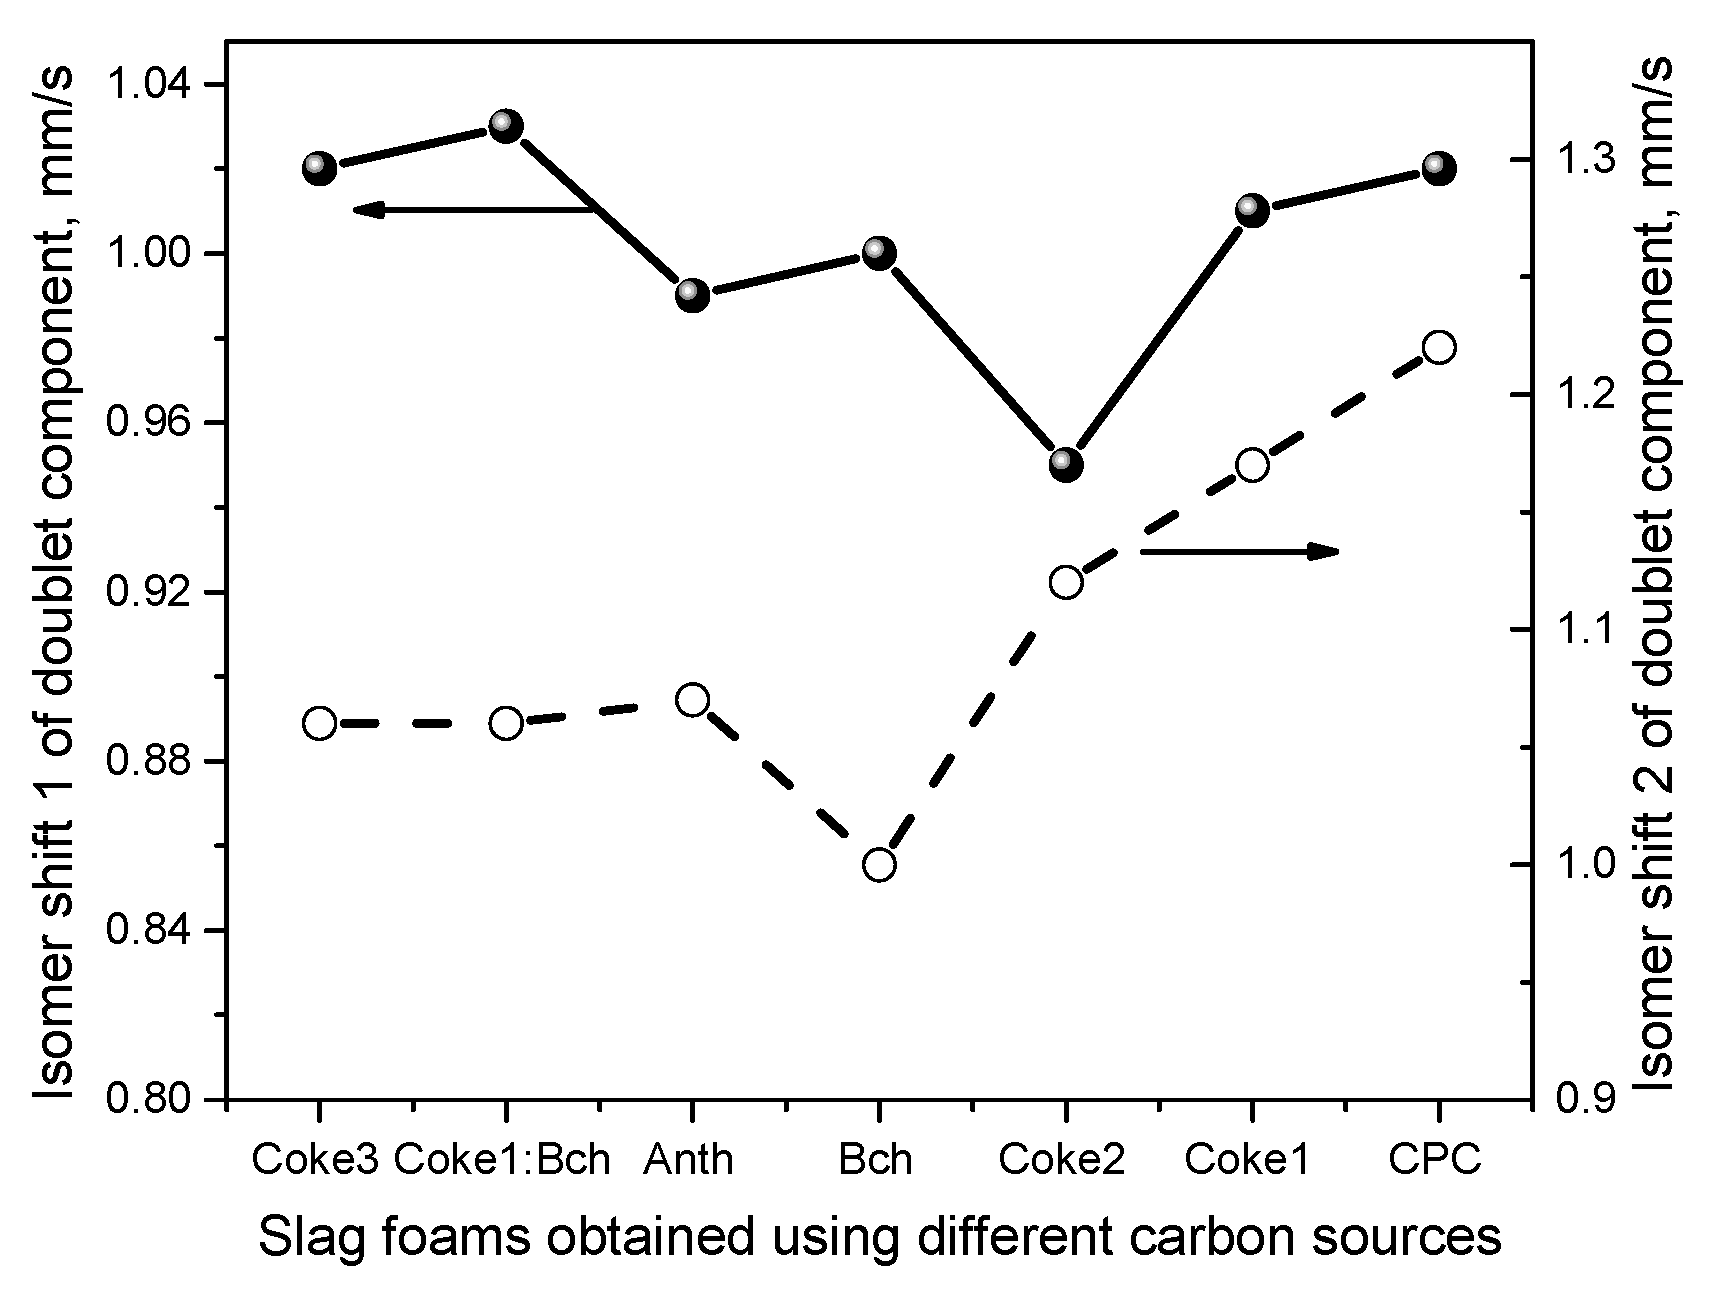
- Mossbauer spectroscopy made it possible to obtain values of the isomer shift (IS) and quadrupole splitting (QS) for the doublet components that are in agreement with the parameters for crystalline wuestite (FeO). Through the analysis of interatomic magnetic interactions and the non-equivalent environment surrounding the nuclei, it was found that an increase in the disordering of nuclei in surface positions leads to a higher degree of order within the core of the particles. Additionally, a change in the chemical environment of the iron nuclei was observed, which was attributed to the defects present in the surface regions.
Author Contributions
Funding
Data Availability Statement
Acknowledgments
Conflicts of Interest
References
- Agnihotri, A.; Singh, P.K.; Singh, D.; Gupta, M. Foamy Slag Practice to Enhance the Energy Efficiency of Electric Arc Furnace: An Industrial Scale Validation. Mater. Today Proc. 2021, 46, 1537–1542. [Google Scholar] [CrossRef]
- Morales, R.D.; Rubén, L.G.; López, F.; Camacho, J.; Romero, J.A. The Slag Foaming Practice in EAF and Its Influence on the Steelmaking Shop Productivity. ISIJ Int. 1995, 35, 1054–1062. [Google Scholar] [CrossRef]
- Matsuura, H.; Fruehan, R.J. Slag Foaming in an Electric Arc Furnace. ISIJ Int. 2009, 49, 1530–1535. [Google Scholar] [CrossRef]
- Vieira, D.; de Almeida, R.A.M.; Bielefeldt, W.V.; Vilela, A.C.F. Slag Evaluation to Reduce Energy Consumption and EAF Electrical Instability. Mat. Res. 2016, 19, 1127–1131. [Google Scholar] [CrossRef]
- Molloseau, C.L.; Fruehan, R.J. The Reaction Behavior of Fe-C-S Droplets in CaO-SiO2-MgO-FeO Slags. Met. Mater. Trans B 2002, 33, 335–344. [Google Scholar] [CrossRef]
- Kitamura, S.; Okohira, K. Influence of Slag Composition and Temperature on Slag Foaming. ISIJ Int. 1992, 32, 741–746. [Google Scholar] [CrossRef]
- Zhu, T.X.; King, M.P.; Coley, K.S.; Irons, G.A. Erratum to: Progress in Slag Foaming in Metallurgical Processes. Met. Mater. Trans. B 2013, 44, 478. [Google Scholar] [CrossRef]
- Vidacak, B.; Arvanitidis, I.; Jönsson, P.G.; Sjöberg, P. Observation on Foaming of EAF Slags in the Production of Stainless Steel: Observation on Foaming of EAF Slags. Scand. J. Metall. 2002, 31, 321–327. [Google Scholar] [CrossRef]
- Jung, S.-M.; Fruehan, R.J. Foaming Characteristics of BOF Slags. ISIJ Int. 2000, 40, 348–355. [Google Scholar] [CrossRef]
- Wang, R.; Zhang, B.; Liang, Y.; Liu, C.; Jiang, M. Micro Insight into Foaming Behavior of CaO–SiO2–FeO–MgO-Based Slag Induced by Slag/Metal Reaction. Ceram. Int. 2023, 49, 17185–17193. [Google Scholar] [CrossRef]
- Wang, R.; Zhang, B.; Hu, C.; Liu, C.; Jiang, M. Study on Splashing Mechanism in Basic Oxygen Furnace Based on Slag Foaming Modeling. Steel Res. Int. 2022, 93, 2100318. [Google Scholar] [CrossRef]
- Zhang, Y.; Fruehan, R.J. Effect of the Bubble Size and Chemical Reactions on Slag Foaming. MMTB 1995, 26, 803–812. [Google Scholar] [CrossRef]
- European Commission. Directorate General for Research and Innovation. Sustainable EAF Steel Production (GREENEAF); Publications Office: Luxembourg, 2013. [Google Scholar]
- Luz, A.P.; Tomba Martinez, A.G.; López, F.; Bonadia, P.; Pandolfelli, V.C. Slag Foaming Practice in the Steelmaking Process. Ceram. Int. 2018, 44, 8727–8741. [Google Scholar] [CrossRef]
- Chychko, A.; Seetharaman, S. Foaming in Electric Arc Furnace Part I: Laboratory Studies of Enthalpy Changes of Carbonate Additions to Slag Melts. Met. Mater. Trans. B 2011, 42, 20–29. [Google Scholar] [CrossRef]
- Kim, H.S.; Min, D.J.; Park, J.H. Foaming Behavior of CaO-SiO2-FeO-MgOsatd-X (X=Al2O3,MnO, P2O5, and CaF2) Slags at High Temperatures. ISIJ Int. 2001, 41, 317–324. [Google Scholar] [CrossRef]
- Leonard, D.C.; Bonte, L.; Dufour, A.; Ferstl, A.; Raipala, K.; Scmole, P.; Schoone, P.; Verduras, J.L.; Willmers, R.R. Coke Quality Requirements of European Blast Furnace Engineers. In Proceedings of the Proceedings 3rd European Cokemaking Congress, Gent, Belgium, 16–18 September 1996. [Google Scholar]
- Bhoi, B.; Jouhari, A.K.; Ray, H.S.; Misra, V.N. Smelting Reduction Reactions by Solid Carbon Using Induction Furnace: Foaming Behaviour and Kinetics of FeO Reduction in CaO–SiO2–FeO Slag. Ironmak. Steelmak. 2006, 33, 245–252. [Google Scholar] [CrossRef]
- Luz, A.P.; Avila, T.A.; Bonadia, P.; Pandolfelli, V.C. Slag Foaming: Fundamentals, Experimental Evaluation and Application in the Steelmaking Industry. Refract. Worldforum 2011, 3, 91–98. [Google Scholar]
- Zhang, Y.; Fruehan, R.J. Effect of Carbonaceous Particles on Slag Foaming. MMTB 1995, 26, 813–819. [Google Scholar] [CrossRef]
- Ogawa, Y.; Katayama, H.; Hirata, H.; Tokumitsu, N.; Yamauchi, M. Slag Foaming in Smelting Reduction and Its Control with Carbonaceous Materials. ISIJ Int. 1992, 32, 87–94. [Google Scholar] [CrossRef]
- Wu, K.; Qian, W.; Chu, S.; Niu, Q.; Luo, H. Behavior of Slag Foaming Caused by Blowing Gas in Molten Slags. ISIJ Int. 2000, 40, 954–957. [Google Scholar] [CrossRef]
- Corbari, R.; Matsuura, H.; Halder, S.; Walker, M.; Fruehan, R.J. Foaming and the Rate of the Carbon-Iron Oxide Reaction in Slag. Met. Mater. Trans. B 2009, 40, 940–948. [Google Scholar] [CrossRef]
- Ji, F.-Z.; Barati, M.; Coley, K.; Irons, G.A. Kinetics of coal injection into iron oxide containing slags. Can. Metall. Q. 2005, 44, 85–94. [Google Scholar] [CrossRef]
- Kieush, L.; Rieger, J.; Schenk, J.; Brondi, C.; Rovelli, D.; Echterhof, T.; Cirilli, F.; Thaler, C.; Jaeger, N.; Snaet, D.; et al. A Comprehensive Review of Secondary Carbon Bio-Carriers for Application in Metallurgical Processes: Utilization of Torrefied Biomass in Steel Production. Metals 2022, 12, 2005. [Google Scholar] [CrossRef]
- Kieush, L.; Schenk, J.; Koveria, A.; Rantitsch, G.; Hrubiak, A.; Hopfinger, H. Utilization of Renewable Carbon in Electric Arc Furnace-Based Steel Production: Comparative Evaluation of Properties of Conventional and Non-Conventional Carbon-Bearing Sources. Metals 2023, 13, 722. [Google Scholar] [CrossRef]
- DiGiovanni, C.; Li, D.; Ng, K.W.; Huang, X. Ranking of Injection Biochar for Slag Foaming Applications in Steelmaking. Metals 2023, 13, 1003. [Google Scholar] [CrossRef]
- Ismail, A.N.; Yunos, N.F.D.M.; Rajeswari, M.S.R.; Idris, M.A. Production of Metallic Iron from Electric Arc Furnace (EAF) Slag Using Palm Shells Char/Coke Blends. In Proceedings of the AIP Conference Proceedings, Arau, Malaysia, 3 May 2021; p. 020202. [Google Scholar]
- Sahajwalla, V. Recycling Waste Plastics in EAF Steelmaking: Carbon/Slag Interactions of HDPE-Coke Blends. Steel Res. Int. 2009, 80, 535–543. [Google Scholar] [CrossRef]
- Kongkarat, S.; Khanna, R.; Koshy, P.; O’kane, P.; Sahajwalla, V. Recycling Waste Polymers in EAF Steelmaking: Influence of Polymer Composition on Carbon/Slag Interactions. ISIJ Int. 2012, 52, 385–393. [Google Scholar] [CrossRef]
- Zaharia, M.; Sahajwalla, V.; Kim, B.-C.; Khanna, R.; Saha-Chaudhury, N.; O’Kane, P.; Dicker, J.; Skidmore, C.; Knights, D. Recycling of Rubber Tires in Electric Arc Furnace Steelmaking: Simultaneous Combustion of Metallurgical Coke and Rubber Tyres Blends. Energy Fuels 2009, 23, 2467–2474. [Google Scholar] [CrossRef]
- Maroufi, S.; Mayyas, M.; Mansuri, I.; O’Kane, P.; Skidmore, C.; Jin, Z.; Fontana, A.; Sahajwalla, V. Study of Reaction Between Slag and Carbonaceous Materials. Met. Mater. Trans. B 2017, 48, 2316–2323. [Google Scholar] [CrossRef]
- Yunos, N.F.M.; Zaharia, M.; Idris, M.A.; Nath, D.; Khanna, R.; Sahajwalla, V. Recycling Agricultural Waste from Palm Shells during Electric Arc Furnace Steelmaking. Energy Fuels 2012, 26, 278–286. [Google Scholar] [CrossRef]
- Fidalgo, B.; Berrueco, C.; Millan, M. Chars from Agricultural Wastes as Greener Fuels for Electric Arc Furnaces. J. Anal. Appl. Pyrolysis 2015, 113, 274–280. [Google Scholar] [CrossRef]
- Huang, X.-A.; Ng, K.W.; Giroux, L.; Duchesne, M. Carbonaceous Material Properties and Their Interactions with Slag During Electric Arc Furnace Steelmaking. Met. Mater. Trans. B 2019, 50, 1387–1398. [Google Scholar] [CrossRef]
- Echterhof, T. Review on the Use of Alternative Carbon Sources in EAF Steelmaking. Metals 2021, 11, 222. [Google Scholar] [CrossRef]
- Heo, J.H.; Park, J.H. Assessment of Physicochemical Properties of Electrical Arc Furnace Slag and Their Effects on Foamability. Met. Mater Trans. B 2019, 50, 2959–2968. [Google Scholar] [CrossRef]
- Stadler, S.A.C.; Eksteen, J.J.; Aldrich, C. Physical Modelling of Slag Foaming in Two-Phase and Three-Phase Systems in the Churn-Flow Regime. Miner. Eng. 2006, 19, 237–245. [Google Scholar] [CrossRef]
- Matsuura, H.; Manning, C.P.; Fortes, R.A.F.O.; Fruehan, R.J. Development of a Decarburization and Slag Formation Model for the Electric Arc Furnace. ISIJ Int. 2008, 48, 1197–1205. [Google Scholar] [CrossRef]
- Fruehan, R.J.; Goldstein, D.; Sarma, B.; Story, S.R.; Glaws, P.C.; Pasewicz, H.U. Recent Advances in the Fundamentals of the Kinetics of Steelmaking Reactions. Met. Mater Trans. B 2000, 31, 891–898. [Google Scholar] [CrossRef]
- Hong, L.; Hirasawa, M.; Sano, M. Behavior of Slag Foaming with Reduction of Iron Oxide in Molten Slags by Graphite. ISIJ Int. 1998, 38, 1339–1345. [Google Scholar] [CrossRef]
- Xiang, J.; Wang, X.; Yang, M.; Wang, J.; Shan, C.; Fan, G.; Qiu, G.; Lv, X. Slag-Foaming Phenomenon Originating from Reaction of Titanium-Bearing Blast Furnace Slag: Continuous Monitoring of Foaming Height and Calibration. J. Mater. Res. Technol. 2021, 11, 1184–1192. [Google Scholar] [CrossRef]
- Kieush, L.; Schenk, J.; Pfeiffer, A.; Koveria, A.; Rantitsch, G.; Hopfinger, H. Investigation on the Influence of Wood Pellets on the Reactivity of Coke with CO2 and Its Microstructure Properties. Fuel 2022, 309, 122151. [Google Scholar] [CrossRef]
- Bazaluk, O.; Kieush, L.; Koveria, A.; Schenk, J.; Pfeiffer, A.; Zheng, H.; Lozynskyi, V. Metallurgical Coke Production with Biomass Additives: Study of Biocoke Properties for Blast Furnace and Submerged Arc Furnace Purposes. Materials 2022, 15, 1147. [Google Scholar] [CrossRef]
- Kieush, L.; Boyko, M.; Koveria, A.; Yaholnyk, M.; Poliakova, N. Manganese Sinter Production with Wood Biomass Application. KEM 2020, 844, 124–134. [Google Scholar] [CrossRef]
- Sahajwalla, V.; Zaharia, M.; Kongkarat, S.; Khanna, R.; Rahman, M.; Saha-Chaudhury, N.; O’Kane, P.; Dicker, J.; Skidmore, C.; Knights, D. Recycling End-of-Life Polymers in an Electric Arc Furnace Steelmaking Process: Fundamentals of Polymer Reactions with Slag and Metal. Energy Fuels 2012, 26, 58–66. [Google Scholar] [CrossRef]
- Almeida, R.A.M.D.; Vieira, D.; Bielefeldt, W.V.; Vilela, A.C.F. MgO Saturation Analisys of CaO-SiO2-FeO-MgO-Al2O3 Slag System. Mat. Res. 2017, 21, 1–8. [Google Scholar] [CrossRef]
- Luz, A.P.; Vivaldini, D.O.; López, F.; Brant, P.O.R.C.; Pandolfelli, V.C. Recycling MgO–C Refractories and Dolomite Fines as Slag Foaming Conditioners: Experimental and Thermodynamic Evaluations. Ceram. Int. 2013, 39, 8079–8085. [Google Scholar] [CrossRef]
- Chang, Y.-E.; Lin, C.-M.; Shen, J.-M.; Chang, W.-T.; Wu, W. Effect of MgO Content on the Viscosity, Foaming Life, and Bonding in Liquid and Liquid/Solid CaO-SiO2-MgO-5Al2O3-30FeO Slags. Metals 2021, 11, 249. [Google Scholar] [CrossRef]
- Pretorius, E.; Carlisle, R.C. Foamy Slag Fundamentals and Their Practical Application to Electric Furnace Steelmaking. Iron Steelmak. 1999, 26, 79–88. [Google Scholar]
- Aldon, L.; Jumas, J.-C. Lithium-Induced Conversion Reaction in Wüstite Fe1−xO Studied by 57Fe Mössbauer Spectroscopy. Solid State Sci. 2012, 14, 354–361. [Google Scholar] [CrossRef]
- Bazaluk, O.; Hrubiak, A.; Moklyak, V.; Moklyak, M.; Kieush, L.; Rachiy, B.; Gasyuk, I.; Yavorskyi, Y.; Koveria, A.; Lozynskyi, V.; et al. Structurally Dependent Electrochemical Properties of Ultrafine Superparamagnetic ‘Core/Shell’ γ-Fe2O3/Defective α-Fe2O3 Composites in Hybrid Supercapacitors. Materials 2021, 14, 6977. [Google Scholar] [CrossRef]
- Cornell, R.M.; Schwertmann, U. The Iron Oxides: Structure, Properties, Reactions, Occurences and Uses, 1st ed.; Wiley: Hoboken, NJ, USA, 2003; ISBN 978-3-527-30274-1. [Google Scholar]
- Ajinkya, N.; Yu, X.; Kaithal, P.; Luo, H.; Somani, P.; Ramakrishna, S. Magnetic Iron Oxide Nanoparticle (IONP) Synthesis to Applications: Present and Future. Materials 2020, 13, 4644. [Google Scholar] [CrossRef]


| FeO, wt.% | SiO2, wt.% | Al2O3, wt.% | MgO, wt.% | CaO, wt.% | B2 | B3 | g/cm3 | s | ||
|---|---|---|---|---|---|---|---|---|---|---|
| 28.0 | 19.4 | 9.1 | 11.9 | 31.6 | 1.6 | 1.1 | 3.44 | 0.0382 | 0.568 | 0.863 |
| Elements | wt.% |
|---|---|
| C | 0.007 |
| Fe | 99.6 |
| Characteristics | Anth | CPC | Coke1 | Coke2 | Coke3 | Bch |
|---|---|---|---|---|---|---|
| Proximate analysis (wt.%) | ||||||
| M | 5.91 | 0.75 | 1.04 | 0.82 | 0.78 | 2.67 |
| VM (db) | 3.69 | 0.44 | 1.42 | 0.95 | 0.74 | 39.28 |
| VM (daf) | 4.12 | 0.45 | 1.57 | 1.03 | 0.80 | 41.04 |
| Ash (db) | 10.50 | 0.90 | 10.88 | 11.03 | 11.09 | 4.29 |
| Elemental analysis (wt.%) | ||||||
| S (db) | 0.48 | 0.62 | 0.77 | 0.56 | 0.59 | n.d. |
| C (db) | 82.58 | 97.01 | 86.25 | 86.50 | 86.55 | 72.74 |
| H (db) | 2.19 | 0.26 | 0.29 | 0.23 | 0.21 | 4.62 |
| N (db) | 0.97 | 0.94 | 1.21 | 1.15 | 1.11 | 0.24 |
| * Others, mainly O (db) | 3.28 | 0.27 | 0.6 | 0.53 | 0.45 | 18.11 |
| Cfix (db) | 85.81 | 98.66 | 87.70 | 88.02 | 88.17 | 56.43 |
| Characteristics of microstructural parameter (nm) | ||||||
| Lc | 2.08 | 1.58 | 1.86 | 1.56 | 1.32 | 0.69 |
| Calculated Slag Height hcalc, cm | Calculated Slag Volume Vcalc, cm3 |
|---|---|
| 0.93 | 29.1 |
| Sample | Experimental Slag Height Mean hslag, cm | std | Experimental Slag Volume Mean Vslag, cm3 | Std | Foam Height Mean hfoam, cm | std | Foam Volume Mean Vfoam, cm3 | Std | Relative Foaming Height Mean Δh/h0 | Gas Fraction Mean Xgas |
|---|---|---|---|---|---|---|---|---|---|---|
| SF (Anth) | 0.95 | 0.05 | 30 | 1.5 | 8.7 | 0.8 | 272.1 | 23.6 | 8.2 | 0.89 |
| SF (CPC) | 8.3 | 0.2 | 260.5 | 5.3 | 7.8 | 0.88 | ||||
| SF (Coke1) | 8.3 | 0.3 | 259.9 | 9.2 | 7.7 | 0.89 | ||||
| SF (Coke2) | 8.9 | 0.3 | 277.7 | 9.2 | 8.4 | 0.89 | ||||
| SF (Coke3) | 8.1 | 0.2 | 254.5 | 5.8 | 7.6 | 0.88 | ||||
| SF (Bch) | 6.5 | 0.3 | 201.9 | 9.0 | 5.8 | 0.85 | ||||
| SF (Coke1:Bch 50 wt.%:50 wt.%) | 8.7 | 0.1 | 271.8 | 3.9 | 8.2 | 0.89 |
| Sample | Fetot | Fe2+ | SiO2 | CaO | Al2O3 | MgO | B2 |
|---|---|---|---|---|---|---|---|
| SF (Anth) | 17.66 | 15.14 | 16.73 | 32.98 | 17.26 | 5.51 | 1.9 |
| SF (CPC) | 16.60 | 16.32 | 17.67 | 31.48 | 18.03 | 7.21 | 1.8 |
| SF (Coke1) | 16.71 | 16.37 | 16.88 | 30.79 | 16.95 | 7.13 | 1.8 |
| SF (Coke2) | 15.49 | 15.39 | 18.89 | 32.96 | 17.69 | 7.51 | 1.7 |
| SF (Coke3) | 19.21 | 18.99 | 17.05 | 29.72 | 17.55 | 6.90 | 1.7 |
| SF (Bch) | 13.97 | 11.57 | 18.90 | 33.03 | 17.49 | 6.88 | 1.7 |
| SF (Coke1:Bch) | 20.60 | 19.60 | 14.09 | 30.00 | 12.45 | 9.80 | 2.1 |
| Sample | Fetot | Fe2+ | SiO2 | CaO | Al2O3 | MgO | B2 |
|---|---|---|---|---|---|---|---|
| SF (Anth) | 23.72 | 23.67 | 15.77 | 28.89 | 15.10 | 6.97 | 1.8 |
| SF (CPC) | 18.92 | 16.06 | 15.69 | 30.90 | 15.96 | 6.73 | 1.9 |
| SF (Coke1) | 18.57 | 16.01 | 16.20 | 31.20 | 17.00 | 6.44 | 1.9 |
| SF (Coke2) | 17.69 | 17.14 | 17.68 | 31.37 | 16.99 | 7.39 | 1.8 |
| SF (Coke3) | 18.76 | 16.26 | 15.93 | 29.89 | 16.56 | 6.50 | 1.9 |
| SF (Bch) | 34.10 | 31.72 | 12.13 | 23.18 | 14.16 | 5.15 | 1.9 |
| SF (Coke1:Bch) | 21.12 | 20.00 | 12.36 | 28.07 | 14.64 | 10.66 | 2.3 |
| Sample | Relative amount ∆FeOtop, wt.% | Relative amount ∆FeObottom, wt.% |
|---|---|---|
| SF (Anth) | 45.9 | 15.5 |
| SF (CPC) | 41.7 | 42.6 |
| SF (Coke1) | 41.5 | 42.8 |
| SF (Coke2) | 45.0 | 38.8 |
| SF (Coke3) | 32.2 | 41.9 |
| SF (Bch) | 58.7 | n.a. |
| SF (Coke1:Bch) | 30.0 | 28.6 |
| Sample | Component | IS, mm·s−1 | QS, mm·s−1 | H, Tesla | Relative intensity (%) | G, mm·s−1 | Interpretation |
|---|---|---|---|---|---|---|---|
| SF (Anth) | Doublet1 (Fe2+) | 0.99 | 0.87 | 0 | 76 | 0.57 | Fe(II)O6 |
| Doublet2 (Fe2+) | 1.07 | 0.71 | 0 | 24 | 0.25 | Fe(II)O6 | |
| SF (CPC) | Doublet1 (Fe2+) | 1.02 | 0.77 | 0 | 94 | 0.46 | Fe(II)O6 |
| Doublet2 (Fe2+) | 1.22 | 1.02 | 0 | 6 | 0.17 | Fe(II)O6 | |
| SF (Coke1) | Doublet1 (Fe2+) | 1.01 | 0.77 | 0 | 84 | 0.47 | Fe(II)O6 |
| Doublet2 (Fe2+) | 1.17 | 0.81 | 0 | 16 | 0.24 | Fe(II)O6 | |
| SF (Coke2) | Doublet1 (Fe2+) | 0.95 | 0.80 | 0 | 71 | 0.49 | Fe(II)O6 |
| Doublet2 (Fe2+) | 1.12 | 0.76 | 0 | 29 | 0.29 | Fe(II)O6 | |
| SF (Coke3) | Doublet1 (Fe2+) | 1.02 | 0.91 | 0 | 74 | 0.46 | Fe(II)O6 |
| Doublet2 (Fe2+) | 1.06 | 0.57 | 0 | 26 | 0.25 | Fe(II)O6 | |
| SF (Bch) | Doublet1 (Fe2+) | 1.00 | 0.81 | 0 | 89 | 0.42 | Fe(II)O6 |
| Doublet2 (Fe2+) | 1.15 | 0.74 | 0 | 11 | 0.17 | Fe(II)O6 | |
| SF (Coke1:Bch) | Doublet1 (Fe2+) | 1.03 | 0.89 | 0 | 78 | 0.49 | Fe(II)O6 |
| Doublet2 (Fe2+) | 1.06 | 0.57 | 0 | 22 | 0.24 | Fe(II)O6 |
| Sample | O | Mg | Al | Si | Ca | Fe |
|---|---|---|---|---|---|---|
| SF (Anth) | 35.98 | 4.11 | 11.67 | 8.70 | 21.85 | 17.70 |
| SF (CPC) | 36.30 | 4.42 | 8.37 | 10.57 | 23.76 | 16.58 |
| SF (Coke1) | 38.80 | 4.76 | 10.94 | 10.71 | 23.57 | 11.22 |
| SF (Coke2) | 38.63 | 3.82 | 8.79 | 10.32 | 23.06 | 15.39 |
| SF (Coke3) | 37.38 | 4.54 | 9.73 | 10.10 | 23.96 | 14.29 |
| SF (Bch) | 37.21 | 3.17 | 10.26 | 9.93 | 24.12 | 15.31 |
| SF (Coke1:Bch) | 38.18 | 4.63 | 9.48 | 10.77 | 25.52 | 11.42 |
Disclaimer/Publisher’s Note: The statements, opinions and data contained in all publications are solely those of the individual author(s) and contributor(s) and not of MDPI and/or the editor(s). MDPI and/or the editor(s) disclaim responsibility for any injury to people or property resulting from any ideas, methods, instructions or products referred to in the content. |
© 2023 by the authors. Licensee MDPI, Basel, Switzerland. This article is an open access article distributed under the terms and conditions of the Creative Commons Attribution (CC BY) license (https://creativecommons.org/licenses/by/4.0/).
Share and Cite
Kieush, L.; Schenk, J.; Koveria, A.; Hrubiak, A.; Hopfinger, H.; Zheng, H. Evaluation of Slag Foaming Behavior Using Renewable Carbon Sources in Electric Arc Furnace-Based Steel Production. Energies 2023, 16, 4673. https://doi.org/10.3390/en16124673
Kieush L, Schenk J, Koveria A, Hrubiak A, Hopfinger H, Zheng H. Evaluation of Slag Foaming Behavior Using Renewable Carbon Sources in Electric Arc Furnace-Based Steel Production. Energies. 2023; 16(12):4673. https://doi.org/10.3390/en16124673
Chicago/Turabian StyleKieush, Lina, Johannes Schenk, Andrii Koveria, Andrii Hrubiak, Horst Hopfinger, and Heng Zheng. 2023. "Evaluation of Slag Foaming Behavior Using Renewable Carbon Sources in Electric Arc Furnace-Based Steel Production" Energies 16, no. 12: 4673. https://doi.org/10.3390/en16124673
APA StyleKieush, L., Schenk, J., Koveria, A., Hrubiak, A., Hopfinger, H., & Zheng, H. (2023). Evaluation of Slag Foaming Behavior Using Renewable Carbon Sources in Electric Arc Furnace-Based Steel Production. Energies, 16(12), 4673. https://doi.org/10.3390/en16124673