Article

Landfill Biogas Recovery and Its Contribution to Greenhouse Gas Mitigation

by
Dek Vimean Pheakdey
1,2,
Vongdala Noudeng
1,3 and
Tran Dang Xuan
1,4,*
1
Graduate School of Advanced Science and Engineering, Hiroshima University, 1-5-1 Kagamiyama, Higashi-Hiroshima 739-8529, Japan
2
Department of Hazardous Substances Management, Ministry of Environment, Phnom Penh 120101, Cambodia
3
Ministry of Natural Resources and Environment, Dongnasok-Nong Beuk Road, P.O. Box 7864, Vientiane 0117, Laos
4
Center for the Planetary Health and Innovation Science (PHIS), The IDEC Institute, Hiroshima University, 1-5-1 Kagamiyama, Higashi-Hiroshima 739-8529, Japan
*
Author to whom correspondence should be addressed.
Energies 2023, 16(12), 4689; https://doi.org/10.3390/en16124689
Submission received: 25 April 2023 / Revised: 12 June 2023 / Accepted: 12 June 2023 / Published: 13 June 2023

Abstract

:
This study assesses the biomethane (CH4) generation and greenhouse gas (GHG) emissions resulting from municipal solid waste landfilling in Phnom Penh, Cambodia, with a focus on the impact of fugitive CH4 emissions and operation processes in four landfilling scenarios: simple dumping (S1), improved management with leachate treatment (S2), engineered landfill with flaring (S3), and engineered landfill with energy recovery (S4). The study also considered the environmental benefits of carbon sequestration and landfill gas utilization. The LandGEM and IPCC FOD models were used to calculate CH4 generation over the period of 2009–2022, and it was found that approximately 18 and 21 M kg/year of CH4 were released, respectively. The energy potential from CH4 recovery was 51–61 GWh/year. Overall, GHG emissions in S2 were the highest, amounting to 409–509 M kg CO2-eq/year, while S1 had lower emissions at 397–496 M kg CO2-eq/year. Flaring-captured CH4 in S3 could reduce GHG emissions by at least 55%, and using captured CH4 for electricity production in S4 could mitigate at least 83% of GHG emissions. Electricity recovery (S4) could avoid significant amounts of GHG emissions (−52 to −63 kg CO2-eq/tMSW). The study suggests that landfill gas-to-energy could significantly reduce GHG emissions.

1. Introduction

Landfilling remains a widely used method for disposing of municipal solid waste (MSW). Under anaerobic conditions, biodegradable wastes in the landfill site decompose over time, generating landfill biogas (LFG) which is primarily composed of methane (CH4) and carbon dioxide (CO2), as well as a small proportion of non-methane organic compounds (NMOCs) [1,2]. Fugitive CH4 emissions from disposal sites have a high global warming potential (GWP), accounting for approximately 5% of the world’s anthropogenic greenhouse gases (GHGs) [3]. CO2 emitted from landfills originates from biogenic sources and is not considered a GHG [4]. LFG generation varies depending on factors such as the physical composition, permeability, moisture, temperatures, and landfill management practices [5,6]. Some countries have implemented regulations on landfill management to mitigate the negative impacts on the environment, including the installation of LFG collection systems, separation of organic waste, and the application of soil covers to enhance bio-oxidation of CH4 [7]. Denmark, for example, has implemented various methods for LFG management, such as using CH4 for electric energy and heat, flaring, microbial oxidation of CH4, and the construction of biofilters, as regulated by their government [8]. In the USA, the Clean Air Act requires certain landfills to install and operate a gas collection and control system. As a result, many landfill owners voluntarily collect LFG for flaring for use as a renewable energy resource. In 2021, there were 550 LFG-to-energy projects operating in the USA for producing electricity (70%), direct use (17%), and use as renewable natural gas (RNG) (13%) [9]. In the United Kingdom (UK), the emission of LFG accounts for approximately 20% of the country’s total CH4 emissions, and the UK government has a regulated GHG emissions policy (WMP 27) which includes measures such as increasing the use of enclosed flares, improving LFG collection efficiency, and increasing the number of LFG utilization projects [10]. However, even with a highly effective LFG collection system in place, some amount of LFG is still released [11] through processes such as the bio-oxidation of CH4 when the landfill surface is covered by soil, leakage of the LFG collection system, and the leachate collection system [1]. Collecting the LFG generated from landfill sites for flaring or energy purposes can help reduce fugitive CH4 emissions, thereby reducing direct GHG emissions associated with landfill management. Moreover, energy recovery from LFG can replace electricity generated from highly polluting energy sources such as coal and fossil fuels. It is worth noting that not all carbon-containing materials in landfills undergo degradation. Certain waste types, such as paper, cardboard, wood, and garden waste, decompose slowly. As a result, the carbon content in these materials can be stored in landfills for an extended period rather than being emitted into the atmosphere [12,13]. This long-term carbon storage in landfills can be considered as having been sequestrated, resulting in negative emissions. Therefore, they should be included in GHG emissions assessments [14]. These avoided emissions can offset the indirect GHG emissions resulting from landfill operation (e.g., compaction, excavation, and soil cover, which consume diesel), leachate treatment (e.g., water, chemicals, and electricity), and construction (e.g., gravel and synthetic liner) [14]. Studies in European countries have demonstrated that when including GHG emissions savings from LFG recovery and carbon sequestration in quantification models, the net GHG emissions reduced to zero or even negative values in conventional landfills [15].
In Cambodia, rapid urbanization, coupled with socio-economic development and population growth, has led to a significant increase in MSW generation. The lack of treatment infrastructure, technology, and management has exacerbated the environmental burden of MSW, particularly in major cities such as Phnom Penh. Numerous landfills have been created to accommodate the excessive increase in MSW volumes. Phnom Penh is facing a rapid increase in waste disposal due to its status as the most developed city in Cambodia, which poses significant challenges. MSW generation in the Phnom Penh municipality accounts for approximately one quarter of the total generation nationwide [16]. In 2022, an average of 3538 tMSW was collected daily and sent to a landfill without intermediate treatment. The waste fraction consisting of organic matter with high moisture content was the most predominant component disposed of at the landfill, accounting for approximately 56% of the total waste [17]. The degradation of carbon content in degradable wastes poses a high potential risk, including increased global warming through GHG emissions, soil contamination, surface water and groundwater pollution, human health risks through disease spreading, and fire and explosion hazards by LFG [12,18]. It is important to note that the current landfill is operating without leachate treatment and LFG capture systems, which are found in most cities in Cambodia.
MSW landfills in Cambodia are currently undergoing improvement as a result of economic growth and increased environmental awareness among the population. The extraction and treatment of LFG are becoming increasingly important in landfill management in the country. Therefore, data on LFG emissions are essential for developing policies to mitigate the environmental impacts of landfills and designing LFG-to-electricity projects. This study aimed to quantify GHG emissions resulting from MSW landfilling in the Phnom Penh municipality over a 14-year period (2009–2022), taking into account four different landfill management options.

2. Landfill Gas Generation Investigation Approaches

Several methods have been developed to evaluate LFG generation from disposal sites, including field measurement methods and mathematical models. Field measurement methods, such as flux chambers, tracer gases technique, horizontal radial plume mapping optical remote sensing (HRPM ORS), the inverse modeling technique, differential absorption light detection and ranging (LiDAR), micrometeorological eddy covariance (EC), and helicopter-borne spectroscopy, have been used to investigate CH4 collection and fugitive CH4 emissions from landfills [19]. However, these methods are time-consuming and costly and have some uncertainties when used to measure large-scale landfills due to the spatial and temporal fluctuations in methane flow balance components [1]. Sample site selection and uncontrolled leakage may also lead to uncertainty in on-site measurements [20].
Mathematical models have been developed to estimate LFG emissions based on waste disposal data, waste composition, moisture content, landfill cover material, and LFG collection [21]. A significant number of models have been developed which have drawn the attention of many researchers in the industry, including but not limited to the IPCC default model, Modified Triangular method (MTM), Dutch Multiphase first-order model, AMPM, GASSFILL, Scholl Canyon first-order model, Rettenberger first-order model, E-PLUS model, Zero-order German EPER model, IPCC first-order model, US EPA Landfill Gas Emissions Model (LandGEM), Afvalzorg model, and Gassim [22]. Among those, LandGEM is widely used for assessing the LFG and other air pollutants from the decomposition of landfilled waste. The model was first developed in 2005 by the US EPA based on a first-order decay (FOD) rate [23]. Users can either input the site-specific data or use the default value if the site-specific data are not available. The default data are based on the empirical data of various landfills in the USA. Another model commonly used by many research scholars is the IPCC model, which consists of two methods for quantifying GHG emissions from solid waste disposal sites [4]. The Tier 1 method of the IPCC model estimates the CH4 emissions from the mass balance of waste. Tier 2 utilizes the FOD method, which produces a high accuracy of the estimated results. Hence, the FOD model is recommended to estimate CH4 emissions. The model estimates CH4 emissions based on waste compositions and assumes a slow degradation of organic matter over time. Challenges regarding the accuracy of the models have been raised in relation to the input parameters, which include the amount of waste, the physical composition of landfilled waste, moisture content, temperature, and lag time in gas generation [1]. However, the models have more advantages compared to field measurement methods when investigating CH4 emissions in large-scale landfills [1].

3. Materials and Methods
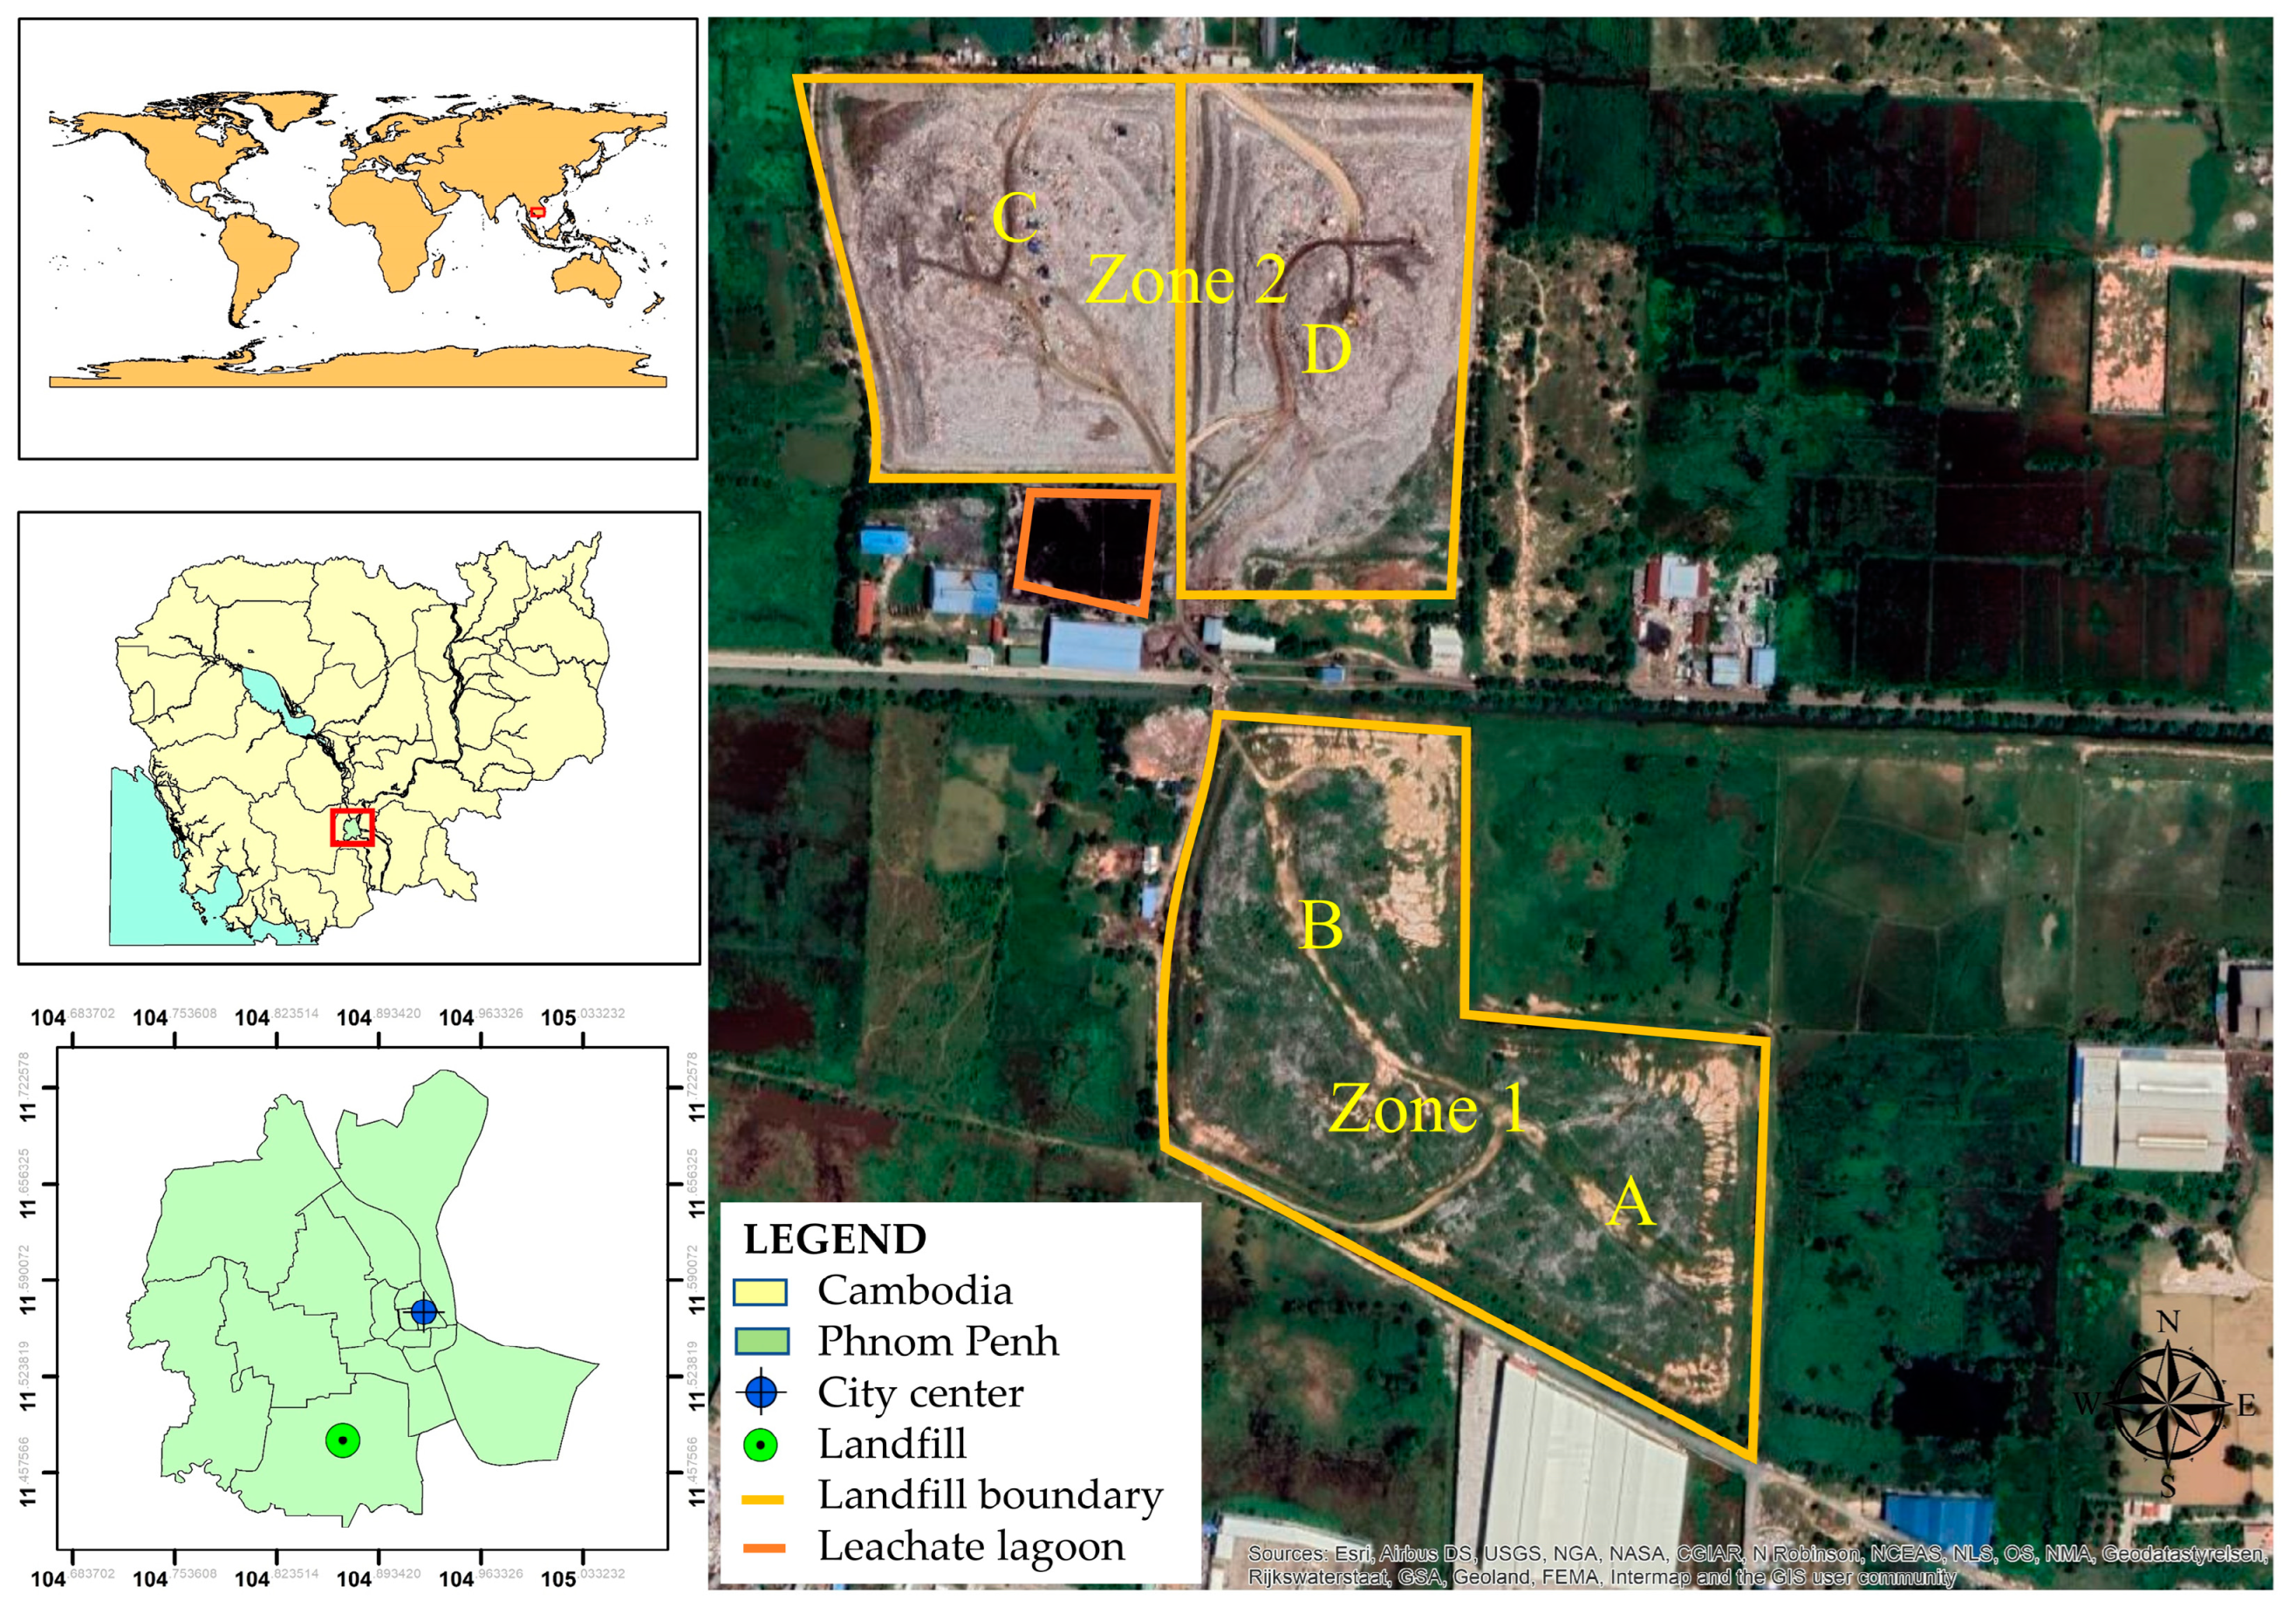
3.1. Study Area

In 2019, the population of Phnom Penh municipality was 2,281,951 [24]. The Dangkao landfill is currently the only active MSW landfill in the city, operating since July 2009. The landfill is located approximately 18 km south of Phnom Penh (11°28′29″ N and 104°53′11″ E), covering an area of 31.4 ha which is divided into two zones: Zone 1 (consisting of blocks A and B) with a pit depth of 10 m, and Zone 2 (including blocks C and D) with the deepest pit depth of 30 m below the ground surface [25] (Figure 1). Zone 1 was closed and covered with soil in February 2016, while Zone 2 is in operation and partially covered with soil.

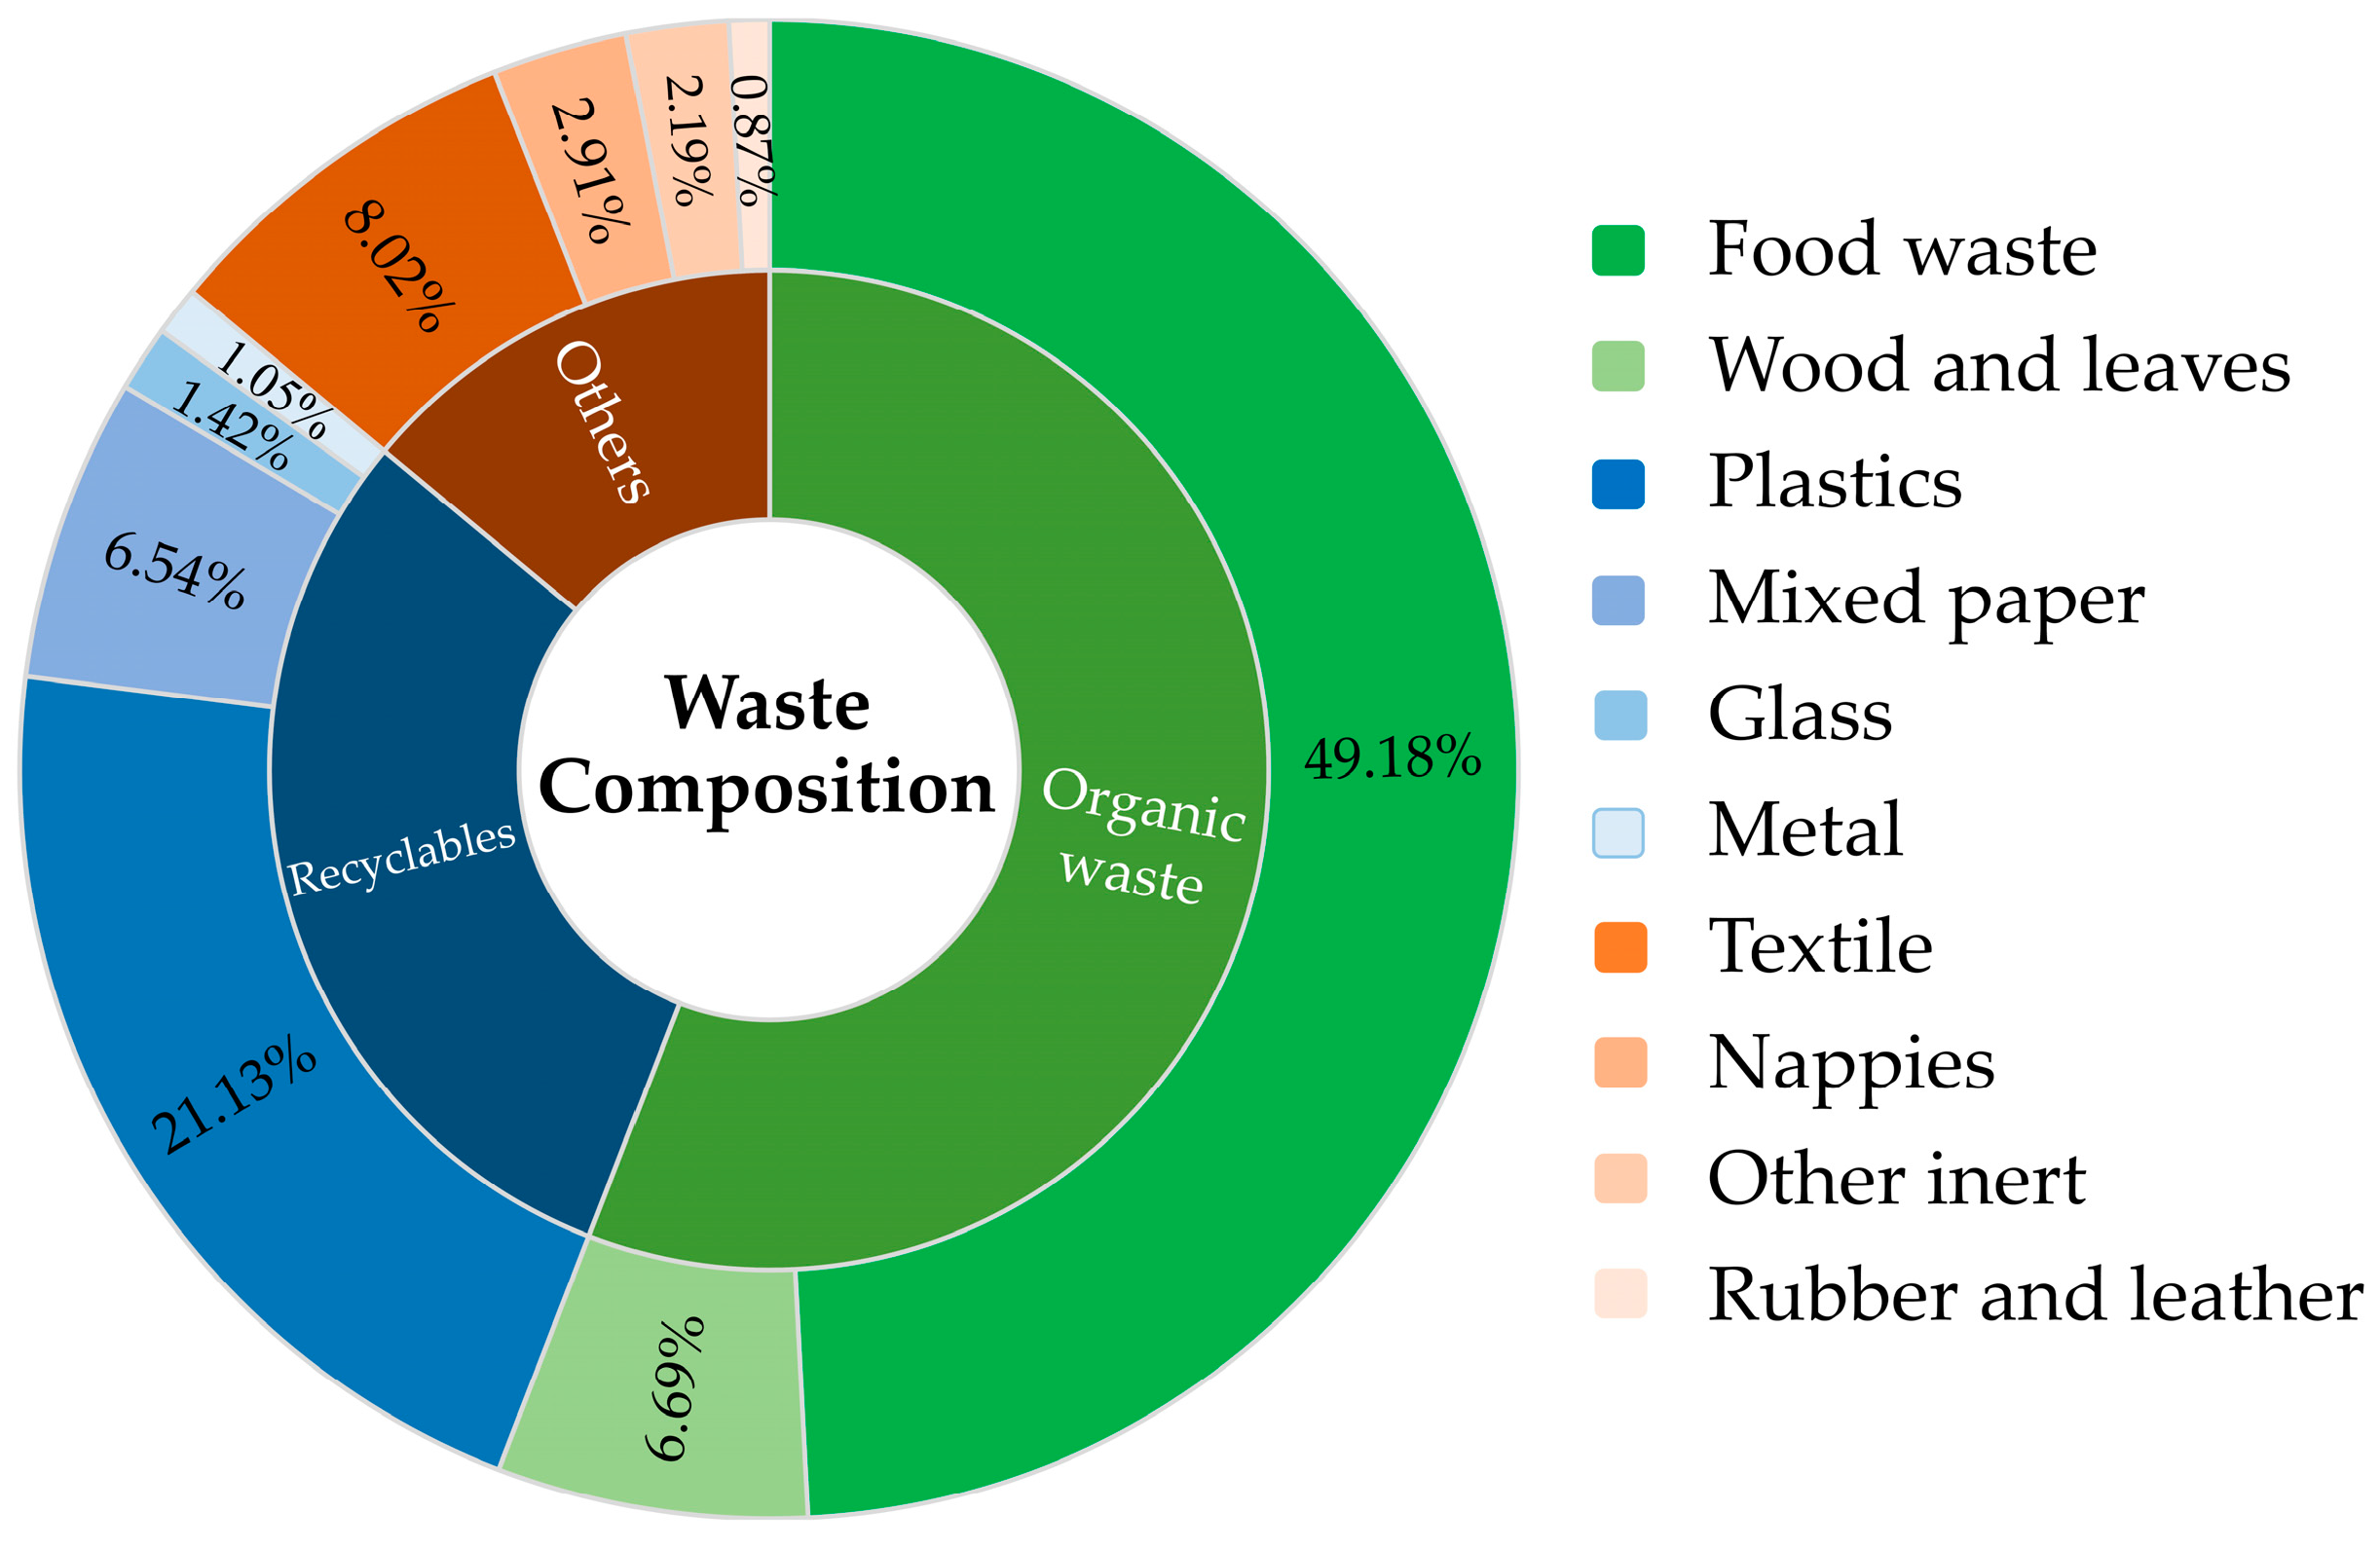
3.2. Data Collection

The data on landfilled waste were obtained from the Dangkao landfill office for a period of 14 years, from 2009 to 2022. The historical waste disposal data were used to calculate the landfill gas emissions in the estimation models, namely the LandGEM and IPCC FOD models. Daily records of MSW disposal data were available, which showed a dramatic increase from 177,224 t/year in 2009 to 1,288,223 t/year in 2022, as shown in Table 1. In 2022, the MSW collection rate was estimated at 1.34 kg/capita/day, which increased from 0.70 kg/capita/day in 2009. It is important to note that a significant increase in the amount of waste collected and sent to the landfill occurred until 2020, before declining in 2021 due to a COVID-19 outbreak in the city. However, despite the increase in waste collection in 2020, the per capita collection rate was lower compared to that of 2019. This can be attributed to the high population growth in Phnom Penh, while the progress in waste collection efficiency has been slow.
The physical characteristics of the landfilled waste were taken from [17]. As shown in Figure 2, the organic fraction accounted for the highest proportion of disposed waste, at 55.87%. The second-highest component was recyclables, including plastics (21.13%), mixed paper (6.54%), glass (1.42%), and metals (1.05%).

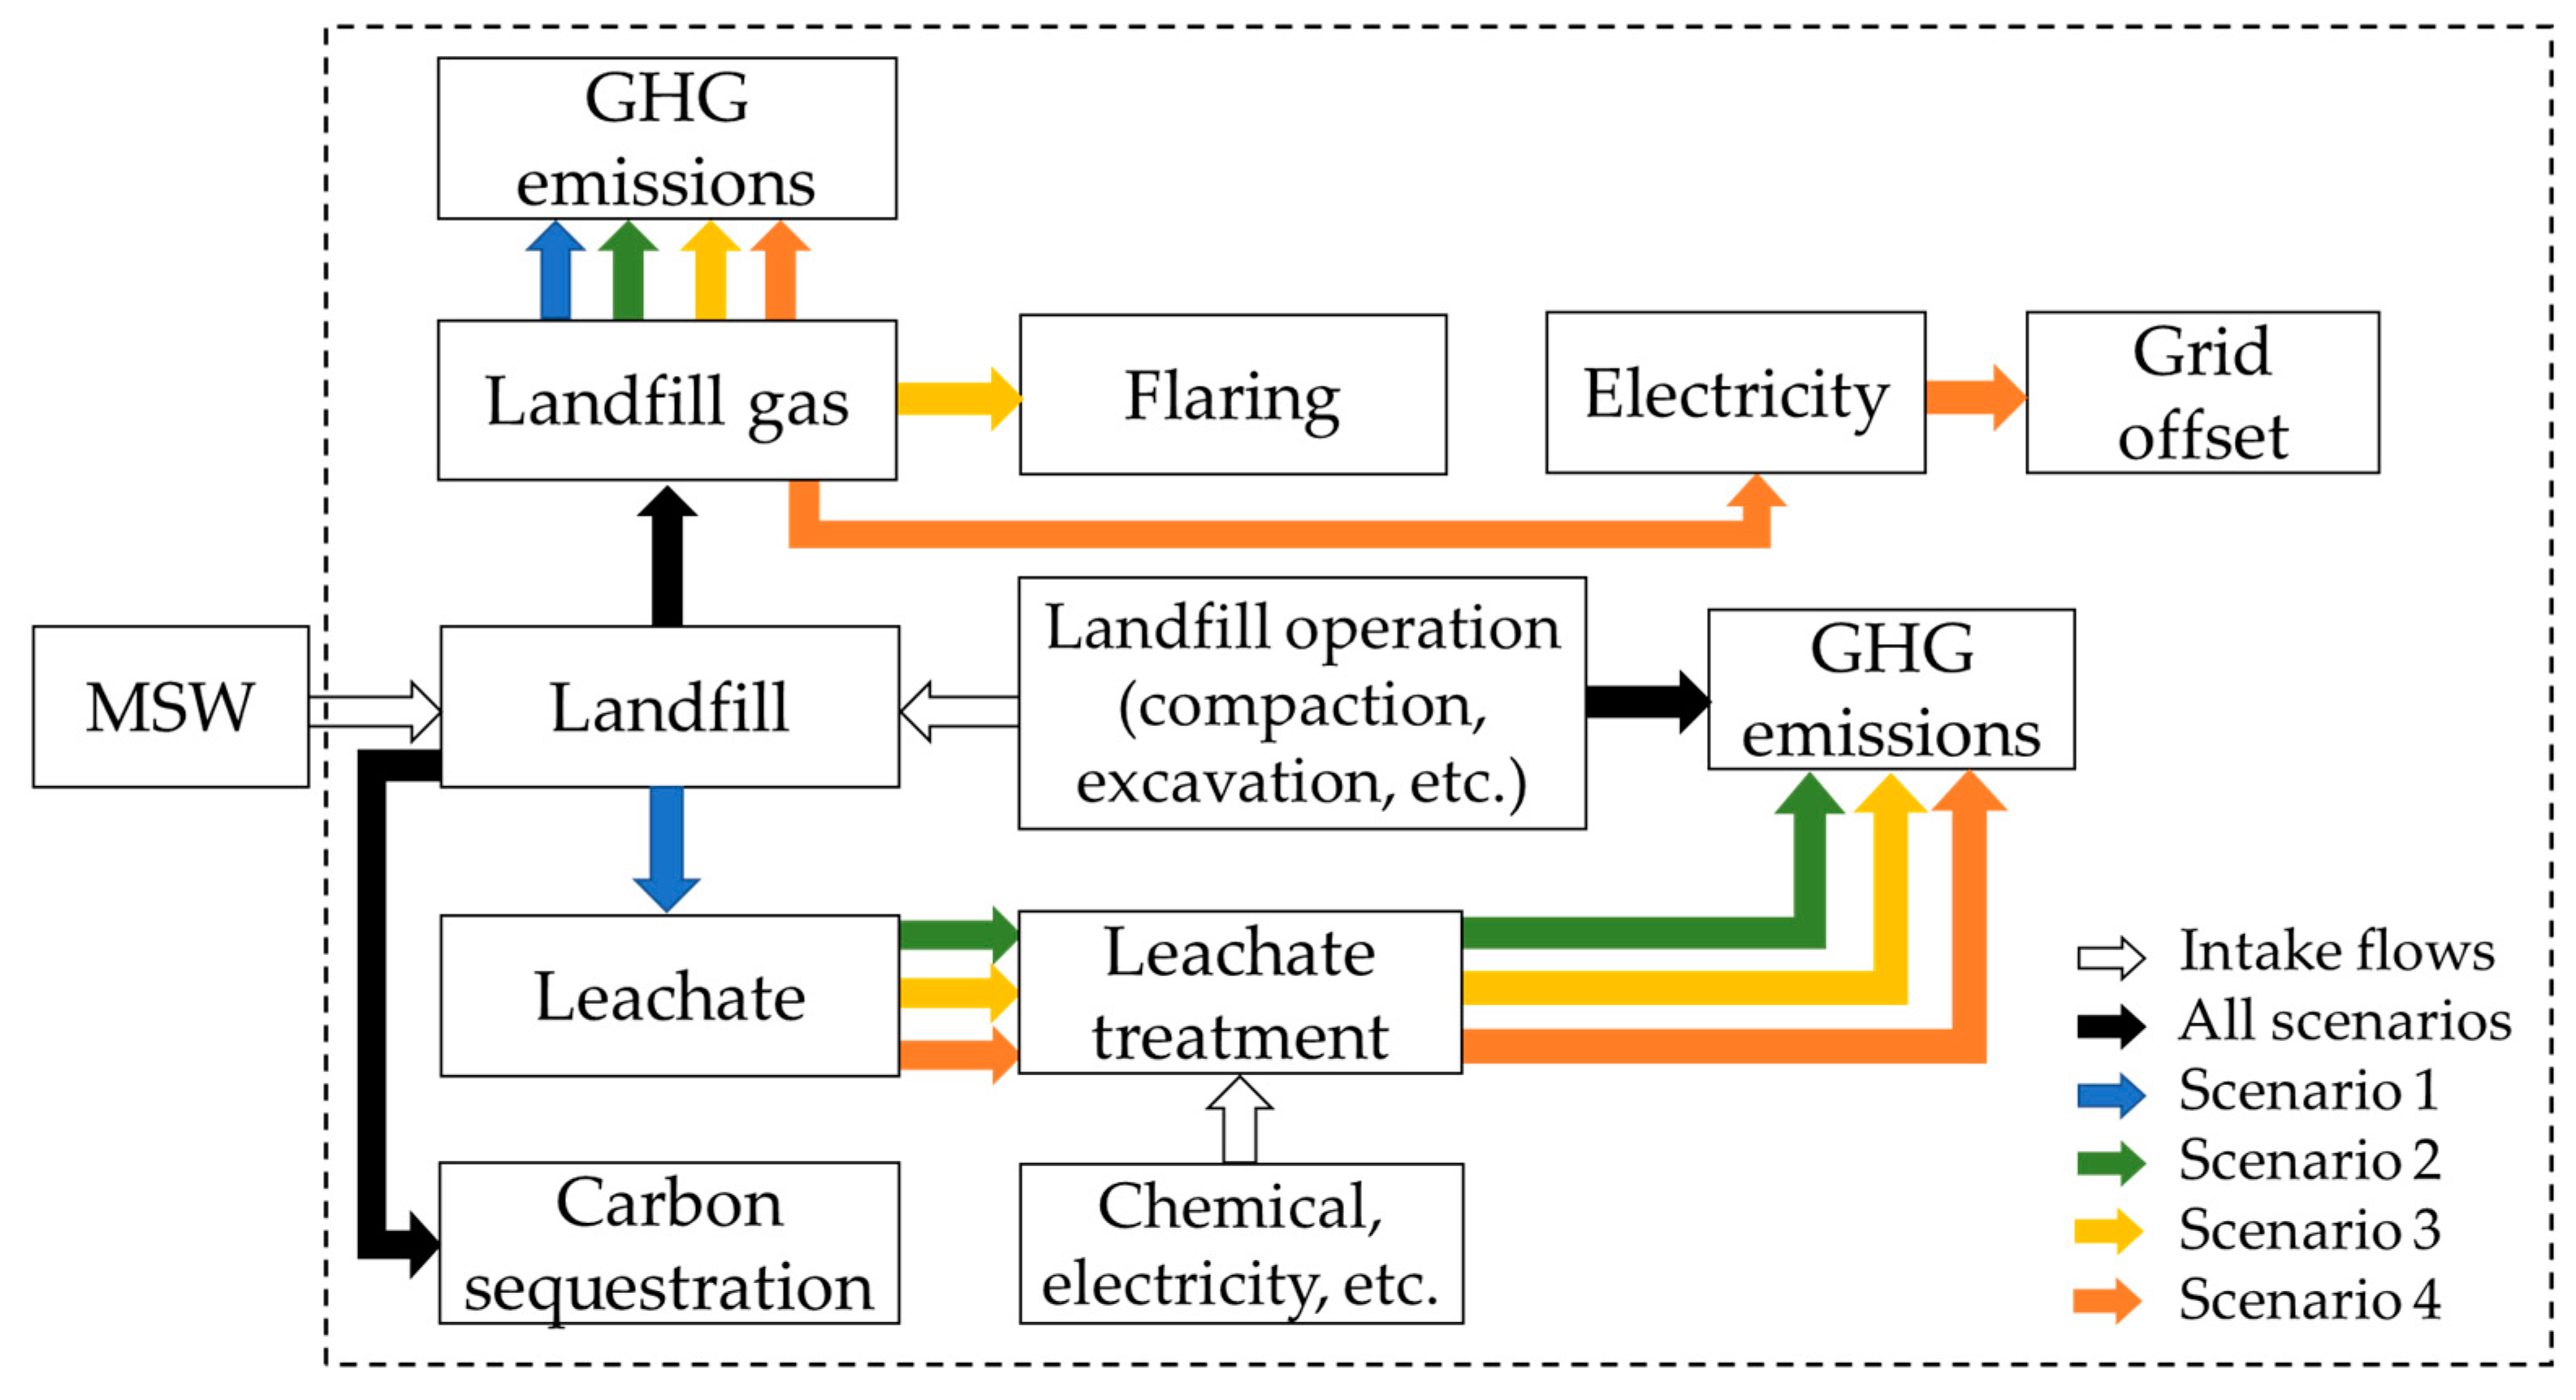
3.3. Landfill Management Scenarios

The management of the Dangkao landfill currently involves a simple dumping method without leachate treatment or LFG collection. This approach may have adverse effects on the environment, including the emission of LFG and the potential contamination of soil, surface water, and groundwater resources through leachate infiltration. Four scenarios were developed to explore different landfill management options (see Figure 3). In scenario 1 (S1), the landfill operates without LFG extraction and leachate treatment. This scenario includes direct fugitive CH4 emissions that are not captured as well as emissions from the fuel used in heavy-duty equipment, such as excavation and compaction. Additionally, the potential carbon sequestration was considered as a means of offsetting GHGs. In scenario 2 (S2), the landfill management remains the same as in S1, but the leachate is collected and treated. This scenario also includes indirect GHG emissions resulting from electricity consumption and chemicals used in the leachate treatment. Scenario 3 (S3) represents an engineered landfill that is more advanced than S2, incorporating flaring, compaction, and frequent soil cover. Hence, GHG emissions under S3 are expected to further reduce by capturing 50% of CH4 for flaring. The optimal scenario is presented in scenario 4 (S4), where LFG is captured and utilized for energy production. The GHG emission quantification under S4 is similar to that in the first three scenarios. However, due to the application of LFG-to-energy technology, the electricity generation can offset the electricity generation from conventional energy sources. Therefore, the reduction in GHG emissions resulting from electricity substitution is accounted for in S4. In the scenario comparison, the study considered the three main GHGs:, non-biogenic CO2, CH4, and N2O, using 100-year GWPs of 1, 25, and 298, respectively [4].

3.4. Calculation of LFG Generation

The landfill CH4 generation was calculated using the LandGEM and IPCC FOD models from 2009 to 2022. Different compositions of landfilled waste can result in varying amounts of CH4 generation due to their carbon content. For example, waste containing cellulose degrades quickly under landfill conditions, while waste containing lignin decomposes slowly or not at all [14]. In this study, only wastes that undergo degradation, such as food waste, wood and leaves, paper, textiles, and nappies, were considered for the model calculation.

3.4.1. LandGEM Model

The landfill CH4 generation was calculated using the US EPA LandGEM 3.03 model. The model estimates CH4 gas based on the FOD approach, as given in Equation (1). The model relies on two key parameters: the CH4 generation rate per year, k, and the CH4 generation potential, L0 (m3/Mg):
Q C H 4 = i = 1 n j = 0.1 1 k × L 0 × M i 10 × e k t i , j
where, QCH4 is the annual methane generation in the year of calculation (t/year), i is the one-year time increment, j is the 0.1-year time increment, n is the duration of waste acceptance at the landfill (year), Mi is mass of waste disposed of in year i (t), and ti,j is the time in year jth section of waste Mi accepted (year).
The calculation for the CH4 generation potential (L0) is shown in Equation (2):
L 0 = M C F × D O C × D O C f × F × 16 12
where MCF is the CH4 correction factor, taken as 0.8 for an unmanaged landfill deeper than 5 m (Table 2); DOC is the degradable organic yielded on the CH4 in landfill gas; DOCf is the fraction of degradable organic carbon which decomposes, taken as 0.77 [4]; F is the fraction of CH4 in landfill gas, taken as 0.5; and 16/12 is the conversion factor from methane to carbon.
The degradable organic carbon (DOC) was calculated using Equation (3) [26]:
D O C = 0.4 × A + 0.17 × B + 0.15 × C + 0.30 × D
where A represents paper and textiles, B represents nappies, C represents food waste, and D represents wood and leaves. The values of these waste compositions are presented in Figure 2.
The value of the CH4 generation rate constant (k) reflects the degradation rate of the disposed waste composition. The k value in this study was derived from Equation (4):
k = i = 1 n k i × W i
where ki is the degradation rate of decomposable waste composition i, and Wi is the fraction of decomposable i. This study used the default values of ki recommended in the IPCC 2006 guidelines for moist and wet tropical climate regions.

3.4.2. IPCC FOD Model

The IPCC FOD model was also employed to estimate the landfill CH4 emissions, and the result was compared with the LandGEM model. The calculation for CH4 generation using the IPCC OFD model is given as [4]:
Q C H 4 = D D O C m   d e c o m p T × F × 16 12
where DDOCm decomp(T) is the total mass of decomposable degradable organic carbon (DDOC) decomposed in landfill in year T, F is the fraction of CH4 by volume in generated landfill gas (0.0–1.0), and 16/12 is the molecular weight ratio of CH4/C.
The amount of DDOC decomposed in year T (DDOCmdecomp(T)) was calculated as:
D D O C m   d e c o m p T = D D O C m a T 1 × 1 e k
D D O C m a   T 1 = D D O C m d T 1 × D D O C m a T 2 × e k
D D O C m d T 1 = W T 1 × D O C × D O C f × M C F
where DDOCma(T−1) is the mass of DDOC accumulated in in the landfill at the end of year T − 1 (ton C/year), k is the reaction constant (k (year−1) = ln (2)/t1/2), t1/2 is the half-life time, DDOCma(T−1) is the mass of DDOCm deposited into the landfill in year T − 1 (ton C/year), W is the mass of waste deposited (tMSW/year), and DOC is the degradable organic carbon in the year of deposited (ton C/tMSW).

3.5. Calculation of Energy Recovery Potential

LFG collection cannot achieve 100% efficiency due to leakage of the gas captured system, methane oxidation in the soil cover, or an improper cap [11]. Therefore, a 75% CH4 collection efficiency was assumed in this study [27]. The energy generation from the LFG recovery technology was calculated as follows:
E R P L F G = Q C H 4 / ρ C H 4 × 1 O F × L H V C H 4 × η × λ × C F / 3.6
where ERPLFG is the energy recovery potential from LFG; ρCH4 is the density of CH4 in standard temperature (0.667 t/m3); OF is the oxidation factor of CH4, taken as 10% [4]; LHVCH4 is the low heating value of CH4, taken as 37.2 [28]; ŋ is the electricity conversion efficiency, taken as 30% [1]; λ is the CH4 collection efficiency, taken as 75% [1]; and CF is the capacity factor of an internal combustion engine, taken as 85% [29].

3.6. Calculation of Overall GHG Emissions

3.6.1. Fugitive CH4 Emissions

The landfill in Phnom Penh is currently operating without the function of a CH4 capture system, resulting in the release of generated CH4 from the landfill. However, not all the generated CH4 is released into the atmosphere, as a portion of it is oxidized in the topsoil cover. In this study, a CH4 oxidation rate of 10% was used, following the IPCC 2006 guidelines. Given that the current landfill operation is partially covered with soil, S1 and S2 assumed no CH4 oxidation. The fugitive CH4 emissions in these scenarios can be calculated by multiplying the CH4 yield obtained from the LandGEM and IPCC FOD models with the GWP for CH4, which is 25. For S3 and S4, the fugitive CH4 emissions are associated with CH4 collection efficiency, oxidation rate, and the CH4 burning efficiency, which were calculated using Equations (10) and (11):
E F M = F C H 4 × G W P C H 4
F C H 4 = [ Q C H 4 × 1 λ × 1 O X + [ Q C H 4 × λ × 1 ζ
where EFM is the GHG emissions from the fugitive emissions; FCH4 is the amount of CH4 released from the landfill site; QCH4 is obtained from the LandGEM and IPCC models, and ζ is the burn-out rate of CH4 either by flaring and LFG to energy, taken as 91.1% [30].

3.6.2. Avoided Emissions from Carbon Sequestration

Some biodegradable waste containing biogenic carbon may not be fully degraded, even 100 years after being disposed of in a landfill. This stored biogenic carbon is considered to be sequestered within the landfill and should be counted as emission savings in the quantification process [31]. In this study, the avoided emissions from carbon sequestration, following [14,15,31], were included and calculated as follows [32]:
E C S = C S F × 44 12
C S F = W T × D O C × 1 D O C f × M C F
where ECS is the GHG emissions saving due to carbon being sequestered in the landfill, and CSF is the carbon sequestered factor (kg C/tMSW).

3.6.3. N2O Emissions

N2O and NMOC emitted from landfills also contribute to the GWP. However, NMOC is typically found in very low concentrations is are not considered in GHG accounting [31]. N2O emissions from landfills was unavailable in the LandGEM and IPCC waste models. However, N2O contributes significantly to GWP. Its impact is 298 times higher than CO2 [4], and its atmospheric lifetime is up to 120 years, which needs to be reduced [33]. Therefore, N2O should be considered, even though it is negligible [18]. N2O generation has been found to have a significant relationship with CH4 in the waste layer, and landfills in tropical climate zones exhibit higher N2O emissions [34]. According to Yang et al. [31], the emission factor for N2O ranges from 0.5 to 2 g/kg of CH4 emitted. In this study, an N2O generation rate of 2 g/kg of emitted CH4 was assumed due to the climatic zone, which was calculated as follows:
E N 2 O = F C H 4 × E F N 2 O × G W P N 2 O × 1000
where EN2O is the GHG emissions due to the emissions of N2O (kg CO2-eq/tMSW); EFN2O is the emission factor for N2O, taken as 2 g/kg of fugitive CH4 [31]; and GWPN2O is the global warming potential of N2O, taken as 298 [4].

3.6.4. Emissions from Landfill Operations

GHG emissions from landfill operations are generated through the consumption of electricity, diesel, and auxiliary materials such as HDPE and gravel, which are used for liner, leachate collection, and LFG capture systems. Currently, the landfill operation in Phnom Penh uses diesel fuel to power heavy-duty equipment such as excavators and bulldozers. The daily amount of diesel fuel consumed for this purpose is 1435 L, equivalent to 0.43 L/tMSW. However, additional diesel is required for daily on-site operations when upgrading the landfill with leachate treatment and LFG collection systems. Since specific data for these operations were not available, this study adopted the average values reported in study by Manfredi et al. [15], which were 2 L/tMSW of diesel used for daily operation in scenarios 2–4, and 5, 8, and 12 kWh/tMSW of electricity for scenario 2, 3, and 4, respectively. Other auxiliary materials, such as HPDE liner and gravel, were used under scenarios 2–4 and were taken as 1 and 100 kg/tMSW, respectively. To calculate the GHG emissions from landfill operations, the following equation can be used [31]:
E L O = i = 1 i = 0 A i , L O × E F i
where ELO is the emissions from the operation process of the landfill (kg CO2-eq/tMSW), Ai,LO is the amount of the ith auxiliary material or energy used during landfill operation, and EFi is the emission factors for the provision of the ith auxiliary material or energy, as presented in Table 3.

3.6.5. Emissions from Leachate Treatment

GHG emissions from leachate treatment are mainly from electricity, water, and chemical (HCl and NaOH) consumption in the leachate treatment process. The emissions from leachate treatment were calculated following [31] and given in Equation (16):
E L T = L × λ × W × E F w + C i × E F C i + E C × E F g r i d
where ELT refers to the emissions from the leachate treatment (kg CO2-eq/tMSW), and L, λ, W, Ci, and EC represent the leachate generated over 100 years of landfilling (2.2527 m3/tMSW). The leachate collection efficiency for treatment was 40%, the water used for leachate treatment was 83 L/m3 leachate, the chemicals used for leachate treatment were 3 and 5 kg/m3 leachate for HCl and NaOH, respectively, and the electricity consumption for treating leachate was 14.24 kWh/t leachate [31]. The emission factors for water (EFw), chemicals (EFci), and electricity (EFgrid) are shown in Table 3.

3.6.6. Calculation of Avoided Emissions from Electricity Substitution

The energy generated from landfill CH4 was used to replace electricity generated from conventional fuels. GHG emission savings from electricity substitution were calculated as follows:
E S E = E R P L F G × E F g r i d

3.6.7. Calculation of Overall Emissions from Landfill Management Technologies

The overall GHG emissions from different landfill management under the four scenarios can be calculated as:
E G H G s = E F M + E L O + E L T + E N 2 O E S E E C S
where EGHGs is the total GHG emissions from the landfill management process.

3.7. Determination of Uncertainty in the CH4 Emissions Estimation

According to the IPCC [4], the estimation of CH4 emissions involves inherent uncertainties arising from both activity data and parameters. In this study, the uncertainties in activity data were addressed by examining the variability of waste composition (±30%). Additionally, the uncertainties associated with MCF (±20%) and the fraction of CH4 in generation LFG (±5%) were also determined.

4. Results and Discussion

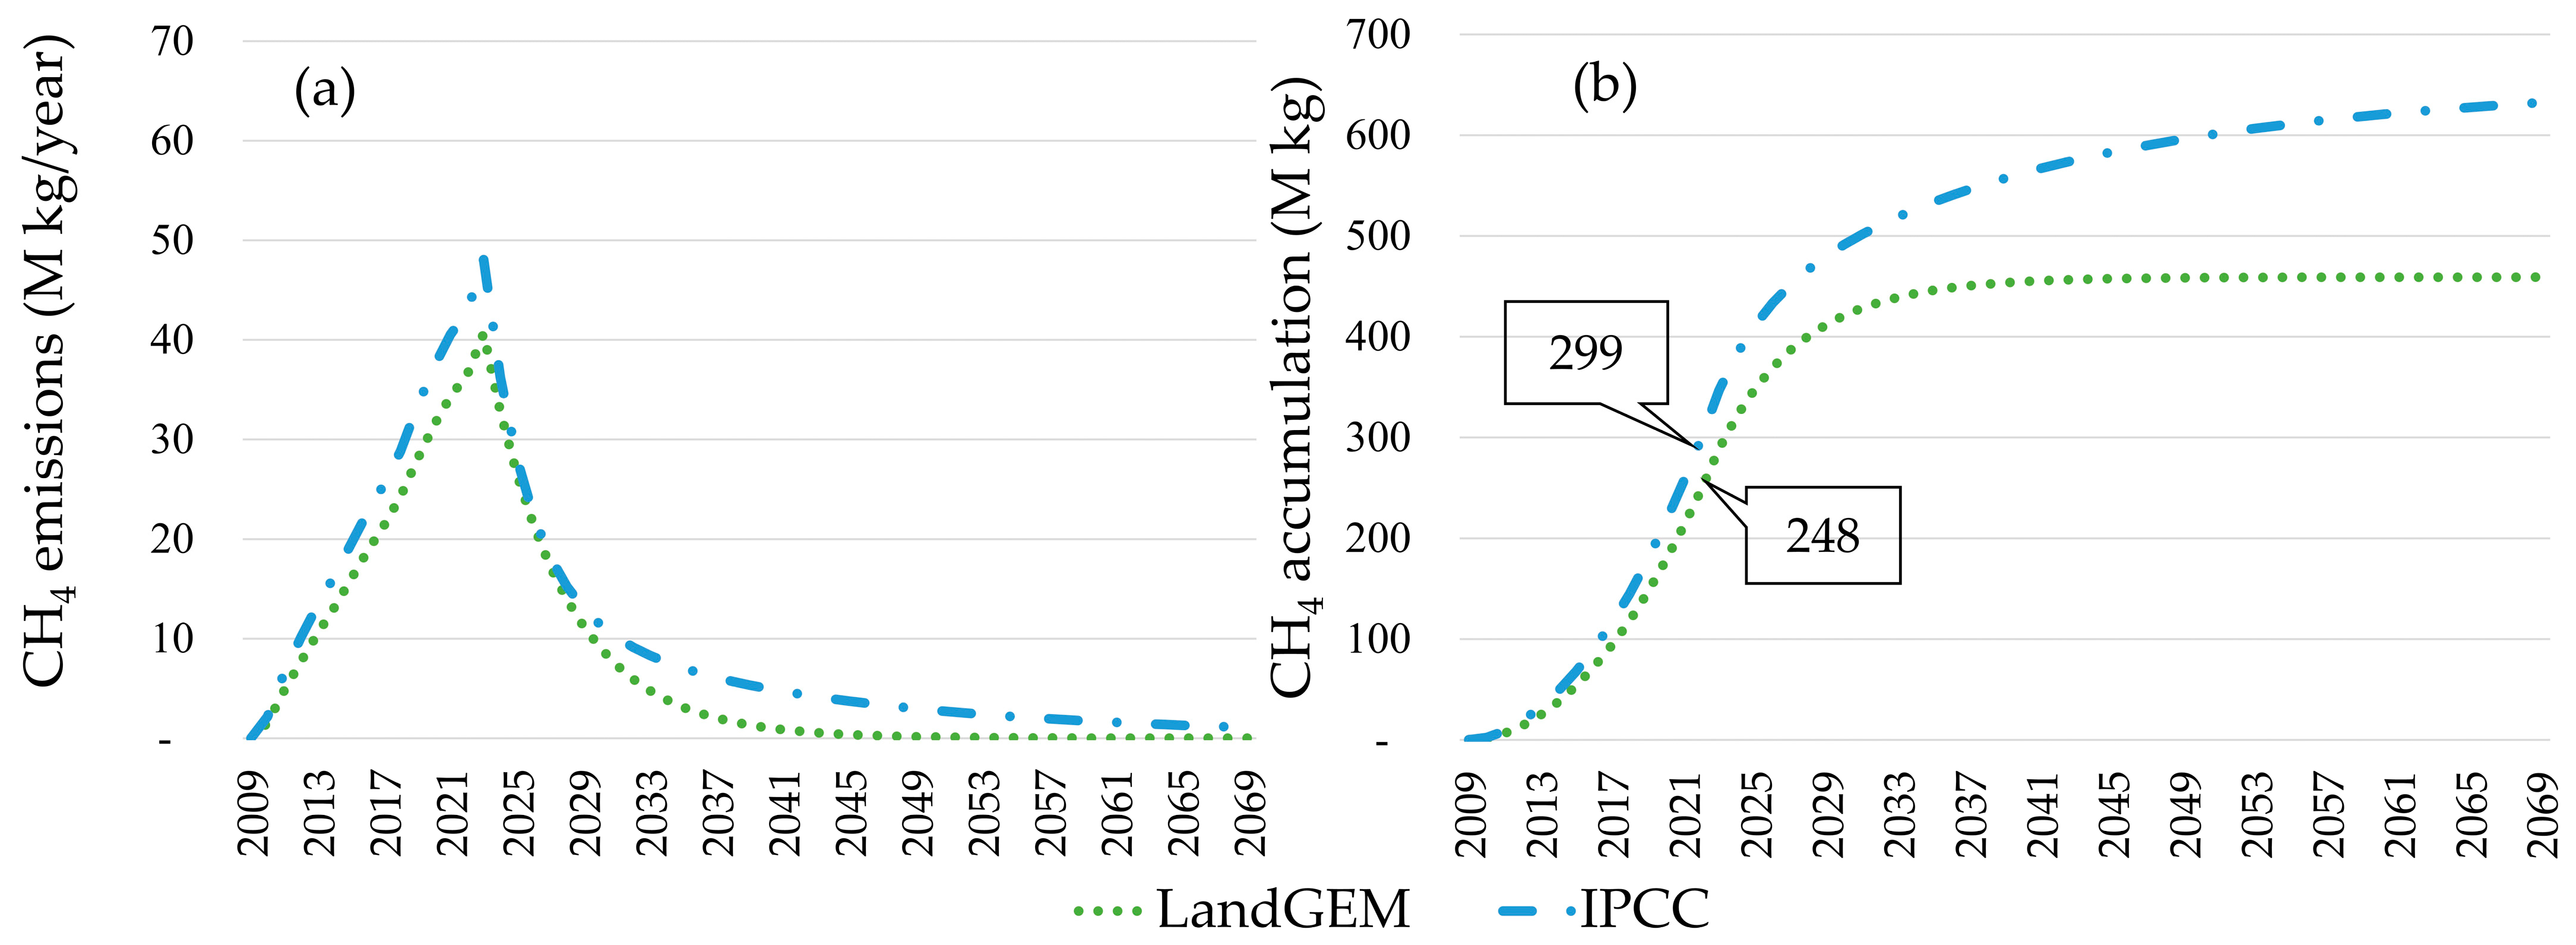
4.1. Estimation of CH4 Generation

The CH4 generation from the Dangkao landfill was estimated using the LandGEM and IPCC FOD models based on the available data regarding landfilled waste recorded at the landfill from 2009 to 2022. The advantage of using the LandGEM model is that it is capable of simulating approximately 51 gases and pollutants for up to 140 years after a landfill is opened. The LandGEM model includes CH4, CO2, and NMOC as common gases. However, since CO2 is of biogenic origins and NMOC levels are negligible (less than 0.1% compared to CH4), they were not included in the quantification of GHG emissions. Meanwhile, the IPCC FOD model potentially estimates CH4 emissions from waste composition, providing a better understanding of the degradability of the waste deposited. However, the IPCC FOD model does not account for CO2 and other gases in its estimation.
The estimation of LFG using the LandGEM model relies on two main parameters: CH4 generation constant rate (k) and CH4 generation potential (L0). The k value is influenced by several factors, including waste composition, moisture content, temperature, waste depth, density, pH, and other environmental conditions [2,36]. Different waste compositions have varying degradation rates [2]. This study estimated a k value of 0.21 per year, which falls within the range of other studies [2,37,38]. Machado et al. conducted field measurements and laboratory tests on landfilled MSW in Brazil and obtained a good agreement of their k value at 0.21 [2]. Meanwhile, Wangyao et al. [37] and Anh et al. [38] obtained relatively higher decay rates (k) from field measurements in Thailand and Vietnam at 0.33 and 0.355 per year, respectively. The LandGEM model recommends a default value of k ranging from 0.02 to 0.7 per year, while the IPCC-recommended default value for tropical areas is 0.17 per year for bulky waste [4].
The CH4 generation potential (L0) was calculated using the IPCC method, resulting in a value of 90 m3/t. This value was higher than that reported in Vietnam [38], mainly due to the higher organic fraction of MSW in Phnom Penh. However, the estimated L0 value for Phnom Penh was lower than the recommended of 96 m3/t for the inventory wet landfill in the LandGEM model. Overall, the k and L0 values obtained in this study were within the ranges reported for other landfills operating in tropical regions, as shown in Table 4.
The Dangkao landfill received 177,224 tMSW in 2009 and increased to 1,288,223 tMSW in 2022. As depicted in Figure 4a, the CH4 generation rapidly increased in the early stage over time as MSW accumulated in the landfill. The potential landfill CH4 generation, as calculated by the LandGEM and IPCC FOD models, increased from 1.54 and 2.17 M kg in 2010 to 36.50 and 42.83 M kg in 2022, respectively. Assuming landfill closure in 2022, both models indicated a similar trend in CH4 generation, although the IPCC FOD model produced relatively higher results. The CH4 emissions are expected to peak in 2023 and then rapidly decline thereafter. The results from both models indicated the rapid degradation of degradable matter due to the high moisture content of waste, leading to the production of more LFG within a short period, as typically observed in tropical regions [2,37,38]. Many Asian countries are known to produce high levels of LFG emissions, mainly due to the large amounts of food waste in waste streams, the moist tropical climate, and the high precipitation in these regions [42]. In contrast, European countries typically exhibit lower LFG generation rates due to the higher proportion of slowly degradable fractions such as paper, wood, and yard waste, which take longer to decompose [43]. In addition, the temperate climates and lower precipitation levels in Europe significantly affect emissions from solid waste disposal sites [42].
Between 2010 and 2022, the CH4 emissions from the Dangkao landfill totaled 248 M kg according to the LandGEM model, with an average emission of 18 M kg/year. According to the IPCC FOD model, the total CH4 emissions were 299 M Kg CH4, with an average annual emission of 21 M kg (Figure 4b). Ghosh et al. estimated CH4 generation from three landfill sites in Delhi and found that the LandGEM model predicted over twice as much as CH4 compared to the IPCC FOD model, which contrasts with the findings in the present study [20]. Since there were no LFG collection systems in place and no on-site measurements data available in Cambodia, this study compared the estimated CH4 generation results with field measurement studies conducted in neighboring countries with similar conditions. Table 5 demonstrates that the results obtained from the LandGEM model in the present study and the closed flux chamber method in Thailand were comparable, at 24 and 22 kgCH4/tMSW, respectively. However, the IPCC FOD model in the present study estimated higher CH4 emissions, at 29 kgCH4/tMSW. On the other hand, measurements taken at the LFG collection system in Nam Binh Doung landfill showed an average of 42 kgCH4/tMSW. It is important to note that the higher value for the Nam Binh Doung landfill was likely due to the measurement being taken during the peak period of CH4 generation, which occurred one year after the landfill closure. If the CH4 measurements were taken during landfill operation, the average CH4 generation would likely be lower. Thus, these findings demonstrate the similarity between the results of this study and the field measurement results from other landfills in similar conditions. However, it is worth noticing that the results of landfill CH4 emissions can vary depending on factors such as landfill management practices, waste quantity, and waste composition [44].
Gollapalli and Kota [46] investigated LFG emissions from a landfill in India using a flux chamber and compared them with the results calculated using the Modified Triangular Method (MTM), the IPCC default model, and the LandGEM model. Their study found that the MTM, IPCC default model, and LandGEM model predicted emissions 1.9, 1.4, and 1.6 times higher than those measured on-site, respectively. Furthermore, Chakraborty et al. compared simulation results using the IPCC default model, MTM, and FOD model, and found that the FOD model yielded better results that were comparable to those measured in the field [47]. Ghosh et al. highlighted that a lower CH4 measured on-site may be due to uncertainties in sampling selection and uncontrolled emissions that were unaccounted for [20]. However, Amini et al. noted that the LandGEM model underestimates CH4 production [21]. Kumar and Sharma compared several landfill models and concluded that LandGEM is the most advantageous model due to its ability to provide accurate results [48]. These previous studies suggest that different models may yield different levels of accuracy, with some models overestimating or underestimating CH4 production. On the other hand, it is important to carefully plan field measurements, consider spatial and temporal variability, use appropriate measurement techniques, ensure proper calibration, and account for potential uncontrollable emissions. Combining field measurements with modeling approaches can provide a more comprehensive understanding of CH4 emissions from landfills.

4.2. Estimation of Energy Recovery Potential from LFG Recovery

CH4 generated from landfills can be harnessed for various purposes, including power production, direct use, and conversion into fuel for vehicles [12]. However, this study specifically focused on the utilization of CH4 for electricity generation. Table 6 presents the estimated energy generation potential based on the LandGEM and IPCC FOD models. Between 2010 and 2022, the LandGEM model suggests a range of 4.10 to 97.31 GWh, with an average of 50.89 GWh/year. On the other hand, the IPCC FOD model indicated a range of 5.78 to 114.18 GWh, with an average of 61.27 GWh/year during the same period. A portion of the electricity generated could be used for on-site operations at the landfill, reducing electricity consumption costs. Any excess electricity beyond the site’s requirements could be sold to the national grid, contributing to the overall energy supply. Energy recovery not only offers economic benefits, but also aids in GHG mitigation through electricity substitution. According to the IGES [35], the emission factor for the national grid in Cambodia is 0.586 kg CO2-eq/kWh. Therefore, the electricity generation from LFG recovery could potentially avoid approximately 30 and 36 M kg CO2-eq/year of GHG generated by the electricity sector in the country, based on calculations using the LandGEM and IPCC FOD model, respectively.
It should be noted that LFG recovery has the potential to produce both electricity and heat using the combined heat and power (CHP) technology. By considering CHP, the overall energy efficiency of LFG recovery can be greatly enhanced [9]. In addition to electricity, the generated heat can be utilized in industrial areas, thereby promoting economic benefits. This utilization of heat can also directly mitigate GHG emissions resulting from the combustion of firewood in boilers. In Cambodia, the use of firewood as a fuel source in boilers is common in the garment sector. By diverting the heat generated from LFG recovery to these boilers, the demand for firewood can be reduced, resulting in reduced deforestation and increased forest carbon storage. These additional benefits can significantly improve energy efficiency from landfill management and contribute to sustainable development [49].

4.3. Quantification of Emission Factors for Different Landfill Scenarios

In this section, all values are expressed per ton of MSW and converted to carbon dioxide equivalents (CO2-eq) using the 100-year GWPs of 25 and 298 for CH4 and N2O, respectively. Landfills have direct GHG emissions due to the degradation of decomposable wastes under landfill conditions and the operation of the landfill site, as well as indirect emissions from landfill operations and the installation of landfill equipment. Emission factors associated with landfill technologies under the four selected scenarios were calculated and presented in Table 7. Biogenic CO2 emissions resulting from waste degradation in the landfill were not included in the GHG emissions accounting models. However, carbon sequestration and the environmental benefits of electricity substitution provided by the landfill were taken into account in the model calculations. Among the four scenarios, S2 exhibited the highest emissions, with net GHG emissions of 757.72 and 941.49 kg CO2-eq/tMSW according to the LandGEM and IPCC FOD models, respectively. The main factor contributing to higher emissions in S2 compared to the present landfill management scenario (S1) was the implementation of leachate treatment, which requires the installation of liner materials and the use of chemicals and electricity for leachate treatment. This finding was comparable to that observed in China, 619.5–940.7 kg CO2-eq/tMSW, when applying the same landfill management practices and excluding the collection and transportation of MSW [31]. The similarity in results between the two countries could be attributed to the substantial generation of CH4 due to waste characteristics, with organic waste accounting for approximately 55% of the total waste compositions. Furthermore, carbon sequestration within the landfill was quantified as a negative emission. The extent of carbon sequestration depends on the amount and composition of waste buried in the landfill. In this study, carbon sequestration was estimated to be approximately −104.51 kg CO2-eq/tMSW, falling within the range reported by other studies [14,31].

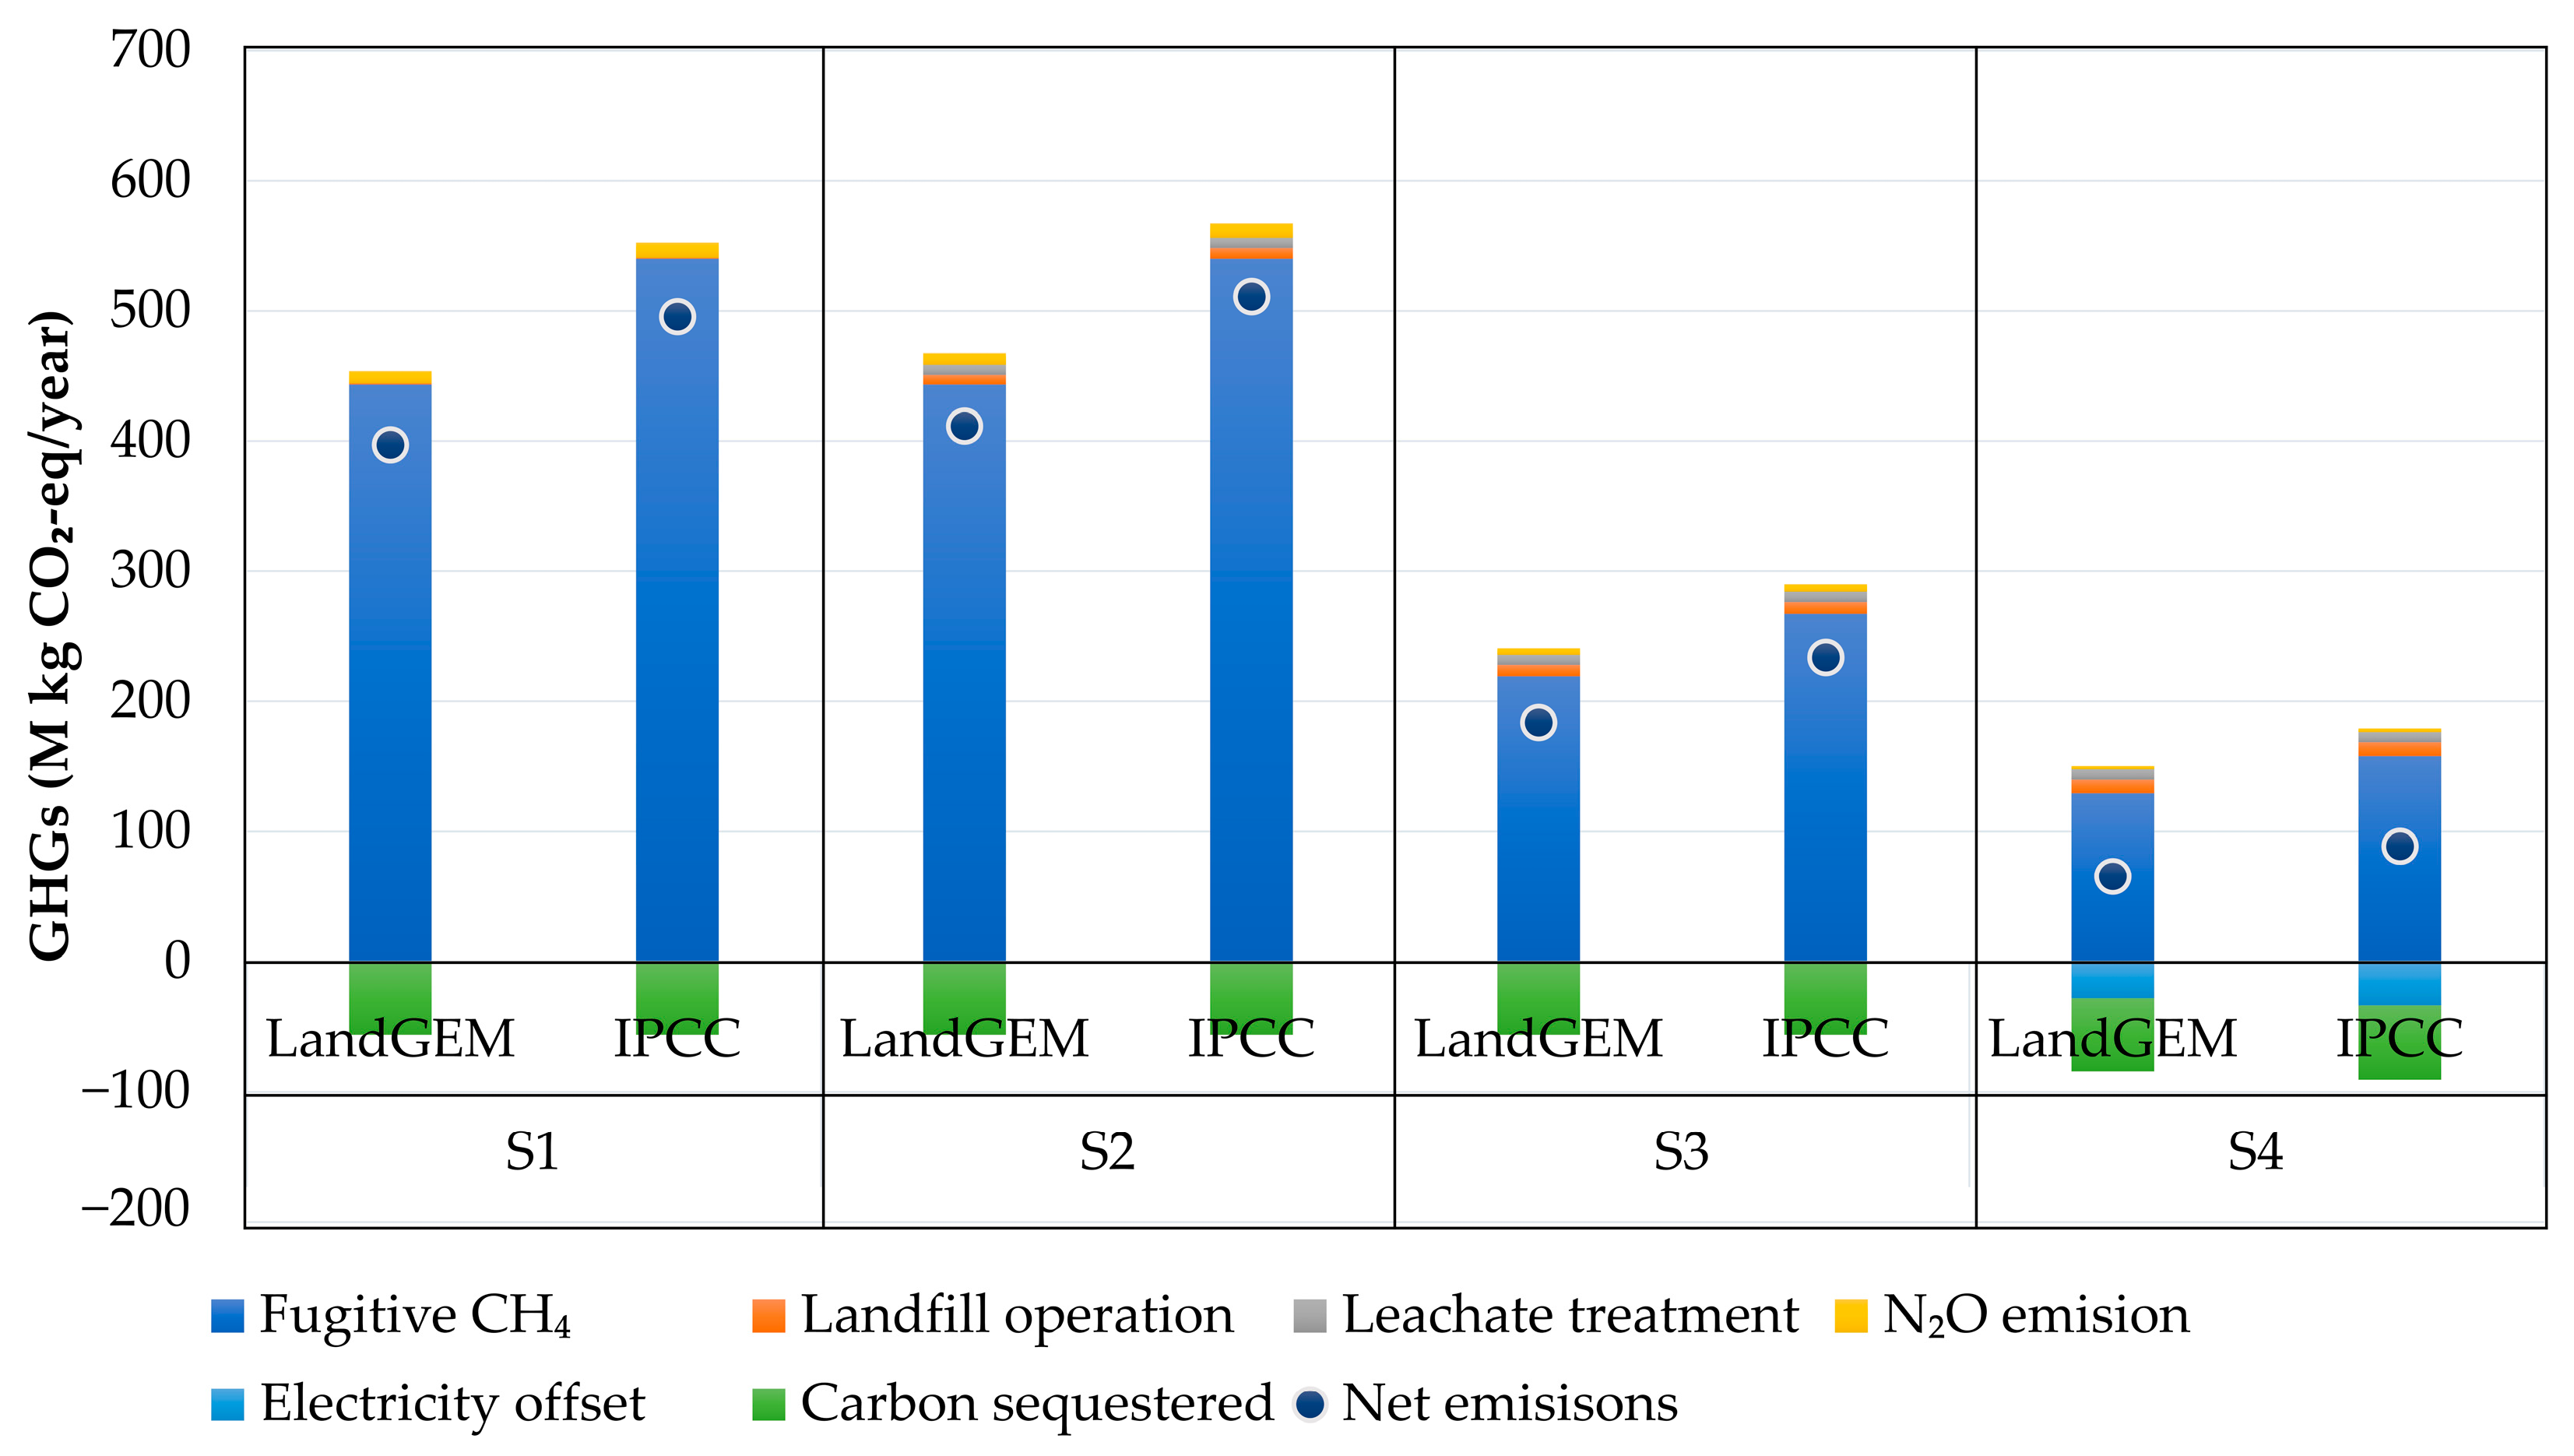
4.4. Overall GHG Emissions from 2009 to 2022

To quantify the total GHG emissions from the Dangkao landfill between 2009 and 2022, the emissions factors for different landfilling options discussed in Section 4.3 were utilized. Figure 5 illustrates that fugitive CH4 emissions made the largest contribution to the overall GHG emissions in all scenarios. GHG emissions attributed to fugitive CH4 were highest in S1 (98%) and lowest in S4 (86%). Other contributors to GHG emissions from landfill management technologies included N2O emission, leachate treatment, and landfill operation. The second-highest emissions stemmed from leachate treatment, which involved significant electricity consumption, water, and chemical inputs.
Figure 6 indicates that the overall GHG emissions resulting from current landfill management practices (S1) between 2009 and 2022 amounted to 397 and 496 M kg CO2-eq/year, as determined by the LandGEM and IPCC FOD models, respectively. With the implementation of leachate collection and treatment in S2, GHG emissions increased and averaged 409 M kg CO2-eq/year based on the LandGEM model and 509 M kg CO2-eq/year based on the IPCC FOD model. Although S1 exhibited lower GHG emissions compared to S2, the current landfill management practice has a high potential to pollute the landfill vicinity through the leakage of leachate. In contrast, S2 involves the installation of liners and regular soil cover applications, which can reduce liquid infiltration into waste and decrease leachate generation by approximately 50% [31]. Since fugitive CH4 emissions are a key contributor to GHG emissions from landfills, reducing these emissions through LFG-capturing systems for flaring or electricity generation could minimize their potential contribution to global warming [12]. S3 involves the installation of a LFG collection system for flaring, resulting in an average annual emission 182 M kg CO2-eq according to the LandGEM model and 231 M kg CO2-eq calculated based on the IPCC FOD model. GHG emissions in S3 were significantly reduced by at least 55% compared to S2. On the other hand, S4 proved to be the most effective option for reducing GHG emissions. This scenario involved capturing and utilizing landfill CH4 for generating electricity, thereby offsetting emissions from conventional high-emission energy sources. In S4, GHG emissions were estimated at 63 M kg CO2-eq/year based on the LandGEM model and 86 M kg CO2-eq/year according to the IPCC FOD models. Therefore, S4 represents a promising approach to reducing GHG emissions by at least 83% from landfill management. However, implementing such systems requires financial resources and technical expertise, which are currently unavailable in the city. While generating renewable energy from CH4 has the potential to generate income, it remains uncertain whether the LFG-to-energy project will be economically feasible for Phnom Penh.

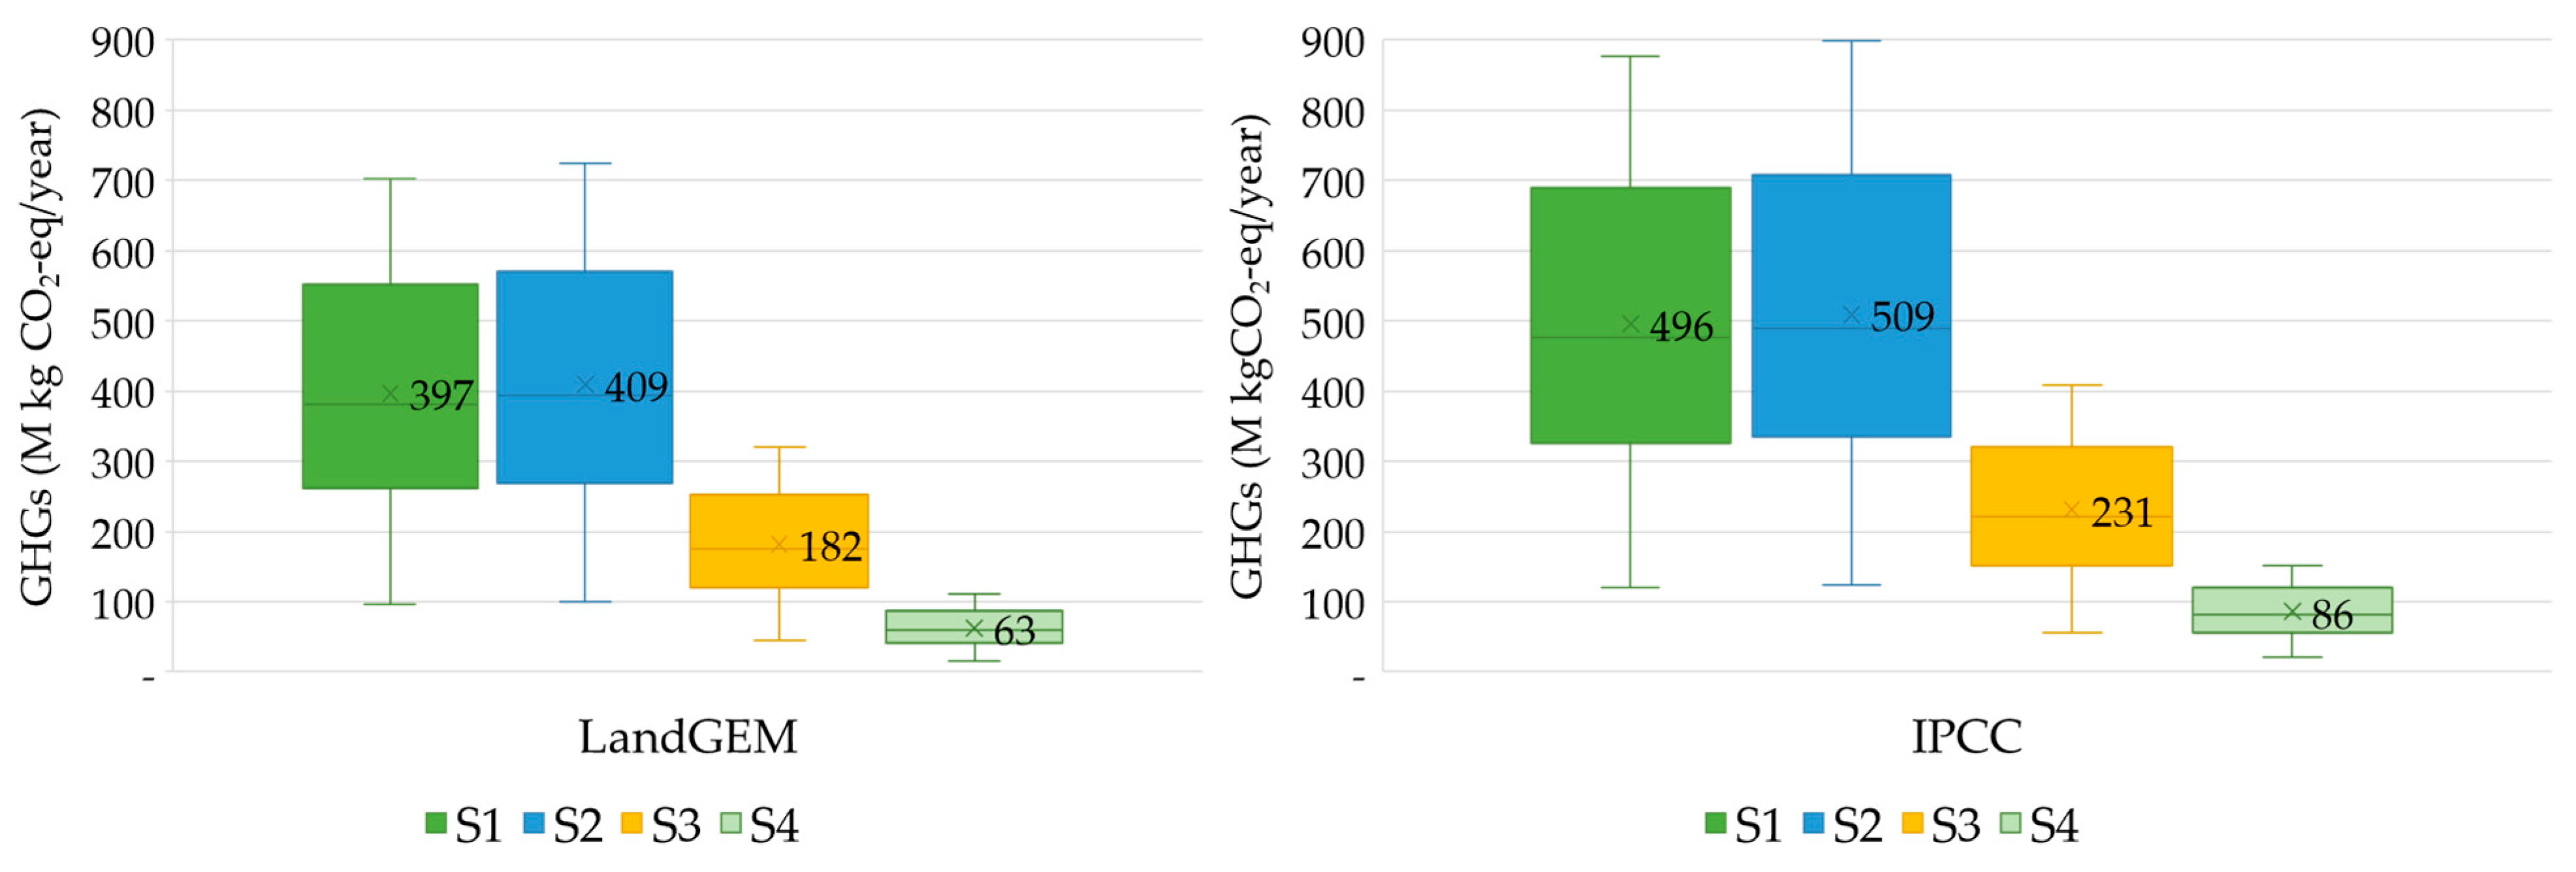
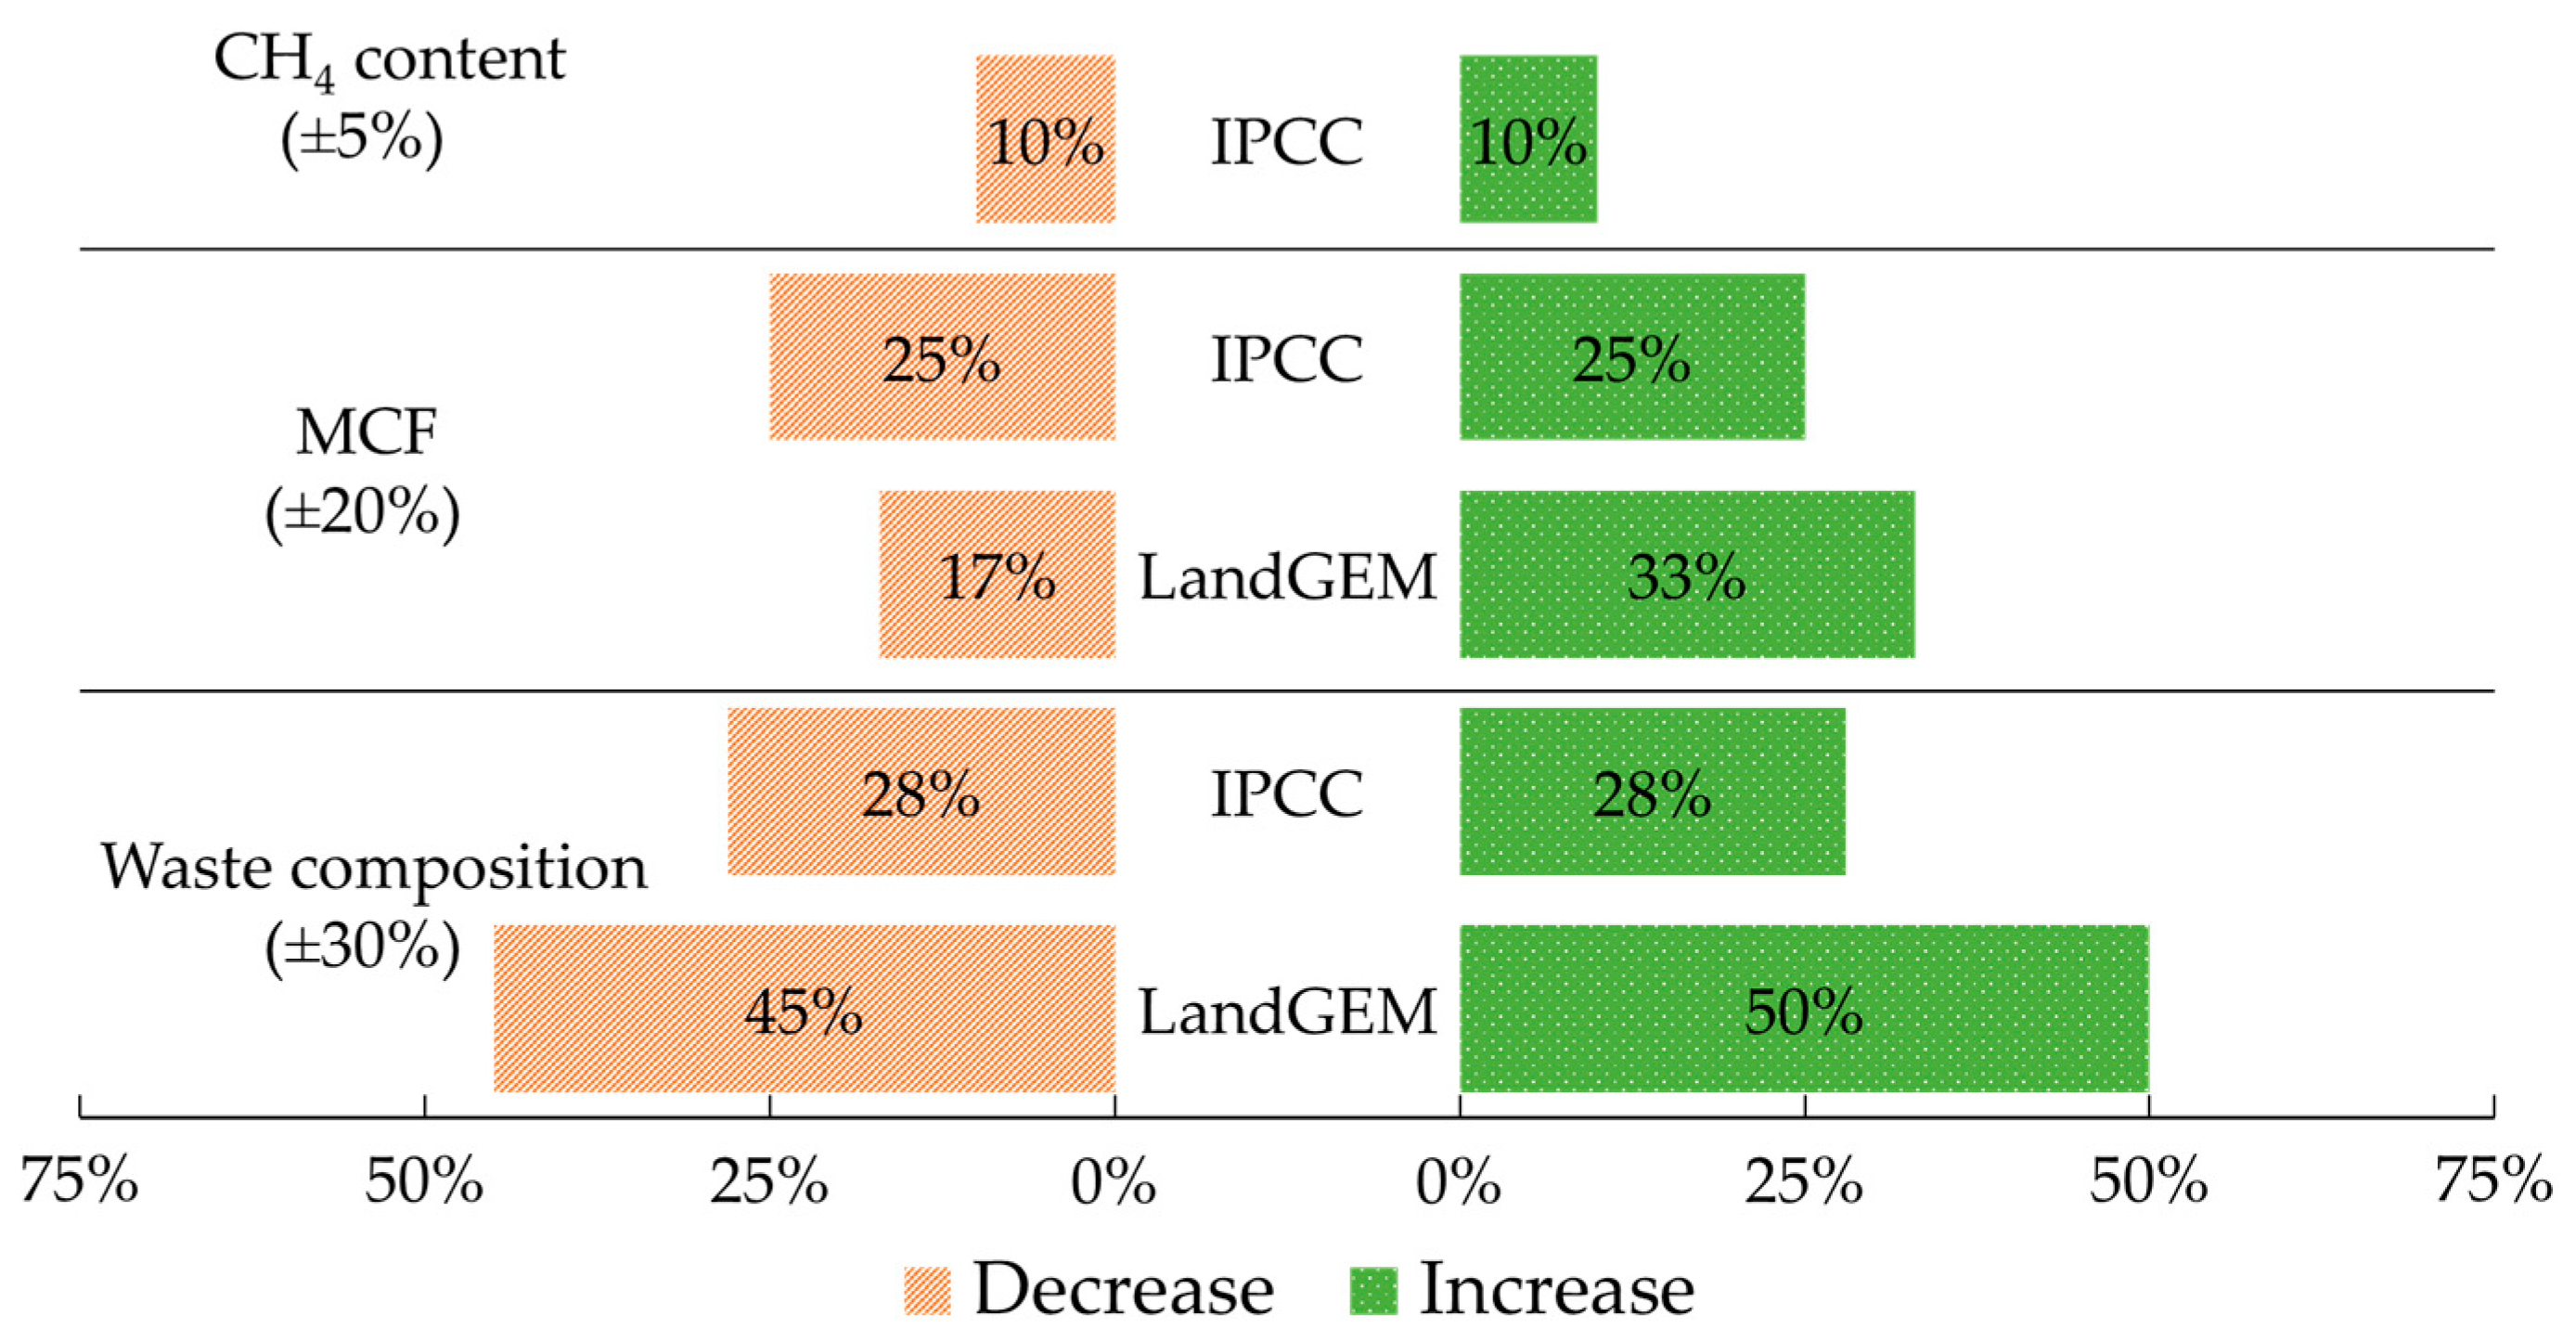
4.5. Uncertainty Assessment

The above findings demonstrate that landfill CH4 predominately contributes to GHG emissions from landfill management. Therefore, uncertainty in CH4 estimation could influence GHG emission accounting. The uncertainty in predicting landfill CH4 emissions was caused by a lack of precise and reliable data [4]. One of the main uncertainties in data was the physical characteristics of the landfilled MSW. The composition of MSW disposal can vary over time, which can be influenced by factors such as consumption habits, income status, socio-economic factors, etc. [16]. Another factor that can affect MSW characteristics is improving the waste collection system and proper source segregation. The varying composition of MSWs can influence the total amount of DOC in the landfill [4], which in turn affects the estimation of CH4 emissions. The uncertainty in CH4 emissions due to MSW composition has been estimated to be approximately ±30%, as recommended by the IPCC 2006 guidelines. As shown in Figure 7, the LandGEM and IPCC FOD models demonstrated different uncertainty levels in predicting CH4 emissions when variating the waste composition. The LandGEM model indicated that CH4 yields could be doubled if decomposable waste increased by 30%, while reducing biodegradable waste by 30% could decrease landfill CH4 generation by 45%. Meanwhile, the IPCC FOD model showed a lower rate of CH4 variation when fluctuating the waste composition. Decreasing biodegradable waste composition by 30% resulted in reduced CH4 yields by 28%, and vice versa. This clearly demonstrates the influence of MSW characteristics, particularly food waste, on landfill CH4 generation. Therefore, minimizing the landfilling of degradable waste can reduce the enormous amount of landfill CH4.
Another source of uncertainty in CH4 prediction is associated with the selection of landfill types. The Dangkao landfill had a pit depth of 10–30 m, which was within the criteria for unmanaged deep landfill as categorized in the IPCC 2006 guidelines, with a MCF of 0.8 (see Table 2). The LandGEM model showed that shifting the MCF to 0.6 for ab uncategorized landfill reduced CH4 generation potential by 17%. However, increasing MCF to 1 for a managed aerobic landfill increased the CH4 potential by 33%. In the IPCC FOD model, the uncertainty caused by variations in the MCF resulted in a variation in CH4 emissions of ±25%.
According to the IPCC [4], the fraction of CH4 in generated LFG can vary by approximately ±5% from the default value of 50%, depending on several factors. The uncertainty in CH4 emissions resulted from variations in CH4 content ranging between 19 and 24 M kg/year based on the IPCC FOD model. Therefore, the availability of data can have a significant impact on the output value, as indicated by the results demonstrating that uncertainty in available data can lead to huge variations in results [20].

5. Limitations of the Study

Variations in waste composition can result in high uncertainty in the CH4 estimation results. The waste composition in Phnom Penh may have changed over time. However, the time series on waste composition was not available at the Dangkao landfill. Furthermore, due to difficulties in arranging manpower, coordinating waste sampling with the timing of waste disposal, and other logistical challenges, the determination of waste compositions was not carried out in this study. Therefore, the physical composition of MSW in Phnom Penh reported in a scientific study conducted in 2014–2015 was used to simulate the CH4 generation. This could be considered one of the limitations of this study. Another limitation in the present study is lack of field measurements to validate the estimated results. On-site measurements can help identify and account for factors that may not be adequately captured in the estimation models. However, the Dangkao landfill does not have a landfill gas collection system and has partial soil cover, leading to high uncontrolled emissions. Therefore, caution should be exercised when selecting a field measurement method. In future research, it would be beneficial to incorporate experimental measurements to improve the accuracy of CH4 estimation.

6. Conclusions

This study estimated CH4 generation, energy recovery potential, and overall GHG emissions resulting from different landfill management practices at the Dangkao landfill in Phnom Penh. The LandGEM and IPCC FOD models were used to predict CH4 generation from 2009 to 2022. Both models exhibited a similar trend of rapid CH4 degradation shortly after MSW disposal. The LandGEM model estimated approximately 18 M kg/year of CH4 generation, while the IPCC FOD model estimated approximately 21 M kg/year. The CH4 generated from the landfill has the potential to generate an average of 51 and 61 GWh/year of electricity based on the LandGEM and IPCC FOD models, respectively. This renewable energy source can offset electricity supply from the national grid, contributing to a reduction in GHG emissions associated with conventional energy generation sources. Additionally, utilizing the recovered LFG for heat generation in industrial sectors can further maximize LFG utilization efficiency and reduce GHG emissions by substituting the firewood used in boilers. However, heat generation was not included in this study. To evaluate net GHG emissions, four landfill management scenarios were considered. S1 represented the current situation without leachate treatment and landfill gas collection systems, while S2 involved leachate treatment but no landfill gas collection. S3 and S4 incorporated leachate treatment and LFG collection for flaring and electricity production. Among the scenarios, S2 exhibited the highest GHG emissions, with average emissions of 409 and 509 M kg CO2-eq/year according to the LandGEM and IPCC FOD models, respectively. The increased emissions in S2 were mainly due to additional emissions from the leachate treatment process. However, through LFG collection for flaring and electricity production, both S3 and S4 demonstrated significant reductions in GHG emissions, achieving at least 55% and 83% reduction, respectively. Estimating CH4 emissions from landfills can be challenging due to factors such as waste composition, selection of the proper landfill type, and CH4 content in LFG. Therefore, it is crucial to conduct field measurements of CH4 emissions to validate the model calculations and minimize uncertainty. Among the landfill management options, S4 proved to be the most favorable option for GHG mitigation and energy recovery. Further study is needed to evaluate the economic feasibility of the LFG recovery project.

Author Contributions

Conceptualization, methodology, software, formal analysis, writing—original draft preparation, D.V.P.; validation, writing—review and editing, D.V.P., V.N. and T.D.X.; supervision, T.D.X. All authors have read and agreed to the published version of the manuscript.

Funding

This research received no external funding.

Data Availability Statement

Not applicable.

Acknowledgments

The authors would like to thank the Project for Human Resource Development Scholarship (JDS) for providing a scholarship for D.V.P. We are also grateful to Nguyen Van Quan for his suggestions regarding the preparation of the manuscript.

Conflicts of Interest

The authors declare no conflict of interest.

References

  1. Amini, H.R.; Reinhart, D.R.; Niskanen, A. Comparison of First-Order-Decay Modeled and Actual Field Measured Municipal Solid Waste Landfill Methane Data. Waste Manag. 2013, 33, 2720–2728. [Google Scholar] [CrossRef]
  2. Machado, S.L.; Carvalho, M.F.; Gourc, J.P.; Vilar, O.M.; do Nascimento, J.C.F. Methane Generation in Tropical Landfills: Simplified Methods and Field Results. Waste Manag. 2009, 29, 153–161. [Google Scholar] [CrossRef] [PubMed]
  3. Bogner, J.; Ahmed, M.A.; Diaz, C.; Faaij, A.; Gao, Q.; Hashimoto, S.; Mareckov, K.; Pipatti, R.; Zhang, T.; Diaz, L.; et al. Waste Management, in Climate Change 2007: Mitigation. Contribution of Working Group III to the Fourth Assessment Report of the Intergovernmental Panel on Climate Change; Metz, B., Davidson, O.R., Bosh, P.R., Dave, R., Meyer., L.A., Eds.; Cambridge University Press: Cambridge, UK; New York, NY, USA, 2007. [Google Scholar]
  4. Intergovernmental Panel on Climate Change. 2006 IPCC Guidelines for National Greenhouse Gas Inventories, Prepared by the National Greenhouse Gas Inventories Programme; Eggleston, H.S., Buendia, L., Miwa, K., Ngara, T., Tanabe, K., Eds.; IGES: Kanagawa, Japan, 2006; Volume 5. [Google Scholar]
  5. Lizik, W.; Im, J.; Semrau, J.D.; Barcelona, M.J. A Field Trial of Nutrient Stimulation of Methanotrophs to Reduce Greenhouse Gas Emissions from Landfill Cover Soils. J. Air Waste Manag. Assoc. 2013, 63, 300–309. [Google Scholar] [CrossRef] [PubMed] [Green Version]
  6. Spokas, K.A.; Bogner, J.; Corcoran, M. Modeling Landfill CH4 Emissions: CALMIM International Field Validation, using CALMIM to Simulate Management Strategies, Current and Future Climate Scenarios. Elem. Sci. Anthr. 2021, 9, 00050. [Google Scholar] [CrossRef]
  7. Mohsen, R.A.; Abbassi, B.; Zytner, R. Investigation of Fugitive Methane and Gas Collection Efficiency in Halton Landfill in Ontario, Canada. Environ. Monit. Assess. 2020, 192, 326. [Google Scholar] [CrossRef]
  8. Scheutz, C.; Kjeldsen, P. Guidelines for Landfill Gas Emission Monitoring Using the Tracer Gas Dispersion Method. Waste Manag. 2019, 85, 351–360. [Google Scholar] [CrossRef]
  9. US EPA. Landfill Gas Energy Cost Model; Landfill Methane Outreach Program (LMOP), U.S. Environmental Protection Agency: Washington, DC, USA, 2016. [Google Scholar]
  10. Environment Agency. Guidance on Landfill Gas Flaring Version 2.1; Environment Agency: Bristol, UK, 2002. [Google Scholar]
  11. Barlaz, M.A.; Chanton, J.P.; Green, R.B. Controls on Landfill Gas Collection Efficiency: Instantaneous and lifetime performance. J. Air Waste Manag. Assoc. 2009, 59, 1399–1404. [Google Scholar] [CrossRef] [Green Version]
  12. Kumar, A.; Sharma, M.P. GHG Emission and Carbon Sequestration Potential from MSW of Indian Metro Cities. Urban Clim. 2014, 8, 30–41. [Google Scholar] [CrossRef]
  13. Barlaz, M.A.; Eleazer, W.E.; Odle, W.S., III; Qian, X.; Wang, Y.-S. Biodegradative Analysis of Municipal Solid Waste in Laboratory-Scale Landfills; US EPA: Springfield, MA, USA, 1997. [Google Scholar]
  14. Friedrich, E.; Trois, C. GHG Emission Factors Developed for the Collection, Transport and Landfilling of Municipal Waste in South African Municipalities. Waste Manag. 2013, 33, 1013–1026. [Google Scholar] [CrossRef]
  15. Manfredi, S.; Tonini, D.; Christensen, T.H.; Scharff, H. Landfilling of Waste: Accounting of Greenhouse Gases and Global Warming Contributions. Waste Manag. Res. 2009, 27, 825–836. [Google Scholar] [CrossRef]
  16. Dek, V.P.; Nguyen, V.Q.; Tran, D.K.; Tran, D.X. Challenges and Priorities of Municipal Solid Waste Management in Cambodia. Int. J. Environ. Res. Public Health 2022, 19, 8458. [Google Scholar] [CrossRef]
  17. Seng, B.; Fujiwara, T.; Seng, B. Suitability Assessment for Handling Methods of Municipal Solid Waste. Glob. J. Environ. Sci. Manag. 2018, 4, 113–126. [Google Scholar] [CrossRef]
  18. Seng, B.; Hirayama, K.; Katayama-Hirayama, K.; Ochiai, S.; Kaneko, H. Scenario Analysis of the Benefit of Municipal Organic-Waste Composting Over Landfill, Cambodia. J. Environ. Manag. 2013, 114, 216–224. [Google Scholar] [CrossRef] [PubMed]
  19. Babilotte, A.; Lagier, T.; Fiani, E. Fugitive Methane Emissions from Landfills: Field Comparison of Five Methods on a French Landfill. J. Environ. Eng. 2010, 136, 777–784. [Google Scholar] [CrossRef]
  20. Ghosh, P.; Shah, G.; Chandra, R.; Sahota, S.; Kumar, H.; Vijay, V.K.; Thakur, I.S. Assessment of Methane Emissions and Energy Recovery Potential from the Municipal Solid Waste Landfills of Delhi, India. Bioresour. Technol. 2019, 272, 611–615. [Google Scholar] [CrossRef] [PubMed]
  21. Amini, H.R.; Reinhart, D.R.; Mackie, K.R. Determination of First-Order Landfill Gas Modeling Parameters and Uncertainties. Waste Manag. 2012, 32, 305–316. [Google Scholar] [CrossRef]
  22. Majdinasab, A.; Zhang, Z.; Yuan, Q. Modelling of Landfill Gas Generation: A Review. Rev. Environ. Sci. Biotechnol. 2017, 16, 361–380. [Google Scholar] [CrossRef]
  23. Alexander, A.; Burklin, C.; Singleton, A. Landfill Gas Emissions Model (LandGEM) Version 3.02 User’s Guide; US EPA: Washington, DC, USA, 2005. [Google Scholar]
  24. National Institute of Statistics. General Population Census of the Kingdom of Cambodia 2019. 2020. Available online: https://www.nis.gov.kh/nis/Census2019/Final%20General%20Population%20Census%202019-English.pdf (accessed on 20 September 2021).
  25. Xaypanya, P.; Takemura, J.; Chiemchaisri, C.; Seingheng, H.; Tanchuling, M.A.N. Characterization of Landfill Leachates and Sediments in Major Cities of Indochina Peninsular Countries—Heavy Metal Partitioning in Municipal Solid Waste Leachate. Environments 2018, 5, 65. [Google Scholar] [CrossRef] [Green Version]
  26. Intergovernmental Panel on Climate Change. CH4 emissions from solid waste disposal. In Background Paper-Good Practice Guidance and Uncertainty Management in National Greenhouse Gas Inventory; Jesen, J.F.J., Pipatti, R., Eds.; IGES: Kanagawa, Japan, 2002; pp. 419–439. [Google Scholar]
  27. Cudjoe, D.; Han, M.S.; Chen, W. Power generation from municipal solid waste landfilled in the Beijing-Tianjin-Hebei region. Energy 2021, 217, 119393. [Google Scholar] [CrossRef]
  28. Ayodele, T.R.; Ogunjuyigbe, A.S.O.; Alao, M.A. Life Cycle Assessment of Waste-to-Energy (Wte) Technologies for Electricity Generation using Municipal Solid Waste in Nigeria. Appl. Energy 2017, 201, 200–218. [Google Scholar] [CrossRef]
  29. Hadidi, L.A.; Omer, M.M. A Financial Feasibility Model of Gasification and Anaerobic Digestion Waste-to-Energy (WTE) Plants in Saudi Arabia. Waste Manag. 2017, 59, 90–101. [Google Scholar] [CrossRef] [PubMed]
  30. Plant, G.; Kort, E.A.; Brandt, A.R.; Chen, Y.; Fordice, G.; Negron, A.M.G.; Schwietzke, S.; Smith, M.; Zavala-Araiza, D. Inefficient and Unlit Natural Gas Flares Both Emit Large Quantities of Methane. Science 2022, 377, 1566–1571. [Google Scholar] [CrossRef] [PubMed]
  31. Yang, N.; Zhang, H.; Shao, L.M.; Lü, F.; He, P.J. Greenhouse Gas Emissions during MSW Landfilling in China: Influence of Waste Characteristics and LFG Treatment Measures. J. Environ. Manag. 2013, 129, 510–521. [Google Scholar] [CrossRef]
  32. EPE. Protocol for the Quantification of Greenhouse Gas Emissions from Waste Management Activities, Version 5.0; Entreprises pour L’Environment: Paris, France, 2013. [Google Scholar]
  33. Intergovernmental Panel on Climate Change. The Science of Climate Change: Contribution of Working Group I to the Second Assessment Report of the Intergovernmental Panel on Climate Change; Intergovernmental Panel on Climate Change: Geneva, Switzerland, 1995. [Google Scholar]
  34. Ishigaki, T.; Nakagawa, M.; Nagamori, M.; Yamada, M. Anaerobic Generation and Emission of Nitrous Oxide in Waste Landfills. Environ. Earth Sci. 2016, 75, 750. [Google Scholar] [CrossRef]
  35. Institute for Global Environmental Strategies. List of Grid Emission Factors. Available online: https://doi.org/10.57405/iges-1215 (accessed on 10 December 2022).
  36. Garg, A.; Achari, G.; Joshi, R.C. A Model to Estimate the Methane Generation Rate Constant in Sanitary Landfills using Fuzzy Synthetic Evaluation. Waste Manag. Res. 2006, 24, 363–375. [Google Scholar] [CrossRef]
  37. Wangyao, K.; Yamada, M.; Endo, K.; Ishigaki, T.; Naruoka, T.; Towprayoon, S.; Chiemchaisri, C.; Sutthasil, N. Methane Generation Rate Constant in Tropical Landfill. J. Sustain. Energy Environ. 2010, 1, 181–184. [Google Scholar]
  38. Anh, L.H.; Thanh, T.N.T.; Tuyen, N.T.K.; Bang, H.Q.; Son, N.P.; Schneider, P.; Lee, B.-K.; Moustakas, K. Site-Specific Determination of Methane Generation Potential and Estimation of Landfill Gas Emissions from Municipal Solid Waste Landfill: A Case Study in Nam Binh Duong, Vietnam. Biomass Convers. Biorefinery 2021, 12, 3491–3502. [Google Scholar] [CrossRef]
  39. Abushammala, M.F.M.; Basri, N.E.A.; Kadhum, A.A.H.; Basri, H.; El-Shafie, A.H.; Sharifah, M.S.A. Evaluation of Methane Generation Rate and Potential from Selected Landfills in Malaysia. Int. J. Environ. Sci. Technol. 2014, 11, 377–384. [Google Scholar] [CrossRef] [Green Version]
  40. Srivastava, A.N.; Chakma, S. Quantification of Landfill Gas Generation and Energy Recovery Estimation from the Municipal Solid Waste Landfill Sites of Delhi, India. Energy Sources Part A Recover. Util. Environ. Eff. 2020, 1–14. [Google Scholar] [CrossRef]
  41. Ramprasad, C.; Teja, H.C.; Gowtham, V.; Vikas, V. Quantification of Landfill Gas Emissions and Energy Production Potential in Tirupati Municipal Solid Waste Disposal Site by LandGEM Mathematical Model. MethodsX 2022, 9, 101869. [Google Scholar] [CrossRef]
  42. Ishigaki, T.; Hirata, O.; Oda, T.; Wangyao, K.; Chiemchaisri, C.; Towprayoon, S.; Lee, D.H.; Yam, M. Greenhouse Gas Emission from Solid Waste Disposal Sites in Asia. In Integrated Waste Management; Kumar, S., Ed.; IntechOpen: London, UK, 2011; Volume 2, pp. 462–472. [Google Scholar] [CrossRef] [Green Version]
  43. Christensen, T.H.; Manfredi, S.; Knox, K. Landfilling: Reactor Landfills. In Solid Waste Technology & Management; Christensen, T.H., Ed.; John Wiley & Sons: Chichester, UK, 2010. [Google Scholar] [CrossRef]
  44. Fallahizadeh, S.; Rahmatinia, M.; Mohammadi, Z.; Vaezzadeh, M.; Tajamiri, A.; Soleimani, H. Estimation of Methane Gas by LandGEM Model from Yasuj Municipal Solid Waste Landfill, Iran. MethodsX 2019, 6, 391–398. [Google Scholar] [CrossRef] [PubMed]
  45. Chiemchaisri, C.; Juanga, J.P.; Visvanathan, C. Municipal Solid Waste Management in Thailand and Disposal Emission Inventory. Environ. Monit. Assess. 2007, 135, 13–20. [Google Scholar] [CrossRef] [PubMed]
  46. Gollapalli, M.; Kota, S.H. Methane Emissions from a Landfill in North-East India: Performance of Various Landfill Gas Emission Models. Environ. Pollut. 2018, 234, 174–180. [Google Scholar] [CrossRef] [PubMed]
  47. Chakraborty, M.; Sharma, C.; Pandey, J.; Singh, N.; Gupta, P.K. Methane Emission Estimation from Landfills in Delhi: A Comparative Assessment of Different Methodologies. Atmos. Environ. 2011, 45, 7135–7142. [Google Scholar] [CrossRef]
  48. Kumar, A.; Sharma, M.P. Estimation of GHG Emission and Energy Recovery Potential from MSW Landfill Sites. Sustain. Energy Technol. Assess. 2014, 5, 50–61. [Google Scholar] [CrossRef]
  49. Liang, X.; Kurniawan, T.; Goh, H.H.; Zhang, D.; Dai, W.; Liu, H.; Goh, K.C.; Othman, M.H.D. Conversion of Landfilled Waste-to-Energy (WTE) for Energy Efficiency Improvement in Shenzhen (China): A Strategy to Contribute to Resource Recovery of Unused Methane for Generating Renewable Energy On-Site. J. Clean. Prod. 2022, 369, 133078. [Google Scholar] [CrossRef]
Figure 1. Map of the study area.
Energies 16 04689 g001
Figure 2. Landfilled municipal solid waste composition in Phnom Penh [17].
Energies 16 04689 g002
Figure 3. System boundary for GHG emission quantifications.
Energies 16 04689 g003
Figure 4. (a) Annual CH4 emissions and (b) cumulative CH4 emissions based on the LandGEM and IPCC FOD models.
Energies 16 04689 g004
Figure 5. Contribution of treatments to overall GHG emissions.
Energies 16 04689 g005
Figure 6. Overall GHG emissions based on the LandGEM and IPCC FOD models.
Energies 16 04689 g006
Figure 7. Uncertainty assessment in landfill CH4 estimation.
Energies 16 04689 g007
Table 1. Population, amount of MSW disposal, and per capita MSW disposal from 2009 to 2022.
YearPopulation a
(Thousand)
Waste Landfilled
(t/year)
Per Capita Collection
(kg/cap/day)
YearPopulation a
(Thousand)
Waste Landfilled
(t/year)
Per Capita Collection
(kg/cap/day)
20091393177,224 b0.7020161947717,4351.01
20101461409,3360.7720172043808,5301.08
20111533442,4690.7920182143965,9441.24
20121608492,3800.84201922821,015,9801.22
20131687532,4710.86202023941,035,8781.19
20141770617,4890.96202125111,012,0391.10
20151856681,9051.01202226341,288,2231.34
a The population was estimated based on General Population Census 2019 [24]. b The values represent a six-month period (July–December).
Table 2. The values of MCF recommended in the IPCC 2006 guidelines.
Type of Waste Disposal SiteMCF Default Values
Managed—anaerobic1.0
Managed—semi-aerobic0.5
Unmanaged—deep (>5 m waste) and/or high-water table0.8
Unmanaged—shallow (<5 m waste)0.4
Uncategorized landfill0.6
Table 3. Emission factors used in the study.
ItemEmission FactorUnitReference
Diesel fuel2.70kg CO2-eq/LThis study
Electricity grid0.586kg CO2-eq/kWh[35]
HDPE liner1.9kg CO2-eq/kg[14]
Gravel0.0027kg CO2-eq/kg[31]
Water0.0002kg CO2-eq/L[31]
HCl0.8kg CO2-eq/kg[31]
NaOH1.04kg CO2-eq/kg[31]
Table 4. Comparison of the k and L0 values reported in different studies.
Locationk (year−1)L0 (m3/t)Reference
Phnom Penh, Cambodia0.2190This study
Nam Binh Duong, Vietnam0.35581[38]
Four landfills, Thailand0.33-[37]
Sanitary landfills, Malaysia0.072–0.136151.7[39]
Delhi, India0.05130[40]
Andhra Pradesh, India0.05110[41]
Salvador, Brazil0.2170[2]
Table 5. Comparison of CH4 emissions with field measurement studies.
MethodsLocationAnnual Waste Acceptance (tMSW/year)Annual CH4
Emissions (tCH4/year)
CH4 Emissions Per Unit Disposal (kgCH4/tMSW)References
LandGEM modelDangkao landfill728,37917,72724This study
IPCC FOD modelDangkao landfill728,37921,34129This study
Direct measurement at LFG collection systemNam Binh Doung landfill149,850622542[38]
Closed flux chamber95 landfills in Thailand4,444,60598,14022[45]
Table 6. Estimation of energy generation and GHGs avoided due to electricity substitution.
YearLandGEMIPCC FOD
CH4 Generated (m3/year)Energy
Recovered (GWh)
GHGs Avoided Due to Electricity Substitution (MkgCO2-eq)CH4 Generated (m3/year)Energy
Recovered (GWh)
GHGs Avoided Due to Electricity Substitution (MkgCO2-eq)
2009------
20102,304,2084.102.403,250,3745.783.39
20117,182,35112.777.499,832,57417.4910.25
201211,551,49620.5512.0415,179,26927.0015.82
201315,727,84527.9716.3920,008,04135.5920.85
201419,620,86634.9020.4524,326,23843.2725.35
201523,869,27042.4524.8829,133,91851.8230.37
201628,136,72150.0429.3333,936,51060.3635.37
201732,043,99156.9933.4038,230,51968.0039.85
201836,382,90664.7137.9243,201,96276.8445.03
201941,932,56974.5843.7149,889,42488.7352.00
202047,063,63483.7149.0555,855,02299.3558.22
202151,464,89691.5453.6460,785,458108.1163.36
202254,708,29997.3157.0264,196,796114.1866.91
Average28,614,54350.8929.8234,448,16261.2735.90
Table 7. Quantification of emission factors for landfill scenarios (kg CO2-eq/tMSW).
ActivityS1S2S3S4
LandGEMIPCCLandGEMIPCCLandGEMIPCCLandGEMIPCC
Fugitive CH4820.09998.86820.09998.86405.53493.94190.67291.42
Landfill operation1.161.1610.1611.3211.9213.0814.2715.43
Leachate treatment--14.3814.3814.3814.3814.3814.38
N2O emission17.6021.4317.6021.438.8010.724.405.36
Electricity offset------−51.89−63.20
Carbon sequestered−104.51−104.51−104.51−104.51−104.51−104.51−104.51−104.51
Total734.33916.94757.72941.49336.12427.61115.91157.85
Disclaimer/Publisher’s Note: The statements, opinions and data contained in all publications are solely those of the individual author(s) and contributor(s) and not of MDPI and/or the editor(s). MDPI and/or the editor(s) disclaim responsibility for any injury to people or property resulting from any ideas, methods, instructions or products referred to in the content.

