Article

Perception of Prosumer Photovoltaic Technology in Poland: Usability, Ease of Use, Attitudes, and Purchase Intentions

1
Department of Economics and Informatics, Faculty of Organization and Management, Silesian University of Technology, Akademicka 2A, 44-100 Gliwice, Poland
2
Central Mining Institute, Plac Gwarków 1, 40-166 Katowice, Poland
*
Author to whom correspondence should be addressed.
Energies 2023, 16(12), 4674; https://doi.org/10.3390/en16124674
Submission received: 10 May 2023 / Revised: 7 June 2023 / Accepted: 11 June 2023 / Published: 12 June 2023

Abstract

:
This article aims to examine the factors affecting the acceptance of photovoltaic technology in Poland. Questions were asked about the perceived usefulness and ease of use of PV technology, how the attitudes and intentions of using PV technology are shaped, and how activities related to the promotion of PV technology are perceived. An examination was also conducted on which sociodemographic variables influence the above-mentioned constructs. As a result of the analysis, it was found that the economic usefulness of prosumer PV technology is rated the highest from the cost perspective. In terms of perceived ecological utility, the highest ratings were assigned to intentions to increase the production of green energy and to perceiving PV heating as ecological. In both of the above cases, the variables that statistically significantly influenced this assessment were age and the fact of having a PV system. The perceived ease of use of the PV system was also rated highly. The answers provided differed significantly depending on the possession of a PV system, gender, size of the place of residence and whether there was a person with technical education in the household. It was also noted that the attitudes towards the technology of prosumer PV systems are very favorable in terms of all the examined variables defining this construct. The variables that statistically differentiated the answers were experience in using PV systems, age, and size of the town. Furthermore, attention was drawn to ambiguous assessments of the perception of activities related to the promotion of prosumer PV systems. It was established that the only sociodemographic variable that determines statistically significant differences is age.

1. Introduction

To mitigate climate change and become independent of fossil fuels, numerous activities are being undertaken to support the acquisition of electricity from clean and renewable sources. However, the adoption of new technologies is not immediate and problem-free, as it is associated with significant financial outlays and changes in the way of thinking, which is determined by many sociodemographic variables [1]. Such conditions are also met by the technology of prosumer photovoltaic (PV) systems in Poland, which are the subject of this study. Many research works have already been dedicated to this topic, which indicates a considerable interest in this research area [2,3,4,5,6,7,8,9,10,11,12,13,14,15]. Researchers have made many attempts to identify factors influencing the adoption of prosumer PV technology using different approaches and models. Correlation studies are very often used in research [3,11,13] and in modelling structural equations [5,7]. Despite this, the factors affecting the acceptance of prosumer PV systems are still under-researched. To fill this gap, we propose research based on the technology acceptance model (TAM). While researching the acceptance of PV technology in Poland, we decided on a complex research process, starting with the qualitative research presented in the article by [9] and afterwards, the quantitative research based on Structural Equation Modeling (SEM) presented in the article by [10]. Both articles were created as part of cooperation in the same author’s group. In the article by [10], we answer questions about factors influencing the intention to use PV technology by analyzing paths on constructs (latent variables) resulting from the technology acceptance theory. In our opinion, this does not give sufficient insight into the observable variables shaping individual constructs. Thus, in the present article, we wanted to extend our earlier analysis to study the impact of categorical (sociodemographic) variables on the variables that make up these constructs.
This article aims to empirically examine the factors affecting the acceptance of photovoltaic technology in Poland. As the theoretical background of the research, the technology acceptance model was used, in which the usability and ease of use of technology determine attitudes towards it, and these, in turn, determine the intentions of use. Since each of these constructs belongs to the so-called latent variables, their examination is possible by measuring a number of observable variables. Therefore, we based our empirical research on measuring these variables and examining how their distributions are shaped and which sociodemographic variables influence this distribution.
In connection with the above aim, the article poses the following research questions:
Research Question 1: How is the usefulness and ease of use of PV technology perceived, and what variables shape this perception?
Research Question 2: How are the attitudes and intentions of using PV technology shaped, and what variables influence them?
Research Question 3: How is the promotion of PV technology activities perceived, and what variables influence it?
To answer these questions, surveys were conducted in March and April 2022 with the participation of 430 people. The collected data were analyzed using one- and two-dimensional statistical analysis and visualization techniques.
The originality of the considerations and research undertaken in this article results from the following circumstances: (1) filling the research gap in terms of the impact of sociodemographic variables on the variables measuring the utility, ease of use of the PV system, attitudes towards it and purchase intentions; (2) formulating recommendations for activities that enhance the acceptance of prosumer photovoltaic technology.

2. Theoretical Background

Factors influencing the adoption of innovative technology are being studied by scientists using many models. The most popular models are based on: the theory of reasoned action (TRA) [16], the theory of planned behavior (TPB) [17], the theory of diffusion of innovation (DOI) [18], the technology acceptance model (TAM) [19] and the unified theory of acceptance and use of technology (UTAUT) [20]. In this study, we decided to choose a technology acceptance model. This is due to the fact that PV technology is relatively new in Poland, and therefore TAM, which is used to study the general conditions of the technology, can provide insight into these conditions. TAM treats the intentions of these behaviors as the basic construct shaping behavior (i.e., the use of a given technology), which in turn is determined by attitudes towards the researched technology. Attitudes are shaped by two constructs, i.e., the perceived usefulness of technology and its ease of use. Attitude is defined as the result of beliefs and judgments towards an idea or object [21]. This means that they can be positive or negative.
Positive attitudes towards PV technology may result from the perception of this technology as clean, emission-free and resource-saving [22,23], and negative from high installation costs [24]. This has a significant relationship with how the usefulness of this technology is perceived. The utility is a multidimensional construct, as it can be perceived in economic, ecological and even social terms.
The economic utility is related to the fact that a PV system can generate long-term benefits in the form of energy security and savings in electricity bills achieved thanks to this system [9]. The more consumers pay for electricity bills, the more likely they are to invest in a PV system [4]. For many potential investors, the benefits of subsidies and tax reliefs widely used by various countries to popularize PV technology may also be important. As research shows [3,24,25,26], these activities contribute to the dissemination of PV systems. However, high installation costs may be a problem—they can affect the decision of whether it is worth investing in this technology. According to research by [24], the cost of installing PV is perceived as a disincentive to invest in this technology. Therefore, investors are usually people whose income and accumulated capital are large enough to buy and install PV systems [4,27,28,29]. In Poland, several economic incentives support investments in prosumer PV systems. These are tax breaks and programs that provide direct subsidies for investments. The most well-known programs include the nationwide government program “My Electricity” and numerous local government programs. In addition, research by [11] revealed that the development of prosumer photovoltaics depends on GDP. In addition to income and accumulated capital, the willingness to invest in PV technology may be affected by age. Research by [29,30,31] revealed that age is negatively correlated with the intention to purchase a PV system. Over time, the perception of PV technology changes, especially for people who have made the decision to invest in and use the technology. If the investment meets their expectations, they can decide to expand the system and invest further funds [9].
Along with the dissemination of the idea of sustainable development and the escalating climate crisis [32], ecological benefits, i.e., ecological utility, may also be important to many people. The use of green electricity reduces greenhouse gas emissions, saves natural resources, and thus enables ecological behavior [3]. Evidence that beliefs about the ecological benefits of PV systems influence decisions are also provided by [33,34,35,36,37]. However, as research has shown [9], for some, the production process of PV panels and electronics related to this technology may not be ecological, and some may be convinced that the use of PV technology is not conducive to pro-environmental behavior. However, as in the case of economic utility, other demographic variables may affect ecological utility.
Acceptance of technology is also related to how easy it is to use. According to research by [9], the system itself is established by professional companies and takes quite a short time, and the use of the system is assessed as maintenance-free. Over time, however, the system may need maintenance. It may also need repair. However, as research shows [38,39], decisions on investing in a PV system depend on household members’ traits. An important feature is the type of skills resulting from gender and education. People with a technical education may be more willing to make decisions about investing in PV technology. In Poland, technical education is chosen mostly by men. They also usually repair or supervise these repairs in households. This may suggest that men will be more willing to invest in PV systems, which is confirmed by research by [4]; however, research by [40] shows women as more likely to make such investments. As in the case of economic and ecological utility, other demographic variables may also influence the assessment of ease of use.
Given that the variables observed in the literature affect the acceptance of prosumer PV technology, we put forward three hypotheses corresponding to the first research question:
Hypothesis 1a.
The assessment of the economic utility of a PV system is affected by such variables as experience in using the system, age, sex, technical education, and place of residence.
Hypothesis 1b.
The assessment of the ecological utility of a PV system is affected by such variables as experience in using the system, age, sex, technical education, and place of residence.
Hypothesis 1c.
The assessment of the ease of use of a PV system is affected by such variables as experience in using the system, age, sex, technical education and place of residence.
Due to the fact that the technology acceptance model assumes that the perceived usefulness of the technology and its ease of use influence the attitudes, and these influence the intentions of using this technology, and due to the fact that the importance of these relationships for prosumer PV technology has been confirmed in research by [10], we put forward two more hypotheses regarding the attitudes and intentions of using PV technology, corresponding to the second research question:
Hypothesis 2a.
Attitudes towards use of a PV system are affected by such variables as experience in using the system, age, sex, technical education and place of residence.
Hypothesis 2b.
The purchasing of a PV system is affected by such variables as experience in using the system, age, sex, technical education and place of residence.
Intentions to use PV technology are also significantly influenced by the promotion of this technology. In Poland, a few programs financially support the installation of PV systems for prosumers. Several marketing campaigns in the media accompany them. In addition, companies installing PV systems run their advertising campaigns. The significant impact of the promotional policy has been demonstrated in the paper [41,42]. Empirical studies confirming the significance of this relationship in Poland are presented in the paper by [10]. However, the impact of promotional policies may vary depending on age, gender, place of residence and familiarity with PV technology. In connection with the above, we put forward one more hypothesis corresponding to the third research question:
Hypothesis 3:
The perception of activities related to the promotion of PV technology is affected by such variables as experience in using the system, age, sex, technical education, and place of residence.

3. Methodological Aspects

3.1. The Data Collection Process and the Construction of the Questionnaire

To answer the research questions posed at the beginning, surveys were conducted. Table 1 presents the questionnaire questions. The respondents were asked to answer them according to a five-point Likert scale. Their answers were coded according to the following key: 5—Agree, 4—Rather agree, 3—Do not know, 2—Rather disagree and 1—Disagree.

3.2. Research Sample

Four hundred and thirty respondents took part in the research. Data were collected in March and April 2022. Of those surveyed, 47% were women and 53% were men. The age of the respondents was divided into four groups: up to 24 years old (7.2%), 25–39 years old (33%), 40–54 years old (42%) and over 54 years old (17.9%). This age structure was dictated by the premise that respondents were sought that would have appropriate capital that could potentially be invested in a prosumer PV system. Among the respondents, 21% declared that they had a PV system in their households, while 79% did not. In addition, the respondents were asked whether there was a person with a technical education in the household of the respondents (69%). Details of the research sample are presented in Table 2.

3.3. Research Model and Data Analysis

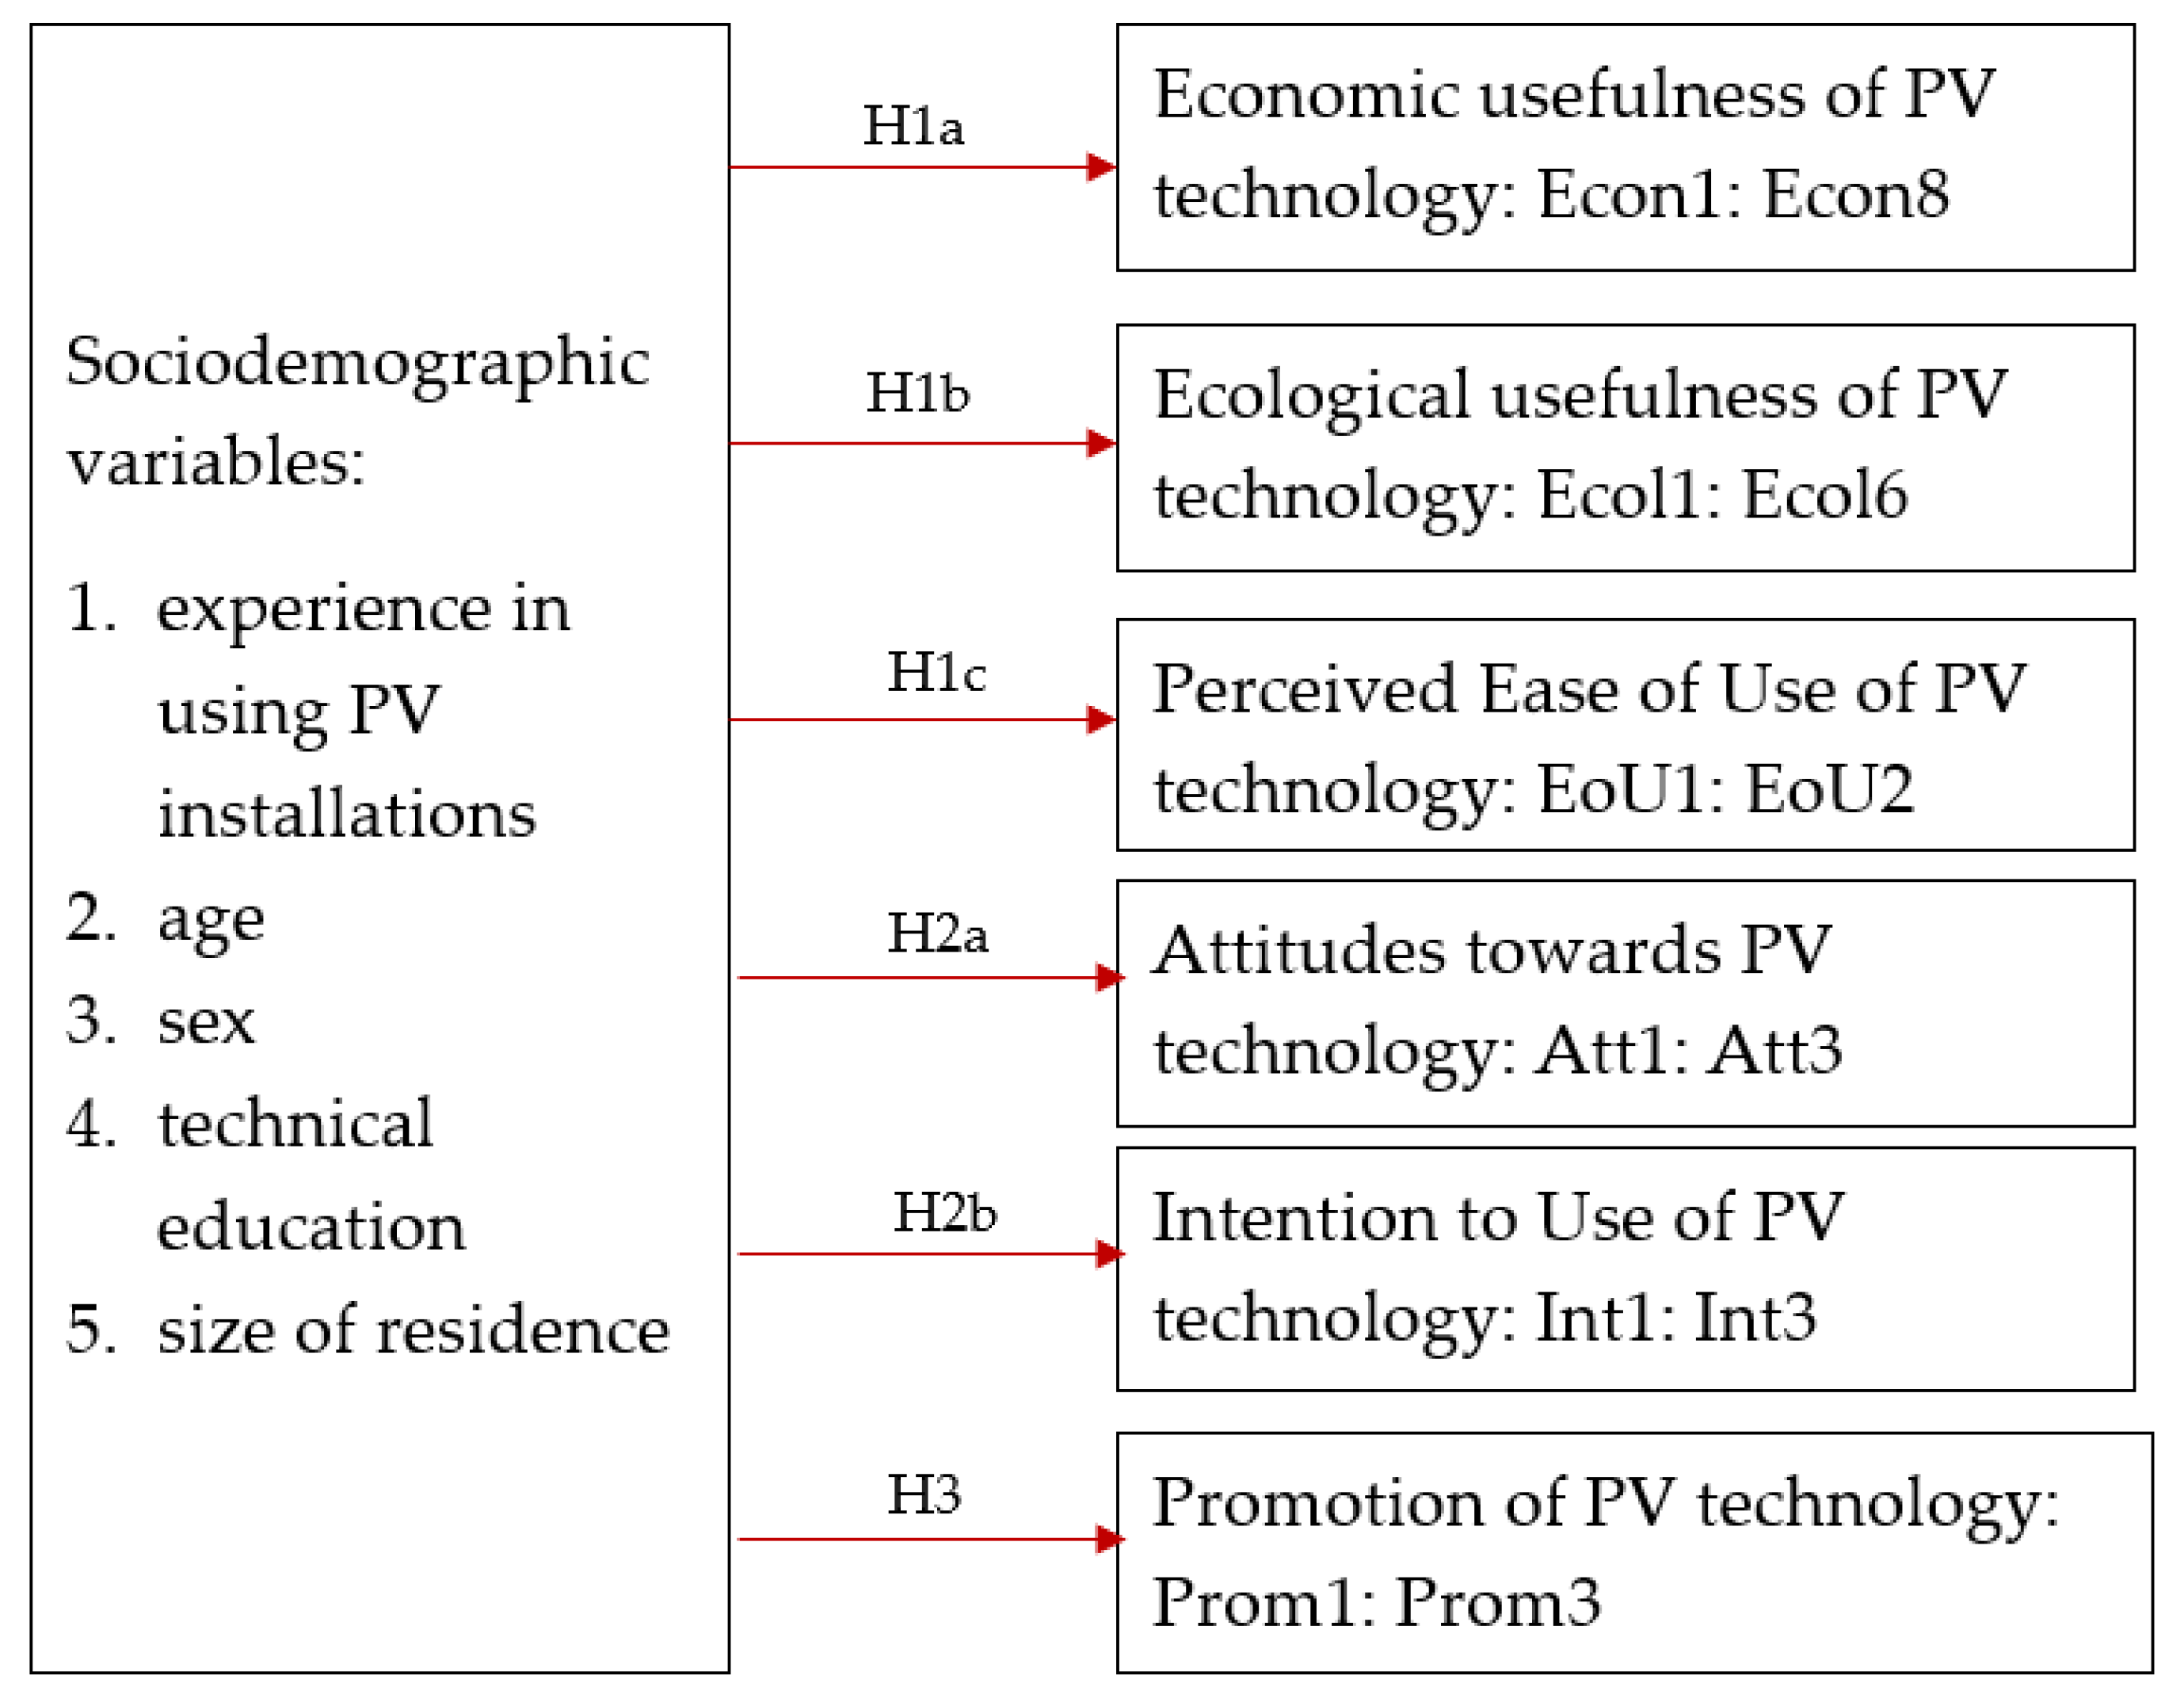
After collecting the survey data, the data were analyzed in two stages. In the first stage, the distribution of answers to questions related to individual constructs resulting from the theory of technology acceptance was described. In the second stage, tests were carried out to determine the dependence of these answers on sociodemographic variables. The examined sociodemographic variables were experience in using a photovoltaic system, age, sex, technical education, and the size of the town. The tests to examine the dependence of the responses on these variables are the Mann–Whitney U (for two subgroups) or Kruskal–Wallis (for more than two subgroups). In cases where significant differences in responses were found between multiple groups, post hoc tests were performed: paired Mann–Whitney U tests between each pair of groups. The research model with hypotheses is shown in Figure 1.

4. Test Results

Cronbach’s α coefficients were calculated for each construct to test scale reliability. As shown in Table 3, they all exceed the assumed threshold value of 0.7.

4.1. Economic Usefulness and Ease of Use of a Prosumer PV System

4.1.1. Economic Usefulness

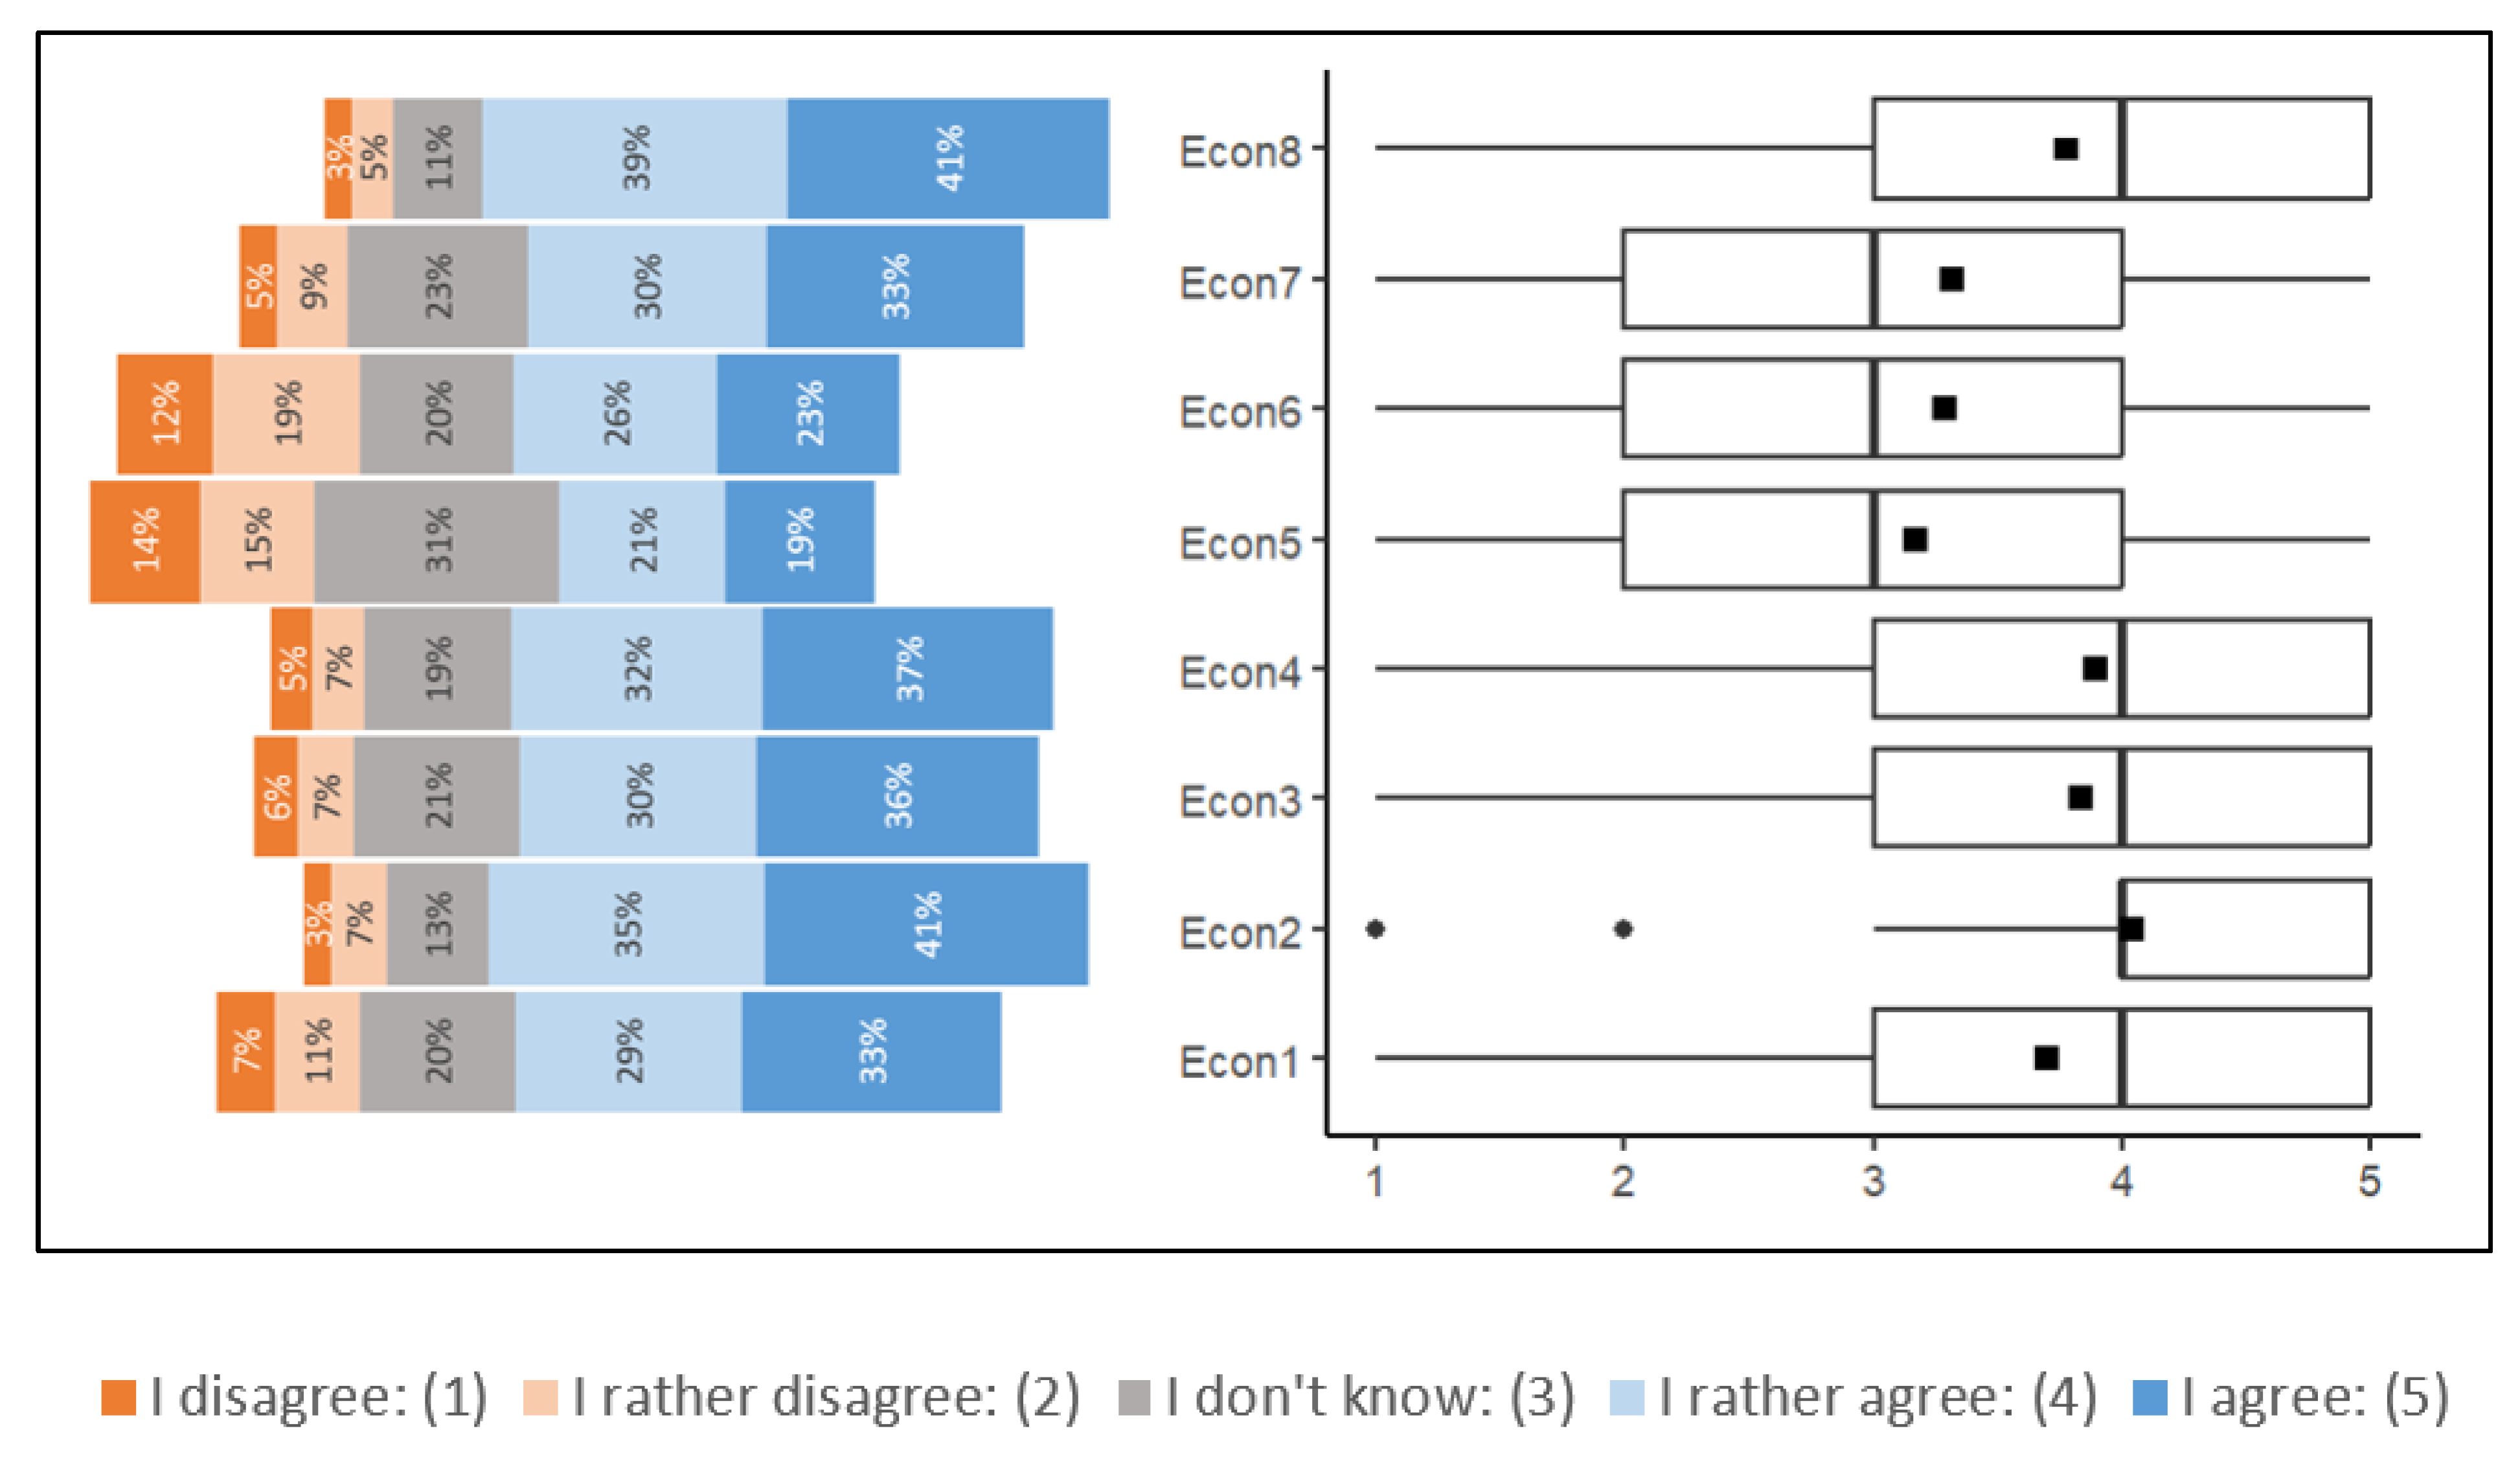
To find an answer to the question “How is the economic utility of PV systems perceived?”, respondents were asked to respond to the statements regarding the economic utility of household photovoltaic systems. Figure 2 shows the distribution of ratings for these statements.
The respondents most positively responded to the statements that PV panels are a good hedge against rising electricity prices (Econ2, average: 4.04) and the introduction of photovoltaic technology in their household will allow them to reduce costs (Econ4, average: 3.9) and save money (Econ3, average: 3.8). In addition, the very prospect of lowering electricity bills would encourage the respondents to invest in PV (Econ8, average: 3.8), and they considered the system of PV to be a good capital investment (Econ1, average: 3.7). The distributions of responses to the above-mentioned statements have asymmetric distributions with a concentration at high ratings and a median of 4 (cf. Figure 2). Statements regarding incentives to install PV panels, i.e., tax relief (Econ7) and a subsidy of PLN 3000–5000 (Econ6) with an average of 3.3 and the statement that the introduction of photovoltaic technology allows for profits (Econ5, average of 3.2) received the lowest ratings. The distributions of answers to these questions are more symmetrical, with a median of 3 (cf. Figure 2).
To answer the question “What variables affect the economic utility of a PV system?” Mann–Whitney and Kruskal–Wallis U tests and (if differences were detected) paired post hoc tests were performed. The variables significantly influencing the answers were having a PV system and the age of the respondents. The results are presented in Table 4.
Owners of PV systems rated the economic benefits of owning systems significantly higher. The only variable that does not depend on whether respondents had a PV installation system was the Econ5 variable (i.e., making profits thanks to the photovoltaics system). The presented results allow the conclusion that the users of PV systems perceive the economic benefits of the system better than people who do not use such systems. Therefore, users of PV systems in discussions about photovoltaics will emphasize its economic advantages.
When examining the influence of age on variables concerning the economic utility of PV systems after conducting the Kruskal–Wallis tests and—in the case of significant dependences on age—post hoc tests for multiple two-way comparisons, it was found that five out of eight of the tested variables are affected by this influence: Econ2—Econ6. In the case of finding that the PV system will allow them to achieve profits (Econ5) and a subsidy of PLN 3000–5000 could induce the respondents to install photovoltaic panels (Econ6), the group with significantly the highest average answers was the youngest age group (p-value for Econ5 paired with: “25–39”: 0.001, “40–54”: 0.000, “over 54”: 0.000; p-value for Econ6 paired with: “25–39”: 0.003, “40–54”: 0.001, “over 54”: 0.006). In responses to the statement that introducing PV in the home will save money (Econ3), the significance of the Kruskal–Wallis test was due to the differences between the youngest group that rated it highest and the two middle groups: “25–39” and “40–54” (p-value in both cases: 0.002). Similarly, in the case of statements that PV panels are a good hedge against rising electricity prices (Econ2) and that the introduction of PV at home will reduce costs (Econ4), significant differences were found in the answers given by the youngest age group (higher ratings) and the groups: “25–39” and “40–54” (p-value for Econ2 paired with: “25–39”: 0.007, “40–54”: 0.042; p-value for Econ4 paired with: “25–39”: 0.031, “40–54”: 0.038). In these cases, however, one can also notice (albeit on the borderline of 0.05) a difference between the group “25–39” and the group “over 54” (p-value for Econ2: 0.041; p-value for Econ4: 0.047). In both cases, the ratings of the oldest group were higher than those of the “25–39” group. There were no significant differences in responses by sex and other sociodemographic variables.

4.1.2. Ecological Usefulness

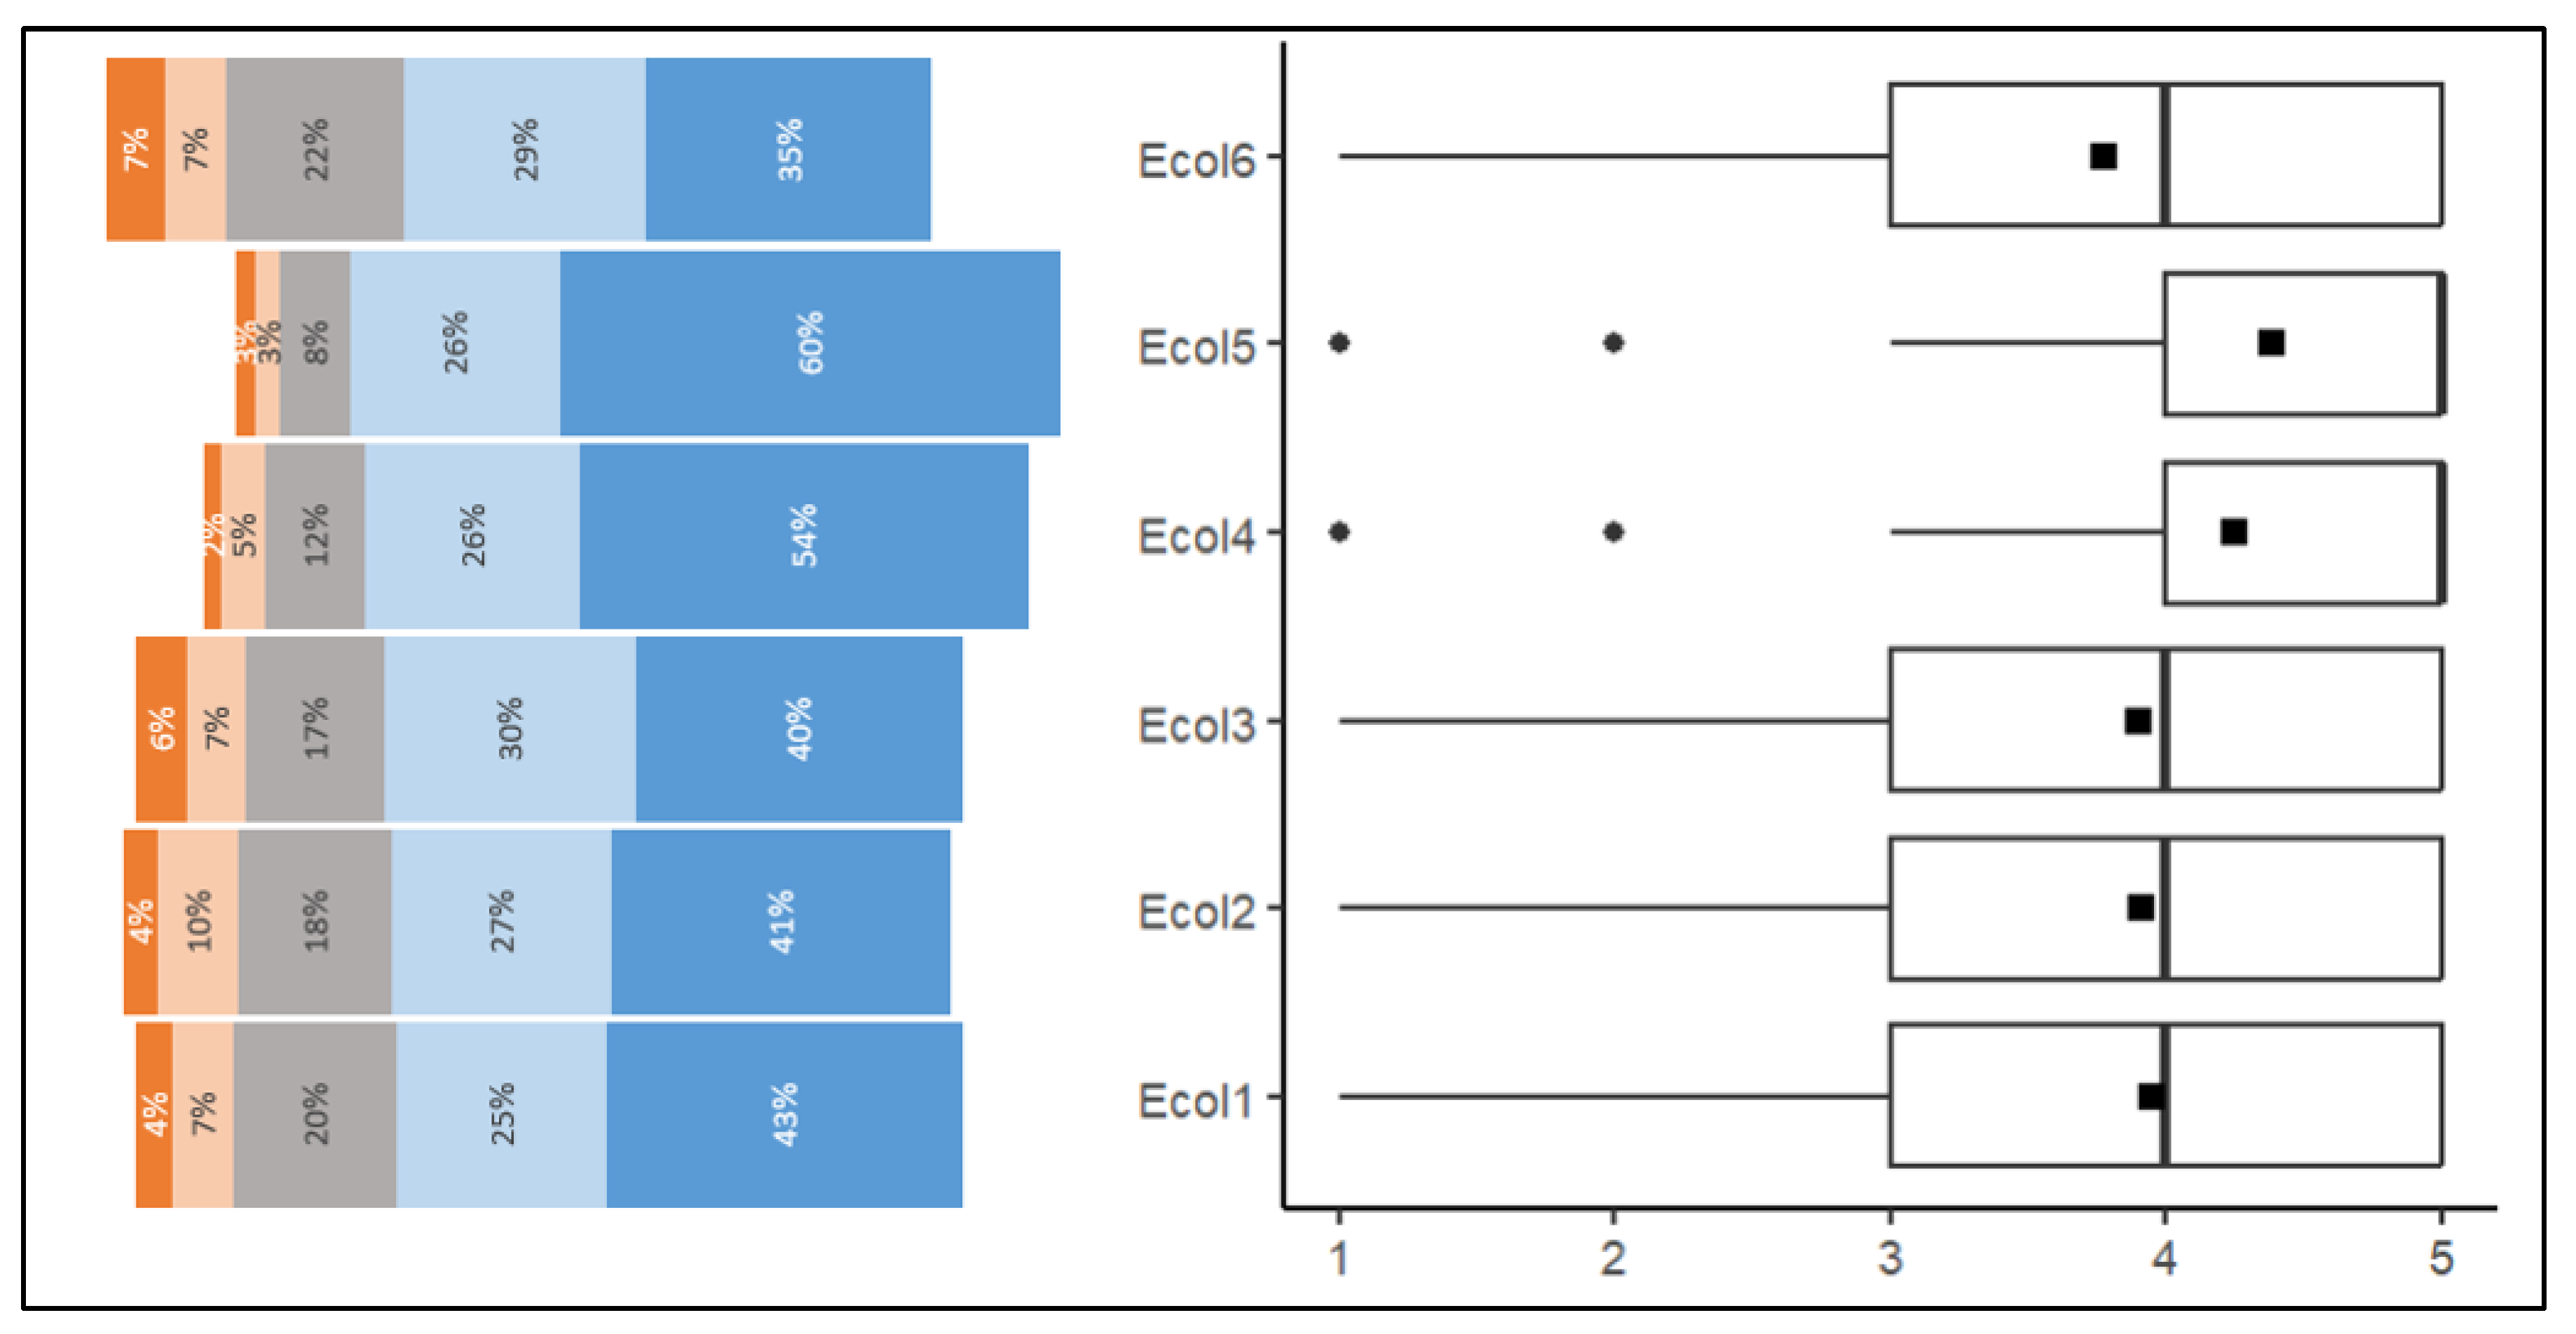
To answer the question “How is the ecological utility of PV systems perceived?”, respondents were asked to respond to the statements regarding the ecological aspects related to PV systems. The distribution of responses is shown in Figure 3.
The respondents were definitely in favor of the ecological benefits of PV systems, evaluating them higher than the economic benefits. The average values of their ratings oscillated around 4, and the lower quartiles around 3 or 4. The statement that one should strive to increase the production of green energy was assessed most favorably (Ecol5, average: 4.4). In second place was the statement that heating with electricity from PV is ecological (average: 4.3). The impact of the photovoltaic system on reducing greenhouse gas emissions (Ecol1), saving natural resources (Ecol2) and pro-environmental behavior was rated at an average of 3.9. The view that PV investments have a positive impact on the environment was rated on average at 3.8. As seen in Figure 3, the response distributions are asymmetric, with a concentration at high ratings.
To answer the question “What variables affect the perception of the ecological utility of PV systems?”, the Mann–Whitney U and Kruskal–Wallis tests were used. As before, the variables significantly affecting the answers turned out to be experience in using PV systems and the age of the respondents. The results are presented in Table 5.
Statements for which PV users answered differently than those without such systems concerned five out of six statements. They referred to the impact of PV on the environment and the resulting pro-ecological behavior. In these cases, PV users rated the positive impact of these systems for the environment significantly higher. It is worth noting that the opinion (Ecol5), for which no significant differences were found in the assessments of both groups, did not directly concern PV systems, but the general opinion on environmental protection and pro-ecological behavior. The same was true for the age of the respondents, where the answers to this question also did not differ. In addition, no significant differences by age were found in responses to the Ecol4 statement.
After conducting post hoc tests, it can be seen that people from the oldest age group usually rated the environmental benefits of PV systems significantly higher than other age groups. The ratings of people from the oldest age group regarding statements about pro-ecological behavior thanks to the PV system (Ecol3) and the positive impact of PV on the environment (Ecol6) were significantly higher than the ratings of all other groups (p-value for Ecol3 paired with: “up to 24”: 0.018, “25–39”: 0.002, “40–54”: 0.033; p-value for Ecol6 paired with: “up to 24”: 0.002, “25–39”: 0.000, “40–54”: 0.003). On the other hand, in the case of finding Ecol1, the oldest people assessed the impact of PV on reducing greenhouse gas emissions significantly higher than the two middle groups: “25–39” and “40–54” (p-value paired with: “25–39”: 0.003, “40–54”: 0.015). Similarly, in relation to the statement that having PV helps to save natural resources (Ecol2), where significant differences were shown between the answers, the oldest group gave significantly higher ratings than the two middle age groups (p-value paired with: “25–39”: 0.000, “40–54”: 0.015). However, this formulation also shows significant (albeit on the borderline of 0.05) differences in the responses of the “25–39” and “40–54” groups. The older one gave higher ratings (p-value = 0.043).

4.1.3. Perceived Ease of Use

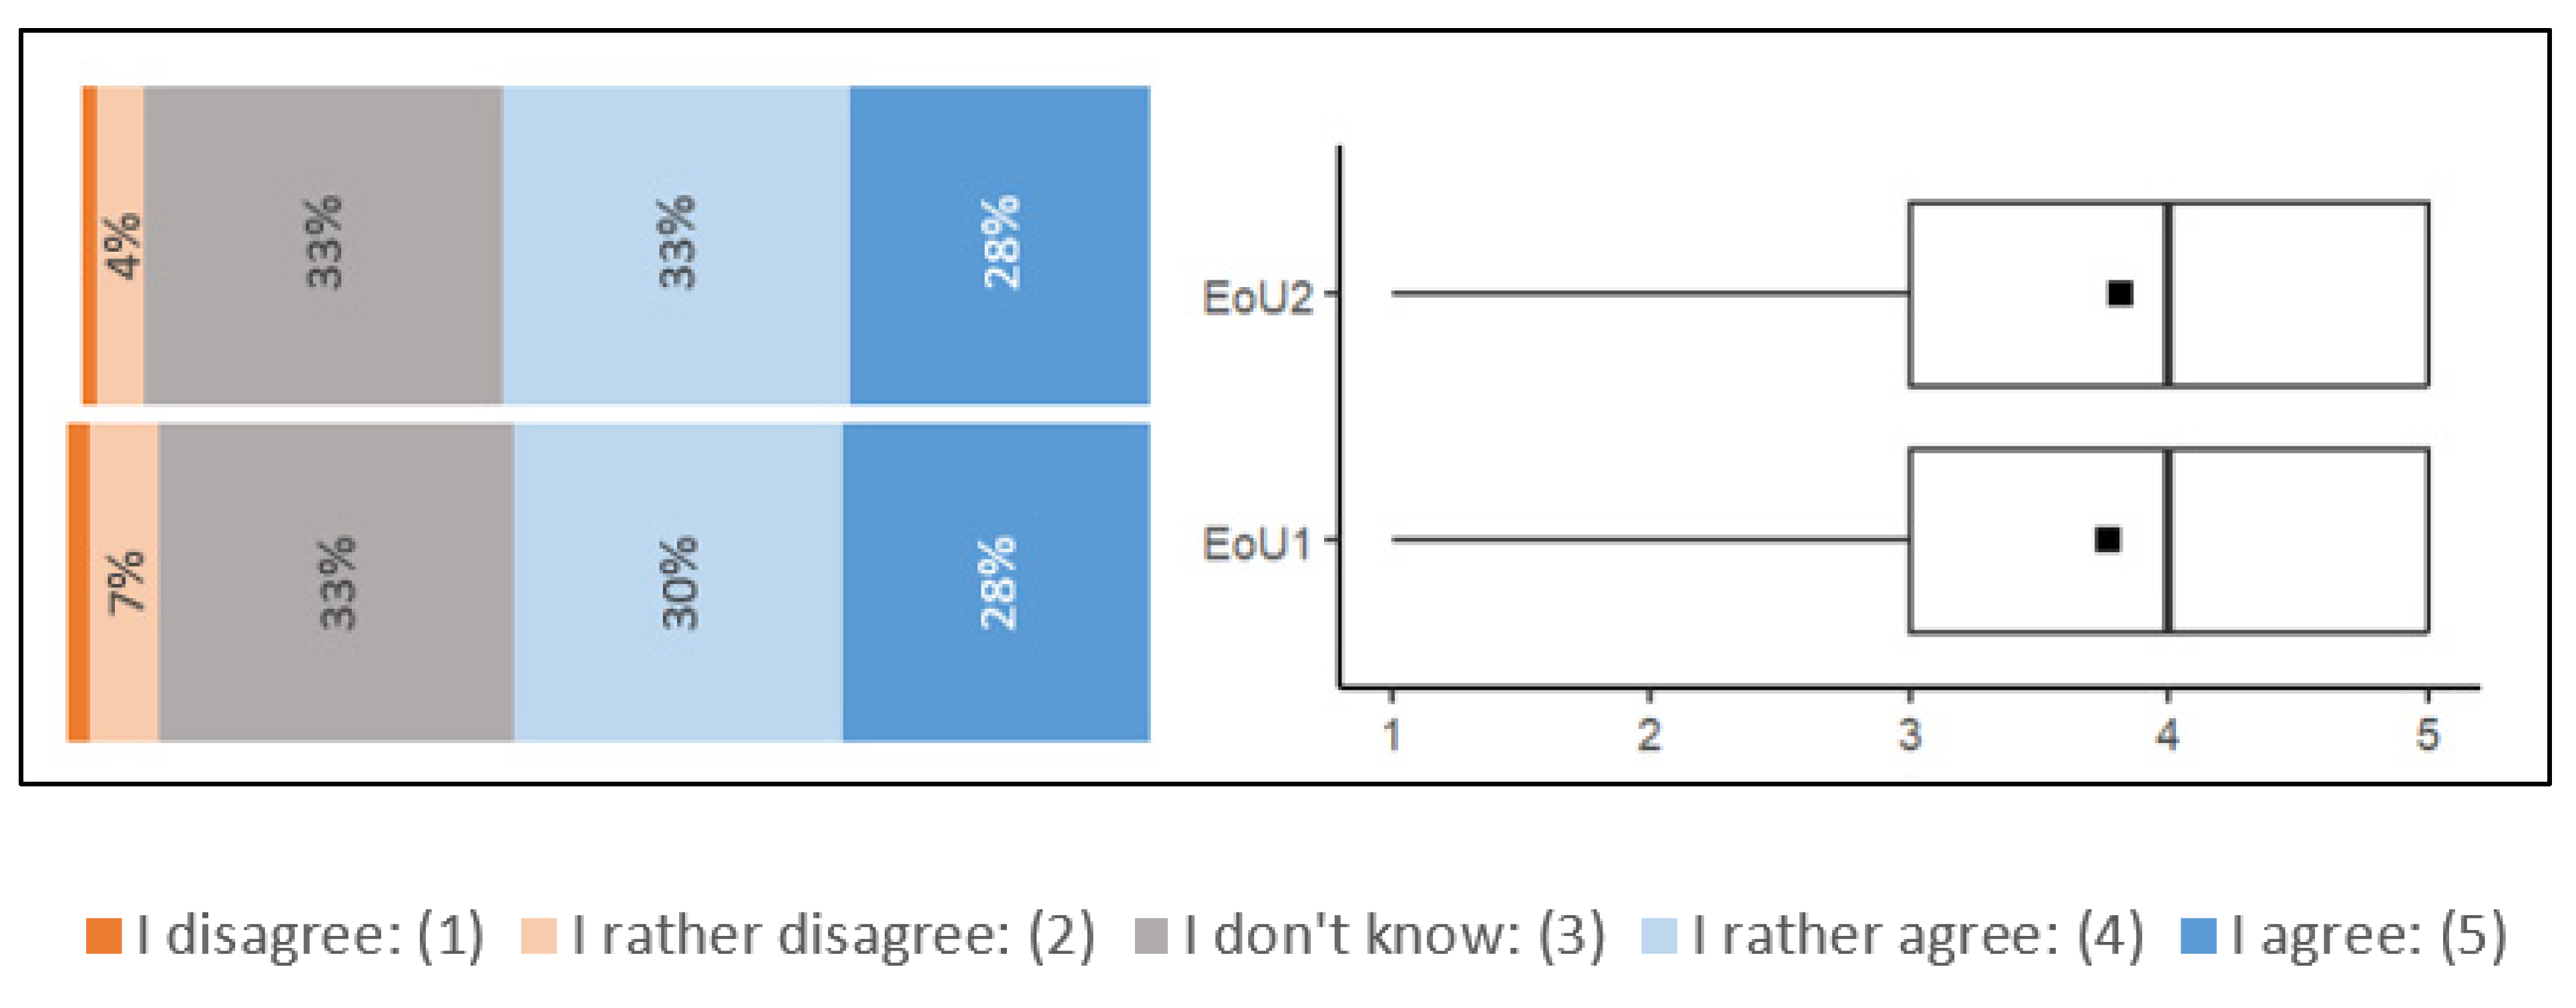
To answer the question “How is the perceived ease of use associated with owning a PV system?”, respondents were asked to respond to two statements (Figure 4).
The distributions of responses for both statements were asymmetric with a concentration at high ratings. The average rating for both statements was 3.8. This means that the ease of use of the PV system was assessed positively.
To answer the question of whether experience in using PV systems and other sociodemographic variables influence the perception of ease of use of PV systems, the Mann–Whitney and Kruskal–Wallis U tests and (if differences were detected) paired post hoc tests were performed. The answers provided significantly differed depending on the respondents’ experience in using PV systems, gender, size of the place of residence and whether there was a person with technical education in the household (Table 6).
Users of PV systems significantly more often considered learning to use and operate the photovoltaic technology to be easy. Moreover, when there was a person with a technical education in the respondent’s household, the ratings were significantly higher. Men were significantly more open to using and learning PV.
With regard to the size of the town, for significant differences, post hoc tests were performed as before, determining p values for two-sided comparisons. People from small towns more often than people from larger cities shared the belief that learning to use photovoltaic technology is easy (EoU1: p-value paired with: “10,000–100,000”: 0.030, “>100,000”: 0.012). However, with the view that the operation of PV systems is easy (EoU2), the significance of the Kruskal–Wallis test resulted from the differences between the inhabitants of the smallest and largest towns (p-value = 0.007). Here too, residents of small towns more often agreed with the view that the operation of PV systems is easy. This result is due to the fact that a greater number of systems are located in small towns, so the answers in this matter were based on the users’ own experience in operating PV systems.

4.2. Attitudes and Intentions of Using PV Technology

4.2.1. Attitude towards PV Technology

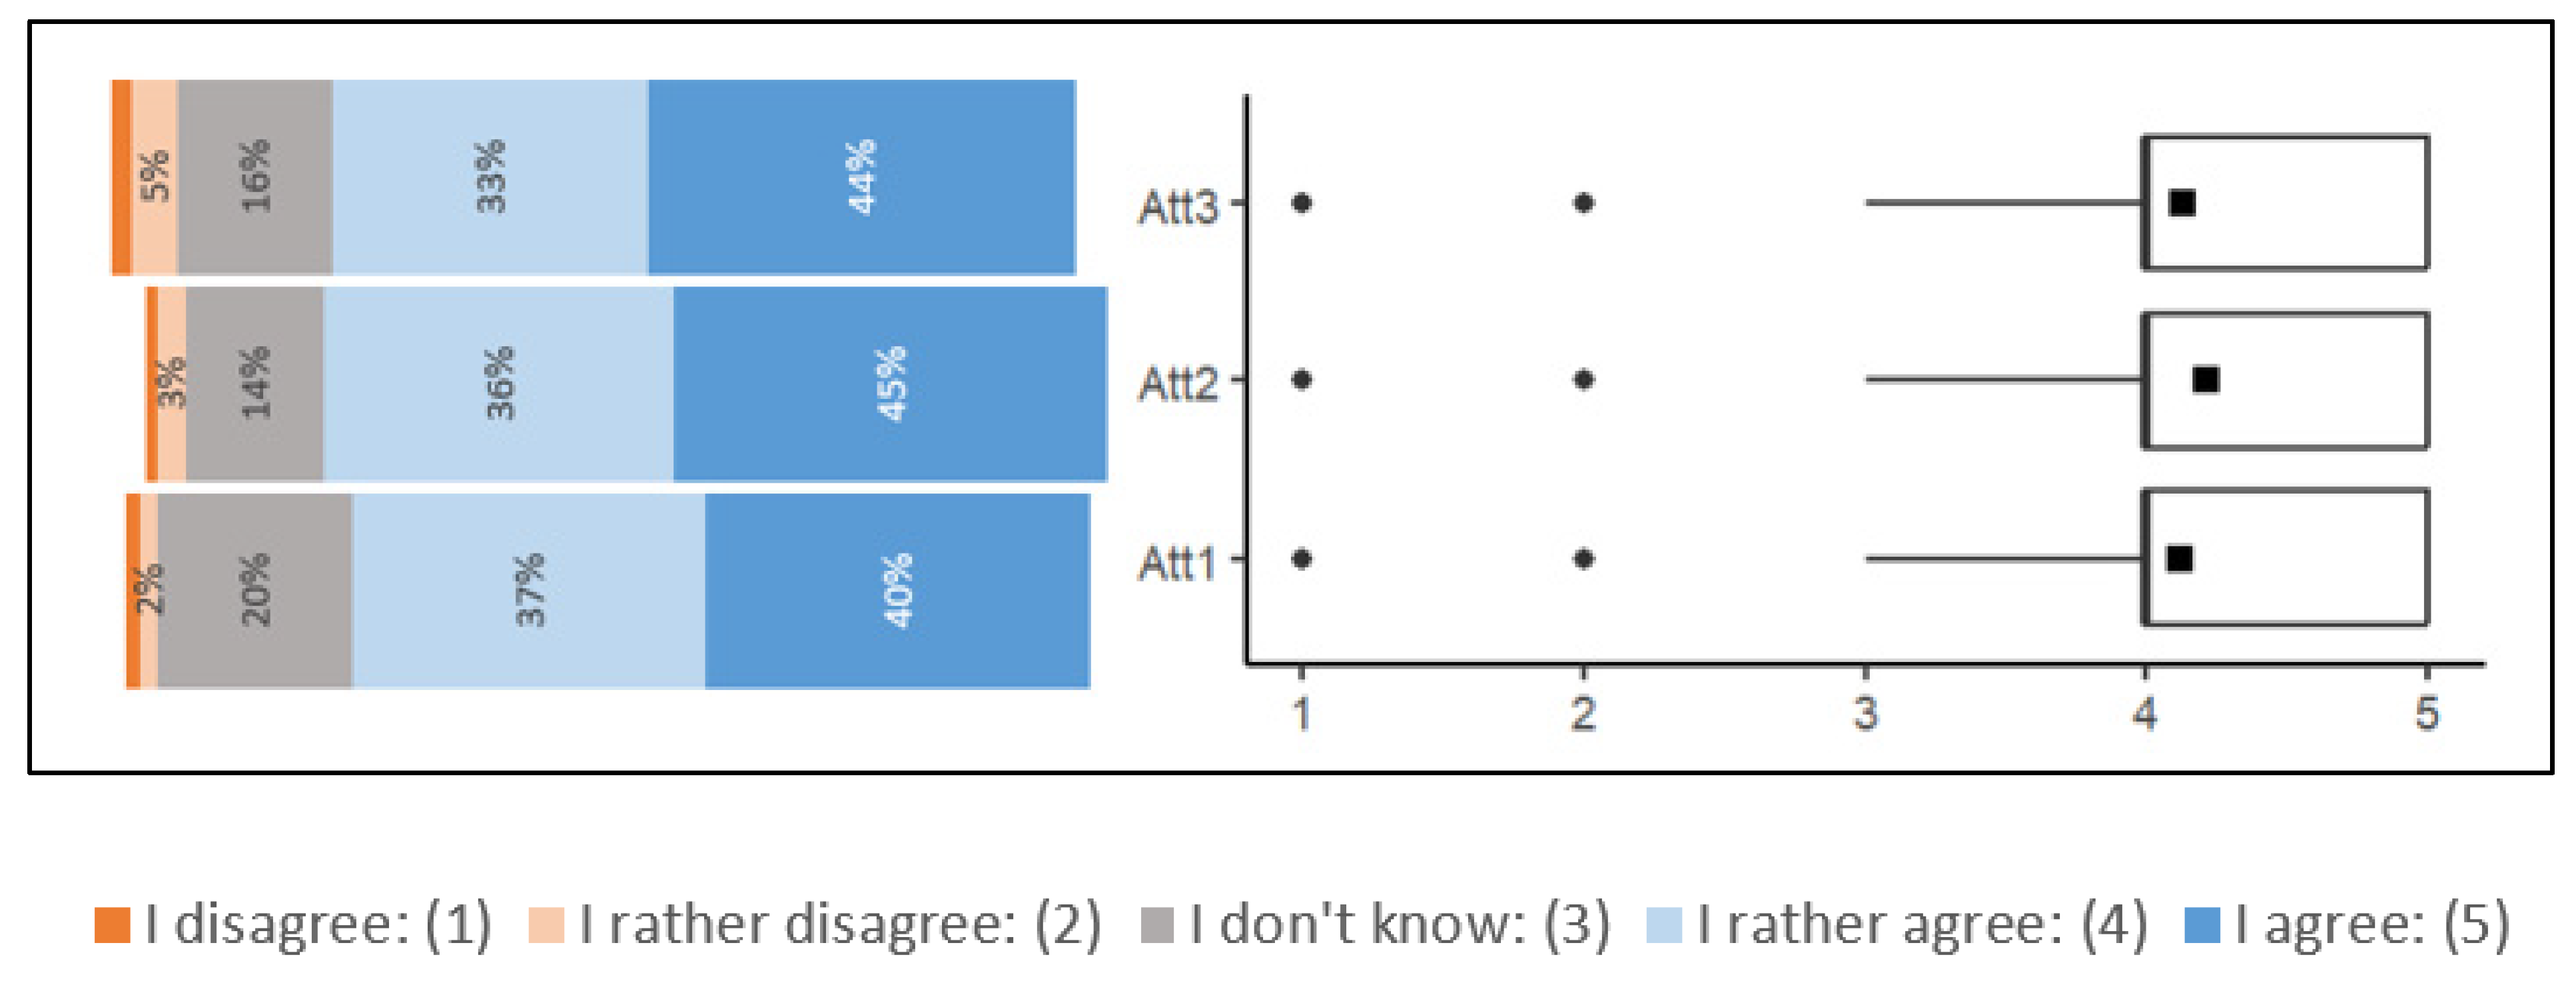
To answer the question about the attitudes towards PV technology, the respondents were asked to respond to three statements (Figure 5).
In the case of this construct, all statements were assessed very favorably. Response distributions are asymmetric, with a concentration at high ratings and means above 4.0. Respondents liked the idea of using a clean source of electricity in their households (average: 4.2) as well as the idea of having PV panels as a source of electricity (average 4.1). They also agreed that it would be good (in due course) to use solar energy in their homes (average 4.1).
Subsequently, the Mann–Whitney and Kruskal–Wallis U tests were conducted to check whether experience in using PV systems and other sociodemographic variables influence attitudes towards PV technology. The answers to the statements regarding attitudes towards PV differed significantly due to the fact of having this technology, the age of the respondents, and the size of the town in which they lived (Table 7).
Analyzing the results, it can be concluded that the attitude of users of photovoltaic systems to this technology was significantly better: they assigned higher marks.
In the case of the age of the respondents and the size of the town, post hoc tests were carried out for significant differences, determining p values for two-sided comparisons. People from the “25–39” age group significantly less often than the two oldest age groups agreed with the statement that it would be good (in due time) to use solar energy in their homes (Att1; p-value paired with: “40–54”: 0.029, “over 54”: 0.003). Similarly, the two oldest groups liked the idea of using a clean source of electricity in their homes more often than the two youngest groups (Att2; p-value paired with: “up to 24”: 0.007 and 0.001, “25–39”: 0.007 and 0.001 for “40–54“ and “over 54”, respectively). To the statement “I generally like the idea of having PV panels as a source of electricity“, the oldest people reacted more positively, with significant differences compared to the two youngest groups (Att3; p-value paired with: “up to 24”: 0.035, “25–39”: 0.008).
Reactions to two out of three statements of the tested construct differed significantly, also due to the size of the respondents’ towns: Att1 and Att2. After conducting post hoc tests, it turned out that this significance results from the differences between the opinions of the inhabitants of small towns, who assessed them more favorably than the inhabitants of medium-sized towns (p-value for Att1: 0.012 for Att22: 0.014).

4.2.2. Intention to Use

To answer the question about the intentions of photovoltaic technology, the respondents were asked to evaluate three statements (Figure 6).
Respondents were rather open to the use of PV in their households. Response distributions are asymmetric with a concentration at high ratings (cf. Figure 6). The highest score was given to the statement regarding the intention to use solar energy in their homes (Int1, average: 3.7) and the high probability of having solar panels in the future (Int3, average: 3.6). As for the time perspective, however, the respondents were more cautious, as far fewer people agreed with the statement that they intend to invest in PV in the near future (Int.2, average: 3.3).
To find an answer to the question of whether experience in using PV systems and other sociodemographic variables affect the intentions of using photovoltaic technology, the Mann–Whitney and Kruskal–Wallis U tests were conducted (Table 8). In this case, significant differences were observed in the answers given due to experience in using PV, age, size of town, and sex.
Having a PV system definitely influenced the higher assessment of the sentences of the tested construct. Men’s attitudes were also more favorable in this case.
Post hoc tests were carried out for age and town size. In the assessment of two out of three statements, the respondents differed in terms of age, i.e., Int1, Int2. The significance of the Kruskal–Wallis test in the assessment of the sentence: “I intend to use solar energy in my house” resulted from the differences between the group “25–39” and “up to 24” (p-value = 0.026) and “above 54” (p-value = 0.006). In this case, the youngest people more often intended to use solar energy in their homes. In turn, in relation to the intention to invest in PV panels in the near future (up to 5 years)—it resulted from the differences between the oldest and the two youngest groups (p-value in pairs with “up to 24” “: 0.009, “25–39”: 0.001) and between the group “25–39” and “40–54” (p-value = 0.009). The oldest people gave the highest ratings, followed by people from the “40–54” group.
Residents of small towns, on the other hand, in all three cases were more positive about investing in PV than residents of larger towns (Int1: p-value paired with “10,000–100,000”: 0.001, with “>100,000”: 0.000; Int2: p-value paired with “10,000–100,000”: 0.004, with “>100,000”: 0.000; Int3: p-value paired with “10,000–100,000” and with “>100,000”: 0.000).

4.3. Promotion of PV Technology

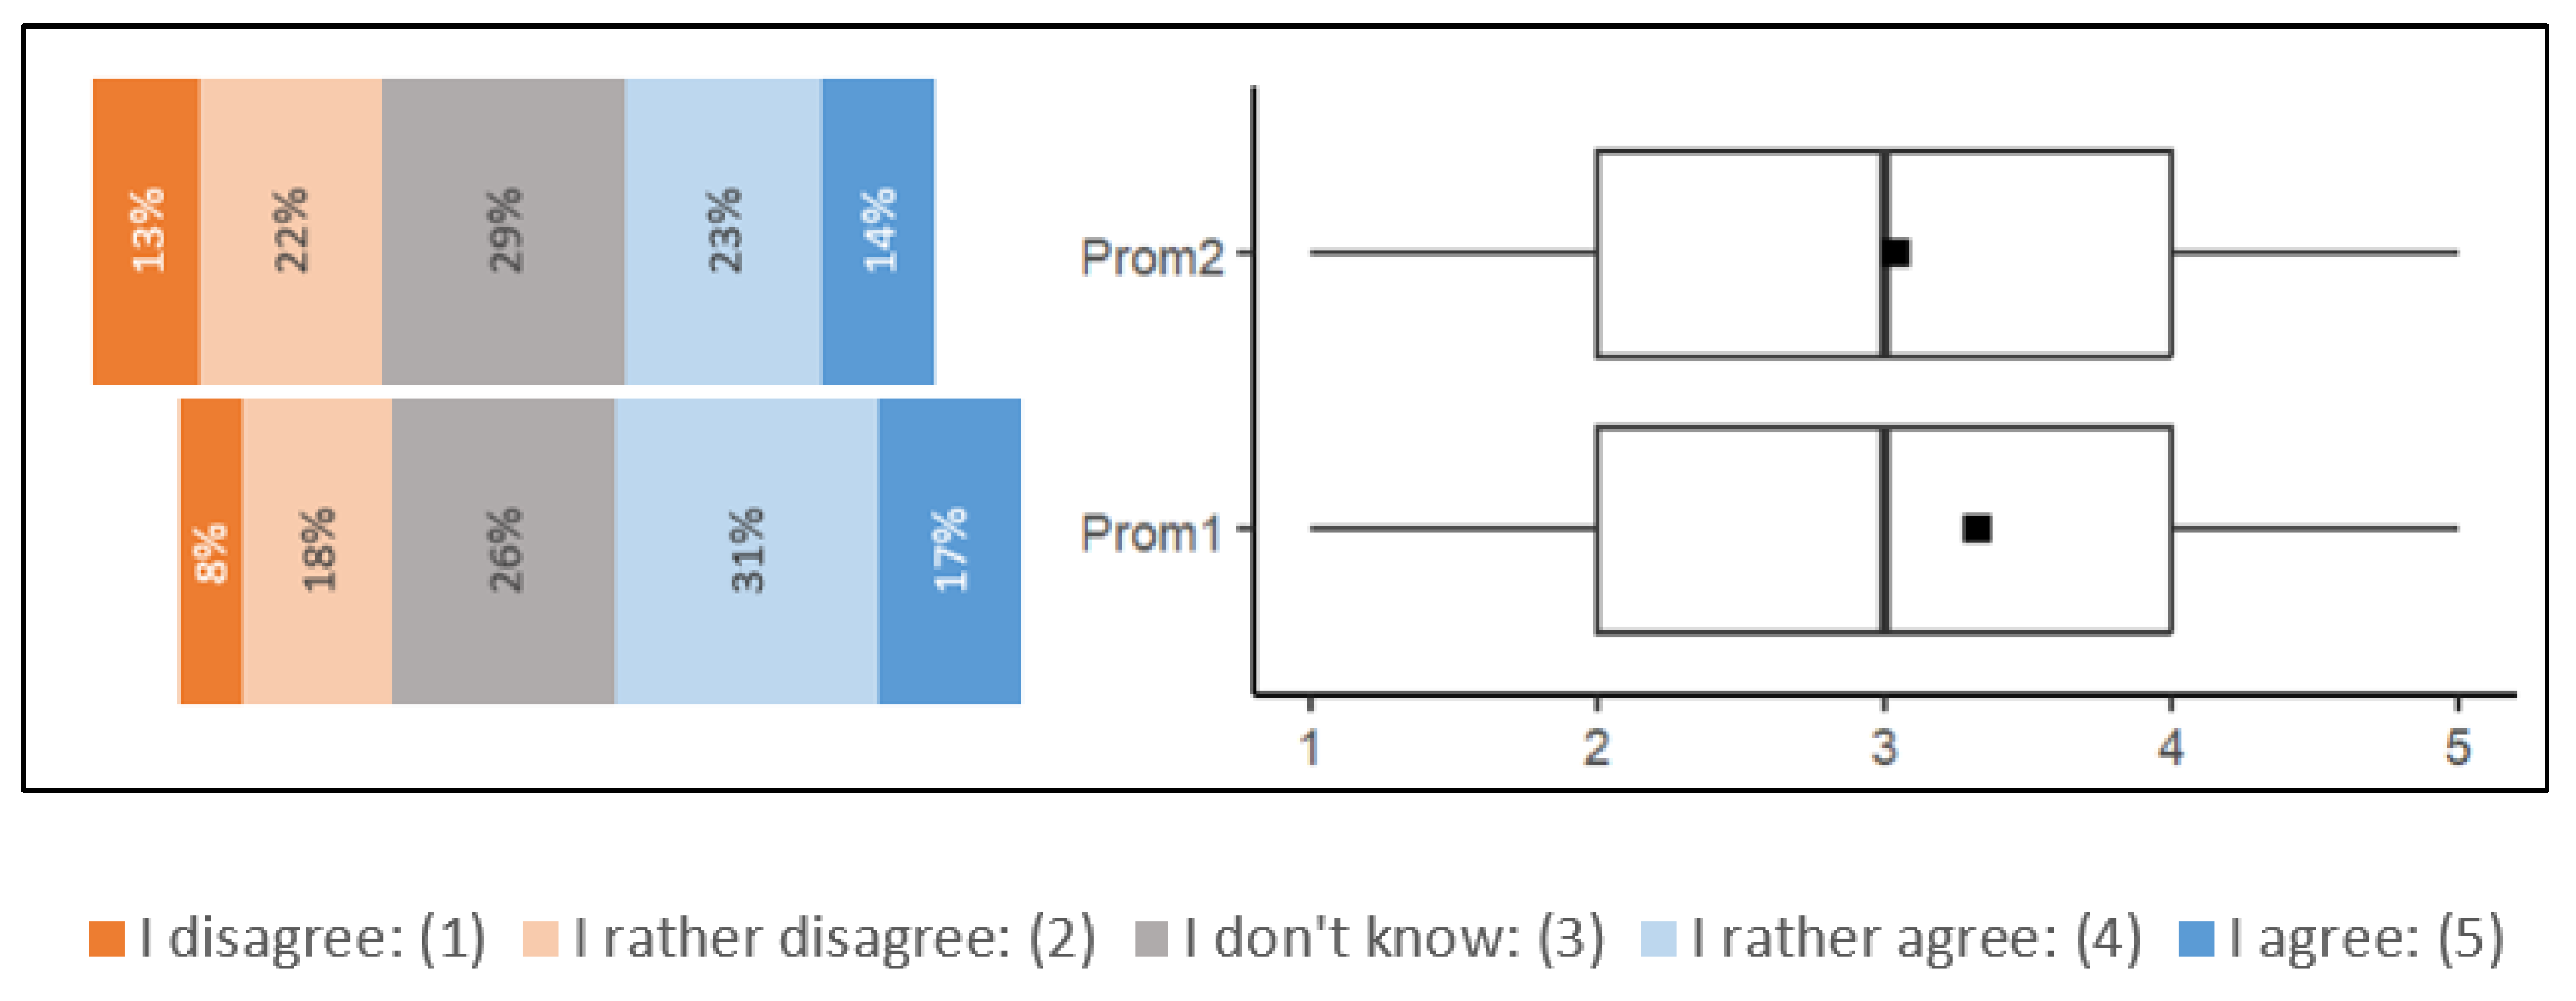
Two statements are included in the construct regarding the promotion of PV technology (Figure 7).
In this case, the distribution of responses turned out to be almost symmetrical. The respondents rated the first statement on average at 3.3, and the second at 3.1. Because of this, state support for household PV systems should be treated as ambiguous.
To answer the question of whether experience in using PV systems and other sociodemographic variables influence the perception of activities related to the promotion of PV technology, the Mann–Whitney and Kruskal–Wallis U tests were used (Table 9).
Only significant differences were confirmed in the assessments of the Prom2 statement in relation to the age of the respondents. After carrying out the post hoc tests, it can be concluded that they resulted from the fact that the youngest people more favorably than the two oldest age groups assessed measures supporting home PV systems by the state (p-value in pairs with “40–54”: 0.007, with “>54”: 0.009).

5. Discussion and Conclusions

In this article, six related hypotheses were verified by answering the three research questions posed in the introduction. A summary of the hypothesis testing is provided in Table 10.
Answering the first research question, it was established that the economic usefulness of prosumer PV technology is rated the highest from the cost perspective, both short-term (lowering electricity bills) and long-term (protection against rising electricity prices). In this way, our results correspond with the conclusions of the work by [4]. Respondents also highly appreciated state financial subsidies supporting PV systems and highly assessed systems as capital investments. This allows us to conclude that our results are consistent with the research by [3,24,25,26]. It was also found that the variables that had a statistically significant impact on this assessment of variables related to economic utility were age and ownership of PV systems: higher ratings were given by younger people, and significantly higher ratings of PV systems were given by their current users. The high ratings of the younger group can be explained by the fact that the younger group, as it has less accumulated capital, appreciates the economic incentives for investment in PV systems. The influence of experience in using a prosumer PV system on its enthusiastic assessments has also been confirmed in qualitative research by [9]. The research presented in this article confirms this relationship also at the level of quantitative research.
In terms of perceived ecological usefulness, it was found that the highest ratings were given to intentions to increase the production of green energy and to perceive PV heating as ecological. The impact of the photovoltaic system on reducing greenhouse gas emissions, saving natural resources and the overall positive impact of the PV system on ecological behavior and the environment itself was highly rated. The variables that statistically significantly affected this assessment of variables related to ecological utility were the possession of a PV system and age. Higher ratings were given by current users of PV systems and people from the oldest age group. High assessments of the ecological utility of PV systems in the older age group are an interesting finding, because in most studies it is the younger age groups that are indicated as more environmentally oriented.
The perceived ease of use of the PV system was rated high. The variables significantly influencing this assessment turned out to be all considered sociodemographic variables, except for age. Higher ratings were made by owners of PV systems, men, people with a technical education, and people from smaller towns. In terms of the impact of technical education, we confirm the conclusions indicated in the research by [38,39]. Residents of smaller towns are also the most common owners of PV systems in Poland. Such systems dominate in single-family buildings, which are more common in smaller towns than in large cities. This explains why the answers of PV system owners are related to the answers of residents of smaller towns.
Answering the second research question, it was found that attitudes towards the technology of prosumer PV systems are very favorable in terms of all the examined variables defining the tested construct. The variables that statistically differentiated the answers were experience in using PV systems, age, and size of the town. Current owners of PV systems gave the most enthusiastic ratings in terms of attitudes. The inhabitants of smaller towns did the same. On the other hand, in terms of age, it was the oldest age group that gave higher ratings. Thus, it can be seen that attitudes towards PV systems were determined more by ecological than economic considerations.
When examining the intentions of investing in PV systems, it was found that they are higher in the long term. The impact on the variables specifying investment intentions is determined by all sociodemographic variables examined, except for technical education. The owners of the systems showed significantly higher intentions, probably related to the expansion of these systems. Residents of smaller towns also showed higher intentions. Men assessed their intentions in terms of investing in a prosumer PV system higher than women. In the short term, older age groups are more likely to invest in PV systems, and in the longer term, younger people. In the case of the older age group, this is most likely due to the accumulated capital and a higher degree of perceived ecological usefulness of such an investment. In this way, our conclusions regarding the impact of accumulated capital on the intentions of investing in PV technology correspond to the conclusions from the research by [4,27,28,29]. At the same time, however, our research differs slightly from the conclusions of [29,30,31] regarding the impact of age on investments in prosumer PV technology. We notice that the influence of age on investment intention is shaped differently depending on the long-term or short-term perspective.
Answering the third research question, ambiguous assessments of the perception of activities related to the promotion of prosumer PV systems were established. It was established that the only sociodemographic variable that determines statistically significant differences is age. In this regard, younger people perceived promotional activities more favorably than older people. This is most likely due to the fact that the investment intentions of this age group are postponed. Moreover, the younger group, due to the fact that it has less accumulated capital, appreciates the economic incentives for this type of investment more, which was demonstrated when discussing the perception of the economic utility of prosumer PV systems.
Practical research implications
In 2019–2022, almost 12 GW of capacity based on photovoltaic technology was installed in the Polish power system. The largest part of the power was connected to the distribution network as micro-systems, both at low and medium voltage. At the end of 2022, in accordance with [2], the number of micro-systems connected to the network of distributors grouped in the Polish Power Transmission and Distribution Association was 1,220,299 units, and the installed capacity was 9254 MW (over 9 GW). In 2022 alone, 356,000 systems with a capacity of 3.18 GW were connected.
The above data on the increase in the number and capacity of micro-systems, including prosumer micro-systems, to the development of which the “My Electricity“ program, launched in 2019 and continued in 2023, contributed to the development, testify to the success of the program itself, both in terms of investment decisions and shaping attitudes towards the new technology of non-emission electricity production. Due to the recent change to a less favorable formula for the consumption of electricity produced by prosumers for their own needs (the net metering formula was changed to net billing during the settlement period, in which 70–80% of the energy was introduced to the power grid so that the excess energy is sold to the grid and the missing energy is purchased), the interest in prosumer investments has decreased. The ability to connect new systems to the grid, especially low voltage, is also limited by regulatory possibilities and ensuring the possibility of receiving all energy during the peak hours of its production. Thus, it is recommended first to ensure that the grid is adapted to the new conditions. Subsequently, it would be necessary to introduce such preferential settlements that would increase the interest in prosumer investments again. Taking into account the aforementioned two limitations and the research results, the following should be pointed out:
  • attitudes towards photovoltaic technology, as well as economic motives, despite the less favorable way of settling the energy produced in the prosumer system from 2022, will not cause withdrawal from investment decisions,
  • an additional argument in favor of the above conclusion is the growing uncertainty about electricity prices and their increase related to the increase in the prices of emission allowances (quotations above EUR 100 per allowance at the beginning of 2023),
  • growing environmental awareness and green deal policy are building sustainable attitudes towards energy solutions (electricity, heat, cooling) for households that are carbon footprint-free in the long run.
In addition to economic and ecological factors, ease of use and the attitudes towards prosumer photovoltaics built on them, an additional factor that has not been studied but which should be taken into account after Russia’s invasion of Ukraine is the security of distributed energy systems. Experiences resulting from the physical destruction of large-scale power generation infrastructure and transmission systems in war conditions or natural disasters should be pointed out. Distributed micro-energy infrastructure can be more easily restored and used in the face of the aforementioned threats.
Author Contributions

Conceptualization: M.T., S.T., A.M. and I.Z.; methodology: I.Z.; formal analysis, I.Z. and A.M.; investigation: M.T. and A.M.; writing—original draft preparation: M.T., S.T., A.M. and I.Z.; writing—review and editing: M.T., S.T., A.M. and I.Z.; visualization: I.Z.; funding acquisition: M.T, A.M. and I.Z. All authors have read and agreed to the published version of the manuscript.

Funding

This paper was published as part of statutory research at the Silesian University of Technology, Faculty of Organization and Management, grant number: BK-274/ROZ1/2023 (13/010/BK_23/0072).

Data Availability Statement

Not applicable.

Conflicts of Interest

The authors declare no conflict of interest.

References

  1. Nawrocki, T.L.; Jonek-Kowalska, I. Is Innovation a Risky Business? A Comparative Analysis in High-Tech and Traditional Industries in Poland. J. Open Innov. Technol. Mark. Complex. 2022, 8, 155. [Google Scholar] [CrossRef]
  2. PTPiREE. Mikroinstalacje w Polsce Stan Na 28 Lutego 2023 Roku. 2023. Available online: http://www.ptpiree.pl/energetyka-w-polsce/energetyka-w-liczbach/mikroinstalacje-w-polsce (accessed on 14 March 2023).
  3. Kowalska-Pyzalska, A. An Empirical Analysis of Green Electricity Adoption Among Residential Consumers in Poland. Sustainability 2018, 10, 2281. [Google Scholar] [CrossRef] [Green Version]
  4. Ropuszyńska-Surma, E.; Węglarz, M. Profiling End User of Renewable Energy Sources among Residential Consumers in Poland. Sustainability 2018, 10, 4452. [Google Scholar] [CrossRef] [Green Version]
  5. Angowski, M.; Kijek, T.; Lipowski, M.; Bondos, I. Factors Affecting the Adoption of Photovoltaic Systems in Rural Areas of Poland. Energies 2021, 14, 5272. [Google Scholar] [CrossRef]
  6. Kata, R.; Cyran, K.; Dybka, S.; Lechwar, M.; Pitera, R. Economic and Social Aspects of Using Energy from PV and Solar Installations in Farmers’ Households in the Podkarpackie Region. Energies 2021, 14, 3158. [Google Scholar] [CrossRef]
  7. Grębosz-Krawczyk, M.; Zakrzewska-Bielawska, A.; Glinka, B.; Glińska-Neweś, A. Why Do Consumers Choose Photovoltaic Panels? Identification of the Factors Influencing Consumers’ Choice Behavior regarding Photovoltaic Panel Installations. Energies 2021, 14, 2674. [Google Scholar] [CrossRef]
  8. Podgórska, M.; Zdonek, I. Sustainable Technologies Supported by Project-Based Learning in the Education of Engineers: A Case Study from Poland. Energies 2022, 15, 278. [Google Scholar] [CrossRef]
  9. Zdonek, I.; Tokarski, S.; Mularczyk, A.; Turek, M. Evaluation of the Program Subsidizing Prosumer Photovoltaic Sources in Poland. Energies 2022, 15, 846. [Google Scholar] [CrossRef]
  10. Mularczyk, A.; Zdonek, I.; Turek, M.; Tokarski, S. Intentions to Use Prosumer Photovoltaic Technology in Poland. Energies 2022, 15, 6300. [Google Scholar] [CrossRef]
  11. Wolniak, R.; Skotnicka-Zasadzień, B. Development of Photovoltaic Energy in EU Countries as an Alternative to Fossil Fuels. Energies 2022, 15, 662. [Google Scholar] [CrossRef]
  12. Bieszk-Stolorz, B. Impact of Subsidy Programmes on the Development of the Number and Output of RES Micro-Installations in Poland. Energies 2022, 15, 9357. [Google Scholar] [CrossRef]
  13. Skiba, S.; Maruszczak, M. The Impact of the COVID-19 Pandemic on the Decision to Use Solar Energy and Install Photovoltaic Panels in Households in the Years 2019–2021 within the Area of a Selected Polish Municipality. Energies 2022, 15, 7257. [Google Scholar] [CrossRef]
  14. Wicki, L.; Pietrzykowski, R.; Kusz, D. Factors Determining the Development of Prosumer Photovoltaic Installations in Poland. Energies 2022, 15, 5897. [Google Scholar] [CrossRef]
  15. Zuk, P.; Zuk, P. Prosumers in Action: The Analysis of Social Determinants of Photovoltaic Development and Prosumer Strategies in Poland. Int. J. Energy Econ. Policy 2022, 12, 294–306. [Google Scholar] [CrossRef]
  16. Ajzen, I.; Fishbein, M. Understanding Attitude and Predicting Social Behaviour; Prentice Hall: Englewood Cliffs, NJ, USA, 1980. [Google Scholar]
  17. Fishbein, M.; Ajzen, I. Belief, Attitude, Intention, and Behavior: An Introduction to Theory and Research; Addison-Wesley Pub. Co.: Reading, MA, USA, 1975. [Google Scholar]
  18. Davis, F.D. Perceived Usefulness, Perceived Ease of Use, and User Acceptance of Information Technology. MIS Q. 1989, 13, 319–340. [Google Scholar] [CrossRef] [Green Version]
  19. Davis, F.D. A Technology Acceptance Model for Empirically Testing New End-User Information Systems: Theory and Results; Wayne State University: Detroit, MI, USA, 1985. [Google Scholar]
  20. Venkatesh, V.; Morris, M.G.; Davis, G.B.; Davis, F.D. User Acceptance of Information Technology: Toward a Unified View. MIS Q. 2003, 27, 425–478. [Google Scholar] [CrossRef] [Green Version]
  21. Ajzen, I.; Fishbein, M. Scaling and Testing Multiplicative Combinations in the Expectancy-Value Model of Attitudes. J. Appl. Soc. Psychol. 2008, 38, 2222–2247. [Google Scholar] [CrossRef]
  22. Carlisle, J.E.; Kane, S.L.; Solan, D.; Joe, J.C. Support for solar energy: Examining sense of place and utility-scale development in California. Energy Res. Soc. Sci. 2014, 3, 124–130. [Google Scholar] [CrossRef]
  23. Tokarski, S.; Magdziarczyk, M.; Smoliński, A. Risk Management Scenarios for Investment Program Delays in the Polish Power Industry. Energies 2021, 14, 5210. [Google Scholar] [CrossRef]
  24. Zhang, Y.; Song, J.; Hamori, S. Impact of subsidy policies on diffusion of photovoltaic power generation. Energy Policy 2011, 39, 1958–1964. [Google Scholar] [CrossRef]
  25. Lekavičius, V.; Bobinaitė, V.; Galinis, A.; Pažėraitė, A. Distributional impacts of investment subsidies for residential energy technologies. Renew. Sustain. Energy Rev. 2020, 130, 109961. [Google Scholar] [CrossRef]
  26. Nicolini, M.; Tavoni, M. Are renewable energy subsidies effective? Evidence from Europe. Renew. Sustain. Energy Rev. 2017, 74, 412–423. [Google Scholar] [CrossRef]
  27. Briguglio, M.; Formosa, G. When households go solar: Determinants of uptake of a Photovoltaic Scheme and policy insights. Energy Policy 2017, 108, 154–162. [Google Scholar] [CrossRef]
  28. Müller, S.; Rode, J. The adoption of photovoltaic systems in Wiesbaden, Germany. Econ. Innov. New Technol. 2013, 22, 519–535. [Google Scholar] [CrossRef]
  29. Zarnikau, J. Consumer demand for ‘green power’ and energy efficiency. Energy Policy 2003, 31, 1661–1672. [Google Scholar] [CrossRef]
  30. Zhang, L.; Wu, Y. Market segmentation and willingness to pay for green electricity among urban residents in China: The case of Jiangsu Province. Energy Policy 2012, 51, 514–523. [Google Scholar] [CrossRef]
  31. Zorić, J.; Hrovatin, N. Household willingness to pay for green electricity in Slovenia. Energy Policy 2012, 47, 180–187. [Google Scholar] [CrossRef]
  32. Zdonek, I.; Mularczyk, A.; Polok, G. The Idea of Corporate Social Responsibility in the Opinion of Future Managers—Comparative Research between Poland and Georgia. Sustainability 2021, 13, 7045. [Google Scholar] [CrossRef]
  33. Ozaki, R. Adopting sustainable innovation: What makes consumers sign up to green electricity? Bus. Strat. Environ. 2010, 20, 1–17. [Google Scholar] [CrossRef]
  34. Gerpott, T.J.; Mahmudova, I. Determinants of green electricity adoption among residential customers in Germany. Int. J. Consum. Stud. 2010, 34, 464–473. [Google Scholar] [CrossRef]
  35. Stern, P.C. Individual and household interactions with energy systems: Toward integrated understanding. Energy Res. Soc. Sci. 2014, 1, 41–48. [Google Scholar] [CrossRef]
  36. Graziano, M.; Gillingham, K. Spatial patterns of solar photovoltaic system adoption: The influence of neighbors and the built environment. J. Econ. Geogr. 2014, 15, 815–839. [Google Scholar] [CrossRef]
  37. Tsantopoulos, G.; Arabatzis, G.; Tampakis, S. Public attitudes towards photovoltaic developments: Case study from Greece. Energy Policy 2014, 71, 94–106. [Google Scholar] [CrossRef]
  38. Bollinger, B.; Gillingham, K. Peer Effects in the Diffusion of Solar Photovoltaic Panels. Mark. Sci. 2012, 31, 900–912. [Google Scholar] [CrossRef] [Green Version]
  39. Davidson, C.; Drury, E.; Lopez, A.; Elmore, R.; Margolis, R. Modeling photovoltaic diffusion: An analysis of geospatial datasets. Environ. Res. Lett. 2014, 9, 074009. [Google Scholar] [CrossRef]
  40. Sundt, S.; Rehdanz, K. Consumers’ willingness to pay for green electricity: A meta-analysis of the literature. Energy Econ. 2015, 51, 1–8. [Google Scholar] [CrossRef] [Green Version]
  41. Cousse, J. Still in love with solar energy? Installation size, affect, and the social acceptance of renewable energy technologies. Renew. Sustain. Energy Rev. 2021, 145, 111107. [Google Scholar] [CrossRef]
  42. Heras-Saizarbitoria, I.; Cilleruelo, E.; Zamanillo, I. Public acceptance of renewables and the media: An analysis of the Spanish PV solar experience. Renew. Sustain. Energy Rev. 2011, 15, 4685–4696. [Google Scholar] [CrossRef]
  43. Wang, Z.; Zhao, C.; Yin, J.; Zhang, B. Purchasing intentions of Chinese citizens on new energy vehicles: How should one respond to current preferential policy? J. Clean. Prod. 2017, 161, 1000–1010. [Google Scholar] [CrossRef]
  44. Garay, L.; Font, X.; Corrons, A. Sustainability-Oriented Innovation in Tourism: An Analysis Based on the Decomposed Theory of Planned Behavior. J. Travel Res. 2018, 58, 622–636. [Google Scholar] [CrossRef] [Green Version]
  45. Hamari, J.; Sjöklint, M.; Ukkonen, A. The sharing economy: Why people participate in collaborative consumption. J. Assoc. Inf. Sci. Technol. 2015, 67, 2047–2059. [Google Scholar] [CrossRef]
  46. Parasuraman, A. Technology Readiness Index (Tri): A Multiple-Item scale to measure readiness to embrace new technologies. J. Serv. Res. 2000, 2, 307–320. [Google Scholar] [CrossRef]
  47. Ahmad, S.; Tahar, R.B.M.; Cheng, J.K.; Yao, L. Public acceptance of residential solar photovoltaic technology in Malaysia. PSU Res. Rev. 2017, 1, 242–254. [Google Scholar] [CrossRef]
  48. Song, Y.; Guo, S.; Zhang, M. Assessing customers’ perceived value of the anti-haze cosmetics under haze pollution. Sci. Total. Environ. 2019, 685, 753–762. [Google Scholar] [CrossRef]
  49. Paul, J.; Modi, A.; Patel, J. Predicting green product consumption using theory of planned behavior and reasoned action. J. Retail. Consum. Serv. 2016, 29, 123–134. [Google Scholar] [CrossRef]
Figure 1. Test model. Source: own work.
Energies 16 04674 g001
Figure 2. Distribution of answers in the Economic Usefulness construct. Source: own study. Note: the mean of the responses for the question is marked on the box plot with a square, and outliers with dots.
Energies 16 04674 g002
Figure 3. Distribution of answers in the Ecological Usefulness construct. Source: own study. Note: the mean of the responses for the question is marked on the box plot with a square, and outliers with dots.
Energies 16 04674 g003aEnergies 16 04674 g003b
Figure 4. Distribution of answers in the construct 3. Source: own study. Note: the mean of the responses for the question is marked on the box plot with a square, and outliers with dots.
Energies 16 04674 g004
Figure 5. Distribution of responses of variables defining attitudes towards prosumer PV technology. Source: own study. Note: the mean of the responses for the question is marked on the box plot with a square, and outliers with dots.
Energies 16 04674 g005
Figure 6. Distribution of answers in the Intentions to purchase a PV system construct. Source: own study. Note: the mean of the responses for the question is marked on the box plot with a square, and outliers with dots.
Energies 16 04674 g006
Figure 7. Distribution of answers in the Promotion of PV Technology construct. Source: own study. Note: the mean of the responses for the question is marked on the box plot with a square, and outliers with dots.
Energies 16 04674 g007
Table 1. Questionnaire used in the research.
ConstructItemStatementSource
Economic UsefulnessEcon1I believe that PV installation is a good capital investment.
Econ2I think PV panels are a good hedge against rising electricity prices.
Econ3Implementing photovoltaic technology in my home will help me save money.[43,44]
Econ4Implementing photovoltaic technology in my home will help me cut costs.[43,44]
Econ5Implementing photovoltaic technology in my home will help me make a profit.[43,44]
Econ6A grant of PLN 3–5 k might get me to install photovoltaic panels.
Econ7A tax credit could get me to install PV panels.
Econ8The prospect of lowering my electric bills would prompt me to install PV panels.
Ecological UsefulnessEcol1Installing PV on my home would reduce greenhouse gas emissions.[44,45]
Ecol2Installing PV in my home would help conserve natural resources.[44,45]
Ecol3Installing PV in my home would allow me to be eco-friendly.[44,45]
Ecol4Heating with electricity obtained from PV is environmentally friendly.
Ecol5There should be an effort to increase green energy production.
Ecol6Investments in PV benefit the environment.
Perceived Ease of UseEoU1I think learning to use photovoltaic technology is easy for me.[46]
EoU2I believe that operating a PV installation is easy.[46]
Attitude towards PV TechnologyAtt1I think it would be a good idea (in its own time) to use solar energy in my home.[47]
Att2I like the idea of using a clean source of electricity in my home.[47]
Att3I generally like the idea of having PV panels as a source of electricity in my home.[47]
Promotion of PV TechnologyProm1Nowadays, you can see support from the state regarding investments in renewable energy sources.[48]
Prom2Nowadays, you can see a lot of support from the state regarding investments in at-home photovoltaic installations.[48]
Intention to UseInt1I intend to use solar energy in my home.[49]
Int2I intend to invest in PV panels in the near future (within 5 years).
Int3The likelihood of me owning (in the future) PV panels is very high.[49]
Source: own work.
Table 2. Structure of respondents.
VariableDivision
SexFemaleMale
46.7%53.3%
Age<2525–3940–54>54
7.2%33%42%17.9%
PV in the householdYesNo
20.7%79.3%
Household member with technical educationYesNo
68.6%31.4%
Place:<10,00010,000–100,000>100,000
19.5%30.7%49.8%
Source: own calculations.
Table 3. Cronbach’s α values for the tested constructs.
ConstructCronbach’s α
Economic Usefulness0.908
Ecological Usefulness0.894
Perceived Ease of Use0.831
Attitude towards PV Technology0.890
Promotion of PV Technology0.863
Intention to Use0.903
Source: own calculations.
Table 4. Average responses for variables determining the perceived economic utility of a prosumer PV system depending on experience in using PV and age.
ItemExperience in Using PV SystemsAge
AverageMann–Whitney U TestAverageKruskal–Wallis Test
NoYesup to 2425–3940–54above 54
Econ13.554.26<0.0014.163.703.583.780.172
Econ23.884.63<0.0014.453.904.034.160.028
Econ33.664.52<0.0014.423.733.763.970.008
Econ43.714.58<0.0014.293.783.834.100.041
Econ53.113.380.0744.003.133.083.090.002
Econ63.153.82<0.0014.063.303.173.250.009
Econ73.644.28<0.0013.713.613.814.030.068
Econ83.974.55<0.0014.163.994.094.230.305
Source: own calculations. Note: significant differences and the highest mean values are shown in bold.
Table 5. Average responses for variables determining perceived environmental utility depending on experience in using PV systems and age.
ItemExperience in Using PV SystemsAge
AverageMann–Whitney U TestAverageKruskal–Wallis Test
NoYesup to 2425–3940–54above 54
Ecol13.844.37<0.0014.103.813.914.270.022
Ecol23.824.260.0014.063.683.924.230.002
Ecol33.794.31<0.0013.713.763.924.210.013
Ecol44.184.490.0034.584.194.254.230.244
Ecol54.344.550.0594.524.304.414.430.295
Ecol63.654.24<0.0013.423.603.784.220.001
Source: own calculations. Note: significant differences and highest mean values are shown in bold.
Table 6. Average responses for variables determining the perceived ease of use of prosumer PV technology depending on sociodemographic variables.
ItemExperience in Using PV SystemsHousehold Member with Technical EducationSex
AverageMann–Whitney U TestAverageMann–Whitney U TestAverageMann–Whitney U Test
NoYesNoYesWM
EoU13.594.43<0.0013.443.91<0.0013.543.96<0.001
EoU23.614.57<0.0013.513.95<0.0013.594.01<0.001
ItemTown size
averageKruskal–Wallis test
<10,00010,000–100,000>100,000
EoU14.013.733.690.033
EoU24.023.803.730.028
Source: own work. Note: significant differences are shown in bold.
Table 7. Average responses for variables determining attitudes towards prosumer PV technology depending on PV ownership, age and size of the town.
ItemExperience in Using PV SystemsAgeTown Size
AverageMann–Whitney U TestAverageKruskal–Wallis TestAverageKruskal–Wallis Test
NoYesup to 2425–3940–54>54<10,00010,000–100,000>100,000
Att13.994.64<0.0014.063.954.174.340.0164.303.984.140.034
Att24.094.70<0.0013.874.044.304.45<0.0014.384.084.220.039
Att33.984.67<0.0013.903.994.174.360.0314.334.014.120.084
Source: own calculations. Note: significant differences are shown in bold.
Table 8. Average responses for variables determining the intentions of use of prosumer PV technology depending on sociodemographic variables.
ItemExperience in Using PV SystemsAge
AverageMann–Whitney U TestAverageKruskal–Wallis Test
NoYesup to 2425–3940–54above 54
Int13.434.85<0.0014.063.533.703.990.016
Int22.974.46<0.0012.973.003.393.650.002
Int33.264.78<0.0013.843.423.573.750.227
Town sizeSex
averageKruskal–Wallis testaverageMann–Whitney U test
<10,00010,000–100,000>100,000WM
Int14.133.643.610.0013.553.870.001
Int23.763.243.110.0013.083.450.003
Int34.153.503.390.0003.383.740.002
Source: own work. Note: significant differences are shown in bold.
Table 9. Average responses for variables related to the intentions of use of prosumer PV technology depending on age.
ItemAge
AverageKruskal–Wallis Test
up to 2425–3940–54>54
Prom13.843.313.273.220.079
Prom23.583.152.922.900.021
Source: own calculations. Note: significant differences are shown in bold.
Table 10. Summary of the hypothesis verification result.
Research QuestionHypothesisExperience in Using PVAgeSexHousehold Member with Technical EducationTown Size
RQ1H1avv
H1bvv
H1cv vvv
RQ2H2avv v
H2bvvv v
RQ3H3 v
Source: own study.
Disclaimer/Publisher’s Note: The statements, opinions and data contained in all publications are solely those of the individual author(s) and contributor(s) and not of MDPI and/or the editor(s). MDPI and/or the editor(s) disclaim responsibility for any injury to people or property resulting from any ideas, methods, instructions or products referred to in the content.