Article

Experimental Analysis of Bio-Inspired Vortex Generators on a Blade with S822 Airfoil

1
Faculty of Engineering, Universidad Distrital Francisco José de Caldas, Bogotá 110231, Colombia
2
Escola de Engenharia de São Carlos, Universidade de São Paulo, São Carlos 13566590, Brazil
3
Faculty of Engineering, Universidad Militar Nueva Granada, Bogotá 110231, Colombia
*
Author to whom correspondence should be addressed.
Energies 2023, 16(12), 4538; https://doi.org/10.3390/en16124538
Submission received: 31 December 2022 / Revised: 15 March 2023 / Accepted: 21 March 2023 / Published: 6 June 2023
(This article belongs to the Special Issue Advances in Wind Turbines)

Abstract

:
Vortex generators are used in aircraft wings and wind turbine blades. These devices allow them to maintain a stable turbulent behavior in the wind wake. Vortex generators, or VGs, improve the transition from laminar to turbulent boundary layer regime, avoiding abrupt shedding. HAWT wind turbines have high rotational velocity. Currently, HAWT turbines are being redesigned with fixed vortex generators, achieving higher energy production. This paper presents a wind tunnel analysis of a fixed-wire blade with S822 airfoil and active VGs bio-inspired by the flight-stabilizing feathers of the peregrine falcon. Vibrations measured on the blade show a reduction in intensity at wind velocities close to 15 m/s. The measured wake velocities show fluctuations at higher tunnel wind velocities. An FFT spectral analysis of the wind wake velocities showed differences between the spectral components. When activating the VGs in oscillation at a constant frequency, a reduction of the vibrations on the blade was observed for wind velocities around 20 m/s.

1. Introduction

Wind turbines have become increasingly popular in recent years as a means of generating electricity from renewable sources. These turbines convert the kinetic energy of the wind into electrical power using a rotor and a generator. However, there are still challenges associated with wind turbines, such as their efficiency, reliability, and cost-effectiveness. One way to address these challenges is by using vortex generators. Vortex generators are small devices that are attached to the blades of a wind turbine. Their purpose is to increase the efficiency of the turbine by manipulating the airflow around the blade. By creating vortices, these generators can improve the aerodynamics of the blade, resulting in increased lift and reduced drag. This, in turn, leads to greater power output from the turbine. The use of vortex generators is not a new concept in the field of aerodynamics. They have been used in aviation for decades to improve the performance of aircraft wings. However, their application in wind turbines is a more recent development. Researchers have been exploring the use of vortex generators in wind turbines for several years, and the results have been promising. One of the main advantages of vortex generators is that they can be easily retrofitted onto existing wind turbines. This means that older turbines can be upgraded to improve their performance, without the need for costly replacements. Additionally, vortex generators are relatively inexpensive to manufacture and install, making them an attractive option for wind farm operators. Another advantage of vortex generators is their ability to improve the reliability of wind turbines.
By reducing the stress on the blades, these generators can extend the lifespan of the turbine, reducing maintenance costs and downtime. This can be especially important in remote locations where access to the turbine may be difficult or expensive. The design of wind turbines with additional devices on their blades is a growing line of research in several parts of the world, these designs usually have approaches such as: Energy production [1,2,3], structural vibration mitigation systems [4,5], use of composite materials [6] and CFD simulation (Computational Fluid Dynamics) [7]. These simulations allow to appreciate the 3D behavior of the fluid when interacting with novel devices such as blade tips, UAV’s with different number of blades, and aerial spraying applications [8,9,10]. Another approach is the creation of mechanical improvements based on living organisms [10,11], previous works study wind turbine blade shapes inspired by living organisms for the purpose of noise reduction and performance analysis [12]. In this work we analyze the behavior of an airfoil blade used in high velocity turbines such as the S822 [13,14,15], with vortex generators devices inspired by the peregrine falcon [16,17,18], previous studies highlight that this bird has flight stabilizer feathers on its back.
This bird reaches downward velocities of more than 350 km/h; therefore, we seek to create a linear array of vortex generators with similar geometries to the ones present in the bird. Adding a servomechanism, and thus achieving active or mobile vortex generators, will vary its angle of inclination by means of a wireless activation circuit and allow analysis through a hot-wire sensor and a 3D accelerometer to measure the effects on the structural vibration presented by the blade. The motivation of this work is to contribute to the design of future wind turbines with better performance and greater rotational stability, aiding to solve the need for the creation of more efficient wind turbines.

2. Materials and Methods

To analyze the behavior of active and peregrine falcon bio-inspired generators and to observe a possible stabilization effect on a blade with an S822 profile, the following experimental research methodology is proposed, organized into four phases in Figure 1.
The first phase, or the exploration phase, is composed of the review of previous similar works, followed using a CFD simulation tool that allows observation of the behavior of physical variables such as pressure, velocity, and kinetic energy of turbulence or TKE. These variables show the behavior of the wind wake and its turbulence. Phase two, or the design phase, consists of 3D scanning and the creation of the bio-inspired vortex generator using a 3D CAD design tool. Phase three, or the simulation phase, consists of the simulation of a blade without vortex generators and another blade with the vortex generators designed in phase two. Fourth phase, or the experimentation phase, consists of the use of the wind tunnel to measure the blade vibration with vortex generators and the wake wind velocity.
There are commercial tape-type vortex generators used on the blade surfaces of power wind turbines [19]. The differences in the power values in kW for a HAWT wind turbine at constant wind velocities show differences for turbines with vortex generators, obtaining differences of 20% more energy production when using vortex generators (Figure 2). Therefore, being able to analyze a blade using bio-inspired vortex generators contributes to the creation of turbines with better utilization of energy resources. Previous studies conclude that the use of vortex generators on the blades can significantly improve the aerodynamic characteristics of NACA airfoils, increasing the lift coefficient and eliminating boundary layer separation, in some cases reducing the aerodynamic drag coefficient. The position of the VGs is also important, since in some cases, no improvement in aerodynamic performance is observed, which could be related to the size of the VGs [20].

3. Results

3.1. Numerical Simulations

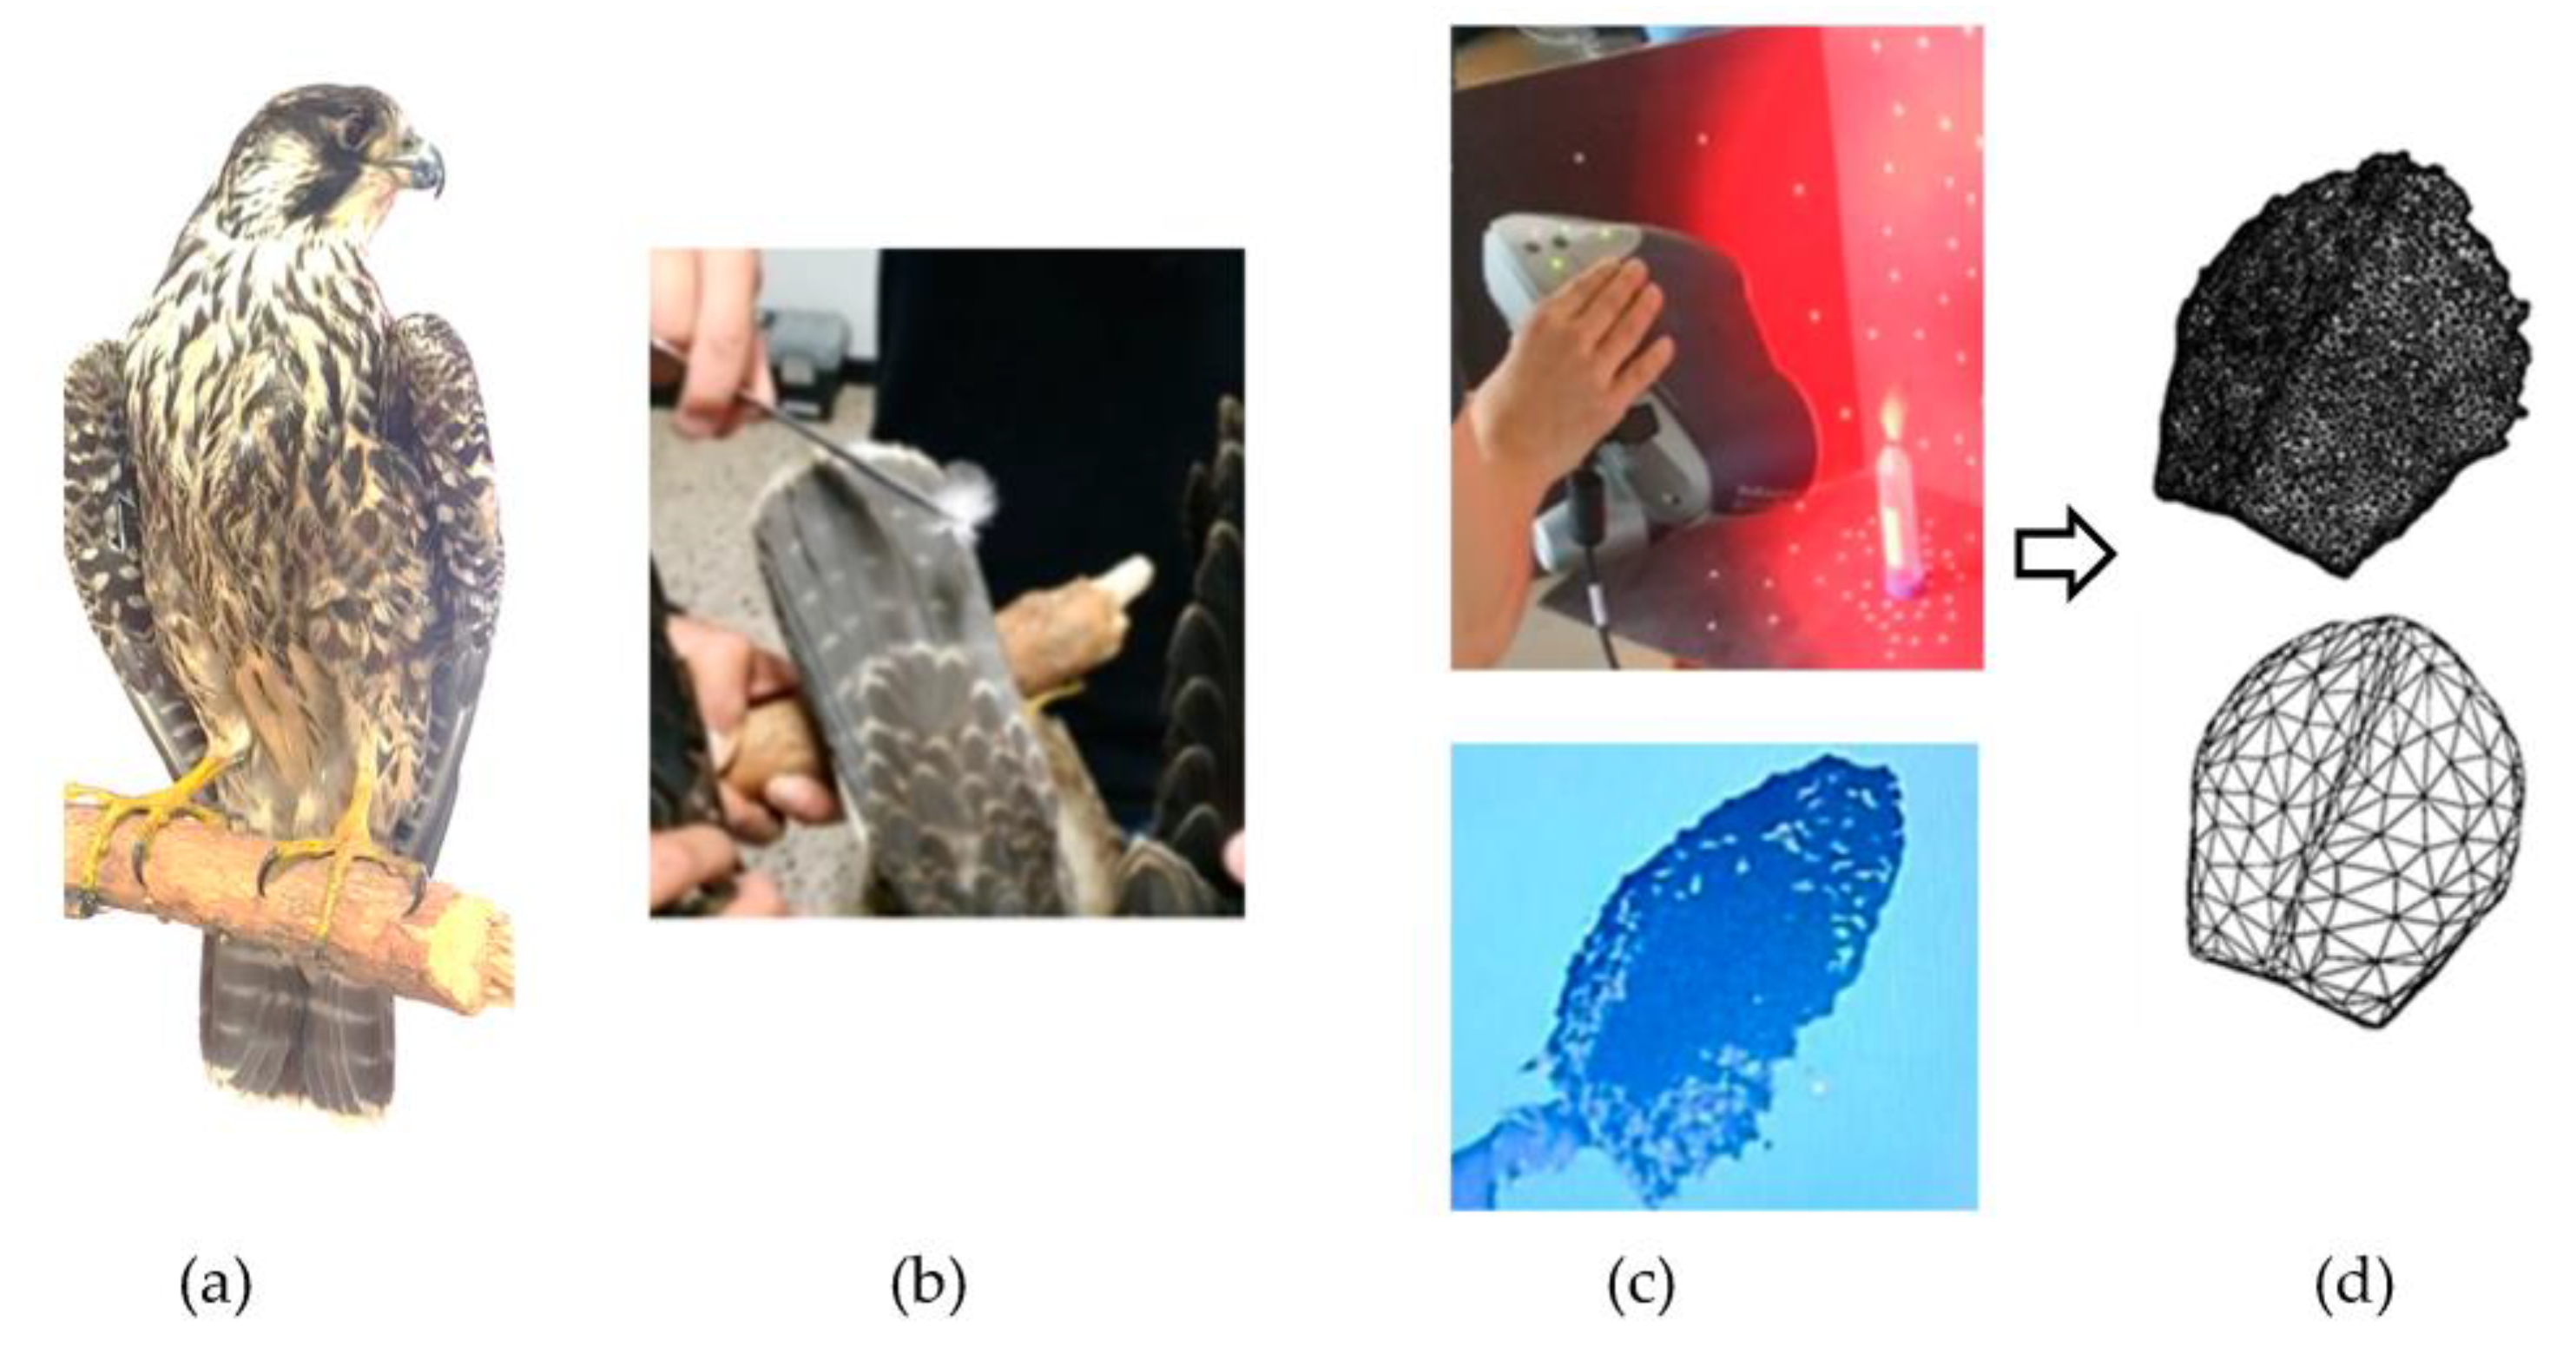
Figure 3 shows that with a 3D scanner and a dissected specimen, a CAD-3D model of the feathers is obtained. The collection of biological samples of feathers from the back of a dissected falcon was donated by the Jaime Duque Zoo in Bogota, Colombia. This was necessary to develop a CFD simulation of rotational mesh and thus achieve an analysis of the behavior of the surface pressure on the blade by varying the angle of inclination of the vortex generators bio-inspired by the peregrine falcon’s flight stabilizer feathers.
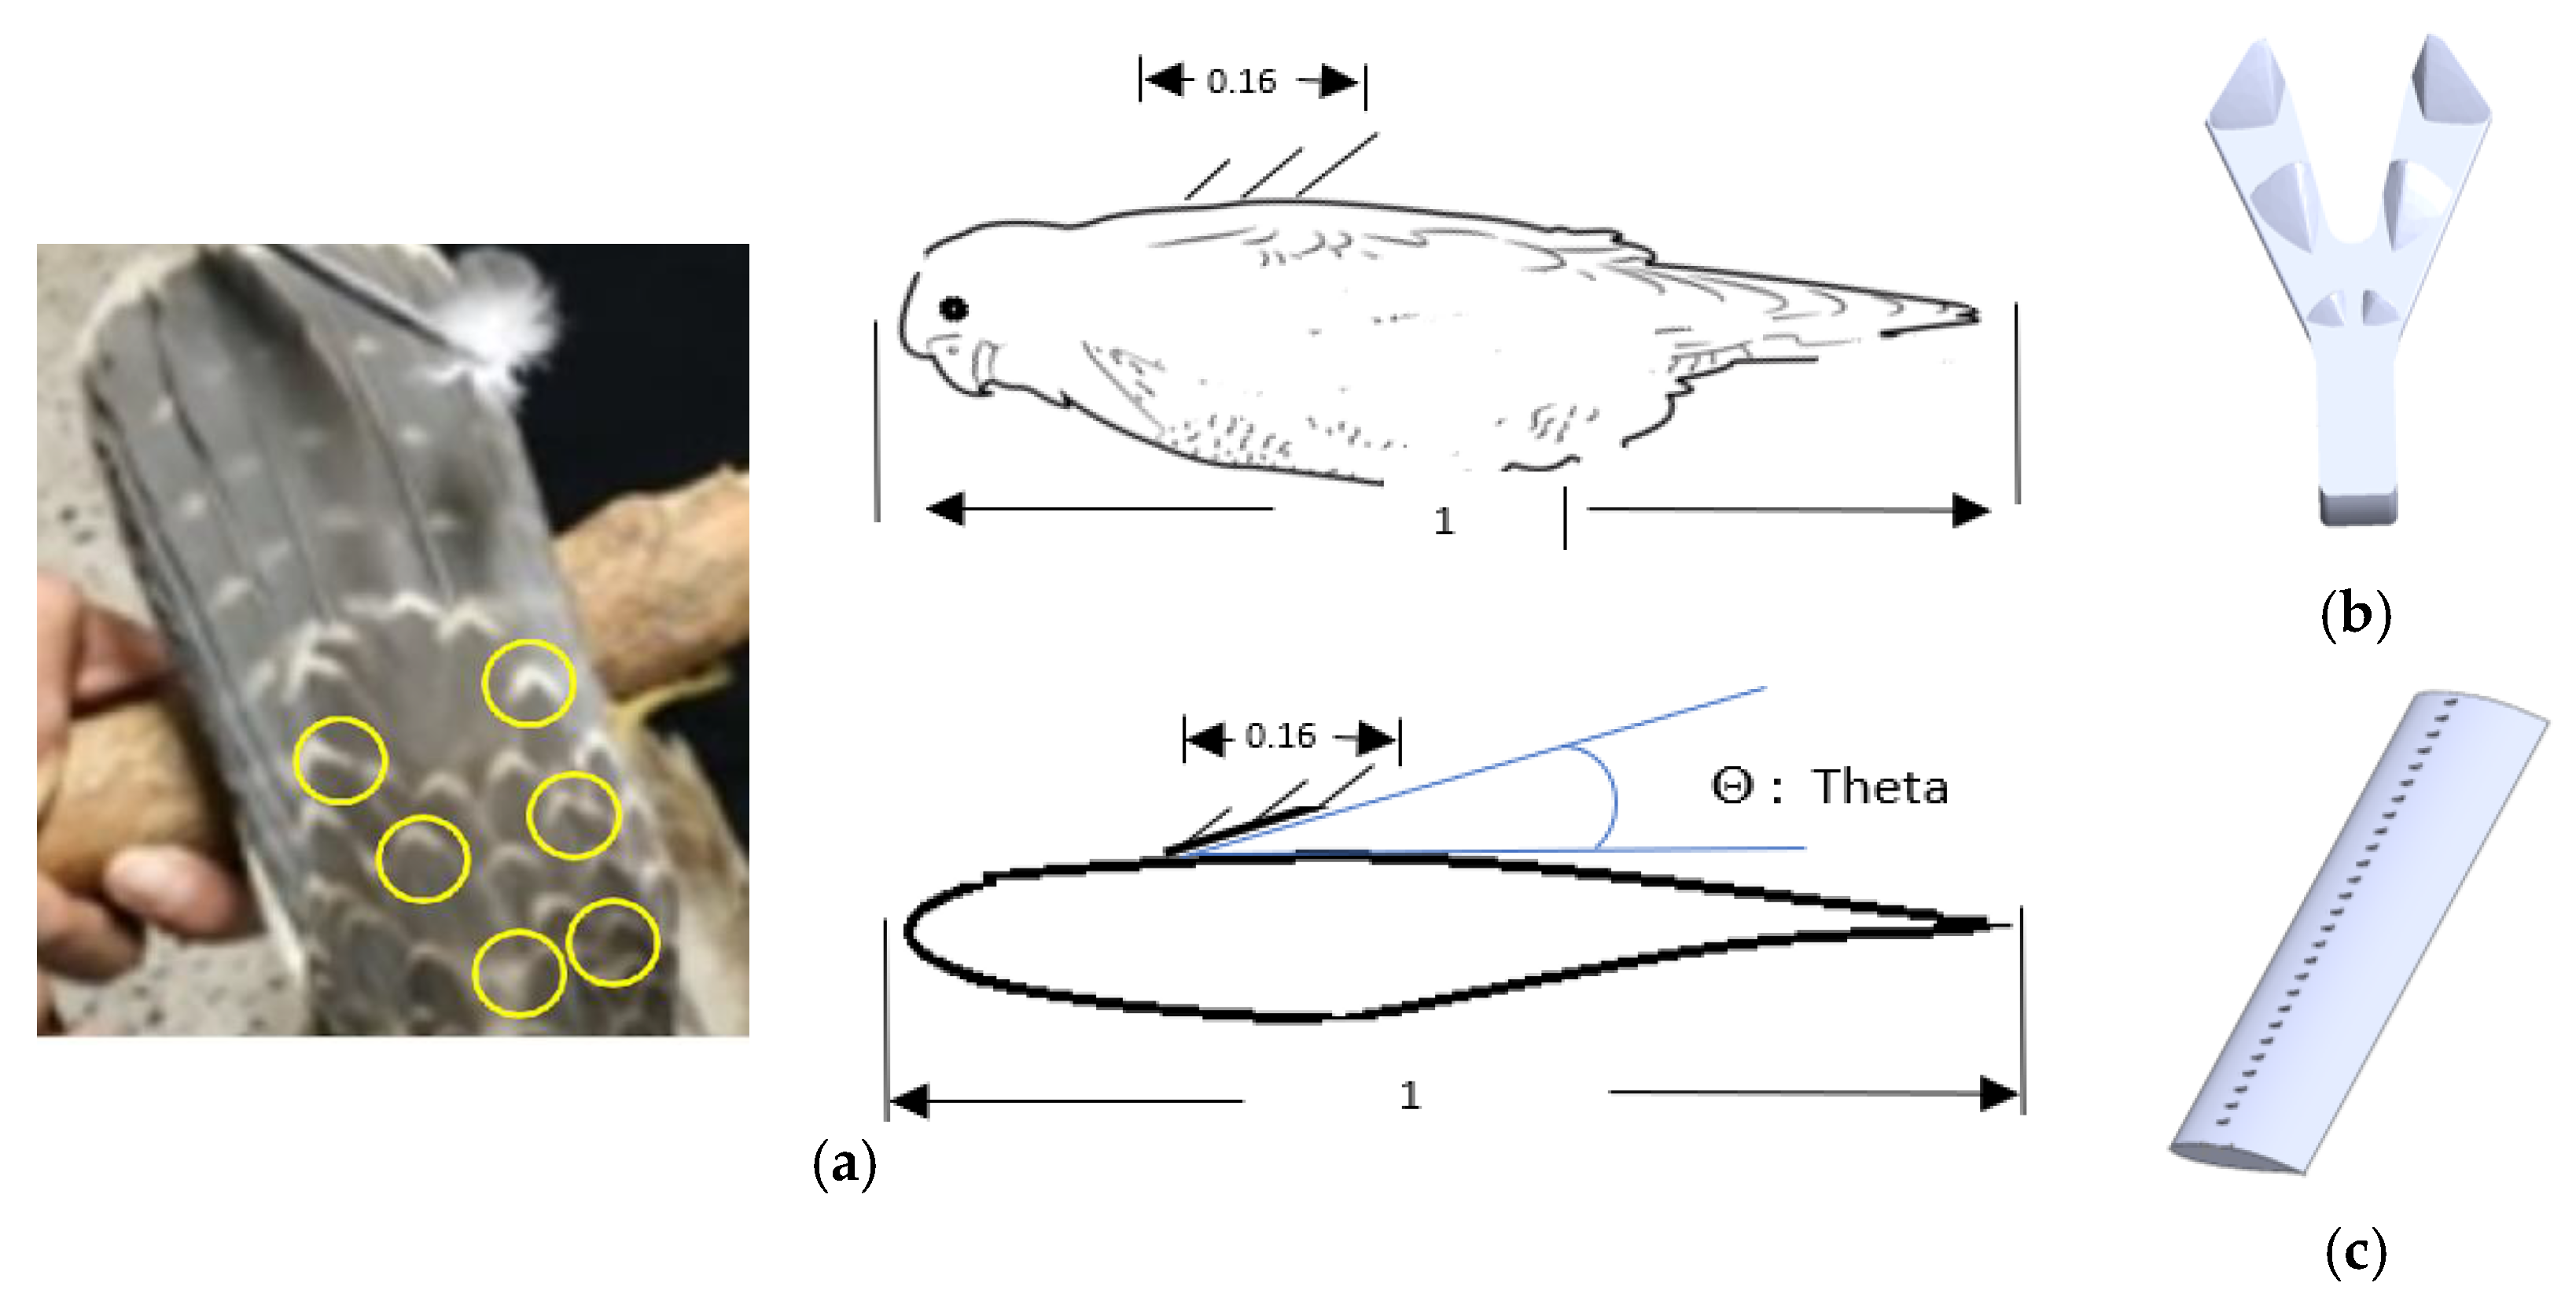
Figure 4 shows the development of the CAD design and construction of the vortex generator based on previous studies of the descending flight of the peregrine falcon [17]. These studies led us to observe the elevation of six feathers on the back of the falcon, so a feather arrangement was recreated on the surface of a vortex generator at a scale of approximately 10:1. In this way, we achieved the addition of a linear arrangement of vortex generators with an axis of rotation and then placed this axis in the quarter chord of a blade with an S822 airfoil; this airfoil is used for aerogenerators with high rotation velocity [21].
Yellow circles show the feathers selected for the construction of the bio-inspired vortex generator (Figure 4). By means of 3D CFD simulation, it is possible to observe the behavior of the fluids; using the ANSYS software tool and the CFX solver (Figure 2), the construction of two simulation domains was performed, one static and the other in rotation by the linear matrix of vortex generators, or VGs. Using the transient mode, it was possible to change the tilt angle Θ or rotate the mesh during the simulation time. Figure 5 shows a transition region analysis, and it was decided to select a value of y + = 20 [22]. This allows to know the behavior of the fluid with a not so fine mesh and to reduce the CFD simulation time.
R e x = ρ V L μ ,   C f = 0.026 R e x 1 7 ,   τ w a l l = C f ρ V 2 2
V f r i c = τ w a l l ρ ,   Δ s = y + μ V f r i c ρ
By using Equations (1) and (2) developed by Frank M. White [23], the separation between nodes was calculated in order to configure the size of the elements in surfaces and areas near the blade and vortex generators. These values are shown in Table 1.
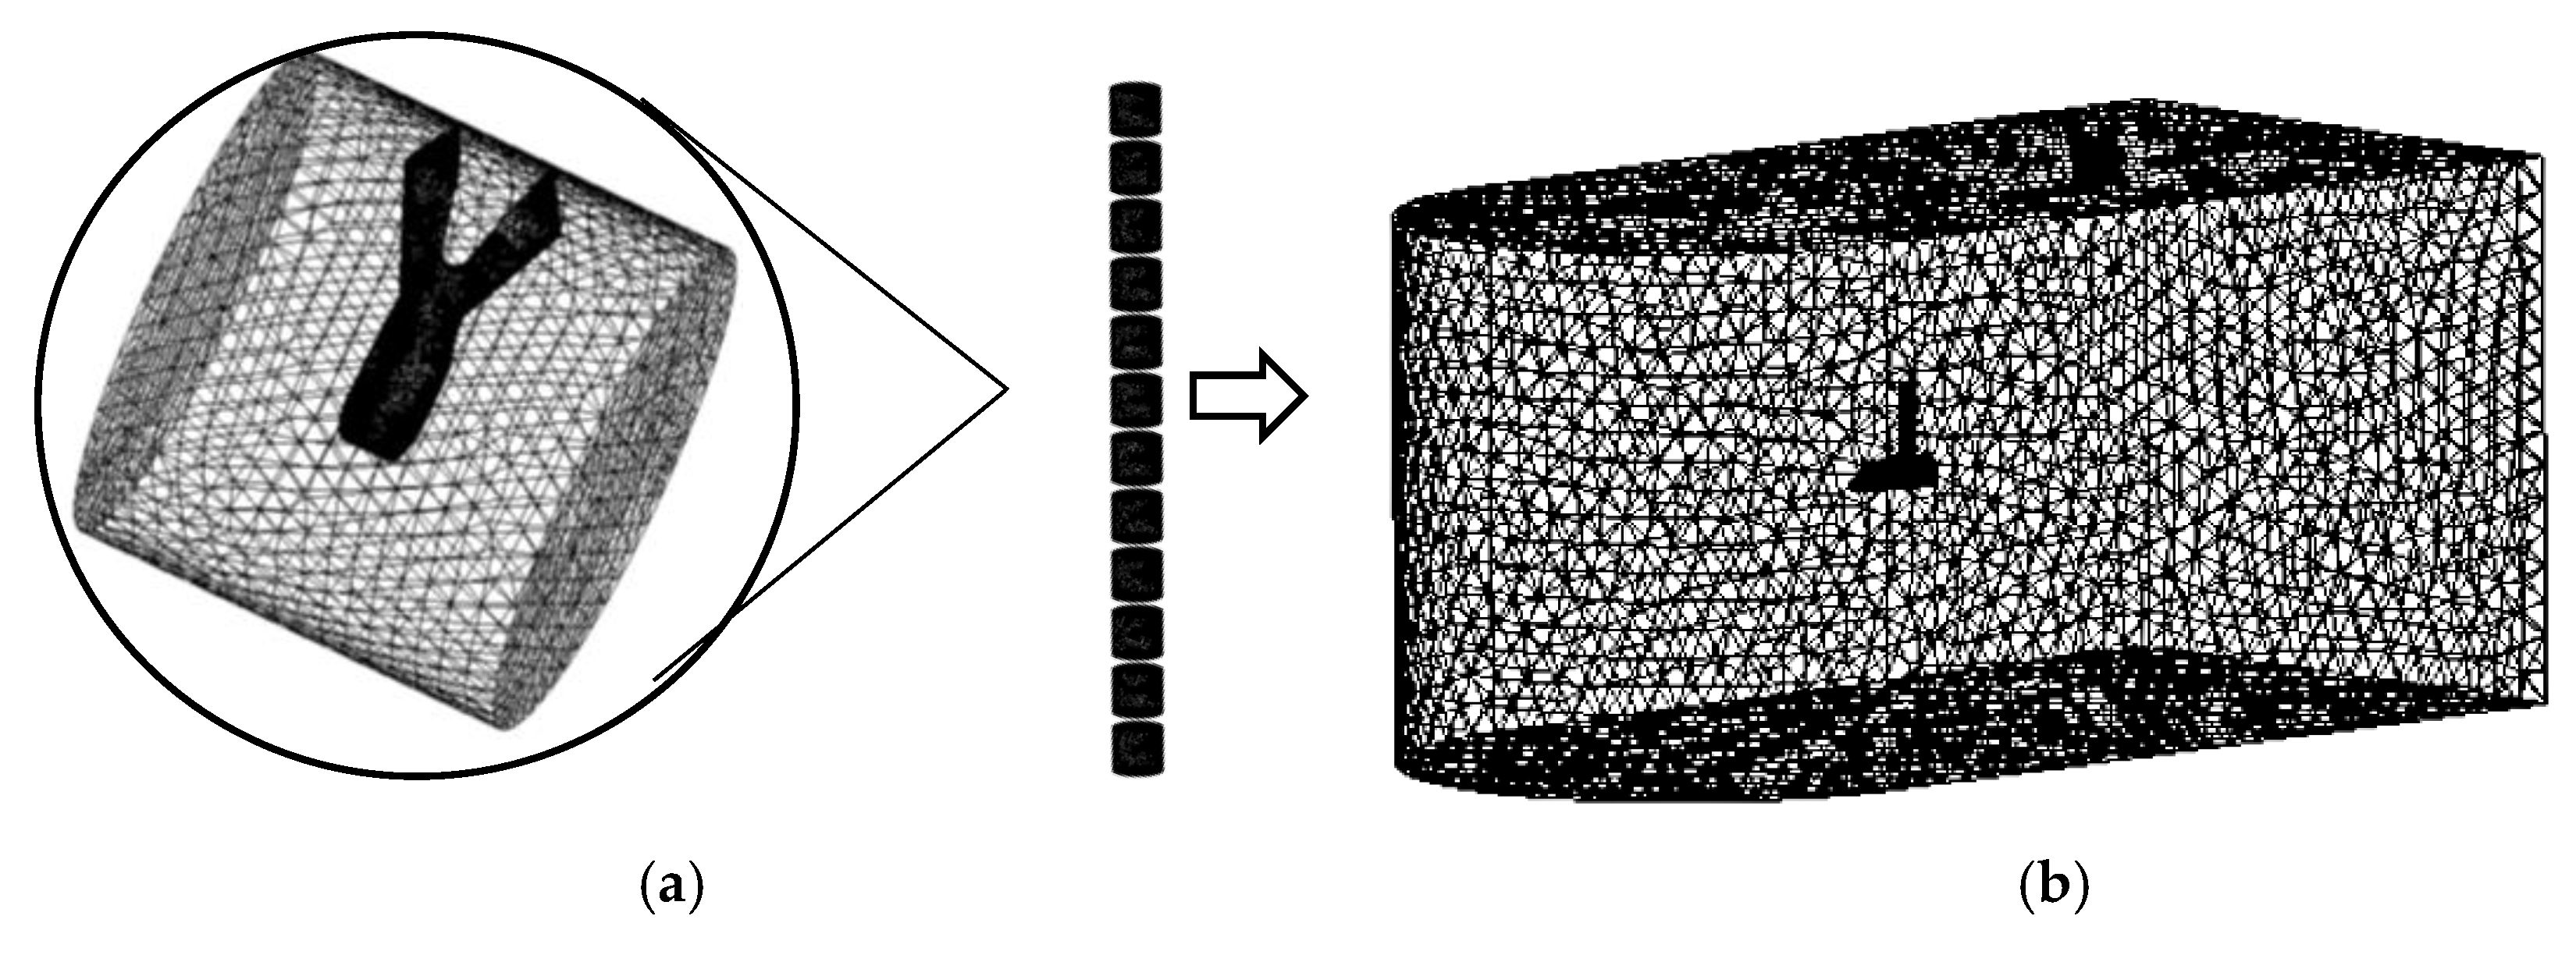
With the finite volume meshes of (Figure 6) obtained for y+ = 20, the following simulation parameters were configured (Table 2).
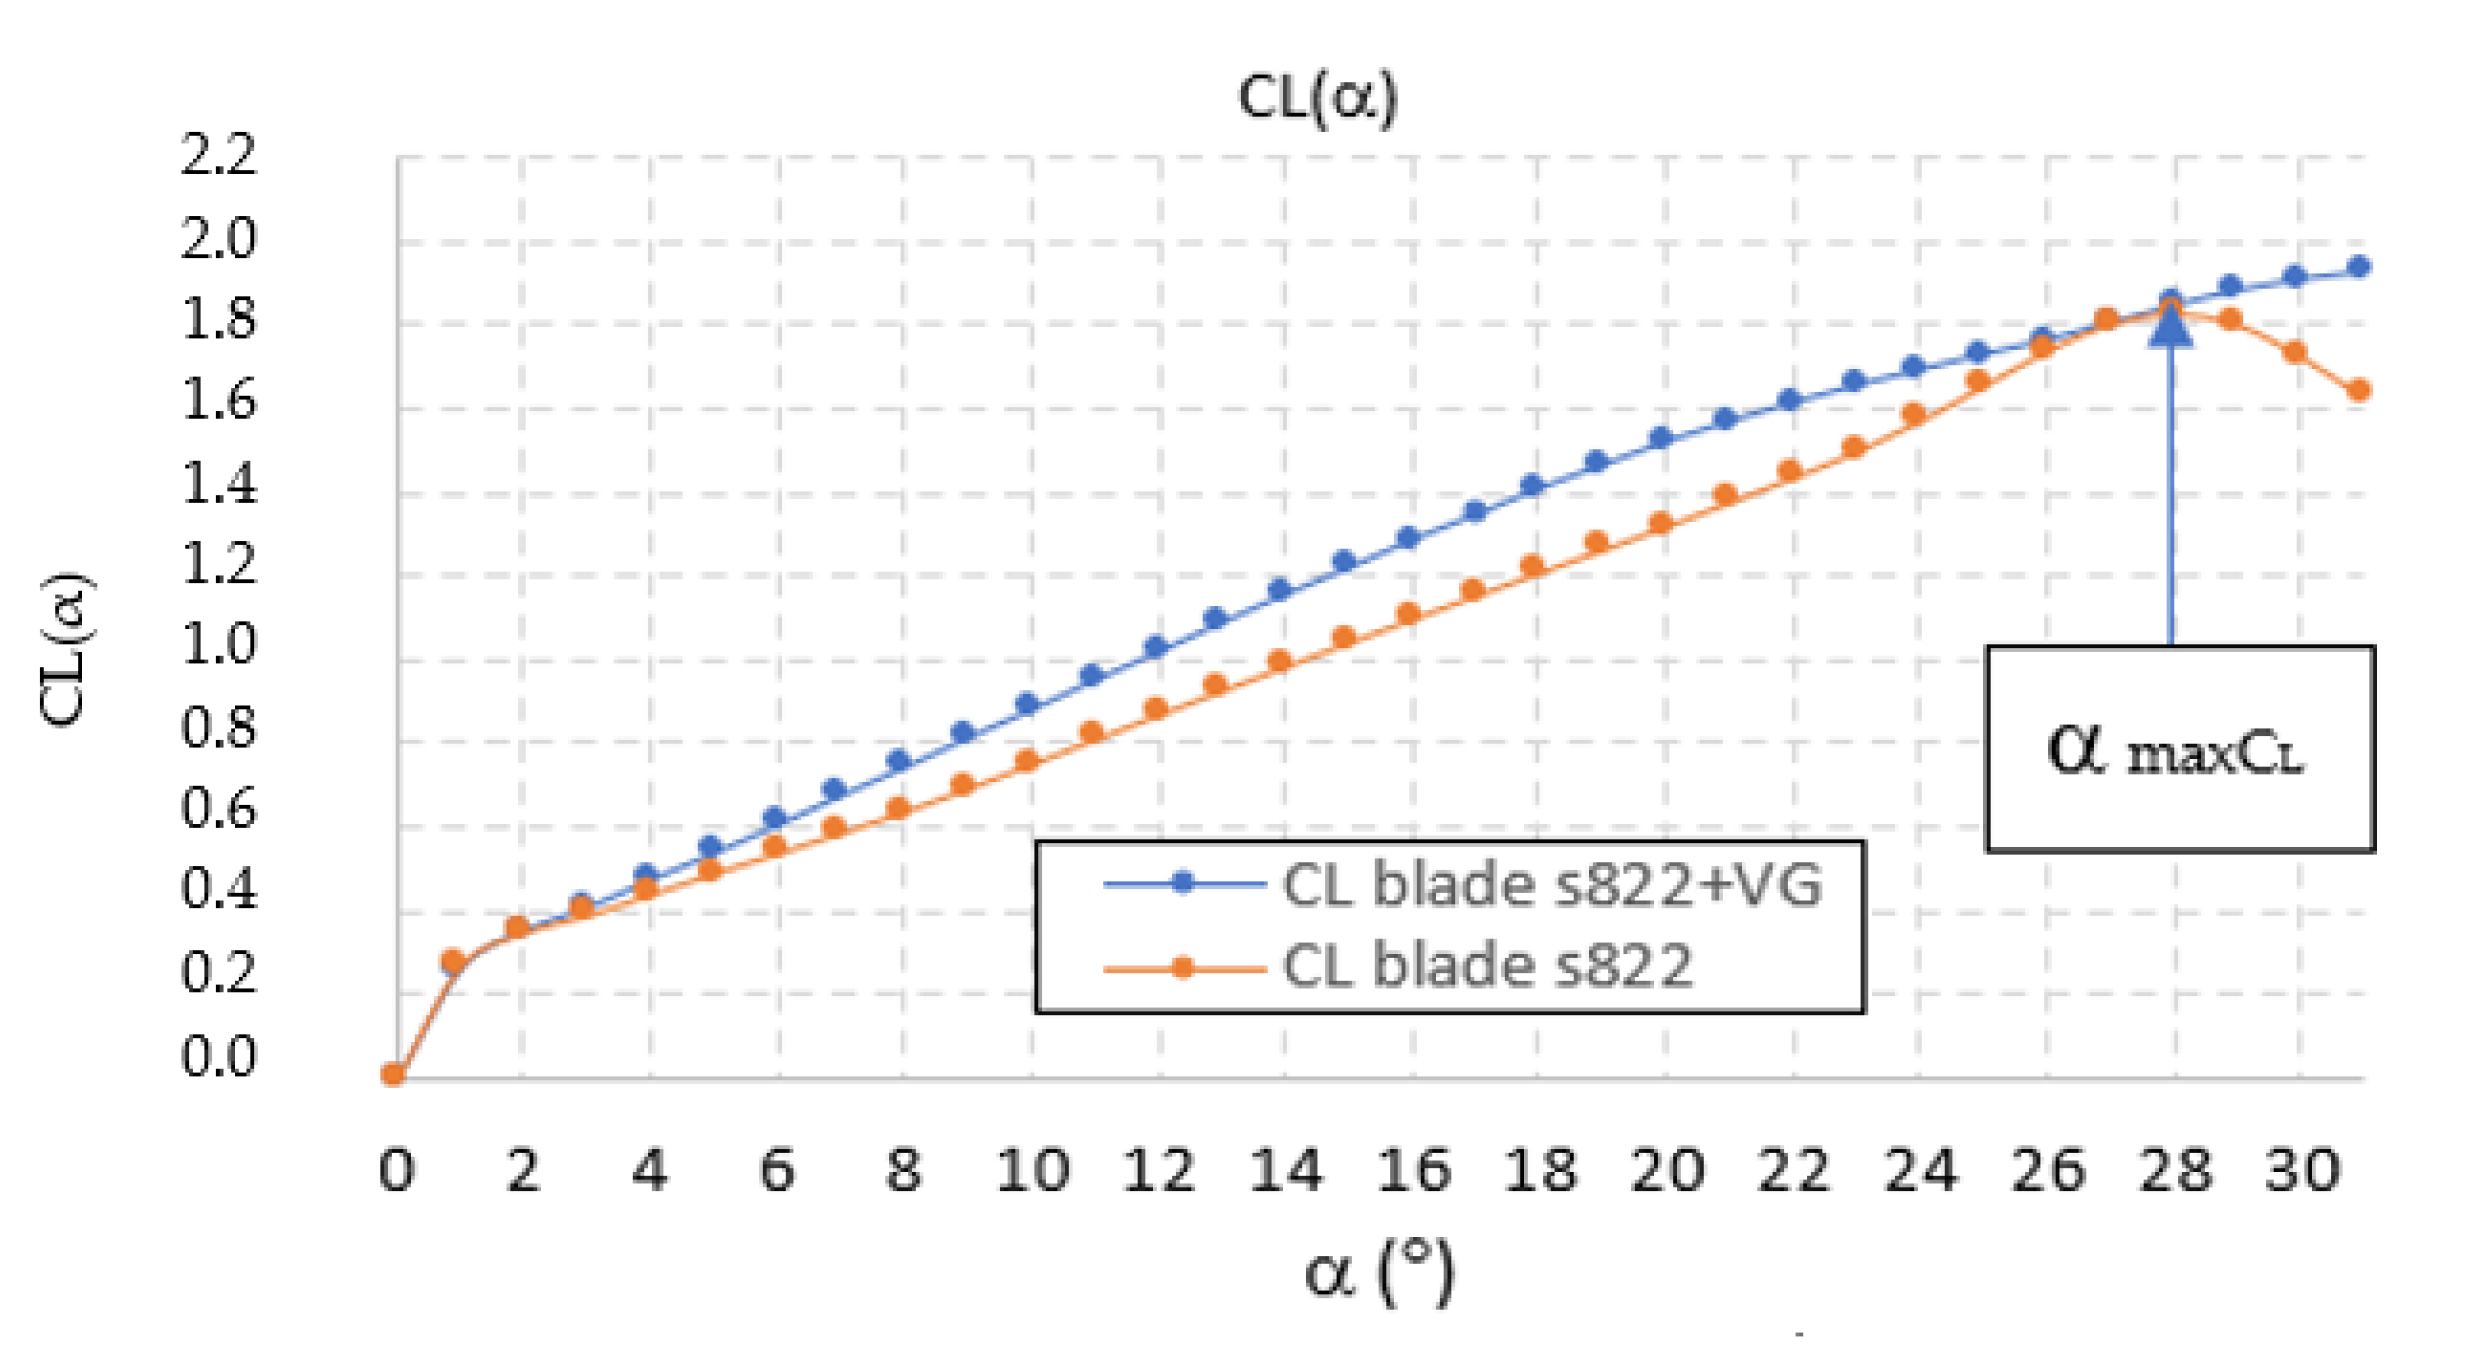
Previously, a convergence analysis or mesh sensitivity was conducted with 3D tetrahedral element edge sizes on the feather surface of 10 mm, 5 mm, 3 mm, 1 mm, and 0.5 mm [8]. Very similar simulated values were observed starting from 3 mm; therefore, all meshes of the CFD simulations were configured with a maximum finite surface size of 1 mm, obtaining rotative meshes of the blade. The construction of the meshes for a first CFD simulation was performed; with this simulation, we seek to analyze what advantages exist in a blade with an S822 profile with and without VGs. To compare the simulation results, we set up a simulation in transient mode with a rotational domain and thus generated the curve of lift coefficients (CL) for the two blades as a function of the angle of attack Alpha that will vary with each time step (Figure 7).
Figure 6 shows the CAD and meshes of rotating and static or envelope domain, the simulation time and time steps were configured to obtain the curves of the forces in the direction of the y-axis or lift experienced by the two types of blades. Using a spreadsheet, the CL coefficient curves were generated with Equation (3).
The curves in Figure 7 show the behavior of the dynamically simulated lift of the two blades with an S822 profile, one with vortex generators and the other without. The figure shows an improvement in the lift values of all the pitch angles of this coefficient, which indicates an aerodynamic difference in the blades when adding these devices at fifteen degrees of pitch or theta = 15°, the maximum CL value obtained in the blade without a vortex generator.
C L = L 1 2 ρ V 2 A
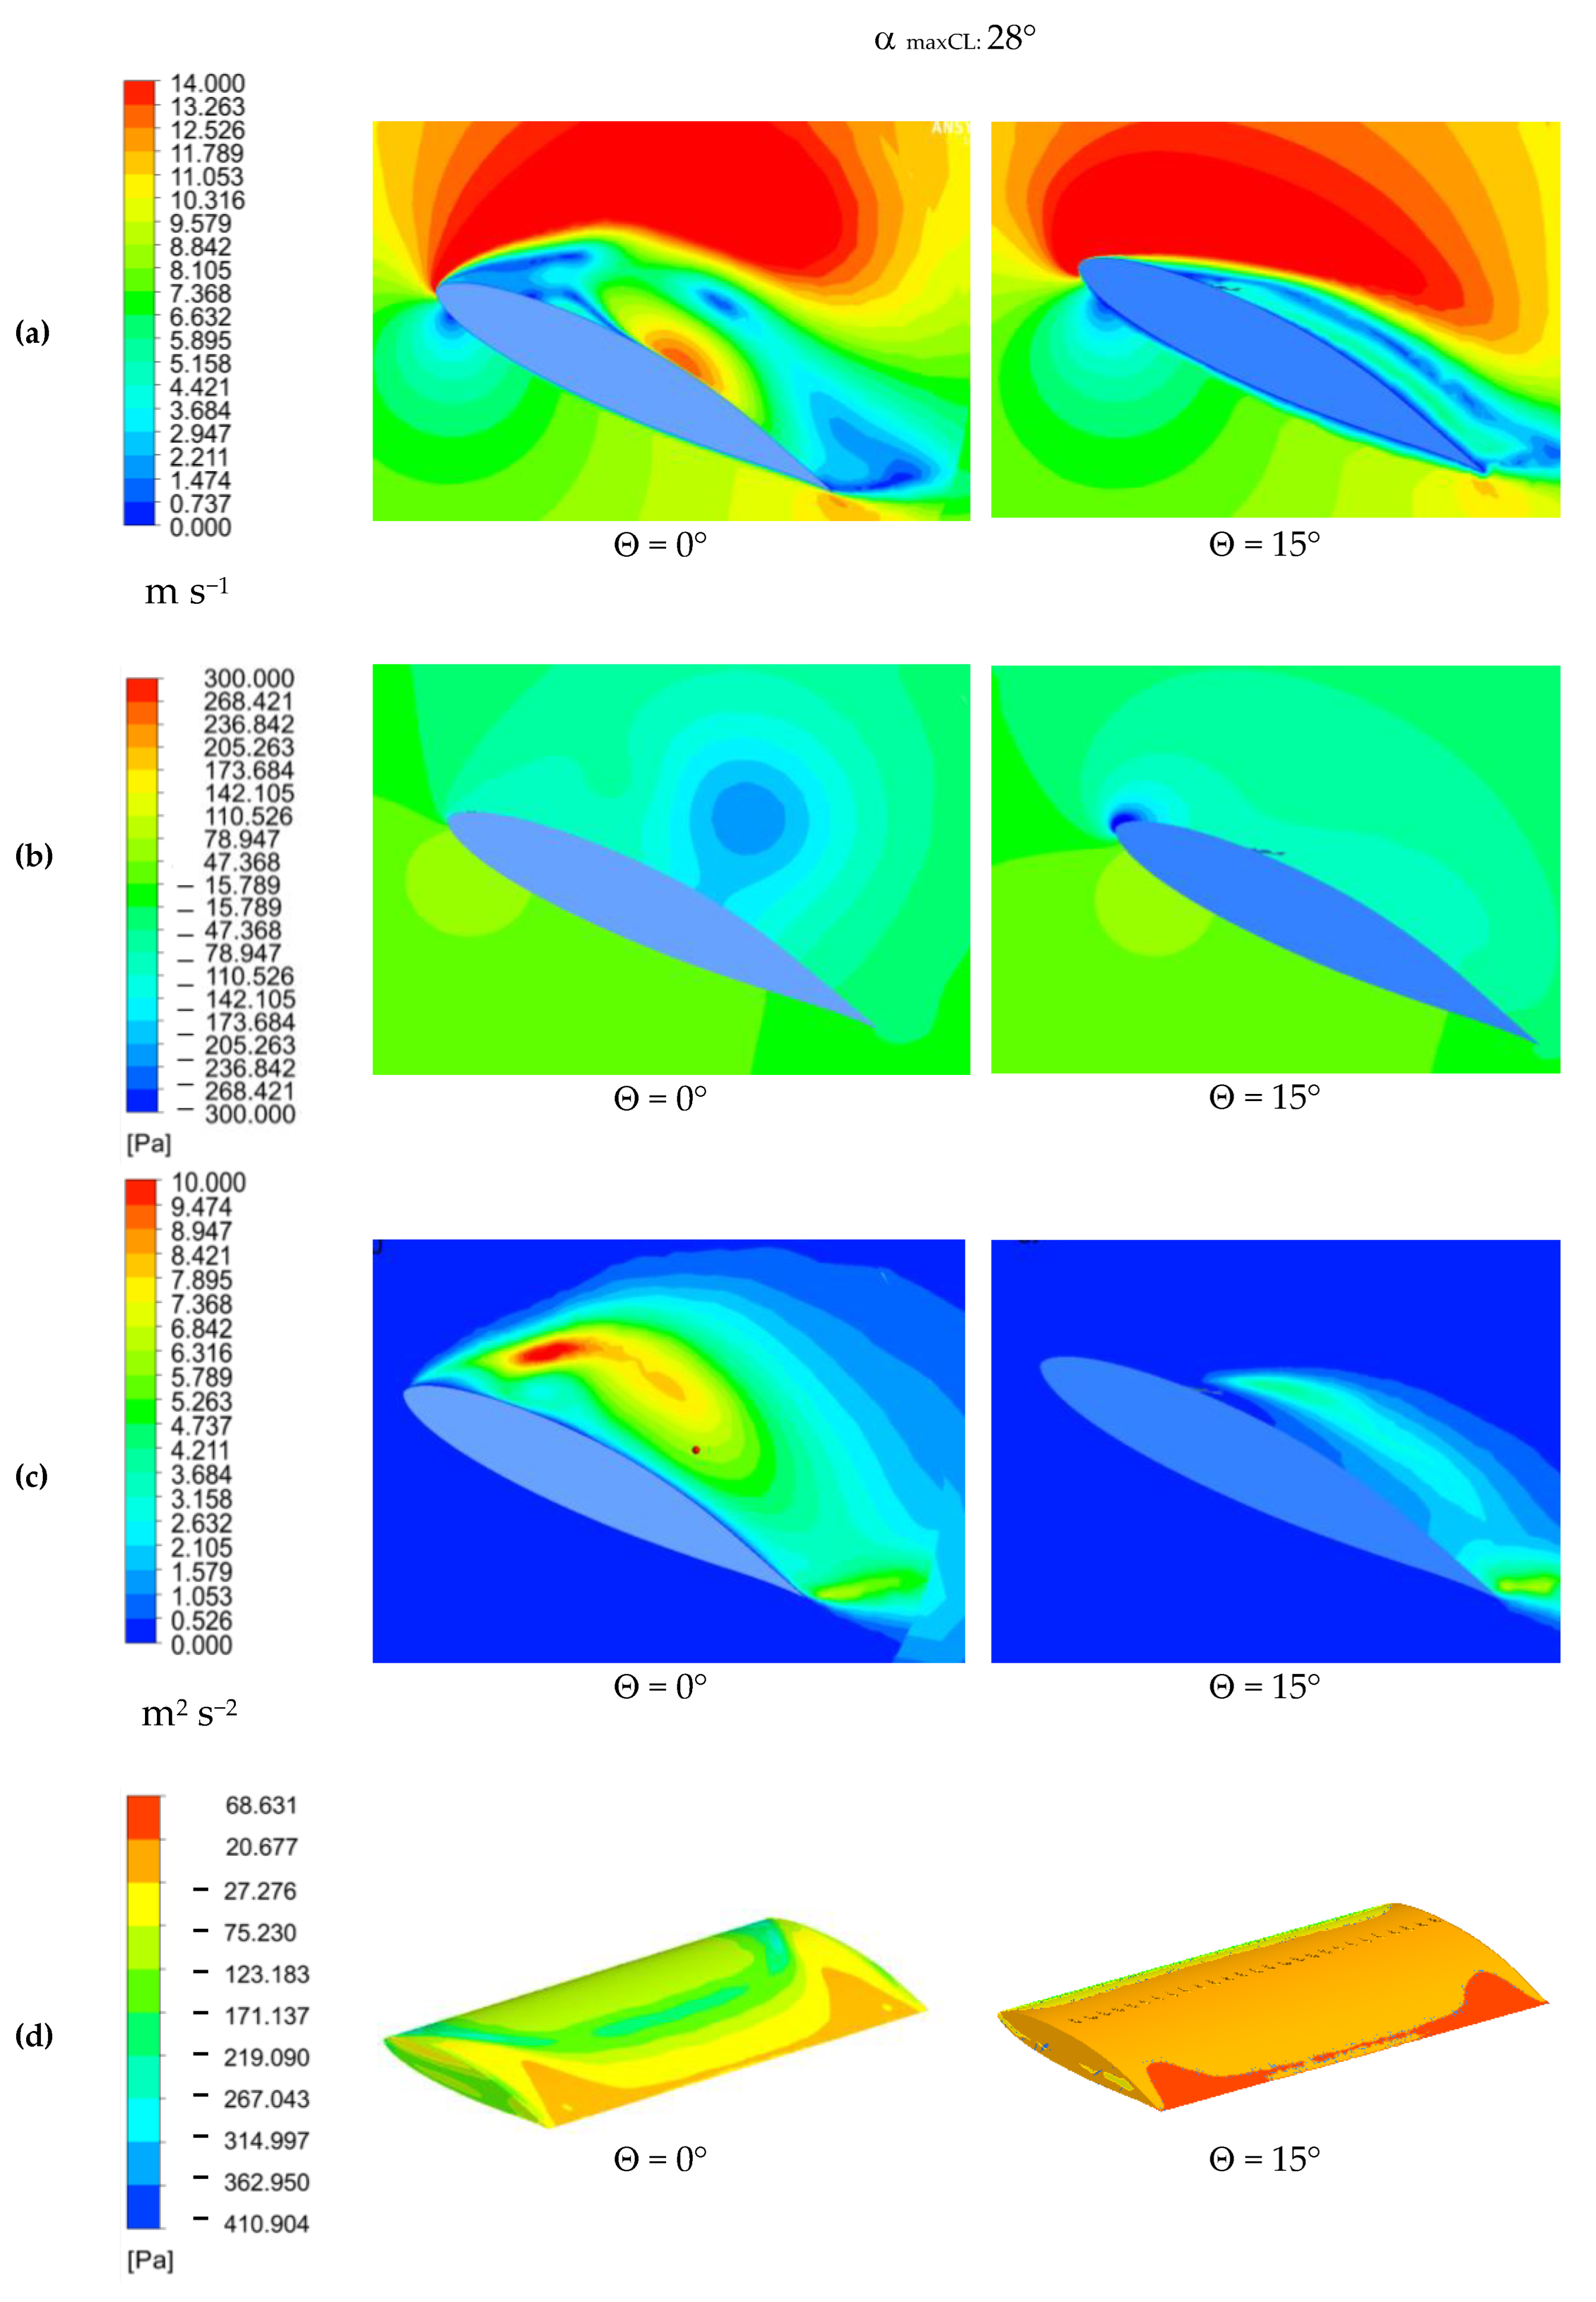
The CL curves in Figure 8 show an angle of alpha = 28°. For this reason, contour planes of velocity, pressure, and turbulence kinetic energy or TKE were generated at this angle of attack, and thus, we compared the results and observed possible differences associated with the addition of bio-inspired vortex generators in the blade. The behavior of the CL curves is similar to that obtained in previous blade works, such as those carried out by Tim Colonius [24] and Jasvipul Chawla [25].
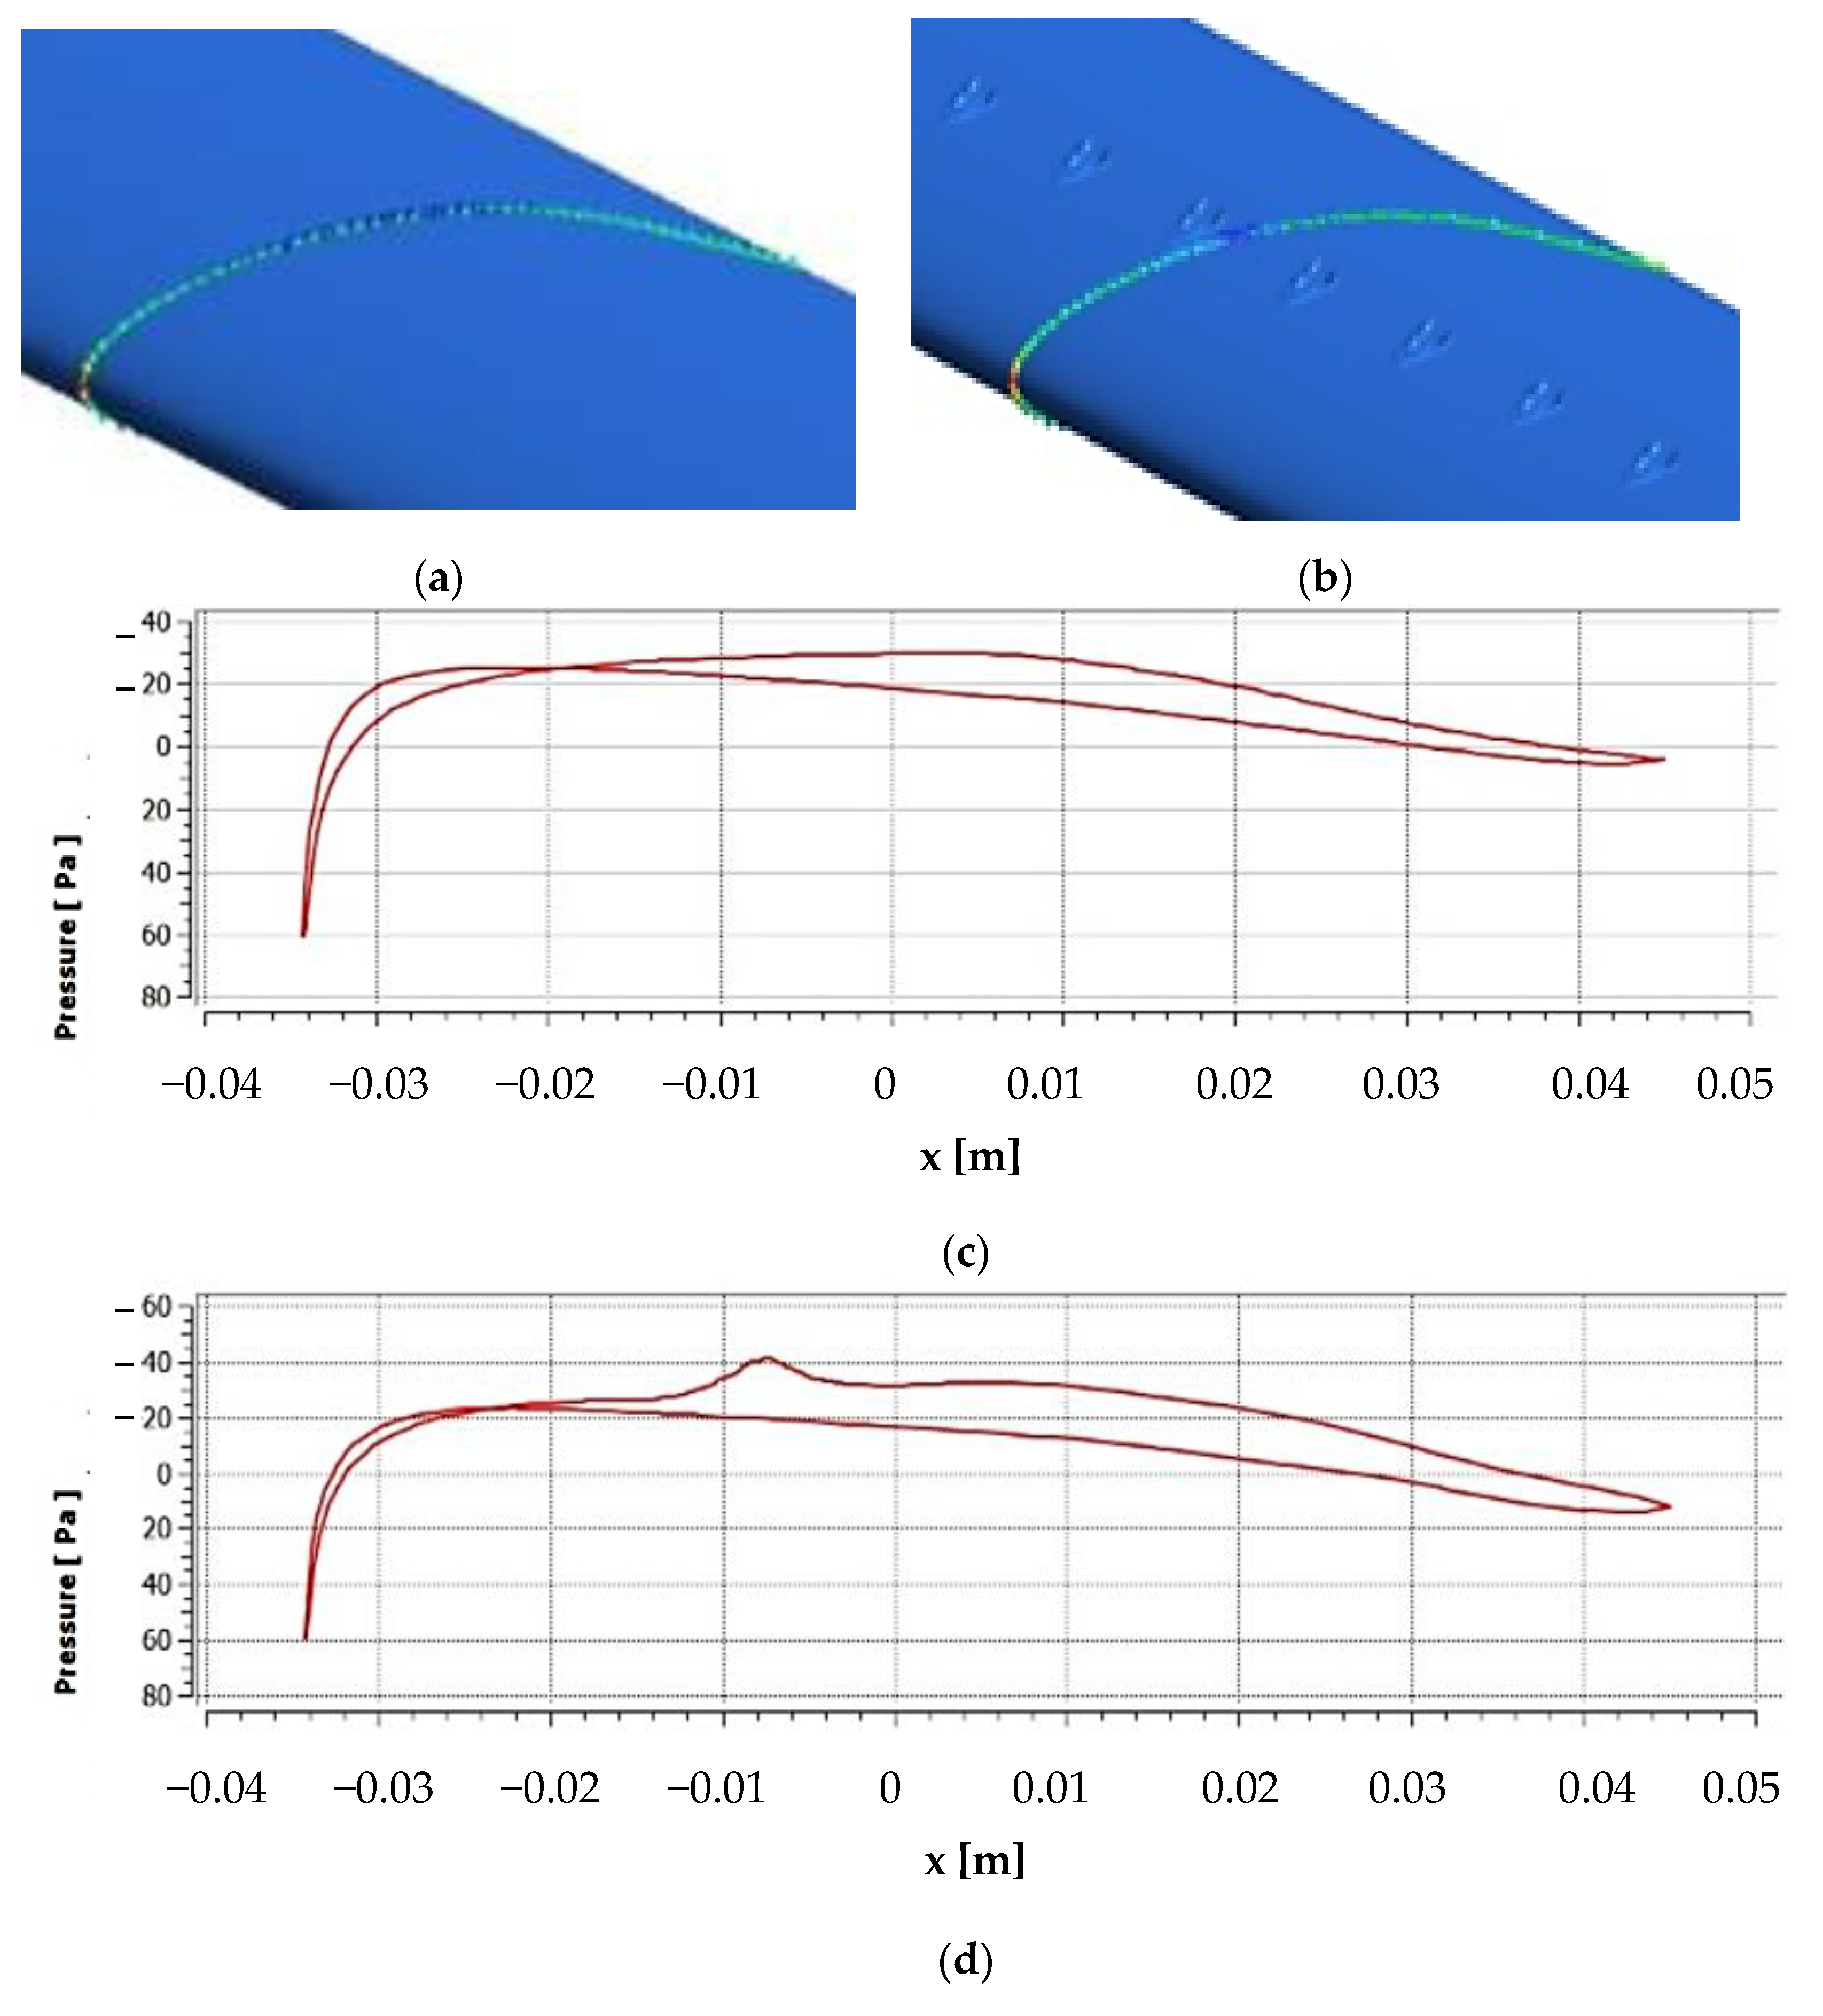
Figure 8 shows that the CP pressure curve presents an overpressure behavior in the vortex generators (Figure 8d) with respect to the blade without vortex generators (Figure 8b) using CFD-Post software.
The simulated contour planes in Figure 9 were obtained at the time step associated with the maximum CL. The velocity contours show an increase in the size of the low velocity wake generated by the blade by adding the vortex generators in linear array aligned in the quarter chord. The pressure contours show that the vortex generators increase the negative pressure in the air near the leading edge of the blade. The turbulence kinetic energy contours show a considerable reduction in the values and contour sizes of this variable with the addition of passive or static VGs with 15 degrees of pitch or theta, Θ = 15°.
The surface pressure, as well as the other variables observed by means of contour planes, shows an interesting behavior since higher values of pressure are observed in the upper surface or surface where the VGs are located. This indicates that the location of vortex generators increases the pressure in the upper surface of the blades.
A second CFD simulation was performed with the following parameters: mode: transient, total simulation time: 5 s, time step: 0.04 s, loops: 800, turbulence model: kw-SST, fluid: air at 25 °C, incoming wind velocity: Vwind = 20 m/s, pressure: 1 atm, turbulence level: 5%, and velocity of subdomain rotation: Vrot = 1 rev/s. For static domain, we obtained 1,089,442 nodes and 3,144,901 elements, and for rotational domain, we obtained 865,109 nodes and 4,787,115 elements (Figure 10).
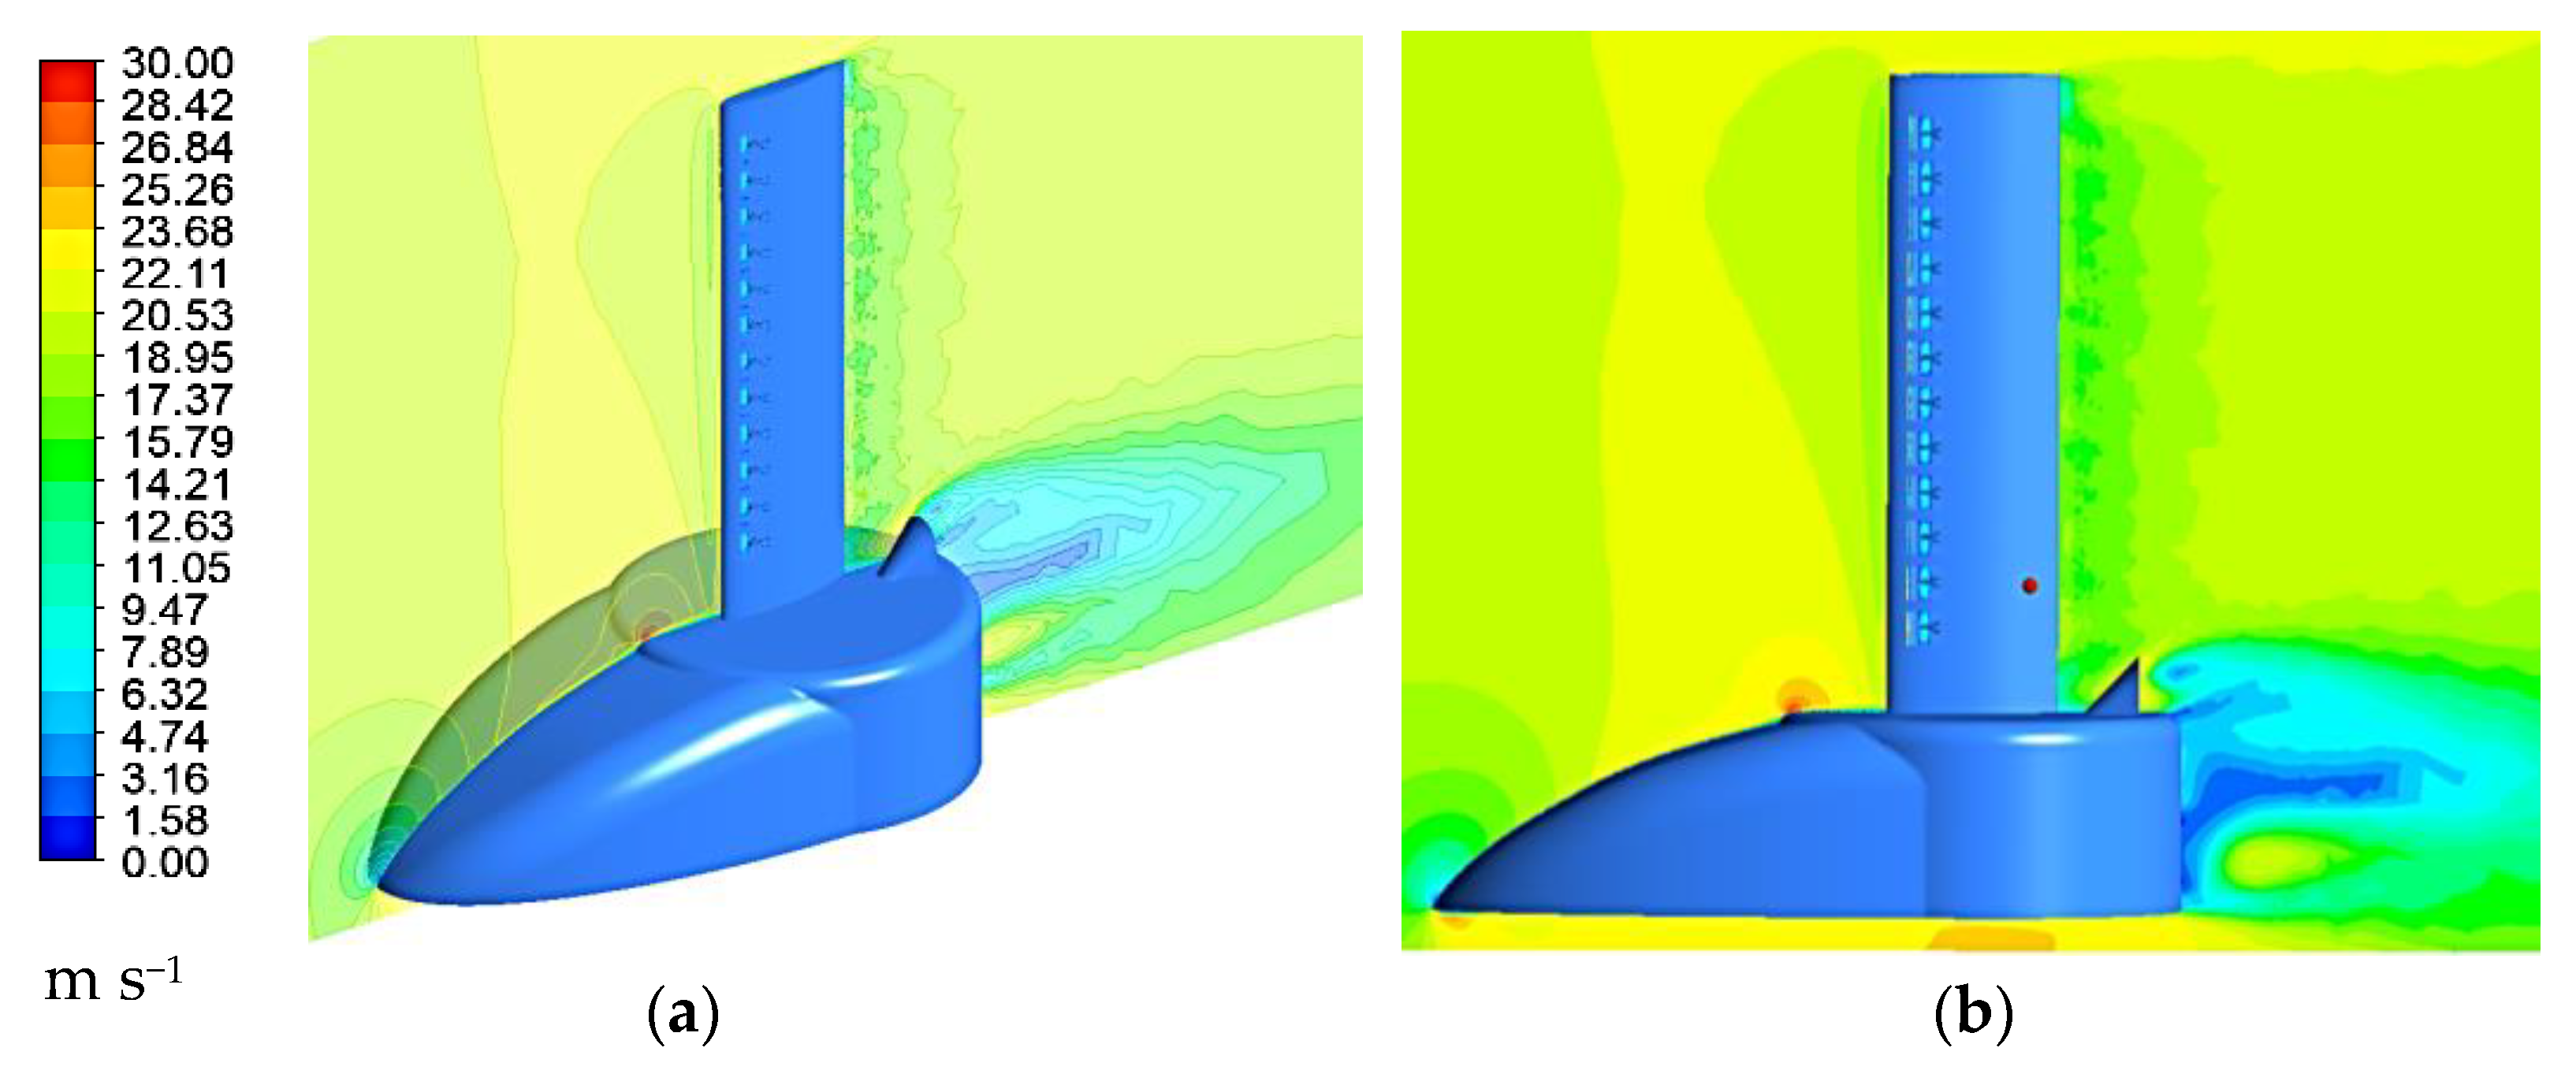
Figure 11 shows a prototype blade section of 350 mm height and an 80 mm chord with an aerodynamic base that was designed for prototype attachment to the wind tunnel and protection of the acquisition circuit. CFD simulation was performed to analyze whether the housing generates interference in the fluid near the blade. At wind velocity 20 m/s, no low-velocity contours associated with interference near the leading edge of blade were observed.
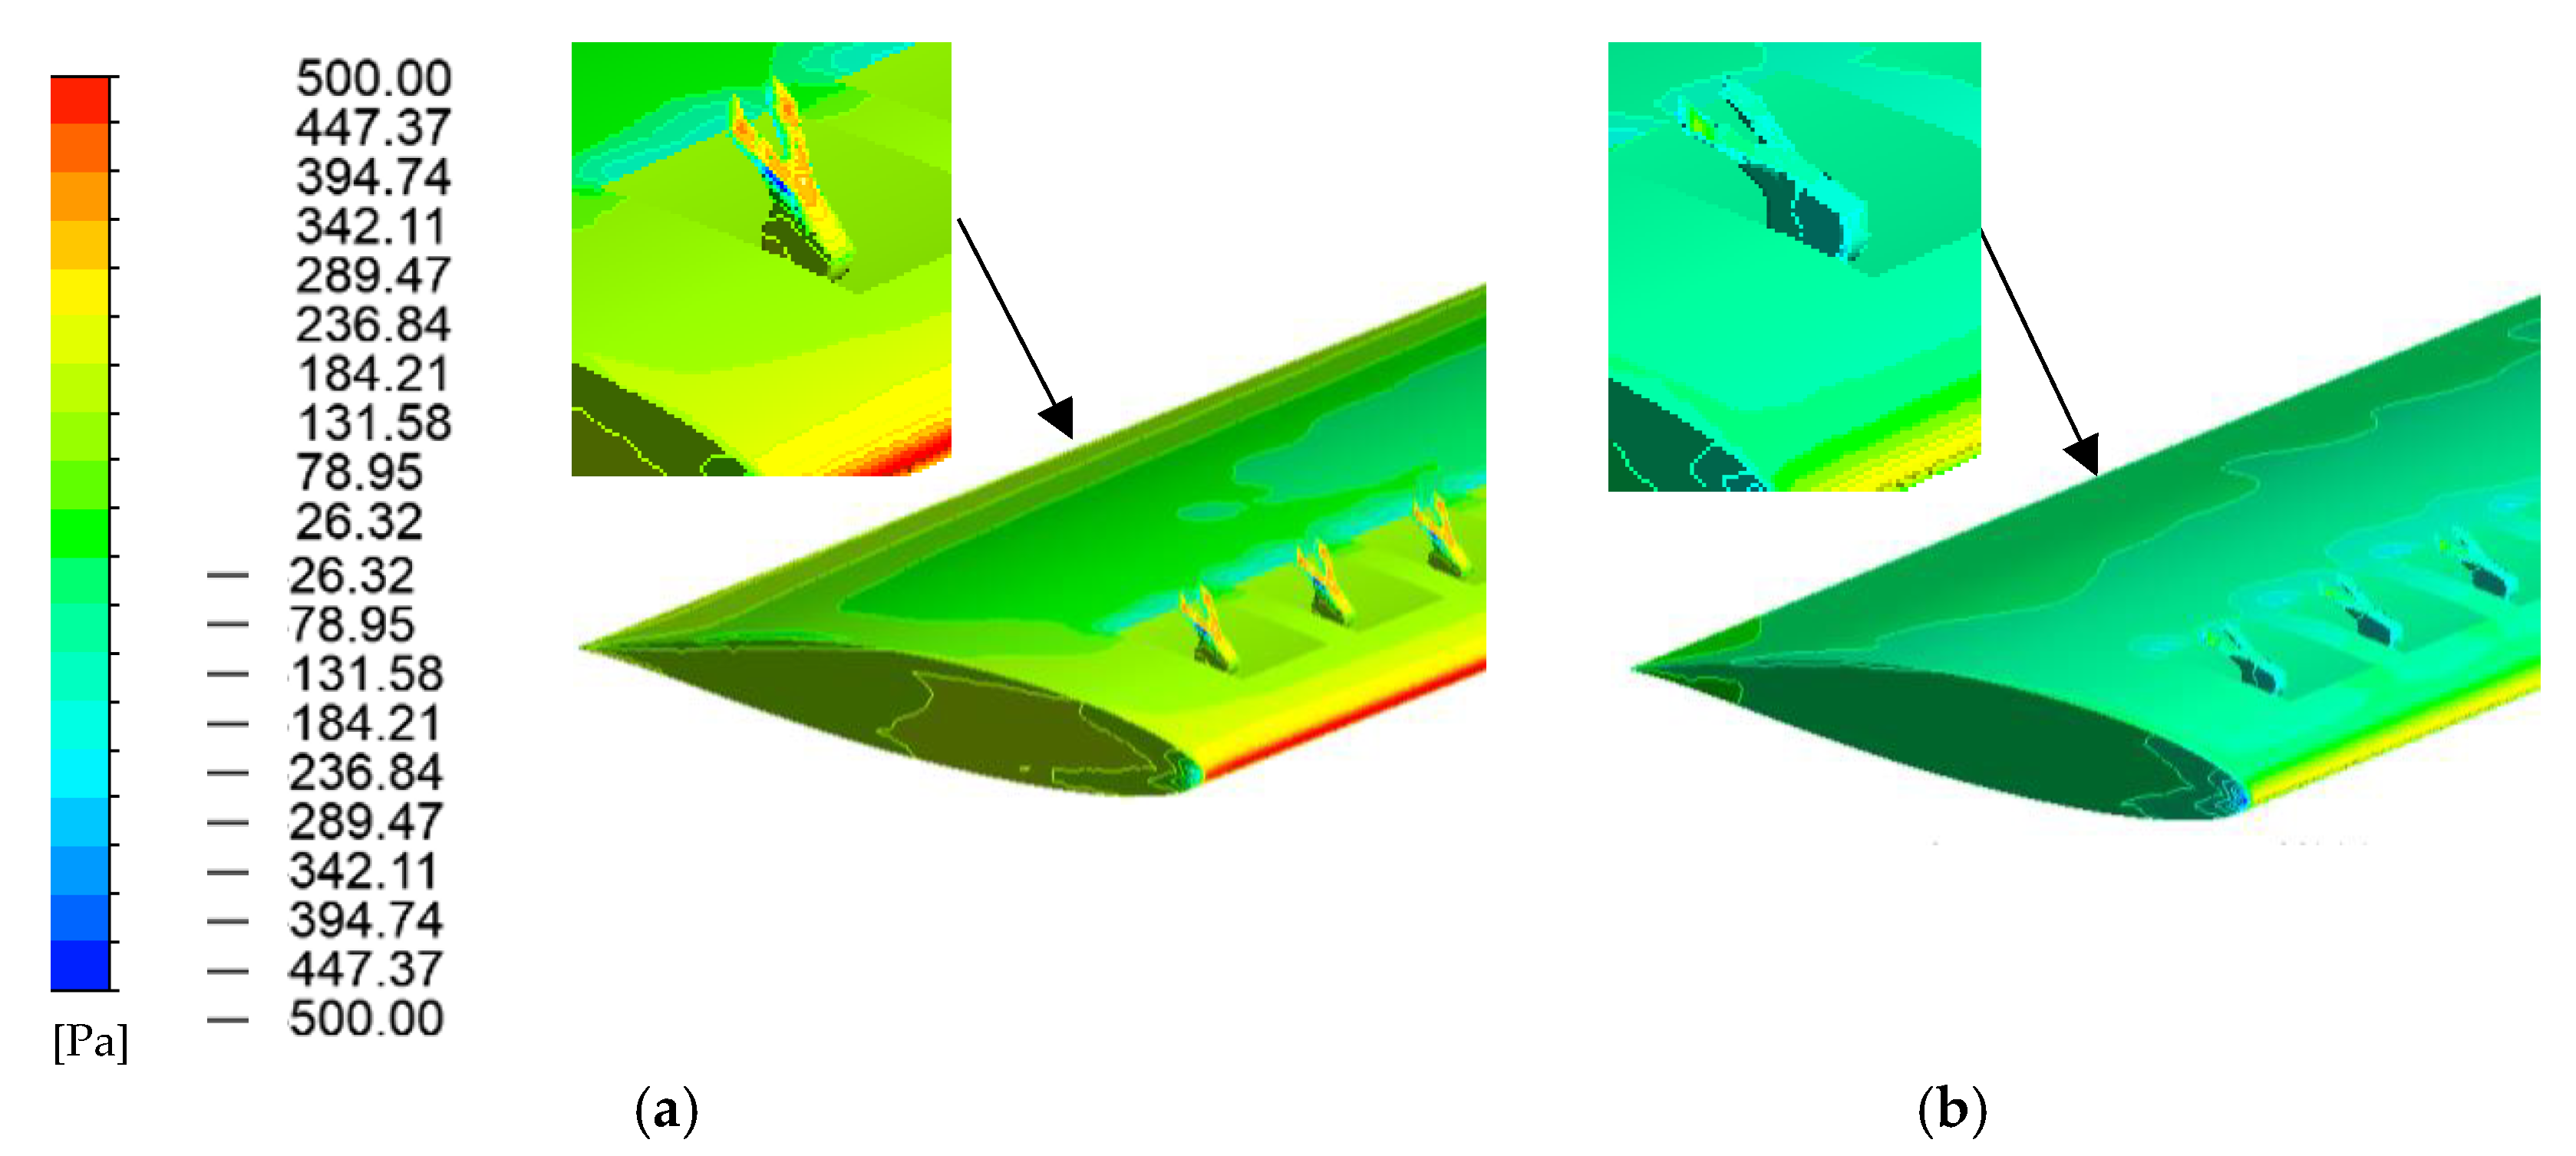
The simulated pressure contours in Figure 12 show that at tilt angles greater than zero, the surface pressure on the upper surface of the blade increases. The largest pressure increases are observed near the bio-inspired vortex generators.
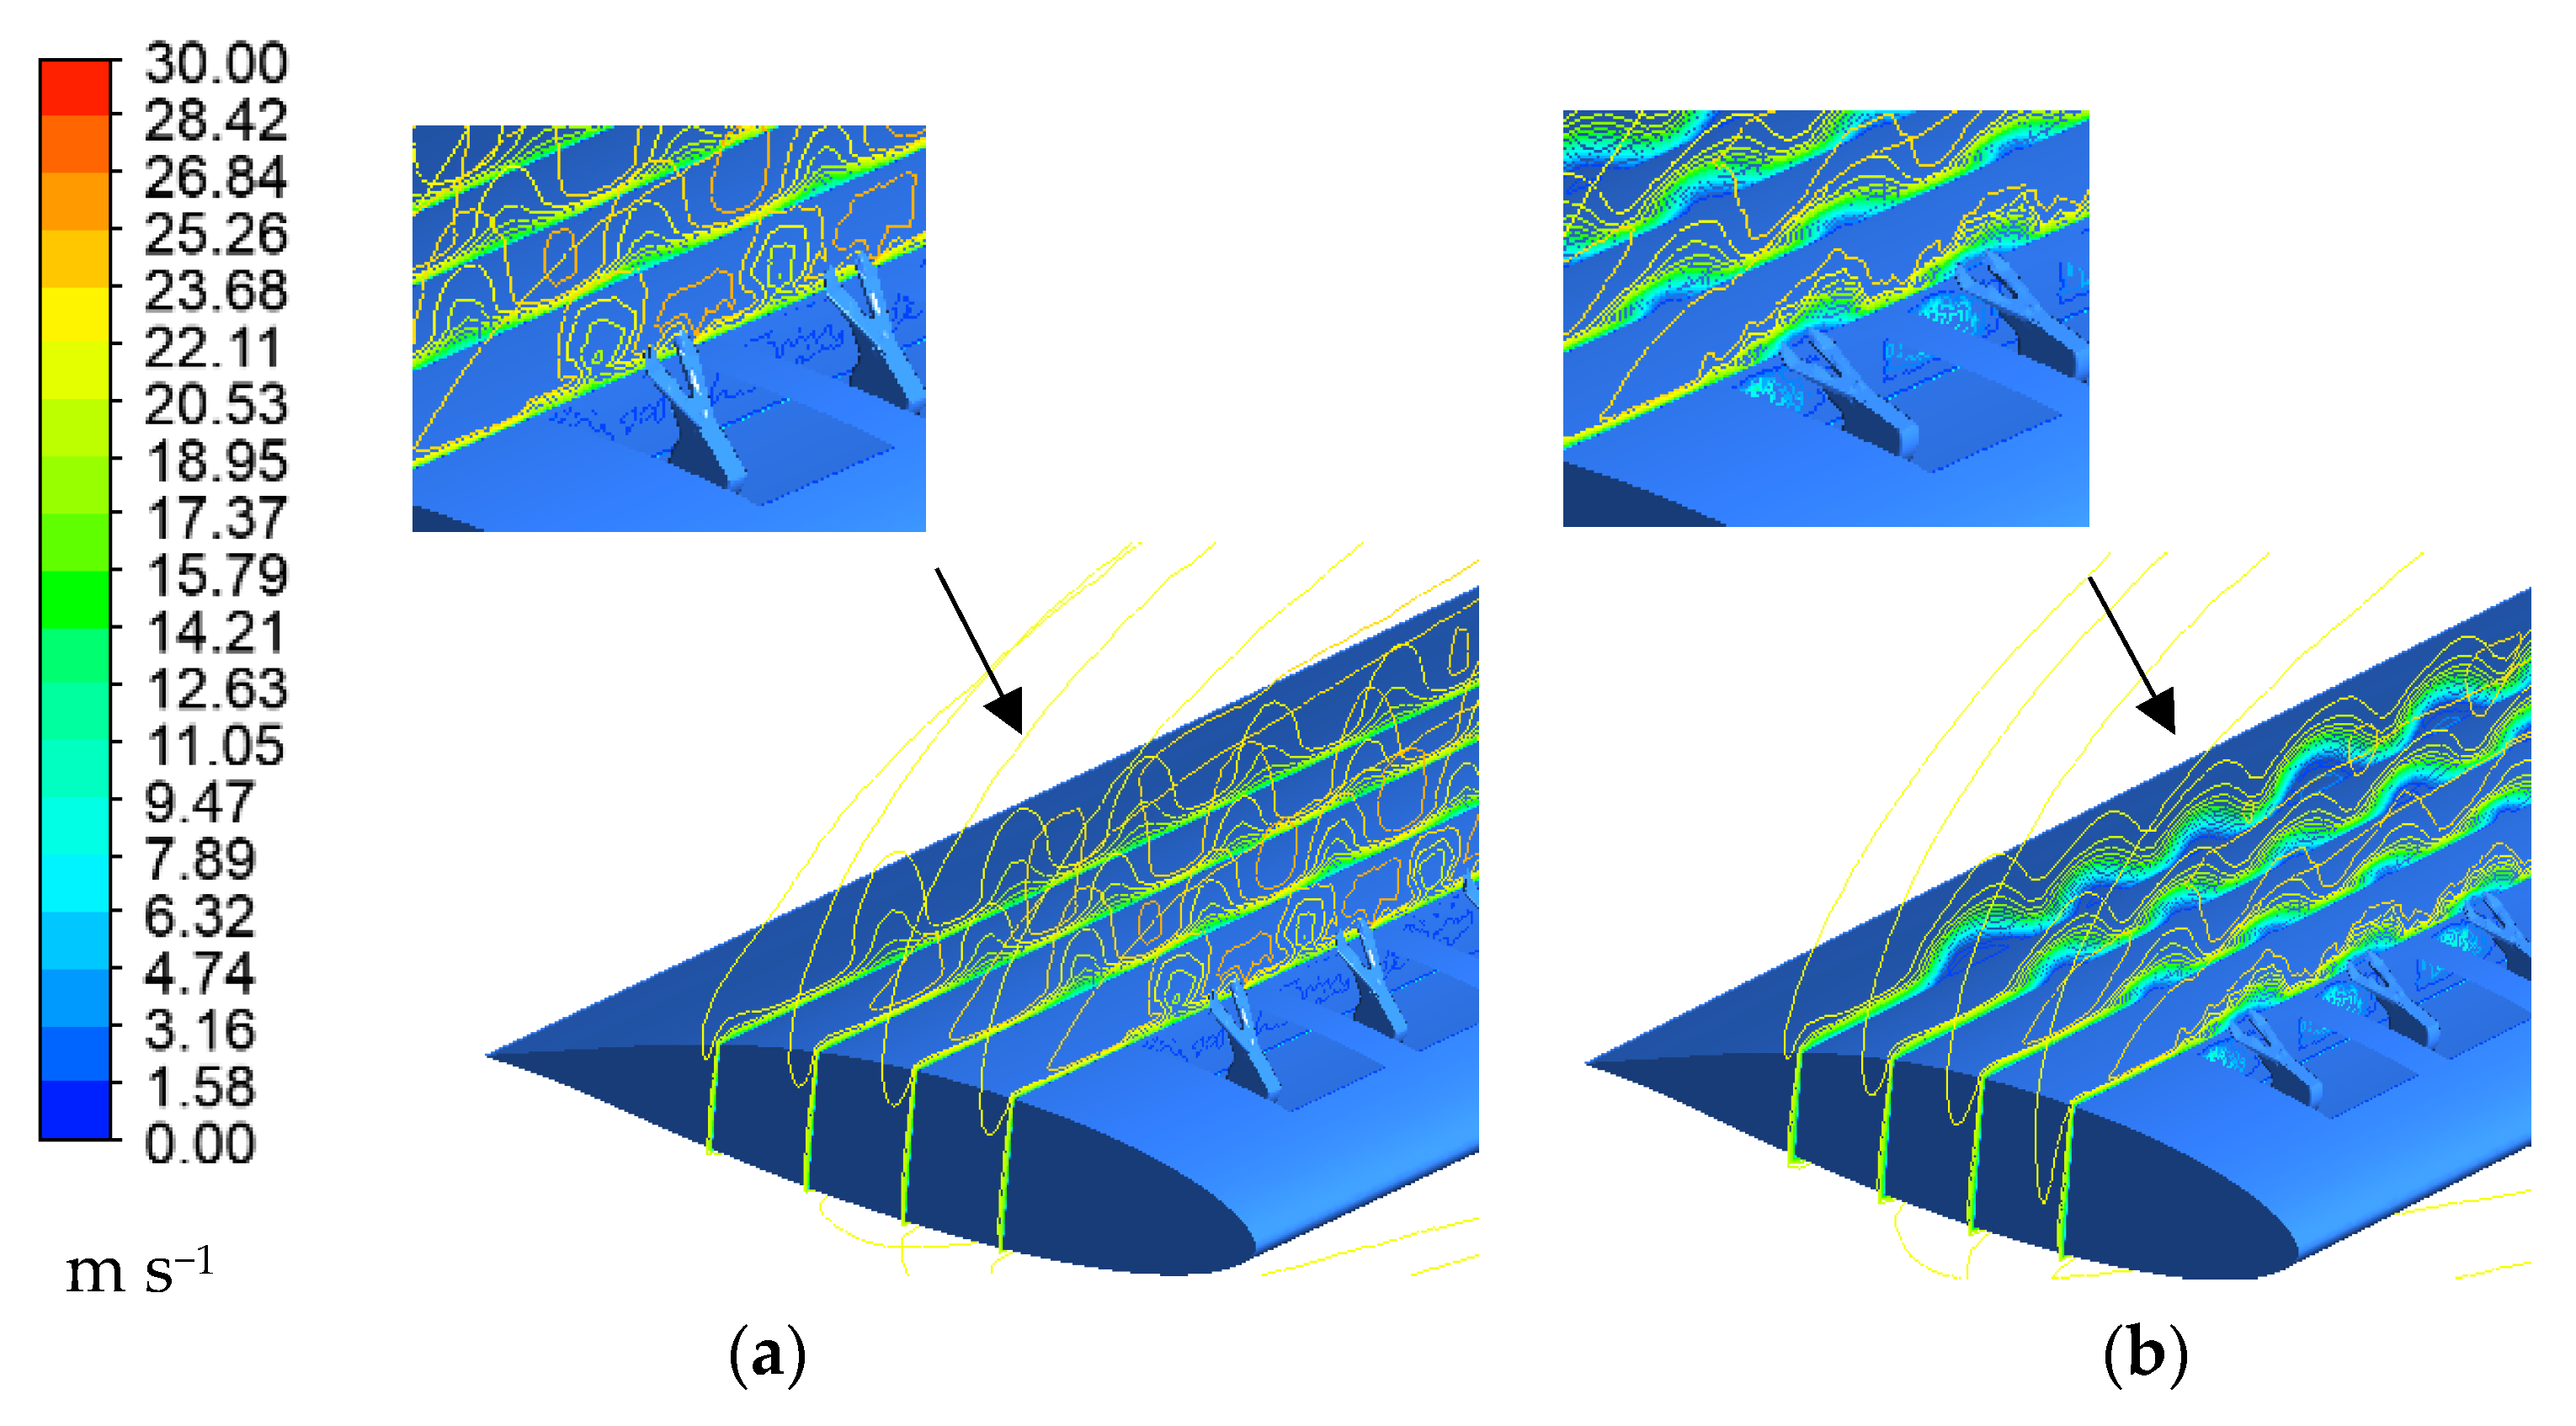
The velocity contours in Figure 13 are obtained with planes spaced at 10 mm. The velocity contours are adjusted in line mode without filling. This post-processing allows observation of the vortices generated in the wind wake. Figure 13 shows contours at 60 degrees tilt angle of the VGs and 15 degrees. Circular vortex cores are observed at 60°, and at the 15° angle, wavy wind velocity contours are observed.
Figure 14 shows roughly the behavior of the wind boundary layer, showing increases in wind velocity in regions above the vortex generator (orange) and a growth in the low wake velocity zone (green).

3.2. Experimental Analysis

Figure 15 shows the electromechanical assembly of the sensors with the acquisition circuit and servomotor for the activation of the designed bio-inspired vortex generators. These devices were printed by 3D printing of Formlabs 3+ resin with Gray V4 resin or standard resin then coupled to a stainless-steel shaft of 2 mm diameter, achieving a linear arrangement of the VGs. This shaft is in the quarter chord of the profile and is coupled to a 5 VDC servomotor.
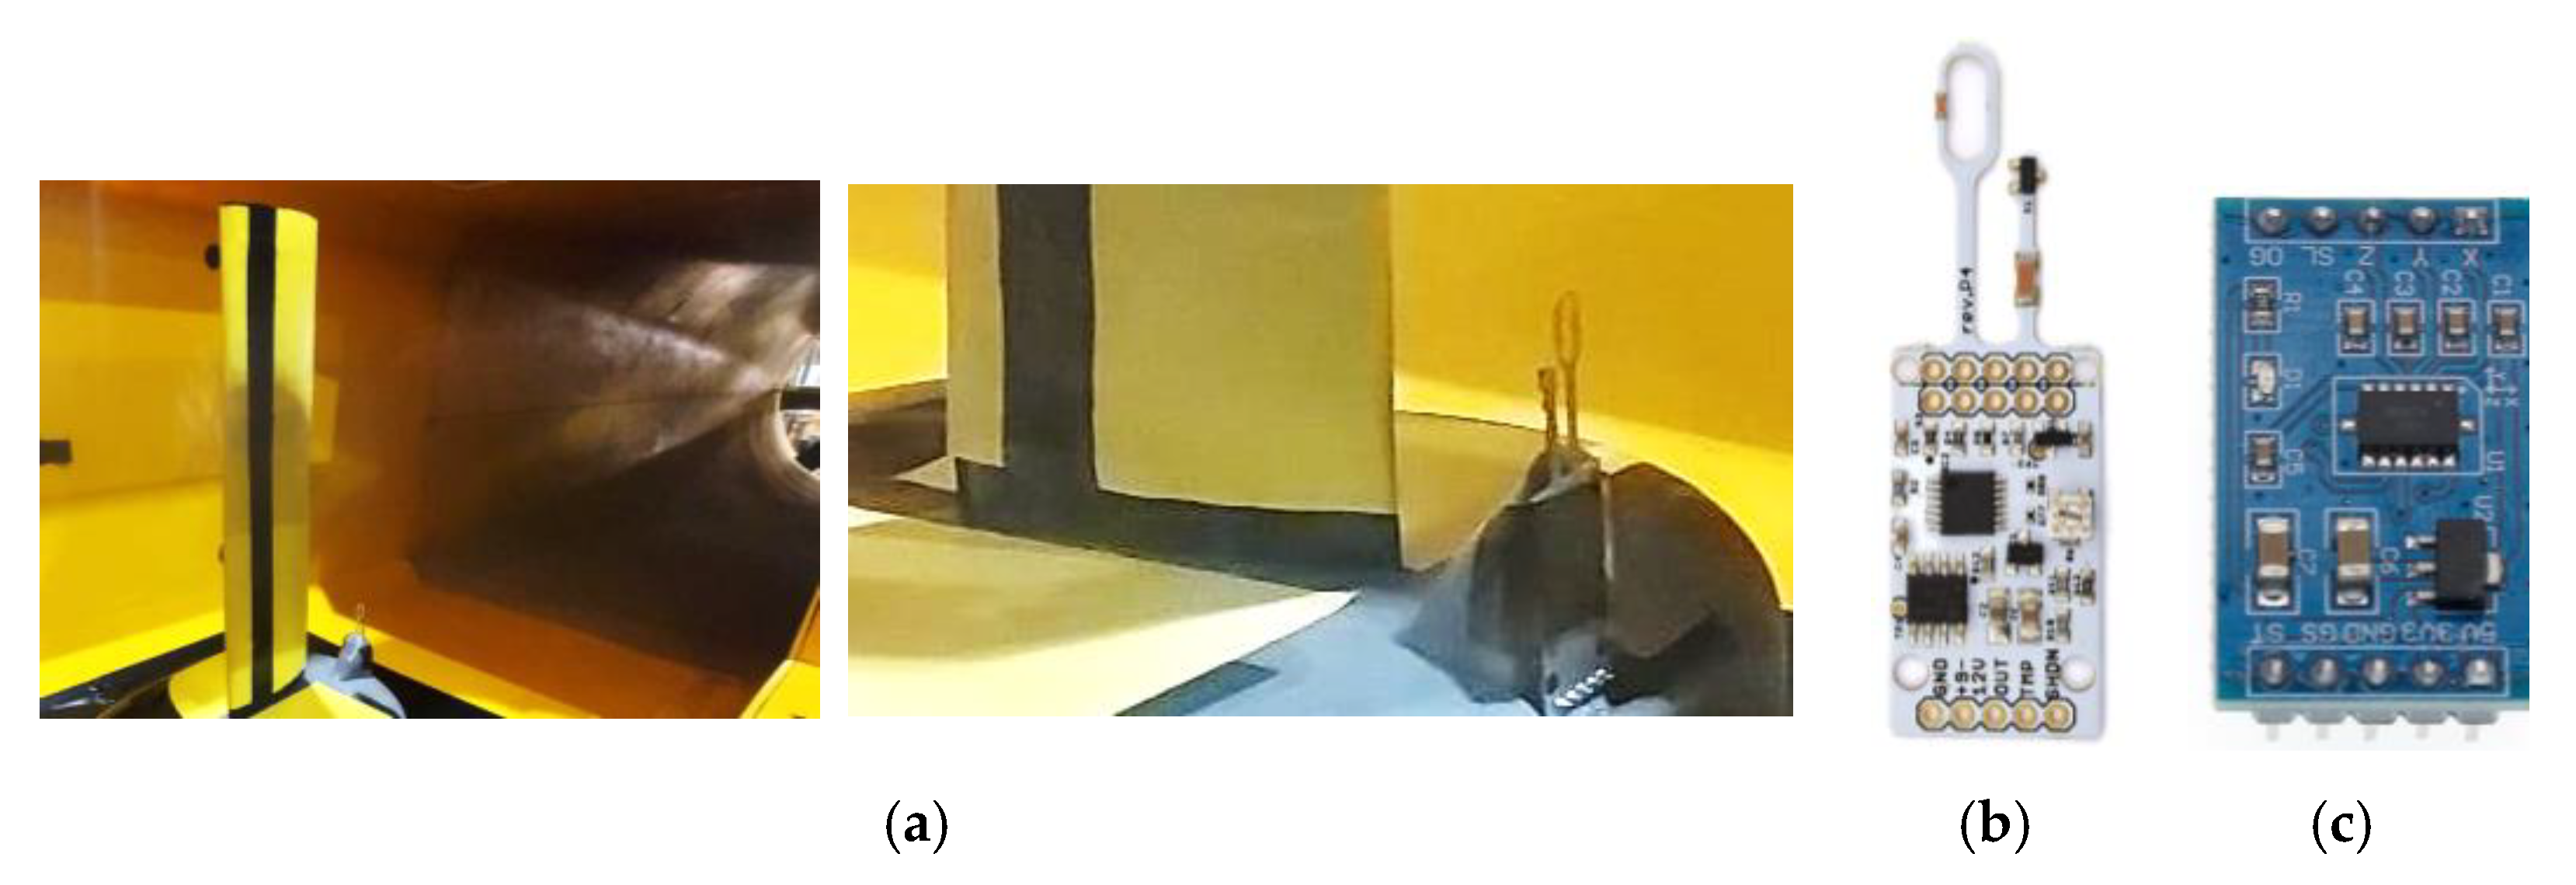
The prototype was placed in a subsonic wind tunnel of the School of Aeronautical Engineering of Sao Carlos, SP, Brazil, and the operation of the acquisition system and servomechanism for the vortex generators’ lineal array inclination was tested (Figure 16).
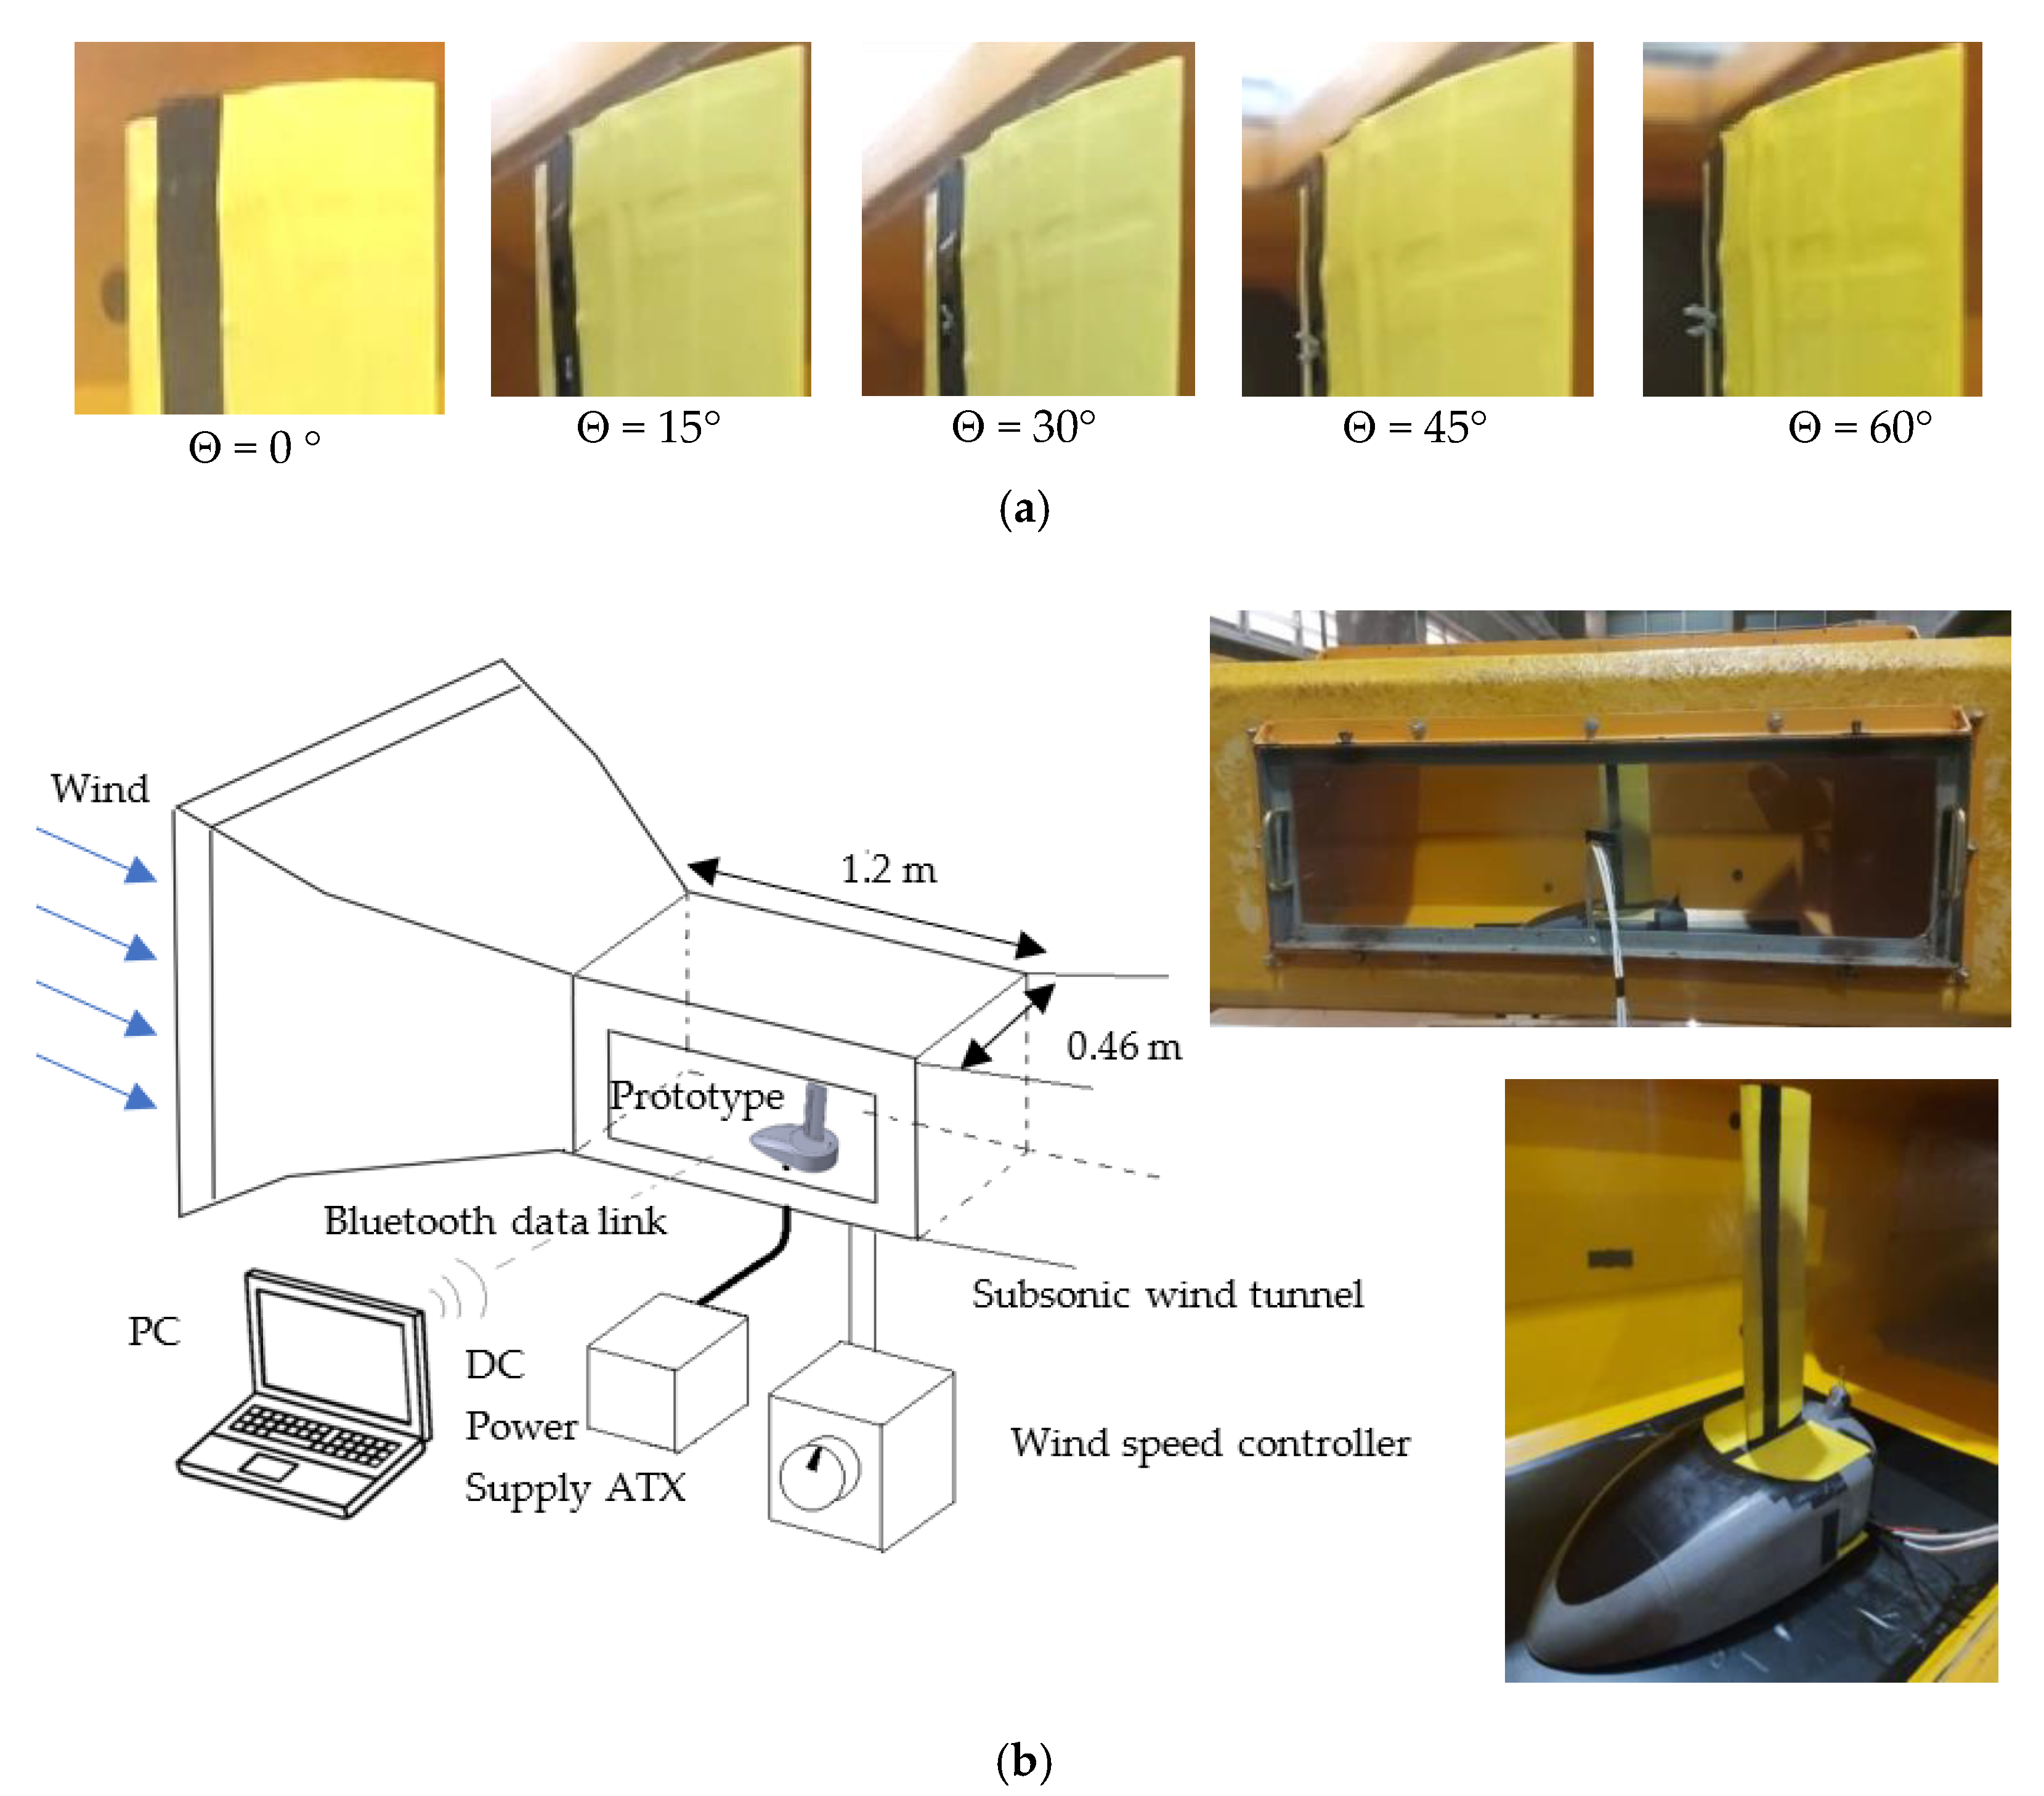
Figure 17 shows the prototype blade section placed in the subsonic wind tunnel when the vortex generators in lineal array were activated at five different tilt angles, theta = 0°, 15°, 30°, 45°, and 60°, to measure the differences when varying this tilt angle. A subsonic wind tunnel is a type of wind tunnel that is designed to simulate airflows at speeds below the speed of sound. These wind tunnels are commonly used in the fields of aerospace and automotive engineering to study the aerodynamic properties of aircrafts and vehicles.
A subsonic wind tunnel typically consists of a long, narrow tube with a fan or compressor at one end to generate a steady flow of air. Models of aircrafts or vehicles are placed inside the tunnel and subjected to different airflow conditions. The properties of the airflow are measured using sensors and instruments placed throughout the tunnel. Subsonic wind tunnels are important tools for engineers because they allow them to study the behavior of airflows in a controlled environment. This information can then be used to design more efficient and effective aircrafts and vehicles.
Figure 17 shows the design of the wind tunnel experiment to compare the CFD simulations of the 3D blade. The blade prototype has a circuit and sensors that communicate wirelessly, and due to the power characteristics of the hot-wire sensor, or Rev-p sensor, it was necessary to use a DC ATX source with +12VDC, +5VDC.
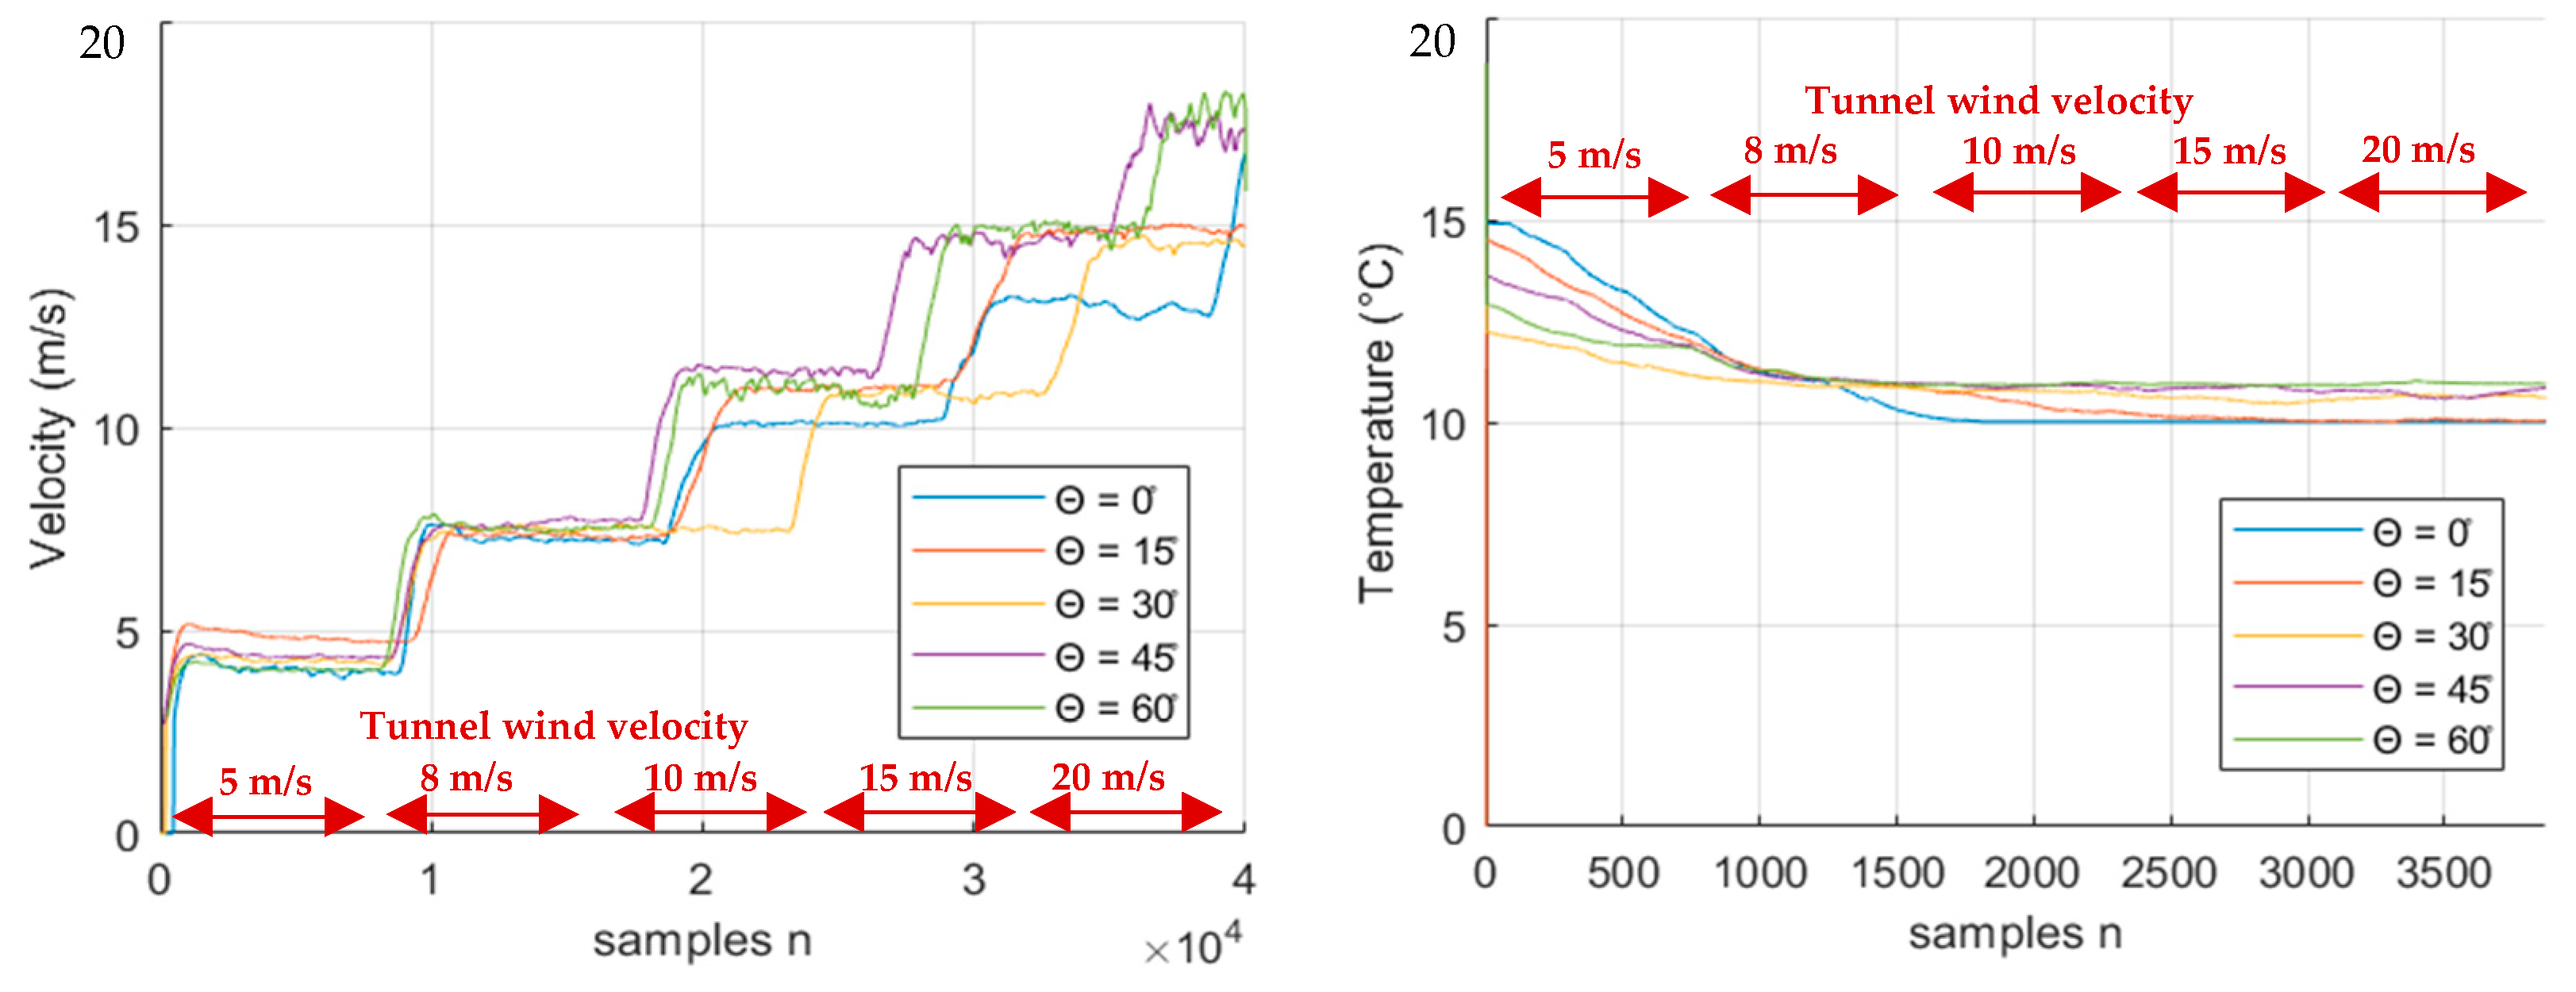
Figure 18 shows the wind velocity measurement captured by the digital hot-wire sensor. The wind velocity changes were observed after the blade section and the VGs interacted. Each color indicates the tilt angle of the VG linear array. The temperature, as a function of the samples with a sampling time ts = 0.005 s, was measured by the hot-wire sensor, having temperature fluctuations between 10 °C and 11 °C between measurements. The digital hot-wire sensor was implemented with a digital 3D accelerometer with the purpose of analyzing the vibration of the structure by means of the accelerations of the blade.
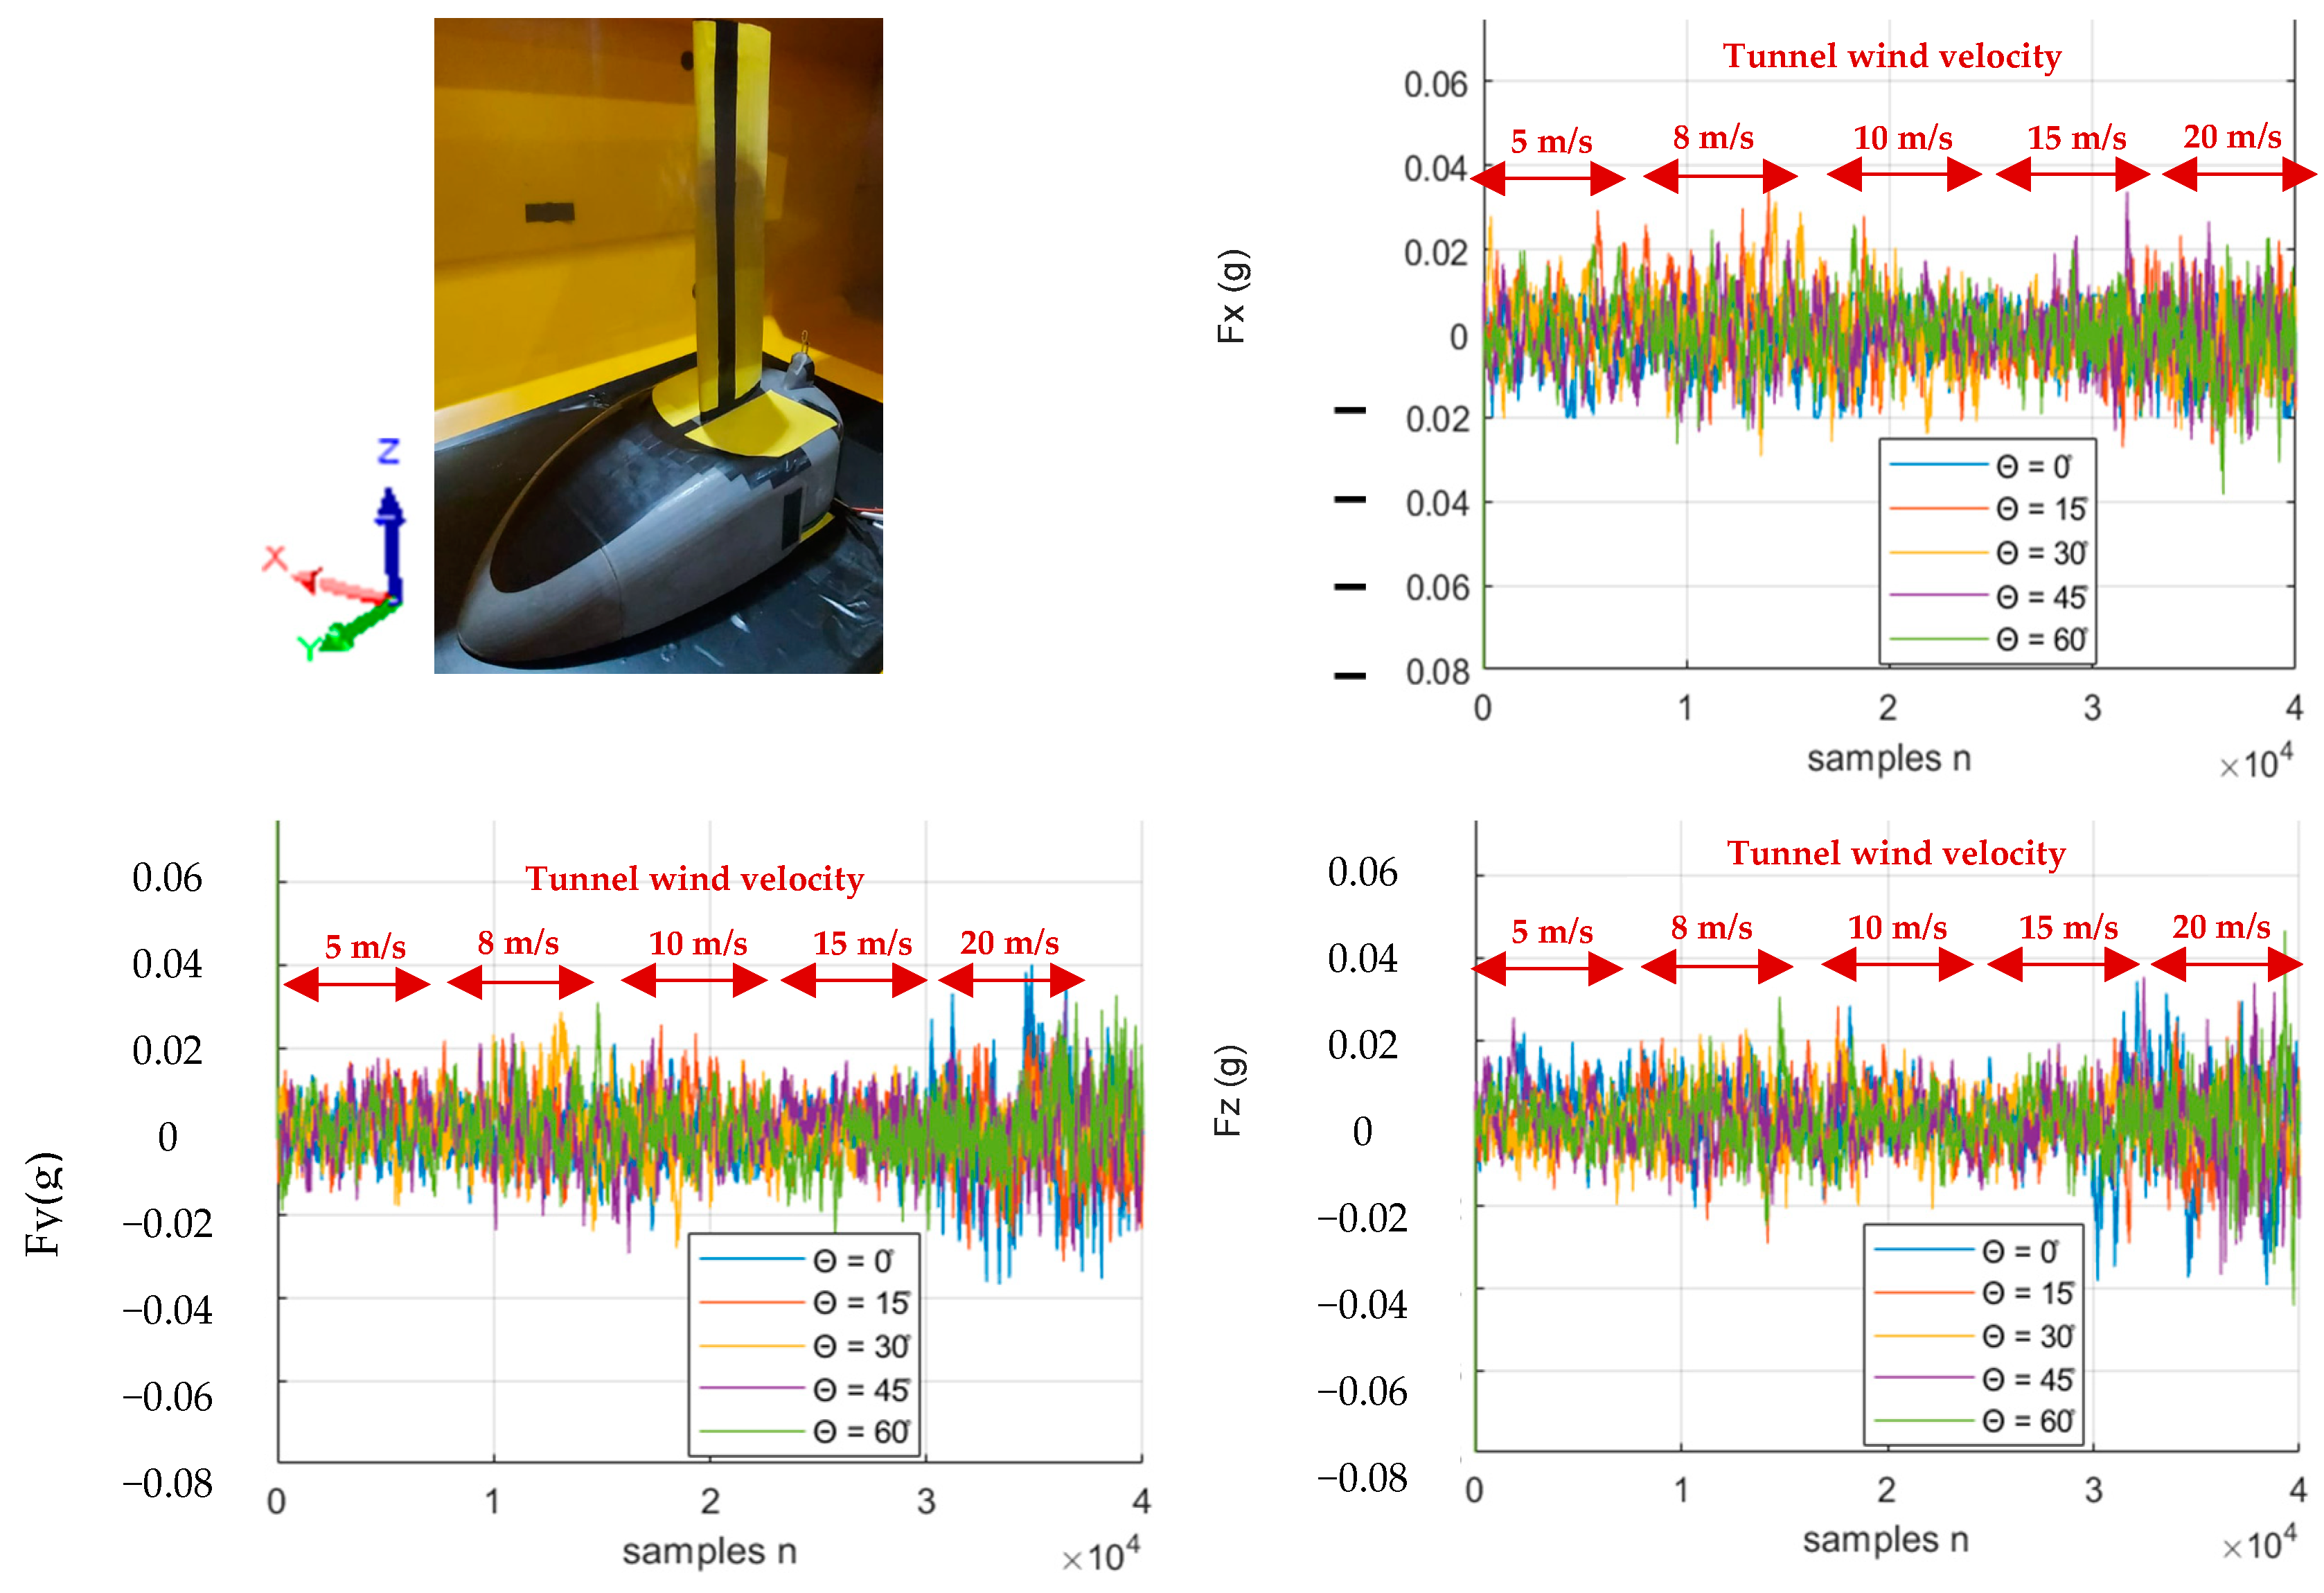
Figure 19 shows the measured vibrations without their mean value. The elimination of the mean value facilitates the appreciation of the differences between the signals. The accelerations are measured in units of gravities g. The accelerometer is located at the base of the blade structure. In the y-direction, increases in vibration amplitudes were observed in association with the increase in tunnel wind velocity. The highest amplitudes occurred for angle theta = 0° (blue curve). The measured vibrations without their mean value on the Z-axis as well as on the Y-axis show that the amplitudes of the accelerations of the prototype structure increase with the tunnel wind velocity.
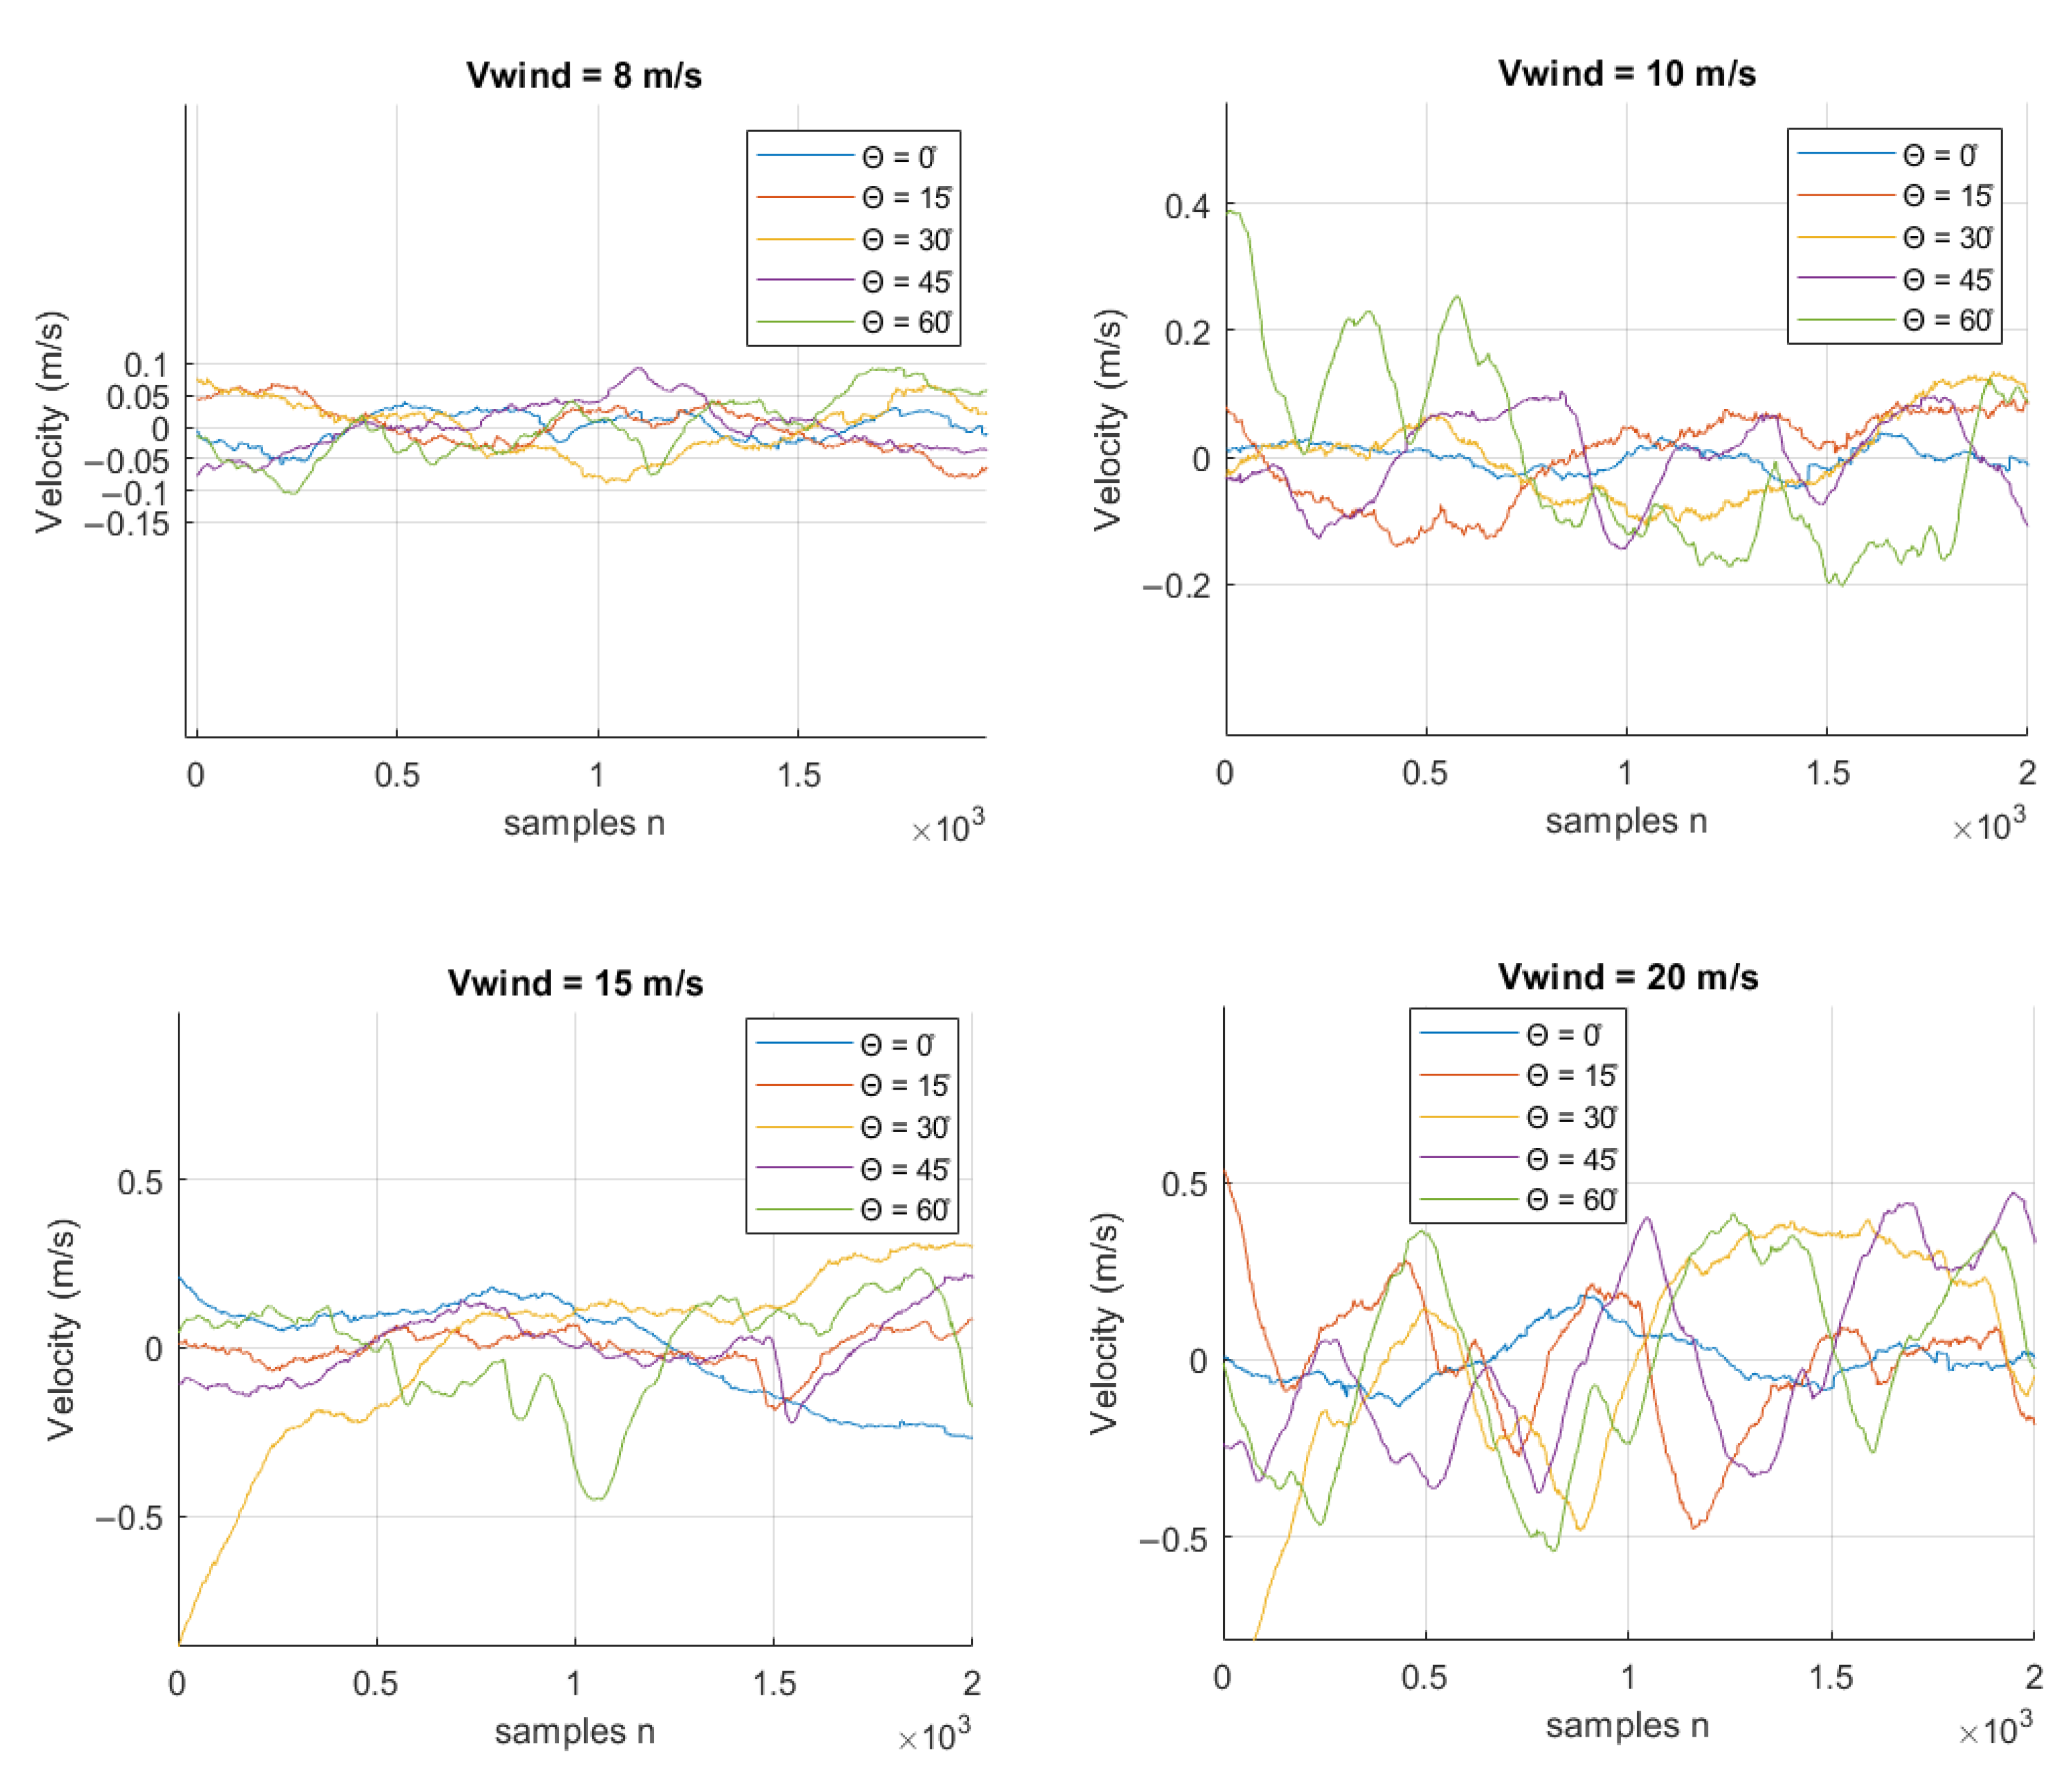
Figure 20 shows the segments of the measured signals to analyze the wind fluctuations measured by the digital hot-wire sensor. This is done with the purpose of comparing the results of the wind fluctuations when changing the angle of inclination of the vortex generators. The sensor is located behind the trailing edge at 40 mm so that the measurements can be associated to the behavior of the wake generated by the blade with active vortex generators.
For the section of the first 2000 samples in Figure 20 or tunnel wind velocity of 5 m/s, a constant behavior of the wake wind velocity measured against changes in the tilt angle of the vortex generators is observed. The wind velocities measured by the sensor are close and constant. The signal section between samples 2000 and 4000 shows the measured results of the wake wind velocity when the tunnel was set to a velocity of Vwind = 8 m/s. In the figure, the wind fluctuations are smooth with respect to the average value for all theta tilt angles or tilt angles of the vortex generator array. For a wind velocity of 10 m/s, a larger separation between velocity measurements of the digital hot-wire anemometer is seen, with the blue signal or the one associated with zero degrees of tilt having the lowest velocity value, indicating that the linear arrangement of the vortex generators generates velocity increases in some areas of the wind wake.
For a tunnel wind velocity of Vwind = 15 m/s, it is possible to observe a larger separation between wind velocity values measured in the vortex wake with vortex generators and without vortex generators (Figure 13). Figure 20 with tunnel wind Vwind = 15 m/s shows greater separation between the wake wind velocity curves measured with and without vortex generators. To compare the results of the previous wake velocity graphs in Figure 20, we decided to calculate the RMS value of the signals and use a bar chart to facilitate their comparison, as shown in Figure 21a.
Figure 21 shows a comparison of the measured RMS values (red box) and the simulated wind velocity values at the hot-wire sensor location using contour planes (red circles). The values for the different tilt angles of the vortex or theta generators show similarities to the simulated values, mainly for angles Θ = 45° and Θ = 60°. The average values are then subtracted from the measured wind signals to better observe the differences between fluctuations associated with the addition of vortex generators in a linear array and their variation by tilt angle (Figure 22).
Segments marked with red arrows indicate the configured tunnel wind velocities. By means of a script, the average value of each wake wind velocity signal obtained with the digital anemometer was subtracted. This mathematical operation shows differences between the velocity fluctuations more clearly, and thus, it is easier to compare the wake behavior at different fixed angles of inclination of the vortex generator array for the tunnel wind velocity of Vwind = 5 m/s (Figure 22). Figure 22 shows the wind velocity measured without the mean value at a tunnel velocity of 8 m/s. For each color or angle of inclination, signals conformed by sinusoids of different frequencies with higher amplitude values are observed. For measurements at Vwind = 5 m/s, Figure 22 shows wind velocity signals measured in the wake with the digital anemometer without the mean value.
This subtraction of the average value allows us to see differences and a considerable increase in the amplitude of the fluctuations at a greater angle of inclination of the vortex generator array on the blade with respect to the signals obtained with Vwind = 8 m/s. At a wind tunnel velocity of 15 m/s, the velocity fluctuations measured by the digital anemometer in the wake are observed with greater amplitude when the vortex generator array is observed at 30° and 60°, shown with yellow and green color signals in Figure 22. At a wind tunnel velocity of 20 m/s, the velocity fluctuations measured by the digital anemometer in the wake are observed with greater amplitude with respect to the previous lower wind tunnel velocity measurements, and a more defined sinusoidal behavior is observed for the two tilt angles theta= 45° and theta = 60°.
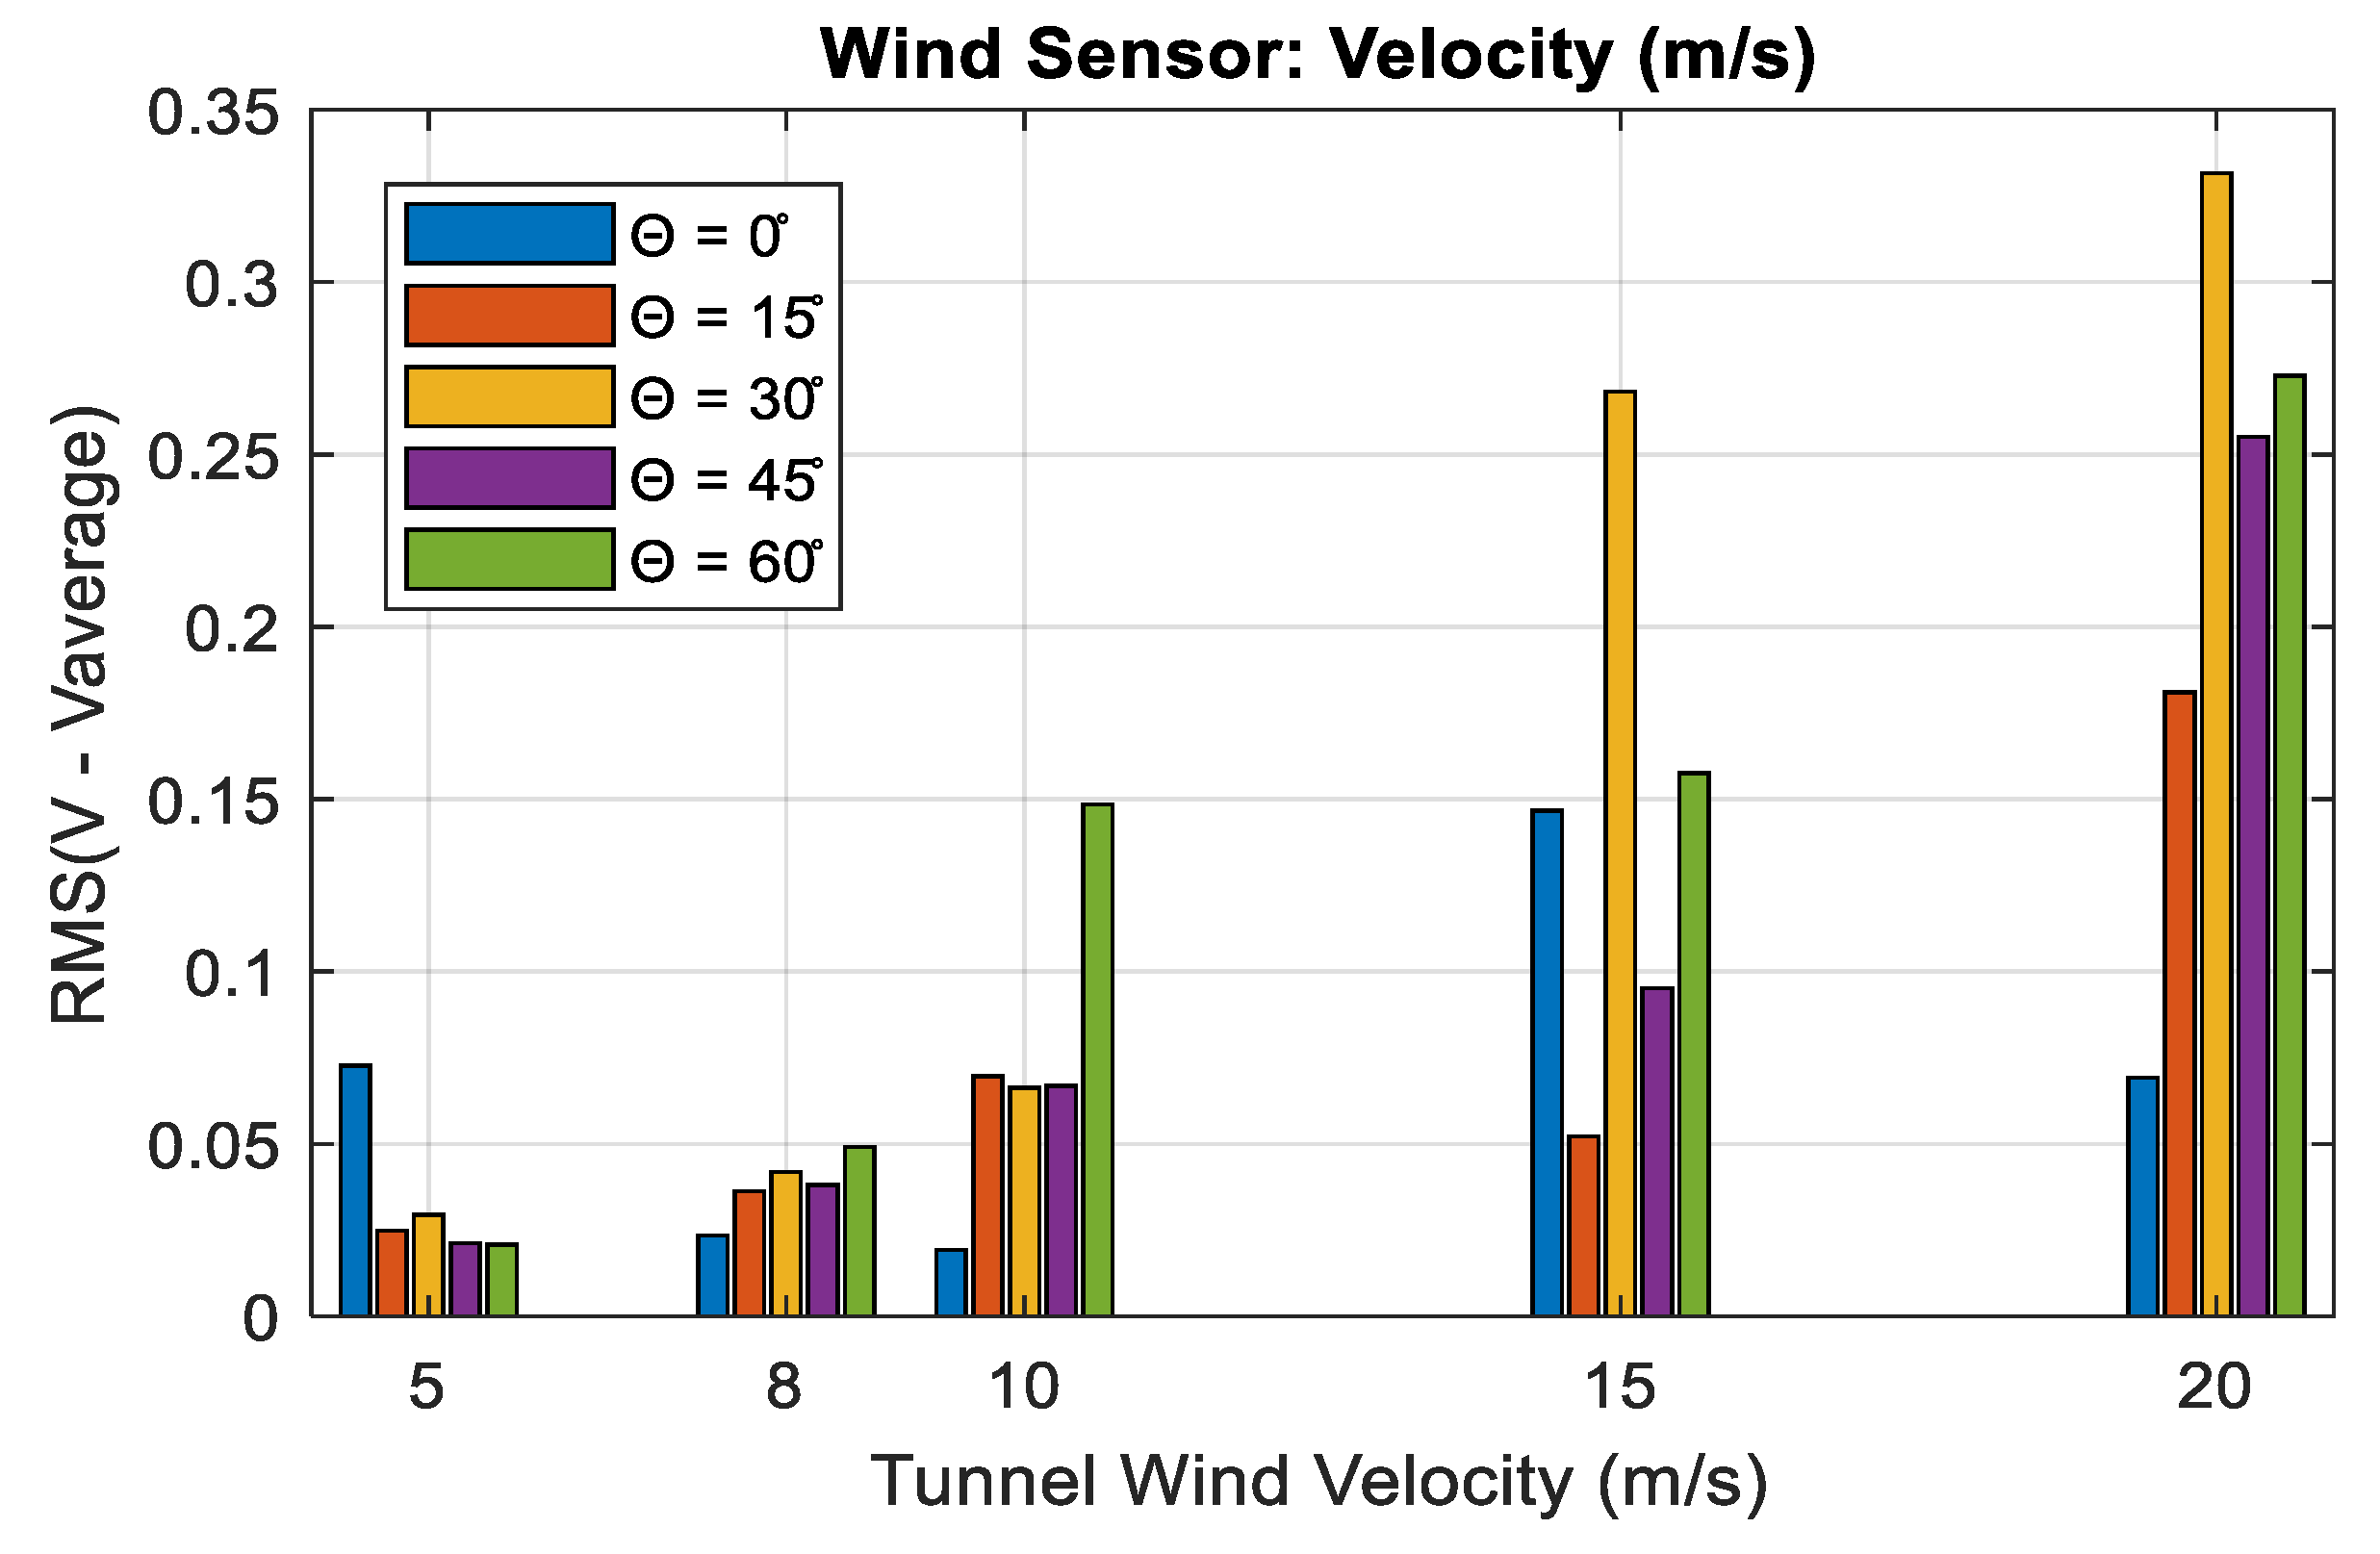
To complement the analysis of the fluctuations of the wind signal associated to the wake behavior and the effect of the generators at different inclination angles, the RMS values were calculated for the measured signals without mean value and organized in a bar chart for comparison. Figure 23 shows that the behavior of RMS values is random at velocities of 5 m/s and 8 m/s, while for values of 10 m/s, 15 m/s, and 20 m/s, an increasing behavior in the RMS values is observed. Due to the differences between the measured signals and their oscillatory behavior in the time domain, it was decided to perform a short frequency analysis of the measured wind signals to find differences between the signals that allow to establish the characteristics of the effect of vortex generators at different tilt angles and more knowledge about the behavior of the wake generated by the vortex blade with active vortex generators (Figure 23).
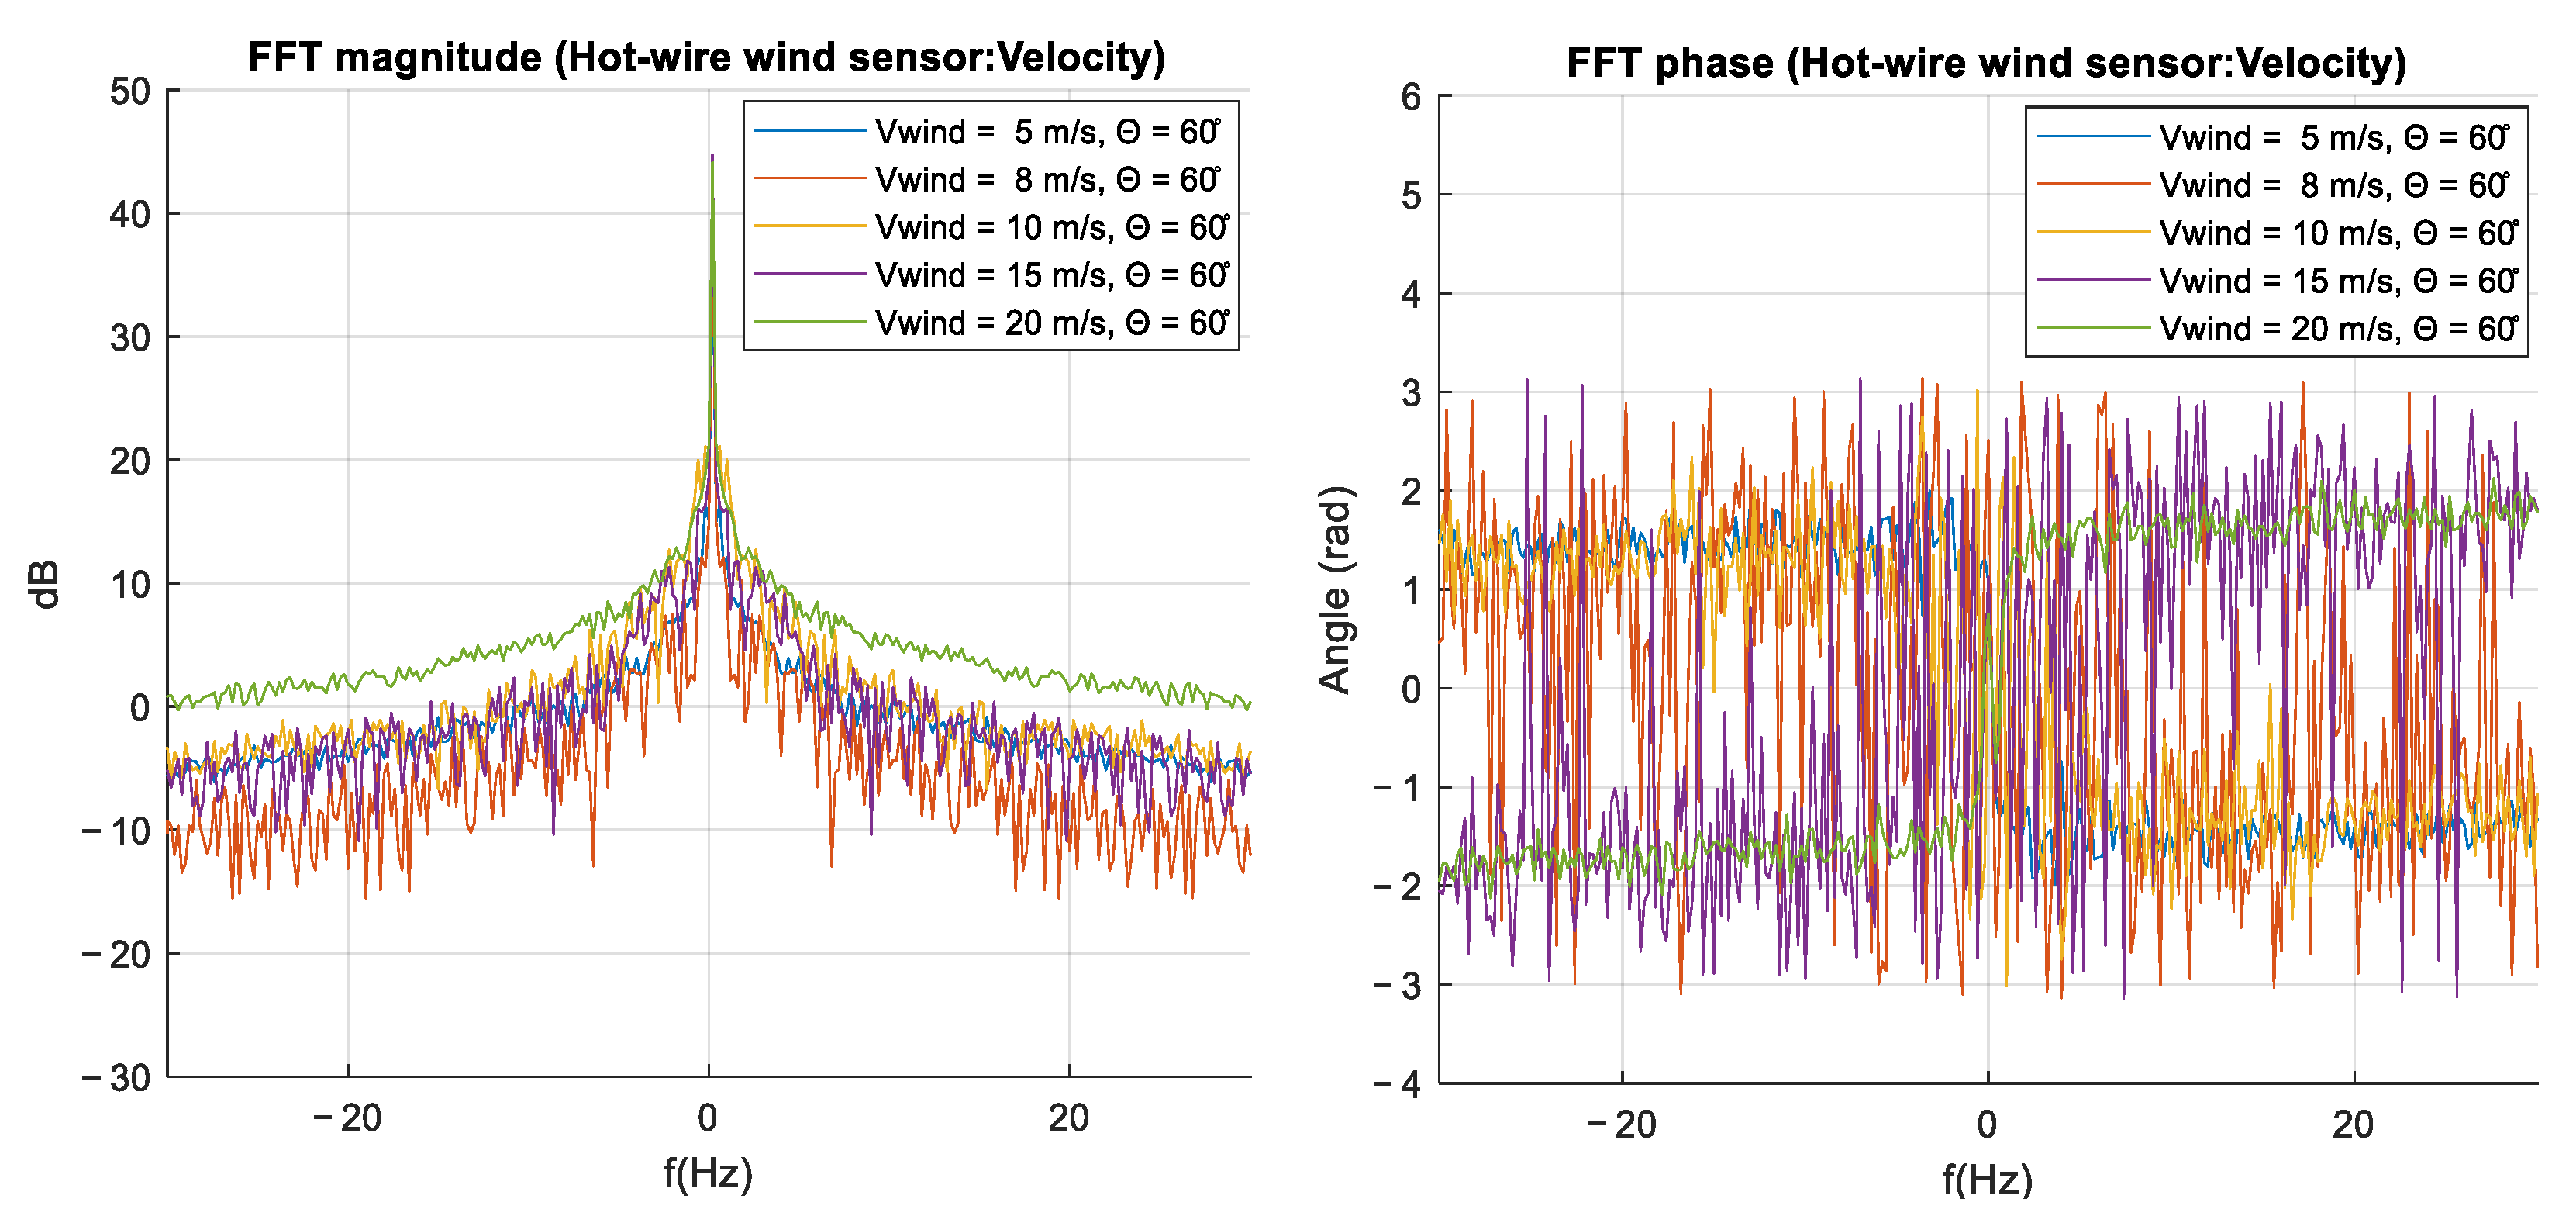
The analysis tool FFT, or fast Fourier transform, was used to select each of the measured wind signals and calculate the magnitude and phase spectra, these spectra allow comparing values of the spectral components and their phases for all wind velocity curves for an angle of Θ = 0° (Figure 24).
The spectrum in Figure 25 shows the magnitude spectrum associated with the amplitudes of the measured wake velocity signals at changes in wind tunnel velocity or color, with tilt angle theta = 60°. Increases in the values of the spectral components for frequencies greater than 5 Hz are seen as the wind tunnel velocity increases.
The spectrum in Figure 25 shows the phase spectrum associated with the angle or phase of each spectral component at different wind tunnel velocities and angle theta = 60°. The main differences observed in this spectrum indicate higher phase variations for signals measured at 8, 10, and 15 m/s and lower phase variations for tunnel velocities of 5 and 20 m/s.
Finally, the activation of the linear array of vortex generators was configured. The vortex generators had a fixed oscillation frequency fosc = 1 Hz. At the same time, the tunnel wind velocity variation was performed approximately every 40 s, obtaining the following data from the hot-wire digital anemometer sensor (Figure 26).
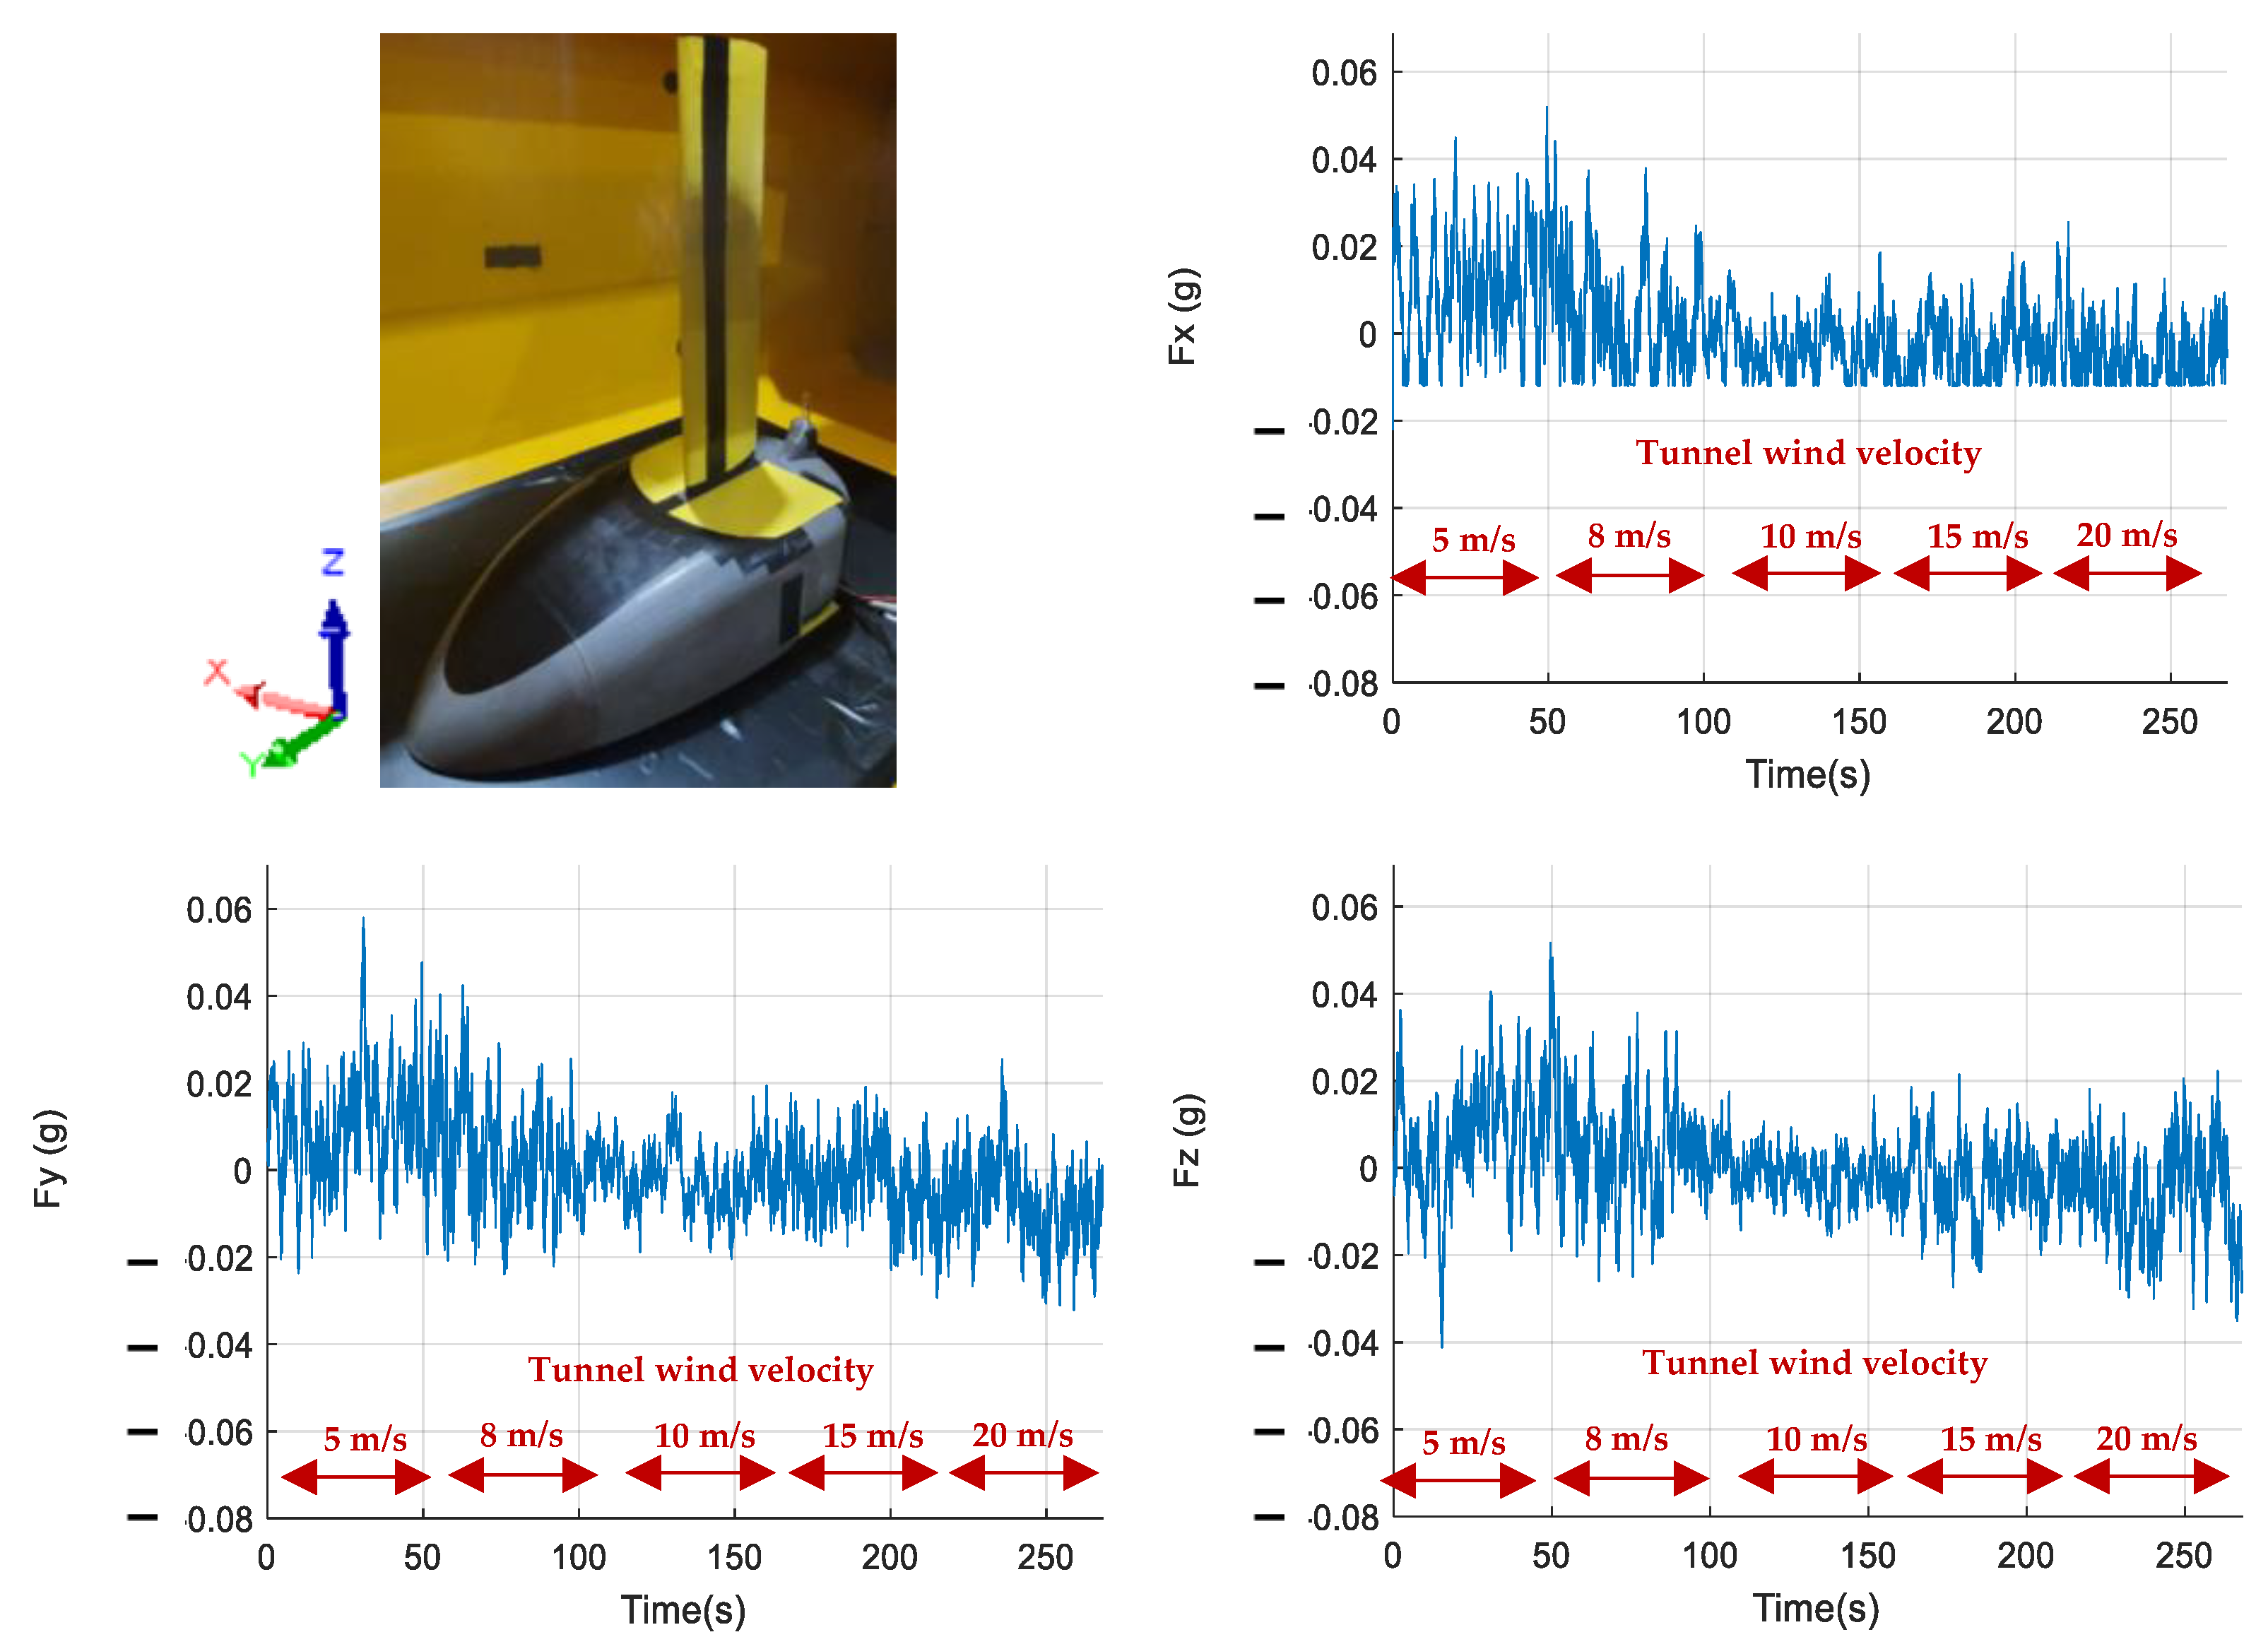
Figure 26 shows the results measured by the wind velocity sensor before the oscillating movements of the vortex generators. Segments marked with red arrows indicate the configured tunnel wind velocities. The changes present a staircase shape where each step indicates the instances of wind tunnel velocity changes. The temperature was measured by the anemometer sensor which, in addition to measuring the wind velocity, also measures the air temperature and the shape of the signal shows a constant behavior during the measurement. Figure 27 shows the acceleration in the direction of the X axis of the prototype. The mean value is subtracted from the acceleration curves, which allows a better comparison of their behavior in the time domain. The acceleration amplitude decreases as the wind velocity increases in the tunnel. For the acceleration in the Y-axis direction of the prototype, the average value of the signal is subtracted from this acceleration, showing a similar reduction in the amplitude of the acceleration as the wind tunnel velocity increases like that seen in the acceleration in the X-axis direction. Like acceleration in the X and Y directions, the acceleration in the Z direction shows a similar amplitude reduction behavior, indicating that the structure reduces its vibration with increasing wind velocity because of the vortex generator array when oscillating.
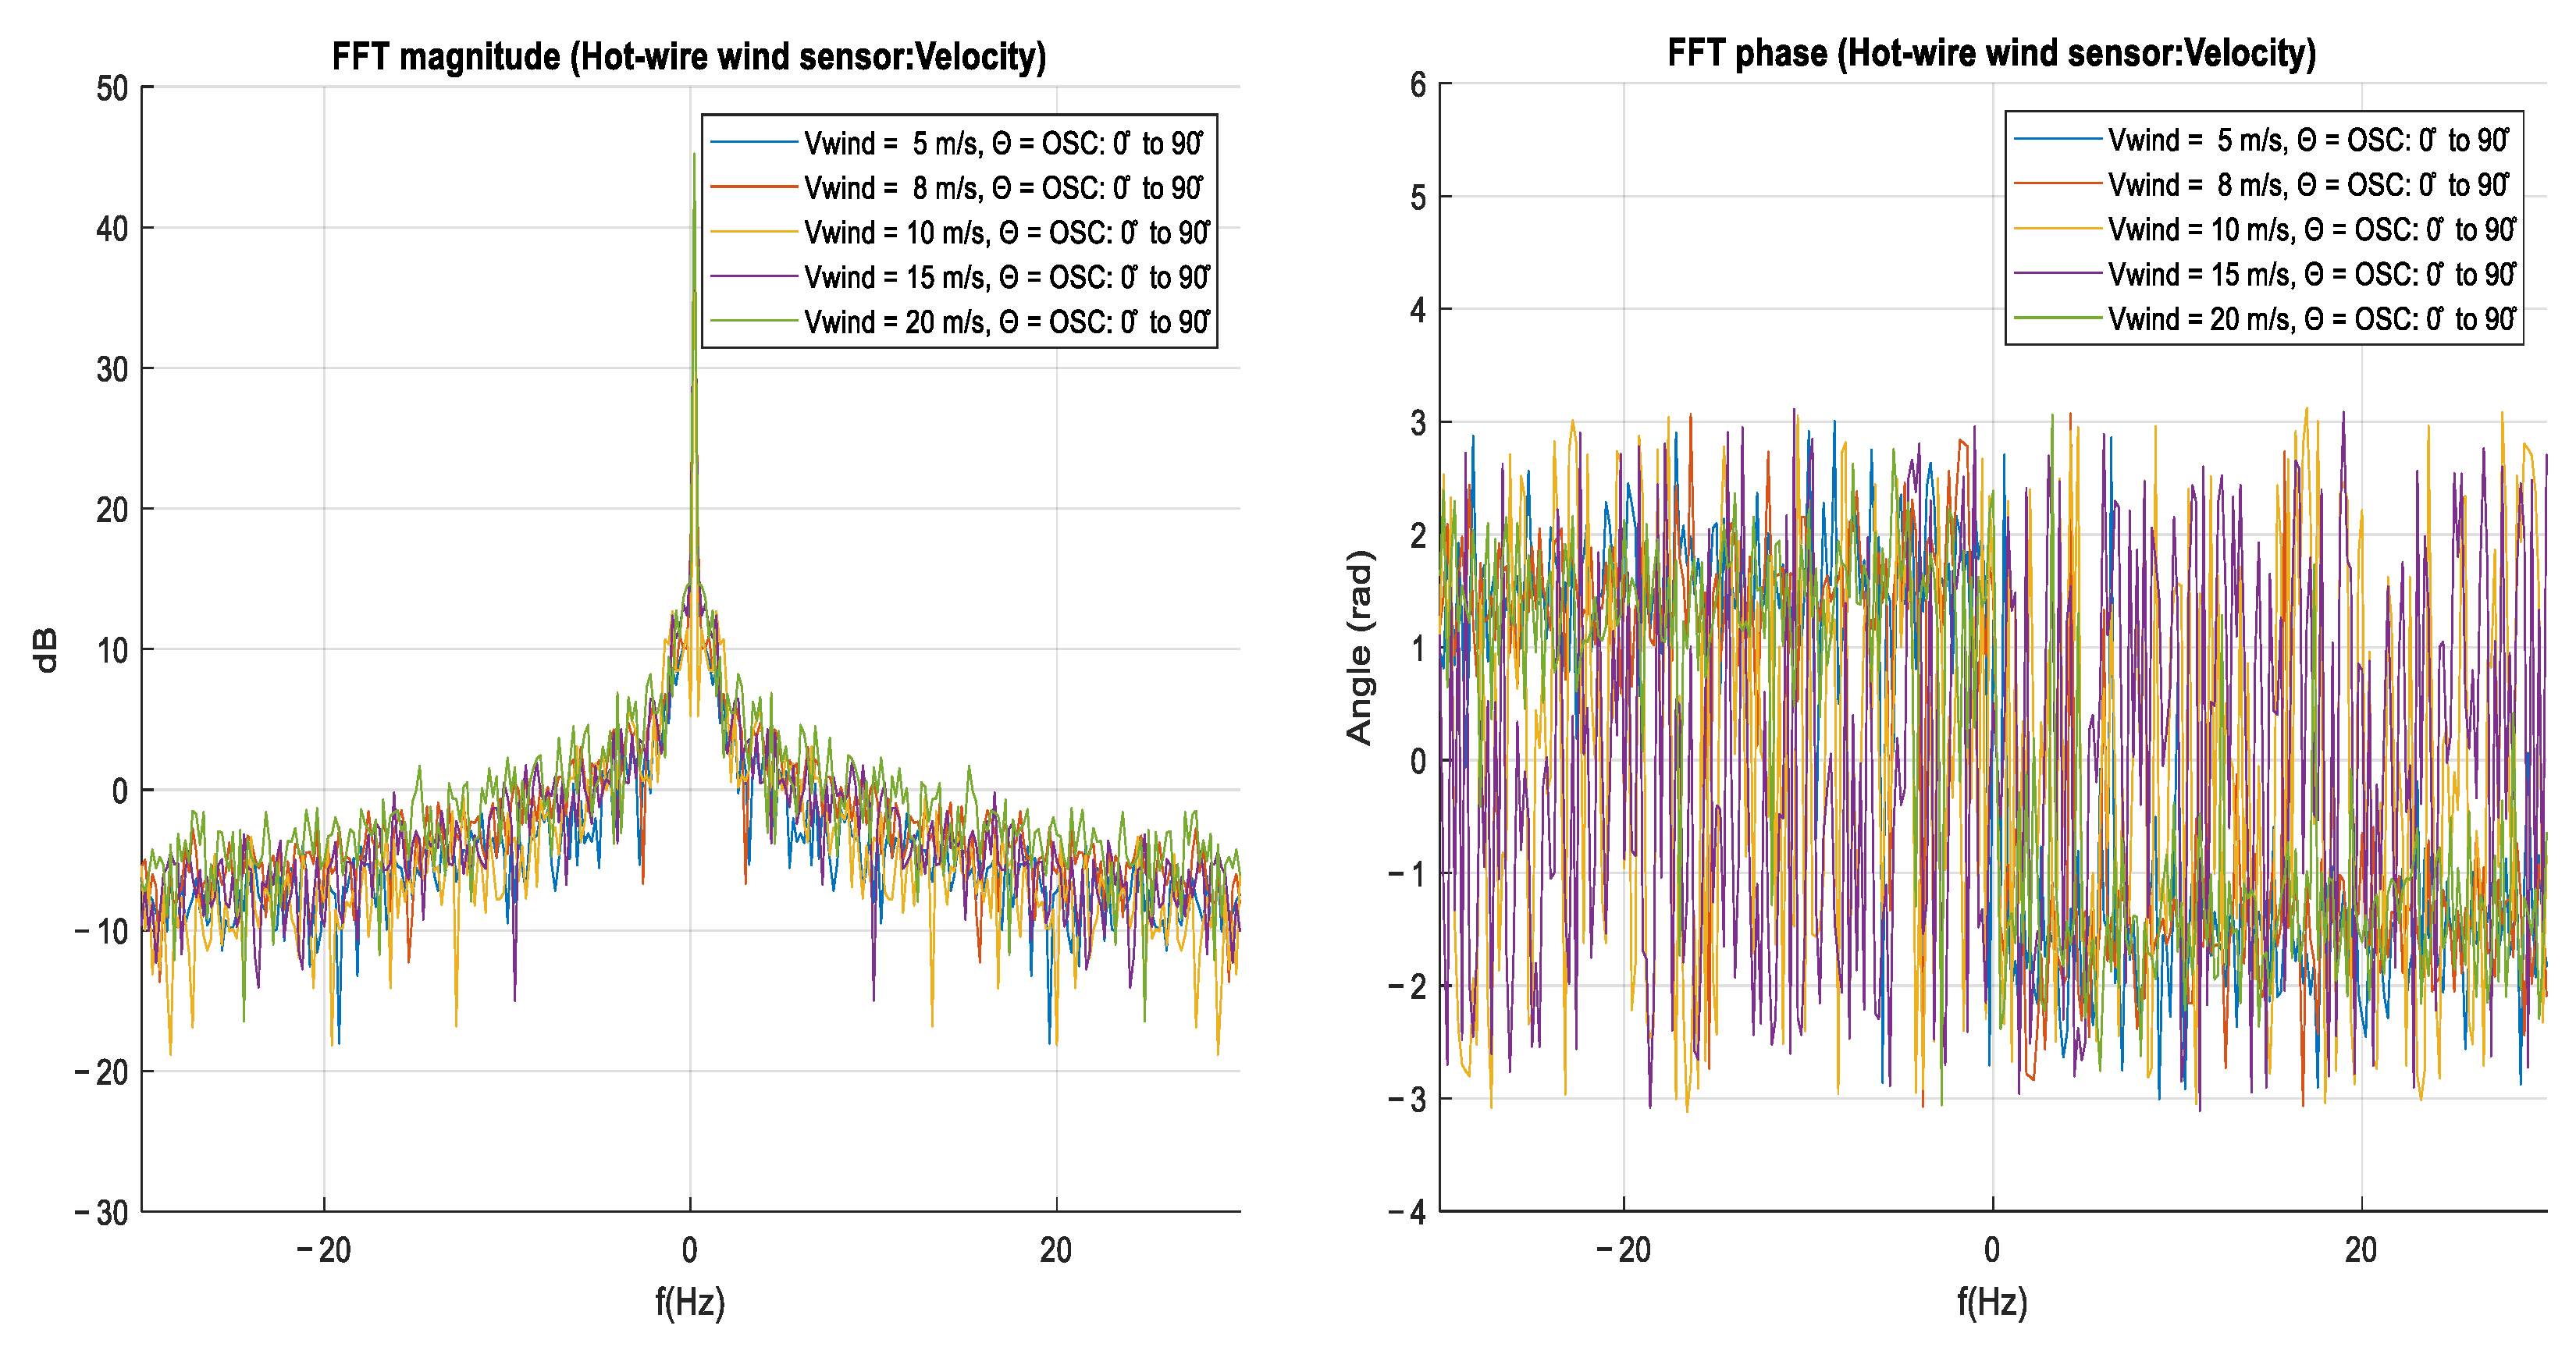
As in the previous measurements and processing, in Figure 20 and Figure 22, the magnitude and phase spectra are taken to identify changes in the spectral components of the wind velocity signal measured with vortex generators oscillating at the fixed frequency fosc = 1 Hz. Figure 28 shows the magnitude spectra with closer and lower attenuation peaks associated with the effect of the oscillation of the linear array of vortex generators. The phase spectrum shows strong variations in all measurements at different tunnel wind velocities, indicating strong angle changes between spectral components caused by mechanical oscillations of the active vortex generators between 0° and 90°.

4. Discussion

The designed prototype shows, by means of 3D CFD simulation, the wind behavior when interacting with the vortex generators bio-inspired by a wind turbine blade, which show the creation of lower velocity vortex wakes with circular cores located between the spaces between vortex generators or VG; the surface pressure increases in the upper surface area from the trailing edge to the VG location, as the VG tilt angle increases. The location of the active vortex generators allows the surface pressure to increase on the top surface in a controlled manner, which in a wind turbine blade can compensate for the bending they experience as they are slender mechanical elements or are made of laminar airfoils.
The overpressure in the blade intradoses generated by the headwind particles allows the rotation of the wind turbines to generate a pressure differential, as low-power wind turbines are smaller in size and have a higher velocity of rotation, their blades tend to be thin and flexible as they are made of elastic materials such as polymers. Blade vibrations can be reduced by vortex generators that compensate for the fluctuating pressures generated by the wind on the blade, these pressure fluctuations are associated with fluctuations in wind velocity that increase in amplitude as wind tunnel speed increases. The oscillation of the linear array of bio-inspired vortex generators showed reduction of the measured vibration peak variation with increasing wind velocity, demonstrating that the analysis of oscillation frequency variations can contribute to the future design of active and smart bio-inspired vortex generators.

5. Conclusions

In this work, it was possible to analyze in a wind tunnel a fixed chord blade with an S822 profile and a linear set of active and bio vortex generators inspired by the stabilizer feathers of the peregrine falcon. The vibration results measured on the blade with a 3D accelerometer showed a reduction of vibration peaks at a wind velocity of 15 m/s for different fixed pitch or fixed theta angles of the vortex generators. The wake wind velocities measured by digital hot-wire anemometer showed larger fluctuations at higher tunnel wind velocities. FFT spectral analysis of the wake wind velocities measured in the wake showed not very visible differences between the magnitude spectra for the fixed tilt angles of theta = 0 and 60. When activating the vortex generators designed with constant oscillation or oscillating theta at 1 Hz, a reduction of the vibration in the blade was observed at wind velocities of 15 and 20 m/s. A greater number of low peaks or components of the magnitude spectrum closer to −20 dB were also observed.

Author Contributions

Conceptualization, H.D.C.; Investigation, H.G.P. and E.E.G.; Supervision, W.G. All authors have read and agreed to the published version of the manuscript.

Funding

This research received no external funding.

Data Availability Statement

Simulation video: https://www.youtube.com/watch?v=MzyU2OLCUQE (accessed on 30 December 2022).

Conflicts of Interest

The authors declare no conflict of interest.

References

  1. Araújo, A.M.; Melo, G.M.; De Medeiros, A.L.R.; Dos Santos, M.J. Simulation of the production of electricity with small size aerogenerators. Inf. Tecnol. 2009, 20, 37–44. [Google Scholar]
  2. Reina, G.; Mauledoux, M.; Avilés, O.A. Simulation of a microgrid for a non-interconnected zone that integrates renewable energies. Int. J. Electr. Comput. Eng. 2021, 11, 201–216. [Google Scholar] [CrossRef]
  3. Dangeama, S. An Electric Generator Driven by a Roof Ventilator. Energy Procedia 2011, 9, 147–158. [Google Scholar] [CrossRef] [Green Version]
  4. Bodling, A.; Sharma, A. Numerical investigation of noise reduction mechanisms in a bio-inspired airfoil. J. Sound Vib. 2019, 453, 314–327. [Google Scholar] [CrossRef]
  5. Deshmukh, S.; Bhattacharya, S.; Jain, A.; Paul, A.R. Wind turbine noise and its mitigation techniques: A review. Energy Procedia 2019, 160, 633–640. [Google Scholar] [CrossRef]
  6. Herrera, C.; Correa, M.; Villada, V.; Vanegas, J.D.; García, J.G.; Nieto-Londoño, C.; Sierra-Pérez, J. Structural design and manufacturing process of a low scale bio-inspired wind turbine blades. Compos. Struct. 2019, 208, 1–12. [Google Scholar] [CrossRef]
  7. Viswanathan, H. Aerodynamic performance of several passive vortex generator configurations on an Ahmed body subjected to yaw angles. J. Braz. Soc. Mech. Sci. Eng. 2021, 43, 131. [Google Scholar] [CrossRef]
  8. Parra, H. Evaluación Aerodinámica Mediante CFD de Dispositivos en Punta de Aspa para Turbina Eólica. 2018. Available online: https://www.researchgate.net/publication/330409106_Aerodynamic_evaluation_with_CFD_of_tip_devices_in_blade_for_wind_turbin (accessed on 30 December 2022).
  9. Hector Guillermo, P.P.; Victor Daniel, A.M.; Elvis Eduardo, G.G. CFD Analysis of two and four blades for multirotor Unmanned Aerial Vehicle. In Proceedings of the 2018 IEEE 2nd Colombian Conference on Robotics and Automation (CCRA), Barranquilla, Colombia, 1–3 November 2018; pp. 1–6. [Google Scholar] [CrossRef]
  10. Parra, H.G.; Morales, V.D.A.; Garcia, E.E.G. Multiphase CFD Simulation of Photogrammetry 3D Model for UAV Crop Spraying. Adv. Intell. Syst. Comput. 2019, 930, 812–822. [Google Scholar] [CrossRef]
  11. Gaitan-Aroca, J.; Sierra, F.; Contreras, J.U.C. Bio-inspired rotor design characterization of a horizontal axis wind turbine. Energies 2020, 13, 3515. [Google Scholar] [CrossRef]
  12. Hassanalian, M.; Throneberry, G.; Abdelkefi, A. Wing shape and dynamic twist design of bio-inspired nano air vehicles for forward flight purposes. Aerosp. Sci. Technol. 2017, 68, 518–529. [Google Scholar] [CrossRef]
  13. Aldabash, N.; Wandel, A.; Darwish, A.S.; Epaarachchi, J. Numerical and experimental investigation of the flow separation over NREL’s S822 aerofoil and its control by suction and blowing. Renew. Energy Environ. Sustain. 2021, 6, 5. [Google Scholar] [CrossRef]
  14. Akbari, V.; Naghashzadegan, M.; Kouhikamali, R.; Afsharpanah, F.; Yaïci, W. Multi-Objective Optimization and Optimal Airfoil Blade Selection for a Small Horizontal-Axis Wind Turbine (HAWT) for Application in Regions with Various Wind Potential. Machines 2022, 10, 687. [Google Scholar] [CrossRef]
  15. Mamouri, A.R.; Khoshnevis, A.B.; Lakzian, E. Entropy generation analysis of S825, S822, and SD7062 offshore wind turbine airfoil geometries. Ocean Eng. 2019, 173, 700–715. [Google Scholar] [CrossRef]
  16. Gowree, E.R.; Jagadeesh, C.; Talboys, E.; Lagemann, C.; Brücker, C. peregrine falcons. Commun. Biol. 2018, 1, 27. [Google Scholar] [CrossRef] [PubMed] [Green Version]
  17. Ponitz, B.; Schmitz, A.; Fischer, D.; Bleckmann, H.; Bru, C. Diving-Flight Aerodynamics of a Peregrine Falcon (Falco peregrinus). PLoS ONE 2014, 9, e86506. [Google Scholar] [CrossRef] [Green Version]
  18. Ponitz, B.; Triep, M.; Brücker, C. Aerodynamics of the Cupped Wings during Peregrine Falcon’ s Diving Flight. Open J. Fluid Dyn. 2014, 4, 363–372. [Google Scholar] [CrossRef] [Green Version]
  19. Dvorak, P. Conformal Vortex Generator and Elastomer Tab Let NREL Test Turbine Produce 22% More Power. 2017. Available online: https://www.windpowerengineering.com/conformal-vortex-generator-elastomer-tab-let-nrel-test-turbine-produce-22-power/ (accessed on 17 November 2020).
  20. Cerón-M, H.; Catalano, F.; Filho, A.C. Experimental Study of the Influence of Vortex Generators on Airfoils for Wind Turbines. In Proceedings of the VI Congreso Internacional de Ingenieria Mecanica y IV de Ingenieria Mecatronica IV Congreso Internacional de Materiales, Energia y Medio Ambiente, Bogotá, Colombia, 2–5 May 2013. [Google Scholar]
  21. Tangier, J.L.; Somers, D.M. NREL Airfoi Families for HAWT’s; National Renewable Energy Lab.: Golden, CO, USA, 1995. [Google Scholar]
  22. Flujo Turbulento-Atreydes Ingeniería-Sevilla. Available online: https://atreydes.com/y-turbulence (accessed on 30 December 2022).
  23. Stevenson, T.N. Fluid Mechanics. Nature 1980, 283, 908. [Google Scholar] [CrossRef] [Green Version]
  24. Colonius, T.; Rowley, C.W.; Tadmor, G.; Williams, D.R.; Taira, K.; Dickson, W.B.; Gharib, M.; Dickinson, M. Closed-loop control of leading-edge and tip vortices for small UAV. In Proceedings of the Conference on Active Flow Control, DFG, Berlin, Germany, 27–29 September 2006; Available online: http://wiki.biotech.rpi.edu/pub/Main/ActiveFlowControlGroup/Closed-loop_control_of_leading-edge_and_tip_vortices_for_small_UAV.pdf (accessed on 30 December 2022).
  25. Chawla, J.S.; Suryanarayanan, S.; Puranik, B.; Sheridan, J.; Falzon, B.G. Efficiency improvement study for small wind turbines through flow control. Sustain. Energy Technol. Assess. 2014, 7, 195–208. [Google Scholar] [CrossRef]
Figure 1. Methodology.
Energies 16 04538 g001
Figure 2. HAWT turbines CFD simulation.
Energies 16 04538 g002
Figure 3. (a) Peregrine falcon, (b) biological samples, (c) scan process, (d) CAD model.
Energies 16 04538 g003
Figure 4. (a) Peregrine falcon, (b) bio-inspired vortex generator, (c) blade with S822 airfoil.
Energies 16 04538 g004
Figure 5. Boundary layer on a plane.
Energies 16 04538 g005
Figure 6. (a) Blade S822, (b) S822 + VGs, (c) rotative domain mesh, (d) static domain mesh.
Energies 16 04538 g006
Figure 7. Simulated CL curves.
Energies 16 04538 g007
Figure 8. (a) Polyline on blade with airfoil S822, (b) polyline on blade with airfoil S822, (c) blade with airfoil S822, α = 0, (d) blade with airfoil S822 + VGs, α = 0.
Energies 16 04538 g008
Figure 9. Contours planes simulated: (a) Velocity, (b) Pressure, (c) TKE, (d) Surface pressure.
Energies 16 04538 g009
Figure 10. (a) Rotative domain, (b) static domain.
Energies 16 04538 g010
Figure 11. (a) Velocity Contour Isometric view, (b) Velocity Contour lateral view.
Energies 16 04538 g011
Figure 12. Pressure: (a) Blade with S822 and Θ = 60°, (b) blade with S822 and Θ = 15°.
Energies 16 04538 g012
Figure 13. (a) Velocity lines: Blade, S822, Θ = 60°, (b) blade, S822, Θ = 15°.
Energies 16 04538 g013
Figure 14. CFD simulation for rotating VGs, Velocity contours: (a) Θ = 0°, (b) Θ = 15°, (c) Θ = 60°.
Energies 16 04538 g014
Figure 15. Blade prototype with S822 and housing measuring circuit.
Energies 16 04538 g015
Figure 16. (a) Prototype in wind tunnel, (b) Anemometer Rev-p, (c) Accelerometer MMA7361.
Energies 16 04538 g016
Figure 17. (a) Angles of inclination Θ, (b) wind tunnel and blade prototype.
Energies 16 04538 g017
Figure 18. Wind velocity and wind temperature measured with Rev-p sensor.
Energies 16 04538 g018
Figure 19. Acceleration in 3D direction without average value.
Energies 16 04538 g019
Figure 20. Wind velocity values measured with Rev-p sensor and segmented.
Energies 16 04538 g020aEnergies 16 04538 g020b
Figure 21. (a) RMS of wind velocity measured, (b) V: velocity contours simulated (sensor zone).
Energies 16 04538 g021
Figure 22. Wind velocity measured with Rev-p sensor and segmented without the average value.
Energies 16 04538 g022aEnergies 16 04538 g022b
Figure 23. RMS of wind velocity without average value in bar chart.
Energies 16 04538 g023
Figure 24. Magnitude and phase spectrums for Θ = 0°.
Energies 16 04538 g024
Figure 25. Magnitude and phase spectrums for Θ = 60°.
Energies 16 04538 g025
Figure 26. Wind velocity with digital anemometer for oscillating vortex generators.
Energies 16 04538 g026
Figure 27. Acceleration in the x-axis, y-axis, and z-axis directions without the average value for oscillating vortex generators on the blade with S822 airfoil.
Energies 16 04538 g027
Figure 28. Magnitude and phase spectrums for value for oscillating vortex generators on blade with S822 airfoil and fosc = 1 Hz.
Energies 16 04538 g028
Table 1. Computed grid spacing for a given y + .
V ρ μ L y + Δ s R e x
10 m/s1.28 kg/m31.8 × 10−5 kg/m s0.08 m200.0005 m71111
Table 2. Summary of simulation parameters of the first CFD.
Simulation ParameterValue
Simulation TypeTransient
Turbulence Modelkw-SST
Total Simulation Time5 s
Time Step0.08 s
Loops800
FluidAir at 25 °C
Wind Velocity20 m/s
Pressure1 atm
Turbulence Level5%
Velocity Subdomain Rotation1 rev/s
Disclaimer/Publisher’s Note: The statements, opinions and data contained in all publications are solely those of the individual author(s) and contributor(s) and not of MDPI and/or the editor(s). MDPI and/or the editor(s) disclaim responsibility for any injury to people or property resulting from any ideas, methods, instructions or products referred to in the content.