Article

An Evaluation Method of Comprehensive Performance of Retrofitted CHP District Heating Systems

China Academy of Building Research, Beijing 100013, China
*
Author to whom correspondence should be addressed.
Energies 2023, 16(12), 4539; https://doi.org/10.3390/en16124539
Submission received: 18 April 2023 / Revised: 24 May 2023 / Accepted: 2 June 2023 / Published: 6 June 2023
(This article belongs to the Special Issue Advances in Energy-Efficient Buildings II)

Abstract

:
There is a big wave in China of retrofitting single-purpose coal-fired systems for district heating into heat-oriented combined heat and power (CHP) systems to save energy. Back-pressure steam turbines (BPSTs) and extraction steam turbines (ESTs) are both common in retrofitted systems, but contrastive analyses of their effects on the systems’ operation performance are lacking. Moreover, comprehensive evaluation methods of the retrofitted systems remain unknown. In this paper, exergy, exergoeconomic, and exergoenvironmental analyses were conducted to evaluate the thermodynamic, economic, and environmental performances of two real CHP systems: system A using a BPST and system B using an EST. Additionally, a new multi-criteria evaluation method based on rank correlation analysis was proposed for the retrofitted system. The results show that system A is better than system B in thermodynamic and environmental aspects but poorer in the economic aspect. Overall, the multi-criteria evaluation result indicates that system A has a better comprehensive performance than system B. Therefore, the BPST has a better effect than the EST on the retrofitted CHP system for district heating in this study. The findings could provide a reference point for retrofitting work in the future.

1. Introduction

In cold regions, energy use for space heating is far more than that for cooling due to the large difference between indoor and outdoor temperatures [1,2]. Therefore, how to achieve an energy-efficient heating mode and find an alternative source of fossil fuels have attracted attention [3,4]. Developing countries, especially China, are still consuming ever larger amounts of coal to drive their economic growth [5].
With China already committing to peak carbon dioxide emissions before 2030, the government have released action plans that enable the peaking of emissions. It called for accelerated efforts to better the building energy structures and bolster the development of efficient district heating [6,7]. Considering the dominating position of coal-fired heating plants in North China, most of the conventional plants are being forced to transform themselves into combined heat and power (CHP) systems [8,9].
Exergy analysis has been accepted widely as an appropriate method to evaluate the efficiency and performance of energy conversion systems. Particularly, the exergy analysis of CHP systems has been a hot topic since Maldague [10] studied the exergies of a CHP system. To improve a CHP system’s efficiency, Smith and Few [11] identified the energy losses and found the inefficient parts of the system using the exergy analysis method. With extensive use of it, some indicators were defined, such as the exergy efficiency, exergy output, and exergy loss rate [12].
Coal-fired Rankine cycle CHP systems are one of the future directions of district heating in regions that rely on coal as their major energy resource. In this respect, many studies have been conducted based on the exergy method. Liao, Zhou, and Zhao [13,14] calculated some key indicators of a coal-fired CHP system to assess its performance, and the results showed that the exergy efficiency was 33%. In 2017, in a review of an exergy analysis of traditional coal-fired power plants, Kumar [15] gave an overview of the research works about Rankine cycle CHP systems. It concluded that thermal recovery techniques played a key role in improving efficiency and performance. Based on this conclusion, Chen et al. [16] studied the effects of a back-pressure steam turbine (BPST) on a CHP system, and the results showed that this high-pressure heating process gave a 17.39% increase in the exergy efficiency. In addition, employing an extraction steam turbine (EST) was demonstrated to be another way of enhancing thermal efficiency [17].
In a real system, its economic and environmental effects must be taken into account seriously. Exergoeconomic and exergoenvironmental analyses were proposed to tackle these problems. Exergoeconomic analysis combines thermodynamic and economic principles to define the actual production costs of each component and the overall system, while exergoenvironmental analysis combines the principles of thermodynamics and Environics to evaluate the environmental impacts [18]. Many studies have shown that exergoeconomic analysis can accurately calculate the levelized exergy cost of an energy system, contributing to cost savings on productivity. For example, Gao et al. [19] performed an exergoeconomic analysis of a coal-fired CHP system. The results showed that the cost caused by the residue exergies accounted for 7.5% in heating seasons and 10.4% in non-heating seasons. Because much attention is paid to carbon emission reduction now, exergoenvironmental analysis has been widely used. Meyer et al. [20] proposed this method and determined its framework and steps. Though they only analyzed a high-temperature solid oxide fuel cell, exergoenviromental analysis could be applied to any energy conversion system. Keçebaş [21] presented an exergoenvironmental analysis for a geothermal district heating system and discussed the effect of the outdoor air temperature on the system’s environmental impact. In some cases, exergoeconomic and exergoenvironmental analyses must be simultaneously conducted to keep a system’s balance of the comprehensive performance [22,23].
According to the literature review, there are four main gaps in the evaluation of CHP systems. First, almost all of the studies were based on simulation, and many impractical configurations cannot reach the experimental research stage, let alone the application stage. Their results lack the support of actual projects. Second, almost all of the CHP systems involved in previous studies subordinated heat production to power generation, thereby giving top priority to meeting the electricity demand. In contrast, there is virtually no analysis of heat-oriented CHP systems that preferentially satisfy building thermal demand. In light of the characteristics, such as the fluctuation in the heating load [24], the CHP systems in which power capacity is determined by heat supply should be analyzed based on the exergy methods. Third, the thermodynamic, economic, and environmental performances of CHP systems were separately evaluated. In fact, a comprehensive evaluation method integrating them properly is lacking. Fourth, the BPST and the EST both demonstrated to be effective equipment for improving thermal efficiency, but the question of which one of the retrofitted CHP systems for district heating should employ is less clear.
To fill these gaps, this study aimed to perform exergy, exergoeconomic, and exergoenvironmental analyses on two real heat-oriented CHP systems. These two systems belong to a retrofit scheme of a conventional district heating plant in Qingdao, China. Based on the results of the analyses, a multi-criteria evaluation method was established to determine which system had a better performance, and the suitability of the BPST and the EST for the retrofitted system was discussed.
There are three novelties in this paper. First, all the data are from the real-time maintenance and monitoring platforms of an actual project rather than simulation or experimental models, which can improve reliability and authenticity. Second, the comprehensive performance of the retrofitted CHP systems remains unknown, and therefore a new multi-criteria evaluation method is proposed. Third, the contrastive analysis of the two different steam turbines’ effects is conducted to demonstrate their suitability for the retrofitted systems.

2. System Description

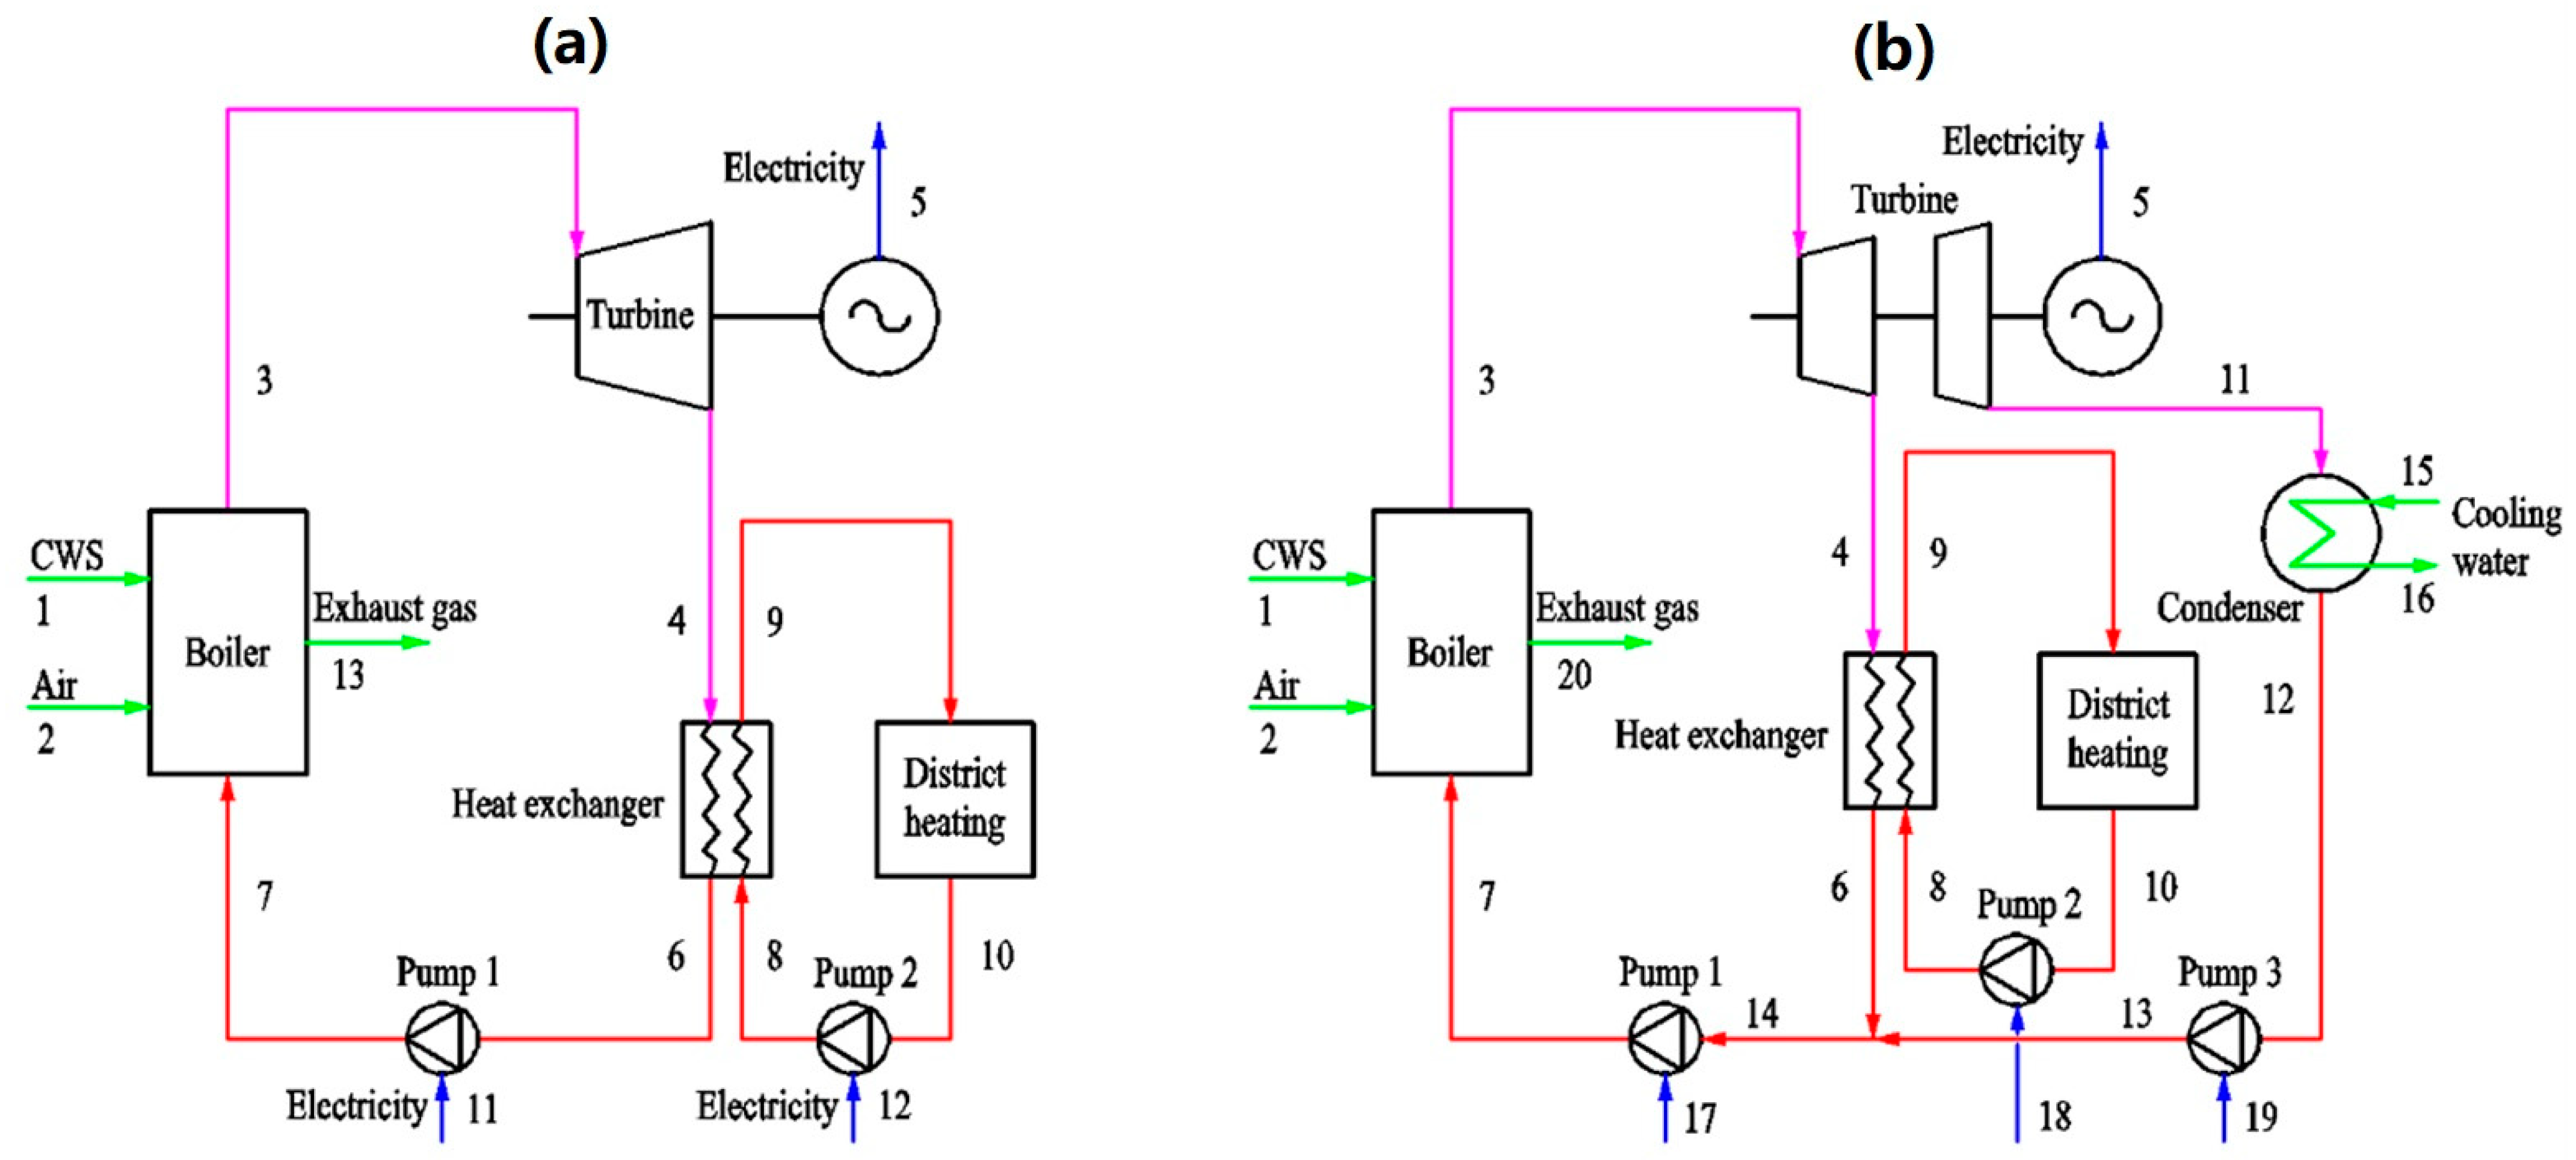
The coal-fired district heating plant came into service in the city of Qingdao in 2004, covering a gross floor area of 2.07 m square meters. With the total length of the heat supply pipelines spanning 470 km, it consumed approximately 0.15 m tons of coal each year. The huge energy use led to severe economic and environmental issues. To save energy and protect the environment, this single-purpose system has been retrofitted into two CHP systems: system A with a BPST and system B with an EST (shown in Figure 1).
The two systems are both based on the Rankine cycle. They are identical except for one thing: the BPST without steam extraction structures was installed in system A, while the EST, with a single-extraction turbine, was installed in system B. Coal water slurry (CWS) was selected as the clean alternative fuel for improving combustion efficiency and reducing emissions.
This study was conducted in the two real CHP systems through a full-field investigation rather than simulation or experimental models. The systems operate steadily under the rated conditions. Superheated steam is produced in the boiler and then drives the turbine for electricity generation. In system A, exhaust steam flows into the heat exchanger to provide heat for residential space heating; however, in system B, it is the steam extracted from the expanding process in the turbine that flows into the heat exchanger, and the exhaust steam is cooled to liquid in the condenser. Finally, all of the cooled water is pumped into the boiler to complete the cycle. In this paper, real operating data were obtained from the monitoring systems, which can collect the temperature, pressure, and mass flow rate of each state point, and the properties and the cost of the system components were collected from their manufacturers.

3. Methodology

A comprehensive evaluation of the CHP systems should include three dimensions: thermodynamics, economics, and Environics. There is broad consensus that appropriate evaluation methods for each of them are exergy, exergoeconomic, and exergoenvironmeantal analyses, respectively [22]. Therefore, the multi-criteria evaluation in this paper is based on the results of these three analyses.

3.1. Exergy Analysis

Exergy analysis is a widely used, effective method to determine an energy conversion system’s efficiency and irreversibility. The results can identify inefficient components and seek means of improvement. On the other hand, it is the preliminary work for exergoeconomic and exergoenvironmental analyses.
According to the coal component analysis conducted by the manufacturer, the exergy of CWS, a mixed liquid fuel, can be calculated using the formula proposed by Yan and Wang [25]:
e CWS = Q L y + 0.7 C y + 125.52 H y + 16.1 O y + 17.41 N y + 1.01 S y + 19.68 W y + 150
where e is a specific exergy value (kJ/kg); QL is the low calorific value of coal; C, H, O, N, and S are the percentages of carbon, hydrogen, oxygen, nitrogen, and sulfur, respectively, in coal; W is the percentage of water in CWS; and the superscript y denotes the as-received basis.
The systems in this study can be viewed as an incomplete thermodynamic equilibrium, so only physical exergy needs to be considered. The exergy of a working medium in a system can be calculated as follows:
e = h h 0 T 0 s s 0
where h and s are a specific enthalpy (kJ/kg) and entropy [kJ/(K·kg)]; T is the temperature (K); and the subscript 0 denotes the ambient condition.
The exergy flow rate at the kth point of the system can be expressed as follows:
E k ˙ = M k ˙ × e k
where M ˙ is the mass flow rate (kg/s).
There are several exergy flows in or out of a component in the system, and they are defined into three categories: fuel, product, and destruction [26]. Similarly to the law of the conservation of energy, the exergy balance equation can be established for each component in the system:
E F ˙ = E P ˙ + E D ˙
where E F ˙ , E P ˙ , and E D ˙ are the fuel exergy, product exergy, and destroyed exergy, respectively (MW).
The exergy efficiency, ε, is defined as:
ε = E P ˙ E F ˙
Therefore, the equations for the components in the two systems are listed in Table 1.

3.2. Exergoeconomic Analysis

Economy principles are incorporated into the theory of thermodynamics in exergoeconomic analysis, which can reflect the economic nature of energy conversion systems. The capital cost of each component and the cost coupled with exergy flows should both be accurately calculated in the analysis. Considering the total operation hours, the capital cost should be converted to the levelized cost using the following formula [27]:
Z ˙ = Z · C R F · α H a · 3600
where Z ˙ is the levelized cost (USD/s); Z is the capital cost of each component (USD); α is the maintenance coefficient being 1.06; Ha is the annual operation hours being 2000 h (the two systems in this study operate only in winter for 2000 h per year); and CRF is the capital recovery factor.
The levelized cost here includes the accumulated depreciation cost and the maintenance cost of the component. Thus, the CRF can be calculated as follows [27]:
C R F = i · 1 + i n 1 + i n 1
where the discount rate is i = 0.0615, and the life cycle is n = 25 yr [28].
According to the plant’s asset ledger, the non-energy costs of components in the two systems are listed in Table 2. Furthermore, the change in the exergy cost is accompanied by the production or destruction of the exergy, and the cost balance equation for each component is expressed as follows [29]:
C F ,     k ˙ + Z k ˙ = C P , k ˙
C F , k ˙ = c F , k × E F , k ˙
C P , k ˙ = c P , k × E P , k ˙
where C F ,   k ˙ and C P , k ˙ are the cost rates of the fuel exergy and product exergy of the kth component (USD/s); c F , k and c P , k are the unit costs of the fuel and product of the kth component (USD/GJ); and Z k ˙ is the levelized cost of the kth component (USD/s).
Because the number of cost balance equations is not enough to obtain the solution, auxiliary equations must be established in accordance with the following assumptions [30]. First, if an output flow of a component is a branch of any input flow, the exergy costs of the two flows are equal. Second, if a product of a component consists of more than one flow, these output flows have the same exergy cost. Therefore, the cost balance and auxiliary equations of the components are shown in Table 3, and the number of equations equals the number of unknown variables. Moreover, the airflow into the boiler is considered free, and the unit cost of the CWS from the manufacturer is 0.5 USD/s.
In the retrofit process, because the non-energy cost of existing equipment would barely change, the lower exergy loss cost indicates better economic performance. Therefore, the exergoeconomic factor, fc, is selected to reflect the proportions of the non-energy cost and the exergy destruction cost [29]:
f c , k = Z k ˙ Z k ˙ + C D , k ˙
C D , k ˙ = c F , k × E D , k ˙  
where C D , k ˙ is the cost rate related to the exergy destruction in the kth component.

3.3. Exergoenvironmental Analysis

Environmental performance now plays a more and more important role in the comprehensive evaluation of a CHP system because of increasingly serious emission problems. The principles of exergoenvironmental analysis and exergoeconomic analysis are essentially similar. The components’ environmental impacts, which can be calculated using the life cycle assessment [31], are allocated to the exergy flows. A component’s environmental impacts in its life cycle consist of three parts [20]:
Y ˙ = Y ˙ CO + Y ˙ OM + Y ˙ DI
where Y ˙ CO , Y ˙ OM , and Y ˙ DI are the construction, operation and maintenance, and disposal environmental impacts, respectively (mPts/s). Pts is an eco-indicator unit used for the standardization and quantification of environmental impacts.
Major ingredients, weights, and production processes of equipment are necessary for calculating the environmental impacts. Unlike simulation models in most studies, the manufacturers can clearly provide the information in this paper. According to the methods reported by Cavalcanti [22], the main materials’ environmental impacts are shown in Table 4, and the environmental impacts of the components in the two systems are listed in Table 5.
Analogously to the exergoeconomic analysis, there is the environmental impact balance equation for each component, shown as follows:
B F , k ˙ + Y k ˙ = B P , k ˙
B F , k ˙ = b F , k × E F , k ˙
B P , k ˙ = b P , k × E P , k ˙
where B F ,   k ˙ and B P , k ˙ are the environmental impact rates of the fuel exergy and product exergy of the kth component (mPts/s); b F , k and b P , k are the unit environmental impacts of the fuel and product of the kth component (mPts/GJ); and Y k ˙ is the levelized environmental impacts of the kth component (mPts/s).
The environmental impact balance equations and their auxiliary equations of system components are listed in Table 6. The environmental impact value of the CWS (b1) is derived from the component analysis conducted by the manufacturer.
In addition, the relative environmental impact difference, re, is selected to reflect a component’s potential for improvement in terms of environmental friendliness and expressed as follows [20]:
r e , k = b P , k b F , k b F , k
In the retrofit process, because existing equipment needs to be retained to save the cost, the component-related environmental impacts are almost unchanged. Therefore, the environmental impacts related to exergy destruction should be kept as small as possible. The exergoenvironmental factor, fb, is selected to determine the sources of environmental impacts in a component. This variable reflects the relative contribution of environmental impacts related to a component, which is given by [20]:
f b , k = Y k ˙ Y k ˙ + B D , k ˙
B D , k ˙ = b F , k × E D , k ˙  
where B D , k ˙ is the environmental impact rate related to exergy destruction.

3.4. Multi-Criteria Evaluation

After evaluating the performances in thermodynamics, economics, and environics, we should obtain a comprehensive result involving these three aspects. To this end, we devised the district heating index (DHI) for the multi-criteria evaluation of the heat-oriented CHP systems, shown as follows:
D H I = ω 1 ε + ω 2 f c + ω 3 f b
where ω1, ω2, and ω3 are weightings of the system’s exergy efficiency, exergoeconomic factor, and exergoenvironmental factor, respectively. The DHI follows the principle that bigger is better because ε, fc, and fb are all larger, desirable responses.
Due to the carbon reduction initiatives of the Chinese government, the environmental friendliness of a district’s heating system has been given a top priority at the sacrifice of its economy. Therefore, subjective weighting methods are appropriate in this paper, and the rank correlation analysis (RCA) was selected to determine the weightings, which are based on the analytical hierarchy process method [31]. Comparatively, RCA has an advantage in simplicity and can accurately reflect the policy support and experts’ preferences.
If there are several evaluation factors, a1, a2, …, an, and their importance ranking is a1 > a2 > … > an, the relative importance between aj−1 and aj can be calculated as:
r j = a j 1 a j ,   j = n ,   n 1 ,   n 2 ,   ,   3 ,   2
where rj is the relative importance of adjacent factors, and the possible values are listed in Table 7.
After the important ranking and the relative importance are determined, the weightings can be calculated as [32]:
ω n = 1 1 + j = 2 n i = j n r i
ω j 1 = r j × ω j
where ωj is the weighting of the factor aj.

4. Results and Discussion

According to the operational monitoring system of the district heating plant, the state properties of system A and system B are listed in Table 8.

4.1. Exergy Performance

4.1.1. Exergy Efficiency

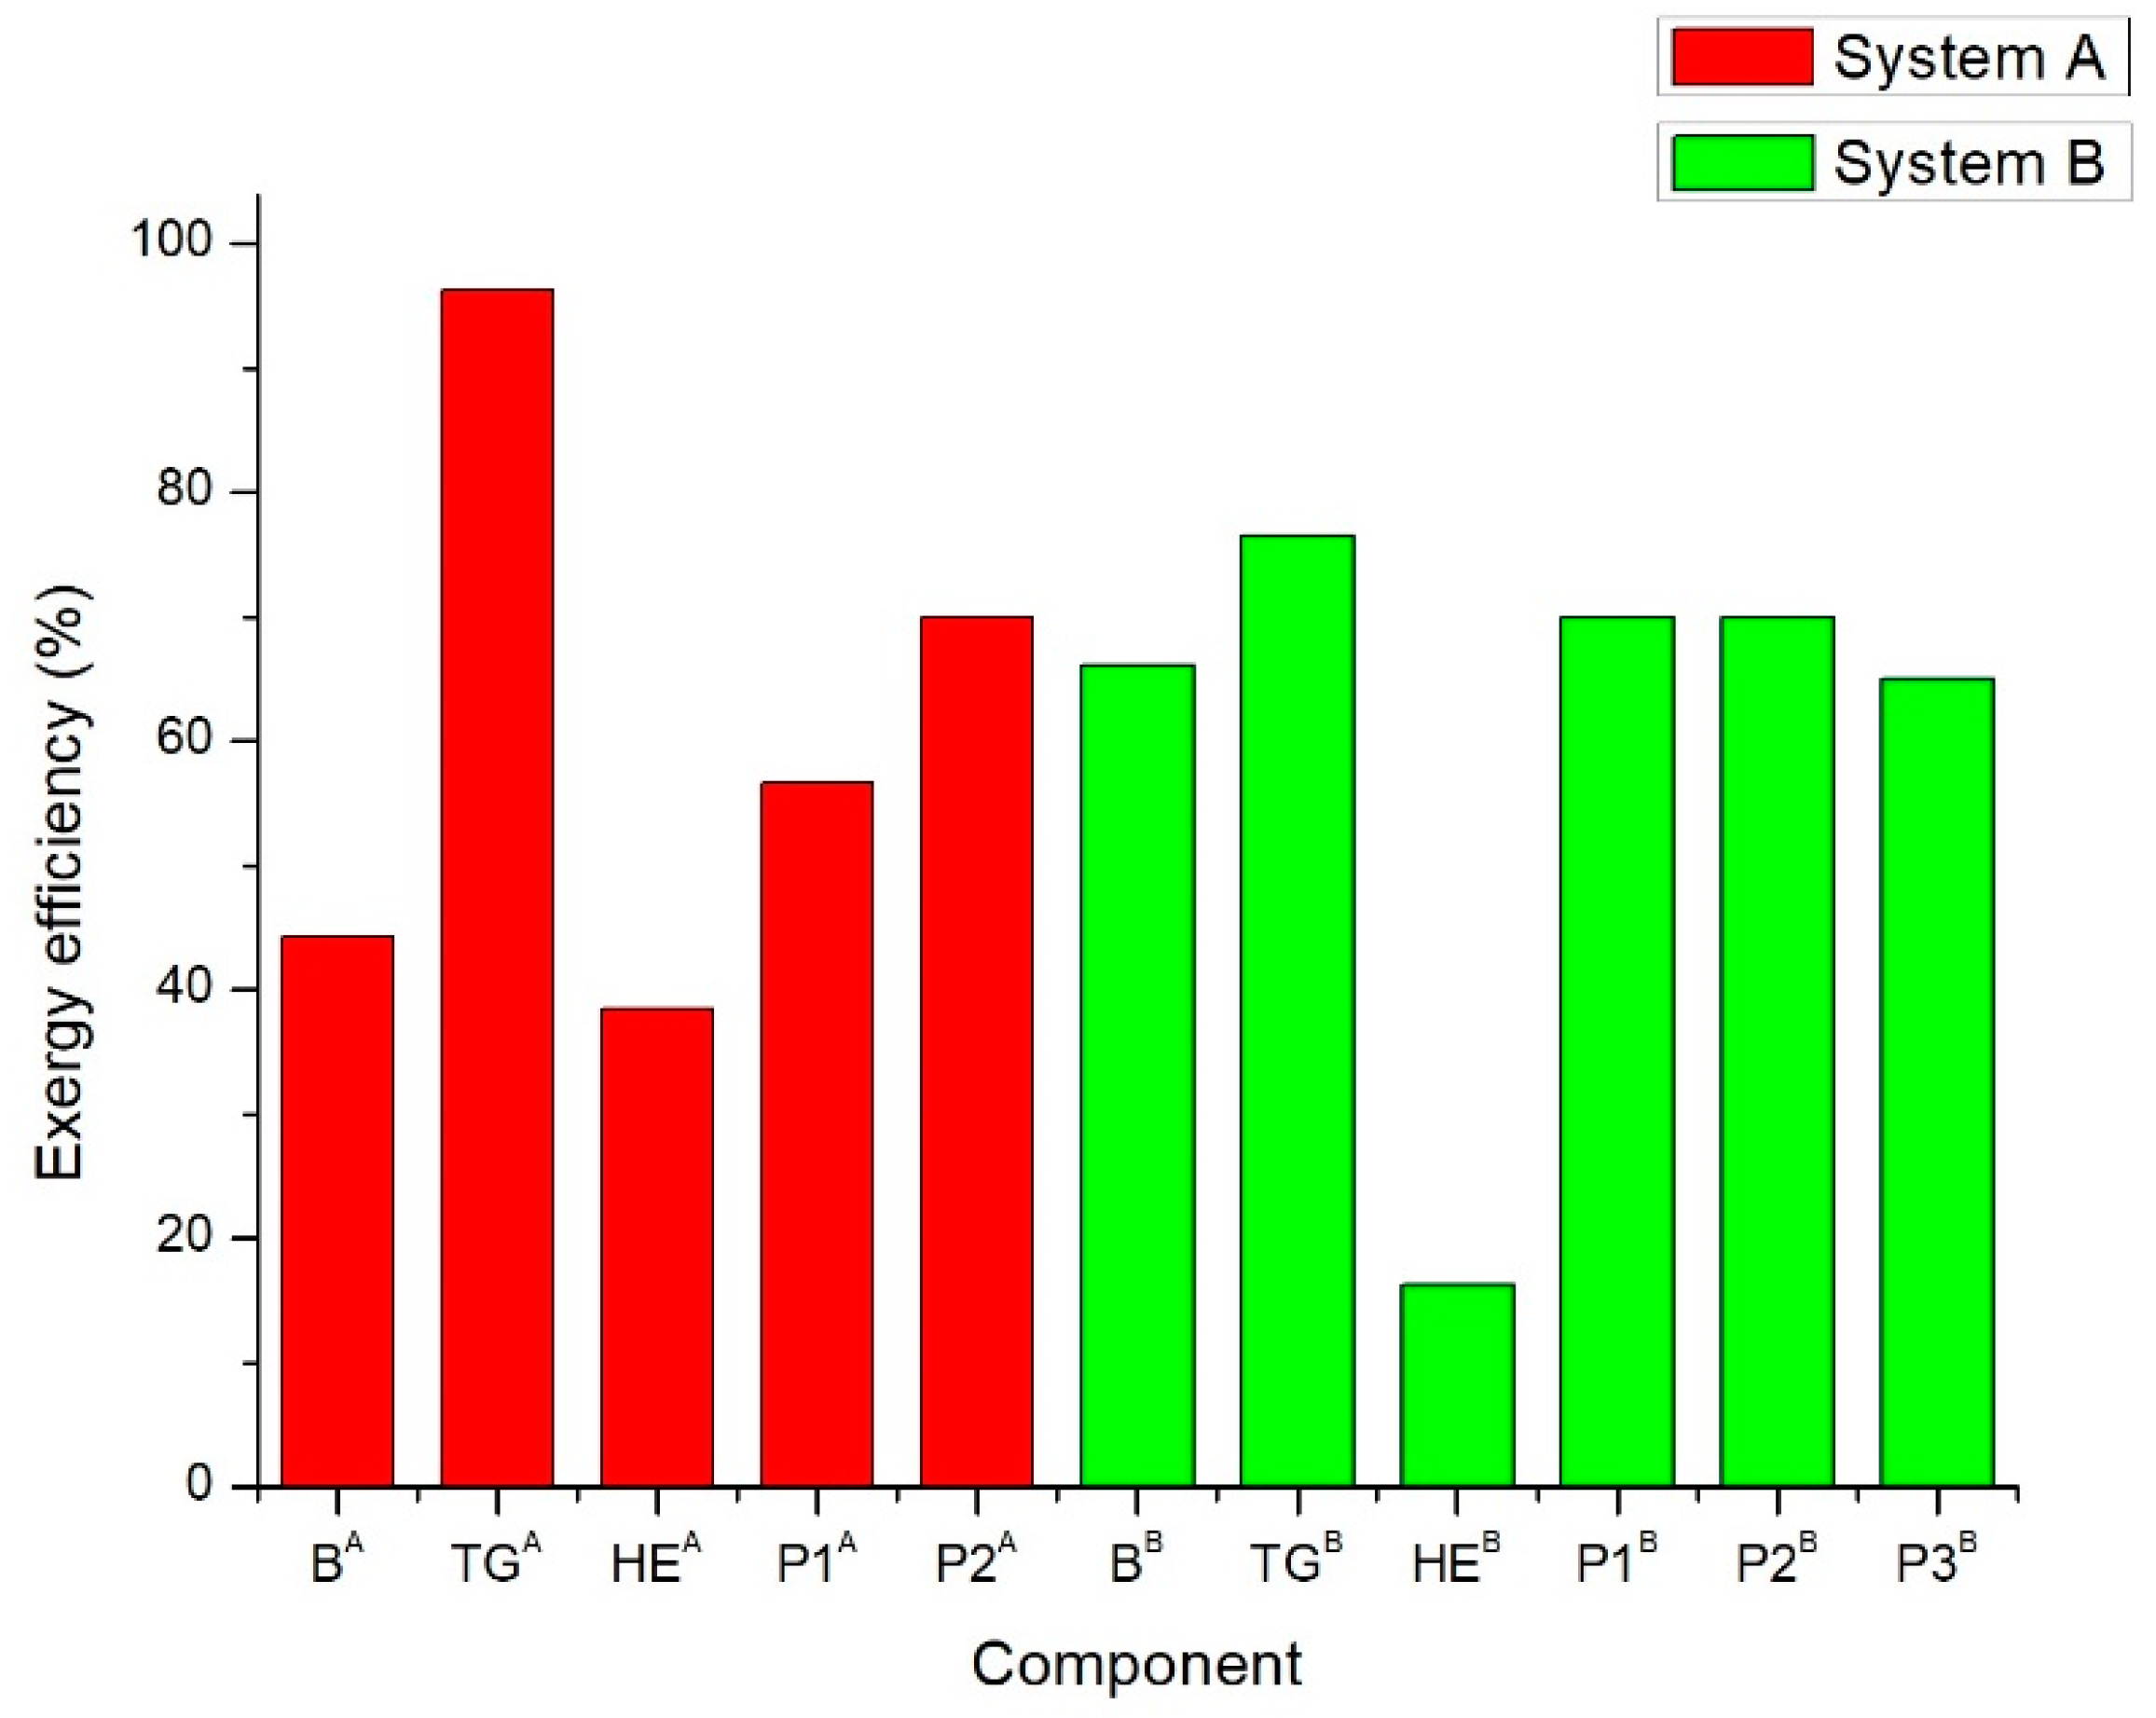
Figure 2 shows the exergy efficiencies of the components in systems A and B. The common features of these two systems are that each turbo-generator offers the highest efficiency and that each heat exchanger has the lowest efficiency. The exergy efficiencies of the BPST and the EST reach 96.2% and 76.5%, while the heat exchangers in system A and in system B have relatively low exergy efficiencies of 38.5% and 16.3%, respectively. Therefore, possibly because of the lack of proper maintenance, effective intervention is necessary for the performance improvement of the heat exchangers. In addition, the BPST’s exergy efficiency is 20.5% higher than the EST’s in the rated operating mode, where the heating demand is matched constantly by the supply. This would imply the BPST’s advantage in system efficiency when the heating supply is constant. There is also an obvious difference in that the exergy efficiency of the boiler in system B is 33.0% higher than that of the boiler in system A, which indicates that changes in other system components can influence the boiler’s performance. To sum up, with the same calculation method, the total exergy efficiencies of system A and system B are 37.1% and 32.1%, respectively.

4.1.2. Exergy Loss

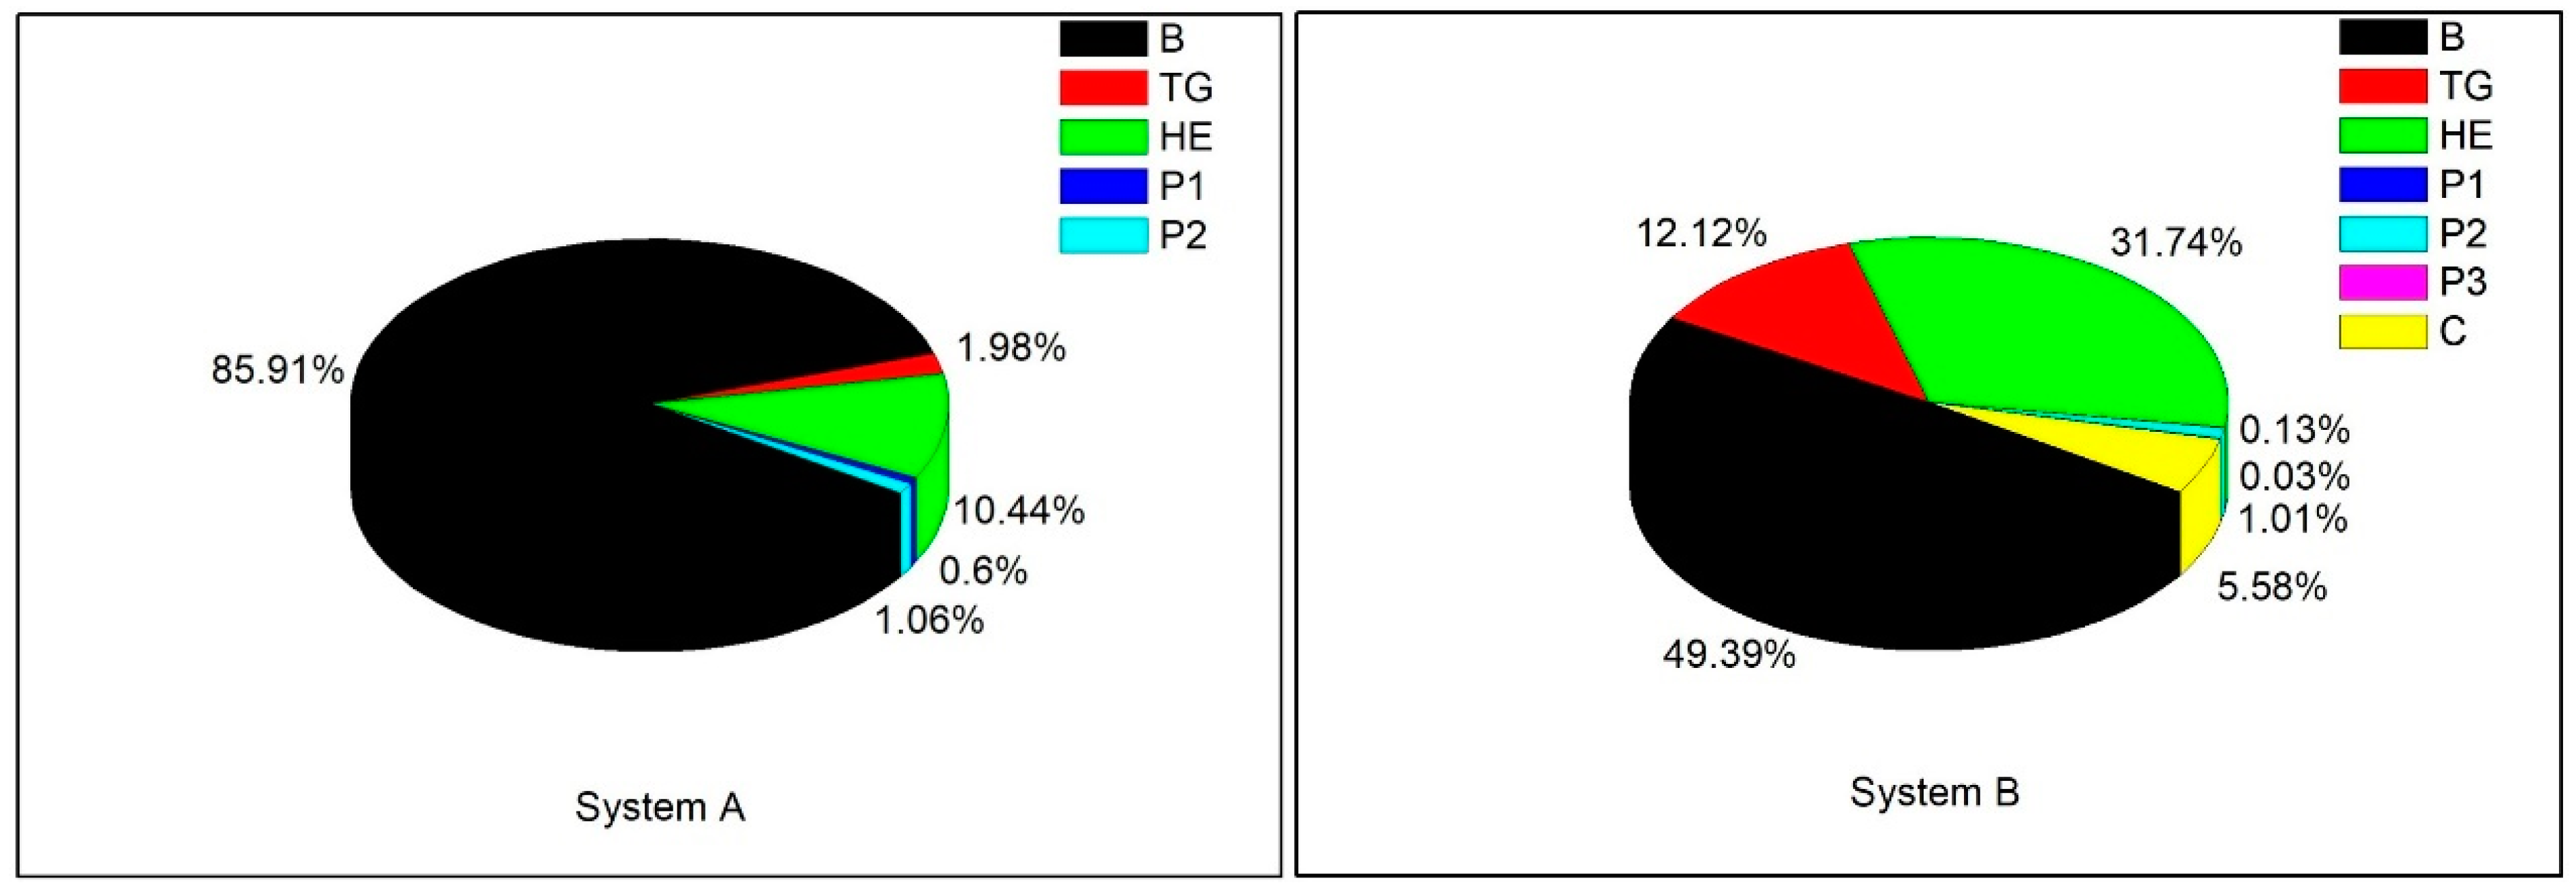
The total exergy losses of system A and system B are 71.930 MW and 76.122 MW, respectively, and Figure 3 shows the proportion of each component’s exergy destruction in the total exergy loss. Each boiler in the two systems accounts for the largest proportion. Because system A has a simpler configuration and fewer components than system B, its boiler’s exergy destruction percentage reaches 85.91%, significantly higher than the 49.39% in system B. Therefore, regardless of the type of turbo-generator, a CHP system’s improvement in efficiency should focus on the boiler. In both systems, the second largest exergy destruction proportion exists in each heat exchanger, 10.44% in system A and 31.74% in system B. This result highlights the necessity of improving the efficiency of the heat exchange, mainly by means of frequent maintenance and cleaning. In contrast, each pump has the smallest exergy destruction. This is largely due to the fact that pumps are essentially high-efficiency energy conversion devices that are driven directly by electricity.

4.2. Exergoeconomic Performance

4.2.1. Exergy Cost

The results of the exergoeconomic analysis are listed in Table 9. The costs of hot water for district heating and electricity are 10.11 USD/GJ and 13.77 USD/GJ in system A, while the costs in system B are 18.32 USD/GJ and 9.47 USD/GJ, respectively. These two systems do not make much difference in the total product cost, and this may be because they have the same suppliers of equipment and fuel. Similarly, the total cost rates of the exergy destruction in system A and system B are 0.32 USD/s and 0.37 USD/s, respectively.

4.2.2. Exergoeconomic Factor

The exergoeconomic factor shows the proportion of the equipment cost in a component’s total costs. Because the equipment was retained as much as possible in the retrofit process, the equipment cost had already been determined and had no room for reduction. Therefore, a higher exergoeconomic factor indicates a lower exergy destruction cost and better exergoeconomic performance. On the contrary, a lower exergoeconomic factor means that proper intervention should be given to reduce exergy destruction for cutting costs.
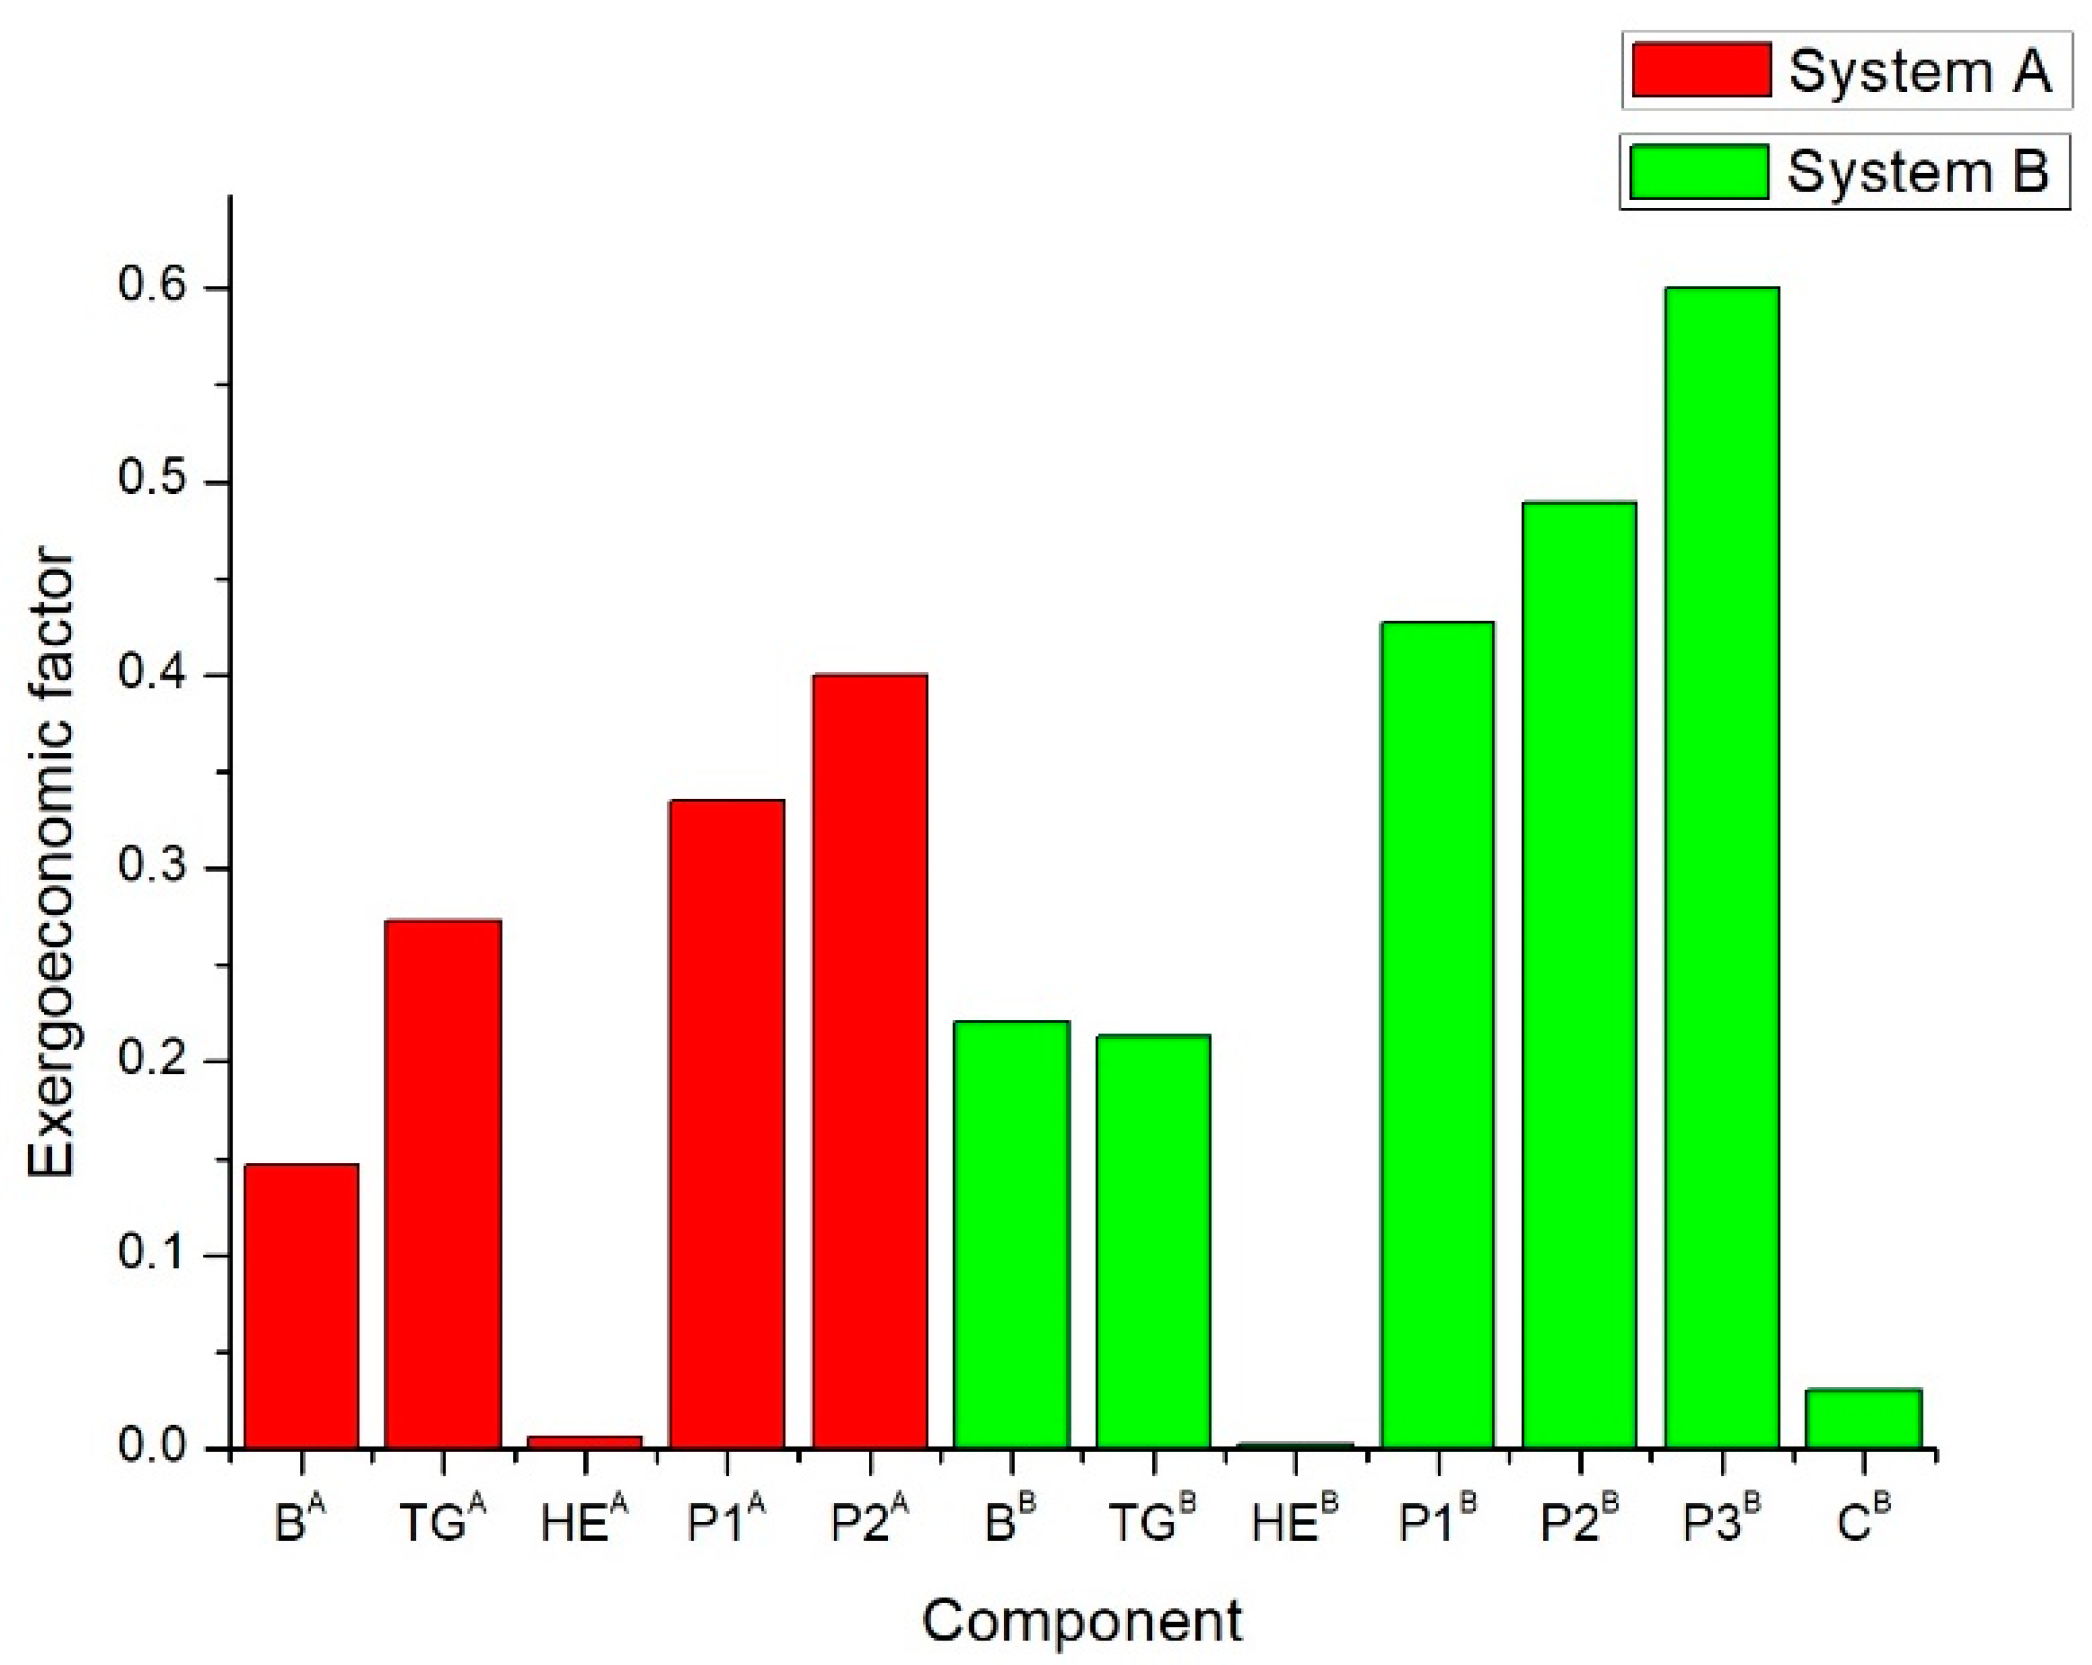
The exergoeconomic factors of the components in the two systems are shown in Figure 4. All the pumps have values higher than 0.3, and the exergoeconomic factor of pump 3 in system B reaches 0.6. This can be explained, in part, by their high exergy efficiencies based on good leak-proof quality and frequent maintenance from the manufacturer. In contrast, the exergoeconomic factors of all the steam-water heat exchangers, including the condenser in system B, are extremely small. This can be demonstrated by their low exergy efficiencies found in the exergy analysis. Here, we can infer that the heat exchangers in the plant have fallen into disrepair. To cut down on the operating cost, improvement intervention must be given to them in the first place. In addition, the exergoeconomic factors of the BPST in system A and the EST in system B are 0.27 and 0.21, both lower than 0.3, indicating that exergy destruction is the dominant cost source. On the whole, the exergoeconomic factors of system A and system B are 0.115 and 0.122, respectively. With the purpose of retrofitting rather than new construction, the economic performance of system B is slightly better than that of system A.

4.3. Exergoenvironmental Performance

4.3.1. Environmental Impacts of Flows

The results of the exergoenvironmental analysis are listed in Table 10. The environmental impacts of hot water for district heating and electricity are 5228 mPts/GJ and 3617 mPts/GJ in system A, while the impacts in system B are 5609 mPts/GJ and 3665 mPts/GJ, respectively. As the total environmental impacts accumulate, the largest value occurs in the state of point 7, the end of the Rankin cycle, and they reach 6365 mPts/GJ and 16706 mPts/GJ in system A and system B, respectively. The fact that system B is more complex than system A, additionally including a condenser and a pump, makes this big difference.

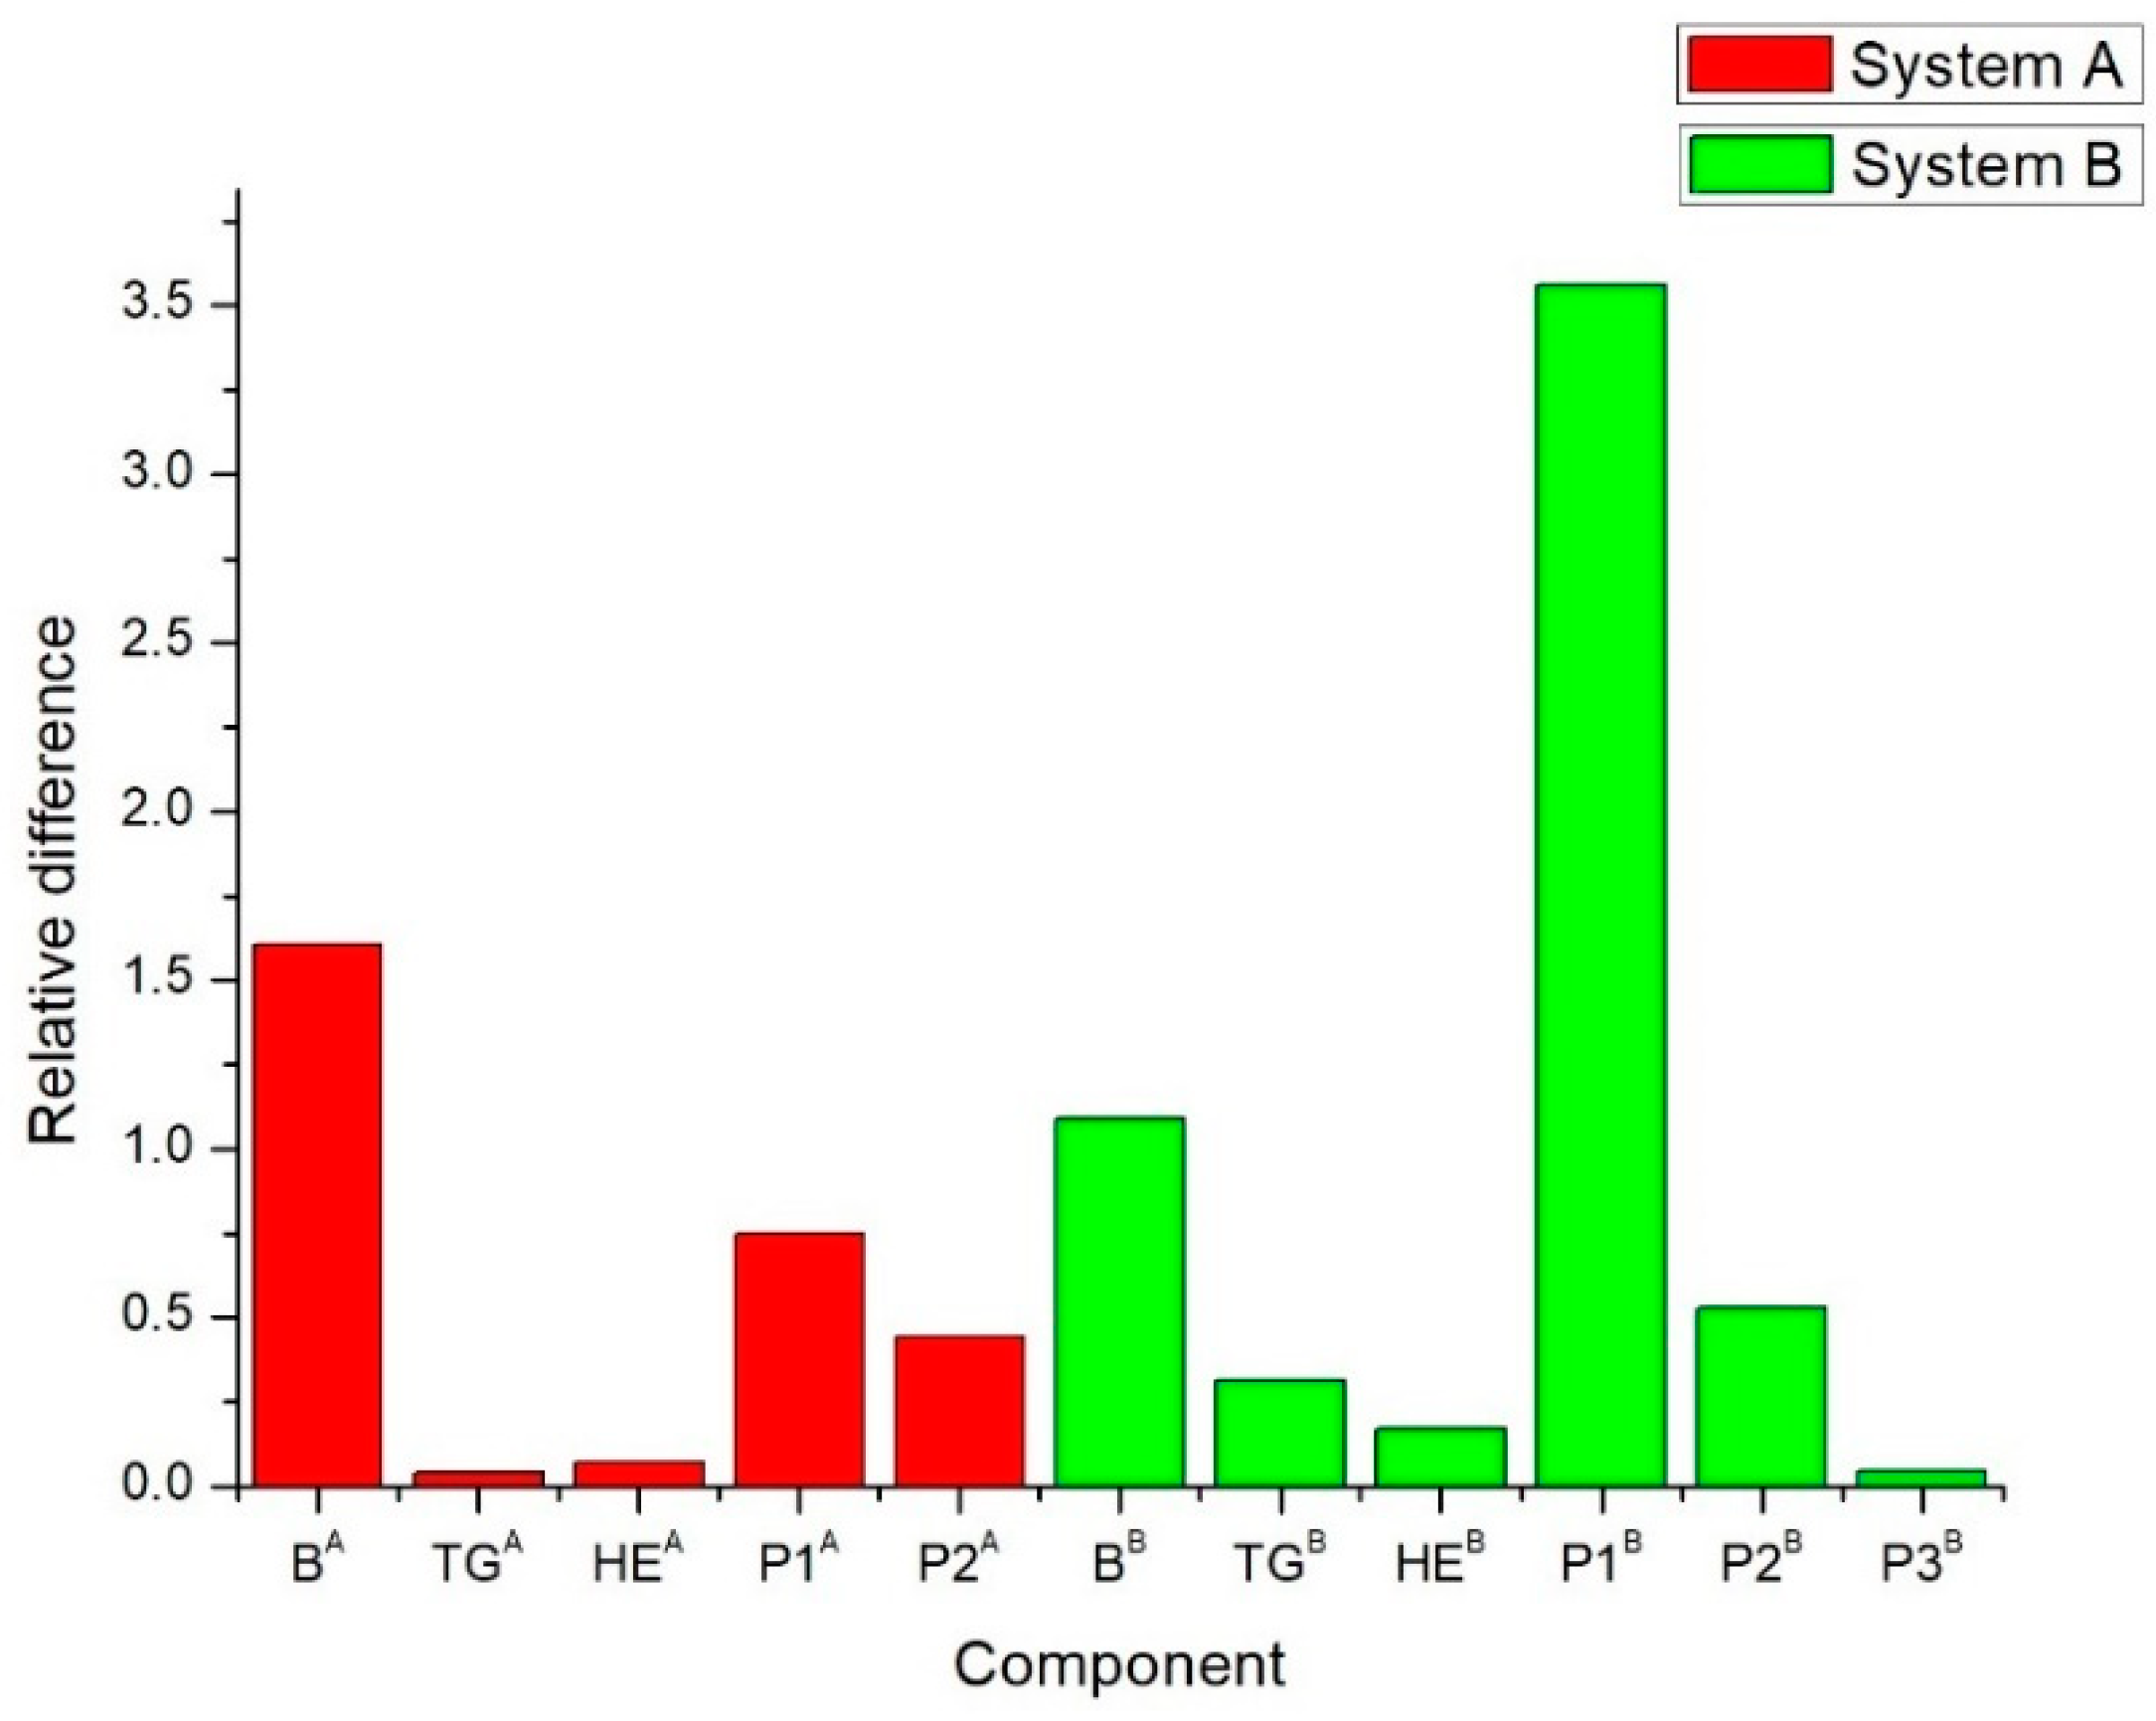
4.3.2. Relative Difference

The relative difference is an indicator that quantifies the improvement potential of the components in terms of their environmental performance. A higher value of relative difference indicates a higher potential for reducing the environmental impacts of the corresponding component. In other words, its environmental impacts can be reduced more easily than those of the component with a lower value. From Figure 5, the boiler in system A has the highest potential, while the environmental impacts of pump 1 in system B can be reduced with the smallest effort. It should be noted that the value of pump 1 in system B is significantly higher than other pumps in the two systems. This unexpected result may be explained by its different structure (a horizontal centrifugal) from the other pumps (a vertical centrifugal). In addition, the EST has a relative difference of 0.31, but the BPST’s value is only 0.04. This difference emphasizes the ESTs’ flexibility in heating load control, and its different extraction modes would result in different environmental impacts.

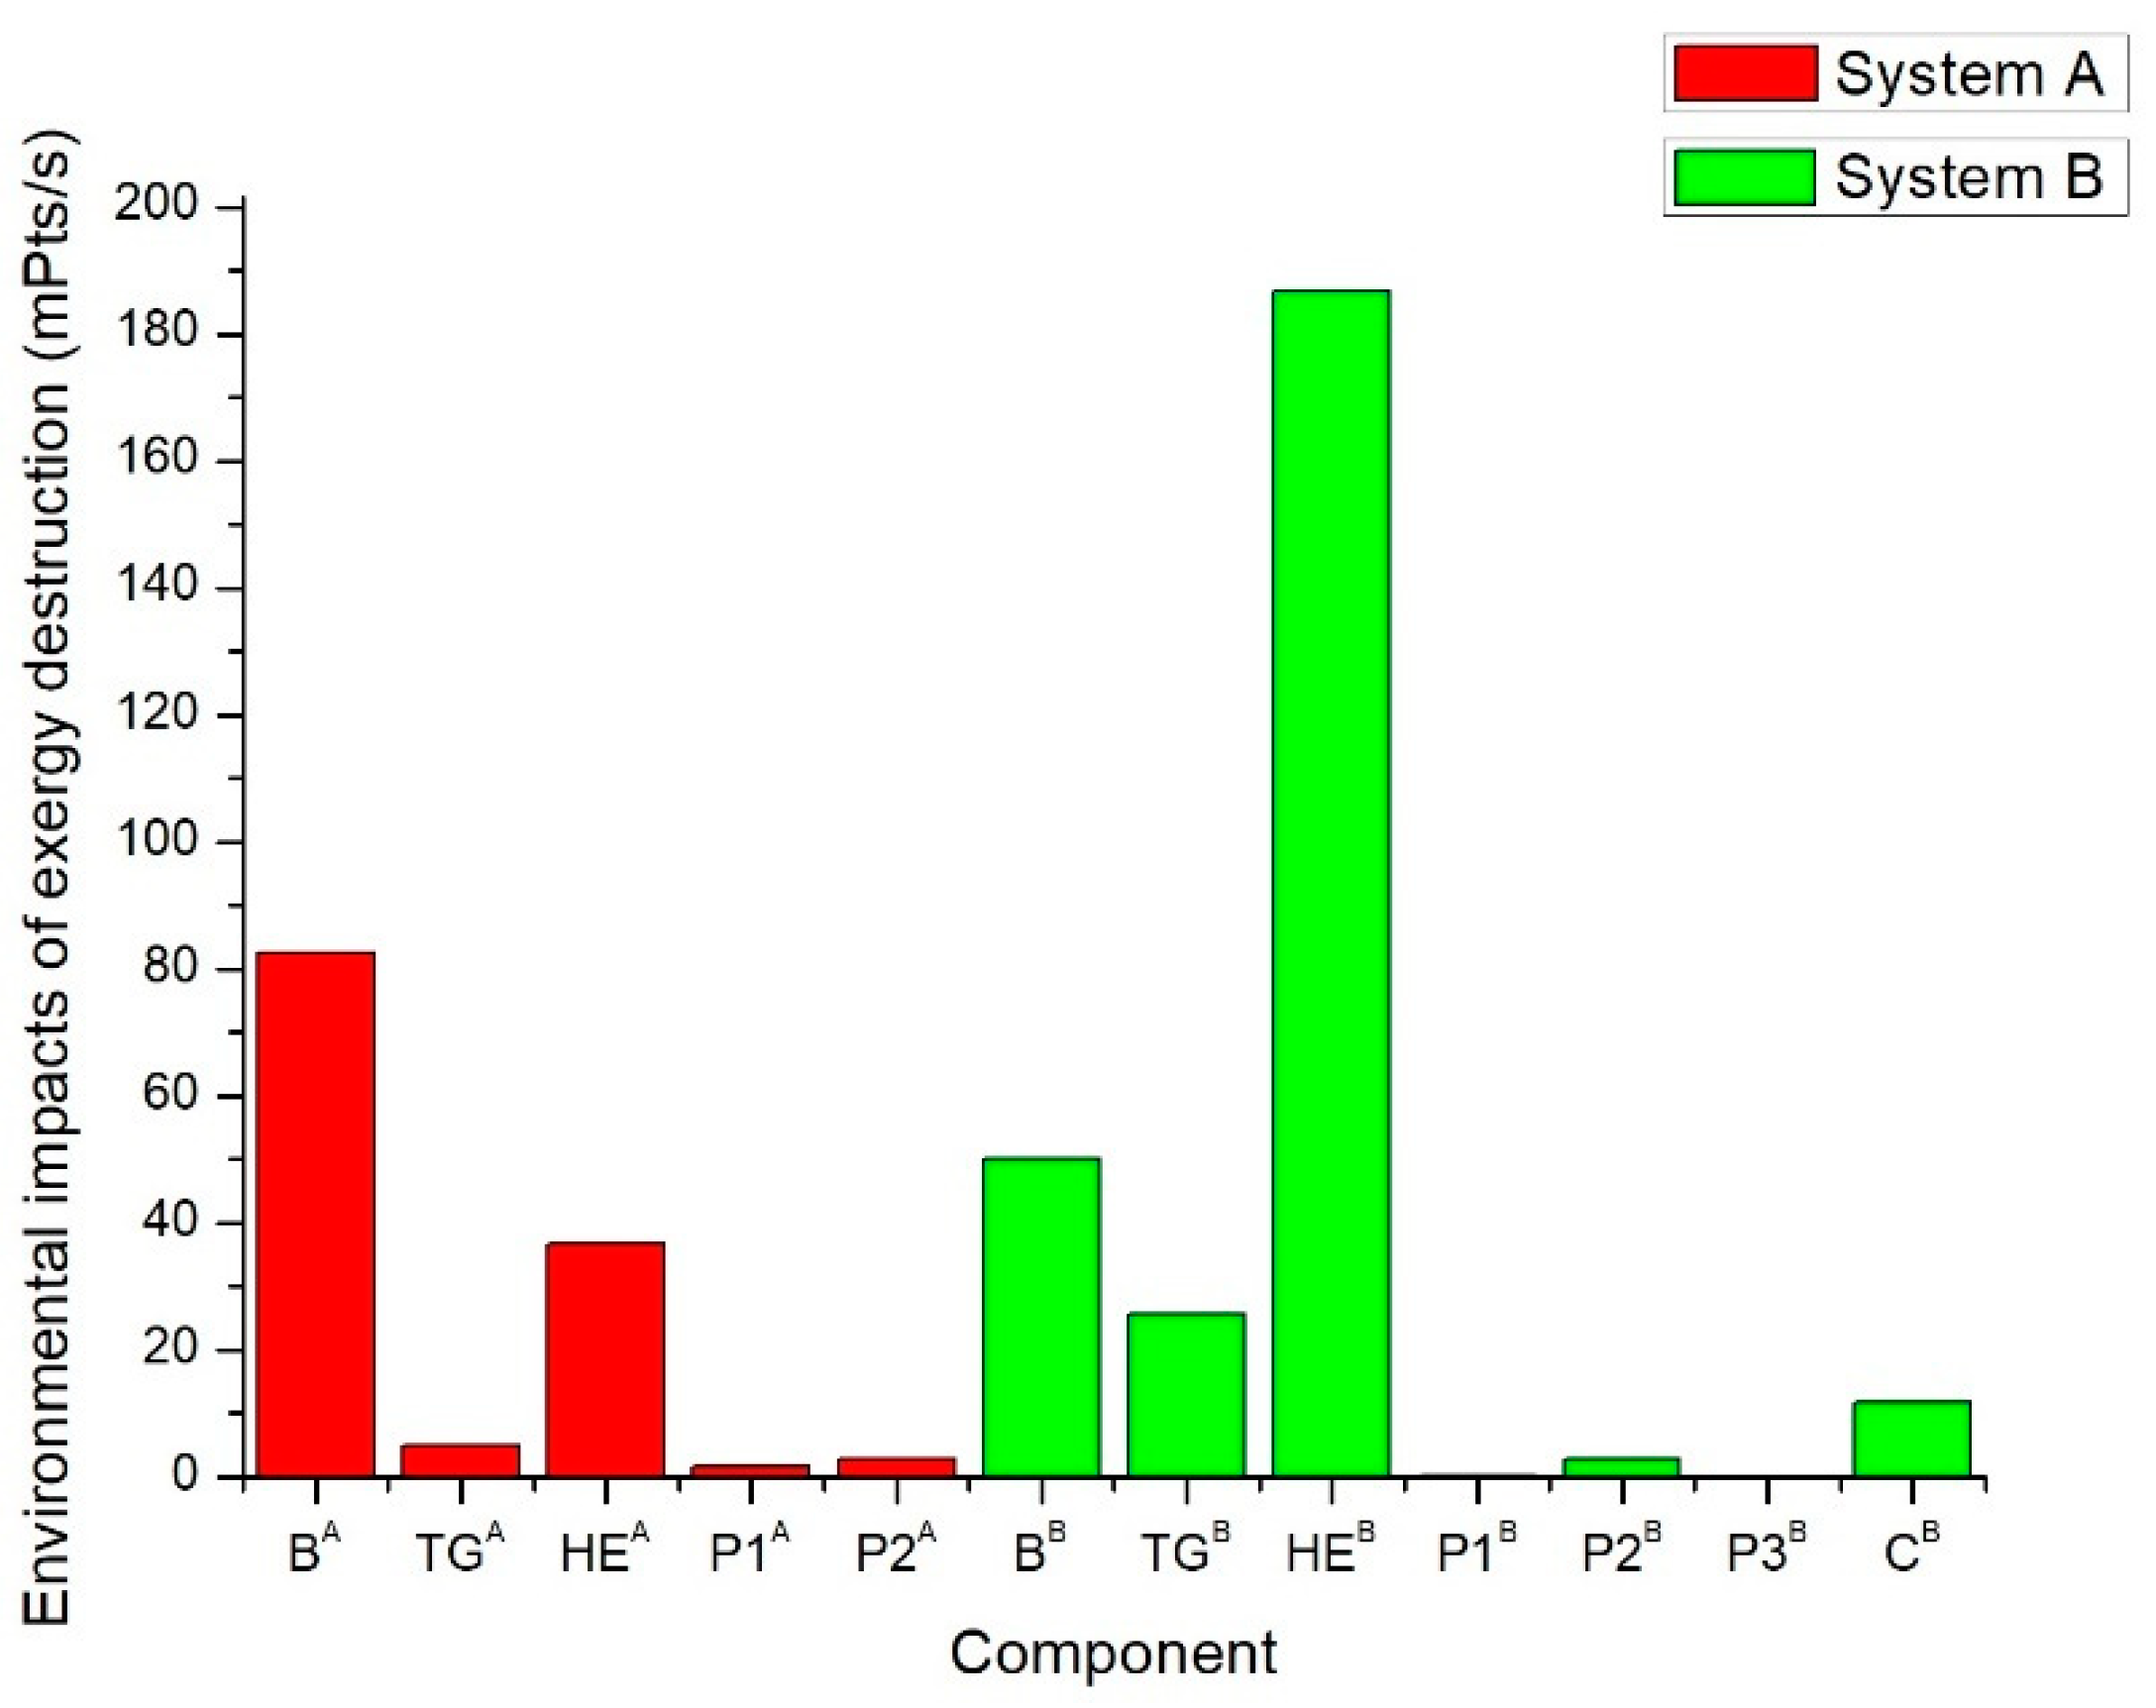
4.3.3. Environmental Impacts of Components

The environmental impact rates caused by exergy destruction in system A and in system B are 128.618 mPts/s and 277.728 mPts/s, respectively. At the component level, the values of this variable are shown in Figure 6. The environmental impacts of the boilers and heat exchangers account for the major portion, and the heat exchanger in system B has the largest value of 186.672 mPts/s. However, all the pumps have extremely low environmental impacts, owing to their high exergy efficiency and small exergy destruction. In addition, the value of the EST (25.750 mPts/s) is approximately five times higher than the BPST’s (4.962 mPts/s), which reflects the larger exergy destruction in the EST.
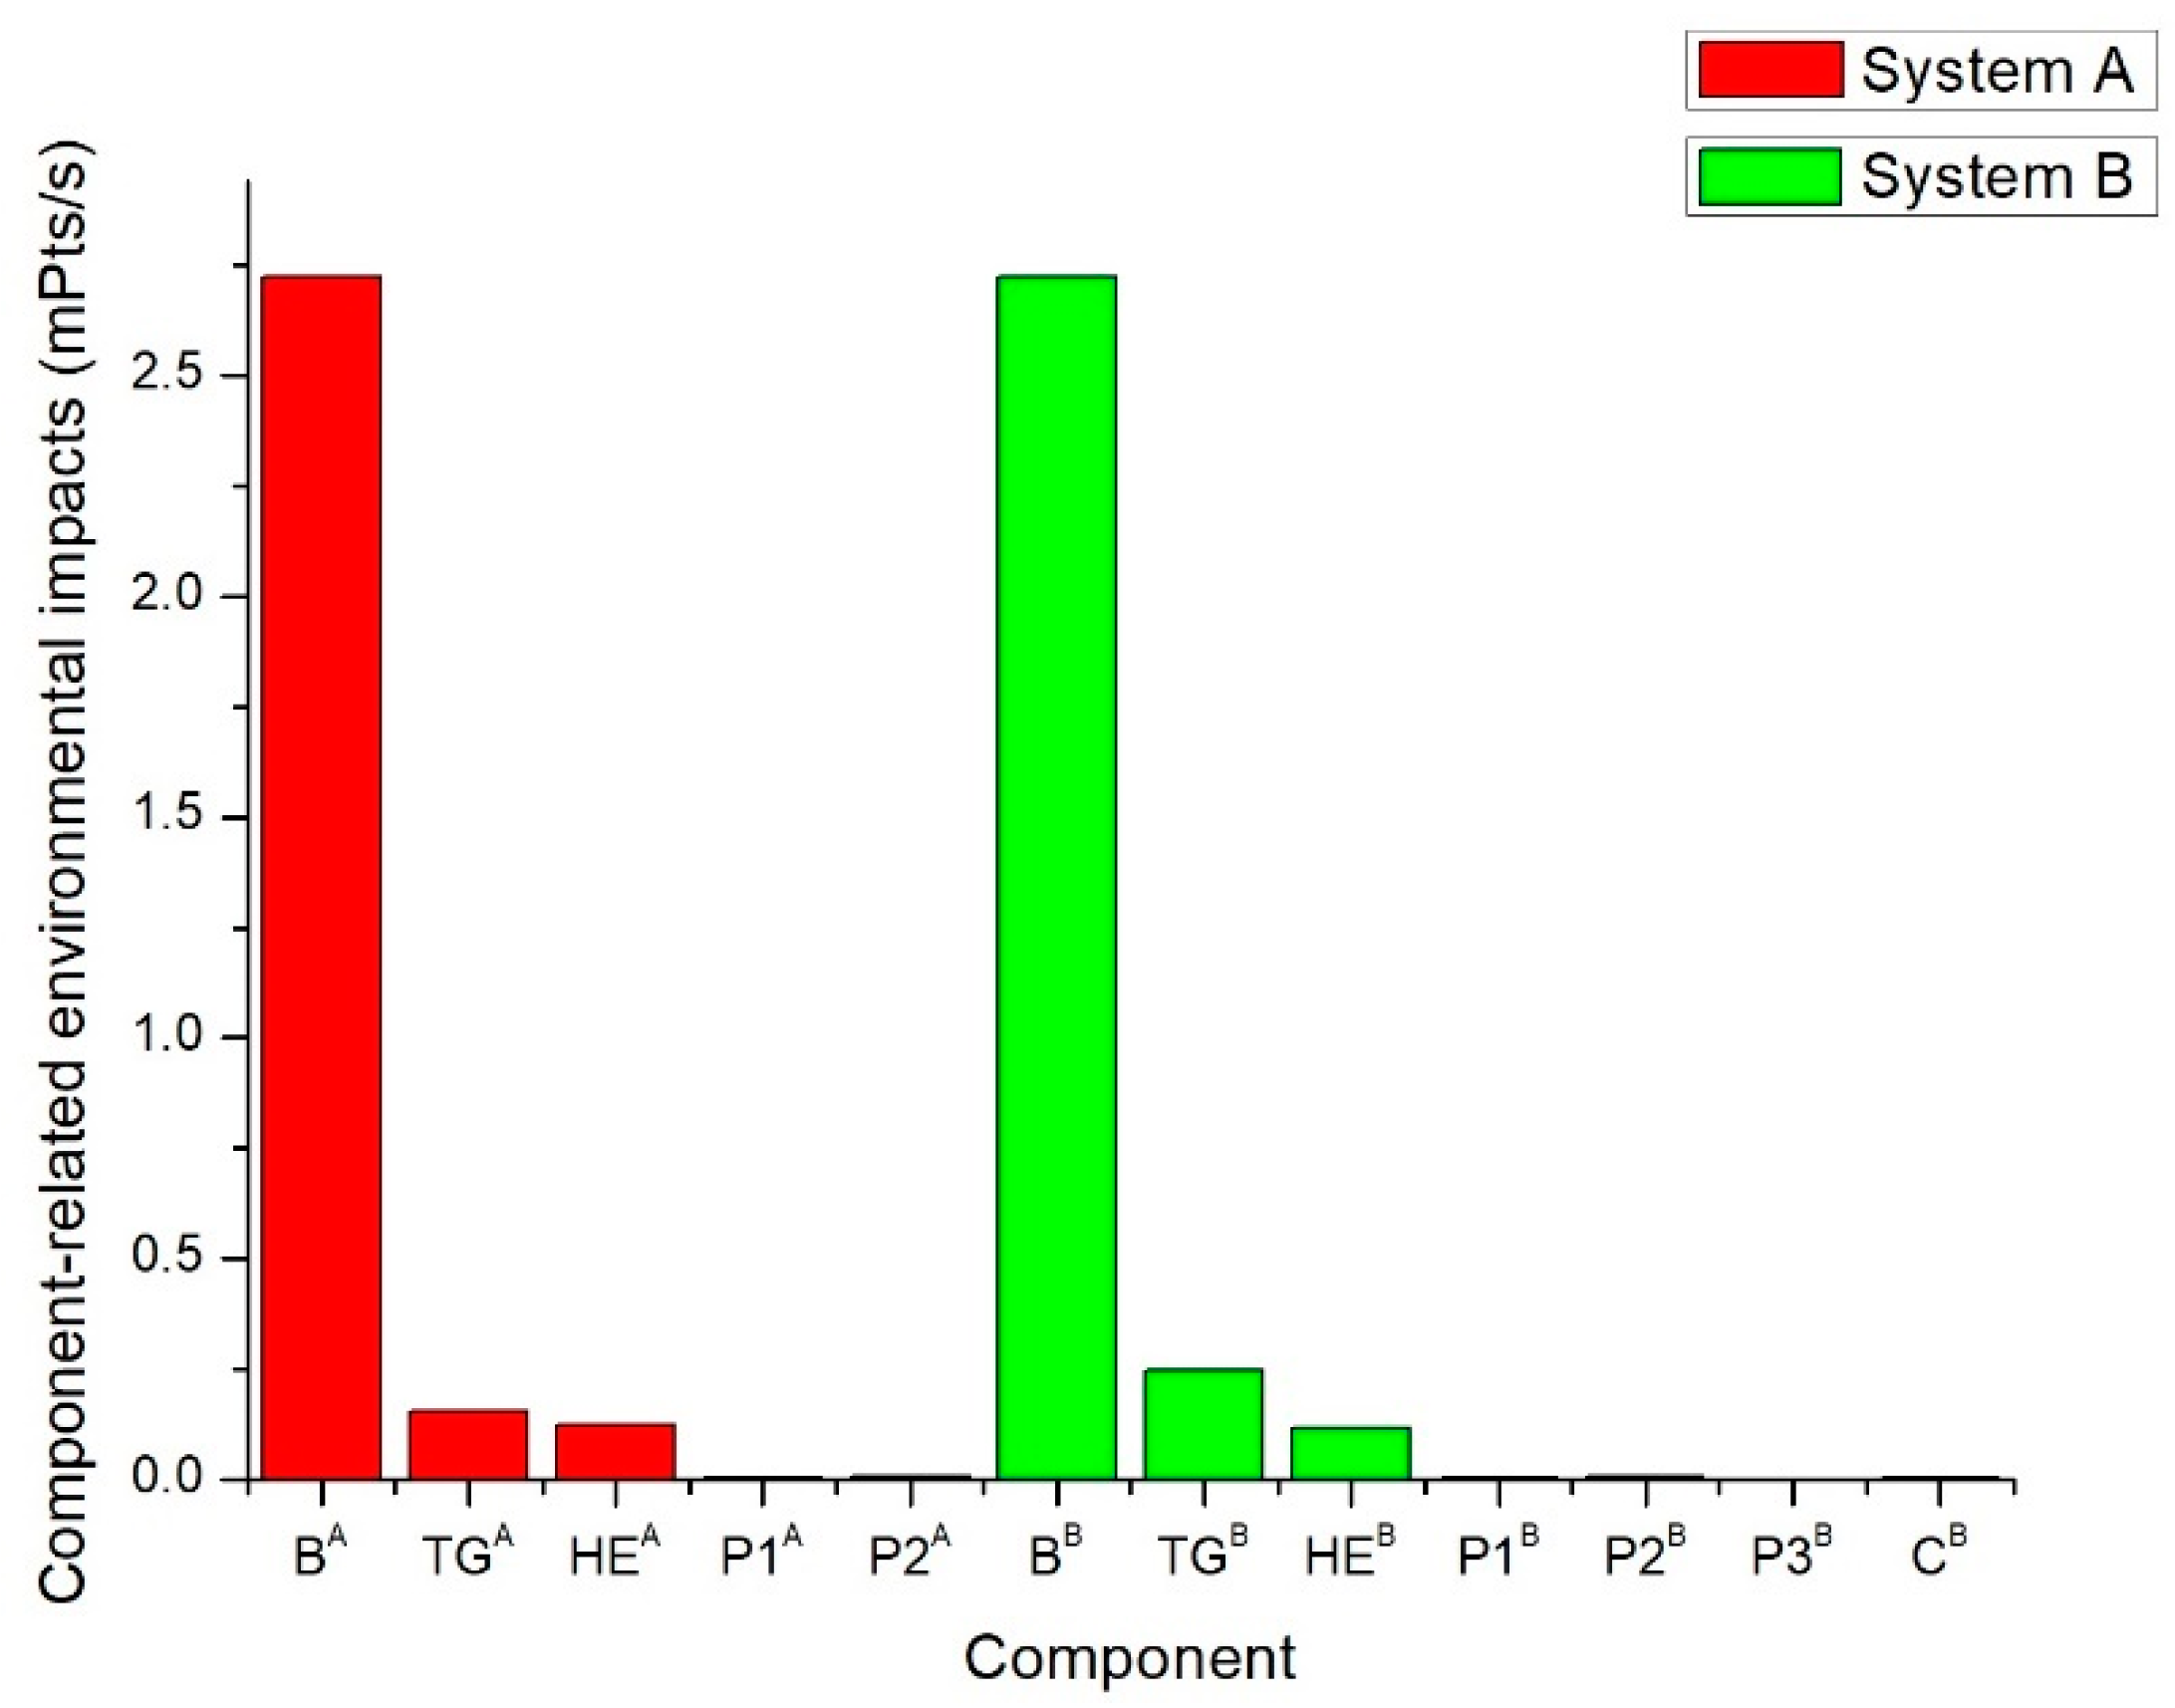
Relatively speaking, the component-related environmental impacts are quite small or can even be negligible, which are shown in Figure 7. The values of the two boilers are significantly greater than those of the other components’ values, and the pumps and the condenser have extremely low values. This variable is influenced mainly by the equipment’s weight and the material’s composition. In practice, the boilers account for the largest portion, both in weight and volume, and their structure is also the most complex, leading to large environmental impacts in the delivery and installation processes. The second and third largest component-related environmental impacts occur in the turbo-generators and heat exchangers, but they are also not comparable to the boilers.

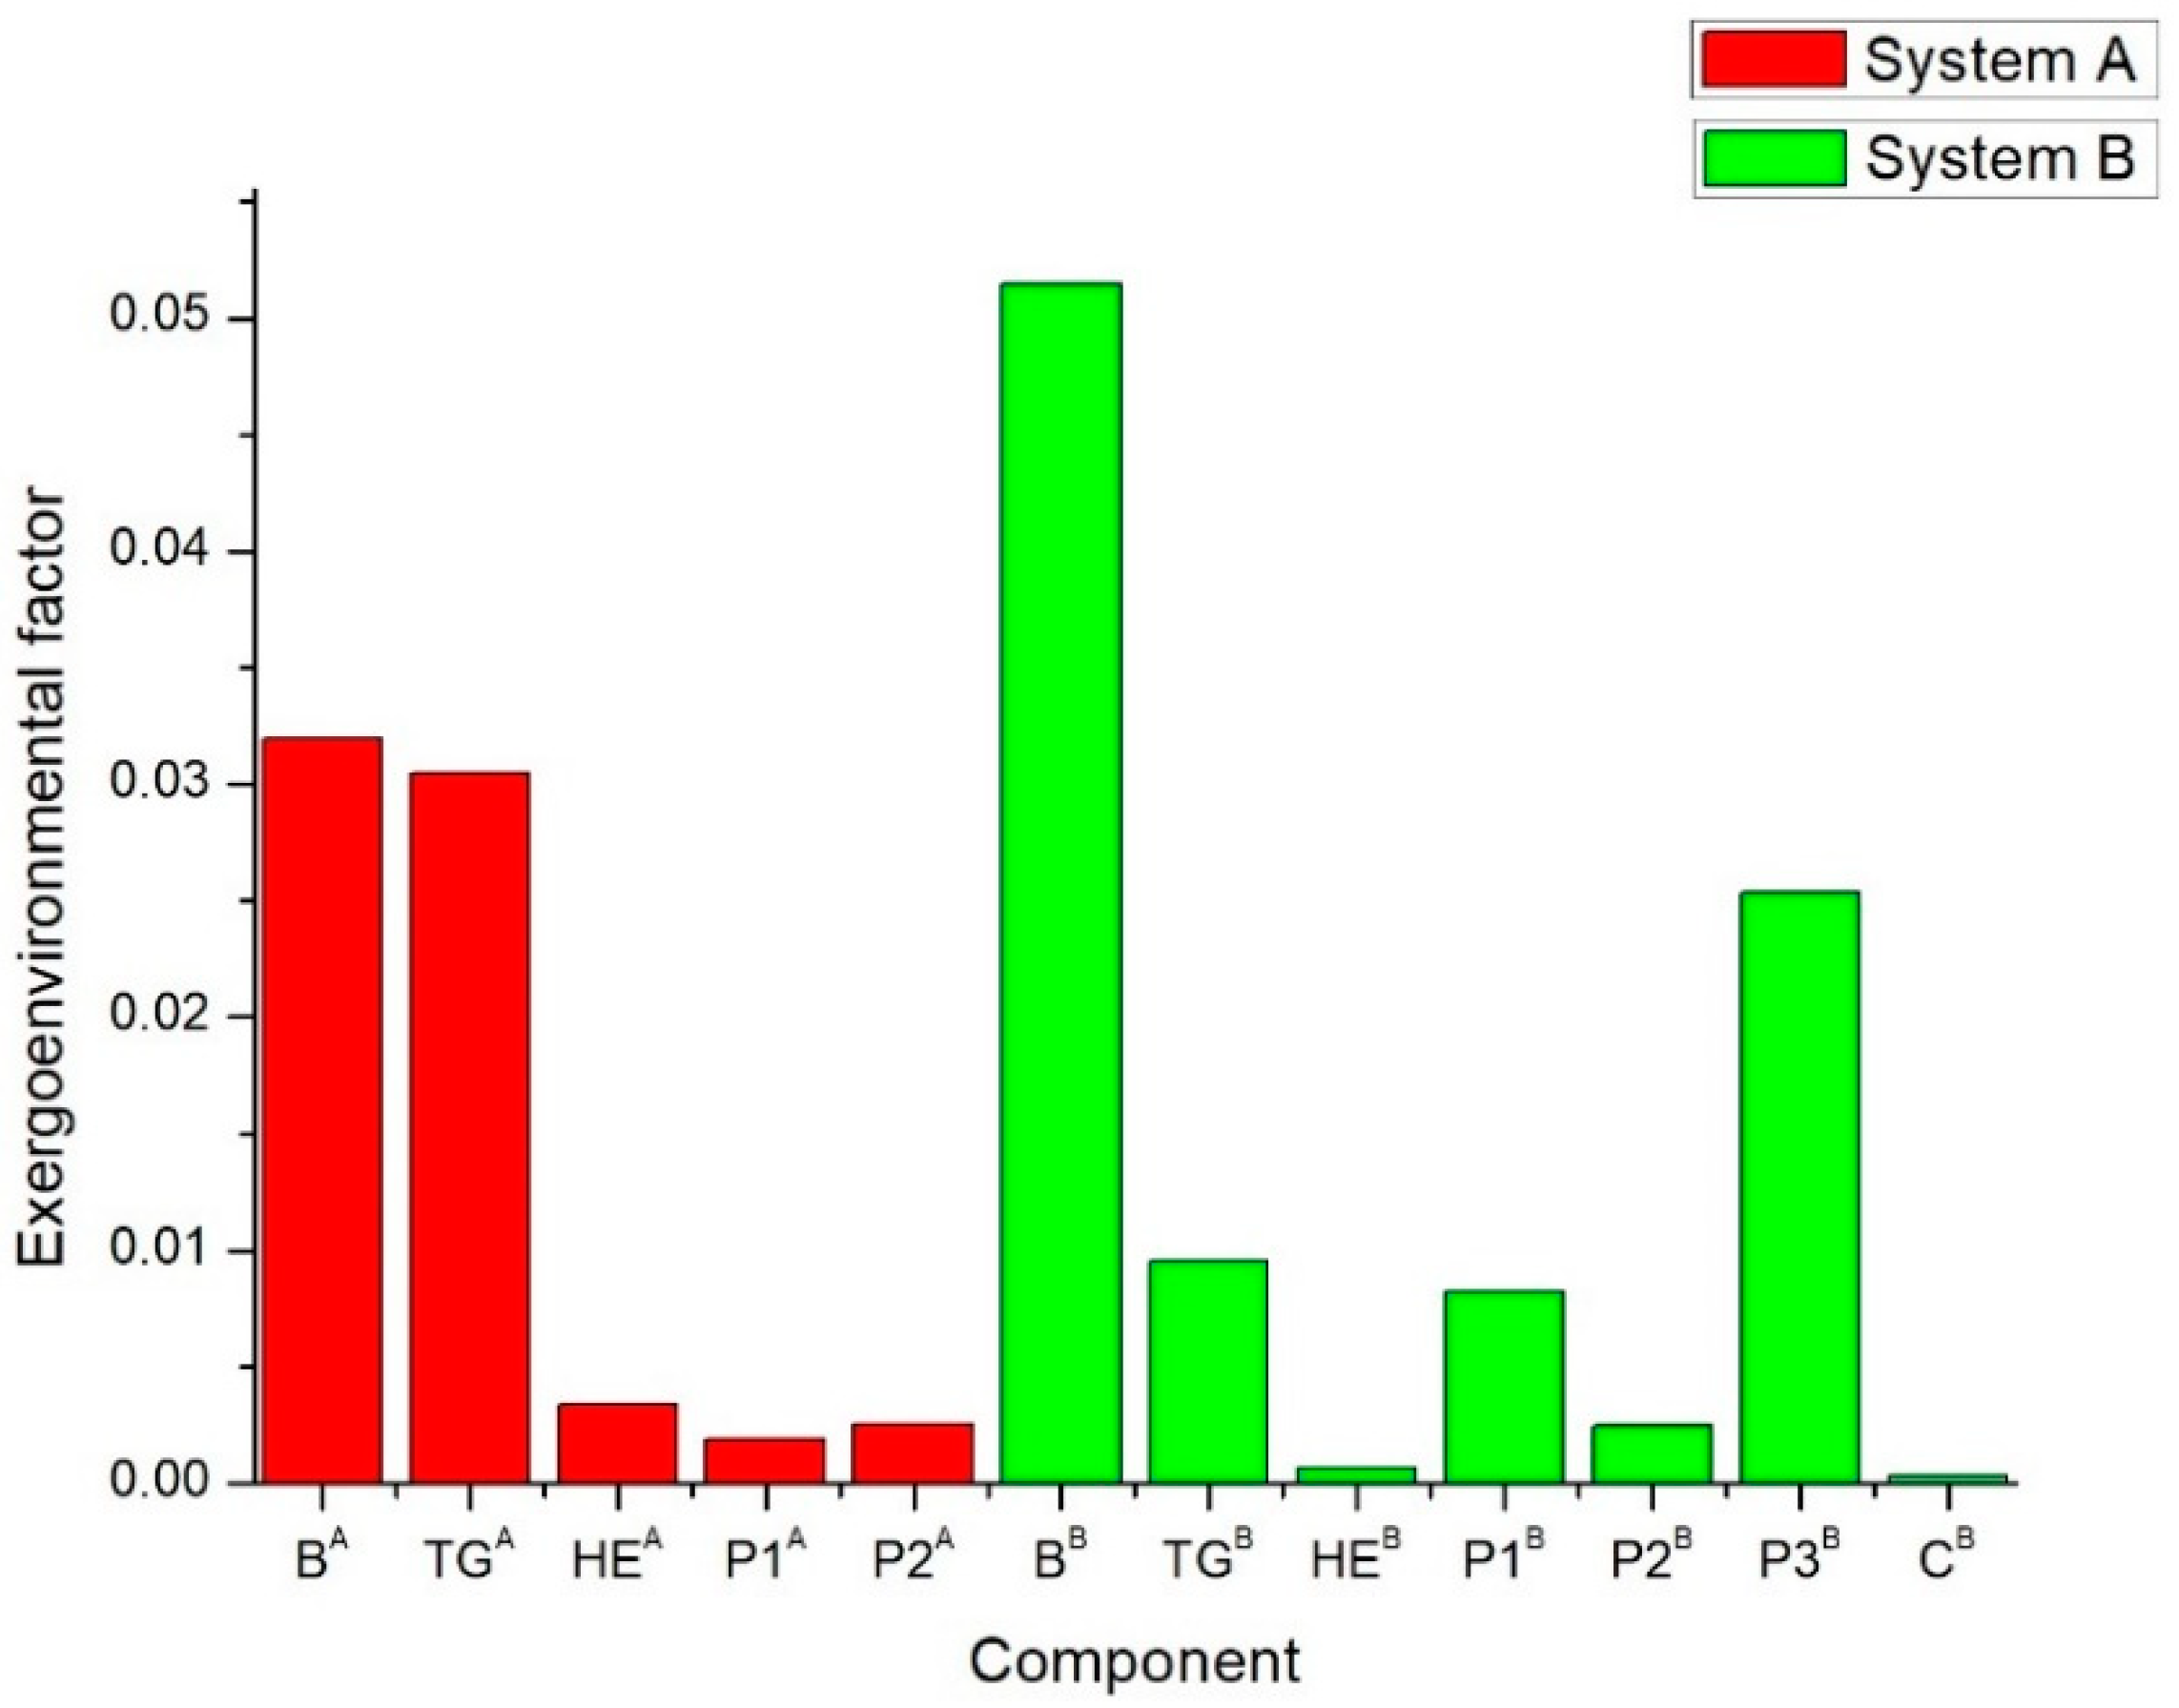
4.3.4. Exergoenvironmental Factor

The exergoenvironmental factor presents the proportions of the component-related impacts and the exergy destruction impacts (shown in Figure 8). It is obvious that exergy destruction is the main cause of environmental impacts for all the components, and all exergoenviromental factors are below 0.1. Therefore, it is certain that efforts to improve environmental performance should focus on enhancing the components’ exergy efficiencies. It should be noted that, except for the newly added turbo-generators, components in the two systems are unchanged in the retrofit process. Because the component-related environmental impacts are fixed, a higher environmental factor indicates better performance. On the whole, the exergoenvironmental factors of system A and system B are 0.023 and 0.011, respectively.

4.4. Comprehensive Performance

In the RCA method, the relative importance is determined by consulting experts and following government policies. With increasing environmental awareness, it is widely believed that environmental performance is far more important than economic performance (r = 1.6), and economic performance is a bit more important than thermodynamic performance (r = 1.2). Therefore, the weightings in the DHI are determined and can be given as:
D H I = 0.47 ε + 0.29 f c + 0.24 f b
The analytic hierarchy process (AHP) method provides a rational framework for a needed decision by quantifying its criteria and alternative options and for relating those elements to the overall goal. RCA is an advanced method developed from the conventional AHP, which can be used to determine subjective weights. The three weights in Equation (24) partly depend on government policy requirements and expertise, but a single subjective method may lead to unrealistic results. Bringing an objective method into the decision-making process can remedy the problem.
Finally, the DHIs of system A and system B are 0.21 and 0.19, respectively. According to the larger desirable responses of ε, fc, and fb, the comprehensive performance of system A is better than system B’s, and at the same time, the BPST is more suitable than the EST for the heat-oriented CHP system in this paper.
To our knowledge, the BPST is inflexible in operation, and its power output is influenced by the heat supply. The systems in this study operated under a constant heating load for buildings, with no need for dynamic regulation. As a result, the BPST had a better performance by virtue of its simple structure and stability in this study. However, the EST would surpass the BPST once the systems operated under dynamic heating loads. This should be demonstrated by future studies.

4.5. Limitations and Future Directions

4.5.1. Some Assumptions

Compared with previous studies, this paper is based on an actual district heating system rather than simulation models. However, there are also some assumptions for the feasible solution. First, the heat dissipation of heating pipe networks is not taken into account. Considering the very long length of the heating supply pipelines, leakage is inevitable, and the proportion of heat loss is around 5.2%. This assumption could lead to a reduction in exergy costs and environmental impacts, as well as higher exergy efficiencies.
Second, the system operation is steady, and the equipment is in rated running conditions. In fact, the heating demand of buildings changes with the changing outdoor air temperature, but the relationship between the changing heating load and the comprehensive system’s performance is not explored in this study. This assumption made the results not related to time, which could not reflect the indicators’ real changes over a long period of time. Therefore, we cannot find the optimal state of the running system in this study. Dynamic studies on this kind of system are urgently needed, especially on the changes of key indicators under different thermal loads.
Third, the pressure loss in the components is also not taken into account, which may influence the specific exergy at each state point. This assumption could lead to a higher exergy efficiency and a lower cost. To some extent, these assumptions affect the accuracy of the analyses but have been demonstrated to be reasonable in this research field [33] and also in this study.

4.5.2. Allocation Principles of the Costs and Environmental Impacts

The auxiliary equations in the exergoeconomic and exergoenvironmental analyses are constructed based on two aforementioned principles. The problem here is that the costs per exergy unit with different temperatures are constant, such as c3 = c4, and it is contradictory to the basic economic principle that a higher temperature energy flow has a higher price. The same problem also exists in the exergoenviromental analysis. To our knowledge, there is no better method now for allocation, and this study still uses the conventional allocation method. To improve the accuracy of the results, a new cost and environmental impact allocation method needs to be proposed in future studies.
As for their impact, the conventional methods cannot reflect the variation of the unit exergy cost along with the energy quality and often lead to an unreasonable result that the price of low-grade energy is higher than that of high-grade. It is more reasonable that the unit exergy cost of power is higher than that of heat, but in this study, some results were unrealistic, such as c5 < c6.

4.5.3. Back-pressure Steam Turbine or Extraction Steam Turbine

The BPST and the EST are both common in Rankin CHP systems. Because steam can be extracted from the turbine before flowing through the last stage, the EST has an advantage in the flexibility of heat supply [34]. Moreover, extracted steam can be used to improve the efficiency of a Rankin cycle. However, the exergy efficiency of the BPST is found to be 20.5% higher than that of the EST in this study. To understand this disparity, we must keep in mind that the two systems operate in standard conditions where the heating load of buildings is constant. Therefore, the finding that the BPST is more suitable than the EST for district heating is limited. Their performance with the dynamic heating load should be investigated in future studies.

5. Conclusions

There are plenty of conventional coal-fired district heating plants that urgently need to be retrofitted into CHP systems to save energy. The aim of this study is to provide a reference point for them based on an actual project rather than on the simulation models in previous studies. Three conclusions are drawn as follows.
First, the exergy efficiency of system A is higher than that of system B, which indicates the better thermodynamic performance of system A. System B has better economic performance than system A, demonstrated by the fact that the exergoeconomic factor of system B is larger than that of system A. The exergoenvironmental factors of system A and system B are 0.023 and 0.011, and the higher value of 0.023 means the better environmental performance of system A.
Second, the proposed evaluation method, focusing more on environmental performance, is validated through this case study. System A is better than system B in the comprehensive performance because system A’s DHI (0.21) is higher than system B’s (0.19).
Third, the BPST has a better effect than the EST on the comprehensive operation performance of the retrofitted heat-oriented CHP system for district heating in this study.

Author Contributions

Conceptualization, D.C.; methodology, D.C.; software, D.C.; validation, D.C.; formal analysis, D.C. and Y.L.; investigation, D.C., Y.L., and L.Z.; resources, H.Z.; data curation, X.L.; writing—original draft preparation, D.C. and M.A.; writing—review and editing, D.C. and M.A.; visualization, D.C.; supervision, X.L. and L.Z.; project administration, H.Z.; funding acquisition, H.Z. All authors have read and agreed to the published version of the manuscript.

Funding

This research was funded by the Scientific Research Fund of China Academy of Building Research, grant number 20221201330730001.

Data Availability Statement

The data presented in this study are available on request from the corresponding author.

Acknowledgments

The authors acknowledge the workers in the surveys who made contributions to this study.

Conflicts of Interest

The authors declare no conflict of interest.

Nomenclature

Abbreviations
CHPcombined heat and power
BPSTback-pressure steam turbine
ESTextraction steam turbine
CWScoal water slurry
CRFcapital recovery factor
DHIdistrict heating index
RCArank correlation analysis
Bboiler
TGturbo-generator
HEheat exchanger
Ppump
Ccondenser
AHPanalytic hierarchy process
Symbols
QLlow calorific value of coal (kJ)
Cpercentage of carbon in coal (%)
Hpercentage of hydrogen in coal (%)
Opercentage of oxygen in coal (%)
Npercentage of nitrogen in coal (%)
Spercentage of sulfur in coal (%)
Wpercentage of water in CWS (%)
eexergy (kJ/kg)
henthalpy (kJ/kg)
sentropy (kJ/(kg·K))
Ttemperature (K)
E ˙ exergy rate (MW)
M ˙ mass flow rate (kg/s)
εexergy efficiency (%)
Z ˙ levelized cost (USD/s)
Zcapital cost (USD)
αmaintenance coefficient
Haannual operation hours (h)
idiscount rate (%)
nlife cycle (yr)
C ˙ cost rate (USD/s)
ccost per exergy unit (USD/GJ)
fcexergoeconomic factor
Y ˙ environmental impact of component (mPts/s)
B ˙ environmental impact rate (mPts/s)
benvironmental impact per exergy unit (mPts/GJ)
rerelative environmental impact difference
fbexergoenvironmental factor
ωweighting in DHI
rrelative importance
aevaluation factor
Superscripts
yas-received basis
COconstruction
OMoperation and maintenance
DIdisposal
Subscripts
0ambient condition
kkth conponent
Ffuel
Pproduct
Ddestruction
jjth evaluation factor

References

  1. Chang, C.; Zhu, N.; Yang, K.; Yang, F. Data and analytics for heating energy consumption of residential buildings: The case of a severe cold climate region of China. Energy Build. 2018, 172, 104–115. [Google Scholar] [CrossRef]
  2. Wang, R.; Lu, S. A novel method of building climate subdivision oriented by reducing building energy demand. Energy Build. 2020, 216, 109999. [Google Scholar] [CrossRef]
  3. Lee, D.; Jeong, H.J.; Ji, H.Y.; Park, S.Y.; Chung, D.Y.; Kang, C.; Kim, K.M.; Park, D. Peak load shifting control on hot water supplied from district heating using latent heat storage system in apartment complex. Case Stud. Therm. Eng. 2022, 34, 101993. [Google Scholar]
  4. Zheng, G.; Li, F.; Tian, Z.; Zhu, N.; Li, Q.; Zhu, H. Operation strategy analysis of a geothermal step utilization heating system. Energy 2012, 44, 458–468. [Google Scholar] [CrossRef]
  5. Qin, J.; Hu, E.; Li, X. Solar aided power generation: A review. Energy Built. Environ. 2020, 1, 11–26. [Google Scholar] [CrossRef]
  6. Yao, G.; Chen, Y.; Lin, Y.; Wang, T. Energy-saving design strategies of zero-energy solar buildings—A Case Study of the Third Solar Decathlon China. Buildings 2023, 13, 405. [Google Scholar] [CrossRef]
  7. Dong, J.; Li, Y.; Zhang, W.; Zhang, L.; Lin, Y. Impact of residential building heating on natural gas consumption in the south of China: Taking Wuhan city as example. Energy Built Environ. 2020, 1, 376–384. [Google Scholar] [CrossRef]
  8. Liu, H.; Geng, Z.; Gu, Y.; Mo, Z.; Yu, Z.; He, X.; Lu, S. A regional integrated energy system with a coal-fired CHP plant, screw turbine and solar thermal utilization: Scenarios for China. Energy Conv. Manag. 2020, 212, 112812. [Google Scholar] [CrossRef]
  9. Cai, B.; Li, H.; Hu, Y.; Zhang, G. Operation strategy and suitability analysis of CHP system with heat recovery. Energy Build. 2017, 141, 284–294. [Google Scholar] [CrossRef]
  10. Maldague, P.E. Combined Heat and Power (CHP) vs seperate Heat and Power (SHP) generation for primary energy conservation. J. Heat Recovery Syst. 1984, 4, 337–340. [Google Scholar] [CrossRef]
  11. Smith, M.A.; Few, P.C. Second law analysis of an experimental domestic scale co-generation plant incorporating a heat pump. Appl. Therm. Eng. 2001, 21, 93–110. [Google Scholar] [CrossRef]
  12. Akkaya, A.V.; Sahin, B.; Erdem, H.H. An analysis of SOFC/GT CHP system based on exergetic performance criteria. Int. J. Hydrog. Energy 2008, 33, 2566–2577. [Google Scholar] [CrossRef]
  13. Liao, C.H.; Zhou, Z.G.; Zhao, J.N. Thermodynamic analysis of minimum extraction ratio for coal-fired CHP plants. Appl. Mech. Mater. 2014, 472, 1052–1056. [Google Scholar] [CrossRef]
  14. Holmberg, H.; Ahtila, P. The thermal analysis of a combined heat and power plant undergoing Clausius-Rankine cycle based on the theory of effective heat-absorbing and heat-emitting temperatures. Appl. Therm. Eng. 2014, 70, 977–987. [Google Scholar] [CrossRef]
  15. Kumar, R. A critical review on energy, exergy, exergoeconomic and economic (4-E) analysis of thermal power plants. Eng. Sci. Technol. 2017, 20, 283–292. [Google Scholar] [CrossRef] [Green Version]
  16. Chen, H.; Xiao, Y.; Xu, G.; Xu, J.; Yao, X.; Yang, Y. Energy-saving mechanism and parametric analysis of the high back-pressure heating process in a 300 MW coal-fired combined heat and power unit. Appl. Therm. Eng. 2019, 149, 829–840. [Google Scholar] [CrossRef]
  17. Zhang, L.; Kong, C.; Yang, T. Performance analysis of turbine extraction superheat utilization schemes of built power plant. Energy Rep. 2020, 6, 2200–2210. [Google Scholar] [CrossRef]
  18. Ahmadi, M.M.; Keyhani, A.; Kalogirou, S.A.; Lam, S.S.; Peng, W.; Tabatabaei, M.; Aghbashlo, M. Net-zero exergoeconomic and exergoenvironmental building as new concepts for developing sustainable built environments. Energy Conv. Manag. 2021, 244, 114418. [Google Scholar] [CrossRef]
  19. Gao, J.; Zhang, Q.; Wang, X.; Song, D.; Liu, W.; Liu, W. Exergy and exergoeconomic analyses with modeling for CO2 allocation of coal-fired CHP plants. Energy 2018, 152, 562–575. [Google Scholar] [CrossRef]
  20. Meyer, L.; Tsatsaronis, G.; Buchgeister, J.; Schebek, L. Exergoenvironmental analysis for evaluation of the environmental impact of energy conversion systems. Energy 2009, 34, 75–89. [Google Scholar] [CrossRef]
  21. Keçebaş, A. Exergoenvironmental analysis for a geothermal district heating system: An application. Energy 2016, 94, 391–400. [Google Scholar] [CrossRef]
  22. Cavalcanti, E.J.C. Exergoeconomic and exergoenvironmental analyses of an integrated solar combined cycle system. Renew. Sust. Energ. Rev. 2017, 67, 507–519. [Google Scholar] [CrossRef]
  23. Wang, W.; Wang, J.; Lu, Z.; Wang, S. Exergoeconomic and exergoenvironmental analysis of a combined heating and power system driven by geothermal source. Energy Conv. Manag. 2020, 211, 112765. [Google Scholar]
  24. Tol, H.I.; Desmedt, J.; Salenbien, R. A novel demand-responsive control strategy for district heating systems, featuring return temperature reduction. Energy Built Environ. 2021, 2, 105–125. [Google Scholar] [CrossRef]
  25. Yan, S.; Wang, W. Estimation of solid and liquid fuel chemical exergy. J. North China Inst. Water Conserv. Hydroelectr. Power 1999, 20, 53–55. [Google Scholar]
  26. Boyaghchi, F.A.; Heidarnejad, P. Thermoeconomic assessment and multi-objective optimization of a solar micro CCHP based on Organic Rankine Cycle for domestic application. Energy Conv. Manag. 2015, 97, 224–234. [Google Scholar] [CrossRef]
  27. Bejan, A.; Tsatsaronis, G.; Moran, M. Thermal Design and Optimization, 1st ed.; Wiley-Interscience: New York, NY, USA, 1995; pp. 11–21. [Google Scholar]
  28. Ghaebi, H.; Amidpour, M.; Karimkashi, S.; Rezayan, O. Energy, exergy and thermoeconomic analysis of a combined cooling, heating and power (CCHP) system with gas turbine prime mover. Int. J. Energy Res. 2011, 35, 697–709. [Google Scholar] [CrossRef]
  29. Yang, K.; Zhu, N.; Ding, Y.; Chang, C.; Wang, D.; Yuan, T. Exergy and exergoeconomic analyses of a combined cooling, heating, and power (CCHP) system based on dual-fuel of biomass and natural gas. J. Clean Prod. 2019, 206, 893–906. [Google Scholar] [CrossRef]
  30. Lozano, M.A.; Valero, A. Theory of the exergetic cost. Energy 1993, 18, 939–960. [Google Scholar] [CrossRef]
  31. Omrany, H.; Soebarto, V.; Zuo, J.; Sharifi, E.; Chang, R. What leads to variations in the results of life-cycle energy assessment? An evidence-based framework for residential buildings. Energy Built Environ. 2021, 2, 392–405. [Google Scholar] [CrossRef]
  32. Yang, K.; Ding, Y.; Zhu, N.; Yang, F.; Wang, Q. Multi-criteria integrated evaluation of distributed energy system for community energy planning based on improved grey incidence approach: A case study in Tianjin. Appl. Energy 2018, 229, 352–363. [Google Scholar] [CrossRef]
  33. Ibrahim, T.K.; Mohammed, M.K.; Awad, O.I.; Abdalla, A.N.; Basrawi, F.; Mohammed, M.N.; Najafi, G.; Mamat, R. A comprehensive review on the exergy analysis of combined cycle power plants. Renew. Sust. Energ. Rev. 2018, 90, 835–850. [Google Scholar] [CrossRef]
  34. Medina-Flores, J.M.; Picón-Núñez, M. Modelling the power production of single and multiple extraction steam turbines. Chem. Eng. Sci. 2010, 65, 2811–2820. [Google Scholar] [CrossRef]
Figure 1. Schematic diagrams of system A (a) and system B (b).
Energies 16 04539 g001
Figure 2. Exergy efficiencies of the components in system A and system B.
Energies 16 04539 g002
Figure 3. Proportions of the components’ exergy destruction in the total loss.
Energies 16 04539 g003
Figure 4. Exergoeconomic factor of each component.
Energies 16 04539 g004
Figure 5. Relative difference of each component.
Energies 16 04539 g005
Figure 6. Environmental impacts of exergy destruction in each component.
Energies 16 04539 g006
Figure 7. Component-related environmental impacts in each component.
Energies 16 04539 g007
Figure 8. Exergoenvironmental factor of each component.
Energies 16 04539 g008
Table 1. Exergy analyses of system A and system B.
Component E F ˙ E P ˙ E D ˙ ε
System ABoiler E 1 ˙ + E 2 ˙ E 3 ˙ E 7 ˙ E 1 ˙ + E 2 ˙ + E 7 ˙ E 3 ˙ E 13 ˙ E 3 ˙ E 7 ˙ E 1 ˙ + E 2 ˙
Turbo-generator E 3 ˙ E 4 ˙ E 5 ˙ E 3 ˙ E 5 ˙ E 4 ˙ E 5 ˙ E 3 ˙ E 4 ˙
Heat exchanger E 4 ˙ E 6 ˙ E 9 ˙ E 8 ˙ E 4 ˙ + E 8 ˙ E 9 ˙ E 6 ˙ E 9 ˙ E 8 ˙ E 4 ˙ E 6 ˙
Pump 1 E 11 ˙ E 7 ˙ E 6 ˙ E 11 ˙ + E 6 ˙ E 7 ˙ E 7 ˙ E 6 ˙ E 11 ˙
Pump 2 E 12 ˙ E 8 ˙ E 10 ˙ E 12 ˙ + E 10 ˙ E 8 ˙ E 8 ˙ E 10 ˙ E 12 ˙
System BBoiler E 1 ˙ + E 2 ˙ E 3 ˙ E 7 ˙ E 1 ˙ + E 2 ˙ + E 7 ˙ E 3 ˙ E 20 ˙ E 3 ˙ E 7 ˙ E 1 ˙ + E 2 ˙
Turbo-generator E 3 ˙ E 4 ˙ E 11 ˙ E 5 ˙ E 3 ˙ E 5 ˙ E 4 ˙ E 11 ˙ E 5 ˙ E 3 ˙ E 4 ˙ E 11 ˙
Heat exchanger E 4 ˙ E 6 ˙ E 9 ˙ E 8 ˙ E 4 ˙ + E 8 ˙ E 9 ˙ E 6 ˙ E 9 ˙ E 8 ˙ E 4 ˙ E 6 ˙
Pump 1 E 17 ˙ E 7 ˙ E 14 ˙ E 17 ˙ + E 14 ˙ E 7 ˙ E 7 ˙ E 14 ˙ E 17 ˙
Pump 2 E 18 ˙ E 8 ˙ E 10 ˙ E 18 ˙ + E 10 ˙ E 8 ˙ E 8 ˙ E 10 ˙ E 18 ˙
Pump 3 E 19 ˙ E 13 ˙ E 12 ˙ E 19 ˙ + E 12 ˙ E 13 ˙ E 13 ˙ E 12 ˙ E 19 ˙
Condenser// E 11 ˙ E 12 ˙ /
Table 2. Non-energy cost of each component in system A and system B.
ComponentZ (USD) Z ˙ (USD/s)
System ABoiler2,038,806.00.024
Turbo-generator626,865.70.007
Heat exchanger109,552.20.001
Pump 1247,700.60.003
Pump 2637,800.40.007
System BBoiler2,038,806.00.024
Turbo-generator1,432,835.80.017
Heat exchanger97,029.80.001
Pump 159,700.10.0007
Pump 2637,800.40.007
Pump 322,380.80.0003
Condenser76,607.60.0009
Table 3. Exergy cost balance and auxiliary equations for the components in the two systems.
ComponentCost BalanceAuxiliary Relation
System ABoiler c 1 E 1 ˙ + c 2 E 2 ˙ + c 7 E 7 ˙ + Z b ˙ = c 3 E 3 ˙ + c 13 E 13 ˙ c 2 = c 13 = 0 ;   c 1 E 1 ˙ = 0.5   USD / s
Turbo-generator c 3 E 3 ˙ + Z tg ˙ = c 5 E 5 ˙ + c 4 E 4 ˙ c 3 = c 4 ;   c 5 = c 11
Heat exchanger c 4 E 4 ˙ + c 8 E 8 ˙ + Z he ˙ = c 6 E 6 ˙ + c 9 E 9 ˙ c 8 = c 9
Pump 1 c 11 E 11 ˙ + c 6 E 6 ˙ + Z p 1 ˙ = c 7 E 7 ˙ c 12 = c 11
Pump 2 c 12 E 12 ˙ + c 10 E 10 ˙ + Z p 2 ˙ = c 8 E 8 ˙ c 9 = c 10
System BBoiler c 1 E 1 ˙ + c 2 E 2 ˙ + c 7 E 7 ˙ + Z b ˙ = c 3 E 3 ˙ + c 20 E 20 ˙ c 2 = c 20 = 0 ;   c 1 E 1 ˙ = 0.5   USD / s
Turbo-generator c 3 E 3 ˙ + Z tg ˙ = c 5 E 5 ˙ + c 4 E 4 ˙ + c 11 E 11 ˙ c 3 = c 4 = c 11 ;   c 5 = c 17
Heat exchanger c 4 E 4 ˙ + c 8 E 8 ˙ + Z he ˙ = c 6 E 6 ˙ + c 9 E 9 ˙ c 8 = c 9
Pump 1 c 17 E 17 ˙ + Z p 1 ˙ = c 7 E 7 ˙ c 14 E 14 ˙ c 17 = c 18
Pump 2 c 18 E 18 ˙ + Z p 2 ˙ = c 8 E 8 ˙ c 10 E 10 ˙ c 9 = c 10
Pump 3 c 19 E 19 ˙ + Z p 3 ˙ = c 13 E 13 ˙ c 12 E 12 ˙ c 19 = c 18
Condenser c 11 E 11 ˙ c 12 E 12 ˙ + Z c ˙ = c 16 E 16 ˙ c 15 E 15 ˙ c 16 E 16 ˙ = 0.03   USD / s ;   c 15 = c 16 ;   c 11 = c 12
Table 4. Eco-indicator of materials of system components.
MaterialEco-Indicator (mPts/s)
Steel86
Steel low alloy110
Steel high alloy910
Cast iron240
Copper1400
Aluminum alloy780
Table 5. Environmental impacts of the components in the two systems.
ComponentMaterial CompositionMaterial (mPts/kg)Process (mPts/kg)Disposal (mPts/kg)Weight (t)Total (Pts) Y ˙ (mPts/s)
System ABoilerSteel 20%; Steel high alloy 70%; Steel low alloy 10%; 74520−70705489,9752.722
Turbo-generatorSteel 20%; Steel high alloy 30%; Cast iron 35%; Copper 10%; Aluminium alloy 5%55317−705628,0000.156
Heat exchangerSteel 67%; Copper 33%51912−704922,4400.125
Pump 1Steel 35%; Cast iron 65%18617−7045320.003
Pump 2Steel 35%; Cast iron 65%18617−701013300.007
System BBoilerSteel 20%; Steel high alloy 70%; Steel low alloy 10%;74520−70705489,9752.722
Turbo-generatorSteel 13%; Steel high alloy 37%; Cast iron 30%; Copper 10%; Aluminium alloy 10%63817−707644,4600.247
Heat exchangerSteel 67%; copper 33%51912−704621,2060.118
Pump 1Steel 35%; Cast iron 65%18617−7045320.003
Pump 2Steel 35%; Cast iron 65%18617−701013300.007
Pump 3Steel 35%; Cast iron 65%18617−7033990.002
CondenserSteel 100%8612−70287840.004
Table 6. Environmental impact balance and auxiliary equations for each system component.
ComponentEnvironmental Impact BalanceAuxiliary Relation
System ABoiler b 1 E 1 ˙ + b 2 E 2 ˙ + b 7 E 7 ˙ + Y b ˙ = b 3 E 3 ˙ + b 13 E 13 ˙ b 1 = 1335   mPts / GJ ;
b 2 = b 13 = 0
Turbo-generator b 3 E 3 ˙ + Y tg ˙ = b 5 E 5 ˙ + b 4 E 4 ˙ b 3 = b 4 ;   b 5 = b 11
Heat exchanger b 4 E 4 ˙ + b 8 E 8 ˙ + Y he ˙ = b 6 E 6 ˙ + b 9 E 9 ˙ b 8 = b 9
Pump 1 b 11 E 11 ˙ + b 6 E 6 ˙ + Y p 1 ˙ = b 7 E 7 ˙ b 12 = b 11
Pump 2 b 12 E 12 ˙ + b 10 E 10 ˙ + Y p 2 ˙ = b 8 E 8 ˙ b 9 = b 10
System BBoiler b 1 E 1 ˙ + b 2 E 2 ˙ + b 7 E 7 ˙ + Y b ˙ = b 3 E 3 ˙ + b 20 E 20 ˙ b 1 = 1335   mPts / GJ ;
b 2 = b 20 = 0
Turbo-generator b 3 E 3 ˙ + Y tg ˙ = b 5 E 5 ˙ + b 4 E 4 ˙ + b 11 E 11 ˙ b 3 = b 4 = b 11 ;   b 5 = b 17
Heat exchanger b 4 E 4 ˙ + b 8 E 8 ˙ + Y he ˙ = b 6 E 6 ˙ + b 9 E 9 ˙ b 8 = b 9
Pump 1 b 17 E 17 ˙ + Y p 1 ˙ = b 7 E 7 ˙ b 14 E 14 ˙ b 17 = b 18
Pump 2 b 18 E 18 ˙ + Y p 2 ˙ = b 8 E 8 ˙ b 10 E 10 ˙ b 9 = b 10
Pump 3 b 19 E 19 ˙ + Y p 3 ˙ = b 13 E 13 ˙ b 12 E 12 ˙ b 19 = b 18
Condenser b 11 E 11 ˙ b 12 E 12 ˙ + Y c ˙ = b 16 E 16 ˙ b 15 E 15 ˙ b 15 = b 16 = 0 ;   b 11 = b 12 ;
Table 7. Values of relative importance of adjacent factors.
rjMeaning
1.0aj−1 is as important as aj
1.2aj−1 is a bit more important than aj
1.4aj−1 is more important than aj
1.6aj−1 is far more important than aj
1.8aj−1 is extremely more important than aj
Table 8. State properties of system A and B.
State PointT (°C)p (kPa) M ˙ (kg/s) E ˙ (MW)
System A15.0101.33.61110.870
25.0101.354.810.000
3435.04900.040.2856.044
4288.0980.040.2818.617
5///36.000
6178.9980.040.286.400
7179.14900.040.286.967
833.1400.0994.105.735
943.0400.0994.1010.441
1033.0100.0994.103.951
11///1.000
12///2.550
135.0101.358.420.000
System B15.0101.33.61110.870
25.0101.354.810.000
3450.04900.054.9277.982
4265.0981.033.3334.420
5///30.000
6179.1981.033.335.554
7121.64900.054.924.711
833.1400.0994.105.735
943.0400.0994.1010.441
1033.0100.0994.103.951
1129.34.121.594.336
1229.34.121.590.085
1329.5981.021.590.124
14121.4981.054.924.480
155.0101.3833.220.000
1620.0101.3833.221.157
17///0.330
18///2.550
19///0.060
205.0101.358.420.000
Table 9. Cost per exergy unit at each point.
State PointExergy Cost (USD/GJ)
System Ac14.49
c20.00
c313.12
c413.12
c513.77
c631.14
c730.61
c810.11
c910.11
c1010.11
c1113.77
c1213.77
c130.00
System Bc14.51
c20.00
c36.80
c46.80
c59.47
c628.10
c71.28
c818.32
c918.32
c1018.32
c116.80
c126.80
c1333.43
c140.49
c1525.47
c1625.47
c179.47
c189.47
c199.47
c200.00
Table 10. Environmental impacts per exergy unit.
State PointEnvironmental Impacts (mPts/GJ)
System Ab11335
b20
b33477
b43477
b53617
b66287
b76365
b85228
b95228
b105228
b113617
b123617
b130
System Bb11335
b20
b32791
b42791
b53665
b612,662
b716,706
b85609
b95609
b105609
b112791
b122791
b133826
b1416,204
b150
b160
b173665
b183665
b193665
b200
Disclaimer/Publisher’s Note: The statements, opinions and data contained in all publications are solely those of the individual author(s) and contributor(s) and not of MDPI and/or the editor(s). MDPI and/or the editor(s) disclaim responsibility for any injury to people or property resulting from any ideas, methods, instructions or products referred to in the content.

