Article

Investigation of Different Rotational Speed Characteristics of Multistage Axial Compressor in CAES System

1
Institute of Engineering Thermophysics, Chinese Academy of Sciences, Beijing 100190, China
2
University of Chinese Academy of Sciences, Beijing 100049, China
3
National Energy Large Scale Physical Energy Storage Technologies R&D Center of Bijie High-Tech Industrial Development Zone, Bijie 551712, China
*
Author to whom correspondence should be addressed.
Energies 2023, 16(11), 4383; https://doi.org/10.3390/en16114383
Submission received: 7 March 2023 / Revised: 15 April 2023 / Accepted: 20 April 2023 / Published: 29 May 2023

Abstract

:
An axial compressor has high efficiency under design conditions, but its stable working range is narrow. Adjusting the rotational speed can effectively expand the stable working range. In this paper, a five-stage axial compressor for a specific compressed air energy storage (CAES) system is taken as the research object, and different rotational speed (DRS) characteristics are studied with NUMECA software. Firstly, the influence of DRS on overall aerodynamic performance is explored, and the working flow range of the compressor is increased from 11.5% to 54.0%. Secondly, the effect of DRS on inlet parameters of the first stage rotor is analyzed, and the reasonable distribution of inlet parameters is obtained. Thirdly, the changing law of the internal flow is investigated at DRS. The corner separation is gradually enhanced when the rotational speed increases, and the leakage flow velocity at the rotor tip gradually improves. Finally, the loss distribution of tip clearance is researched. The result shows that the loss distribution increases significantly in both circumferential and spanwise directions when the speed increases. This work aims to provide a reference for the stable and efficient operation of axial compressors in CAES systems under the wide working range.

1. Introduction

Energy storage is a key supporting technology for the energy revolution, which can effectively improve the utilization rate of renewable energy and ensure the efficiency, security and economy of the regional energy system [1,2,3]. Compressed air energy storage (CAES) technology, as one of the large-scale physical energy storage technologies, has a broad development prospect due to its large energy storage capacity and long energy storage time [4,5]. Multistage axial compressor technology is the key technology of CAES, which requires the compressor to achieve stable and efficient operation in a wide flow range within the specified pressure ratio range. An axial compressor has high efficiency under design conditions, while its stable working range is narrow. Expanding the stable working range of the axial compressor is of great significance to its wide application in the CAES system field, and even to further improve the economy of CAES.
Rotational speed is one of the main parameters to characterize the performance of axial compressors. When the rotational speed changes, the performance and internal flow characteristics of the compressor change accordingly. Researchers have done a lot of investigations on the different rotational speed (DRS) characteristics of axial compressors. The aerodynamic performance of axial compressors is closely related to the speed. The coupling of variable frequency speed regulation and inlet guide vane-stator regulation can significantly improve the pressure ratio and efficiency of compressors under off-design conditions [6,7,8]. The type of axial compressor instability is directly associated with the speed; for low pressure compressors, the form of instability is rotating stall at low speed and surge at high speed [9,10]. The existence of clearance can dramatically affect the aerodynamic performance and stability of axial compressors [11,12,13,14,15,16,17], and the leakage characteristics change at DRS. At high speed, the tip leakage velocity and leakage volume increase, and the leakage flow may be accompanied by transient vortex breakdown [18]. In addition, the rotational speed influences the flow field structure and loss distribution [19]. In the past, the efficient operation of a CAES compressor in a wide working range was generally achieved by joint adjustment of inlet guide vanes and stators/diffusers. There is little practice on different rotational speeds operation of axial compressors in CAES system. Can the compressor operating target in a CAES system be achieved by adjusting the rotational speed of multistage axial compressor? If so, how will the performance and internal flow characteristics change during the adjustment?
Based on the above two issues, the DRS characteristics of a five-stage axial compressor for a specific CAES system are studied numerically. Firstly, the influence of DRS on compressor aerodynamic performance is explored, and the result affirms the stabilization effect of speed adjustment; secondly, the impact of DRS on inlet parameters of the first stage rotor is analyzed; thirdly, changing the law of the internal flow of the third stage rotor is investigated; and finally, the loss distribution of tip leakage flow is researched. This work presents a detailed investigation on the DRS characteristics of a five-stage axial compressor, and the research objective is to provide a reference for the stable and efficient operation of axial compressors in the CAES system.

2. Research Methodology

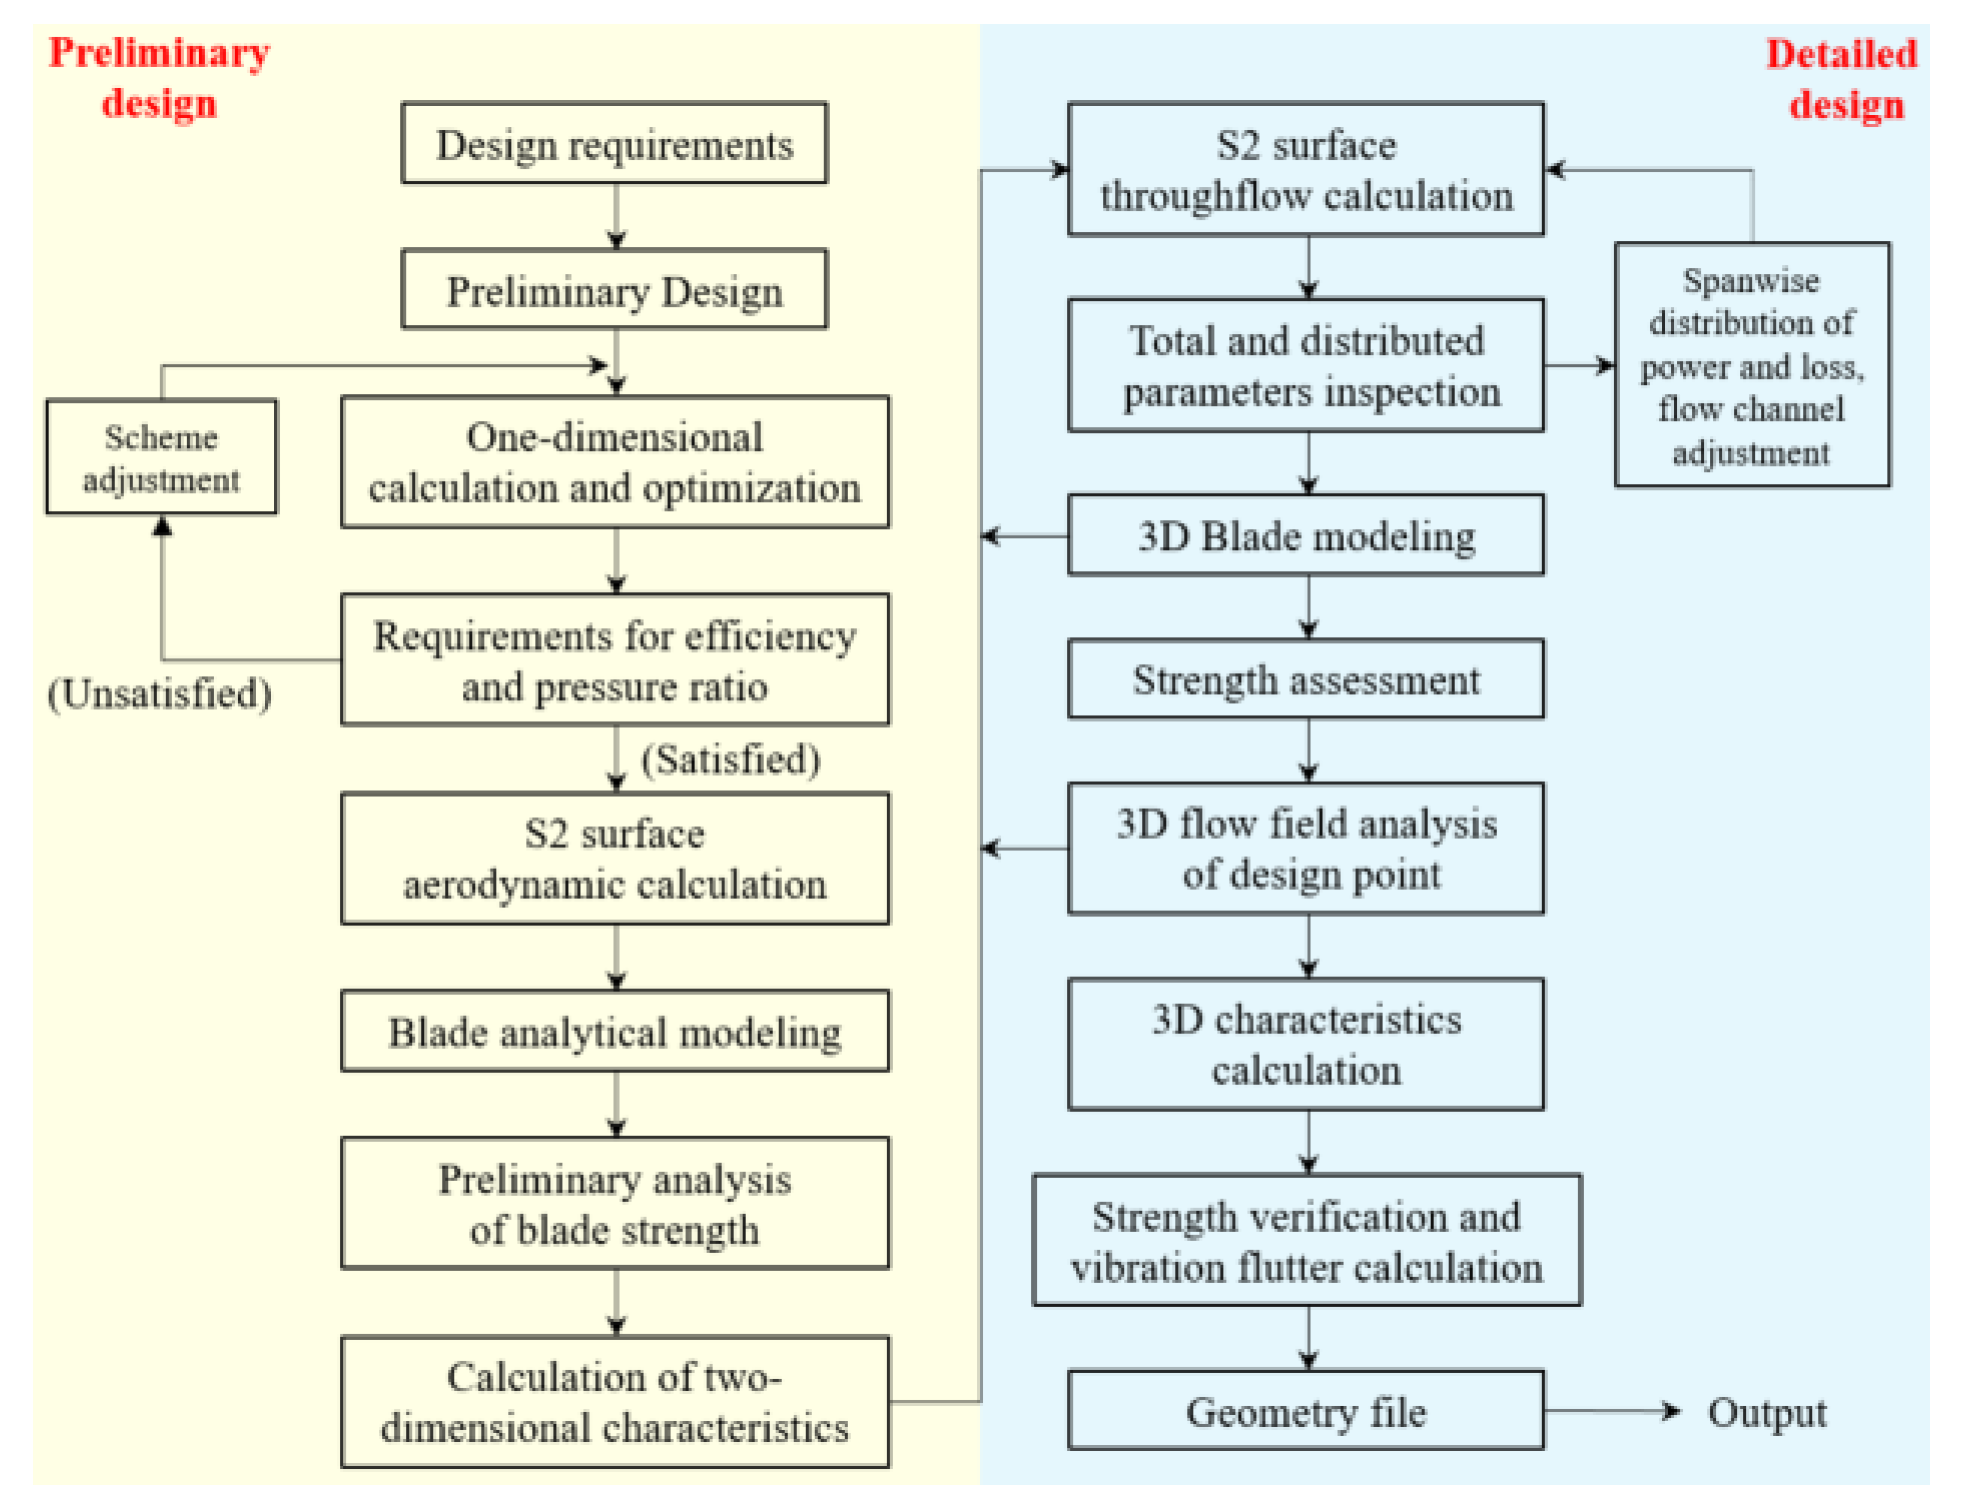
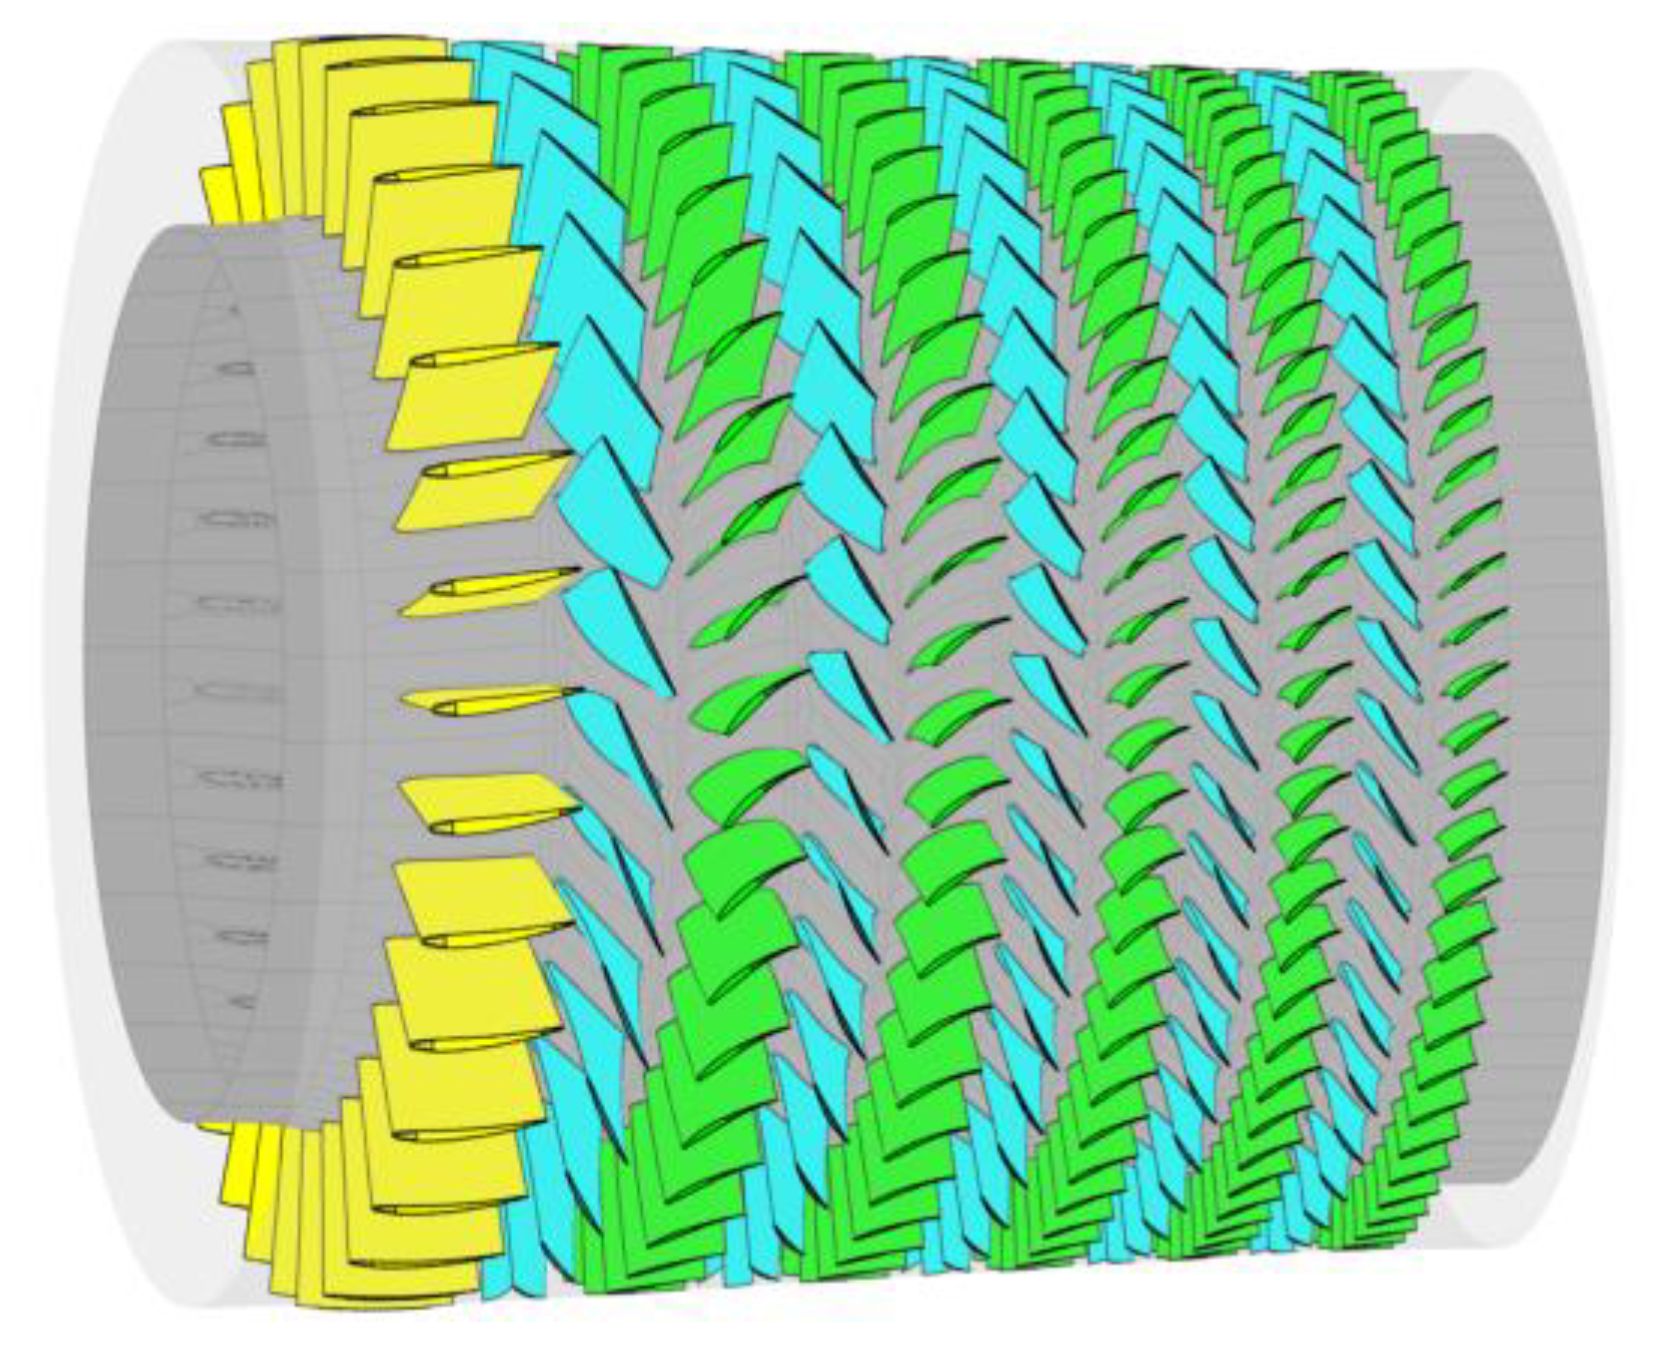
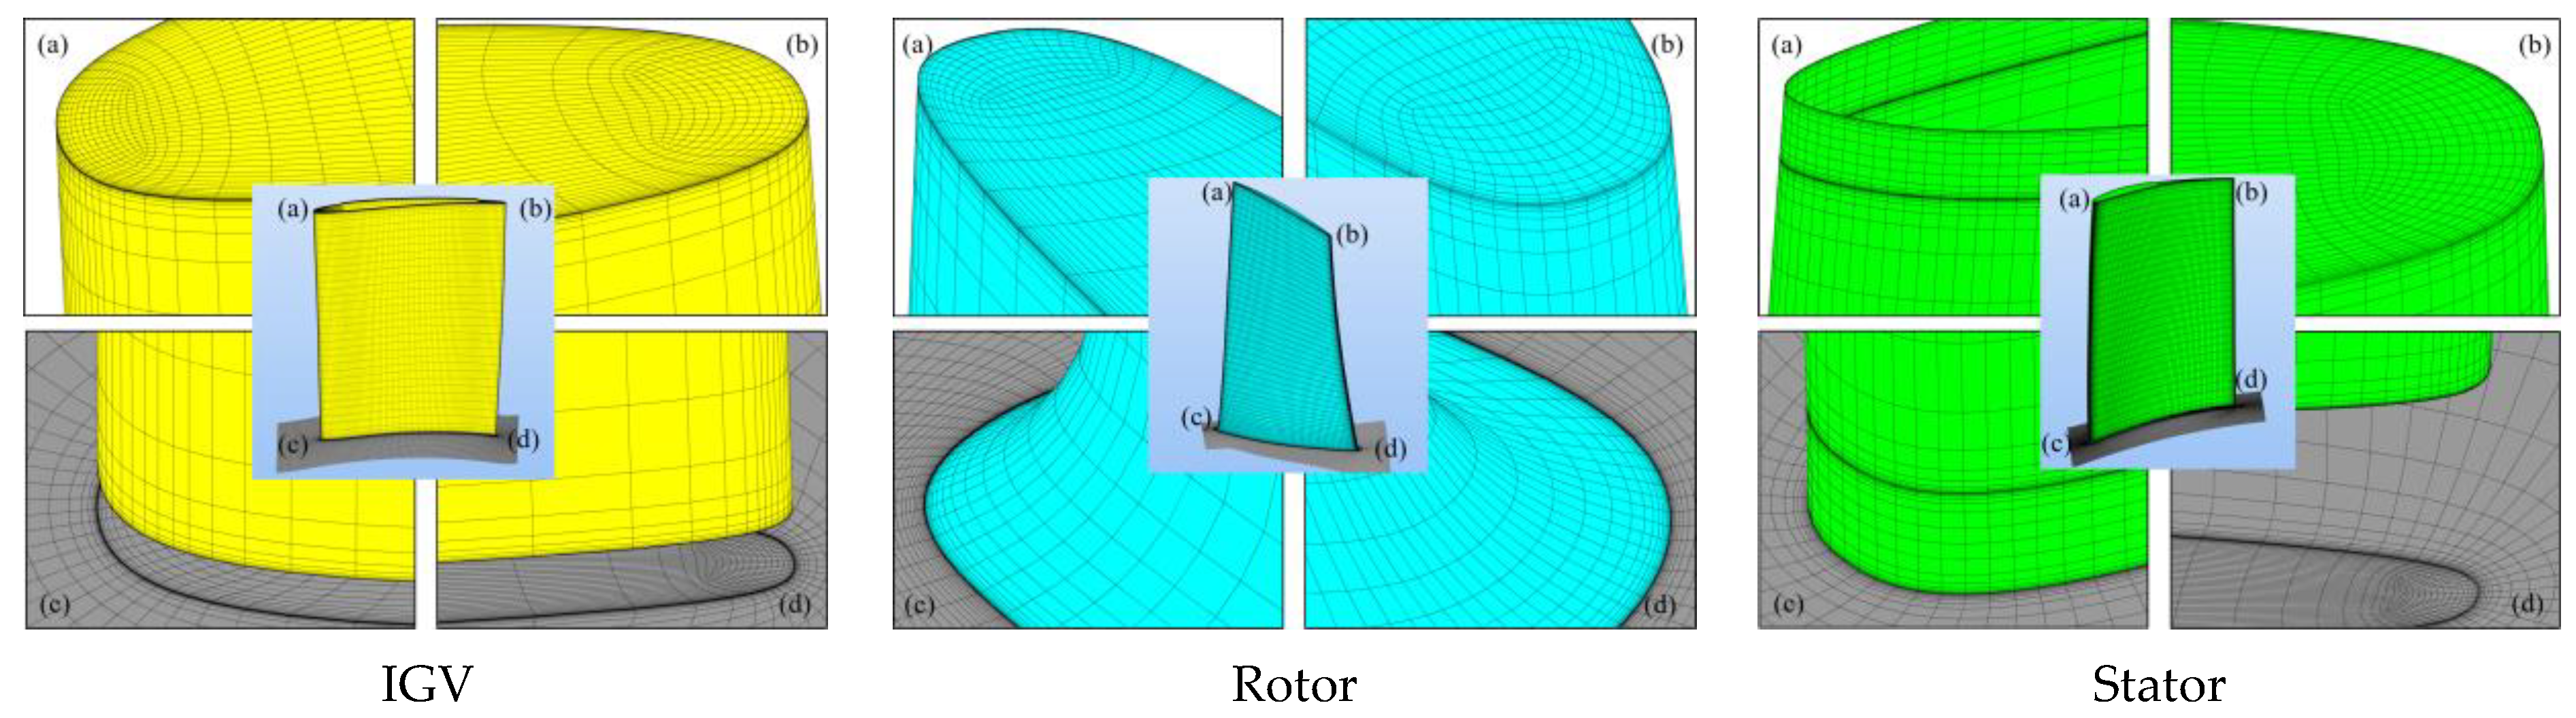
2.1. Numerical Model

The research object is a five-stage axial compressor for a specific CAES system, which is the inlet section of a compression subsystem and consists of inlet guide vanes (IGV) and five-stage rotor-stator rows. Some of the design parameters are listed in Table 1. The geometric modeling process of the compressor is shown in Figure 1, and the compressor three-dimensional model derived from geometry is shown in Figure 2.

2.2. Numerical Method

In this study, the three-dimensional Navier-Stokes flow solver NUMECA FINE/Turbo is used for compressible, viscous, and steady numerical calculation. The Jameson central difference with artificial viscosity added method is used for the spatial discretization of the equations, and the explicit four-step Runge-Kutta method is used for time discretization. The Spalart-Allmaras [20] turbulence model is selected to evaluate the vortex viscosity. The implicit residual smoothing, local time stepping, and multi-grid techniques are used to accelerate the convergence, and the number of CFL is set to 3.
The numerical calculation area is a single channel composed of an inlet guide vane and five-stage rotor-stator vanes. The AutoGrid5 module is used to achieve the grid division. In order to improve the grid quality of blade surface, O4H grid topology is adopted in the main flow region outside the blade tip clearance, and butterfly topology is adopted for the tip clearance region. Previous studies [21] have shown that 17 grid nodes arranged along the spanwise direction of the tip clearance can better simulate the flow field information. This finding is adopted in this paper. In addition, the near-wall surface grid is encrypted, and the minimum grid spacing on the solid wall is 2.0 × 10⁻⁶ m and it gives y+ < 5, which meets the requirement of the S-A model for y+ values ranging from 1 to 10. The calculation channel and blade grid structure are depicted in Figure 3, and the grid details of IGV, rotor, and stator are shown in Figure 4. The adiabatic non-slip condition is taken for the solid wall surface, and the Non-Reflecting 1D Mixing Plane method is adopted at the rotor-stator interface. The ideal gas model is used, and the air inlet direction is set as axial. The total temperature and total pressure are specified at the inlet of the compressor and the average static pressure is specified at the outlet. Table 2 lists the condition settings for numerical simulation, taking the near choke condition as an example. Calculations for different operating points are performed by increasing the outlet static pressure, specifying the previous calculation result as the initial condition for the next calculation, and the last stable result is used as the near stall point. In order to balance the computational cost and the capture accuracy of the internal flow field, this work verifies the independence of grid numbers at the near highest efficiency point, using 5 different grid numbers to repeatedly calculate the compressor model, as shown in Figure 5, and the number of grids is finally determined to be 10.9 million according to the error changes of normalized mass flow, total pressure ratio, and isentropic efficiency, as shown in Table 3.

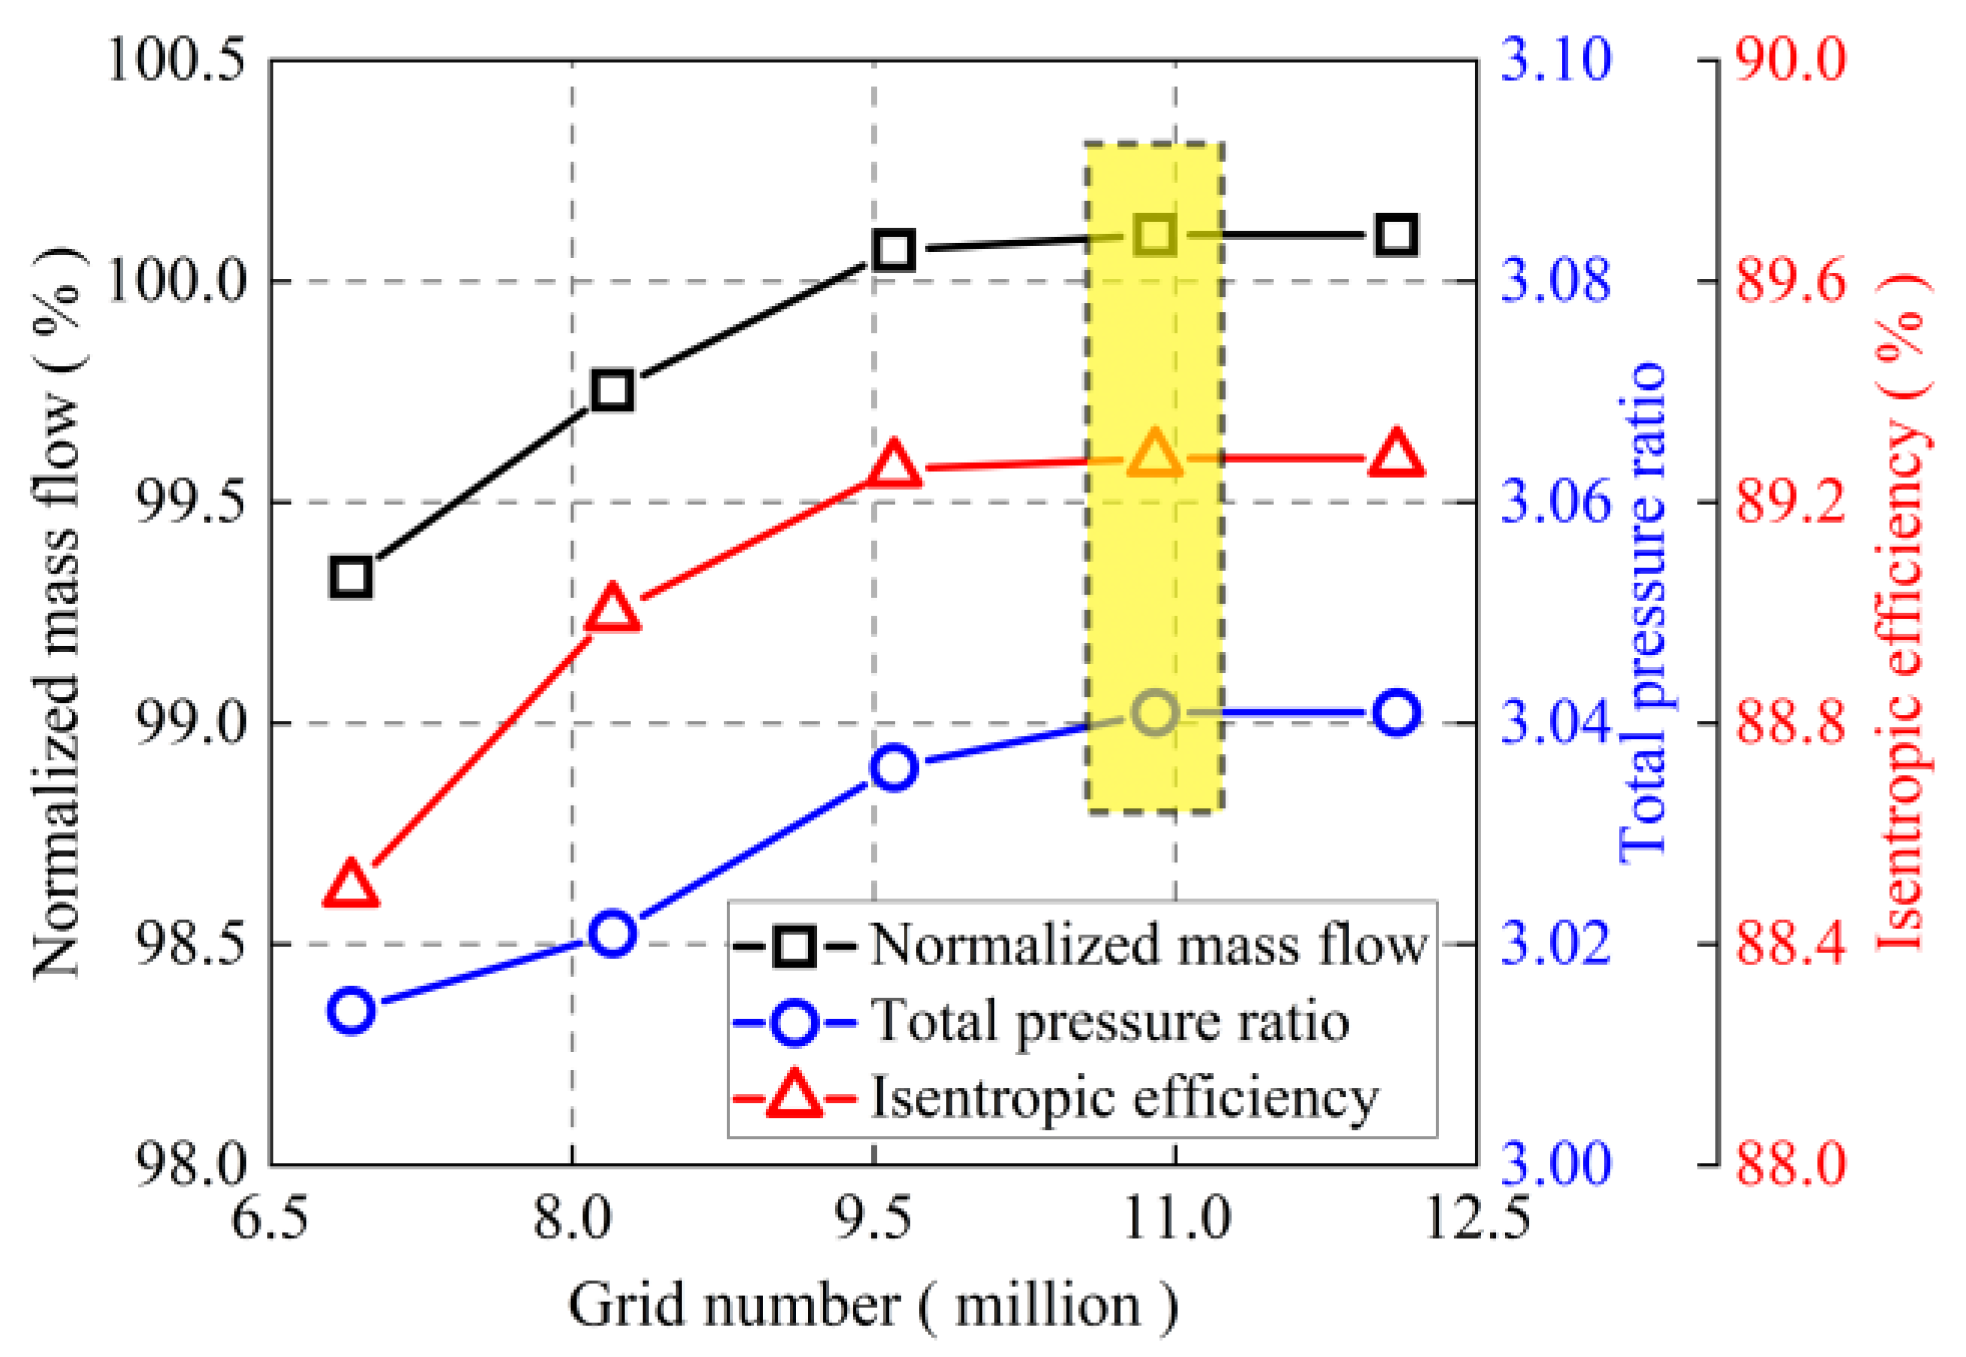
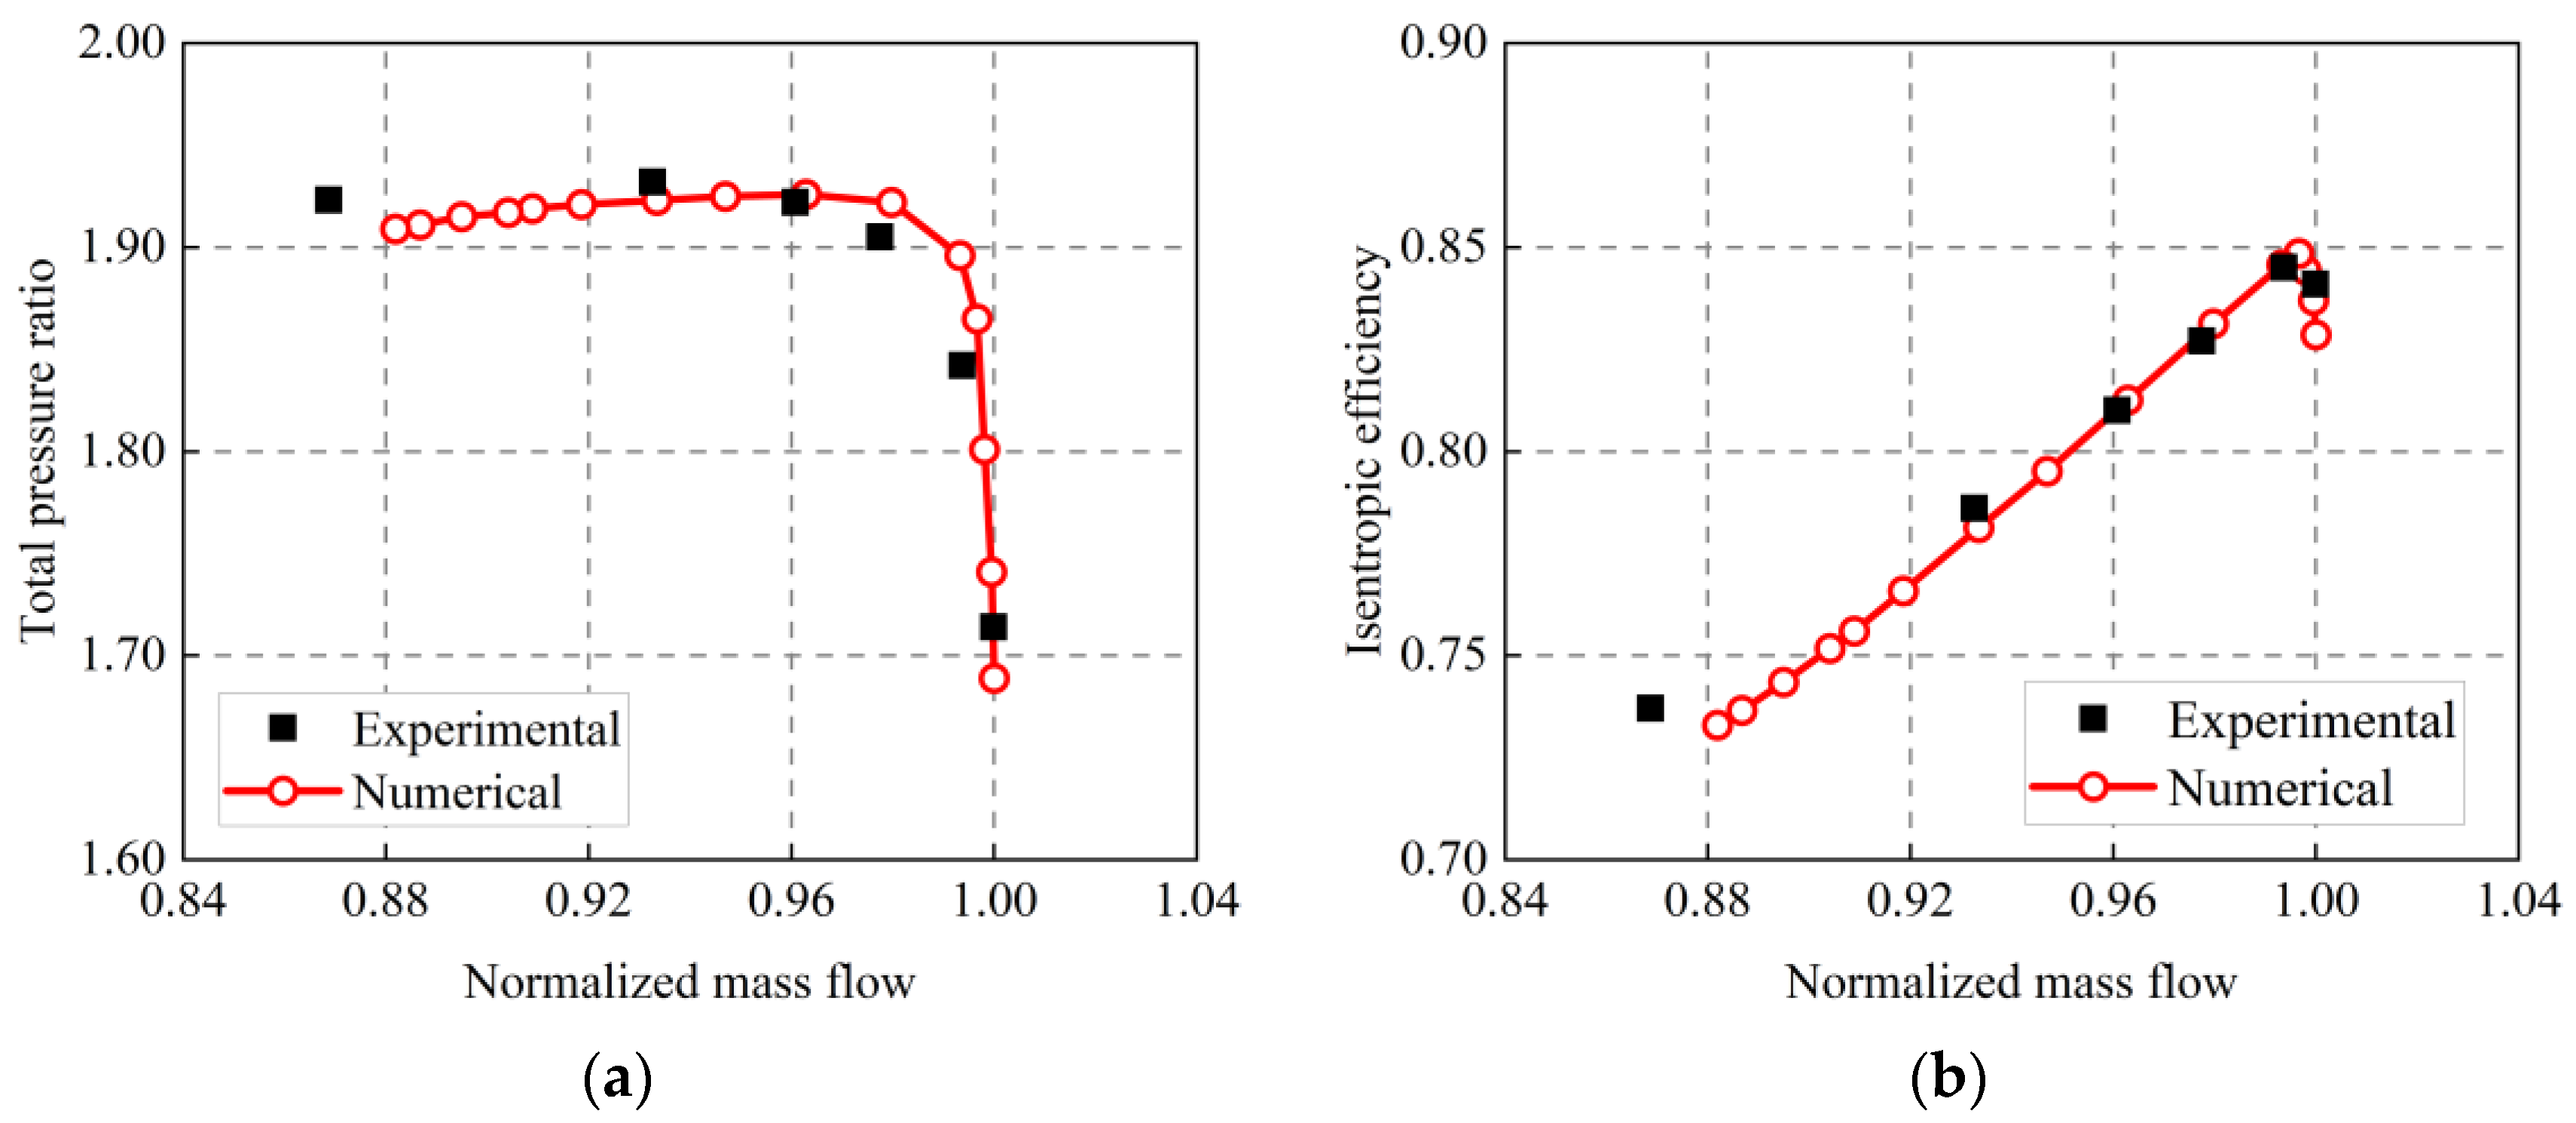
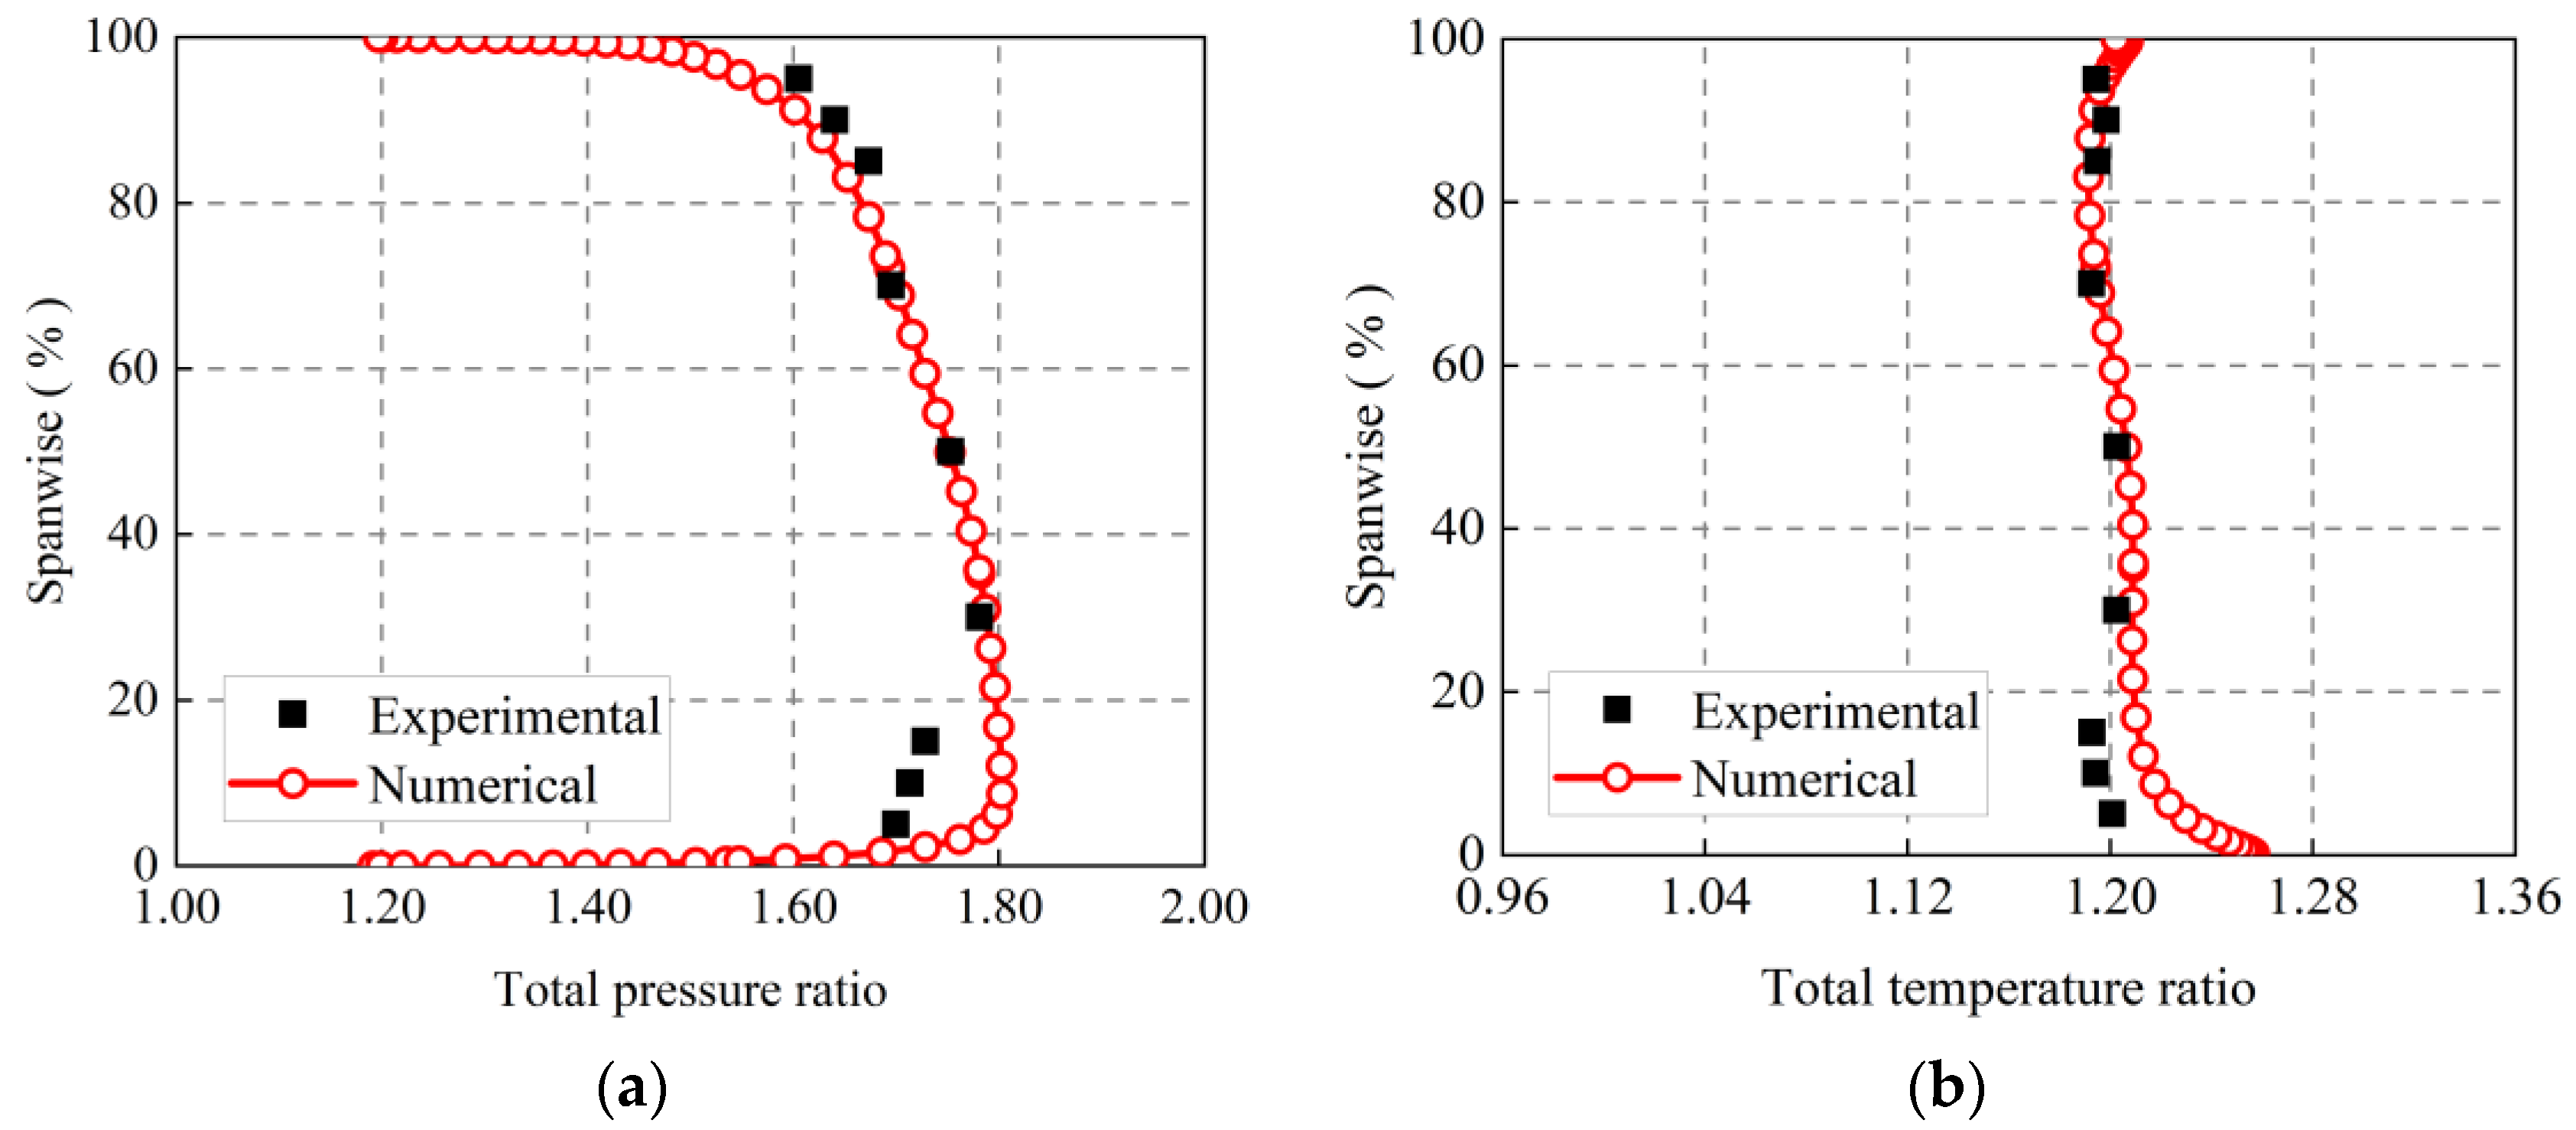
2.3. Numerical Validation

In order to verify the reliability of NUMECA FINE/Turbo, Stage 35 [22] is selected for numerical verification. Stage 35 is a transonic stage designed by NASA Lewis Research Center according to the aerodynamic parameters required by the inlet stage of a typical aero-engine high-pressure compressor. Some of its design parameters are shown in Table 4, and some of the numerical simulation results are summarized in Table 5. Figure 6 plots the results comparison between the experimental measurement and the numerical simulation [23]. One can see that the maximum error of the total pressure ratio is 0.9%, and the maximum error of isentropic efficiency is 1.5% within the whole working range. Figure 7 compares the spanwise distribution of total pressure ratio and total temperature ratio of experimental measurements with numerical simulation results at a design rotational speed near the choke condition. Numerical simulations of both total pressure ratio and total temperature ratio are in good agreement with experimental values. In general, the performance curves obtained by numerical simulation are in good agreement with the experimental measurement results, which proves that the numerical simulation software and numerical methods selected in this paper are effective and reliable, and can be used for subsequent research and analysis.

2.4. Interpolation Method
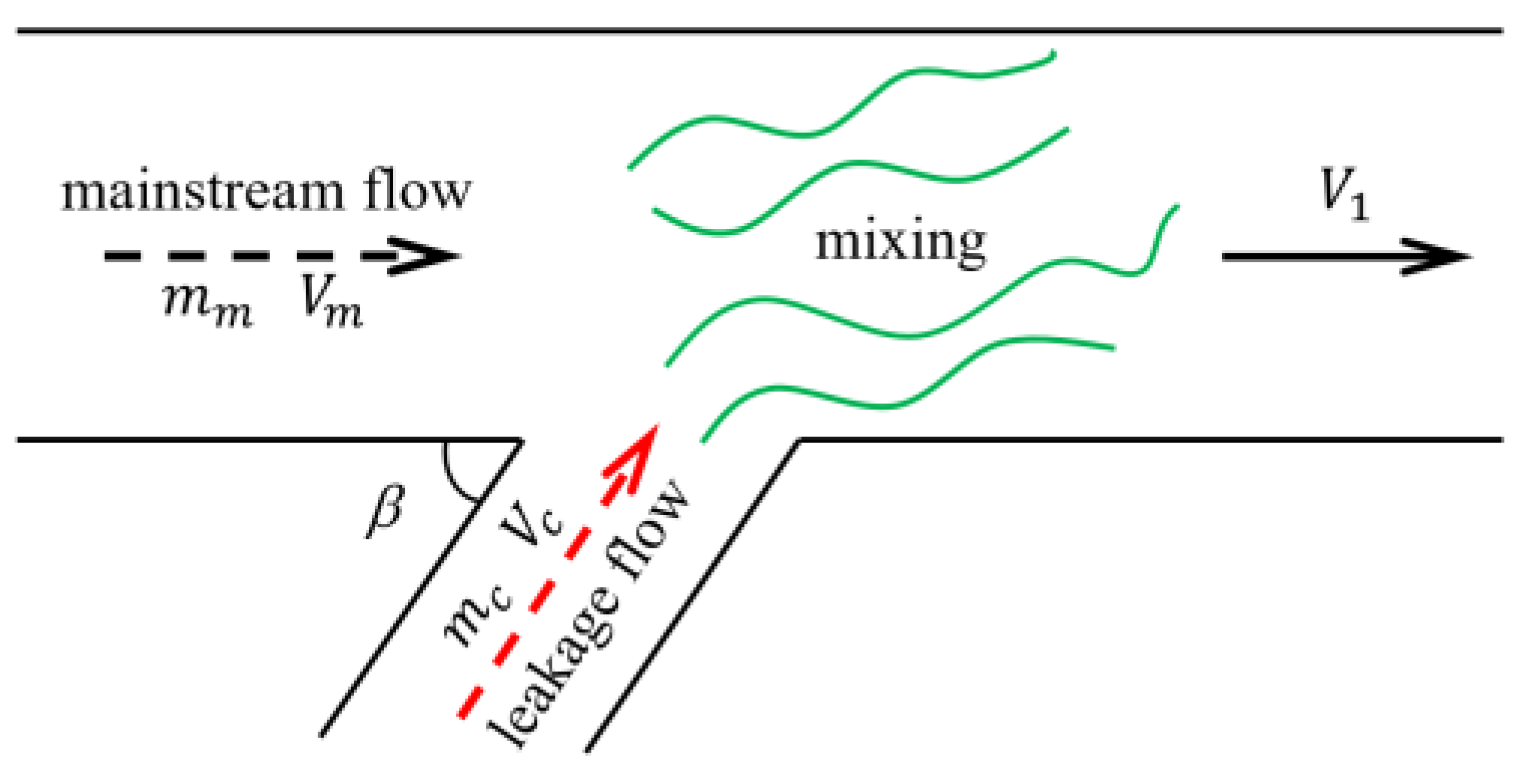
For the purpose of avoiding a large number of time-consuming numerical simulations, this paper uses the Thin-Plate Spline (TPS) method to interpolate the numerical simulation results to obtain the performance data of the compressor at other rotational speeds. TPS interpolation is proposed in 1976 and has been widely used in shape design, curve fitting, and other fields [24].
The TPS model is as follows:
z * x 0 = i = 1 n λ i K x 0 , x i + p = 0 2 α p f p x 0
where    x 0  is the coordinate of the point to be interpolated,  x i  is the coordinate of the sampling point, and  z * x 0  is the estimated value at  x 0 λ i  and  α p  are carried out with the following equations:
j = 1 n λ j K x i , x j + p = 0 2 α p f p x i = z x i               i = 1 , 2 , , n j = 1 2 α j f p x j = 0               p = 0 , 1 , 2
where
K x i , x j = r i j 2 ln r i j
r i j 2 = x i x j 2 + y i y j 2 i , j = 1 , 2 , , n ; i j

2.5. Leakage Model

There is a clearance between the rotor tip and the casing. The leakage flow from the pressure surface to the suction surface through the tip gap will occur under the effect of the pressure difference. Considering the wide application and clear physical concept of the Denton leakage mixing model [25], the generation and development process of tip clearance leakage of the rotor blade is simplified as the mixing process of injection flow and main flow, as illustrated in Figure 8. Entropy generation is calculated as shown in Formula (5).
Δ s = C p m c m m 1 + γ 1 2 M a m 2 T c * T m * T m * + γ 1 M a m 2 1 V c cos β V m
where the leakage flow parameters are: total temperature  T c * , mass flow rate  m c , velocity  V c , and incidence angle β. The main flow parameters are: total temperature  T m * , mass flow rate  m m , velocity  V m , and Mach number  M m .
For the tip leakage flow, part of the streamlines on the pressure surface spray to the suction surface are at an angle nearly perpendicular to the blade surface, and assuming that the flow is incompressible, the total temperature and total pressure of the leakage flow are same as those of the main flow. In this case, total entropy generation can be expressed as:
T S ˙ = 0.5 V m 2 m c 2 + 3 m c m m + m c m m 2
m c = S ρ V c sin β   d A
where  S  represents the leakage area and  V c sin β  can be regarded as the leakage velocity.

3. Results and Discussion

3.1. Overall Aerodynamic Performance Analysis

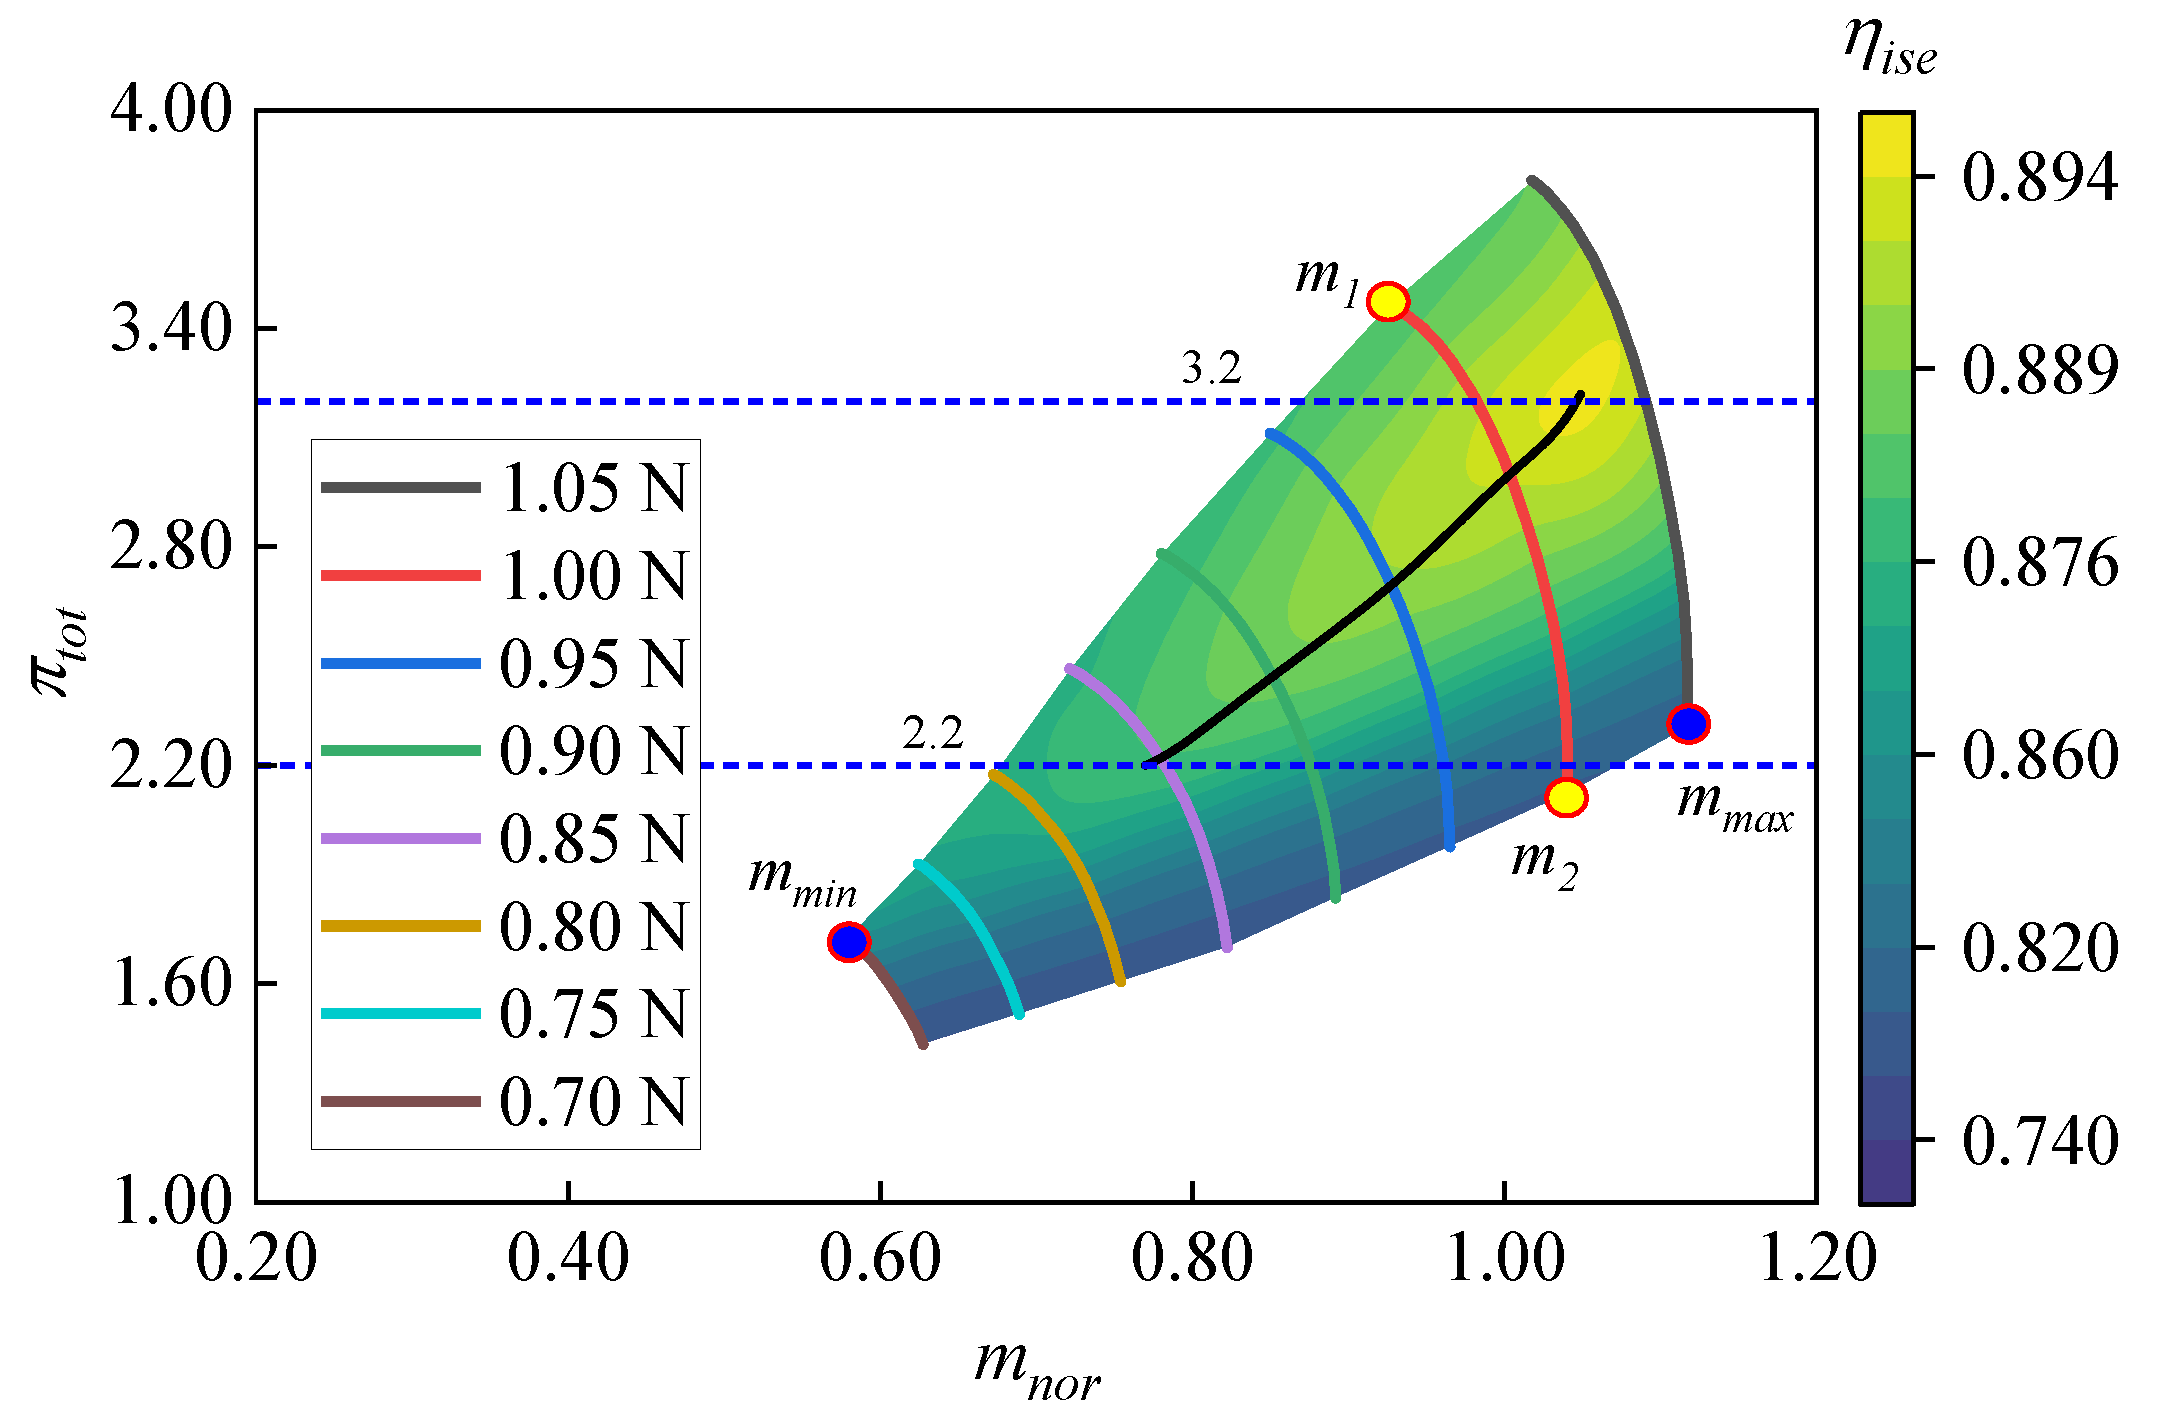
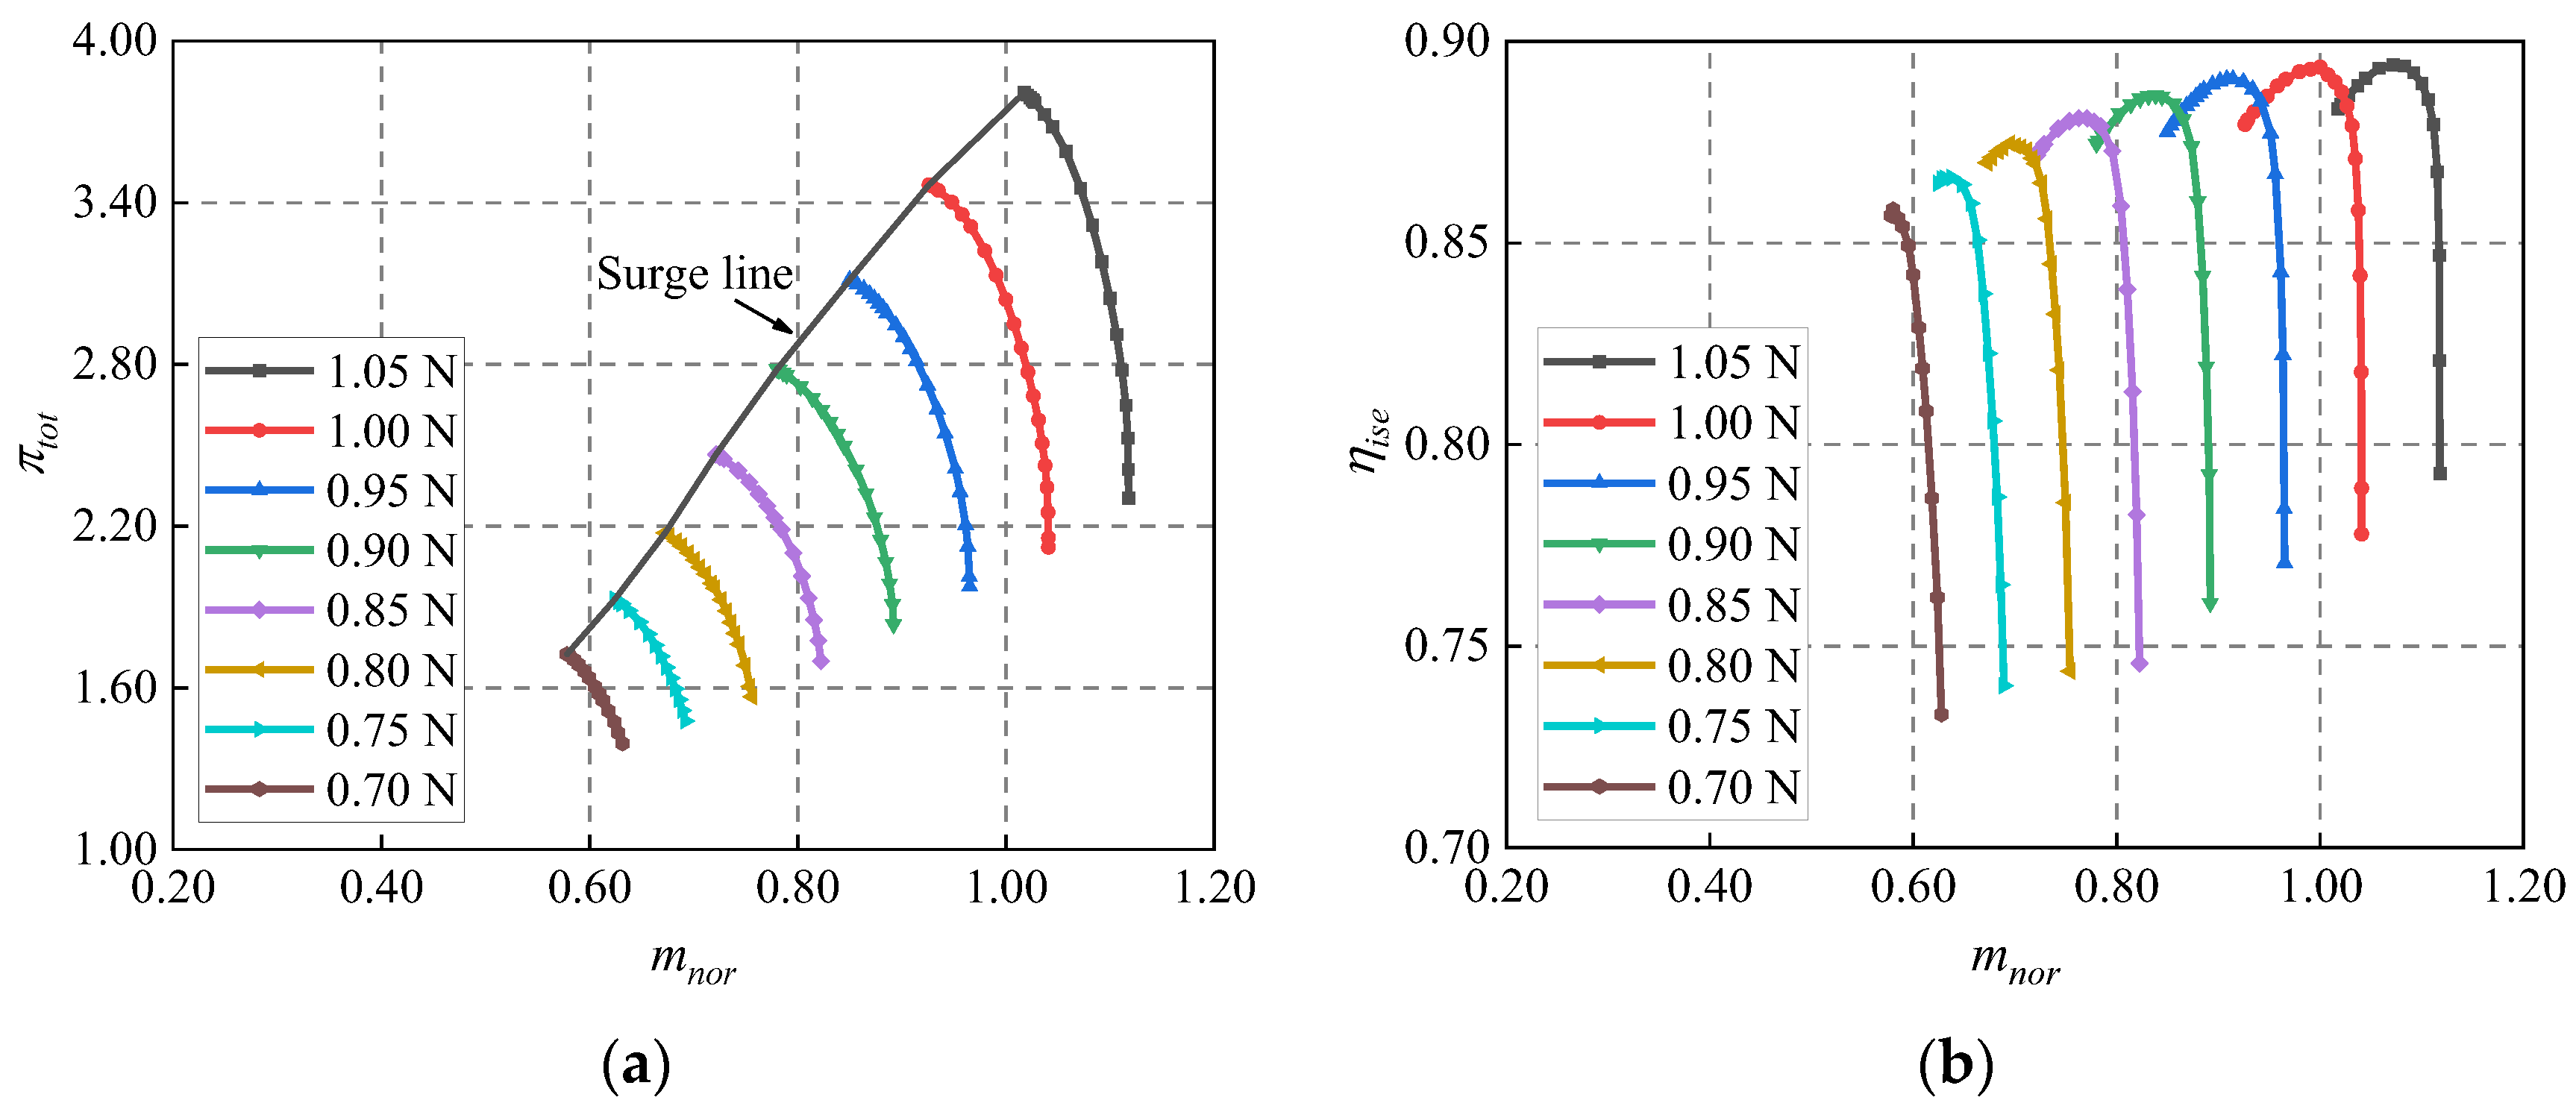
3.1.1. Characteristic Curves

Figure 9 shows the total pressure ratio and isentropic efficiency distribution curves of the five-stage axial compressor at DRS. The rotational speed varies from 0.70 N to 1.05 N, where N represents the design rotational speed, and the calculations of the normalized mass flow, total pressure ratio, and isentropic efficiency are shown in Formulas (8)–(10), where  m  represents the compressor mass flow,  m d e s i g n  is the compressor mass flow under the design condition,  P t , o u t  is the total pressure at compressor outlet,  P t , i n  is the total pressure at compressor inlet,  T o u t  is the static temperature at compressor outlet,  T i n  is the static temperature at compressor inlet, and  γ  is the specific heat ratio of ideal air. As indicated in Figure 9 that the total pressure ratio and isentropic efficiency characteristic curves shift uniformly toward the small flow rate as the speed decreases, the maximum pressure ratio and the peak isentropic efficiency both gradually drop, and the working flow range and the efficient working area gradually shrink.
m n o r = m m d e s i g n
π t o t = P t , o u t P t , i n
η i s e = π t o t γ 1 γ 1 T o u t T i n 1

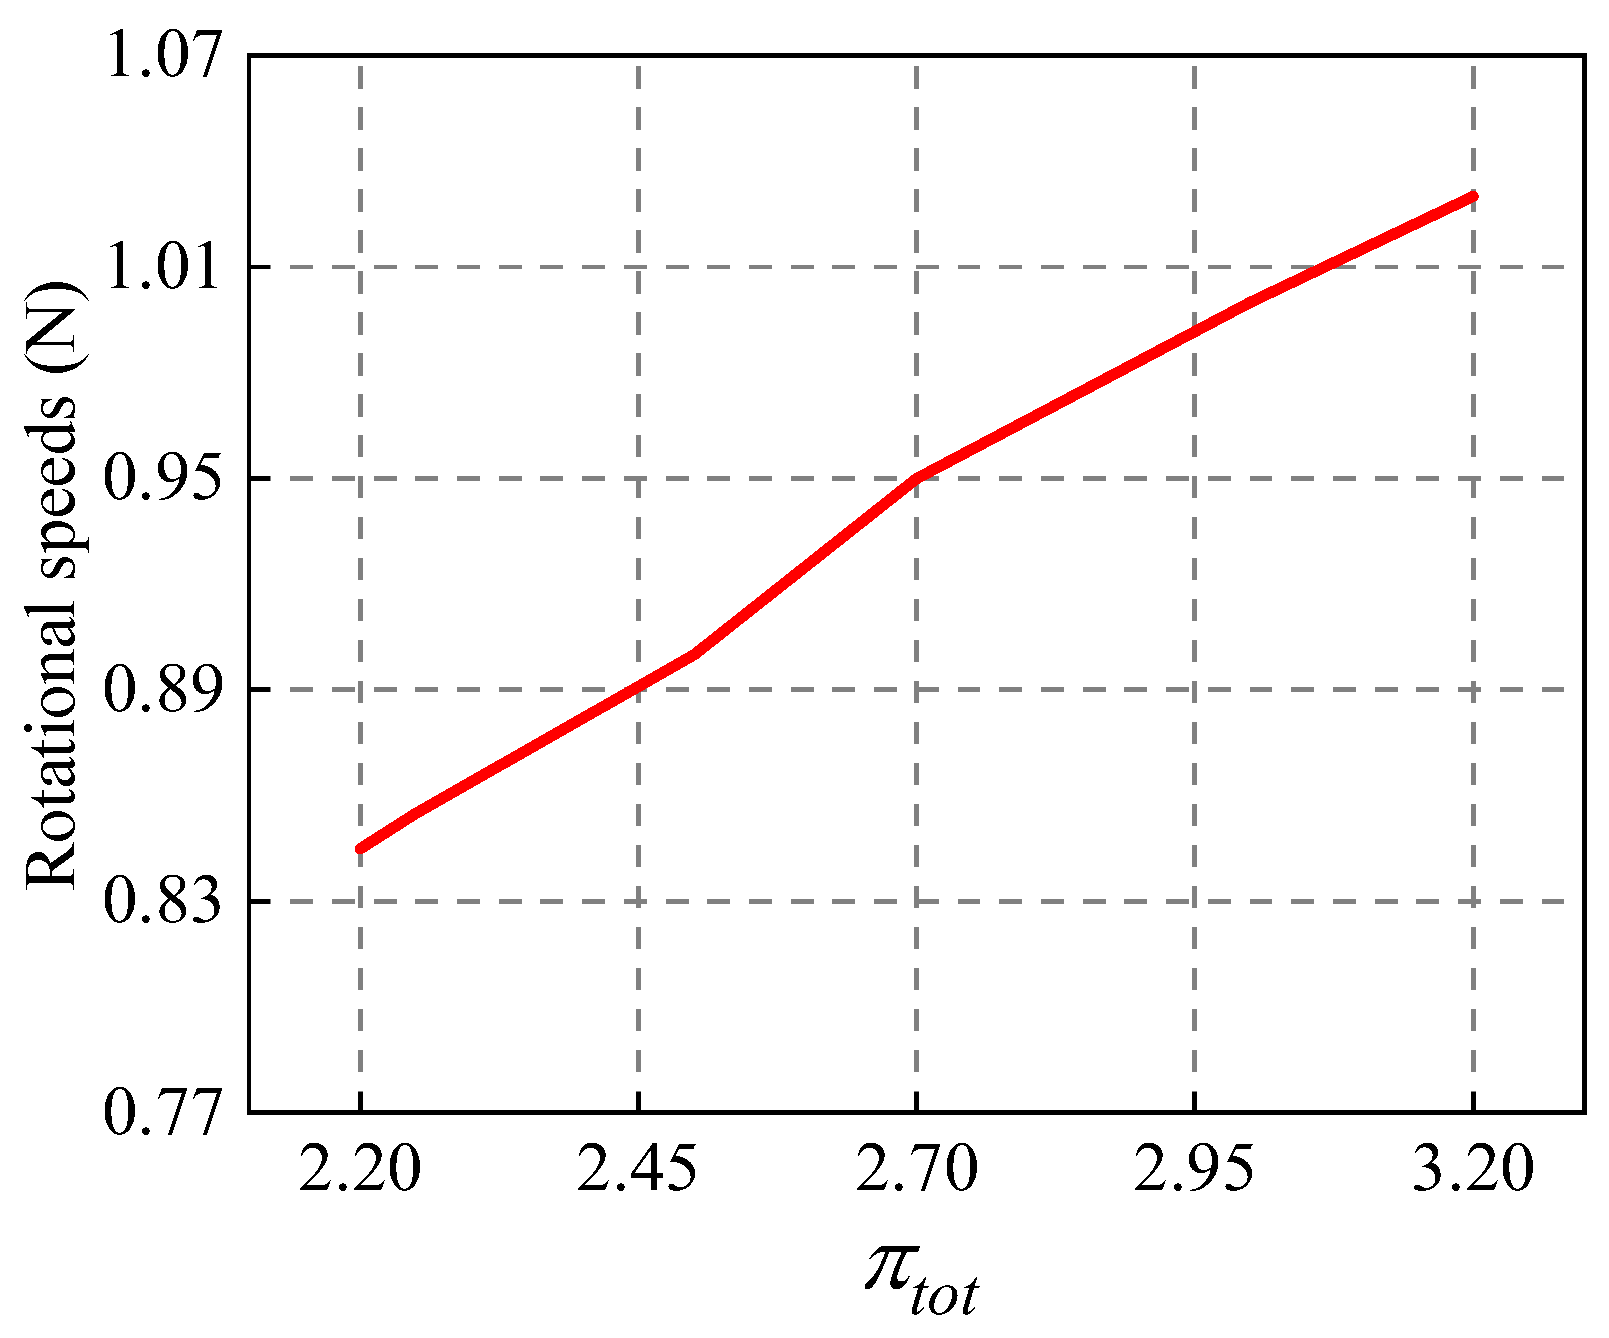
3.1.2. Comprehensive Performance Diagram

Figure 10 demonstrates the comprehensive performance diagram of the axial compressor obtained by TPS interpolation at DRS. Define the working flow range as the percentage of the difference between the near choke condition and near stall condition at a certain speed, as shown in Formula (11), where  m n o r , c h o k e  represents the normalized mass flow at near choke condition and  m n o r , s t a l l  represents the normalized mass flow at near stall condition. At the design speed, the working flow range of the compressor is the difference between points  m 2  and  m 1  in the figure, which is 11.5%. After speed adjustment, the working flow range is the difference between points  m m a x  and  m m i n  in the figure, which is 54.0%, the pressure ratio range is effectively expanded, and the stable and efficient working range is widened from a single curve to a curved surface. When the CAES system stores energy, the compressor consumes electrical energy to compress the air and send it to the storage chamber. Due to the fixed volume of the chamber, as the compressor continues to operate, the pressure in the air storage chamber will gradually increase. The compressor is directly connected to the chamber, so the discharge pressure of the compressor will also gradually increase. Each discharge pressure corresponds to a specific rotational speed to make the compressor operate with the highest efficiency. In this system, the set pressure ratio of this five-stage axial compressor is 2.2 to 3.2. In this range, the highest efficiency points under different pressure ratios are connected in turn, and the obtained curve is shown as the black line in Figure 10, which is defined as the maximum efficiency operation curve of the compressor at DRS. Table 6 shows the operation targets of the five-stage axial compressor in a specific CAES system and lists the parameter comparison of inlet guide vane/stator regulation and rotational speed adjustment. One can see that within the specified pressure ratio range, the normalized mass flow range corresponding to speed adjustment is wider, and the isentropic efficiency is higher, so the speed regulation can fully meet the operating requirements of compressors and can further improve the operating economy of a CAES system.
N M R = m n o r , c h o k e m n o r , s t a l l × 100 %
Figure 11 provides the rotational speed adjustment line corresponding to the highest efficiency point of the compressor at different pressure ratios obtained by interpolation. When a CAES system is running in energy storage mode, the outlet pressure of the compressor is monitored in real time, the pressure ratio is then converted into speed regulation signal by coupling speed adjustment line, and then fed back to the driving mechanism in time, which can realize precise active control of the rotational speed and ensure the compressor can run stably and efficiently in a wide working range.

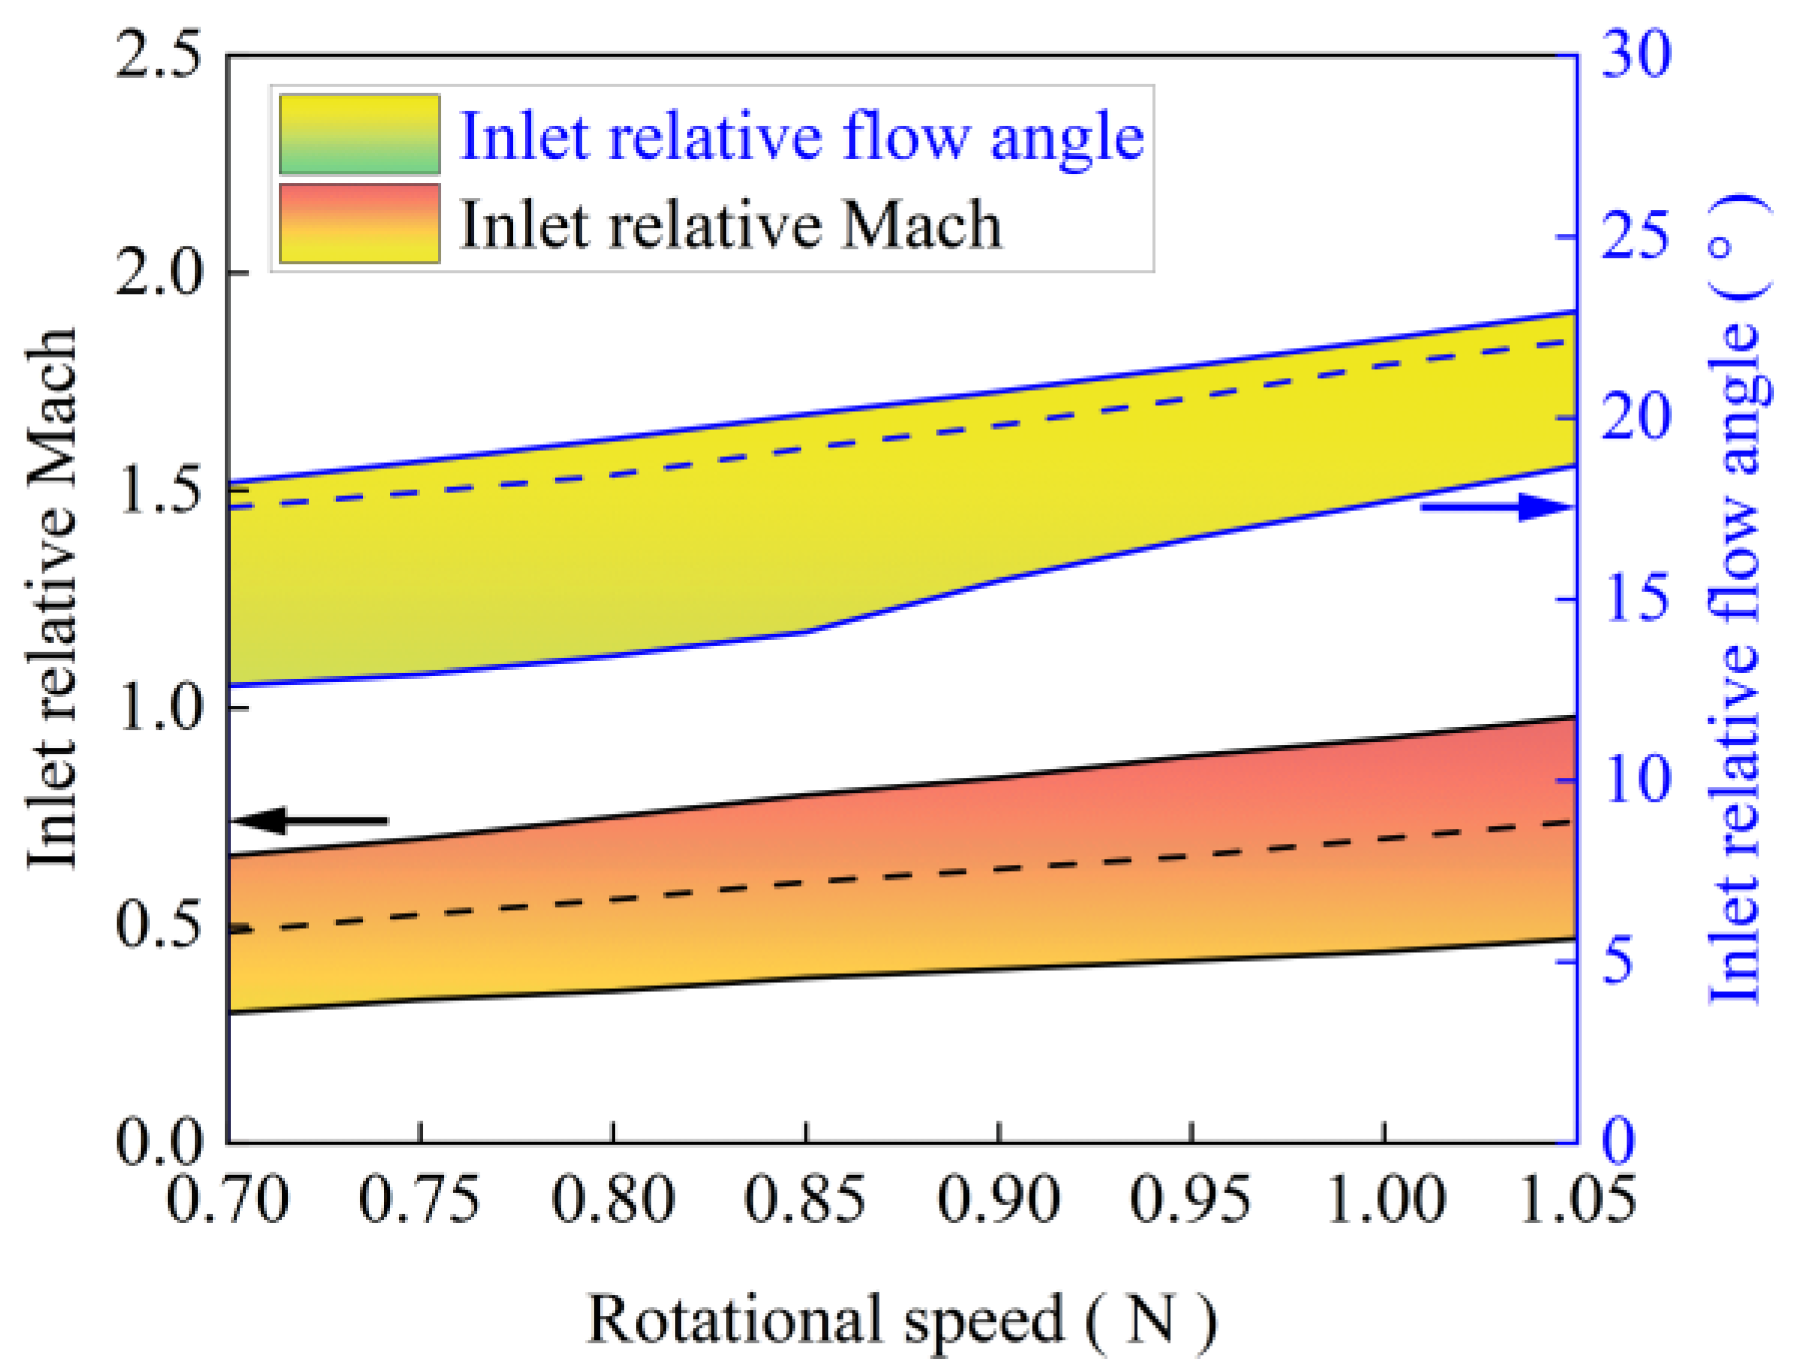
3.2. Inlet Stage Rotor Inlet Parameters Analysis

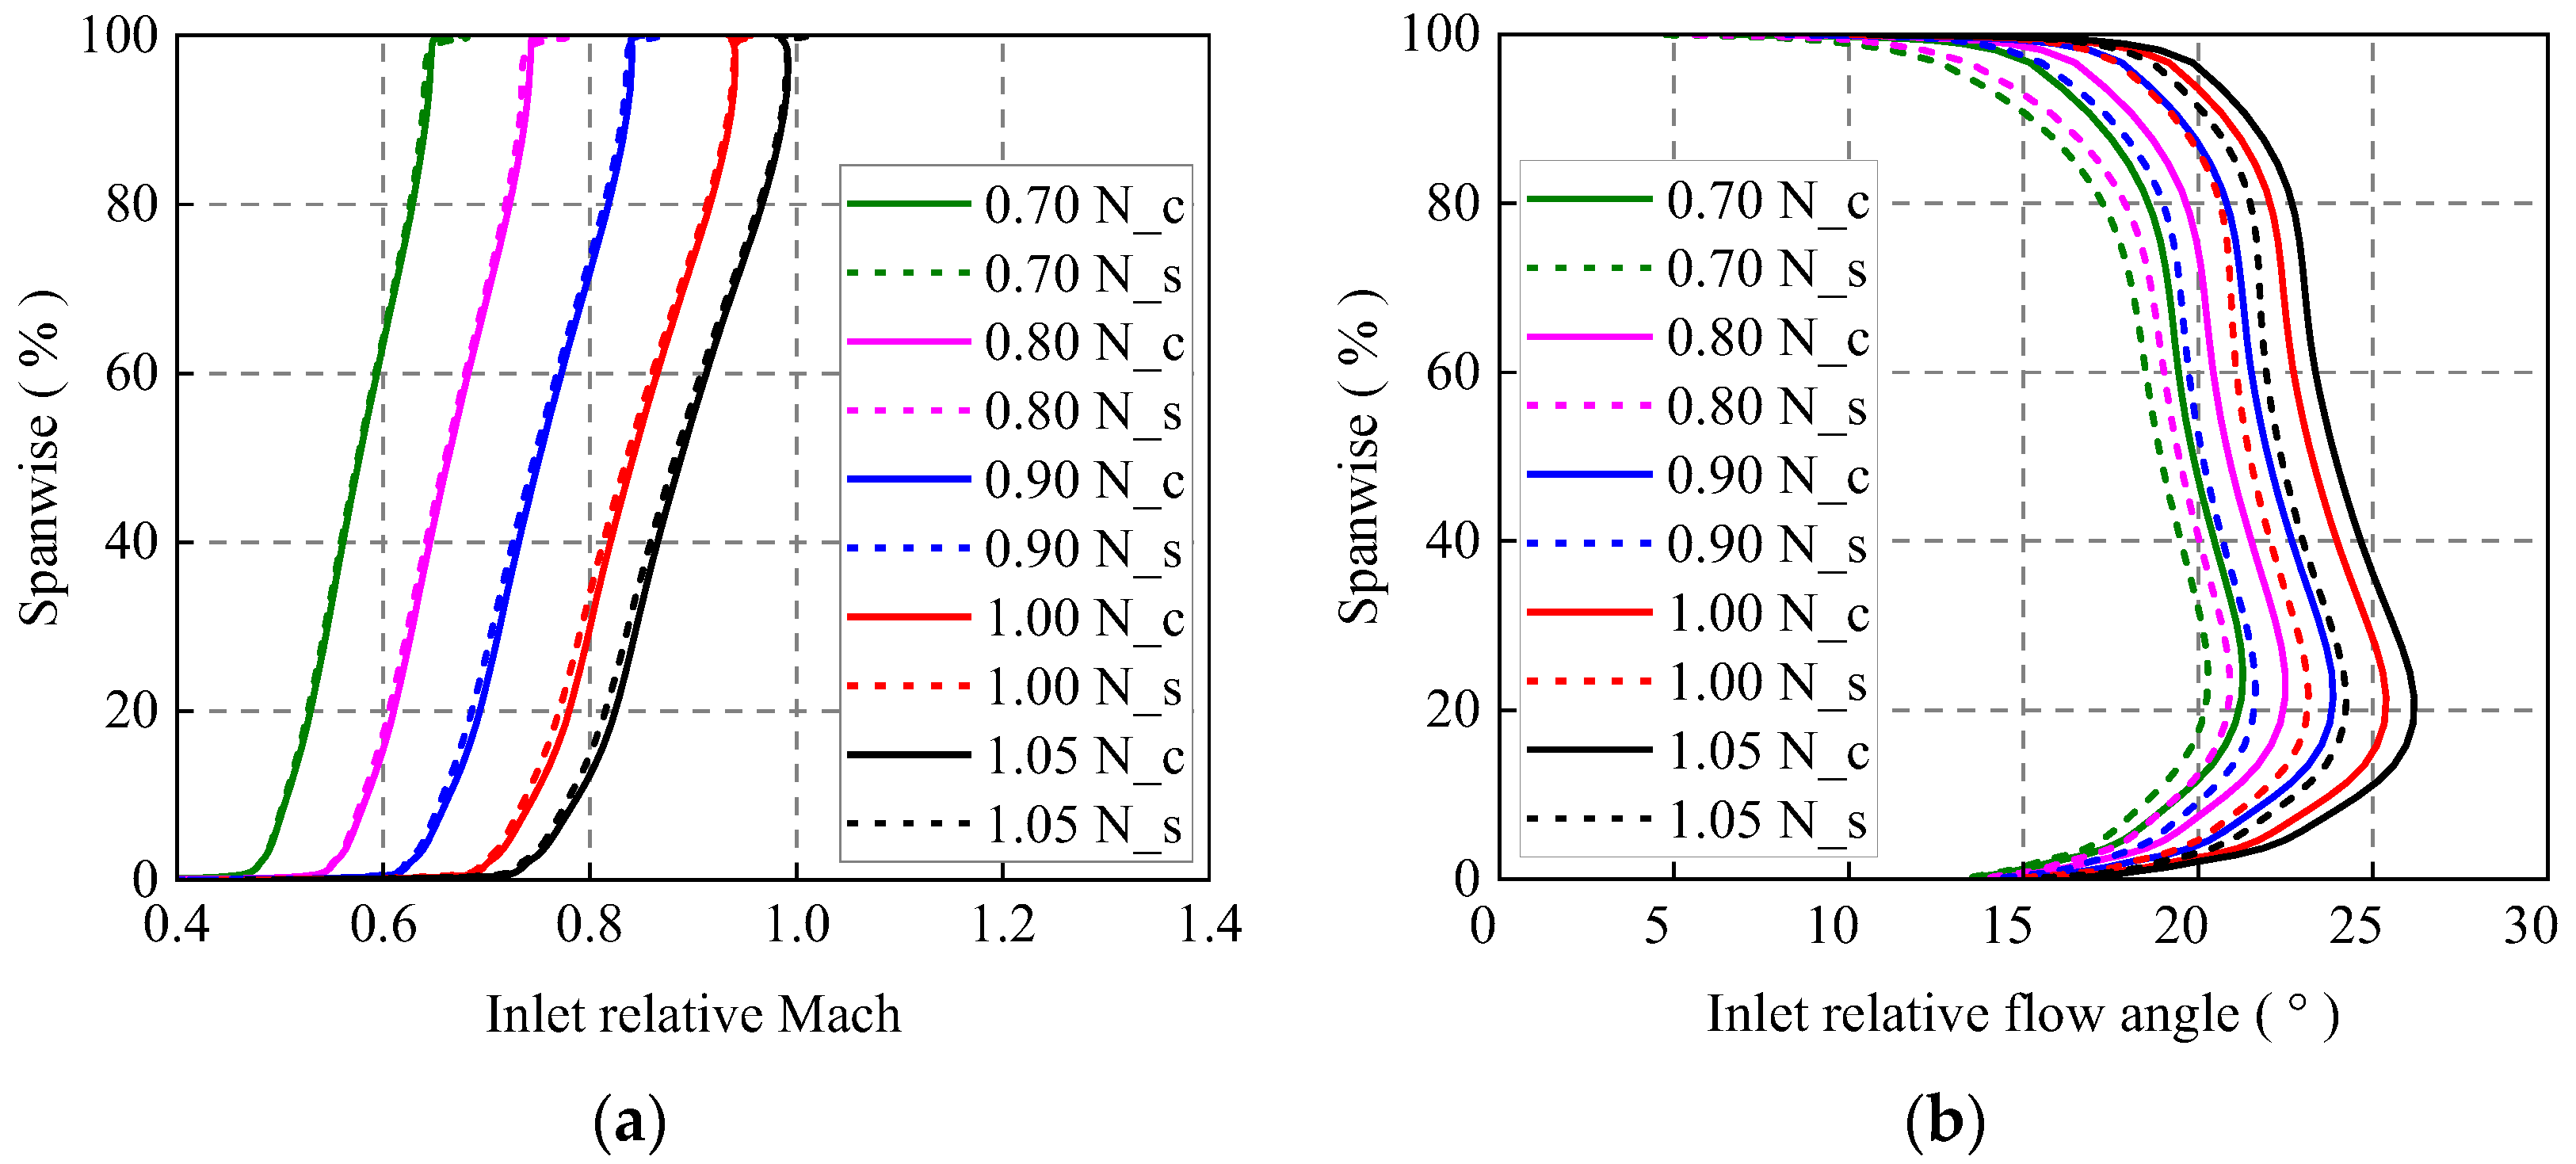
3.2.1. Spanwise Distribution

Figure 12 presents the spanwise distribution of the relative Mach number of the inlet stage rotor and the relative flow angle at five typical rotational speeds, where c represents the near choke condition, and s represents the near-stall condition. The inlet relative flow angle is the angle between the relative velocity and the circumferential direction. With the rotational speed increasing, the relative Mach number and the relative flow angle gradually improve in the whole blade span. When the rotational speed is fixed, the relative Mach number does not change significantly as the compressor develops from the near choke condition to the near-surge condition, while the relative flow angle decreases uniformly. By analyzing the velocity triangle, the increment of rotational speed improves the circumferential and axial velocity, as well as the relative velocity and the angle between the relative velocity and the circumferential direction, resulting in the rise in relative Mach number and relative flow angle. When the rotational speed is fixed and the outlet pressure increases gradually, the change of the back pressure has little impact on the relative velocity, but it will significantly reduce the axial velocity as well as the angle between the relative velocity and the circumferential direction, resulting in the drop in relative flow angle.

3.2.2. Comprehensive Change Diagram

Figure 13 plots a comprehensive diagram of the inlet parameters of the inlet stage rotor, and it illustrates the variation range of the relative Mach number and the relative flow angle at DRS. The two dashed lines represent the midspan distribution of the relative Mach number and the relative flow angle near the highest efficiency point at the corresponding rotational speed. The inlet flow parameter distribution of the multistage axial compressor has a significant influence on the internal flow field distribution of each stage of the compressor. When the rotational speed and the flow rate decrease to a certain extent, rotational stall will first occur in the inlet stage, which may cause surge [26]; when the speed rises to a certain degree, the inlet stage rotor will enter the “turbine condition”. It is important to study the changing law of the inlet parameters when the compressor rotational speed changes. During the operation of a CAES system, the comprehensive map offers a reasonable distribution of the inlet parameters at DRS and the distribution of the inlet parameters at near-highest efficiency point, which provide practical guidance for the stable operation of the compressor and the angle adjustment of inlet guide vanes.

3.3. Internal Flow Analysis

From the above analysis, one can see that the compressor performance characteristics vary significantly with the rotational speed. The performance of compressors is closely related to internal flow, and considering the interaction between stages of the axial compressors, this part will take the third stage rotor as an example to analyze the variation of the internal flow at three typical speeds under the near-highest efficiency point.

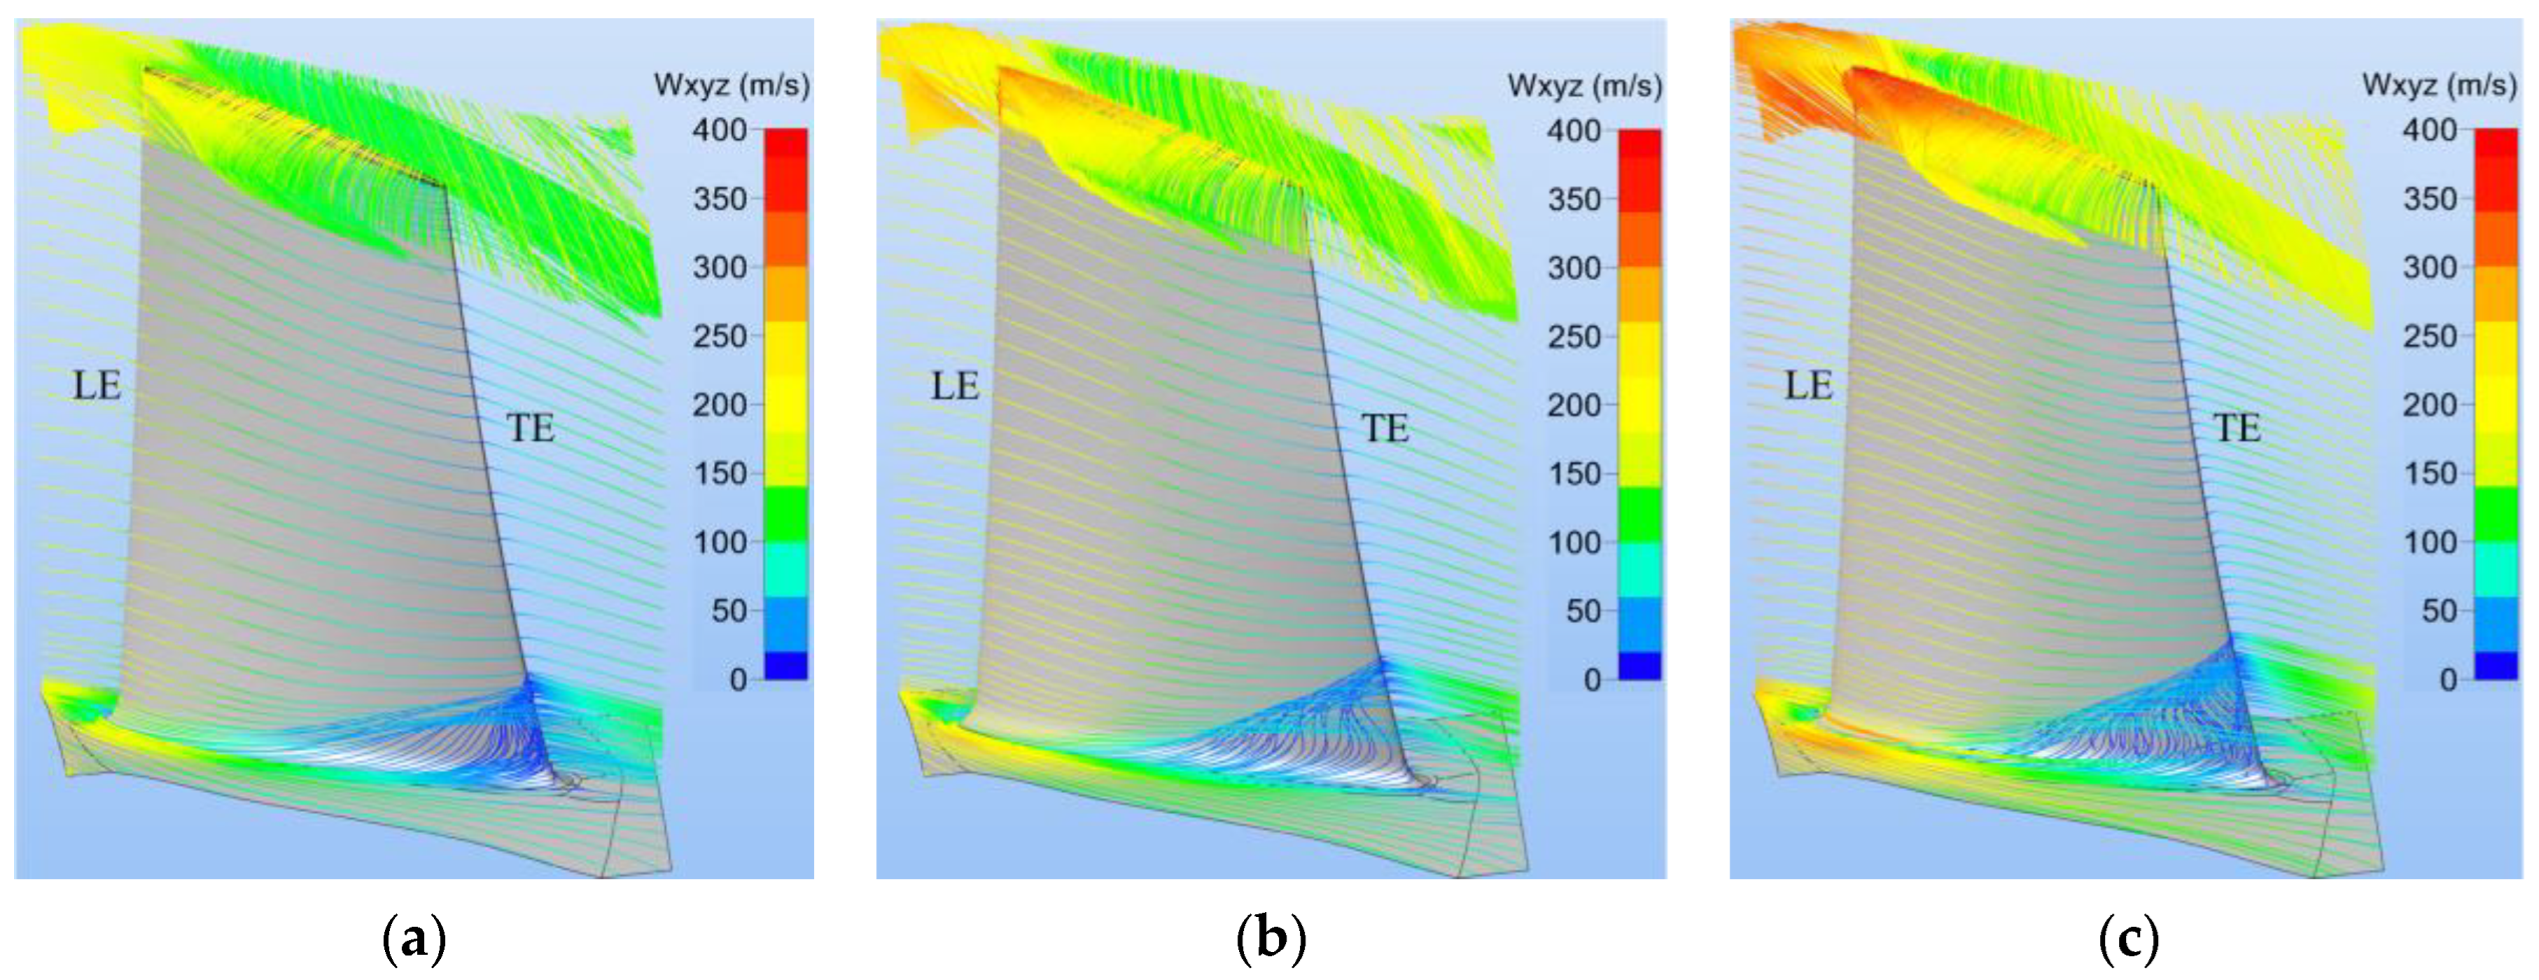
3.3.1. Three-Dimensional Streamlines

In order to explore the internal flow in detail, Figure 14 depicts the three-dimensional streamline distribution of the third stage rotor at three typical rotational speeds. As can be seen, the streamline in the middle channel is smooth, indicating that the flow condition is good. The streamline in the blade end area changes dramatically, and the three-dimensionality is obviously enhanced. For rotor root area, the hub boundary layer and the blade surface boundary layer block each other, resulting in a gradual thickening of the boundary layer, producing an obvious corner separation at the trailing edge of the suction surface, and the higher the rotational speed, the more serious the separation flow is. With the pressure difference, the leakage flow from the pressure surface to the suction side will be generated at the rotor tip area. The structure of the leakage flow is complex, and the leakage streamlines generated in front of the clearance and part of the tip suction surface streamlines are entangled with each other to develop downstream with a large leakage velocity. The leakage flow velocity generated in the rear of the clearance gradually decreases, and the leakage flow does not participate in the formation of the leakage vortex, but crosses the adjacent blade clearance, resulting in secondary leakage or even multiple leakage [27]. With the increase of speeds, the structure of leakage flow remains basically unchanged, while the leakage velocity grows significantly.

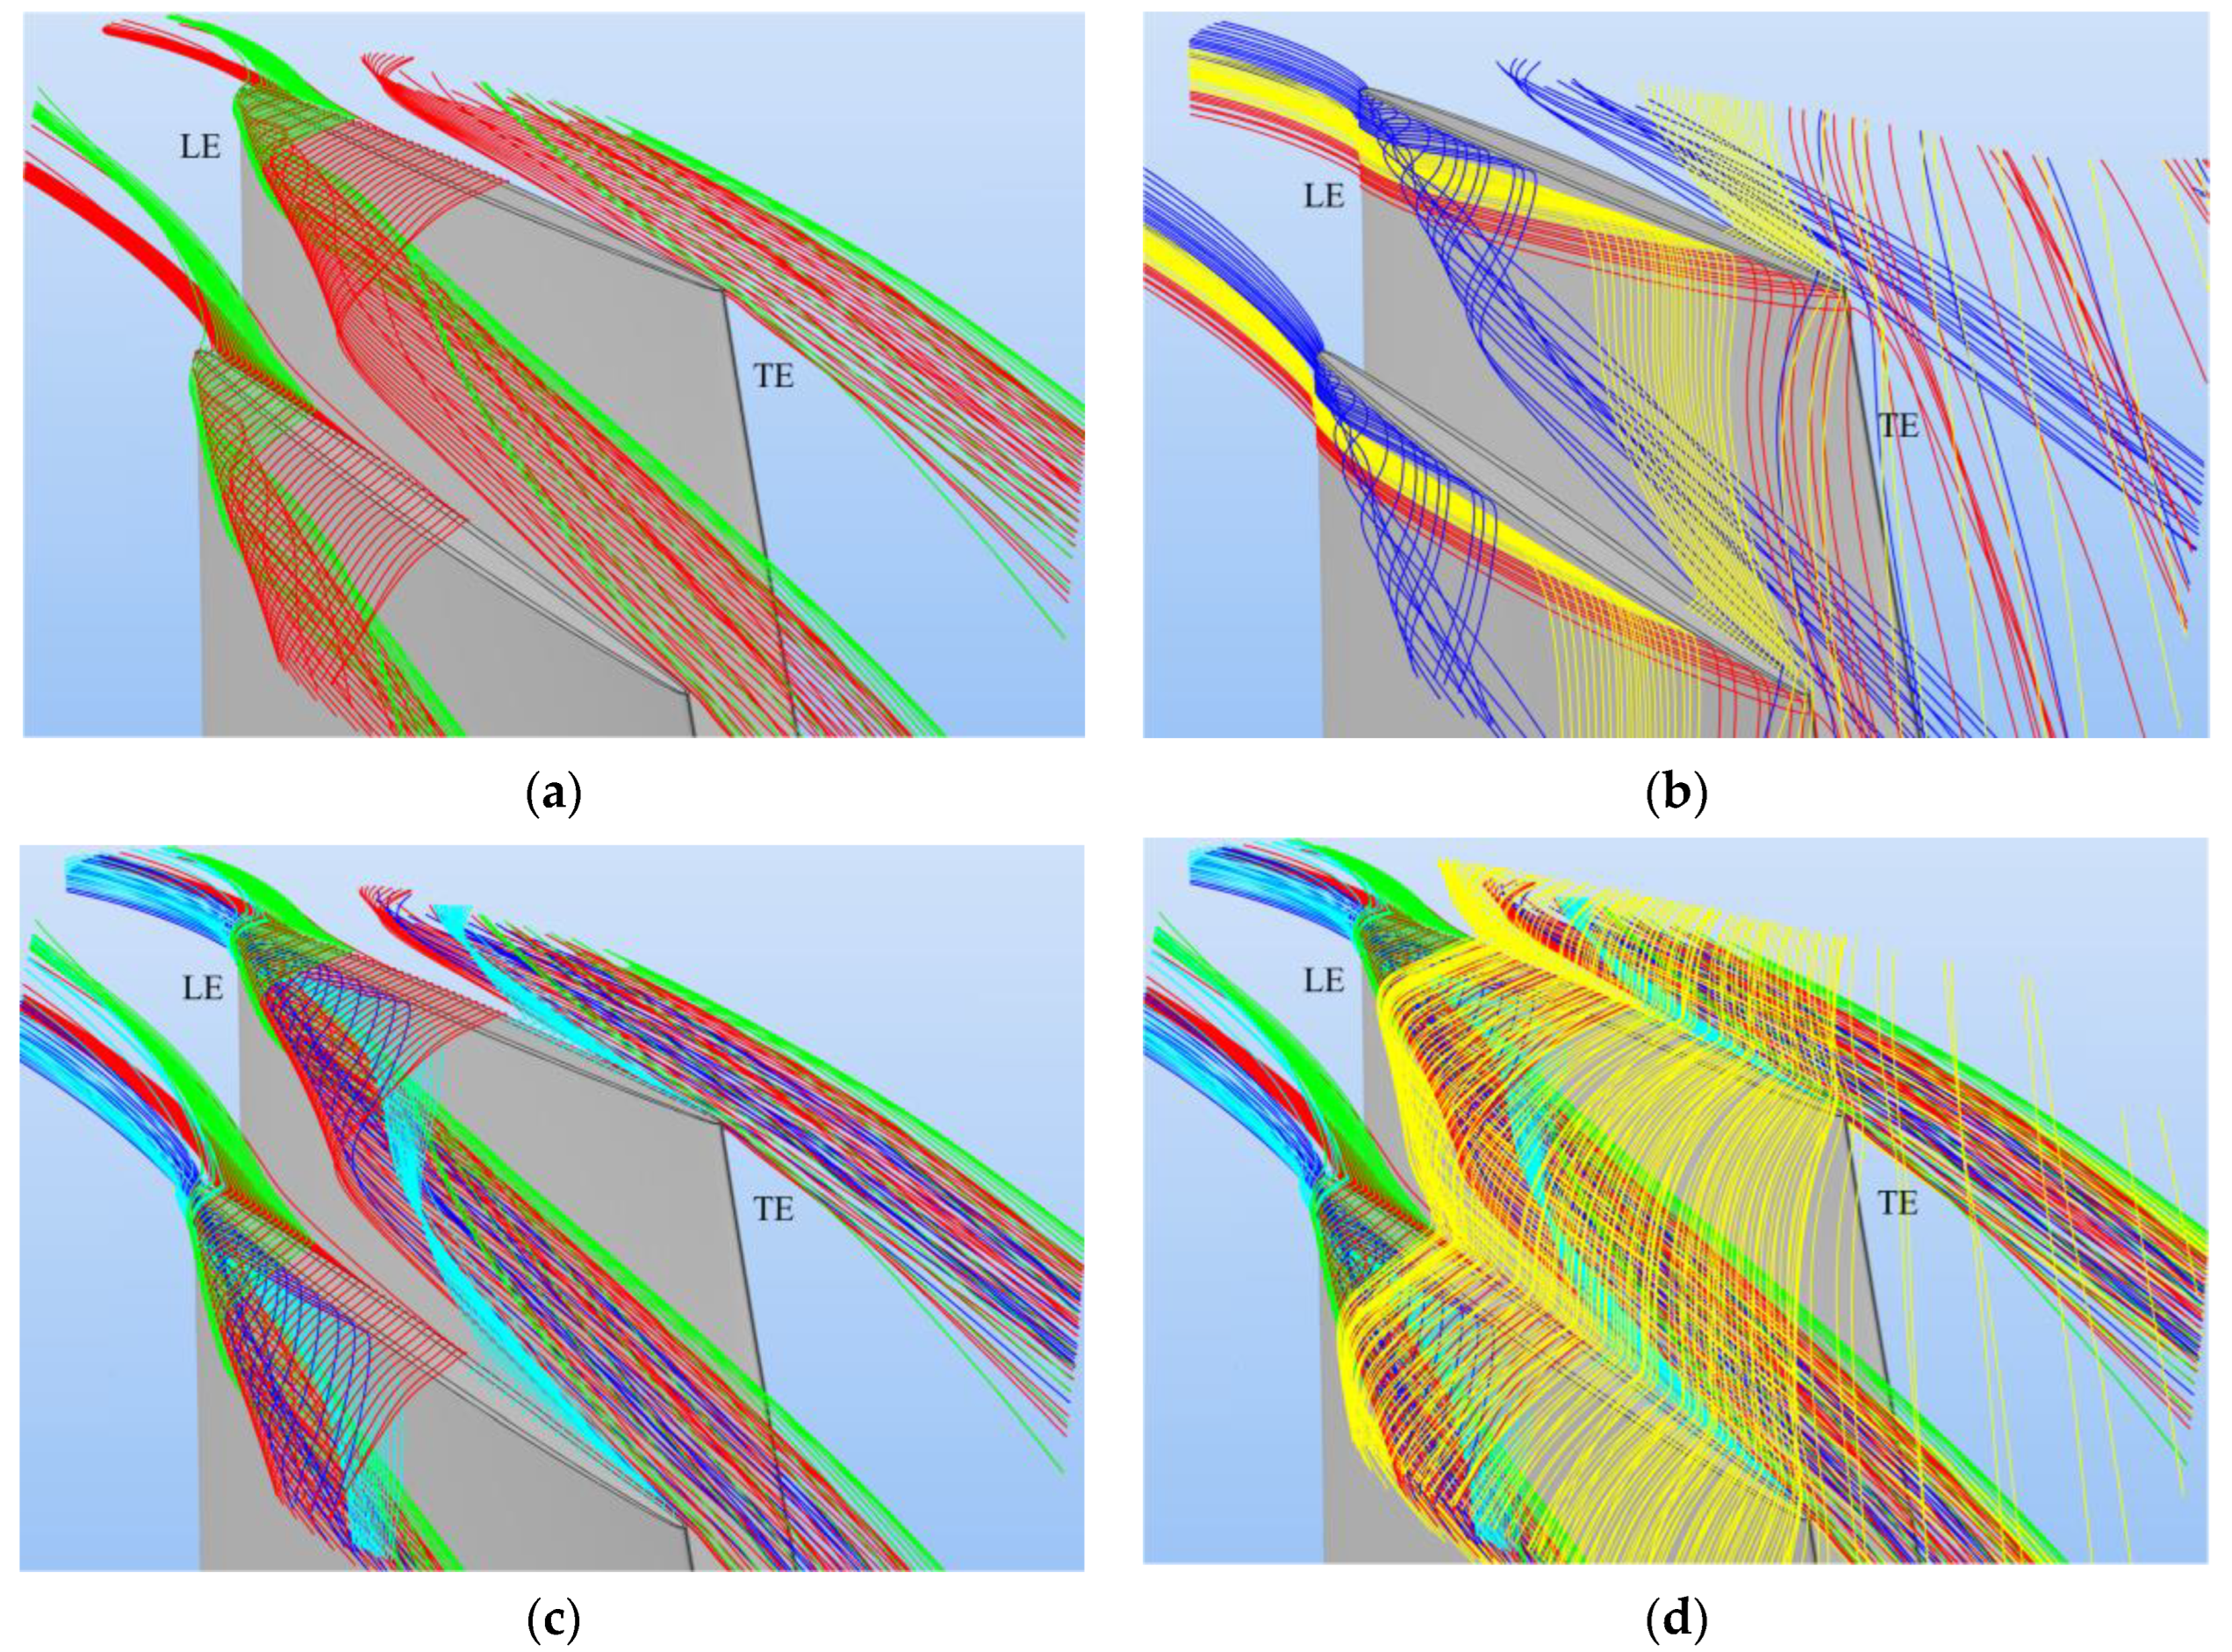
3.3.2. Limit Streamlines on Suction Surfaces

For a clearer analysis of flow separation at the trailing edge of the suction surface, a comparison of the limiting streamlines distribution on the suction surface is given in Figure 15. The increase of speed improves the static pressure coefficient on the suction surface, and the inverse pressure gradient of the rear part of the suction surface is significantly strengthened. The strong inverse pressure gradient thickens the trailing boundary layer of the blade suction surface, and flow separation occurs at 1.0 N. There is an imbalance between centrifugal force and pressure gradient in the boundary layer near the hub, and the hub boundary layer and the blade surface boundary layer block each other, resulting in the accumulation of low-energy fluids at the hub-suction surface area, forming the corner separation [28]. As the rotational speed increases, the accumulation of low-energy fluid in the corner area is serious, the separation is enhanced, and the proportion of separation region in the spanwise direction increases from 26% of 0.70 N to 32% of 1.0 N. Both the boundary layer separation at the trailing edge and the hub corner separation cause the irreversible losses and greatly deteriorate the compressor performance.

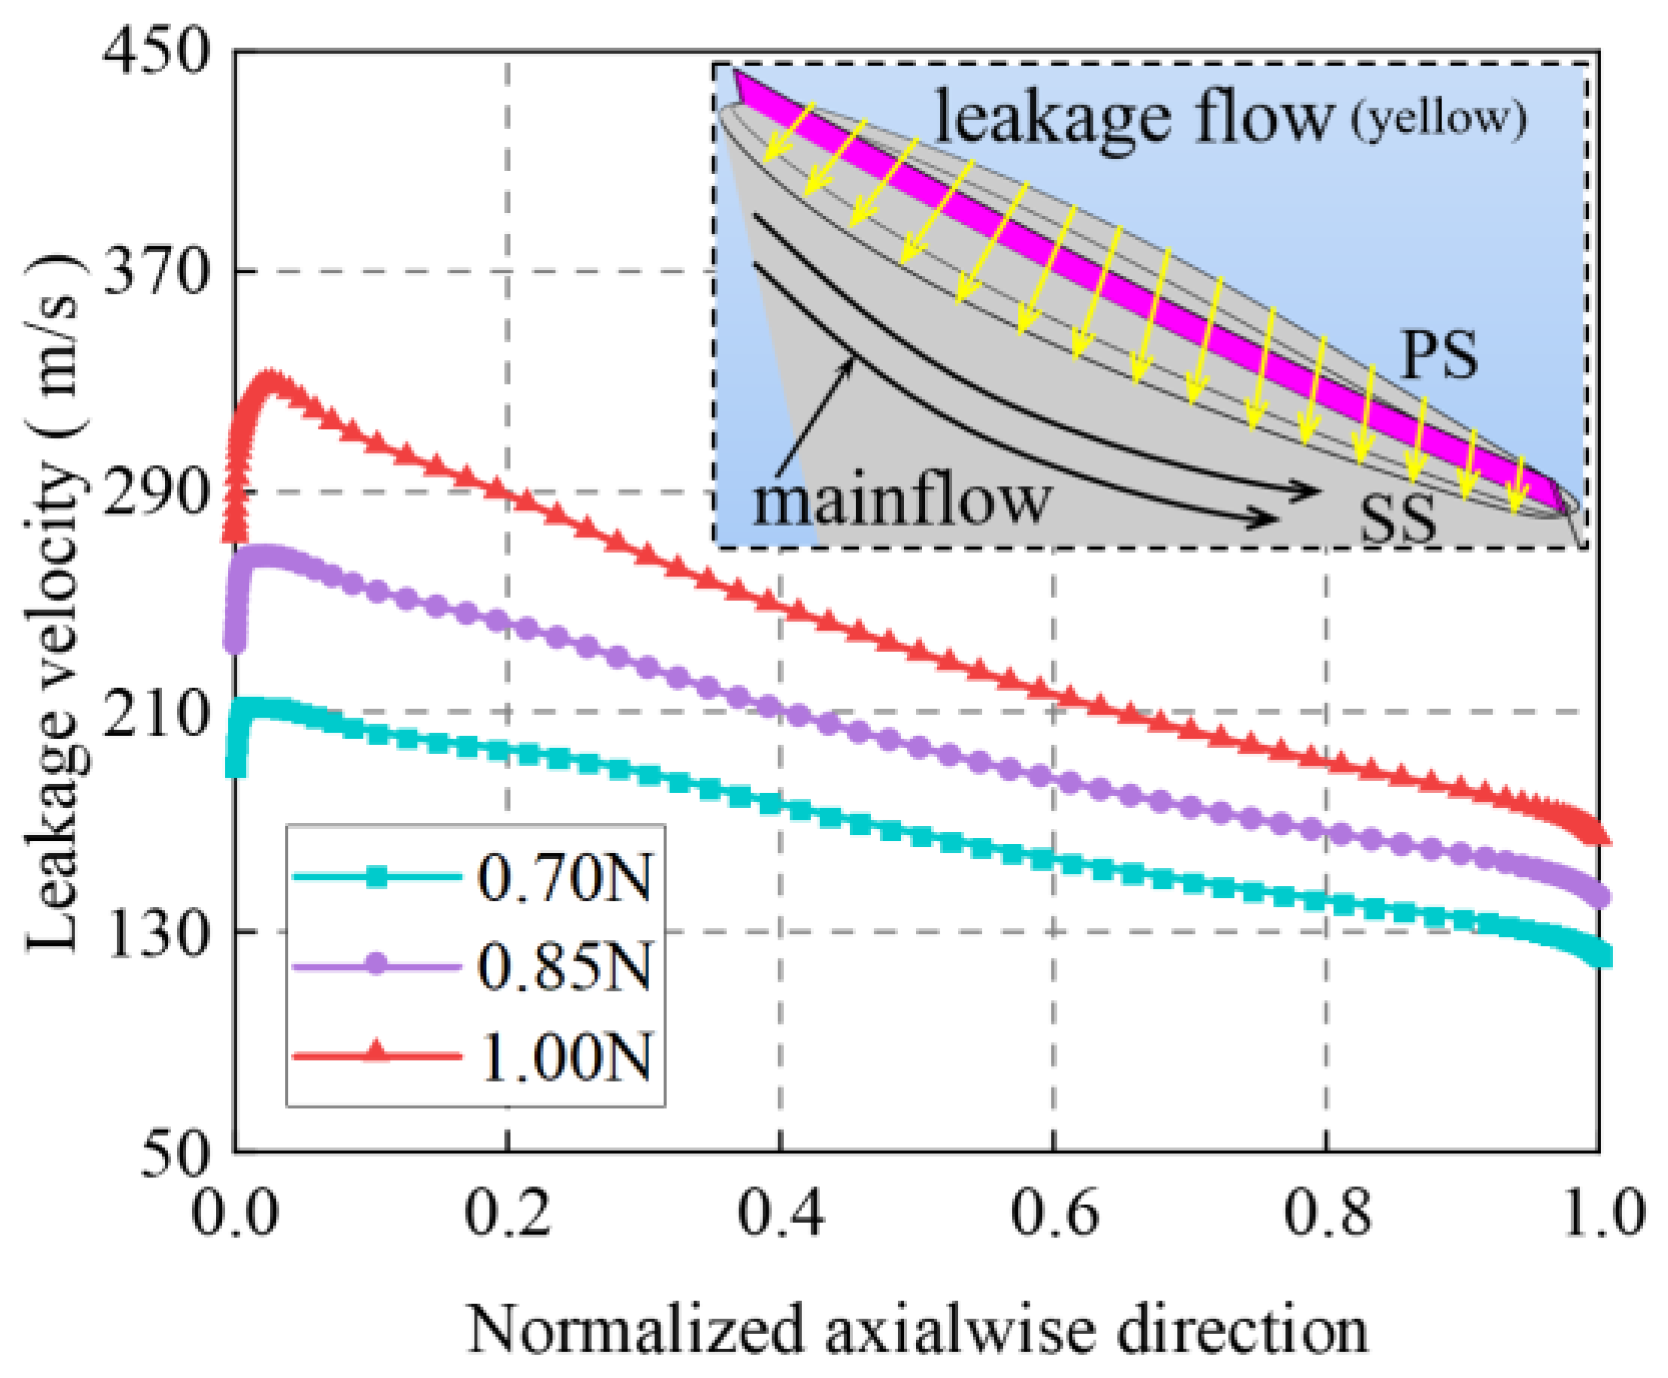
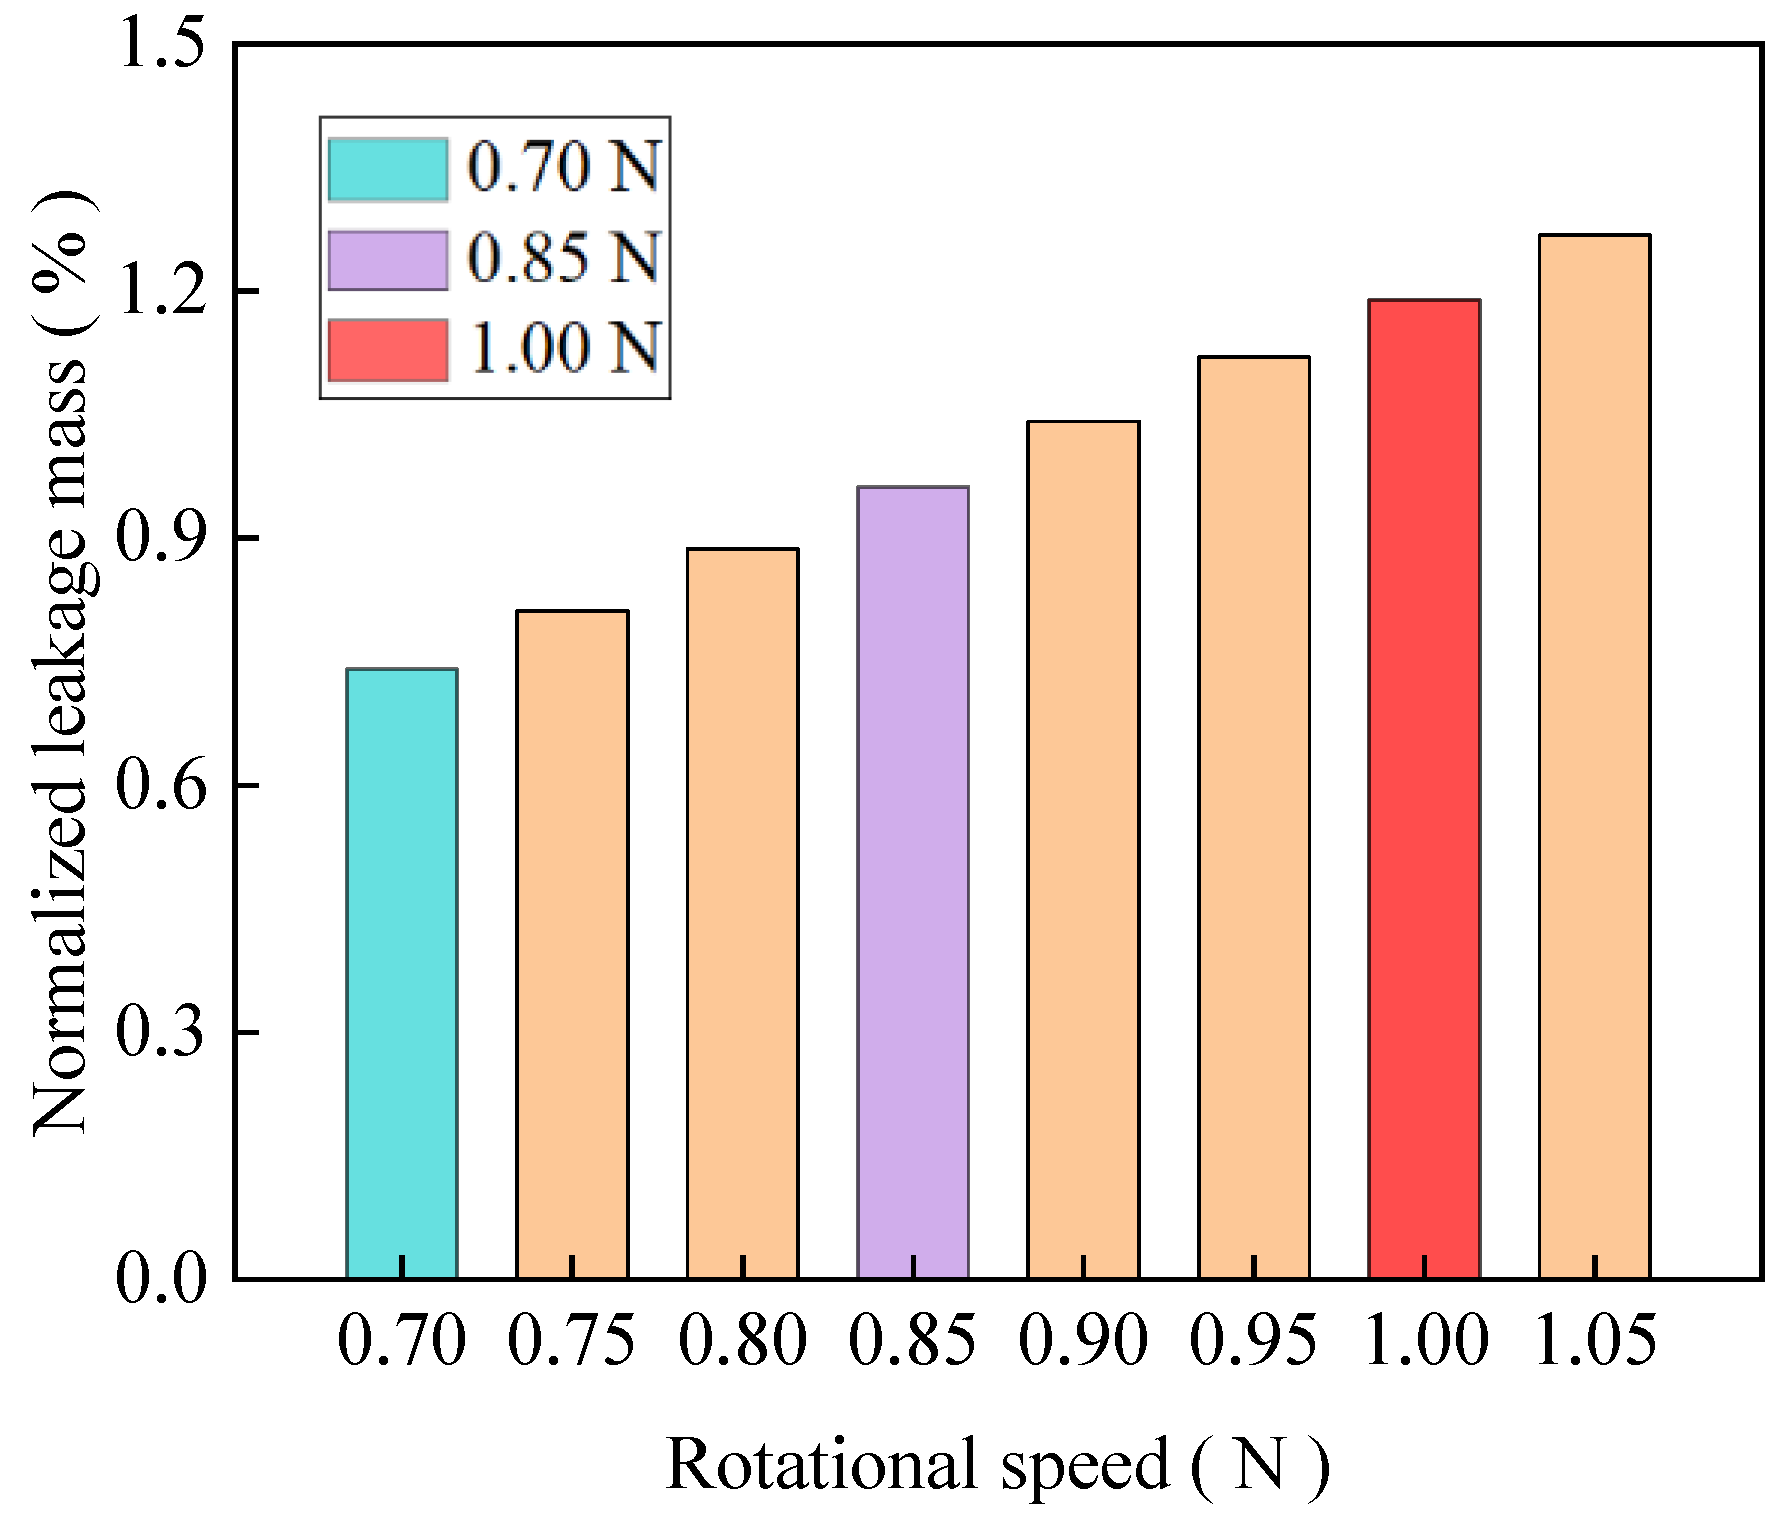
3.3.3. Tip Leakage Characteristics

The increase of rotational speed aggravates the tip leakage flow. Here, the leakage model proposed by Denton is taken to quantitatively compare the leakage velocity and leakage mass flow at DRS. From Equations (6) and (7), the increment of leakage velocity makes the leakage mass flow rate rise, provided that the tip clearance remains unchanged. Figure 16 compares the axial distribution of tip leakage velocity at three typical speeds. The magenta area at the upper right corner shows the leakage flow cross-section, and the yellow streamlines depict the leakage velocity. The leakage velocity increases rapidly at the leading edge of the clearance, and then decreases gradually along the axial direction. When the rotational speed improves, the leakage velocity increases in the entire axial range, and the peak leakage velocity moves slightly to the middle of the blade. This is the result of the interaction between the axial velocity and the circumferential velocity of the leakage flow increasing in unequal proportions. Figure 17 shows the comparison of the leakage mass distribution of the third stage rotor at DRS. The tip leakage is approximately proportional to the rotational speed.
The tip leakage flow has a strong three-dimensional characteristic, which greatly affects the efficiency and aerodynamic stability of compressors. Figure 18 demonstrates the 3D streamline distribution of the tip leakage on the third stage rotor. As noted in Figure 18a, in front of the clearance, the streamlines of the tip pressure surface are ejected into adjacent flow channel through the clearance, and the leakage streamlines are twisted with each other. Observed from the leading edge, they develop clockwise downstream as plotted in the red streamline. Close to the casing, the leakage streamlines wrap the red streamlines from the outside and twist them downstream as depicted in bright green streamlines. At the middle and rear of the clearance, most of the leakage streamlines do not develop downstream, but spray into adjacent flow channels, resulting in secondary leakage or even multiple leakage, as indicated in yellow streamlines in Figure 18d. Leakage flow significantly affects the streamline distribution at the tip suction surface of the rotor. The streamlines in front of the tip suction surface are entangled with the leakage flow, as shown in the blue streamlines in Figure 18b. The streamlines in the middle leave the suction surface and develop downstream towards the flow channel. Some converge with the leakage flow, while most of the other streamlines leak into the adjacent flow channels through the tip clearance near the trailing edge of the adjacent blade, resulting in secondary or multiple leakage, as given in yellow streamlines in Figure 18b. The streamlines at the trailing edge leave the suction surface under the effects of leakage flow and the pressure difference, and develop towards the downstream direction at a relatively high circumferential velocity, as shown in the red streamlines in Figure 18b. Figure 18c presents the coupling between tip leakage streamlines and part of the streamlines on the suction surface. Tip leakage is generated at the leading edge, converges with part of the streamlines on suction surface, twists, and develops in a clockwise direction to the downstream. At the same time, the streamlines in the middle area are separated from the suction surface, pass through the leakage flow and reach the clearance at the trailing edge of the adjacent blade, and spray to the adjacent channel. Figure 18d shows the comprehensive three-dimensional streamline distribution of tip leakage flow. One can see that tip leakage is complex, which has adverse effects on the compressor aerodynamic performance and flow stability.

3.4. Loss Analysis

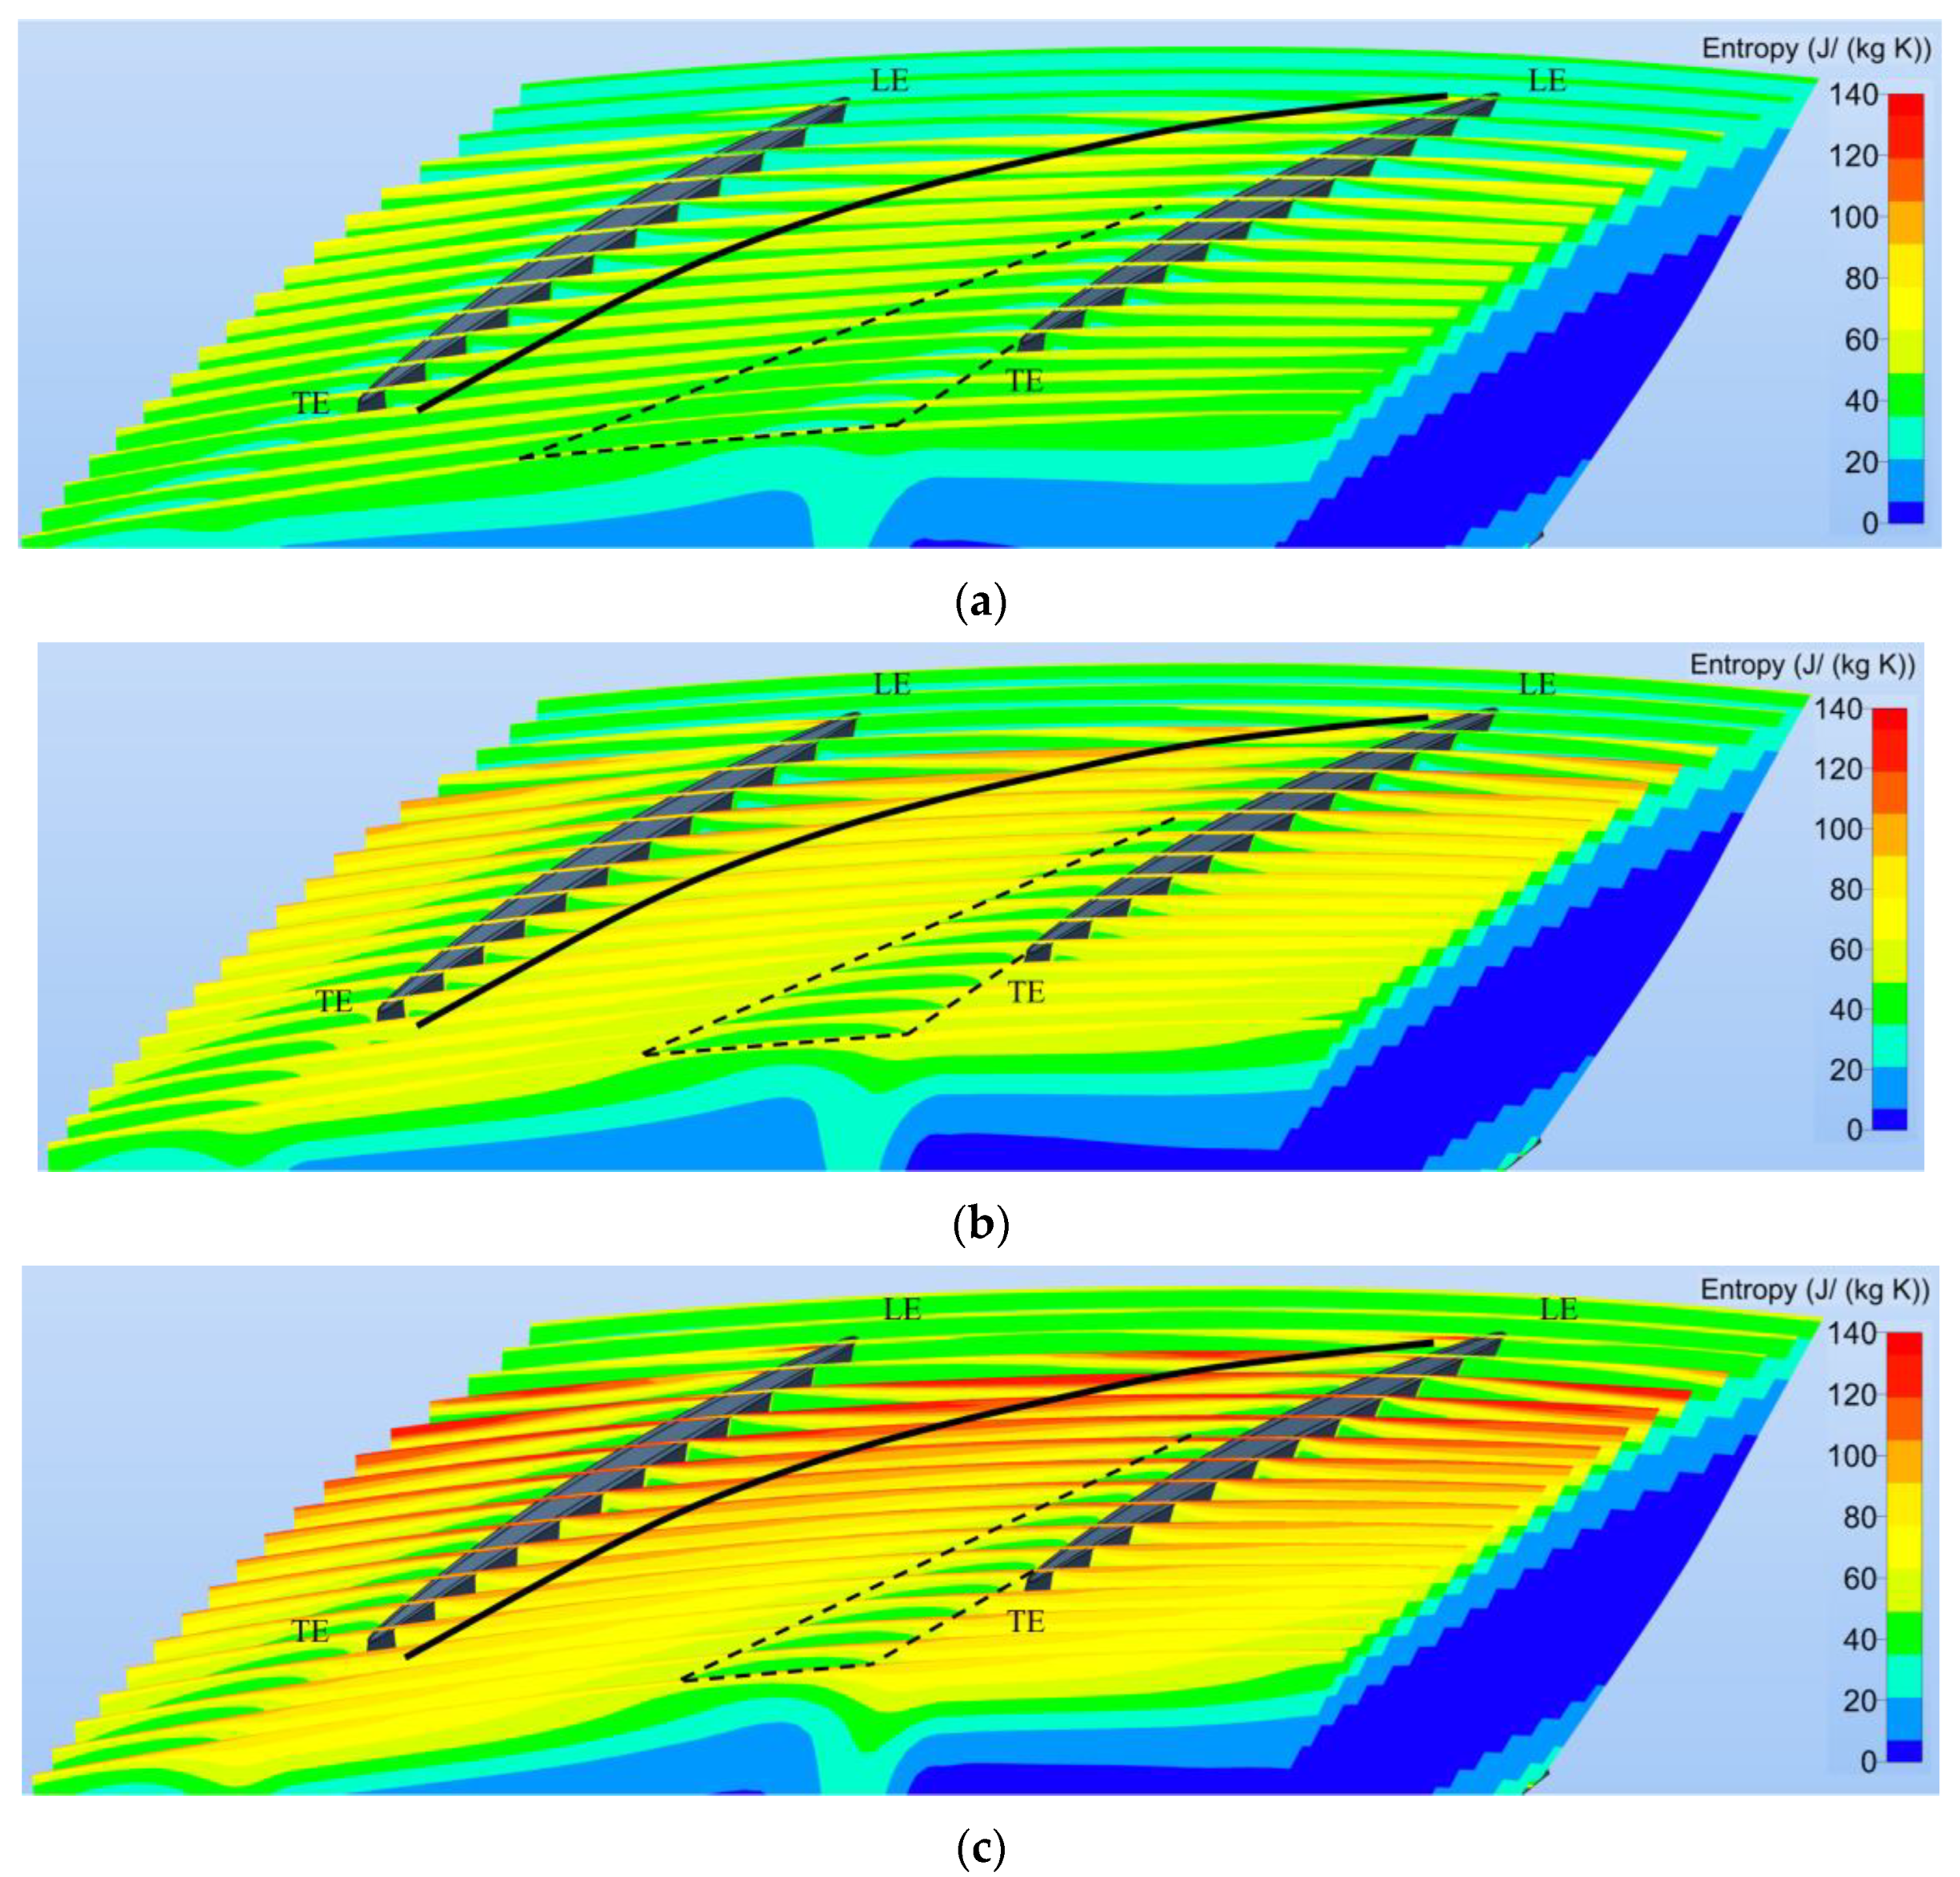
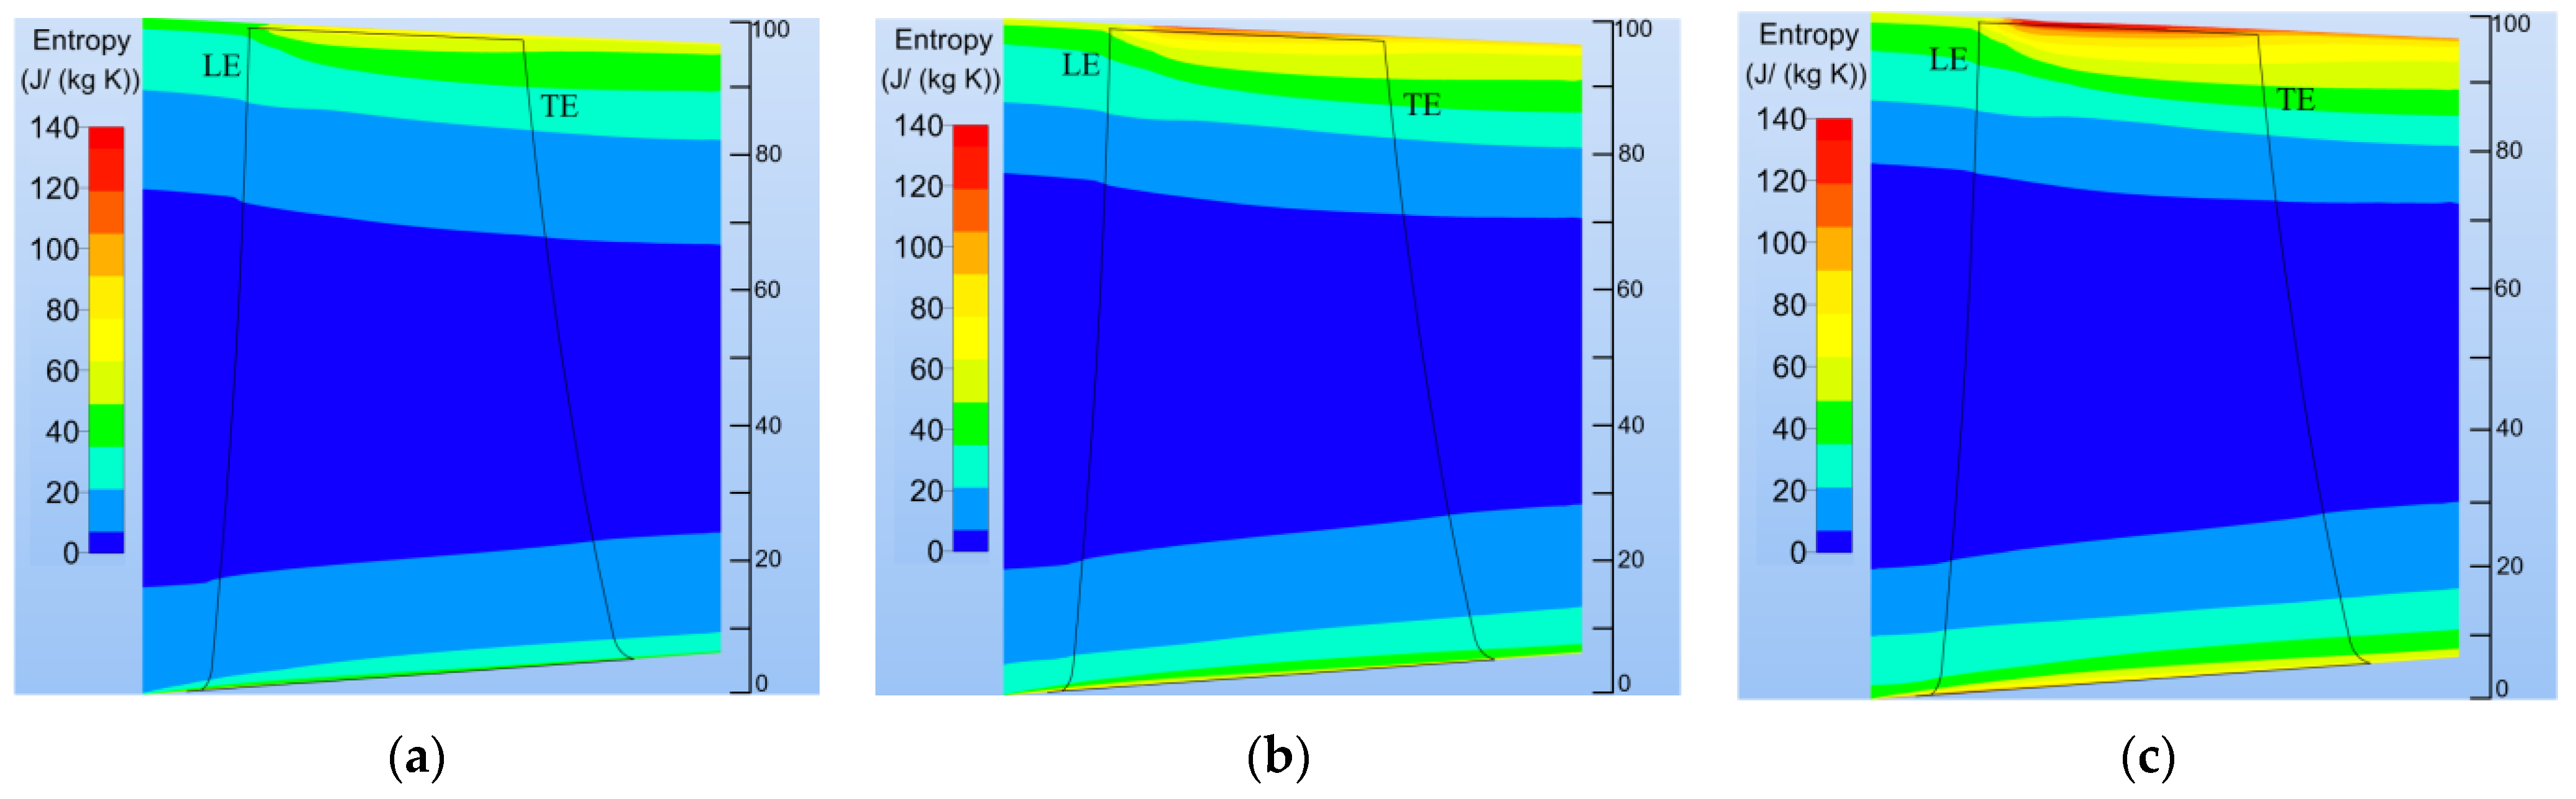
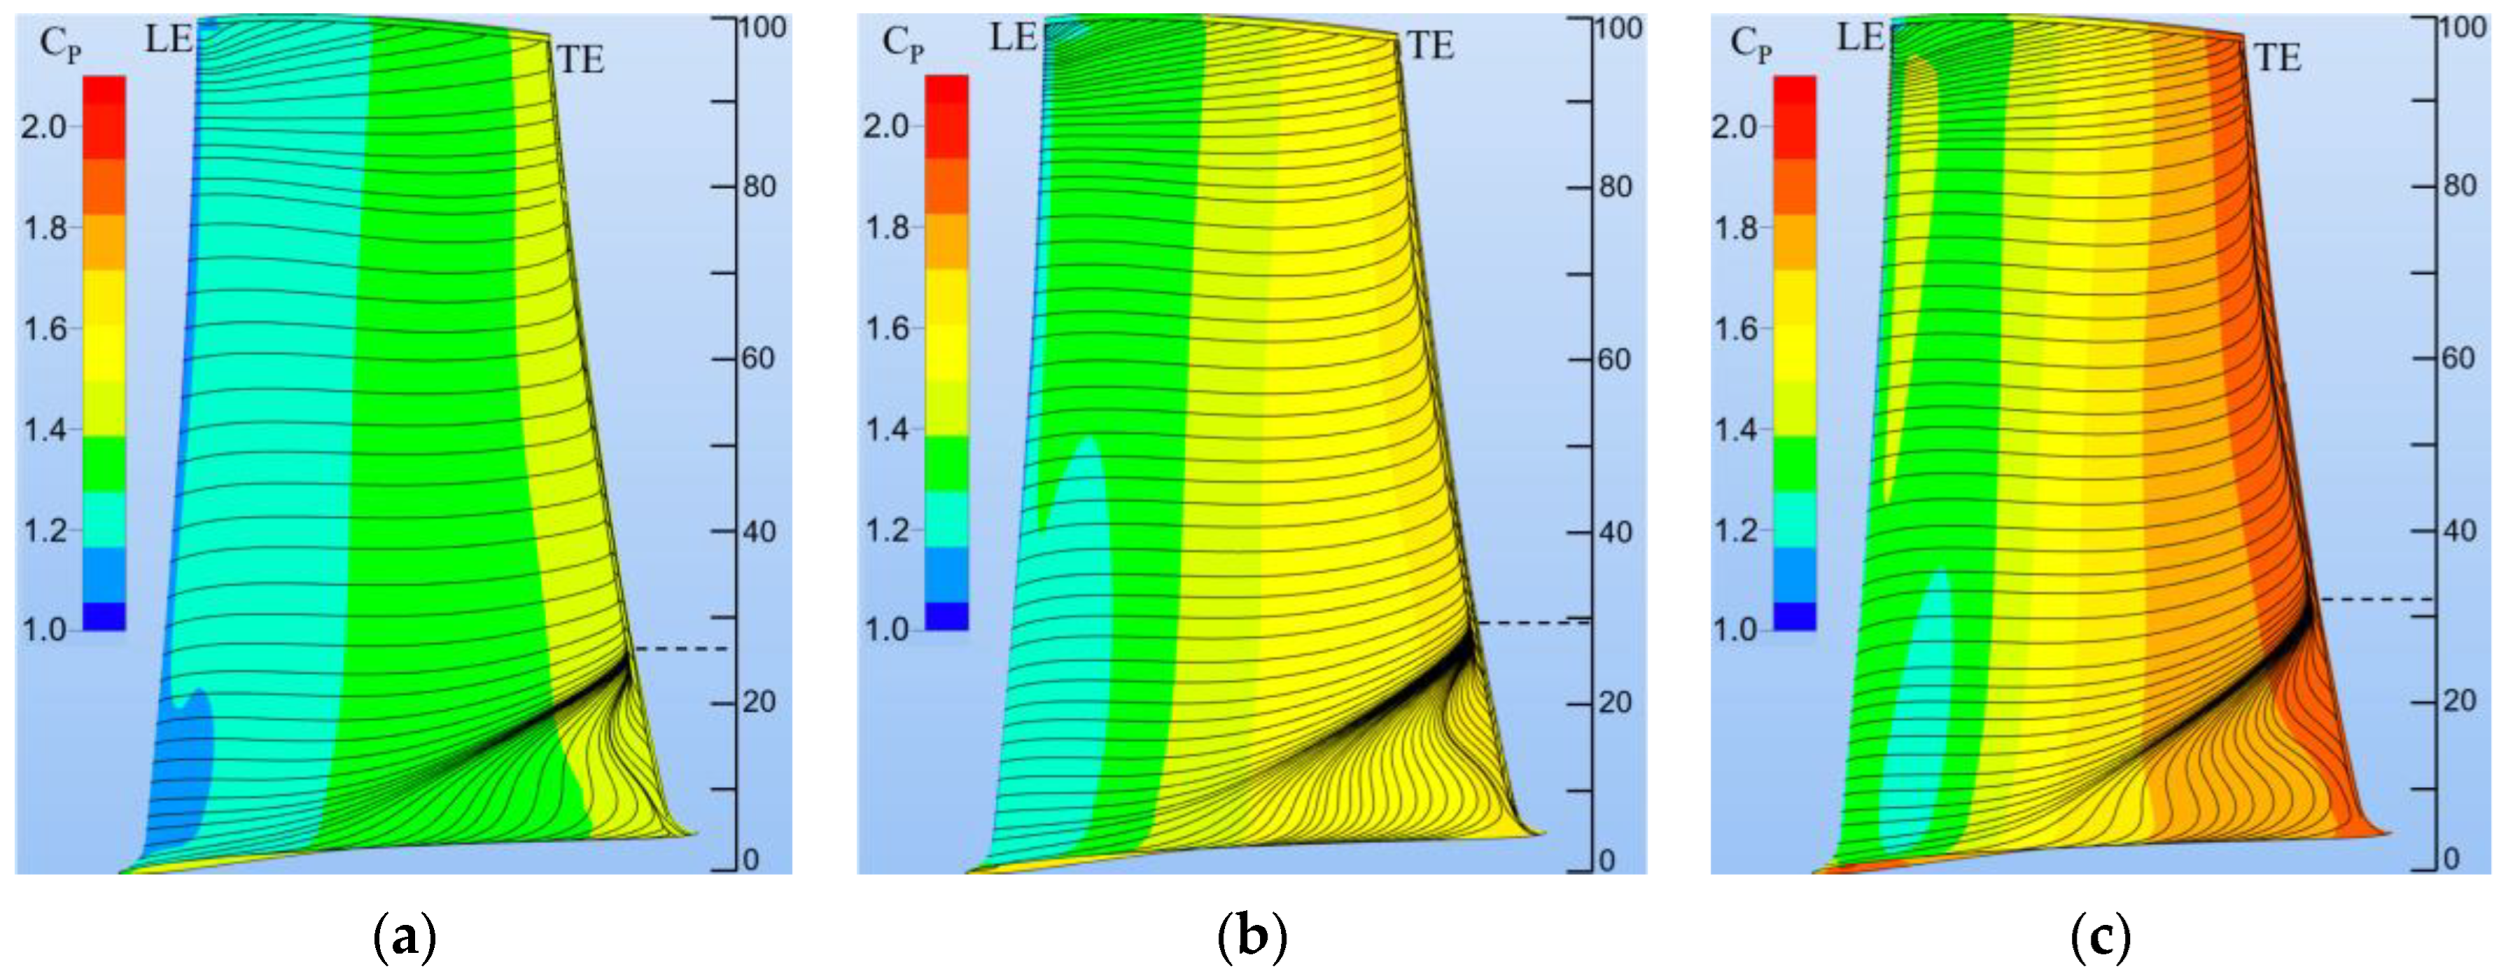
3.4.1. Entropy Contours

Tip leakage has a significant impact on the circumferential and spanwise mixing of the flow field, and the loss caused by tip leakage accounts for a large proportion of the total energy loss. Figure 19 shows the contours of entropy distribution for different S3 surfaces. It can be clearly seen that the entropy value of the rotor tip area rises significantly with the increase of speed, and the low entropy area decreases gradually, as shown by the black dashed line in the figure. The path of high entropy is consistent with the trajectory of the leakage flow vortex core, and it does not change significantly at DRS, as shown by the black solid line, indicating that the leakage vortex structure does not change remarkably with the variation of rotational speed, but the increase of rotational speed will accelerate the leakage velocity and the leakage volume, resulting in increased losses. Contours of the meridional entropy distribution of the third stage rotor are given in Figure 20. With the increase of rotational speed, the high entropy area of the blade root widens, and the high entropy area here is due to the flow separation caused by the accumulation of a large number of low-energy fluids in the hub corner area. The entropy value at the rotor tip increases when the rotational speed grows, and the high entropy region rises significantly at the same time. The reason is that when the rotational speed is high, the pressure difference between the suction and pressure surface at the rotor tip increases, the reverse pressure gradient of the channel strengthens, and the boundary layer of the casing thickens. The combined effect of three factors makes the leakage aggravated, which results in the obvious increment of the entropy value and the high entropy area.

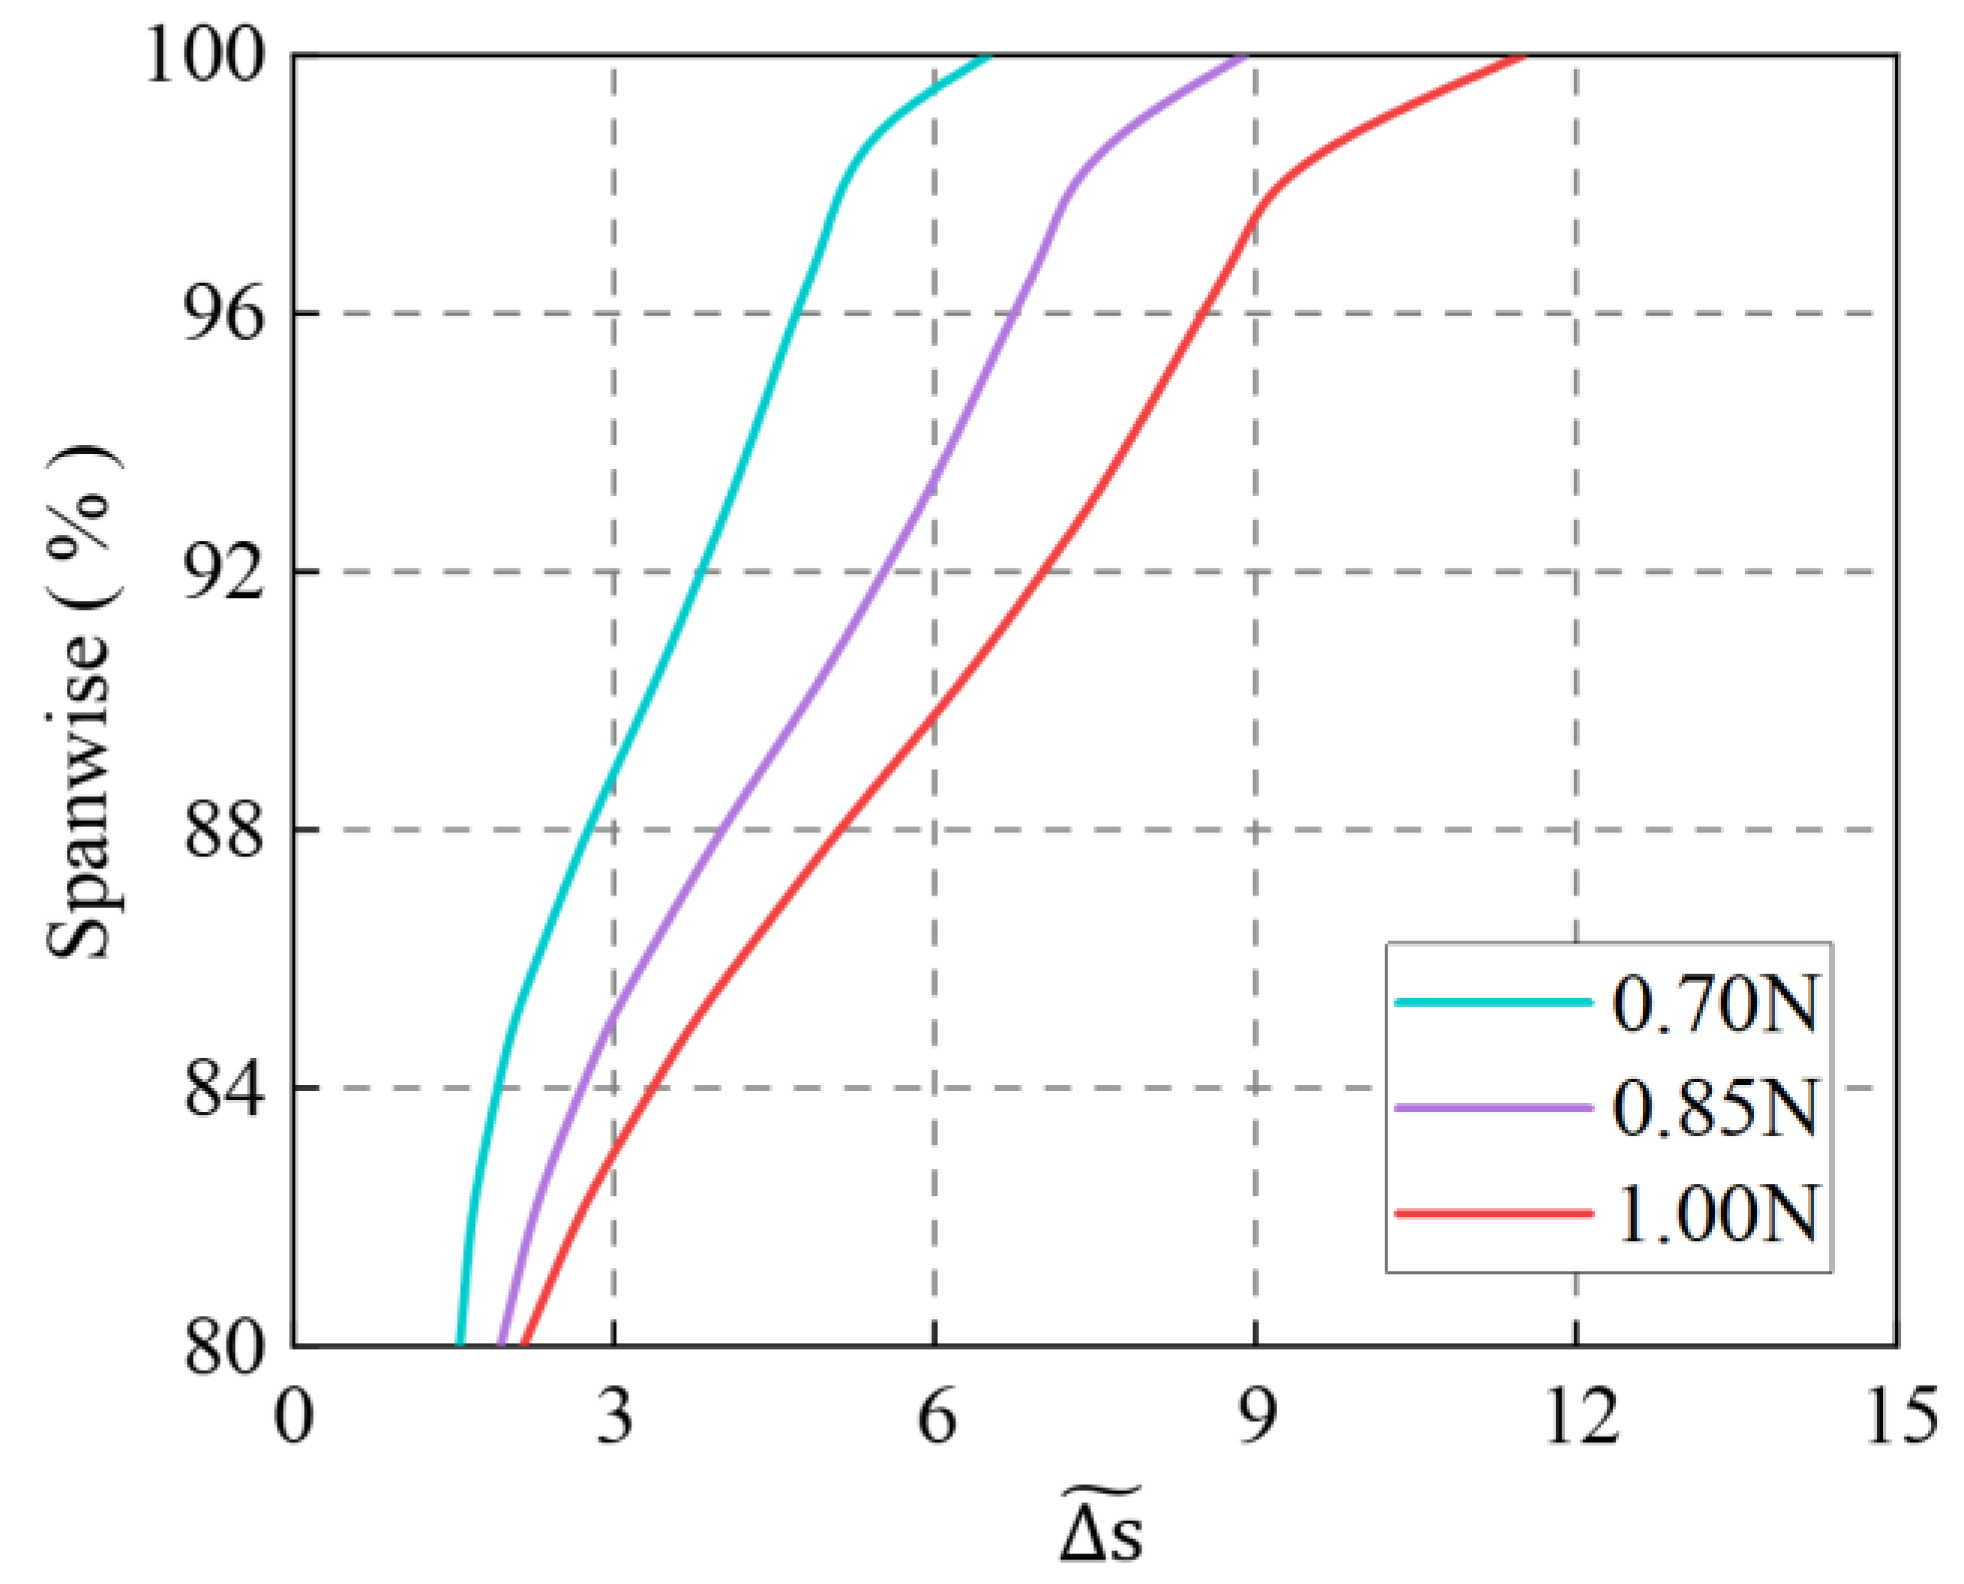
3.4.2. Spanwise Distribution of  Δ s ˜

To quantitatively investigate the loss caused by tip leakage flow at DRS, normalized entropy generation  Δ s ˜  is defined:
Δ s ˜ = Δ s Δ s r e f
where  Δ s  represents the entropy generation of the rotor from the inlet to the outlet, and  Δ s r e f  denotes the midspan entropy generation from the inlet to outlet. Figure 21 illustrates the spanwise distribution of  Δ s ˜  from 80% spanwise to the rotor tip. When the rotational speed is fixed, the closer to the rotor tip, the greater the normalized entropy generation increase, indicating the greater the loss here. When the rotational speed gradually increases,  Δ s ˜  rises significantly from 80% to the rotor tip in the spanwise direction, and the closer to the tip, the larger  Δ s ˜  is, indicating that the loss caused by tip leakage is greater, which is consistent with the contours of the meridional entropy distribution.

4. Conclusions

In this paper, a five-stage axial compressor for a specific CAES system is taken as the research object, and the DRS characteristics are studied by numerical methods. The conclusions are as follows.
(1)
The rotational speed adjustment can effectively realize the operation targets of compressor parameters in a CAES system. With speed adjustment, the working flow range increases from 11.5% to 54.0%. The maximum efficiency operation curve gives the maximum efficiency under different rotational speeds, and provides a reference for the efficient operation of the compressor.
(2)
The relative Mach number and relative flow angle at the inlet of the inlet stage rotor rise uniformly with increases in the rotational speed; the comprehensive map of the inlet parameters gives a reasonable distribution range and the distribution at near-highest efficiency point, and provides a practical guidance for the stable operation of the compressor.
(3)
With the increase of rotational speeds, the corner separation is gradually enhanced, and the flow structure of the leakage does not change obviously, while the leakage flow velocity and leakage amount improve significantly. Leakage flow in front of the tip clearance is entangled with part of the streamlines on suction surfaces and develops clockwise downstream to adjacent channel. Streamlines from the rear part of the clearance forms secondary or multiple leakages.
(4)
With the increase of rotational speed, the loss caused by leakage increases significantly both in the circumferential and spanwise directions of the rotor tip.

5. Limitations and Future Work

Due to the limitations of computational resources and time costs, this work uses steady numerical simulation to explore the variable rotational speed characteristics of a five-stage axial flow compressor in a specific compressed air energy storage system. The speed regulation strategy and internal flow field changes to achieve efficient operation of the compressor are obtained. Future work is to conduct experimental testing on the compressor to verify the speed regulation strategy, and at the same time, to conduct the unsteady numerical simulation and unsteady experimental measurement of the internal flow of the compressor, in order to obtain a more comprehensive understanding of the variable speed characteristics of the compressor.

Author Contributions

Conceptualization, P.L.; methodology, P.L.; software, P.L.; validation, P.L., X.Z. and J.L.; formal analysis, P.L.; data curation, P.L.; writing—original draft preparation, P.L.; writing—review and editing, J.L. and Z.Z.; supervision, H.C.; funding acquisition, X.Z. All authors have read and agreed to the published version of the manuscript.

Funding

This research was funded by the National Natural Science Foundation of China (52106278), the National Science and Technology Major Projects of China (J2019-Ⅱ-0008-0028), Science and Technology Program of Inner Mongolia Autonomous Region (2021ZD0030), and the Science and Technology Foundation of Guizhou Province ([2020]1Y419).

Data Availability Statement

Not applicable.

Conflicts of Interest

The authors declare no conflict of interest.

Nomenclature

m Compressor mass flow
m d e s i g n Compressor mass flow at design condition
m n o r Normalized mass flow
m n o r , c h o k e Normalized mass flow at near choke condition
m n o r , s t a l l Normalized mass flow at near stall condition
P t , i n Total pressure at compressor inlet
Δ s ˜ normalized entropy generation
Δ s entropy generation
Δ s r e f midspan entropy generation
T o u t Static temperature at compressor outlet
T i n Static temperature at compressor inlet
y + Non-dimensional wall distance for the first grid point
π t o t Total pressure ratio
γ Specific heat ratio
η i s e Isentropic efficiency
CAEScompressed air energy storage
DRSdifferent rotational speeds
IGVinlet guide vanes
PSPressure surface
SSSuction surface
LELeading edge
TETrailing edge

References

  1. Chen, H.; Cong, T.N.; Yang, W.; Tan, C.; Li, Y.; Ding, Y. Progress in electrical energy storage system: A critical review. Prog. Nat. Sci. 2009, 19, 291–312. [Google Scholar] [CrossRef]
  2. Chen, H.; Ling, H.; Xu, Y. Physical Energy Storage Technology in Energy Revolution. Bull. Chin. Acad. Sci. 2019, 34, 450–459. [Google Scholar]
  3. Chen, H.; Li, H.; Ma, W.; Xu, Y.; Wang, Z.; Chen, M.; Hu, D.; Li, X.; Tang, X.; Hu, Y.; et al. Research progress of energy storage technology in China in 2021. Energy Storage Sci. Technol. 2022, 11, 1052–1076. [Google Scholar]
  4. Succar, S.; Williams, R.H. Compressed air energy storage: Theory, resources, and applications for wind power. Princet. Environ. Inst. Rep. 2008, 8, 81. [Google Scholar]
  5. Chen, H.; Liu, J.; Guo, H.; Xu, Y.; Tan, C. Technical principle of compressed air energy storage system. Energy Storage Sci. Technol. 2013, 2, 146–151. [Google Scholar]
  6. Gong, W.; Zhang, H.; Nie, C. Investigation on the aerodynamic adjustment between inlet guide-vane, stator, and operating speed of three-stage axial compressor. J. Aerosp. Power 2009, 24, 1122–1128. [Google Scholar]
  7. Hu, Y.; Nie, C. Exploration of combined adjustment laws about IGV, stator and rotational speed in off-design conditions in an axial compressor. Sci. Sin. Technol. 2010, 53, 969–975. [Google Scholar] [CrossRef]
  8. Steinke, R.J. Design of 9.271-Pressure-Ratio 5-Stage Core Compressor and Overall Performance for First 3 Stages; NASA-2597; NASA: Washington, DC, USA, 1986. [Google Scholar]
  9. Greitzer, E.M. Surge and Rotating Stall in Axial Flow Compressors-Part I: Theoretical Compression System Model. J. Eng. Power 1976, 98, 190–198. [Google Scholar] [CrossRef]
  10. Greitzer, E.M. Surge and Rotating Stall in Axial Flow Compressors-Part II: Experimental Results and Comparison with Theory. J. Eng. Power 1976, 98, 199–211. [Google Scholar] [CrossRef]
  11. Peacock, R.E. A review of turbomachinery tip gap effects: Part 1: Cascades. Int. J. Heat Fluid Flow 1982, 3, 185–193. [Google Scholar] [CrossRef]
  12. Peacock, R.E. A review of turbomachinery tip gap effects: Part 2: Rotating machinery. Int. J. Heat Fluid Flow 1983, 4, 3–16. [Google Scholar] [CrossRef]
  13. Copenhaver, W.W.; Mayhew, E.R.; Hah, C.; Wadia, A.R. The Effect of Tip Clearance on a Swept Transonic Compressor Rotor. J. Turbomach. 1996, 118, 230–239. [Google Scholar] [CrossRef]
  14. Du, J.; Lin, F.; Zhang, H.; Chen, J. Numerical Investigation on the Self-Induced Unsteadiness in Tip Leakage Flow for a Transonic Fan Rotor. J. Turbomach. 2010, 132, 021017.1–021017.9. [Google Scholar] [CrossRef]
  15. Kato, H.; Taniguchi, H.; Matsuda, K.; Funazaki, K.I.; Kato, D.; Pallot, G. Experimental and numerical investigation on compressor cascade flows with tip clearance at a low Reynolds number condition. J. Therm. Sci. 2011, 20, 481–485. [Google Scholar] [CrossRef]
  16. Yang, D.; Zheng, X.; Li, Q. An 11-stage axial compressor performance simulation considering the change of tip clearance in different operating conditions. Proc. Inst. Mech. Eng. Part A J. Power 2014, 228, 614–625. [Google Scholar]
  17. Mao, X.; Liu, B.; Zhang, B. Hub clearance effects of a cantilevered tandem stator on the performance and flow behaviors in a small-scale axial flow compressor. Aerosp. Sci. Technol. 2019, 91, 219–230. [Google Scholar] [CrossRef]
  18. Chen, Z.; Wu, Y.; Yang, G.; An, G.; Wang, B. Influence of Different Rotor Speeds on the Unsteady Flow Near Tip Region in a Subsonic Axial Flow Compressor Rotor. J. Eng. Thermophys. 2017, 38, 993–1000. [Google Scholar]
  19. Zhong, J.; Li, X.; Gao, Y. Loss characteristic of stator under different rotational speeds in transonic stage environment. J. Aerosp. Power 2017, 32, 2243–2252. [Google Scholar]
  20. Spalart, P.R.; Allmaras, S.R. A one-equation turbulence model for aerodynamic flows. In Proceedings of the 30th Aerospace Sciences Meeting and Exhibit, Reno, NV, USA, 6–9 January 1992. [Google Scholar]
  21. Inoue, M.; Kuroumaru, M.; Fukuhara, M. Behavior of Tip Leakage Flow in an Axial Flow Compressor Rotor. In Proceedings of the ASME Turbo Expo 2006: Power for Land, Sea, and Air, Barcelona, Spain, 8–11 May 2006; pp. 195–204. [Google Scholar]
  22. Reid, L.; Moore, R.D. Design and Overall Performance of Four Highly Loaded, High-Speed Inlet Stages for an Advanced High-Pressure-Ratio Core Compressor; NASA-TP-1337; NASA: Washington, DC, USA, 1978. [Google Scholar]
  23. Reid, L.; Moore, R.D. Performance of Single-Stage Axial-Flow Transonic Compressor with Rotor and Stator Aspect Ratios of 1.19 and 1.26, Respectively, and with Design Pressure Ratio of 1.82; NASA-TP-1338; NASA: Washington, DC, USA, 1978. [Google Scholar]
  24. Du, G.; Jia, L. Thin plate splines applied to interpolation of spatial data. Comput. Eng. Appl. 2009, 45, 238–240. [Google Scholar]
  25. Denton, J.D. Loss Mechanisms in Turbomachines. J. Turbomach. 1993, 115, 621–656. [Google Scholar] [CrossRef]
  26. Gui, X.; Teng, J.; Liu, B. Compressor Aerothermodynamics and Its Applications in Aircraft Engines; Shanghai Jiaotong University Press: Shanghai, China, 2014. [Google Scholar]
  27. Zhang, C.; Hu, J.; Wang, Z.; Yan, W.; Yin, C.; Gao, X. Numerical Study on Tip Clearance Flow Structure of an Axial Flow Compressor Rotor. Acta Aeronaut. Astronaut. Sin. 2014, 35, 1236–1245. [Google Scholar]
  28. Gbadebo, S.A.; Cumpsty, N.A.; Hynes, T.P. Three-Dimensional Separations in Axial Compressors. J. Turbomach. 2005, 127, 331–339. [Google Scholar] [CrossRef]
Figure 1. Compressor geometric modeling process.
Energies 16 04383 g001
Figure 2. 3D model of the five-stage axial compressor.
Energies 16 04383 g002
Figure 3. Numerically calculated channel and blade grid structure.
Energies 16 04383 g003
Figure 4. Schematic diagram of grid details.
Energies 16 04383 g004
Figure 5. Grid independence verification.
Energies 16 04383 g005
Figure 6. Comparison of numerical and experimental results of Stage 35: (a) Total pressure ratio; (b) Isentropic efficiency.
Energies 16 04383 g006
Figure 7. Spanwise distribution of Stage 35 outlet flow parameters: (a) Total pressure ratio; (b) Total temperature ratio.
Energies 16 04383 g007
Figure 8. Simplified leakage mixing model.
Energies 16 04383 g008
Figure 9. Characteristic curves of axial compressors at DRS: (a) Total pressure ratio; (b) Isentropic efficiency.
Energies 16 04383 g009
Figure 10. Comprehensive performance diagram at DRS.
Energies 16 04383 g010
Figure 11. Rotational speed adjustment strategy.
Energies 16 04383 g011
Figure 12. Spanwise distribution of inlet parameters at DRS: (a) Inlet relative Mach; (b) Inlet relative flow angle.
Energies 16 04383 g012
Figure 13. Comprehensive map of inlet parameters at DRS.
Energies 16 04383 g013
Figure 14. Distribution of 3D streamlines: (a) 0.70 N; (b) 0.85 N; (c) 1.0 N.
Energies 16 04383 g014
Figure 15. Distribution of the limiting streamlines on the suction surface: (a) 0.70 N; (b) 0.85 N; (c) 1.0 N.
Energies 16 04383 g015
Figure 16. Axial distribution of tip leakage velocity.
Energies 16 04383 g016
Figure 17. Leakage mass distribution at DRS.
Energies 16 04383 g017
Figure 18. Distribution of the 3D streamlines on tip leakage: (a) 3D streamlines for front clearance leakage; (b) 3D streamlines on tip suction surface; (c) Coupling of tip leakage and suction surface streamlines; (d) Comprehensive 3D streamlines of tip leakage.
Energies 16 04383 g018
Figure 19. Contours of the entropy distribution for different S3 surfaces: (a) 0.70 N; (b) 0.85 N; (c) 1.0 N.
Energies 16 04383 g019
Figure 20. Contours of the meridional entropy distribution: (a) 0.70 N; (b) 0.85 N; (c) 1.0 N.
Energies 16 04383 g020
Figure 21. Spanwise distribution of normalized entropy generation.
Energies 16 04383 g021
Table 1. Main parameters of the five-stage axial compressor.
ParameterValueParameterValue
Inlet total pressure (kPa)99.525Stage count5
Inlet total temperature (K)293.15IGV count33
Total pressure ratio3.0Rotor vane count29/33/41/45/45
Isentropic efficiency0.893Stator vane count41/47/59/67/67
Table 2. Settings of numerical simulation conditions.
ModelParameterValue
Fluid modelPerfect gas/
Flow modelSteady, Turbulent Navier-Stokes/
Turbulence modelSpalart-Allmaras/
R/S connectionNon-Reflecting 1D Mixing Plane/
InletVr/∣V∣ (V extrapolated)0
Vt/∣V∣ (V extrapolated)0
Vz/∣V∣ (V extrapolated)1
Absolute total pressure (kPa)99,525 Pa
Absolute total temperature (K)293.15 K
Turbulent viscosity2.0 × 10−5
OutletAveraged static pressure (Pa)1.5 × 10⁵
Solid wall surfaceAdiabatic non-slip condition/
Numerical modelCFL number3
Initial SolutionEstimated static pressure for R/S (kPa)/
92.7/117.8/124.7/152.9/162.5/198.5/210.8/245.8/255.4/283.5
Table 3. Grid independence verification of five-stage axial compressor.
Grid Number
(Million)
Normalized Mass FlowTotal Pressure RatioIsentropic Efficiency
Value (%)Error (%)ValueError (%)Value (%)Error (%)
6.999.330.773.0140.8988.510.87
8.299.750.353.0210.6689.060.31
9.6100.070.043.0360.1689.260.02
10.9100.10-3.041-89.28-
12.1100.10-3.041-89.28-
Table 4. Main parameters of NASA Stage 35 [22].
ParameterValueParameterValue
Rotor blade count36Total pressure ratio 1.82
Stator blade count46Adiabatic efficiency0.828
Rotational speed (rpm)17,188.7Rotor aspect ratio1.19
Mass flow (kg/s)20.8Stator aspect ratio1.26
Table 5. Part of results of the numerical simulation.
Normalized Mass FlowTotal Pressure RatioIsentropic Efficiency
0.88191.9090.7330
0.88671.9110.7366
0.89491.9150.7435
---
0.99951.7410.8370
1.00001.6890.8286
Table 6. Operation targets of the compressor in a specific CAES system.
Operation TargetsInlet Guide Vane/Stator AdjustmentRotation Speed
Adjustment
Specified pressure ratio range2.2~3.22.2~3.2
Normalized mass flow range (%)77.1~99.977~105.1
Isentropic efficiency range0.854~0.8910.879~0.894
Disclaimer/Publisher’s Note: The statements, opinions and data contained in all publications are solely those of the individual author(s) and contributor(s) and not of MDPI and/or the editor(s). MDPI and/or the editor(s) disclaim responsibility for any injury to people or property resulting from any ideas, methods, instructions or products referred to in the content.

