1. Introduction
During recent decades, the amount of research on constructing smart energy-conserving buildings has increased [
1]. Scientists and engineers are making efforts to understand and control the dynamic needs of energy for buildings. According to the International Energy Agency (IEA) [
2], about 32% of total generated energy is consumed by buildings, which include residential apartments and offices, and more than 40% of this energy is used for space heating purposes. In European countries, during winter, the temperature is mostly low, and thus, the energy consumption for space heating increases. This demand for heating load goes even higher in Scandinavian countries. Thus, to fulfill these needs, fossil fuels are used for energy generation, resulting in a huge amount of CO
emissions. In general, various parameters such as the thermal model of buildings, ventilation, climatic conditions, and end-consumers affect residential and official building energy loads [
3]. Due to these factors, the average power consumption increases by more than 200
every year in the European Union [
4]. Therefore, it is imperative to take bold steps for conserving energy in offices and residential buildings. Heating, ventilation, and air conditioning (HVAC) systems are used to regulate the temperature and humidity ratio as well as to provide thermal comfort to the occupants. The most energy intensive application in a commercial building is the HVAC system, consuming around 40% of the total energy consumption of the building [
5,
6]. Thus, the efficiency of HVAC should be increased in order to minimize energy consumption while maintaining thermal comfort, and to this end, energy management plays a vital role.
To fulfill the growing needs for energy, various energy load models for buildings have been proposed [
7]. The mathematical modeling of dynamic heat load for a given building is a complex task, as it requires considering several dependent parameters that could affect the heat load. The parameters associated with environmental conditions, building materials, and habitats of the buildings are all nonlinear complex numerical functions that add complexity to thermal building models [
3,
8,
9]. Three techniques are used to model the thermal load behavior for buildings including offices, schools, residential apartments, and hospitals: the physical model or “white box” technique, the statistical or machine learning “black box” technique, and the hybrid or “grey box” technique [
10]. In the white box technique, a physical model of the building is formulated considering all of the variables involved in the thermal behavior of the building. Computational fluid dynamics (CFD), zonal, and multi-zonal are types of physical model techniques. In case of limited information about the heat transfer equation, and thermal and geometrical parameters of the building, the heat load can be predicted by statistical methods. The black box is formed by using sample data that describes the behavior of the system. In the black box, the parameters are generally adjusted automatically [
11]. The third category is a hybrid method (grey box), which uses both physical and statistical modeling techniques [
12]. These models perform well even if the building parameters are unknown and depend on sample data collected from the site, which, however, is a difficult task. A number of different statistical techniques have been proposed to predict the heat load for different cases. Some of these are, artificial neural networks (ANNs), genetic algorithms, linear multiple regression, and support vector machine (SVM) [
13,
14,
15,
16].
A building’s energy performance is commonly evaluated by the steady-state models. A study using the Overall Thermal Transfer Value (OTTV) method [
17] has been carried out to understand the effect of several building envelopes in different climate zones. However, the effect of inertia in building envelopes has been neglected. To overcome this problem, steady-state models have been proposed which include approximated effects of inertia. Depending on the envelope characteristics of the building, these models introduced several correction factors in the approximated inertia effects [
18]. The drawback of steady-state models is the exclusion of evaluation of new technologies exploiting the building’s inertia effects such as phase change materials and free cooling. In this case, the only model that can be modified to analyze creative energy-saving alternative solutions is the transient dynamic model. Therefore, to forecast the energy performance of a building, a thermal model comprising of Thermal Resistance (R) and Capacitance (C) (electrical network analogy) has been introduced in [
19]. Several numerical approaches have been developed, analyzed, and executed in software like DOE-2, EnergyPlus and many more [
20,
21]. However, the MATLAB/Simulink environment is a better option for performing dynamic building simulations without excessive computational costs and with a satisfactory level of accuracy.
The most important goal in HVAC installation is to design an effective control strategy for meeting thermal comfort while keeping the energy consumption of the devices to a minimum. Various control strategies have been implemented for HVAC [
22]. Proportional integral derivative (PID) controllers, based on the Ziegler–Nichols (ZN) method, have been implemented in an HVAC dynamic model in [
23] for reducing disturbances and improving indoor comfort. Due to the linearity of PID controllers, using them for a nonlinear system such as HVAC causes degraded performance. In the case of model nonlinearities and system uncertainties, robust control perhaps would be useful [
22]. In Ref. [
24], a multi input multi output (MIMO) robust controller is used for HVAC, which offers improvement in the system with disturbance rejection compared to a proportional plus integral (PI) controller. Model predictive control (MPC) has also gained popularity for HVAC applications [
25,
26,
27]. A supervisory setpoint control optimizer based on MPC is coupled with a digital parameter-adaptive controller and used in a demand response system [
6]. It performed better than the classical control methods and adaptive fuzzy neural control [
28]. A three-layered ANN has been proposed to predict the energy and heat load of a building [
29,
30], where sample data are collected by using a DOE-2 simulation for training the statistical model. A similar ANN with two hidden layers is used to predict the heat load for a building in [
30]. Sample data of 80 and 170 values for two different rooms are used to train the ML algorithm, and an accuracy of 90% is achieved. The use of statistical models for prediction has certain advantages in gathering dynamic information for any system. The design of the predictive model does not require knowledge of any system parameter and requires only collecting samples for training the neural network. However, due to the black box model approach, the actual system model and parameters remain unknown and cannot be changed. Also, it is very difficult to collect the training data with the help of observations, sensors, or numerical calculations which may result in poor performance in case of a large variance in the training sample or if the training sample is small.
Controller design for HVAC poses several challenges due to the nonlinear, complex and MIMO features. It has time-varying and inherent parameter coupling effects [
28,
31,
32]. Variations in system parameters, model uncertainty due to nonlinear factors, climatic parameters interaction, and variable conditions are some of the major issues faced by HVAC systems. As a result, linear control algorithms are inadequate in terms of performance and stability when dealing with the nonlinearity behavior of the system. Therefore, it is essential to implement nonlinear control algorithms to address the aforementioned issues. Sliding mode control (SMC)-based approaches show promising results for various nonlinear systems. To regulate the superheat temperature of the evaporator in HVAC, a feedback linearization-based SMC controller is presented in [
33]. An SMC and PID approach has been designed for optimization of building energy consumption in [
34] for a multizone VAV air-conditioning system. Robust SMC and PID have been implemented to ensure the robust performance of the air handling unit in the presence of uncertainties [
35]. The authors in [
36] demonstrated a super-twisting SMC for the control of an HVAC system evaporator two-phase length and superheat temperature. However, the stability analysis prevents the super-twisting approach from being implemented [
37]. Hotel energy analysis [
38], Soft Actor-Critic Agent and predictive mean vote index for enhancement of indoor temperature and energy saving in the building have been implemented [
39,
40]. The work in our paper proposes advanced and stable SMC controllers for a hospital HVAC system.
Noteworthy, HVAC system for hospital requires a specialized approach due to unique need of medical facilities. In addition to providing thermal comfort, factor such a patients well being, safety, cooling of specialized surgical equipment, control of precise temperature and humidity are critical. Prioritizing patient comfort and recovery while ensuring medical equipment efficiency is essential. People suffering from the medical condition deserve the best thermal comfort possible to assist them on their healing journey. Hence, temperature and humidity control is fundamental.
This paper selected a special case of a hospital building, considered as a complex organization among various commercial buildings in the sense of its operations, bio-medical technology, and healthcare procedures. In modern hospitals, occupants’ comfort and maintenance of controlled environmental conditions for machinery and other medical equipment have become a necessity, which is achieved by installing HVAC systems as per medical standards. However, such facilities can only be ensured at the cost of high energy consumption, which is identified as the third largest factor among other expenditures in the healthcare sector after staff salaries and medicines. It was also revealed that most of the electricity is consumed for air conditioning, which is more than 50% of the total electricity demand of the building. The highest energy use intensity (EUI) value was found for the hospital’s critical area, i.e., operation theaters (OTs). In OTs, the EUI value is about three times higher than in the other areas and offices in the hospital [
41]. Thus, it is pertinent to have energy management and controlling algorithms to efficiently manage the heating and cooling processes.
The energy management of a healthcare building is a crucial and complex task for researchers due to uncertainty, and thus, various load prediction models are applied to supply uninterruptible supply to the healthcare building. In this paper, a deterministic model for zone temperature has been proposed. The following are the aims and control objectives:
For the case of intensive care units (ICU) and OTs in a hospital environment, dynamic setpoints for the zone temperature are incorporated.
The model will be processed on the dynamic temperature setpoints of operation rooms (ORs) inside the hospital. This is because, in ORs, both patients and healthcare workers desire different temperature environments depending on the patient’s condition and the requirements of the surgical and treatment procedures.
To achieve the dynamic setpoints’ variability, a detailed mathematical model of the zone temperature is considered in the formulation of the controller.
The major influencing parameters of the internal zone temperature, i.e., outside air temperature, solar irradiation, wind speed, and heat generated from internal appliances are incorporated into the design of the controller.
For the dynamic regulation of the HVAC temperature, two nonlinear controllers, DISMC and ITSMC, have been proposed.
Asymptotic stability of the system has been ensured for both nonlinear controllers.
The paper is organized as follows: The mathematical model of heating load demand is explained in
Section 3. The controller designs are presented in
Section 4 and simulation results are analyzed and discussed in
Section 5.
Section 6 details the conclusions with future work.
3. Thermal Mathematical Model
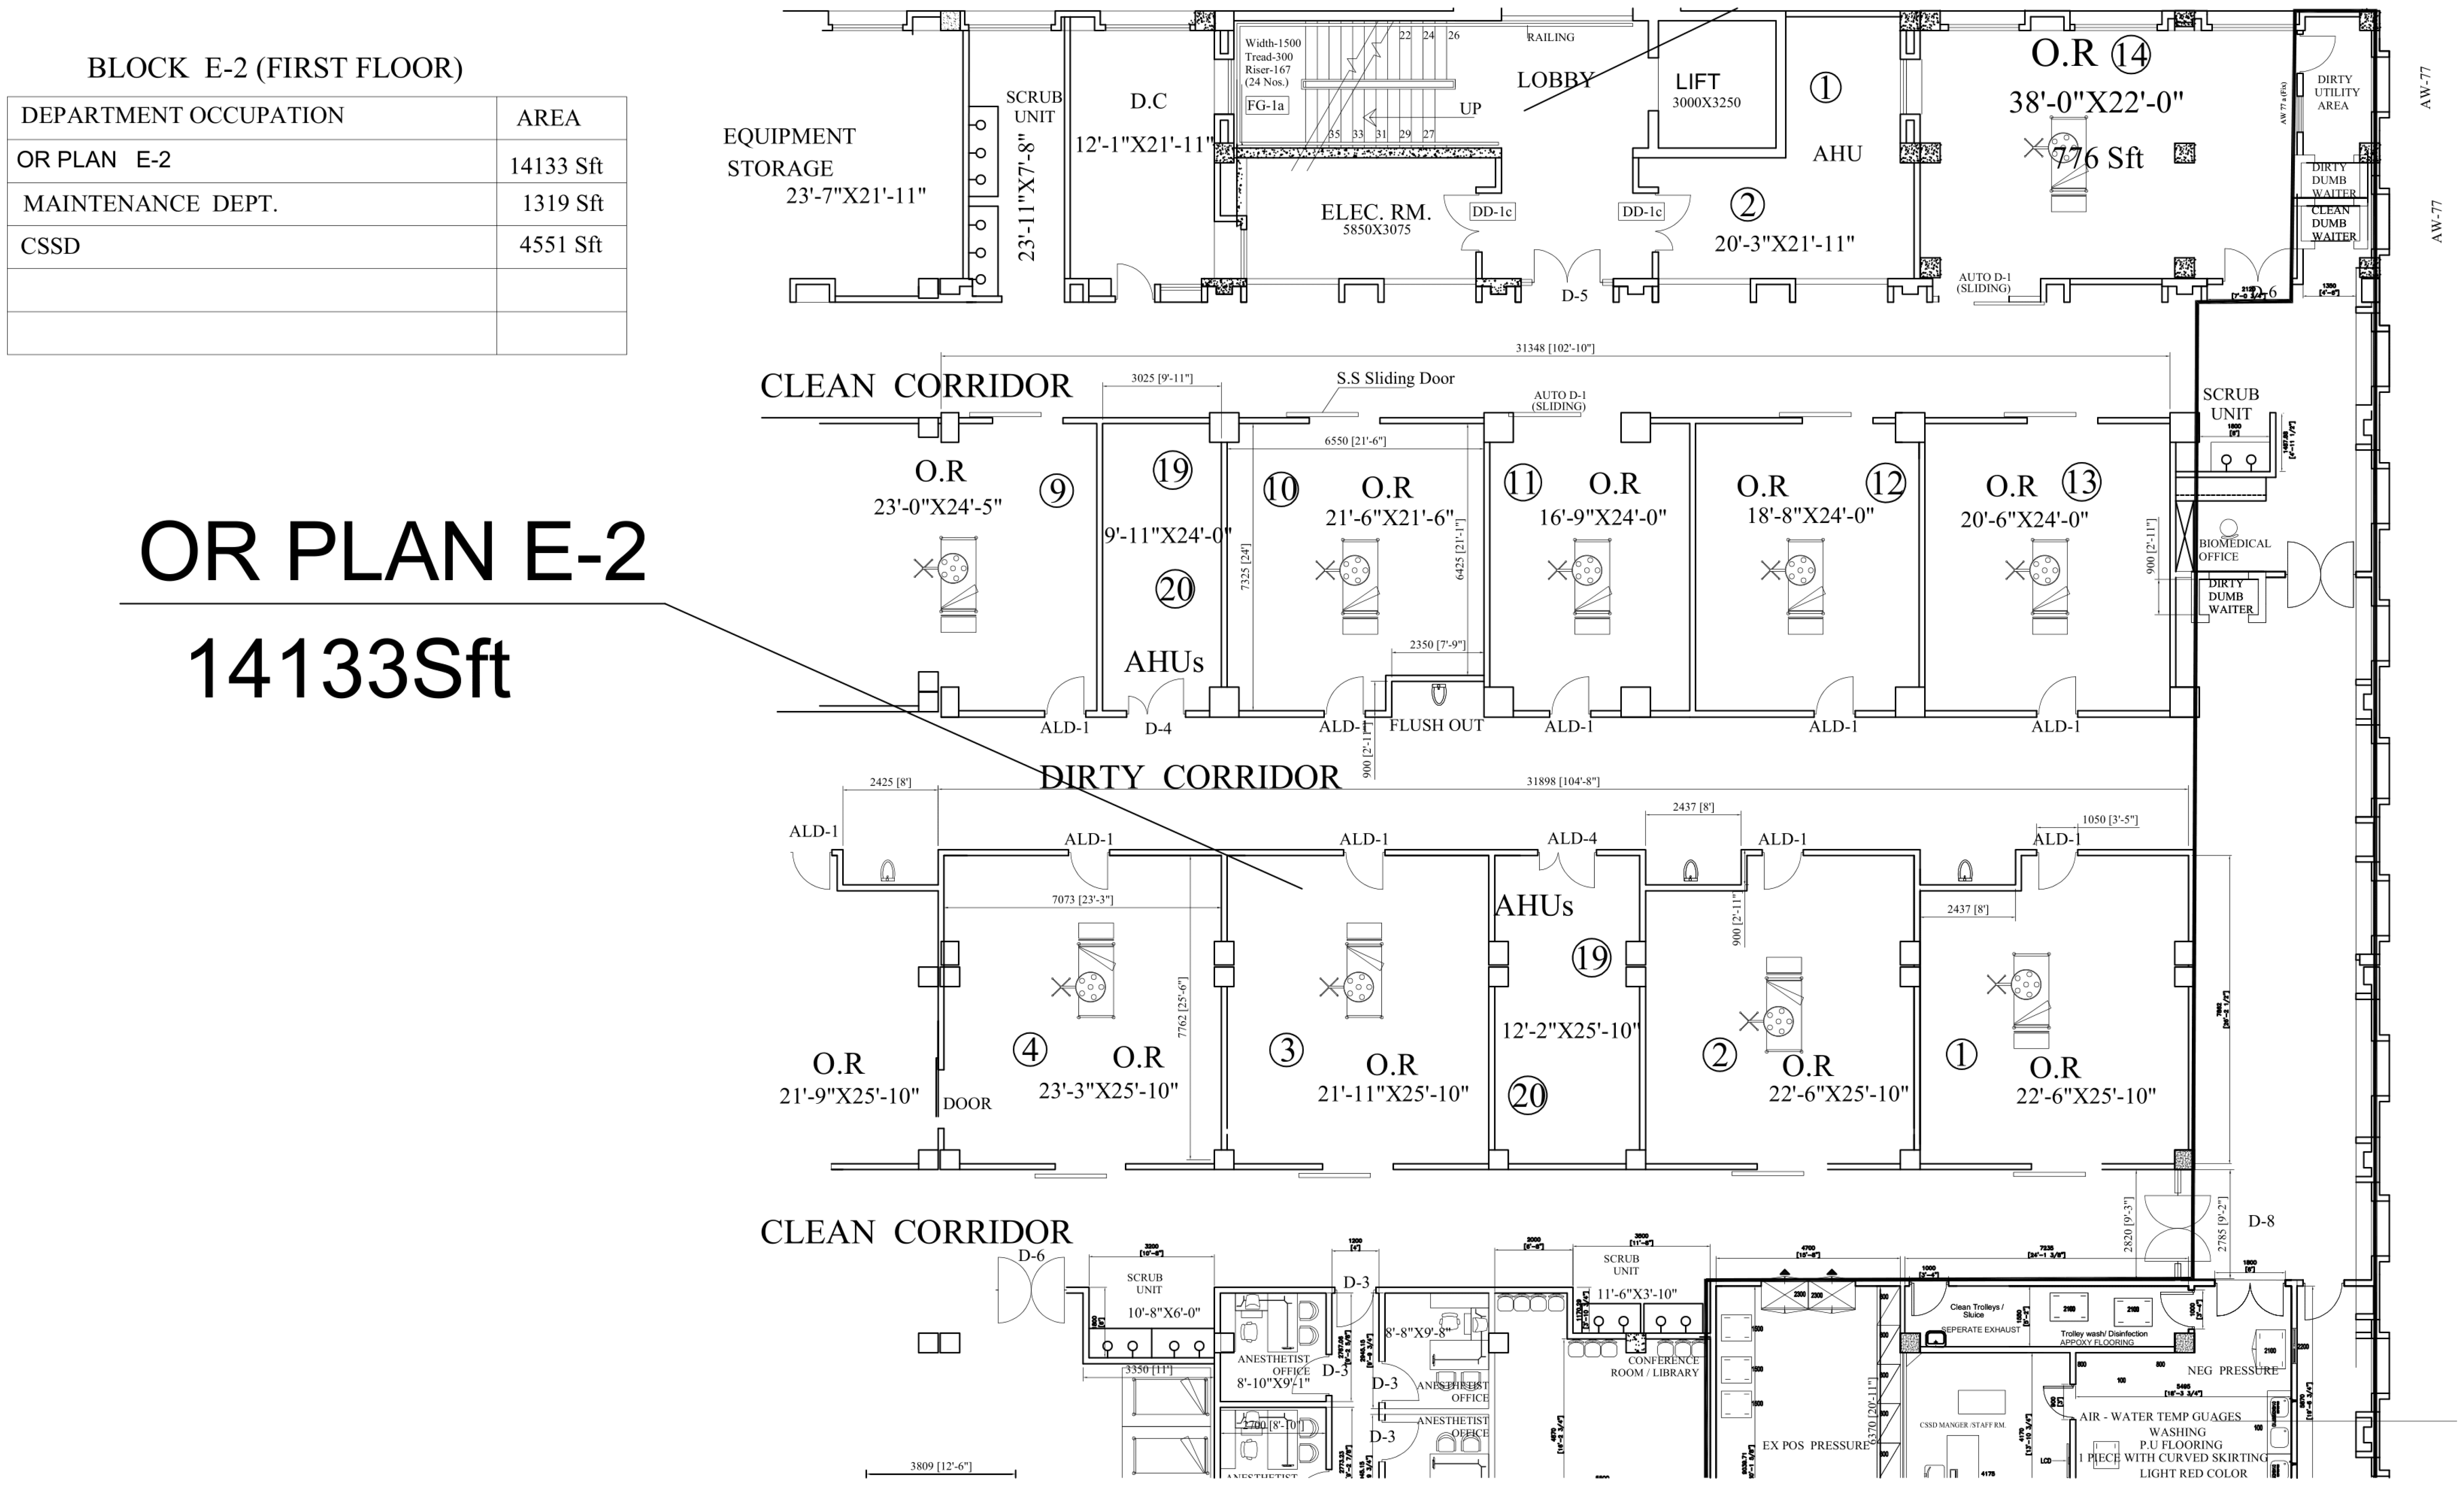
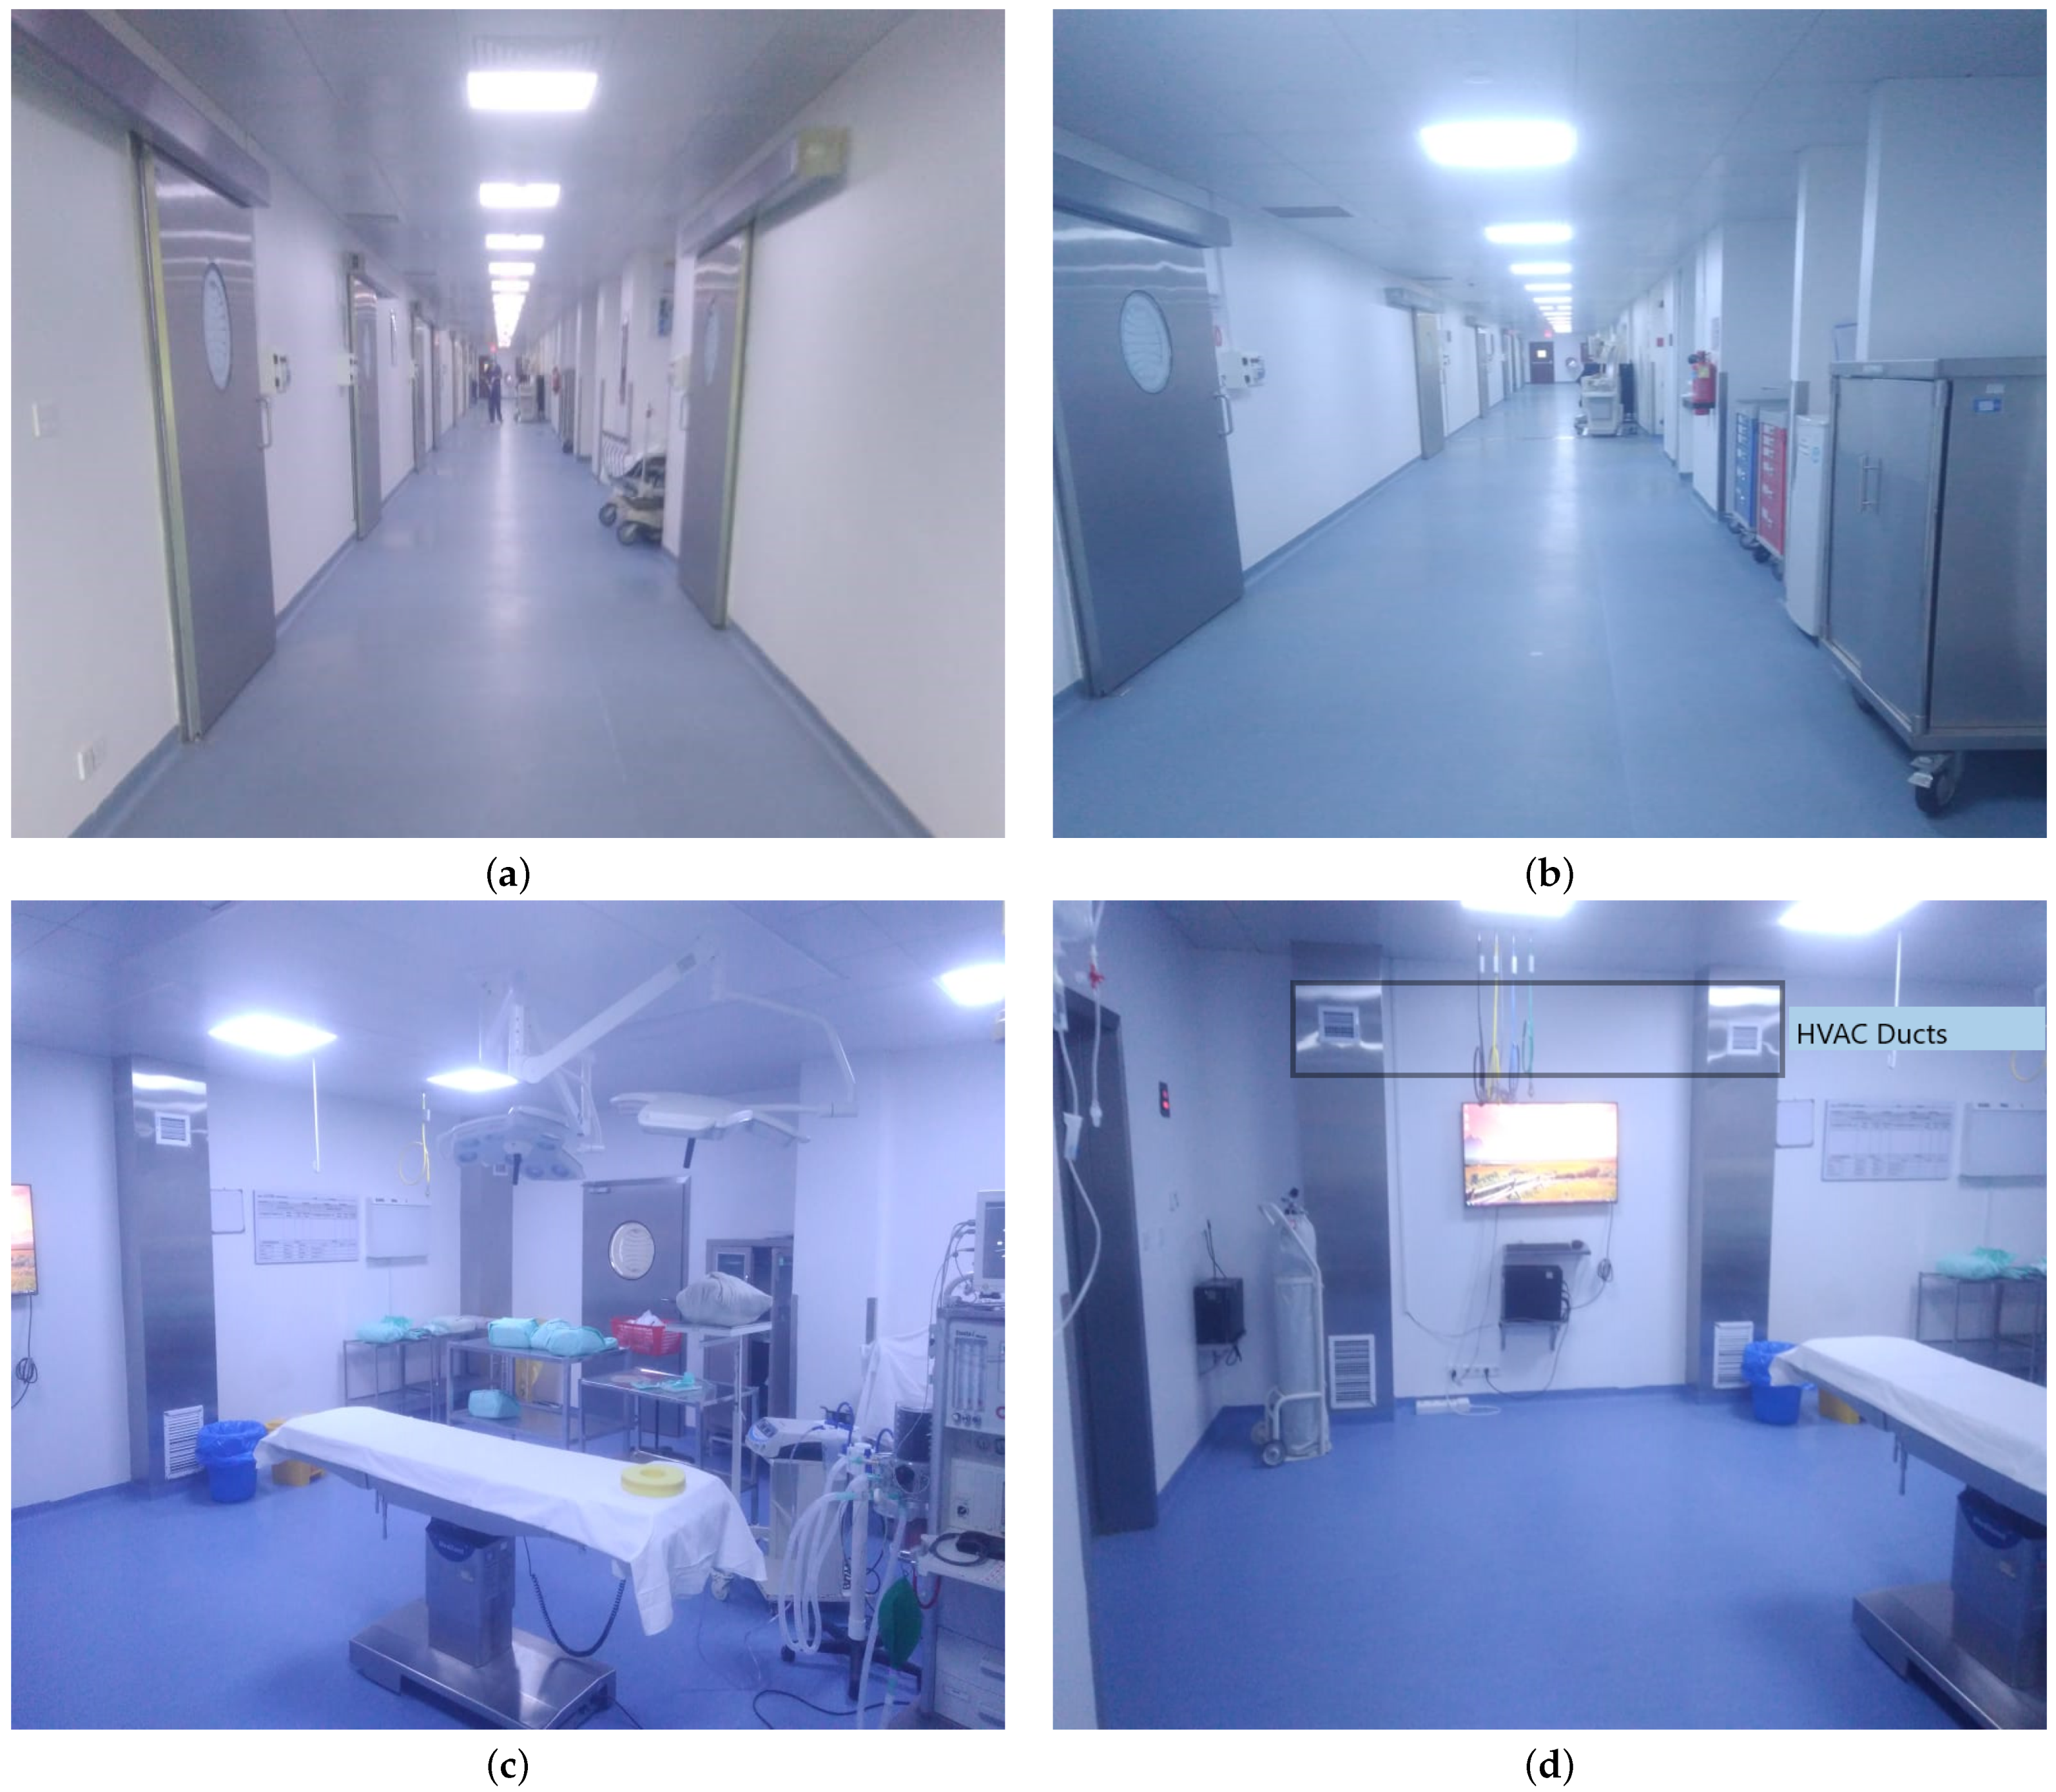
The internal layer of the walls exchanges heat with the external air through the wall and windows. This isothermal volume receives free heat gain from the internal human and heat-radiating appliances. The whole OR is represented in a parallelopiped structure with squared floors, having an internal volume of 310.6677 m
with unique thermal capacitance. The OR model consists of four external wall portions including east, west, north, and south walls. The dynamical equation of the roof is also considered to represent the contribution of external temperature to the internal air of the OR. At the south wall, the window has an accumulated surface area of 6.25 m
. All of the dimensions of the OR are mentioned in
Table 1. Heat transfer is also taken into account due to ventilation and direct solar radiation through the window. The heavy and light configurations of the wall structure of the OR are also considered, which differ from each other on the basis of their thermal capacitance and the mass of the vertical walls and roof.
Table 2 presents the thermal transmittance and thermal capacity for the heavy and light walls of the OT, including the values for the roofs and floors.
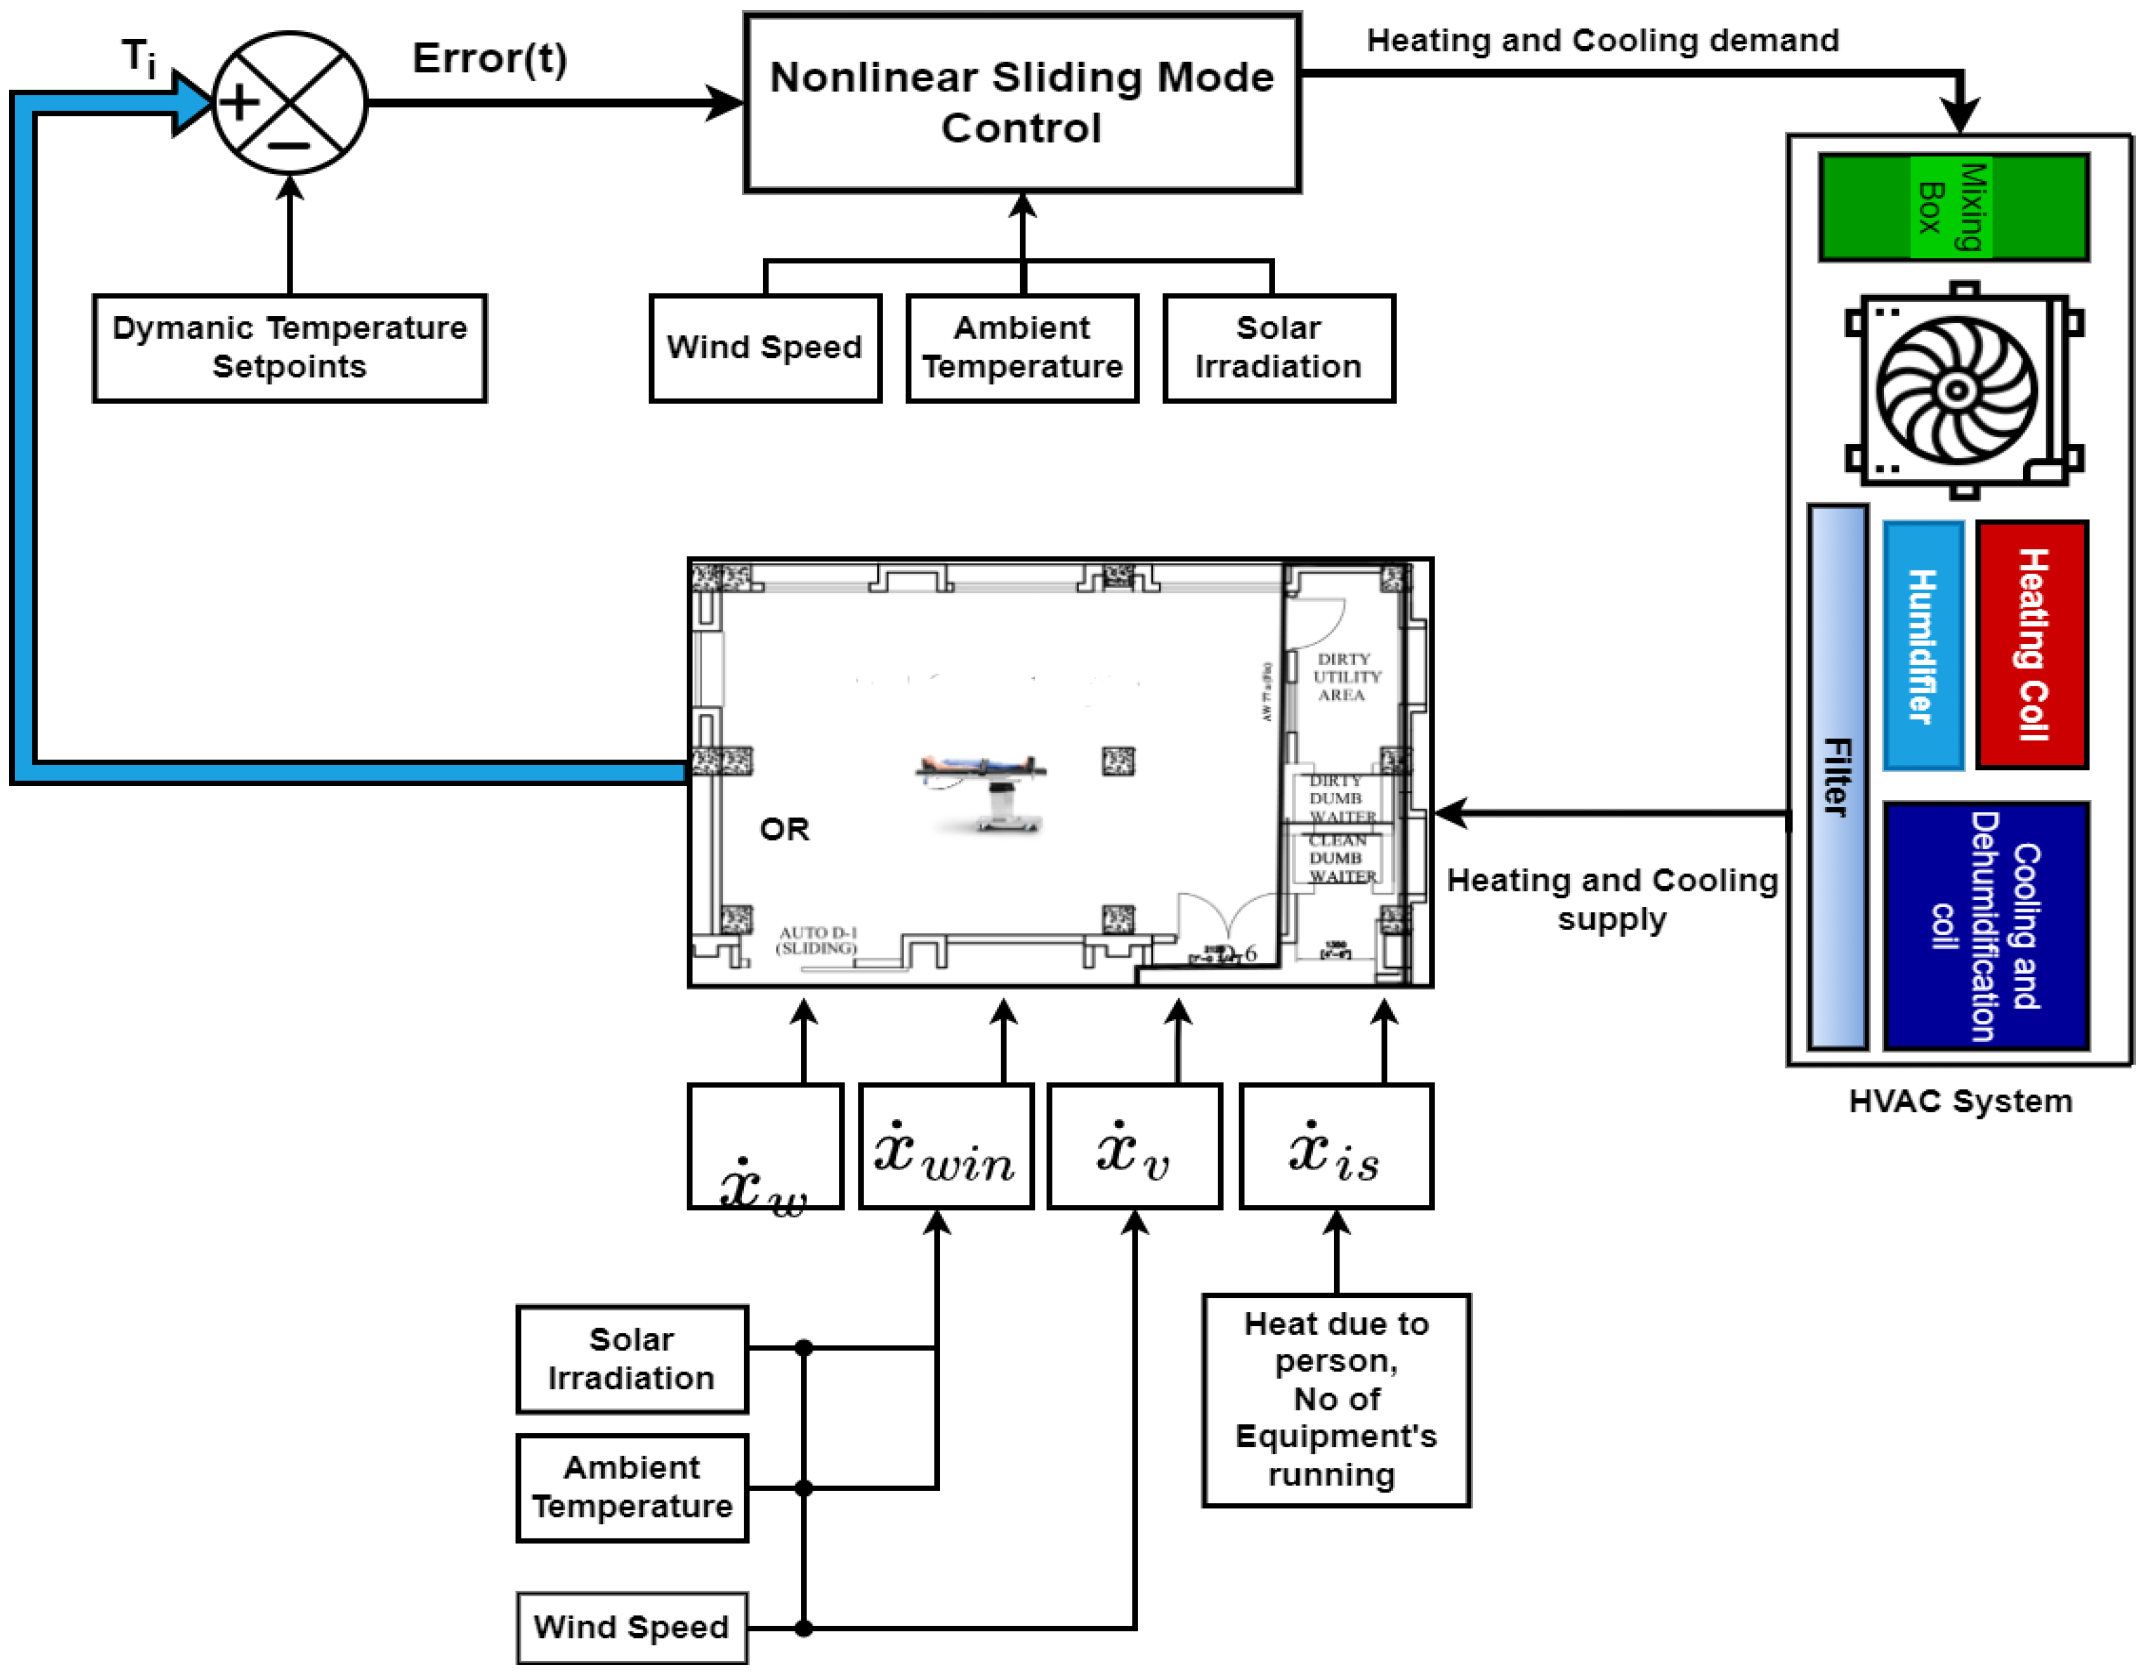
The block diagram of the OR is shown in
Figure 2, where solar radiation from the Sun contributes to the internal air temperature through the transparent window surface and the opaque surface of the wall. Let
be the flow of heat charge across the window.
represents the thermal energy contribution due to solar radiation. Heat transfer to the wall is represented by
due to internal and external temperature differences.
and
are the dynamic inputs of the HVAC source, with efficiency
, which depends on the system’s performance, external conditions, and regulation criteria. The internal free heat gain due to people and equipment is represented by
, as shown in
Figure 2.
refers to the heat transfer through the windows due to ventilation. The blue lines in the block diagram show the cooling input whereas the red lines represent the heating input to the internal air temperature. The dynamic evolution of the internal air temperature [
19] is presented as:
where
is the total capacitance of the OR including the thermal capacities of the walls, window glass, and roof of the OR.
is the internal air temperature, which is the accumulative effect of all of the aforementioned factors.
is the thermal capacitance depending upon the material used for the OR and its properties vary from material to material.
3.1. External Walls
There are two layers for each wall, one is an internal layer and the other is an external layer. The mass of internal air is in direct contact with the inside layer of the wall. The main contributors to the internal air temperature are heat sources, electrical appliances radiating heat, and the human body temperature present inside. The external layer is the layer that is subjected to the environmental effect, including solar irradiation and external air temperature.
Radiation coming from the Sun is directly absorbed by the wall contributing to the rise in temperature and some passes through the transparent surface of the window, causing an increase in the internal temperature. The wall temperature is considered at a single point inside the wall and that point can be close to the internal wall or to the external wall depending on the material and insulation used. The total temperature of the wall is considered as a temperature difference between the internal and external walls.
The transient energy of an opaque external wall can be written as follows:
where
represents the total thermal capacitance of the wall and
is the temperature of the wall’s internal node. The flow of heat flux from the external layer towards the wall node and the flow of heat flux from the internal layer towards the wall node are represented by
and
, respectively, and can be calculated as follows:
where
and
are the internal layer and external layer temperatures of the wall, respectively.
and
are the thermal resistance to the flow of heat flux from the external layer and internal layer to the wall node, respectively, which is purely conductive and its values are known depending upon the nature of the wall material. In the case of a heavy wall structure, this resistance is high and prevents sudden internal changes in case of a change in environmental conditions. When modeling the wall, there is a need to consider the effect of solar radiation coming inside through the windows and reflecting from the floor.
As the deterministic model approach is used, and the values of the internal and external wall layer temperatures
and
cannot be calculated directly by using sensors, the values of these wall layer temperatures can be determined by considering the two energy balance equations given below:
where
and
are the solar contributions and will be explained in a later section.
and
are the total heat flux flows on the internal and external wall surfaces, respectively.
3.2. Solar Contributions
The heat contribution from the Sun’s radiation is divided into two parts, heat absorbed by the wall’s opaque surface and transmittance of solar radiation through the windows. The heat flux absorbed in the surface of the wall can be expressed as follows:
where
is the wall absorbance coefficient, which depends on the external surface of the wall
.
is the total opaque surface area of wall and
is the amount of solar radiation normal to the
wall and taken from weather data.
The total solar radiation transmitted through the transparent surface of glass windows can be modeled as:
where
is the transmittance coefficient of the window glass and
is the total transparent surface area of the window.
is the function of shadow on the window depending upon the orientation of the Sun. Some amount of solar radiation passes from the window and is absorbed by the floor depending on the absorption coefficient
and can be modeled as:
The rest of the solar radiation is reflected from the surface of the floor and considered as uniformly distributed in the internal air volume and can be modeled as:
where
is the global solar radiation normal to the surface of the wall.
3.3. Ventilation
The heat transfers across walls either due to the presence of a ventilation system in the form of windows or through the air-conditioning exhaust system. The heat flux through the ventilation system [
8] can be modeled as:
where
is the overall heat transfer coefficient and
is the air volume conditioned per minute.
and
are the density and specific heat of the air, respectively.
is the mass,
is the specific heat, and
is the temperature of the ventilation system.
3.4. Windows
Heat flux flows across the windows due to the difference between the internal and external temperatures, and can be modeled as an energy balance equation:
The total heat flux flowing across the window depends on the temperature difference between the external and OR temperatures and the resistance of the window glass. This resistance can also be modeled as the inverse of the transmittance of glass across the total transparent surface area
of the window.
is the transmittance of the windows, which depends upon the characteristics of the glass.
3.5. Humans and Applications
The contribution of heat flux to the internal air temperature due to the presence of humans and applications is considered as a constant that does not vary significantly with time, and its value is taken as 50 W.
4. Robust Controller Design
Sliding mode control (SMC) is a nonlinear control technique that presents high accuracy, low steady-state error (SSE), and robustness against model uncertainties and disturbances. It is relatively easy to implement and shows finite time convergence as compared to other nonlinear control techniques [
42]. Various methods such as sliding surface design modification, high order SMC and composite SMC designs have been proposed to improve the conventional SMC performance in terms of reducing the chattering effect, rejecting disturbances, and tracking properties.
It presents a higher degree of flexibility in the designing process as compared to other controllers. It is an effective control strategy to force the system’s state trajectories from the initial states to some predefined sliding surface using control law. Higher-order SMCs such as ITSMC and DISMC eliminate the reaching phase and improve the convergence time and robustness of the system [
43]. ITSMC has dominant properties over SMC in terms of high state tracking accuracy and removal of chattering. For precision control, ITSMC is more relevant and its speed of convergence is quite near the equilibrium points. Thus, in this paper, DISMC and ITSMC are formulated and proposed for controlling the temperature of the nonlinear HVAC system.
The block diagram for SMC-based OR HVAC control is presented in
Figure 3. To track the heating and cooling demand and supply, an error has been introduced into the system by taking the difference between the internal temperature of the OR and the dynamic zone temperature setpoints. A control input law that is based on nonlinear SMC is implemented to achieve the desired different temperature environments depending on the patient’s condition and the requirements of surgical and treatment procedures. The mathematical evaluation of the control input law is presented in the subsequent sections.
In SMC, first of all, a sliding manifold (
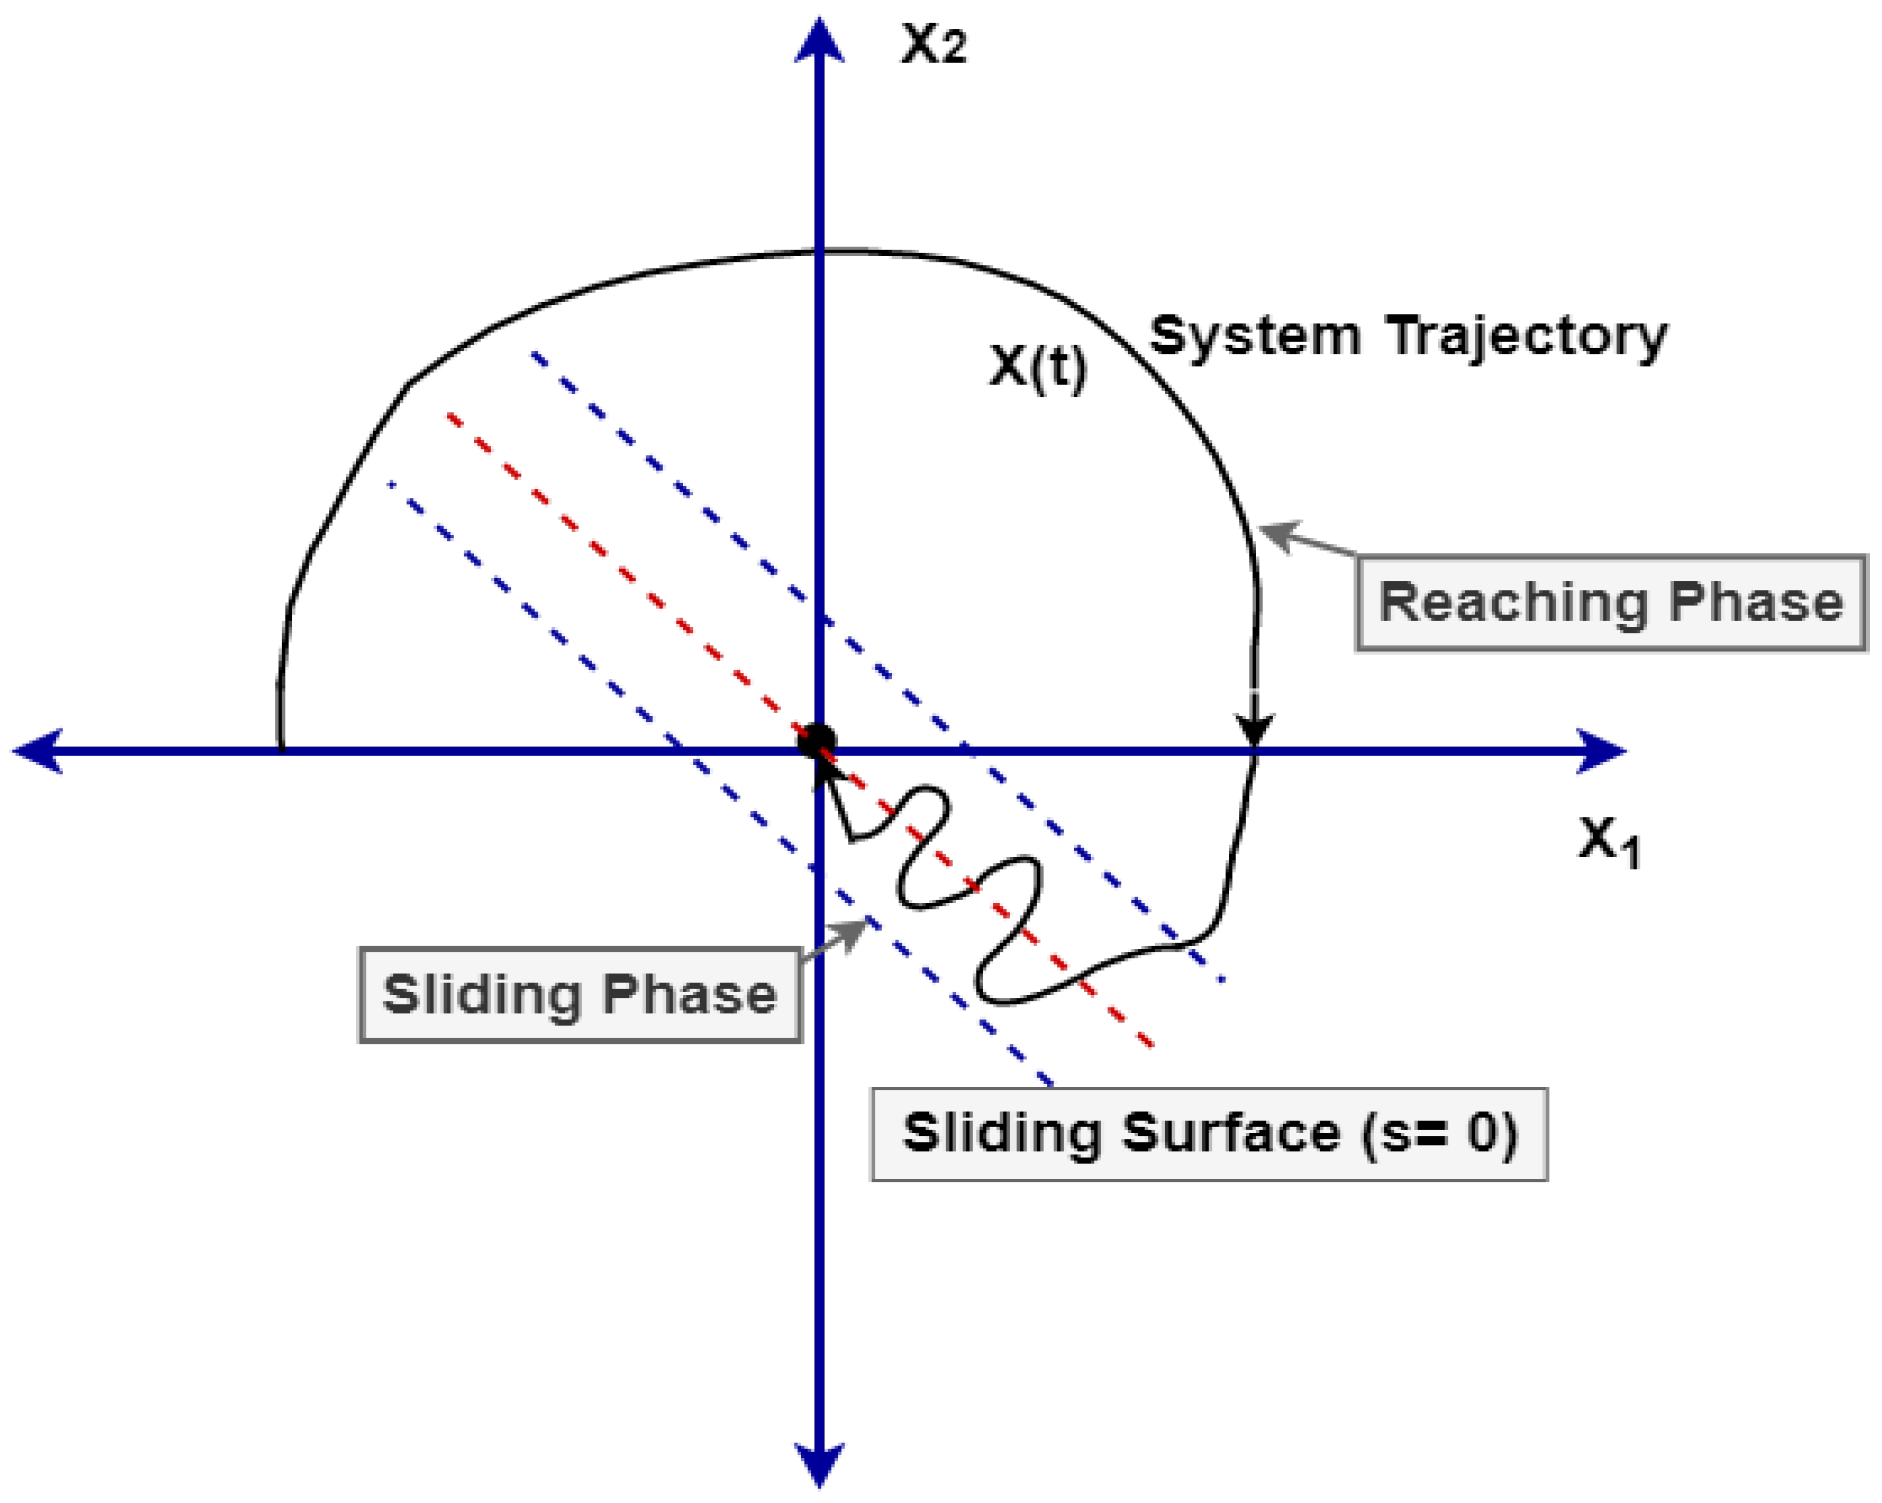
) is defined to meet the control objectives and then a control law is formulated to constrain the motion of the system dynamics to the predefined sliding surface. Once the system dynamics reach the manifold
S in finite time, it remains there because of the binary (0 and 1) switching states, as shown in
Figure 4.
The sliding coefficient is used to control the convergence rate of the trajectory toward the sliding manifold. The reachability condition must be satisfied for guaranteeing convergence to the sliding surface. This condition states that the product of the sliding manifold and its derivative must be negative definite [
42] as:
Due to the 0 and 1 switching states, chattering phenomena are observed in SMC. To reduce this chattering, a strong reachability condition is used to design the control law by considering:
where
is a unit between 0 and 1,
in the expression of
increases the speed of the trajectory toward the sliding manifold, and
is a small number used to reduce the chattering [
44].
The sliding surface for a general multi input multi output (MIMO) system is defined as:
,
, up to
are the sliding surfaces for different outputs.
4.1. Double Integral Sliding Mode Controller Design
The closed-loop response in SMC is totally unresponsive to external disturbances and internal parametric uncertainties. In order to improve the system convergence accuracy and reduce the SSE, integral action is required. A double integral has been added to the sliding surface to compensate for residual SSE and mitigate the chattering. Consider the following sliding surfaces:
where
,
, and
are sliding coefficients.
is the integral error in
.
is the double integral error in
. The second integral has been added to the sliding manifold to compensate for the remaining SSE and mitigate the chattering. In mathematical form, the errors are expressed as:
where
is the operation theater room temperature and
is the reference temperature (desired).
Now, the time derivative of the sliding manifold
is
To find the values of
and
, take the time derivative of (
20) and (
21) as:
Substituting
from (
15) for
and the derivative of errors in (
18):
The use of
from (
1) in (
24) would result in:
Finally, solving (
25) for HVAC control gives:
For the stability of the sliding manifold of
, the Lyapunov candidate function is considered as
By taking the time derivative of (
27) and substituting
from (
15) for
yields:
The expression in (
28) for
becomes:
For
=
and
, (
29) results in:
As the derivative of the Lyapunov candidate function
given by (
30) is negative definite, this shows that the controller is stable.
4.2. Integral Terminal Sliding Mode Controller Design
The DISMC lacks fast and accurate tracking of the dynamic changes in the reference input and thus, for precision control, ITSMC is more suitable and its speed of convergence is quite near the equilibrium points. In order to eliminate the singularity problem and to achieve high state accuracy tracking, integral terminal SMC has been proposed.
Defining the ITSMC sliding manifold as follows:
where
is the design parameter of the sliding manifold and
is a positive number such that
.
is the tracking error in the actual
and the reference OR temperature
. Taking the time derivative of the sliding manifold and substituting
from (
18) gives:
Further, substituting
from (
1) into (
32) results in:
Solving (
33) for the control input
yields:
For the stability of the sliding manifold
, taking the Lyapunov candidate function as:
Taking the time derivative of (
35) yields:
Putting
into (
36) gives:
As the derivative of the Lyapunov candidate function
in (
37) is negative definite for
greater than zero, the system is stable.
The performance of the two proposed controllers will be analyzed in the subsequent section for tracking the reference temperature in a realistic HVAC system for the Shifa International Hospital, Pakistan.
5. Simulation and Results
5.1. Environmental Conditions
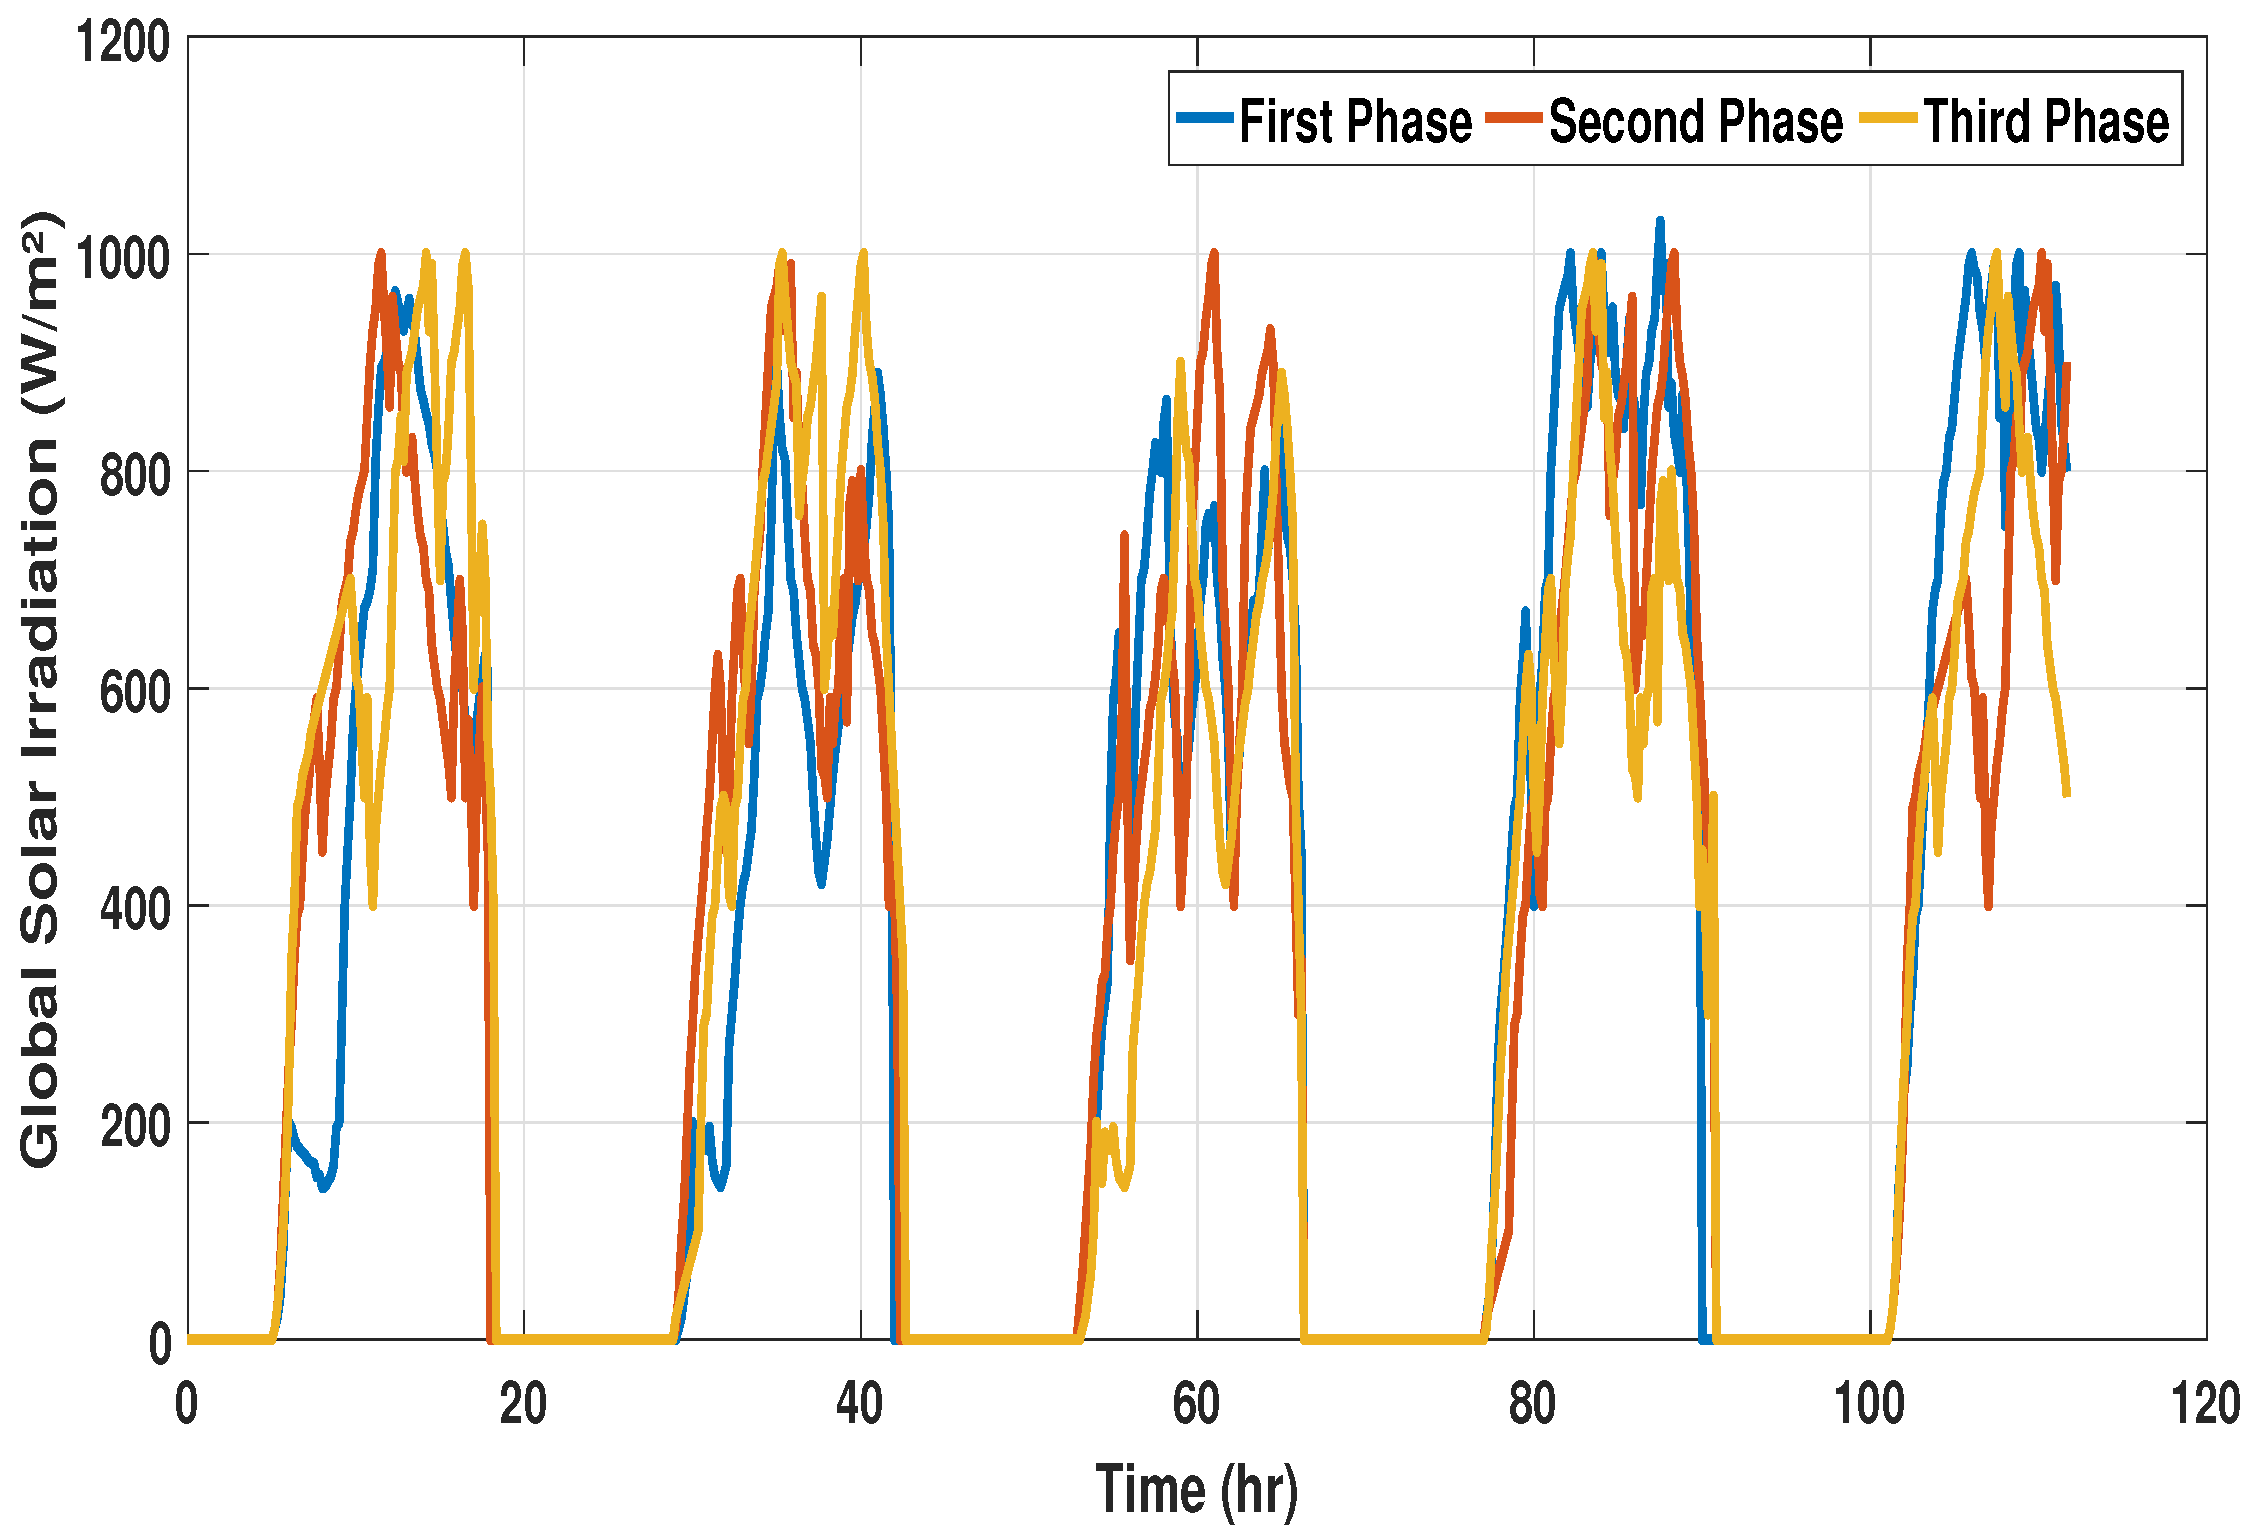
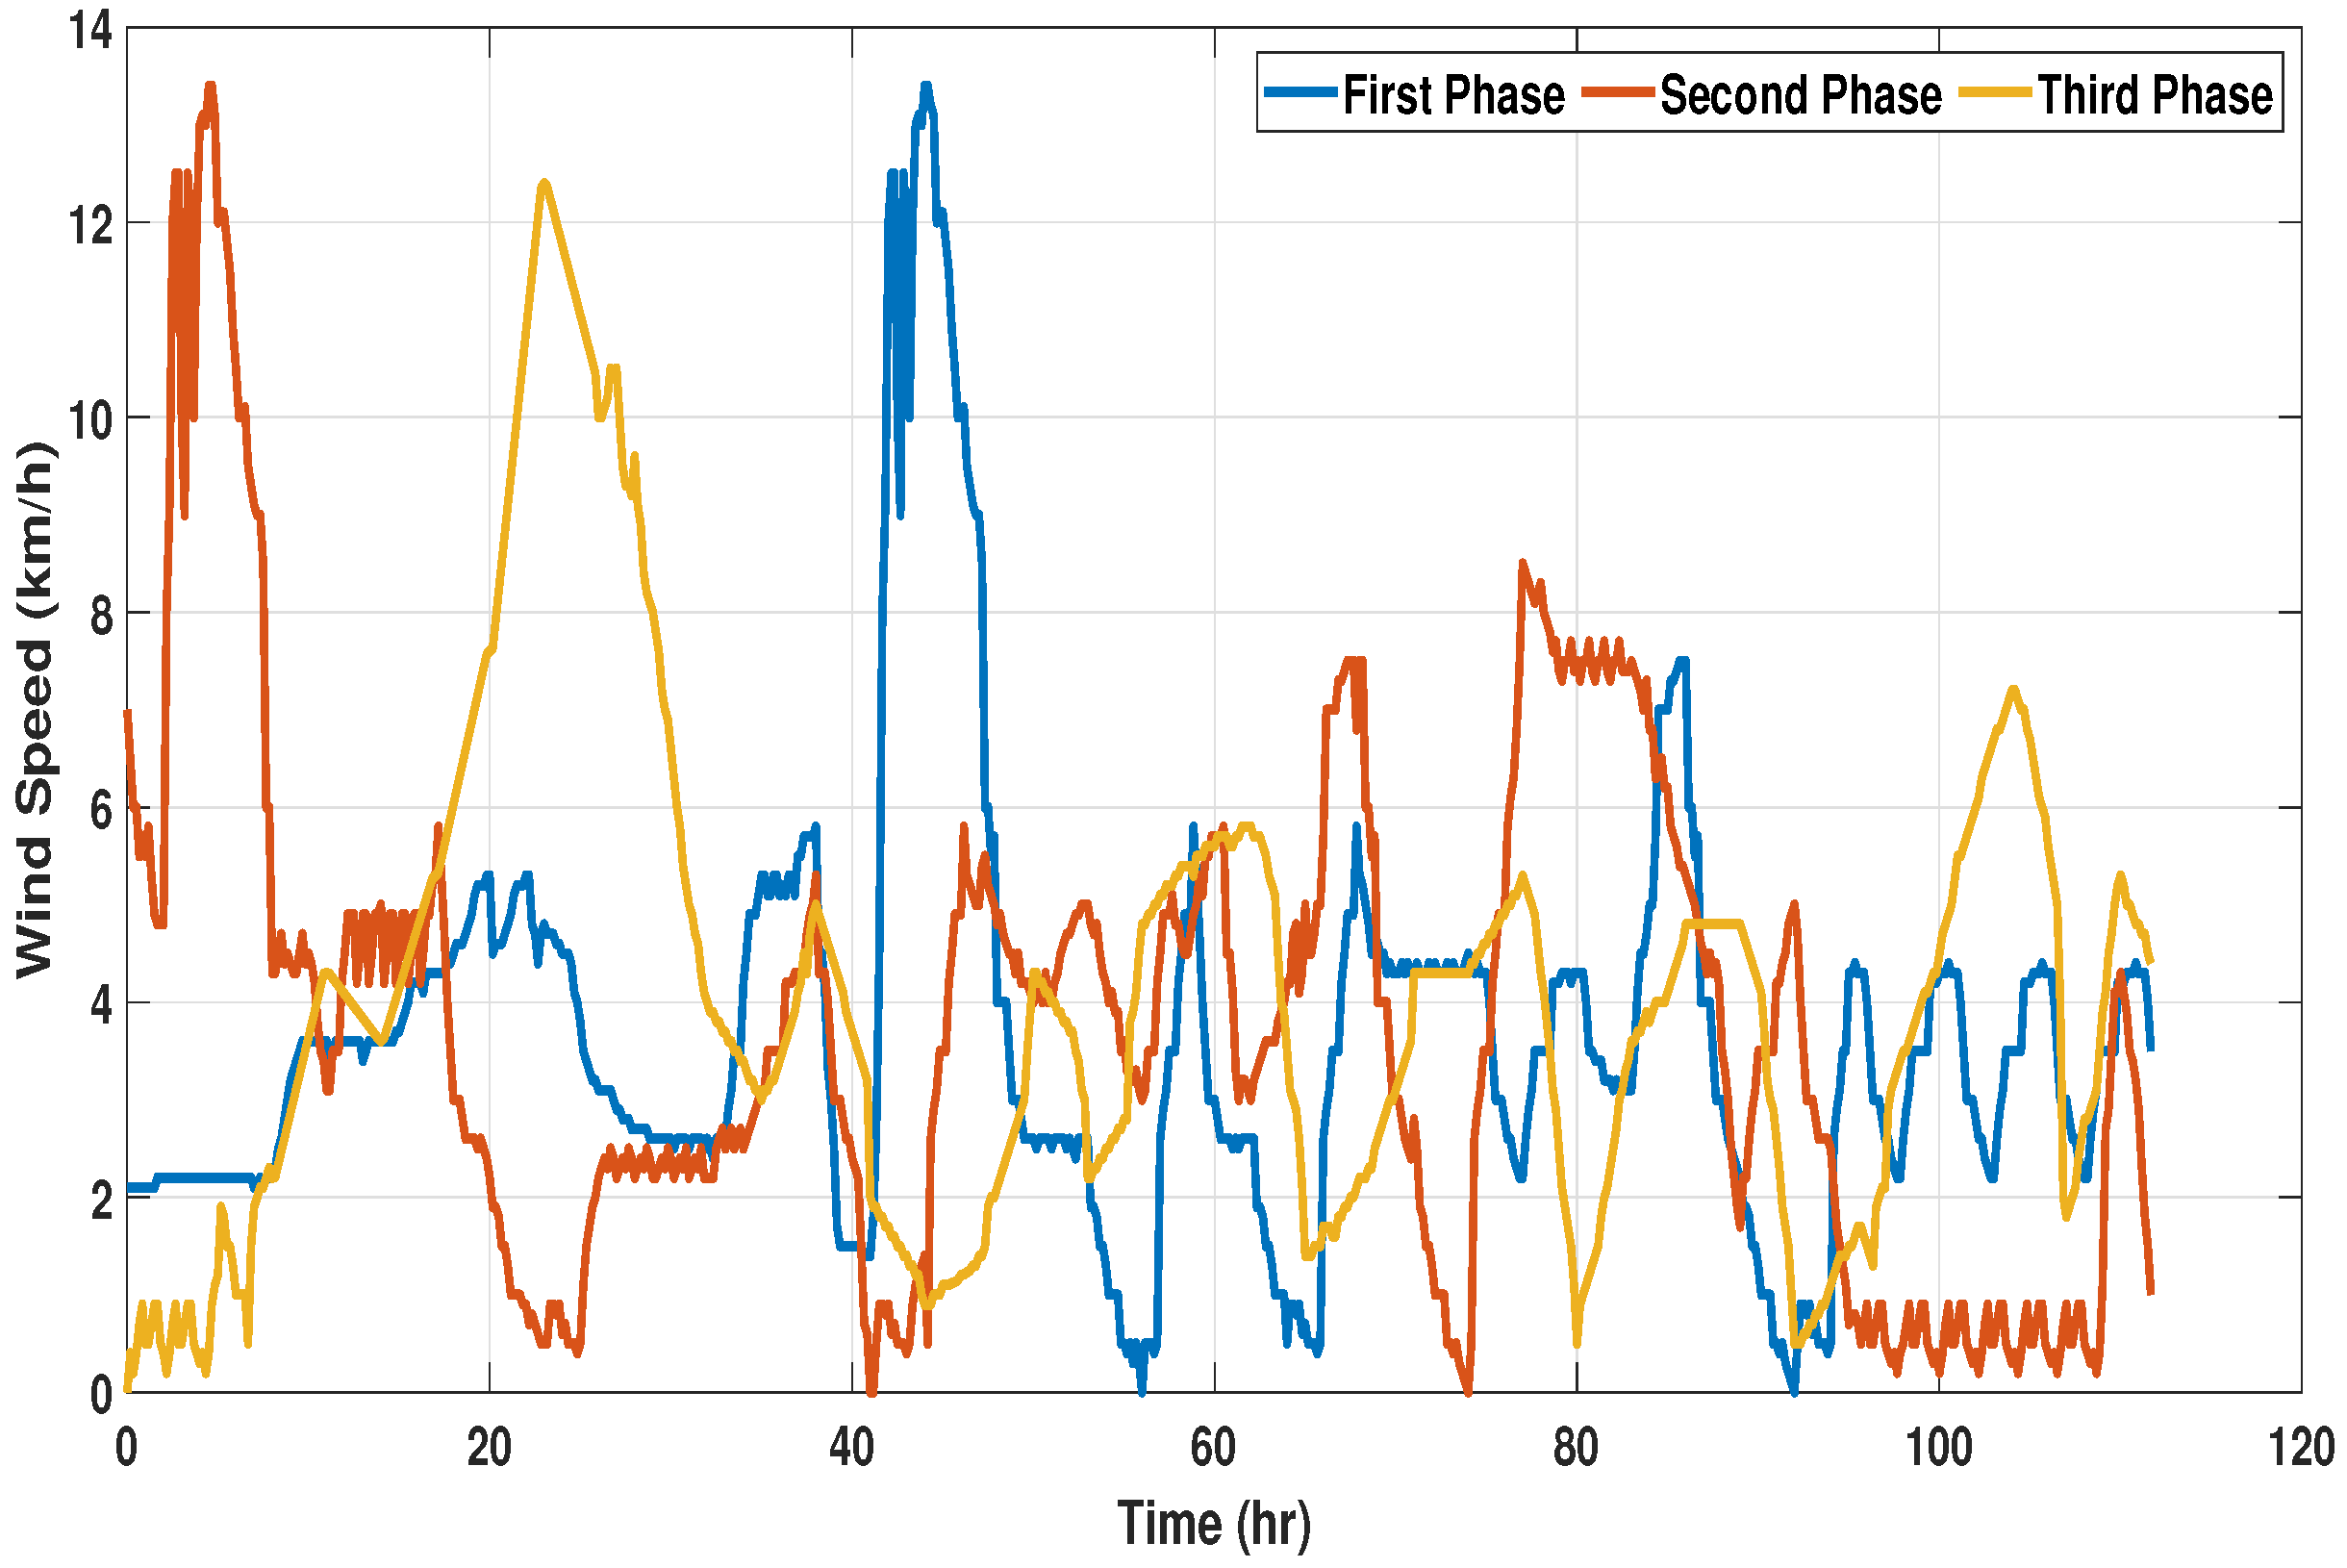
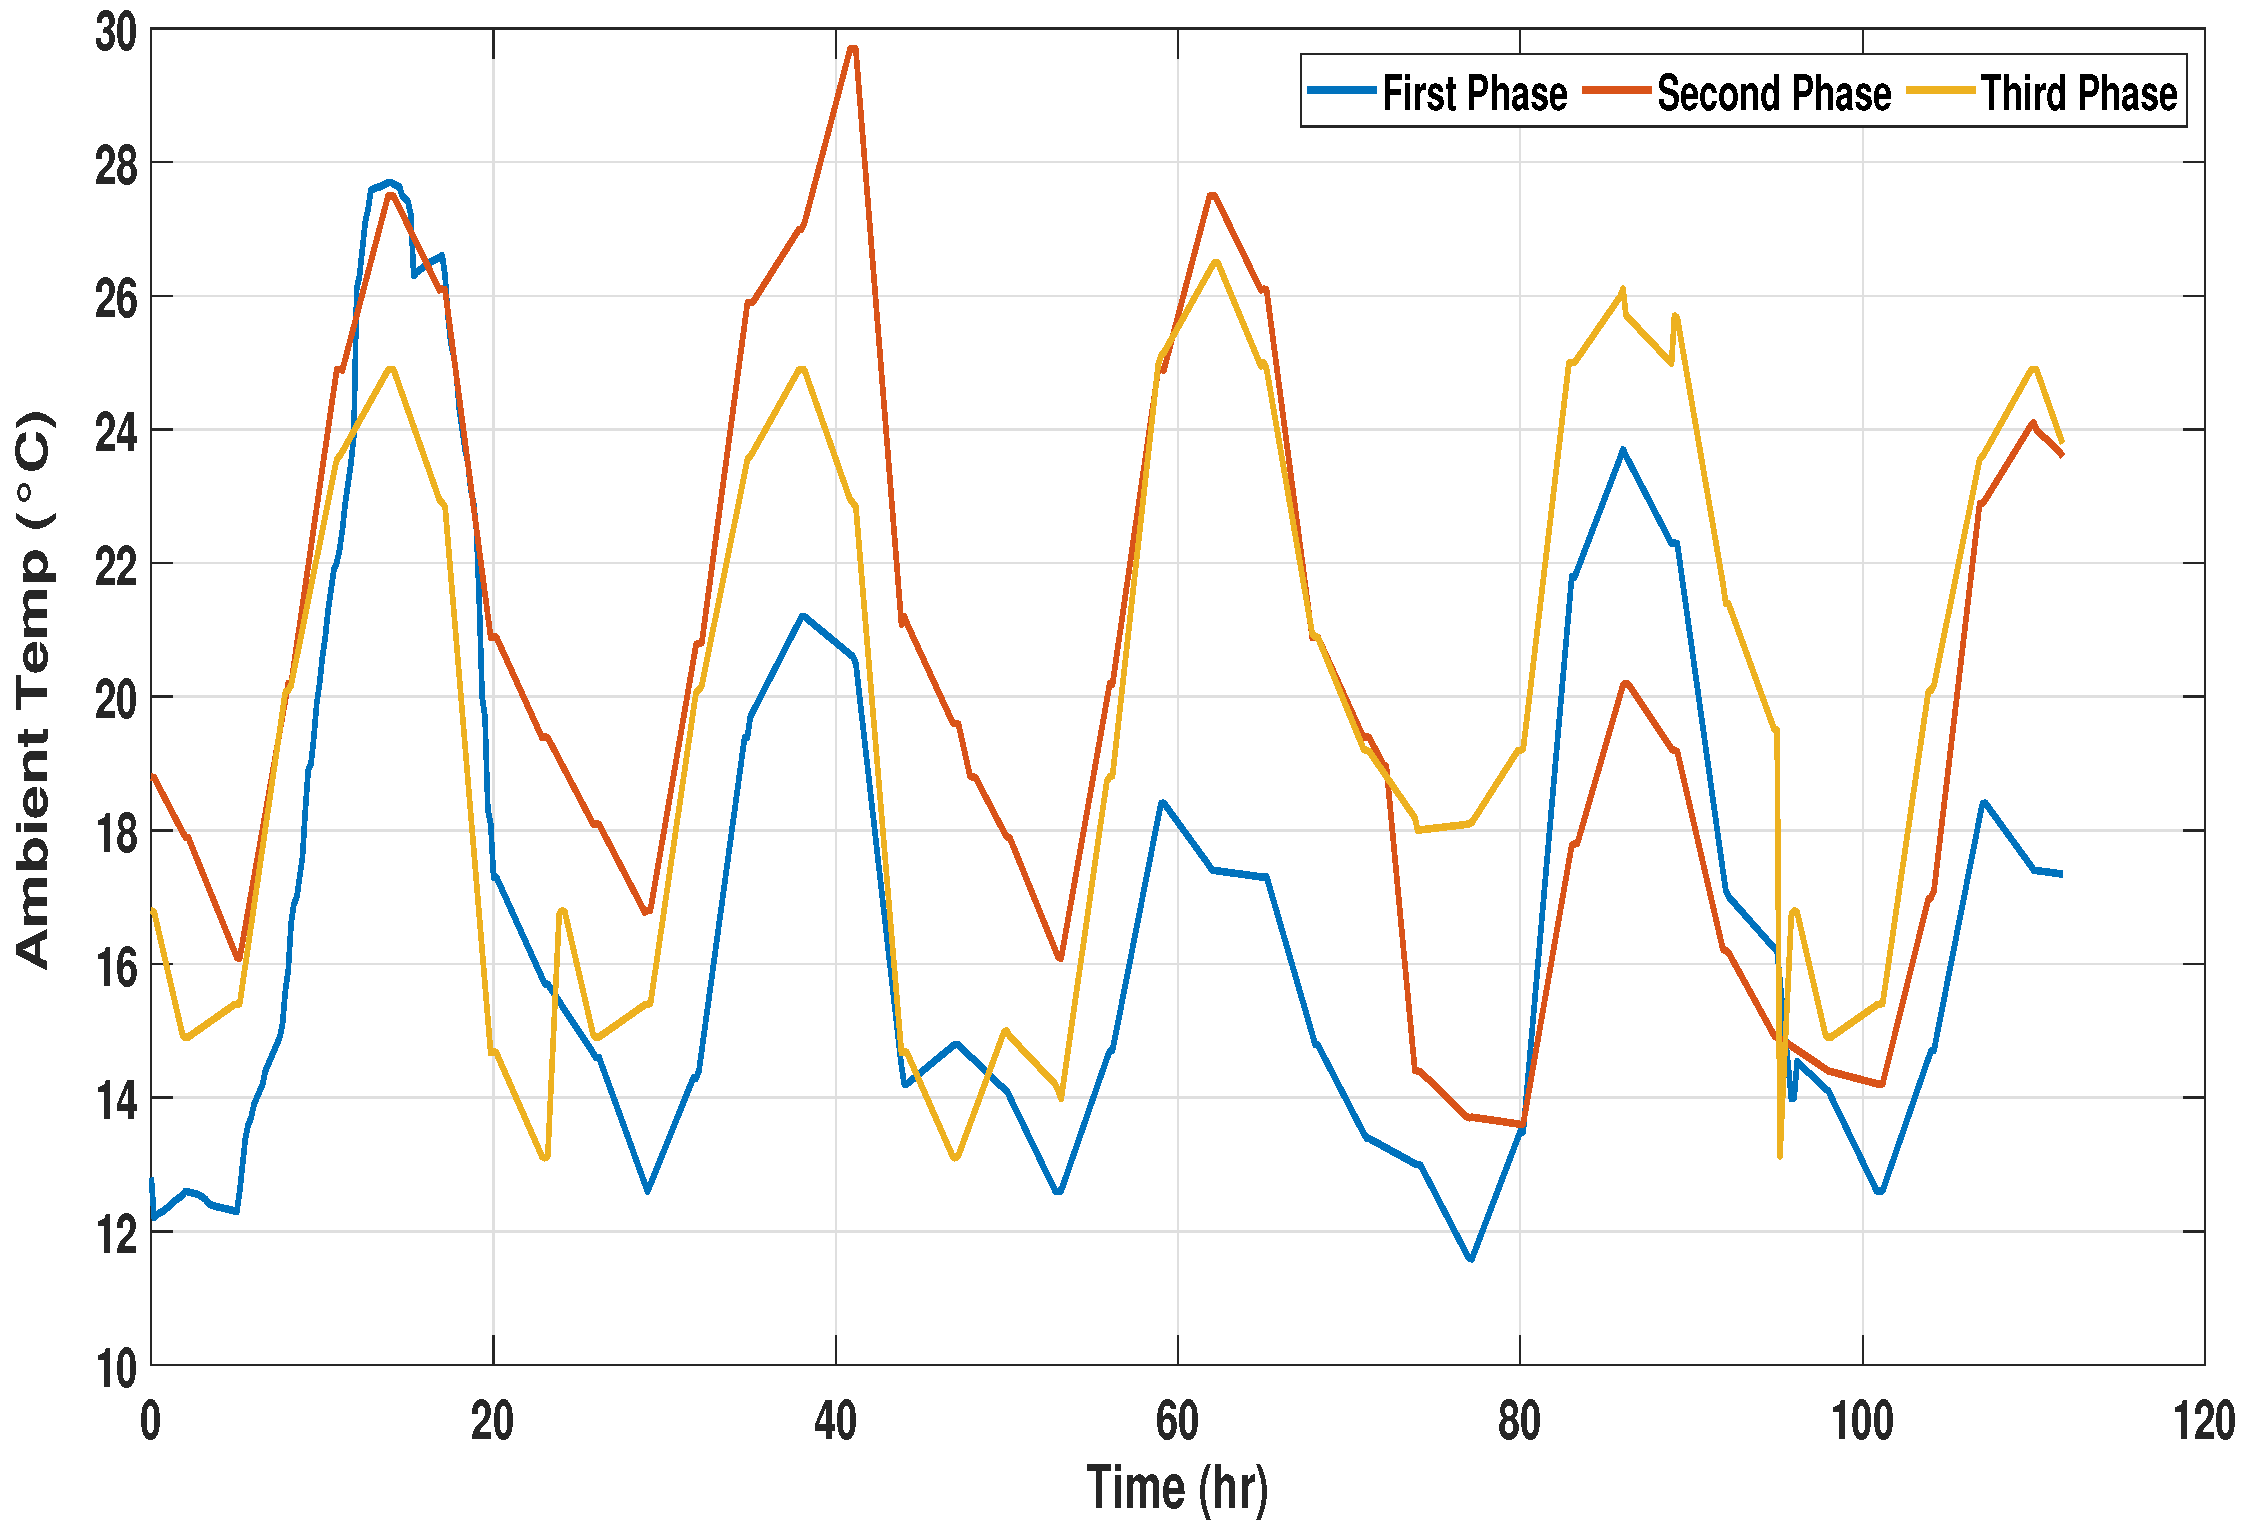
Environmental conditions have a great influence on the power consumed by HVAC systems when achieving a desired setpoint. The difference in ambient temperature and the setpoint is directly proportional to the power consumed. Heat transfer takes place through the outer boundaries of the zone due to temperature differences, and the flow of heat flux increases with an increase in this difference, causing more power consumption by the HVAC system to keep tracking the desired setpoint. Three time spans have been considered to validate the performance of the proposed controllers. Global solar irradiation, wind speed, and ambient temperature data have been collected from [
45], with a sampling period of 10 min, as shown in
Figure 5,
Figure 6 and
Figure 7, respectively. All of the simulation scenarios and controller designs have been carried out in MATLAB Simulink R2022b. The computer used has an Intel(R) Core(TM) i7-10850H CPU operating at 2.70 GHz, 2712 MHz, and having a total of 32 GB of installed physical memory.
Various phases of the year are considered to evaluate the controller performance under different environmental conditions and analyze the influence of weather conditions on the dynamic behavior of the zone temperature. The length of each phase is taken as a quarter of a year (approx. 112 days) to cover all the seasons in a year. To verify the robust response of the proposed controllers, the model has been tested against variations in environmental and in-room parameters. Variations in the required room temperatures and external parameters have been included in the validation process by considering three samples of environmental and operational procedure data from different time frames of a year. It can be observed from
Figure 5,
Figure 6 and
Figure 7 that the length of each span is 111.67 days.
5.2. Dynamic Setpoint
In the case of a hospital OT, the temperature setpoint is selected on the basis of the required operation procedure and the comfort of the patient. Research work is available in the literature which deals with fixed setpoints [
6]. This work shows overshoots and large settling times, which are not useful in the case of hospital OTs.
5.3. Johnson Temperature Controller
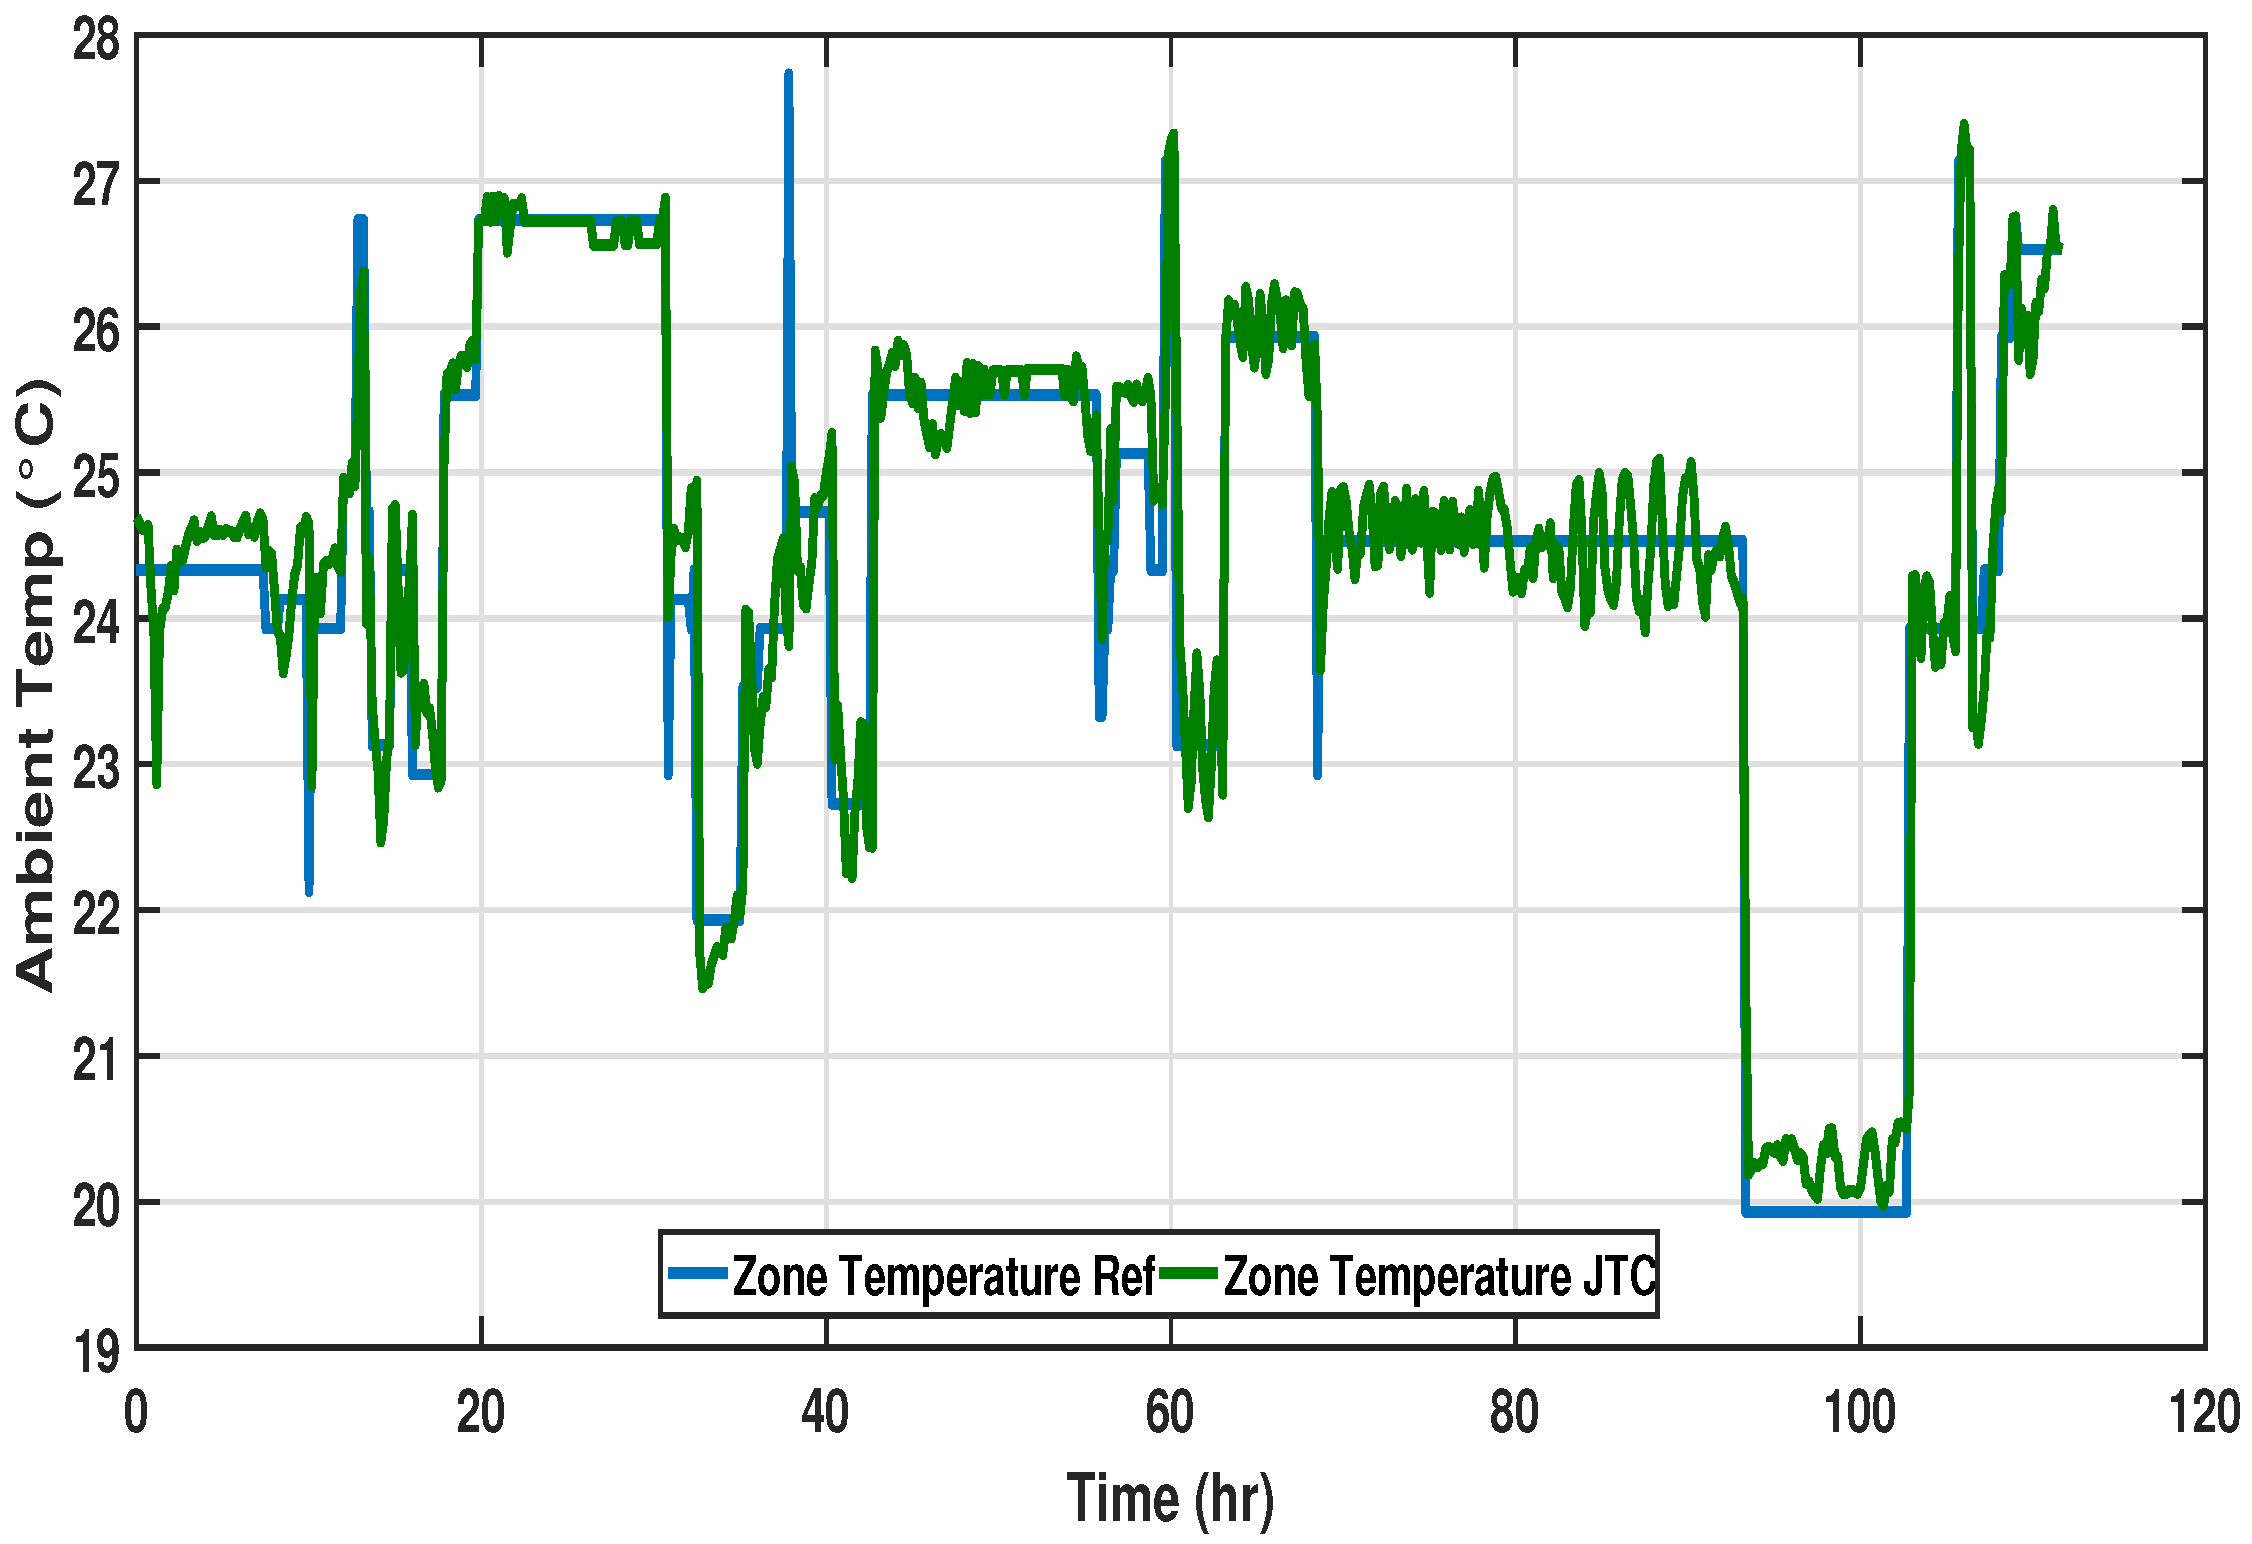
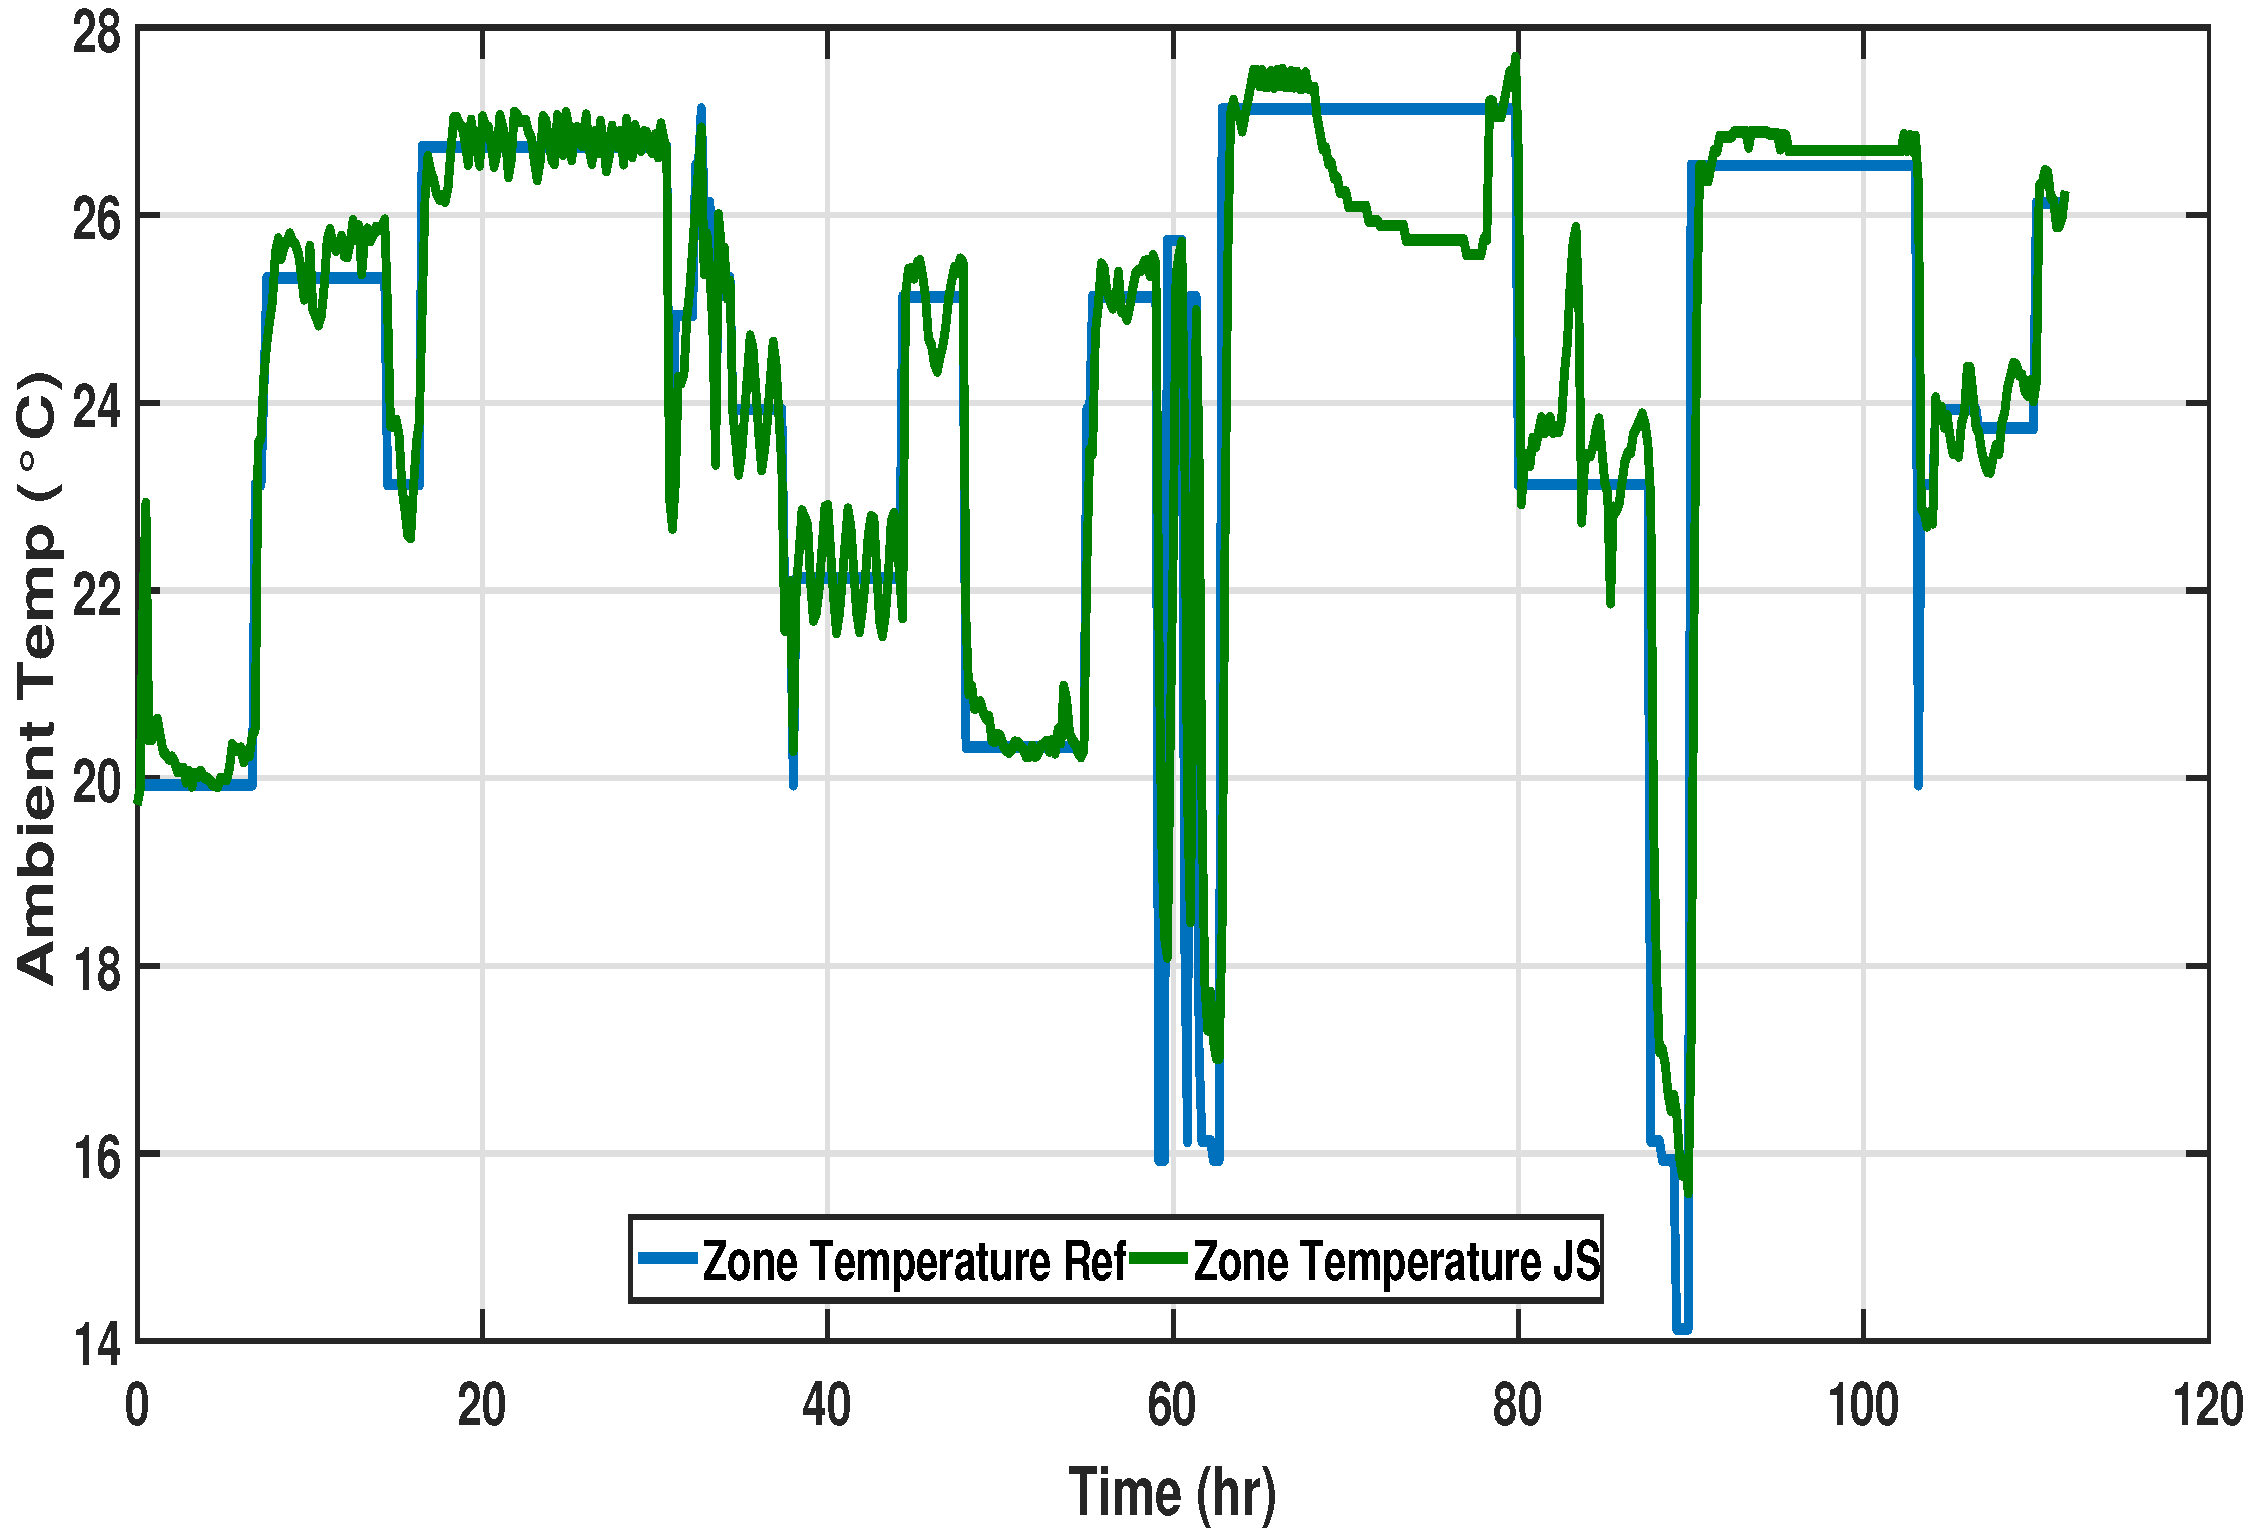
To gather experimental results, a Trane air cooled chiller plant was installed at the under-observation OT zone. The chiller was equipped with a built-in Johnson temperature controller (JTC) to track the desired zone setpoint. The data was recorded and the response of the JTC is presented in
Figure 8,
Figure 9 and
Figure 10 for all three time spans.
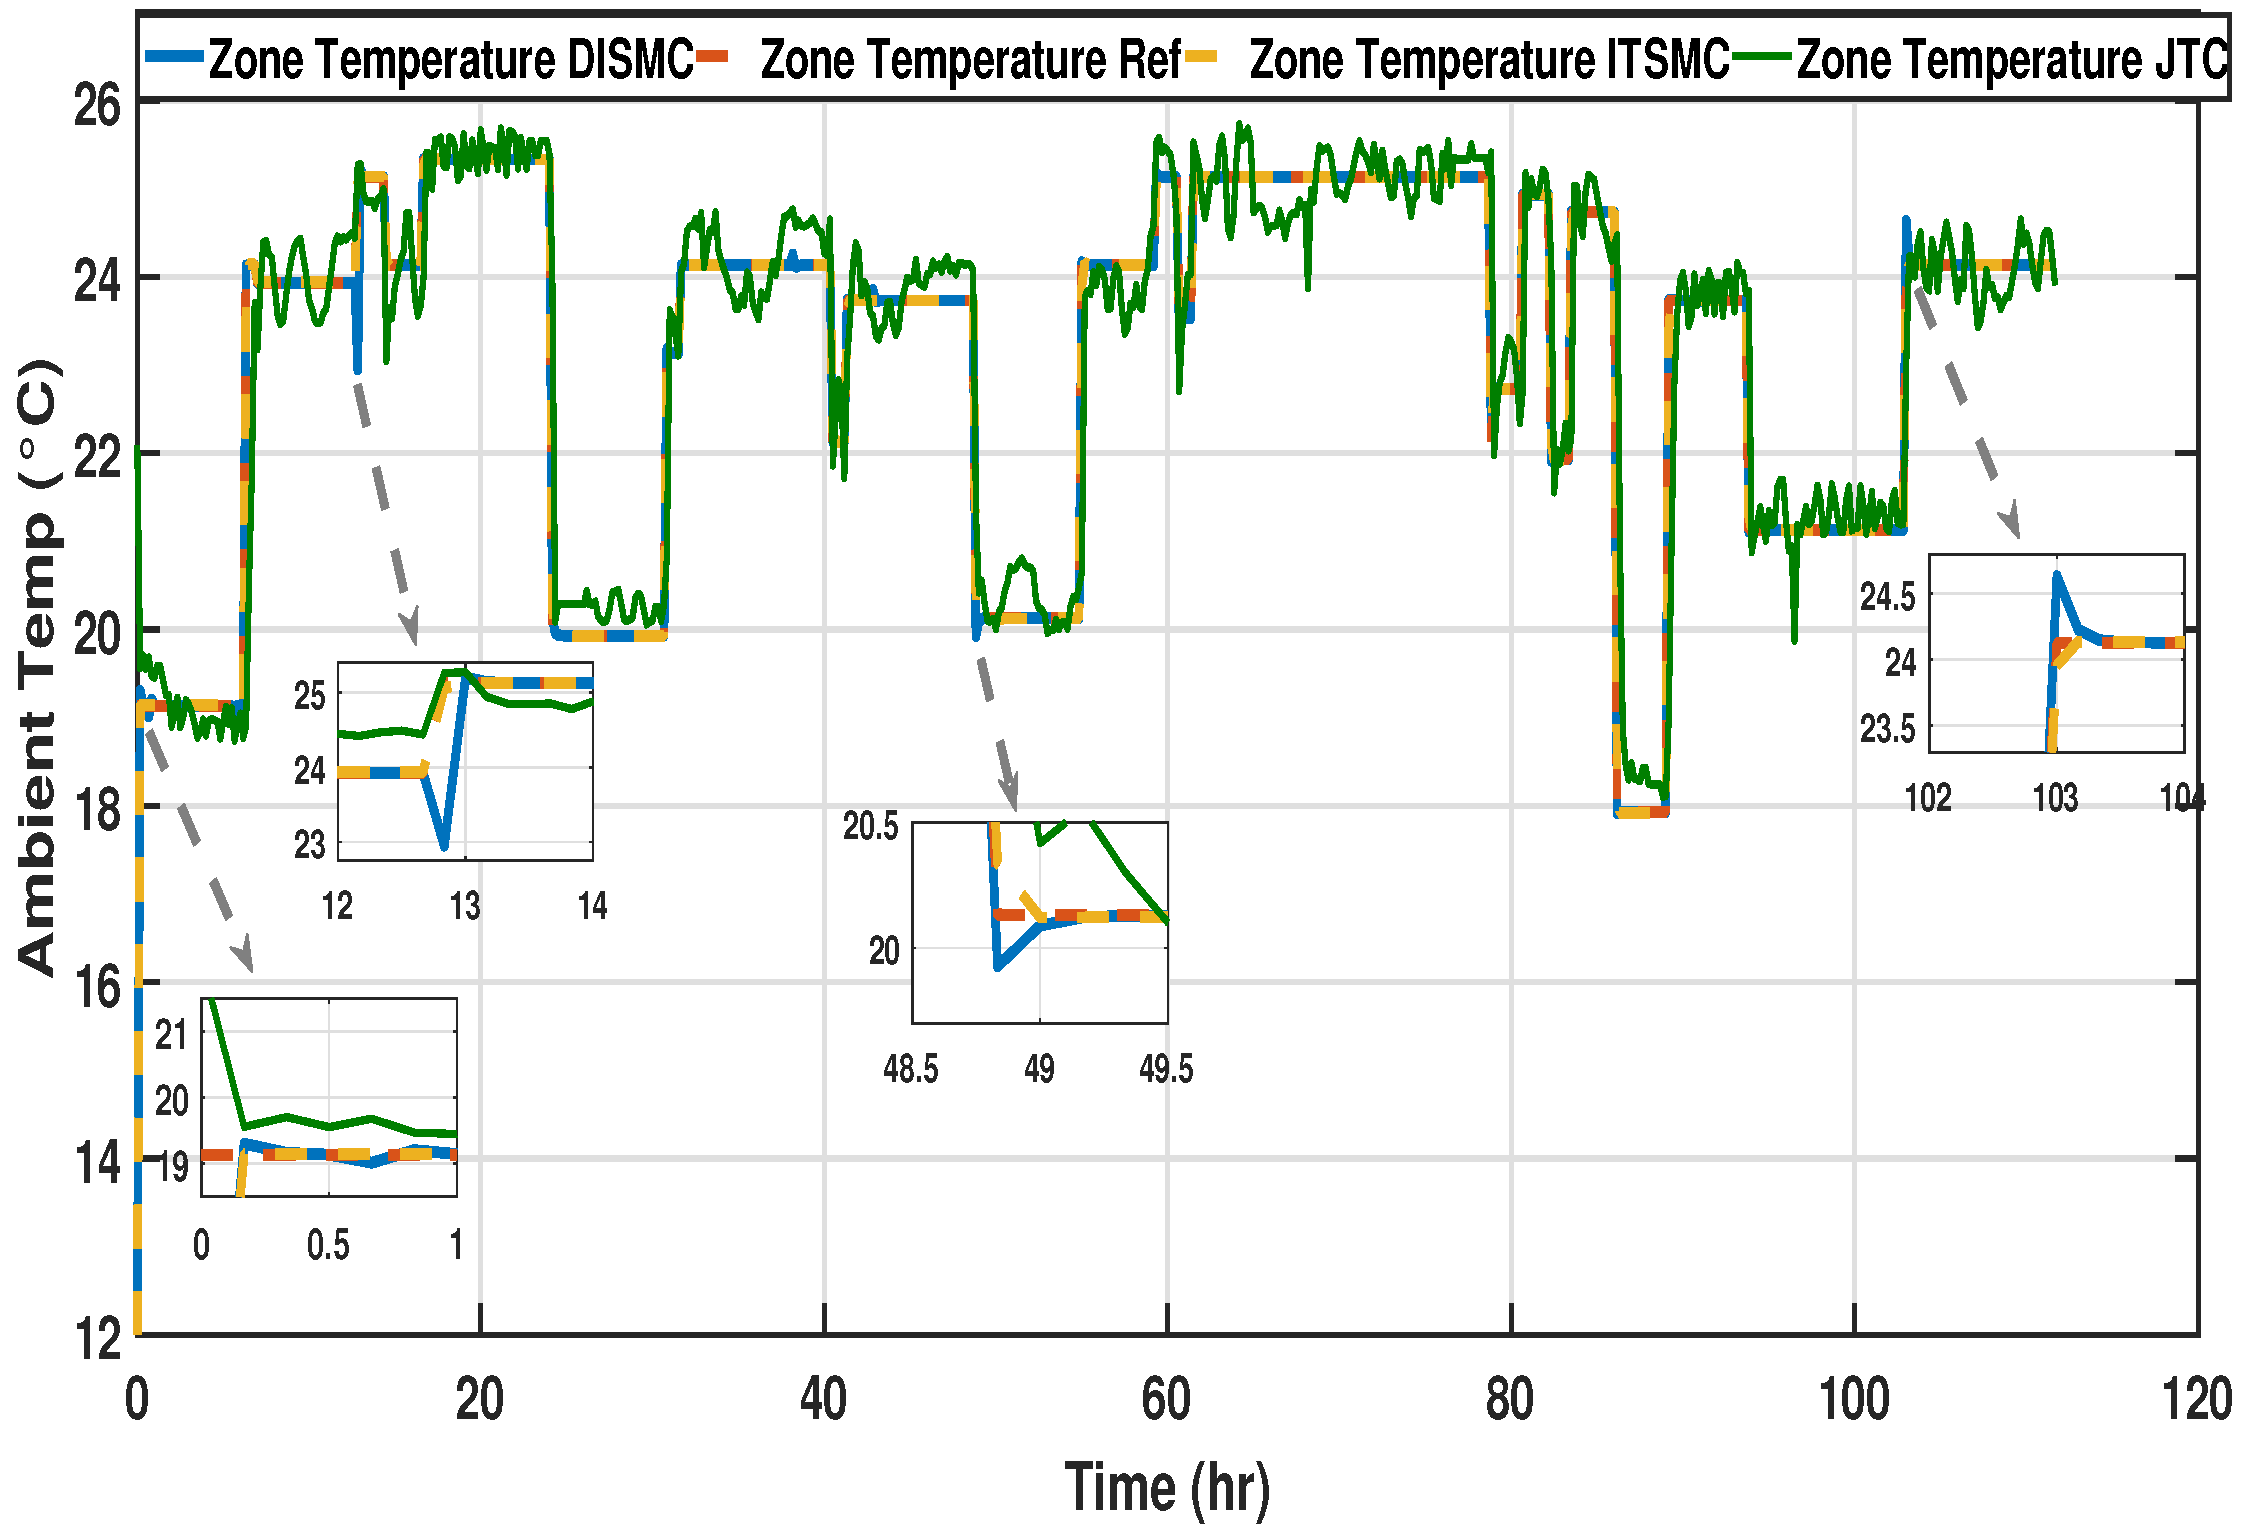
All three cases with JTC show identical responses against dynamic setpoints, where poor tracking performance and undesired oscillations are observed. Even a constant setpoint response shows a steady-state error with large harmonics, which is not suitable for clinical purposes. Large overshoots and undershoots in the zone temperature present unnecessary delays, as the environment is not suitable to initiate the operation. These delays in settling time and power steady-state response force delays in operation initiation that cause huge power losses. Sometimes during an operation, a quick change in zone temperature is required to make it feasible for the doctors and patients. The existing JTC controller appears not to be able to achieve such an abrupt change. A robust and smart controller is thus required which presents a fast dynamic response, less over/undershoots, a stable steady-state response, and a shorter settling time, ultimately leading to a decrease in the electric power consumed during large overshoots and oscillations.
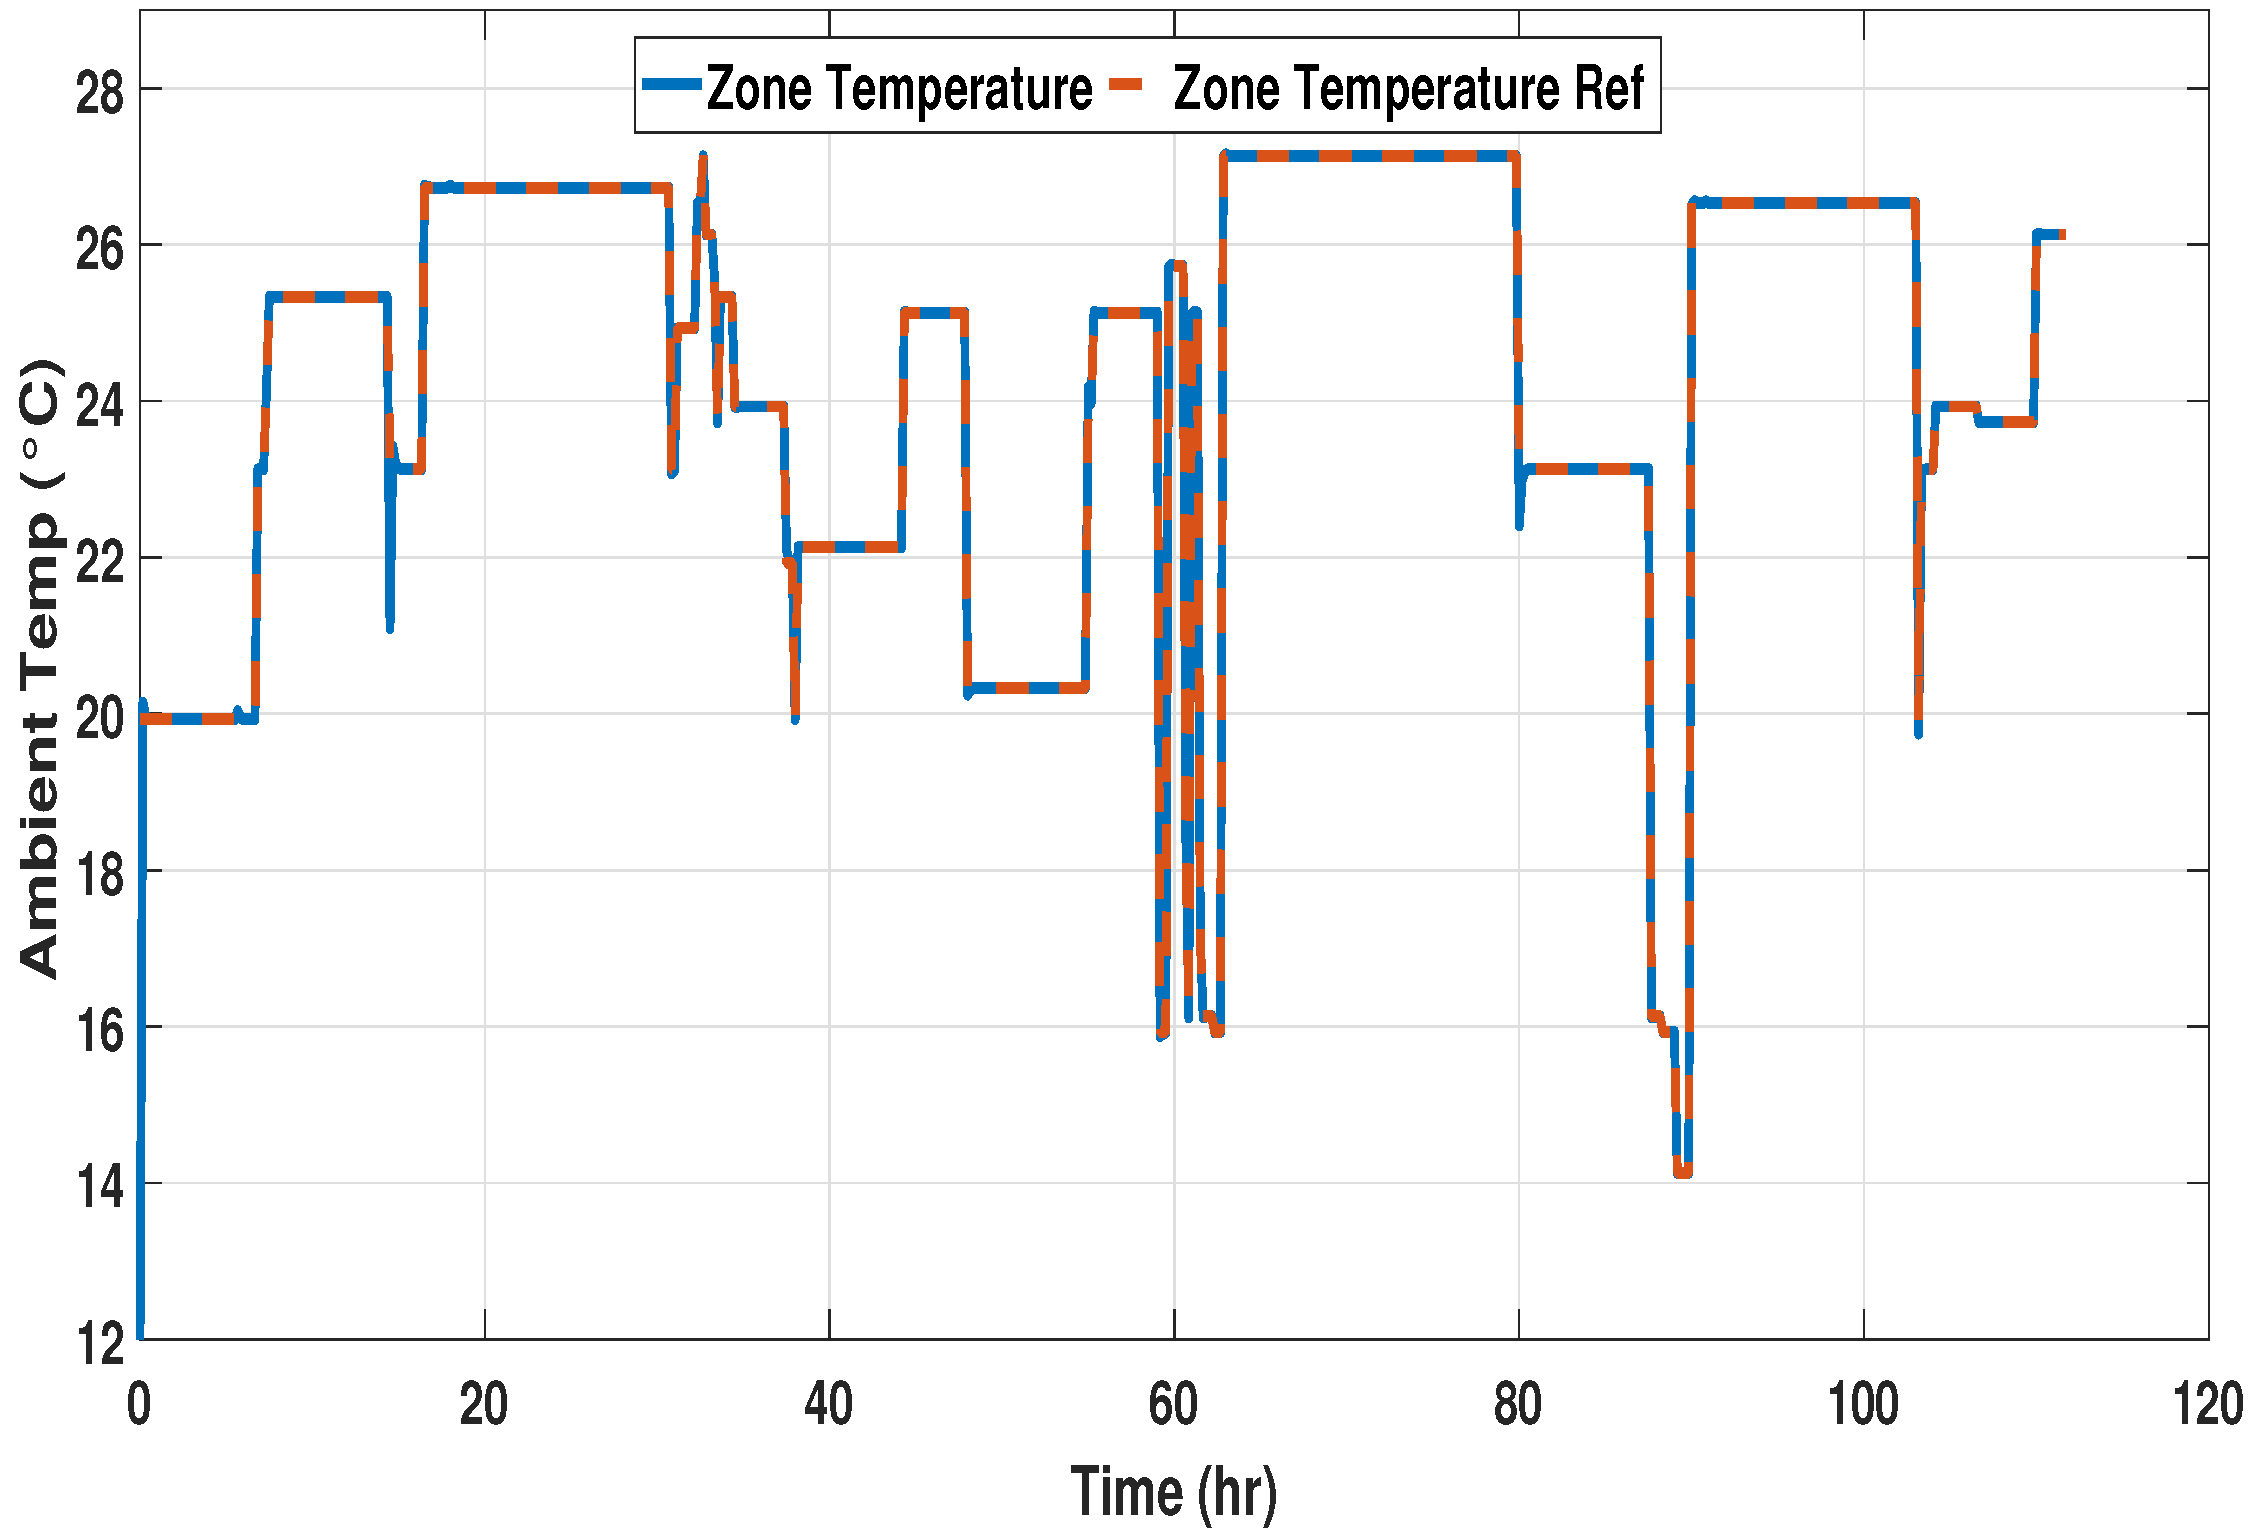
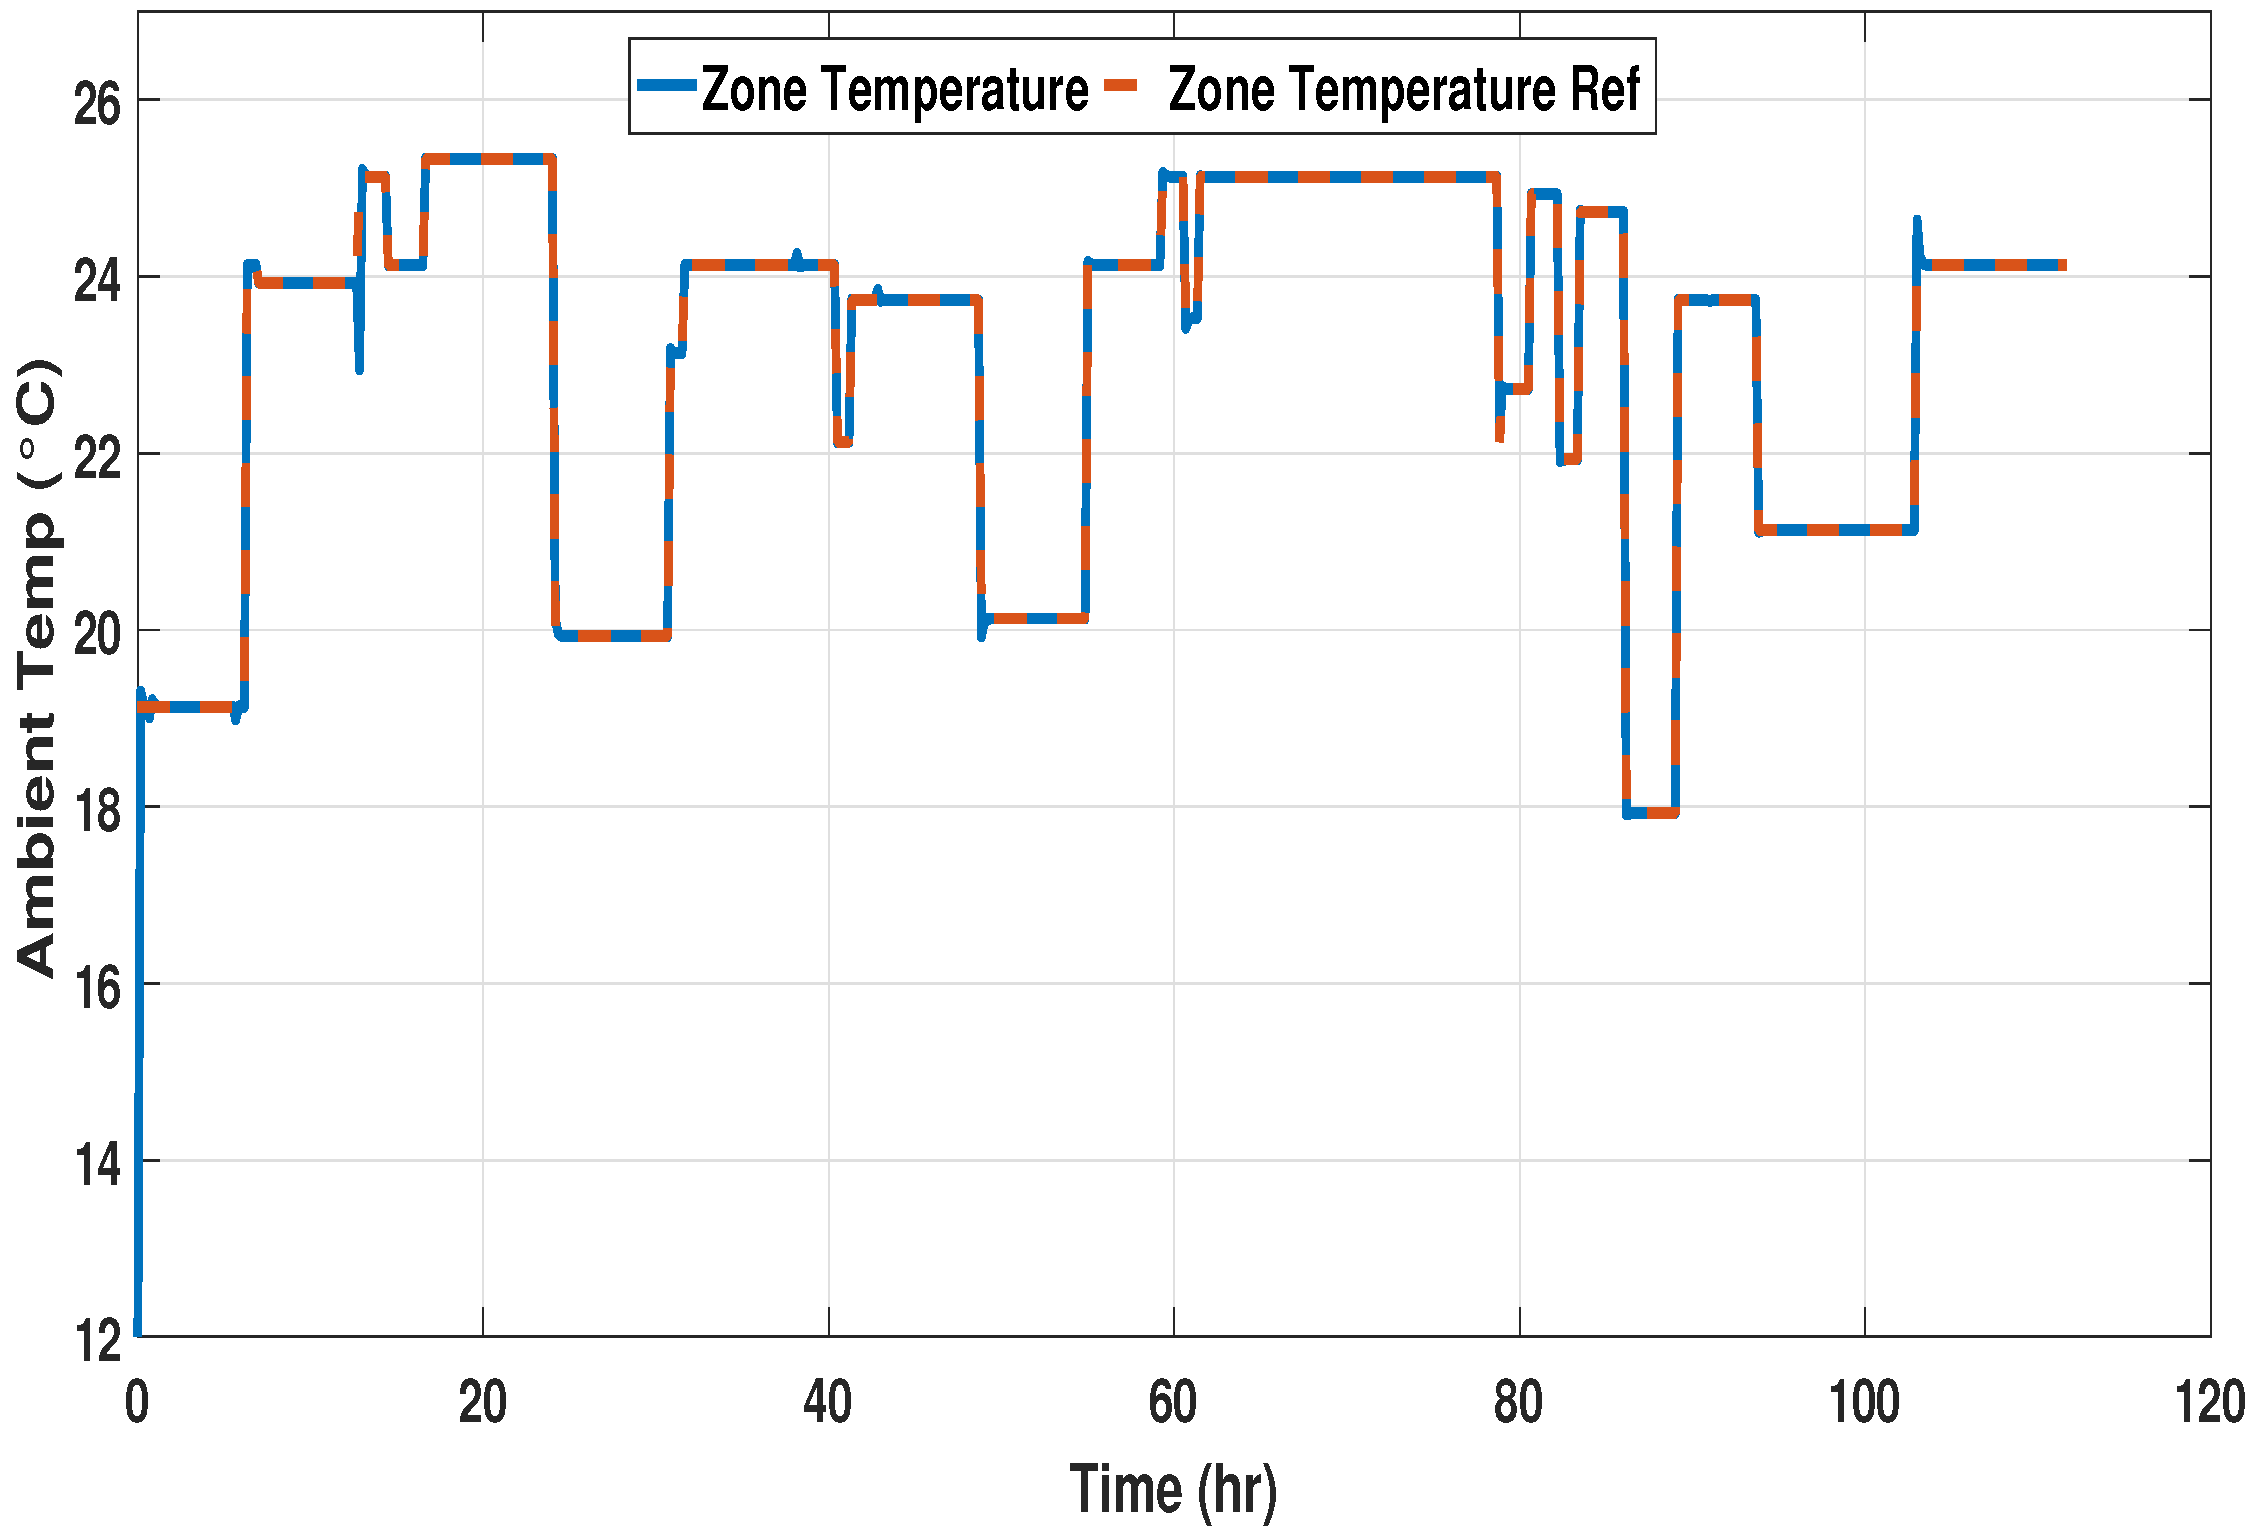
5.4. Implementation of DISMC Temperature Controller
A DISMC for zone temperature control has been designed for tracking the dynamic zone temperature setpoint. The mathematical evaluation of DISMC has been presented in the controller design section. The performance of the controller is tested under the influence of weather conditions for all three time spans, with the results presented in
Figure 11,
Figure 12 and
Figure 13.
The system response during the second and third phases shows better results. The controller helps the HVAC system to track the desired reference in an effective way with zero steady-state error. It has been observed during all the phases that zone temperature sometimes takes up to half an hour to settle down to the required reference due to overshoots. However, the overshoots are not large, which leads to less power consumption and better zone temperature regulation.
5.5. Implementation of ITSMC Temperature Controller
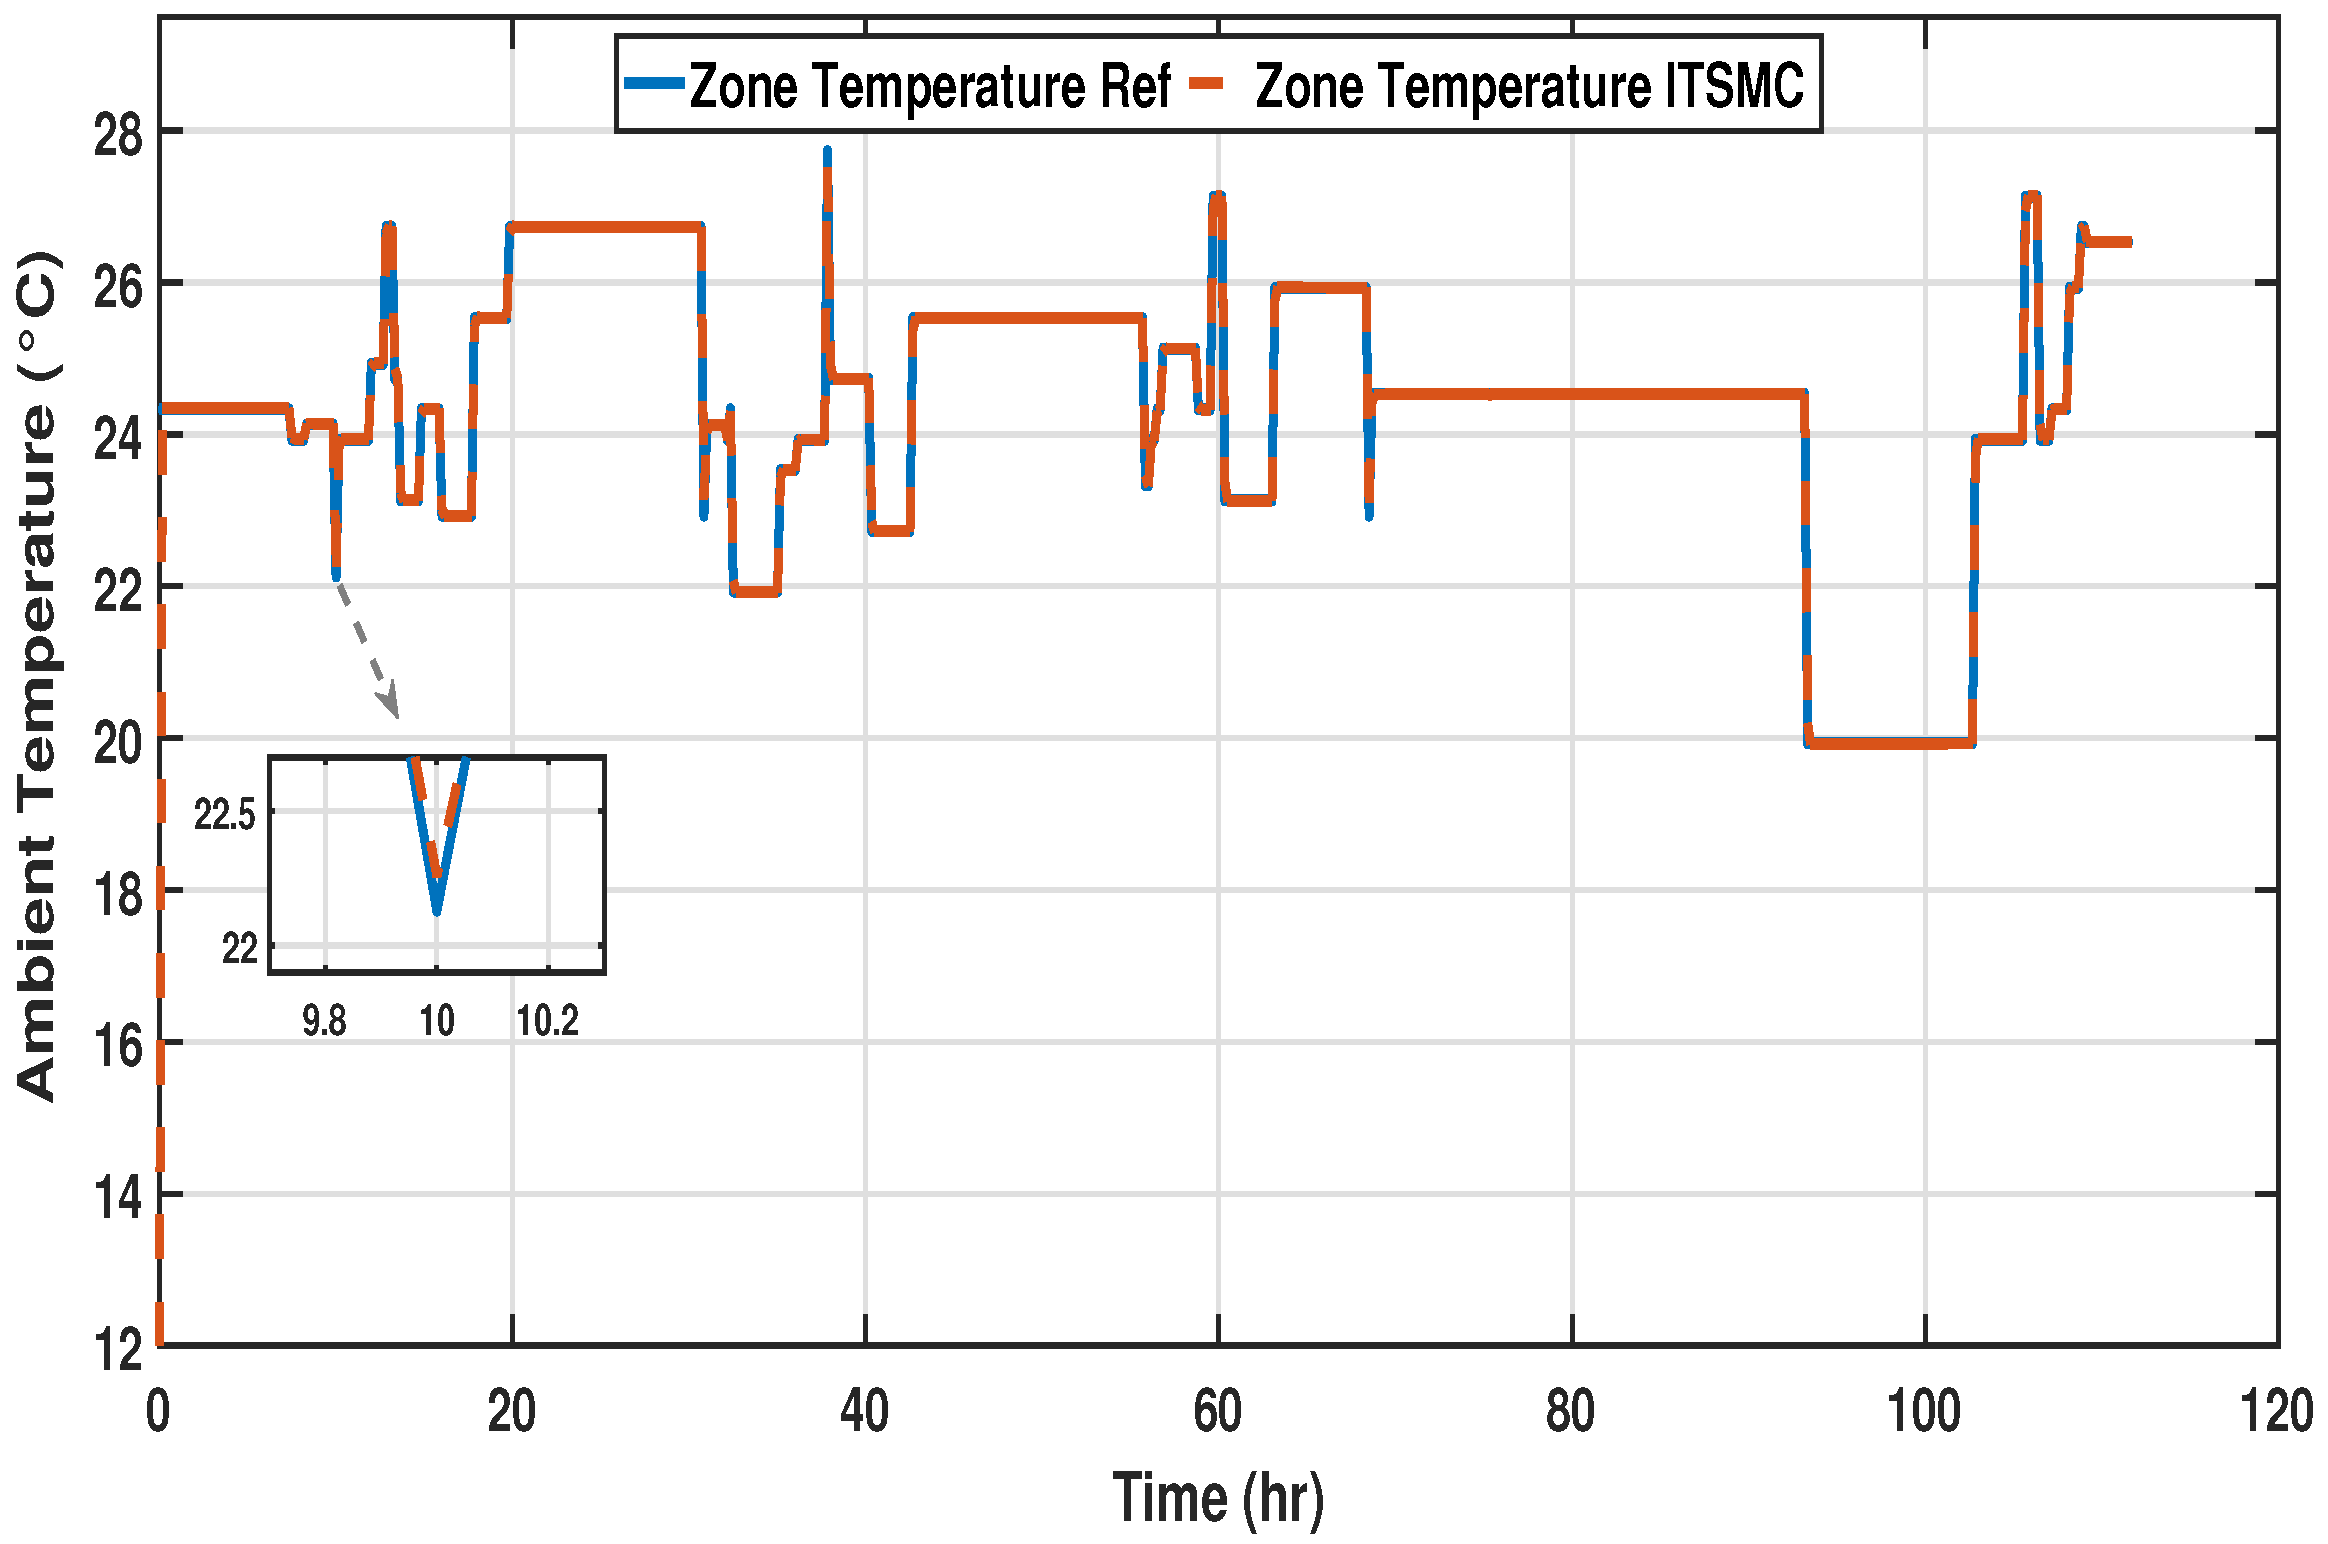
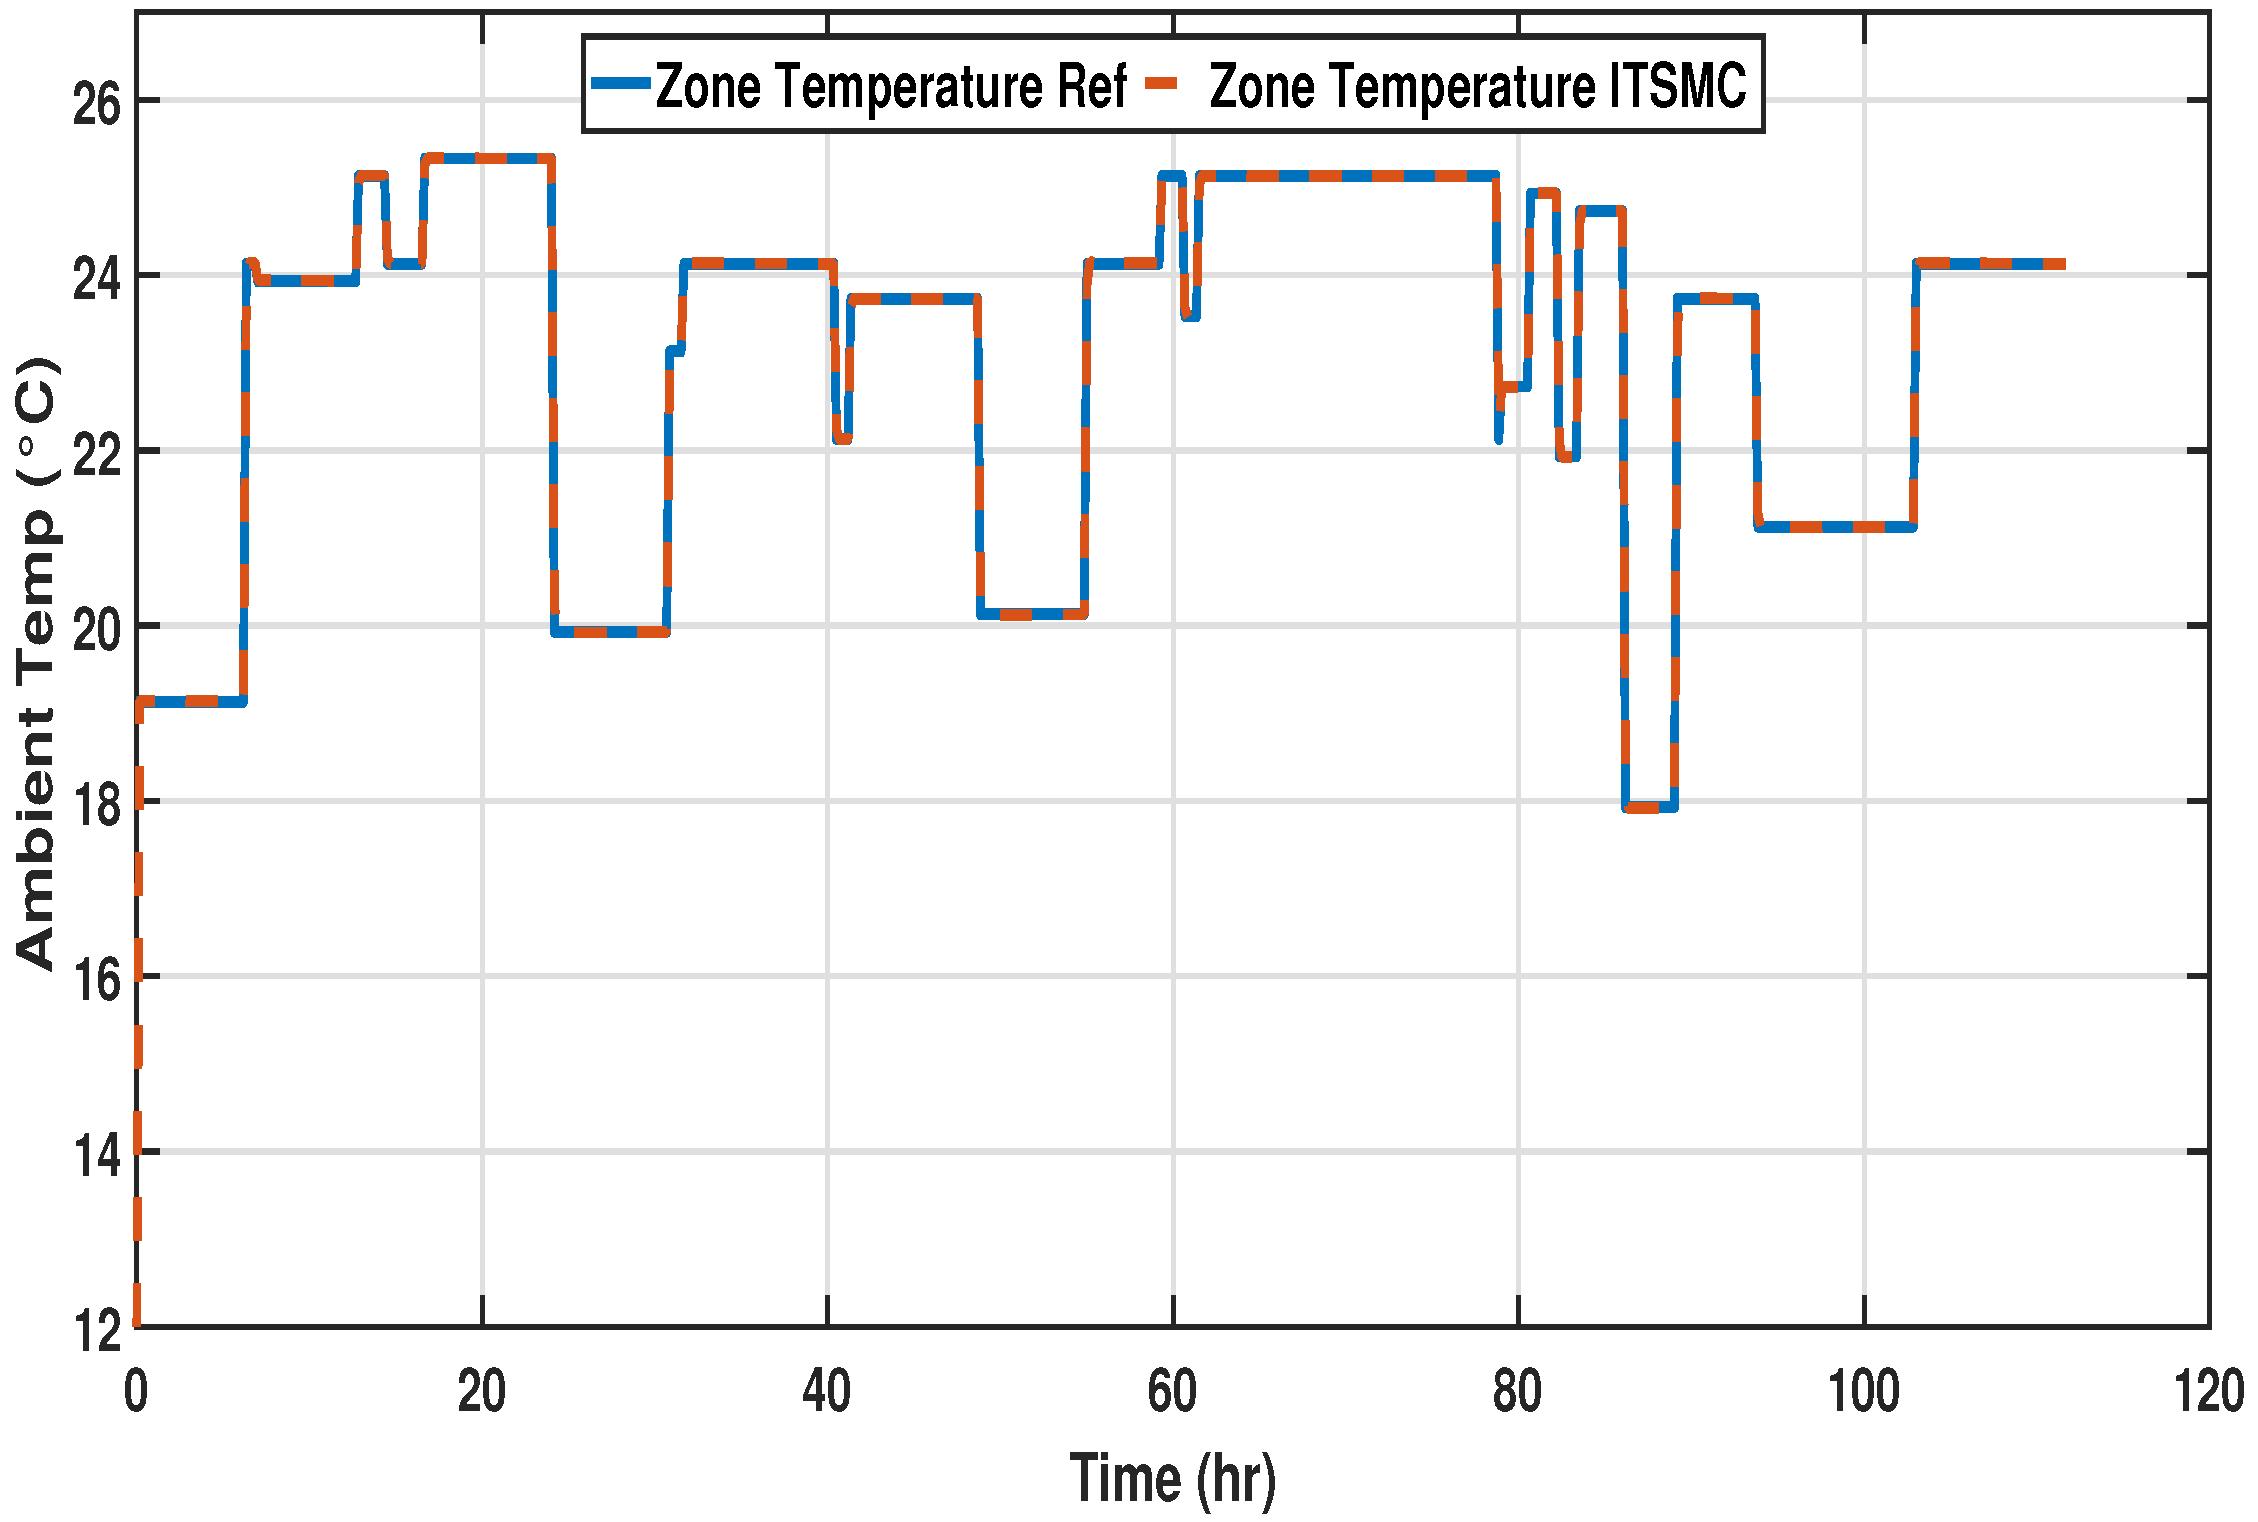
To further decrease the overshoots and to produce a better tracking response, the terminal part has been introduced in the controller design. The performance of the designed controller is evaluated by examining the response of the system under the same testing conditions as DISMC. The responses of ITSMC to the dynamic setpoints are presented in
Figure 14,
Figure 15 and
Figure 16.
During all three phases, the response is satisfactory, with zero overshoots and a small settling time, making it an ideal controller for OT zone temperature control. With negligible overshoot, a small settling time, and negligible steady-state error, the proposed ITSMC controller helps to prepare the OT quickly for the next procedure and supports abrupt temperature variations.
5.6. Comparative Analysis
A comparative performance analysis of JTC and the proposed two controllers is established in this section. The performance of the proposed DISMC and ITSMC temperature controllers with installed JTC for tracking the desired dynamic setpoints in all three phases are presented in
Figure 17,
Figure 18 and
Figure 19.
It can be seen that DISMC shows an overshoot of 0.5 °C at the first phase to the desired reference and takes up to half an hour to reach the desired reference, whereas ITSMC has zero overshoot and a smaller settling time. After 55 hr of observation, a large overshoot of 2 degrees Celsius is seen in DISMC, which forces a delay of half an hour to initiate the procedure so that the system can settle down to the desired reference. At each large transition, DISMC shows overshoots that are not suitable for the clinical installation, whereas ITSMC shows satisfactory results, which makes it a better choice for zone temperature controllers in the case of an operation theater. The JTC, on the other hand, presents significant oscillations and steady-state errors. A similar overshoot in the zone temperature has been observed in the other two observation phases with the DISMC temperature regulator, whereas the ITSMC temperature controller shows promising results with negligible overshoot, a small settling time, and zero steady-state error.
A comparative analysis of the instantaneous power consumption in each observation phase by the HVAC system using DISMC and ITSMC is presented in
Figure 20,
Figure 21 and
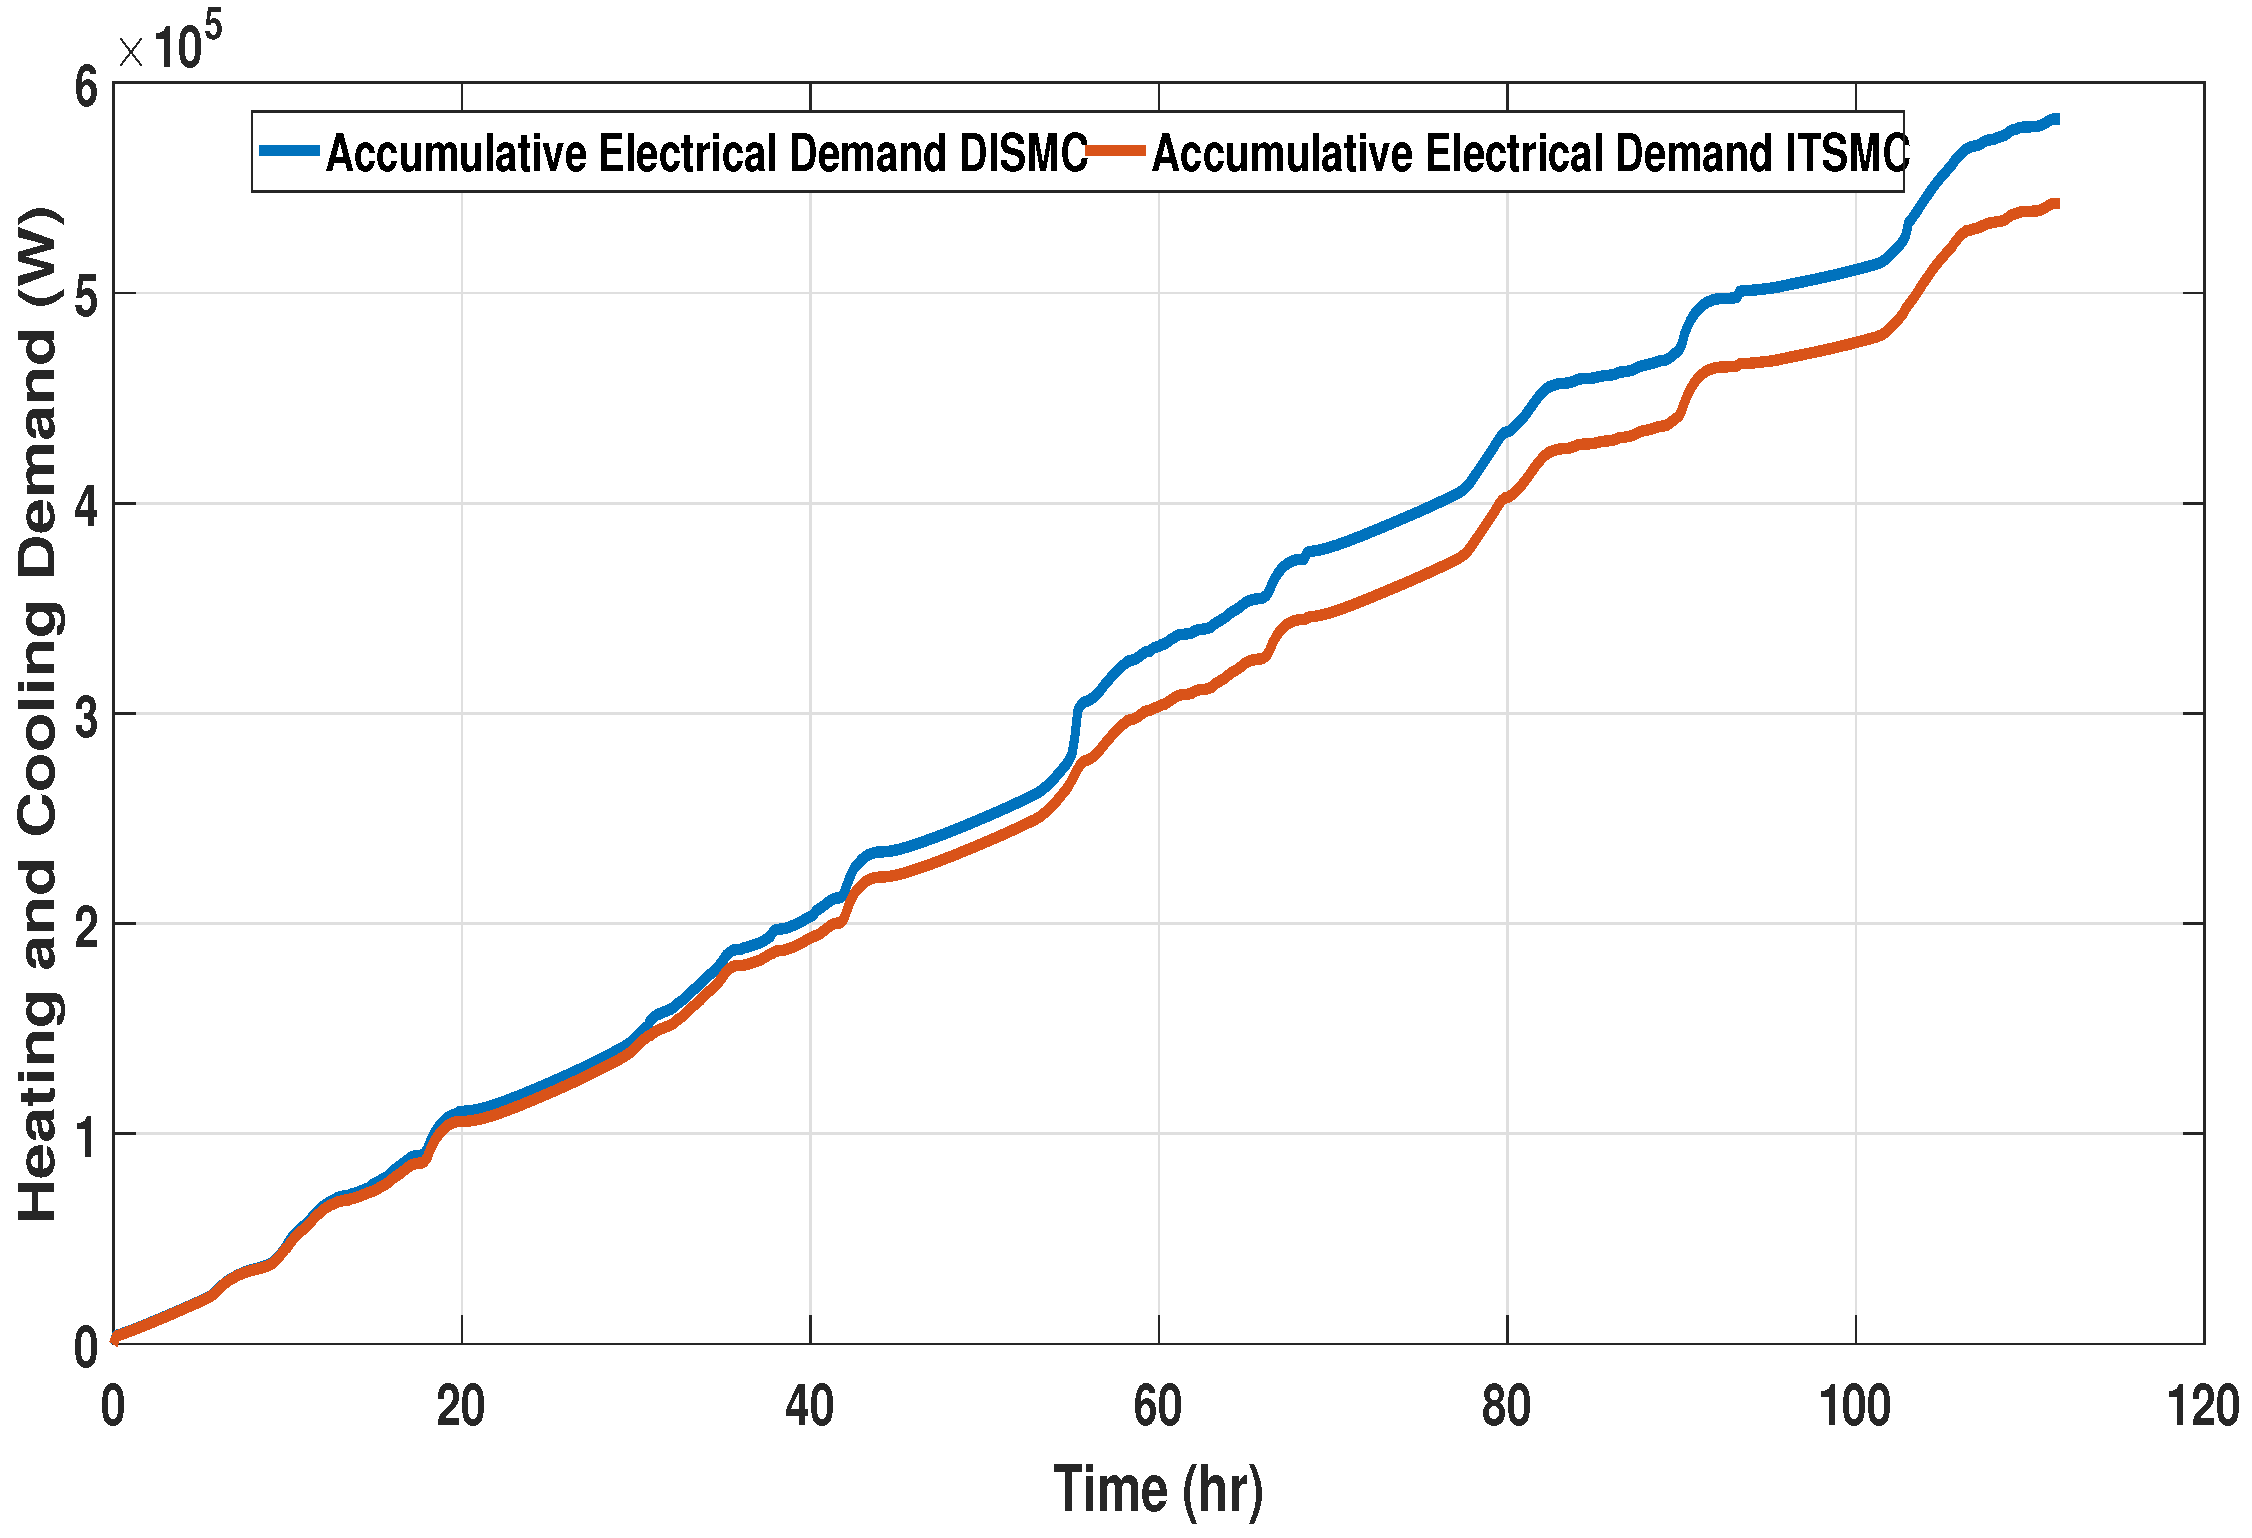
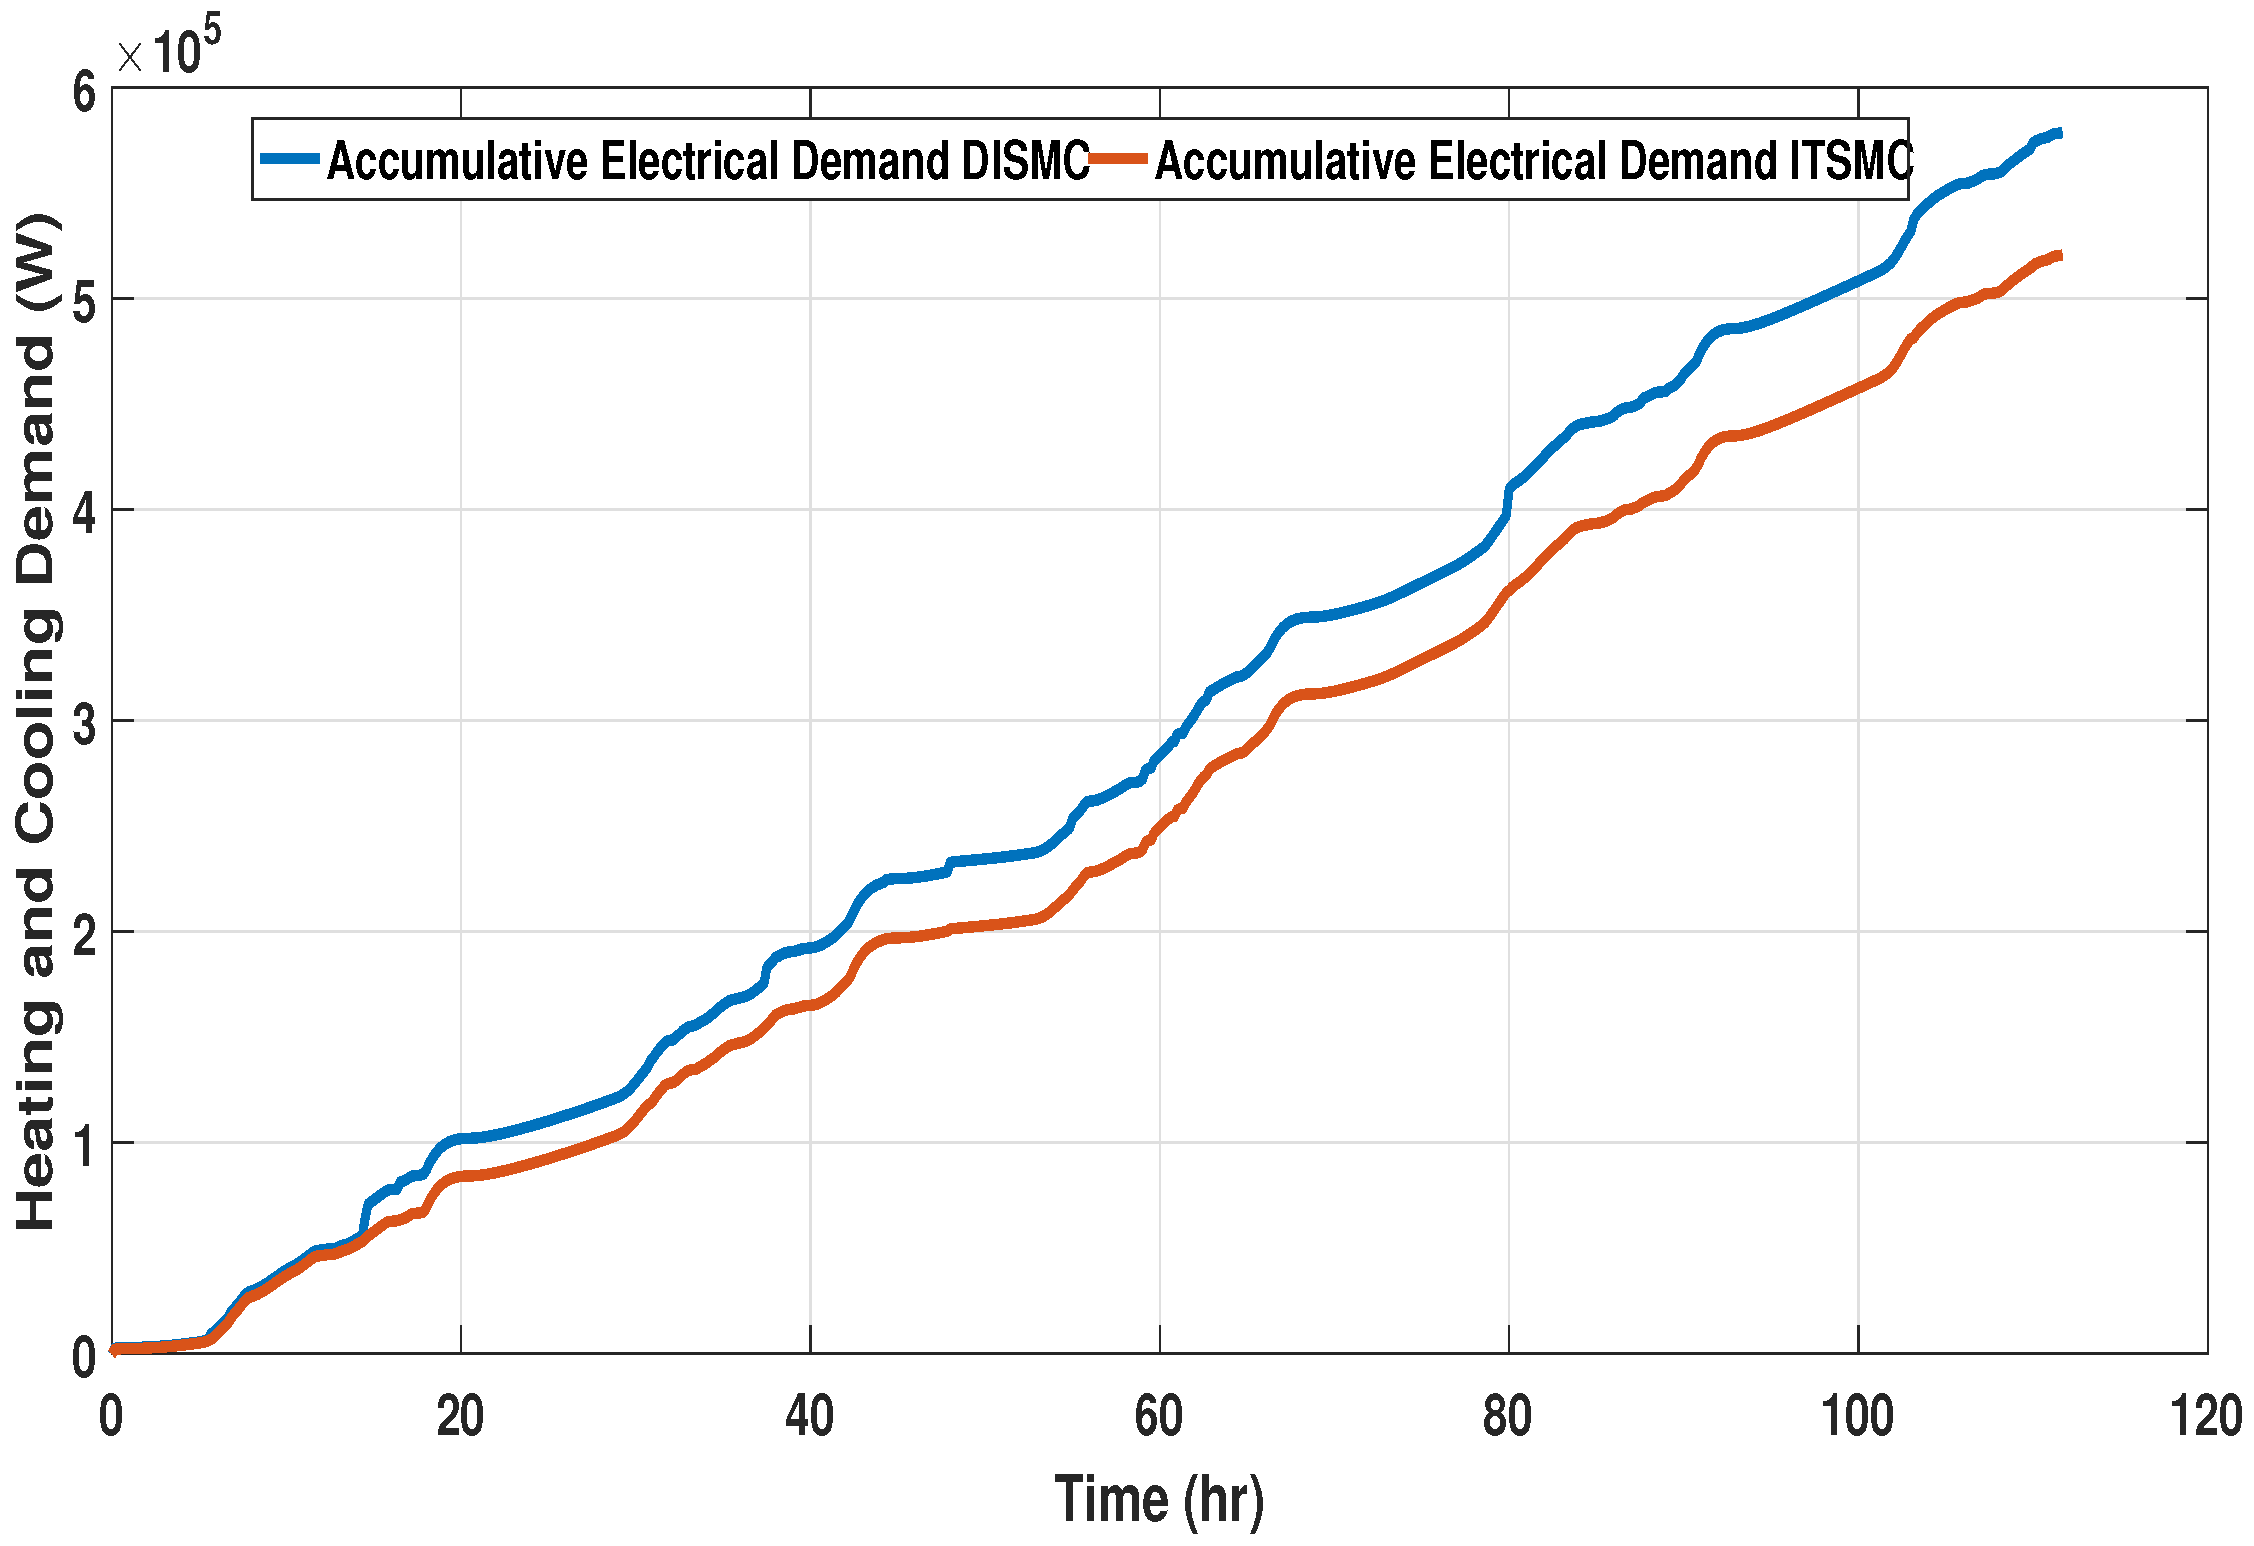
Figure 22, respectively. For phase one, large spikes in power consumption are observed during the temperature setpoints transition in the case of DISMC, whereas the spikes in instantaneous power demand in the case of ITSMC are small. Similar behavior is recorded in the second and third phases of the observation period. For DISMC, large spikes occur at the transition point in the dynamic setpoint of zone temperature. The HVAC system tries to attain the required zone temperature but DISMC overshoots. The accumulative power consumed during each observation phase has been evaluated to analyze the total power consumed by the HVAC system in the case of the DISMC and ITSMC-based controllers. The accumulative power consumed by the HVAC system in the first, second, and third phases are shown in
Figure 23,
Figure 24 and
Figure 25, respectively. The energy consumed by the HVAC operation is dependent on the instantaneous power of the hospital OT unit over the time periods of HVAC operation. Thus, increasing the working period or the demanded power would increase the energy consumption.
It can be observed that a larger amount of accumulative power is consumed by the HVAC system in the case of DISMC installation. This rise in consumed power is due to an overshoot observed in the instantaneous power consumption at setpoint transitions. While the power consumed by the HVAC system with the ITSMC temperature regulator is low, which shows its economic benefits due to smooth and better control actions.
Better performance in achieving the desired temperature, and less consumption by the ITSMC compared to DISMC, shows the advantages of using a better controller with precise control actions.
