Article

Investigation of the Impact of Natural Fracture Geomechanics on the Efficiency of Oil Production and CO2 Injection from/to a Petroleum Structure: A Case Study

by
Wiesław Szott
*,
Piotr Ruciński
,
Małgorzata Słota-Valim
and
Krzysztof Sowiżdżał
Oil and Gas Institute-National Research Institute, 25A Lubicz Str., 31-503 Cracow, Poland
*
Author to whom correspondence should be addressed.
Energies 2023, 16(10), 4219; https://doi.org/10.3390/en16104219
Submission received: 14 April 2023 / Revised: 17 May 2023 / Accepted: 18 May 2023 / Published: 20 May 2023
(This article belongs to the Special Issue Potential Evaluation of CO2 EOR and Storage in Oilfields)

Abstract

:
The paper addresses the problem of geomechanical effects in the vicinity of production/injection wells and their impacts on the processes of enhanced oil recovery by CO2 injection and CO2 sequestration in a partially depleted oil reservoir. In particular, it focuses on natural fracture systems and their dynamics caused by variations in the rock geomechanical state due to reservoir pressure changes during production/injection processes. The comprehensive approach to the problem requires the combined modeling of both geomechanical and flow phenomena associated with effective coupling simulations of their evolution. The paper applies such an approach to a real, partially depleted oil reservoir in Poland. An effective method of coupled geomechanical and dynamic simulations was used together with the natural boundary and initial conditions for both simulation types. In addition, typical operating conditions were applied in analyzing the processes of enhanced oil recovery by CO2 injection and CO2 sequestration. The detailed results of relevant modeling and simulations are presented and discussed focusing on various scale consequences, including the reservoir, well, and completion ones. Both general conclusions as well as the ones specific to the analyzed geological structure are drawn; they confirm the significant dependence of well performance on geomechanical effects and point out several key factors for this dependence. The conclusions specific to the analyzed structure concern fracture reactivation in tensile/hybrid failure mode caused by pressure build-up during CO2 injection and the importance of the fracture-induced aperture changes resulting from the normal stress, while the shear stress is found to be negligible.

1. Introduction

The injection of CO2 into subsurface rock formations has been practiced for decades as an enhanced oil (CO2-EOR) and gas (CO2-EGR) recovery method [1,2,3,4,5,6,7,8,9]. Another, more recent process inherently involving CO2 injection into subsurface structures concerns geological CO2 sequestration [1,7,8,10,11,12,13,14,15]. Generally, most of those projects were preceded and/or accompanied by process modeling studies. Concise descriptions of such studies follow. W. Al-Masari and coworkers [16] evaluated the potential of a CO2-EOR project under the conditions of a specific petroleum reservoir in the Danish sector of the North Sea. A. Ettehadtavakkol, L. W. Lake, and S. L. Bryent [17] performed the field-scale design optimization of coupled CO2-EOR and storage operation from the viewpoint of oilfield operations under specific technical and economic assumptions based on the USA circumstances. Y. Gohmian et al. [18] investigated a variety of CO2 flood design variables related to both EOR and sequestration objectives in sandstone and carbonate reservoirs to maximize profit from oil recovery and maximize the amount of CO2 stored in the reservoir. R. Sagi, R.K. Agarwal, and S. Banerjee [19] optimized the EOR system to increase the recovery factor with more efficient utilization of injected CO2. M. Arnaut and coworkers [20] performed simulations of 72 reservoir cases followed by economic analyses for different reservoir conditions and injection strategies to examine the feasibility of different scenarios. H. Karimaie and coworkers [21] performed a simulation study carried out on a realistic model of a North Sea oil reservoir to assess the performance of CO2 flood in oil recovery. They compared various CO2 injection schemes and found a relatively high utilization ratio of CO2 floods compared to other EOR techniques. Y. Liu and Z. Rui [22] proposed a so-called storage-driven CO2 EOR involving the application of dimethyl ether as an additive to CO2 to improve oil recovery while assisting CO2 storage in oil reservoirs. Their simulation results showed that the storage-driven CO2 EOR is superior to conventional CO2 EOR in expanding a sweeping efficiency and providing a higher CO2 storage ratio. An analogous solution for improving CO2 utilization and storage in oil reservoirs was proposed by Y. Liu, Z., and coworkers [23] who demonstrated the advantages of using propanol as another additive to injected CO2. X. Zhao, Z. Rui, and X. Liao [24] studied the CO2 EOR potential and CO2 storage capacity of three reservoirs characterized by high heterogeneity, high water saturation, and extra-low permeability, and they found promising results that support the effectiveness of CO2 injection as means of reducing the CO2 emission to the atmosphere while enhancing oil recovery.
While all the above-cited studies and many more not mentioned here neglected geomechanical aspects of reservoir simulations applied to the EOR processes, T. W. Teklu and coworkers [25] reviewed geomechanical issues related to those processes and showed the geomechanics to play a significant role regarding all phases of CO2-EOR and CO2 sequestration development schemes. Their conclusions were taken into account in several following studies concerning CO2-EOR and CO2 sequestration modeling and simulations. G. Meurer et al. [26] used a geomechanical model of a fractured carbonate reservoir to understand the failure to open a hydraulic fracture and to investigate the effect of pressure depletion and associated stress changes on fault permeability. They concluded a combination of seismic reservoir characterization and geomechanical forward modeling is useful to identify zones of good reservoir quality. Other advantages of geomechanical modeling included investigating the risk of wellbore collapse during underbalanced drilling, explaining the cause of failure to stimulate a well, and understanding the causes and mechanism of early water breakthrough by fault reactivation H. Jabbari, M. Ostadhassan, and S. Salehi [27] used a coupled code to study the interactions between reservoir flow and geomechanics to model the deformations and stresses in a CO2-EOR process for the extremally tight rocks of the Bakken Formation, Williston Basin, USA. That study confirmed positive results of hydraulic fracturing and well stimulation in an effective increase in the oil recovery factor. A. Elyasi, K. Goshtasbi, and H. Hashemolhosseini [28] implemented a partial coupling of a conventional reservoir and geomechanical simulators to study plastic strain development under production and CO2 injection scenarios for an oil reservoir in the Sarvak Formation, Iran. They found small changes in the permeability and porosity of the reservoir rock due to a rather insensitive stress–permeability relationship for the rock. The geomechanical analysis of the reservoir also showed no sign of plastic strain under the production and gas injection phases. M. J. Rahman, M. Fawad, and N. H. Mondol [29] investigated the hydromechanical effect on geomechanical failure due to injection-induced stress and pore pressure changes in the prospective CO2 storage site Smeaheia, offshore Norway. They found the pore volume and compressibility significantly influenced the mechanical rock failure and deformation. They also concluded that there was no caprock failure, guaranteeing that the caprock would act as an effective top seal. L. Chiaramonte and coworkers [30] developed a geomechanical model of the Teapot Dome oil field in Tensleep Formation, Wyoming, USA, to evaluate the potential for CO2 injection inducing slip on a fault and threatening seal integrity. They found no risk of the fault reactivating and providing a potential leakage pathway. They also concluded that a precise constraint of the least principal stress is needed to establish a reliable estimate of the maximum reservoir pressure required to fracture the caprock. J. White and coworkers [31] used geomechanical modeling to find the reason for the CO2 injected into the In Salah storage site migrating upward into the lower portion of the caprock. They concluded that the simplest and most likely explanation for the observations indicating the leakage is a portion of the lower caprock being hydrofractured but the overall storage complex not being compromised. P. Sharma, S. Ghosh, and A. Tandon [32] studied the behavior of a depleted oil reservoir in the main producing zone of the West Pearl Queen field in the Queen Formation, New Mexico, USA, within the CO2 EOR project. They presented a comparison of the one-way geomechanically coupled and non-coupled models and concluded the simulation results were significantly influenced by reservoir geomechanical properties. Those results were attributed to the alteration in relative permeabilities caused by changes in geomechanical properties in the coupled model.
An additional and significant concern during the operation of carbon dioxide injection into geological formations is the risk of CO2 leakage through the overburden [33,34,35,36,37,38]. To explain and predict this phenomenon as well as many others occurring during production such as subsidence, compaction, casing damage, wellbore stability, and sand production, it is required to incorporate stress changes and rock deformation when pressures and temperatures in a reservoir are changing during the course of production. The physical impact of these aspects of reservoir behavior may be significant and require geomechanical considerations to be taken into account [39].
Currently, conventional reservoir simulators are not able to reproduce the geomechanical impact on the behavior of the reservoir. Instead, separate geomechanical and flow simulations are performed subsequently, and their results are effectively coupled. Various types of coupling were proposed and tested. They include iterative coupling [40], explicit coupling [41], pseudo-coupling [42], and full coupling [43]. Most recently, other methods and techniques were developed employing various numerical approaches, namely the finite element method vs. the finite difference method [44], or addressing specific cases such as hydrofracturing of unconventional reservoirs [45,46] and CO2 sequestration in aquifers [47]. In particular, the hydromechanical behavior of natural fractures greatly impacts the productivity and injectivity of naturally fractured reservoirs. Therefore, coupled simulations are especially relevant in this type of reservoir due to the strong dependence of the fracture permeability on its aperture. For these cases, the following relationship takes place: the fluid flow affects the geomechanics of the rocks in terms of pore pressure variations occurring during the production and/or injection; the pressure variations affect the effective stress and strain distributions acting on the natural fractures and modifying their opening or closure; this, in turn, affects the fracture permeability and storability, which impact pore pressure behavior, closing the hydromechanical coupled loop. The subject of geomechanical effects in fractured reservoirs is addressed in several papers. The most numerous group of the papers refers to unconventional reservoirs in the aspect of their hydrofracturing or refracturing [48,49,50,51,52]. Another group of papers is focused on CO2 sequestration cases in aquifers [53,54]. They studied the geomechanical change in storage formation to evaluate the stability of injected CO2 and to determine induced stress conditions that can result in irreversible mechanical displacement, reactivating natural fractures, or creating additional fractures. Papers of special interest are those covering the subject of geomechanical effects in the functioning of naturally fractured reservoirs. A. Restrepo and coworkers [55] studied a problem of different completion schemes in a stress-sensitive, naturally fractured gas condensate reservoir in the Mirador Formation, Columbian Eastern Cordillera. They performed explicitly coupled geomechanical and flow simulations on conventional, compositional flow models and extended geomechanical models. Assuming a single producing well with various completion schemes (vertical, hydraulically fractured, and multilateral) and a single gas injecting well, they concluded that not accounting for the geomechanical effects would imply an overestimation in the gas and condensate production. It should be noted that the model employed in the study was not calibrated and the authors used an arbitrary relation between permeability changes and effective stress. It is not clear what the dynamics of the natural fractures are concerning the injecting well creating maximum local reservoir pressure. A. Onaisi and coworkers [56] studied stress-sensitive reservoirs using iterative, two-way coupling between geomechanical and flow simulations. They included a large North Sea chalk reservoir to be evaluated in predicting compaction drive and subsidence, a limestone reservoir from the Middle East to be evaluated for thermal and pressure gradient effects, and a high-pressure field situated in the UK sector of the North Sea for in-fill drilling problems to be solved. In all three cases, the authors drew rather qualitative conclusions for reservoir operators to take into account in the future reservoir functioning and did not present the significance of the geomechanical effects. F. Bourgeois and N. Koutsabeloulis [57] performed a full-field study of a reservoir in the North Sea using the geomechanical and flow simulators on the reservoir models to assess the integrity of the reservoir development plan. They seemed to use a one-way coupling approach and did not provide the reader with the way of permeability updating caused by geomechanical state modifications. The authors did not present any simulation results, and their conclusions are qualitative.
In this paper, we apply an explicit and complete procedure to construct geological, geomechanical, and dynamical models of a real partially depleted, naturally fractured oil and gas reservoir in the Zechstein dolomite formation. The final models are calibrated based on the data from the complete history of production including bottom-hole pressures and gas–oil ratios. The geomechanical effects are included by the effective, two-way coupling of an implicit type obtained from local correlations between transport property modifications and reservoir pressure changes via the geomechanical state. The results of the coupled simulations covering both production and CO2 injection phases are analyzed at various levels of complexity (reservoir, well, completion).
Simulation studies performed to cover reservoir fluids dynamics, geomechanical state changes, as well as their effective coupling method, were carried out with the employment of the industry-standard, commercial software package by Schlumberger. In particular, geological modeling was performed with Petrel, geomechanical simulations were performed with Visage, and reservoir flow simulations were performed with Eclipse.

Geological Setting

The study area is located on Gorzow Block, Poland, within the main dolomite basin, belonging to the Stassfurt cyclothem, which is the second out of four depositional cycles of evaporitic rocks in Zechstein and constitutes a part of the more extensive south Permian epicontinental basin [58]. The main dolomite sediments are both the source and reservoir rocks, isolated with the thick sequence of sealing evaporitic rocks, including alternating layers of anhydrite, salt rocks, and thin interbeds of shale. The main dolomite sediments and sealing from the base and top evaporitic rocks make up a closed petroleum system [59]. The biggest accumulations of hydrocarbons in the main dolomite reservoir were discovered on Gorzow Block [60], the tectonic unit neighboring the Foresudetic monocline in the south, Szczecin Through in the north, and Midpolish Through in the NE. Gorzow Block in its NW part is related to Midpolish Through—a regional elongated tectonic unit with an uplifted Permian–Mesozoic complex [61]. It consists of isolated blocks accompanied by extensive volcanic covers and a series of clastic deposits in depressions of the Lower Rotliegend age [62]. These erosional relics had a significant impact on the structural development of the overlying Zechstein–Mesozoic sediment complex. During the sedimentation in early Zechstein, thick platforms of anhydrite with a thickness reaching up to 300 m formed and constituted the base for the main dolomite deposits. The significant variability of the structure of the basement was responsible for the occurrence of the different environments during the sedimentation of the main dolomite. These were the platform, the slope of the platform, and zones of deeper sedimentation [63,64]. Within distinguished facies in the main dolomite, which originated from different sedimentation environments, variation in reservoir quality was observed. The best reservoir properties within the study area were found in the shallow barrier and platform-flat zone [65] and in deeper-situated sediments related to the slope of the platform [64,66]. The reservoir properties were affected by diagenetic processes responsible for the development of secondary porosity [65,66]. The location of the study area on the map of the distribution of paleoenvironments of main dolomite sedimentation on the tectonic sketch of Poland according to [67] and lithological profile in the zone of interest in the reference borehole, including the main dolomite reservoir rock, are presented in Figure 1.

2. Geomechanical Effects on EOR Performance

Taking into account geomechanical effects on the performance of enhanced oil recovery (EOR) processes as well as CO2 storage requires the application of geomechanical modeling coupled with fluid flow modeling to comprehensively evaluate the effectiveness of the EOR process as well as storage characteristics and safety of the geological sequestration in fractured carbonate reservoirs. The change in reservoir formation pressure due to hydrocarbon production and CO2 injection during CO2-EOR and its geological sequestration results in stress field alteration, affecting existing fracture transport properties. A significant increase in pressure can also lead to further fracture propagation, causing the risk of CO2 leakage through the reservoir overburden. To assess the CO2-EOR as well as CO2 sequestration performance in the fractured reservoir and determine the influence of the fracture on the transport properties, storage capacity, and tightness of the carbonate reservoir, we used numerical methods integrating geomechanical and reservoir fluid flow modeling. A detailed description of the method used in this study to effectively perform coupled simulations of geomechanical and reservoir fluid flow effects is presented in Section 6.

3. Geological Modeling

3.1. Structural Modeling

The developed 3D structural model of the reservoir zone, its overlying strata, and its embedding (Figure 2B) was used as a basis for the geomechanical and reservoir fluid flow simulations. The structure of the main dolomite reservoir rock was determined based on the seismic interpretation results, which were constrained with the borehole stratigraphical markers (Figure 2A). The overlying strata included the series of the Zechstein evaporite sequence as follows: basal anhydrite (A2), screening anhydrite (A2G of Stassfurt cyclothem), grey pelite (I3), main anhydrite (A3), younger halite (Na3), top anhydrite (A3G) of Leine cyclothem followed by the lower pegmatite anhydrite (A4D), the youngest halite (Na4), top anhydrite (A4G), and transitional clays (I4) of the Aller cyclothem.
The static geological model of the main dolomite Ca2 with grid horizontal resolution of 100 × 100 m and average vertical resolution of 9.20 m; minimum, maximum, and average reservoir thickness of approx. 0, 90, and 30 m, respectively; and a lateral extent of approx. 13.5 × 13.5 km was embedded with surrounding rocks to apply the boundary conditions properly. The final geometry of the geomechanical embedded model is shown in Figure 2.

3.2. Petrophysical Properties

To model petrophysical properties in the main dolomite reservoir rock, we used borehole geophysical logging data and their interpretations performed in the entire borehole profiles, calibrated with the laboratory measurements, and 3D seismic data used as secondary data in the 3D parametric modeling process. To populate the 3D grid extended model to the top surface with density and porosity, we used the well-log data and interpretation results carried out in entire profiles of eight boreholes. The analysis of porosity and density was executed individually for specific lithostratigraphic units and included the determination of variation ranges and semi-variogram modeling of evaluated parameters. For the estimation of 3D porosity and density distributions, a stochastic algorithm was used (Gaussian random function simulation). The calculation of modeled parameter distributions was repeated 20 times to receive 20 equally probable realizations. The final distribution of density and porosity was an arithmetic average of these realizations, used next in the geomechanical simulation (Figure 3A,B, respectively).
The detailed model of petrophysical properties was developed in the Ca2 main dolomite reservoir zone, which was a potential storage formation at the same time. We used well-log interpretation results calibrated with the dense dataset of laboratory measurements from eight boreholes to model petrophysical properties in the reservoir zone. To enhance model definition, seismic attributes transformed into the seismic properties revealing good correlation with interpreted porosity in the borehole profiles were applied. For calculating porosity distribution, we used the Gaussian random function simulation algorithm with an activated co-kriging option. The obtained porosity distribution is shown in Figure 3. The permeability model was based on the porosity vs. permeability relationship established from the interpretation of permeability in the borehole profiles. Developed models of porosity and permeability determining the pore space volume and the ability of fluids to flow through the reservoir rocks, respectively, provided essential input for reservoir simulations.

4. Geomechanical Modeling

Injection of gas into the reservoir rock as part of the EOR, aiming at increasing the ability of oil flow to enhance the production, followed by long-term injection of CO2 and its storage involves pressure changes in the reservoir and results in a decrease in the effective stresses [68]. The fractures present in the reservoir can be particularly sensitive to those changes, which can translate to the modification of transport properties and affect the overall performance of enhanced recovery and sequestration processes. In addition, a significant increase in pore pressure may lead to the fracture propagation enhancing permeability of the fracture zone but, on the other hand, posing a threat to the sealing properties of the caprock and potential leakage of CO2 through the overlying strata.
The initial effective stress conditions in a reservoir and the overlying rocks can be expressed with the following formula dedicated to isotropic rocks [69,70,71]:
σ h α p = ν 1 ν × σ v α p + E 1 ν 2 × ( Ɛ h + Ɛ H )
To capture the changes in the stress and strain field that can further impact the transport properties, a series of parametric models providing information about the spatial variability of petrophysical and geomechanical properties of the main dolomite reservoir zone and surrounding rocks were developed.

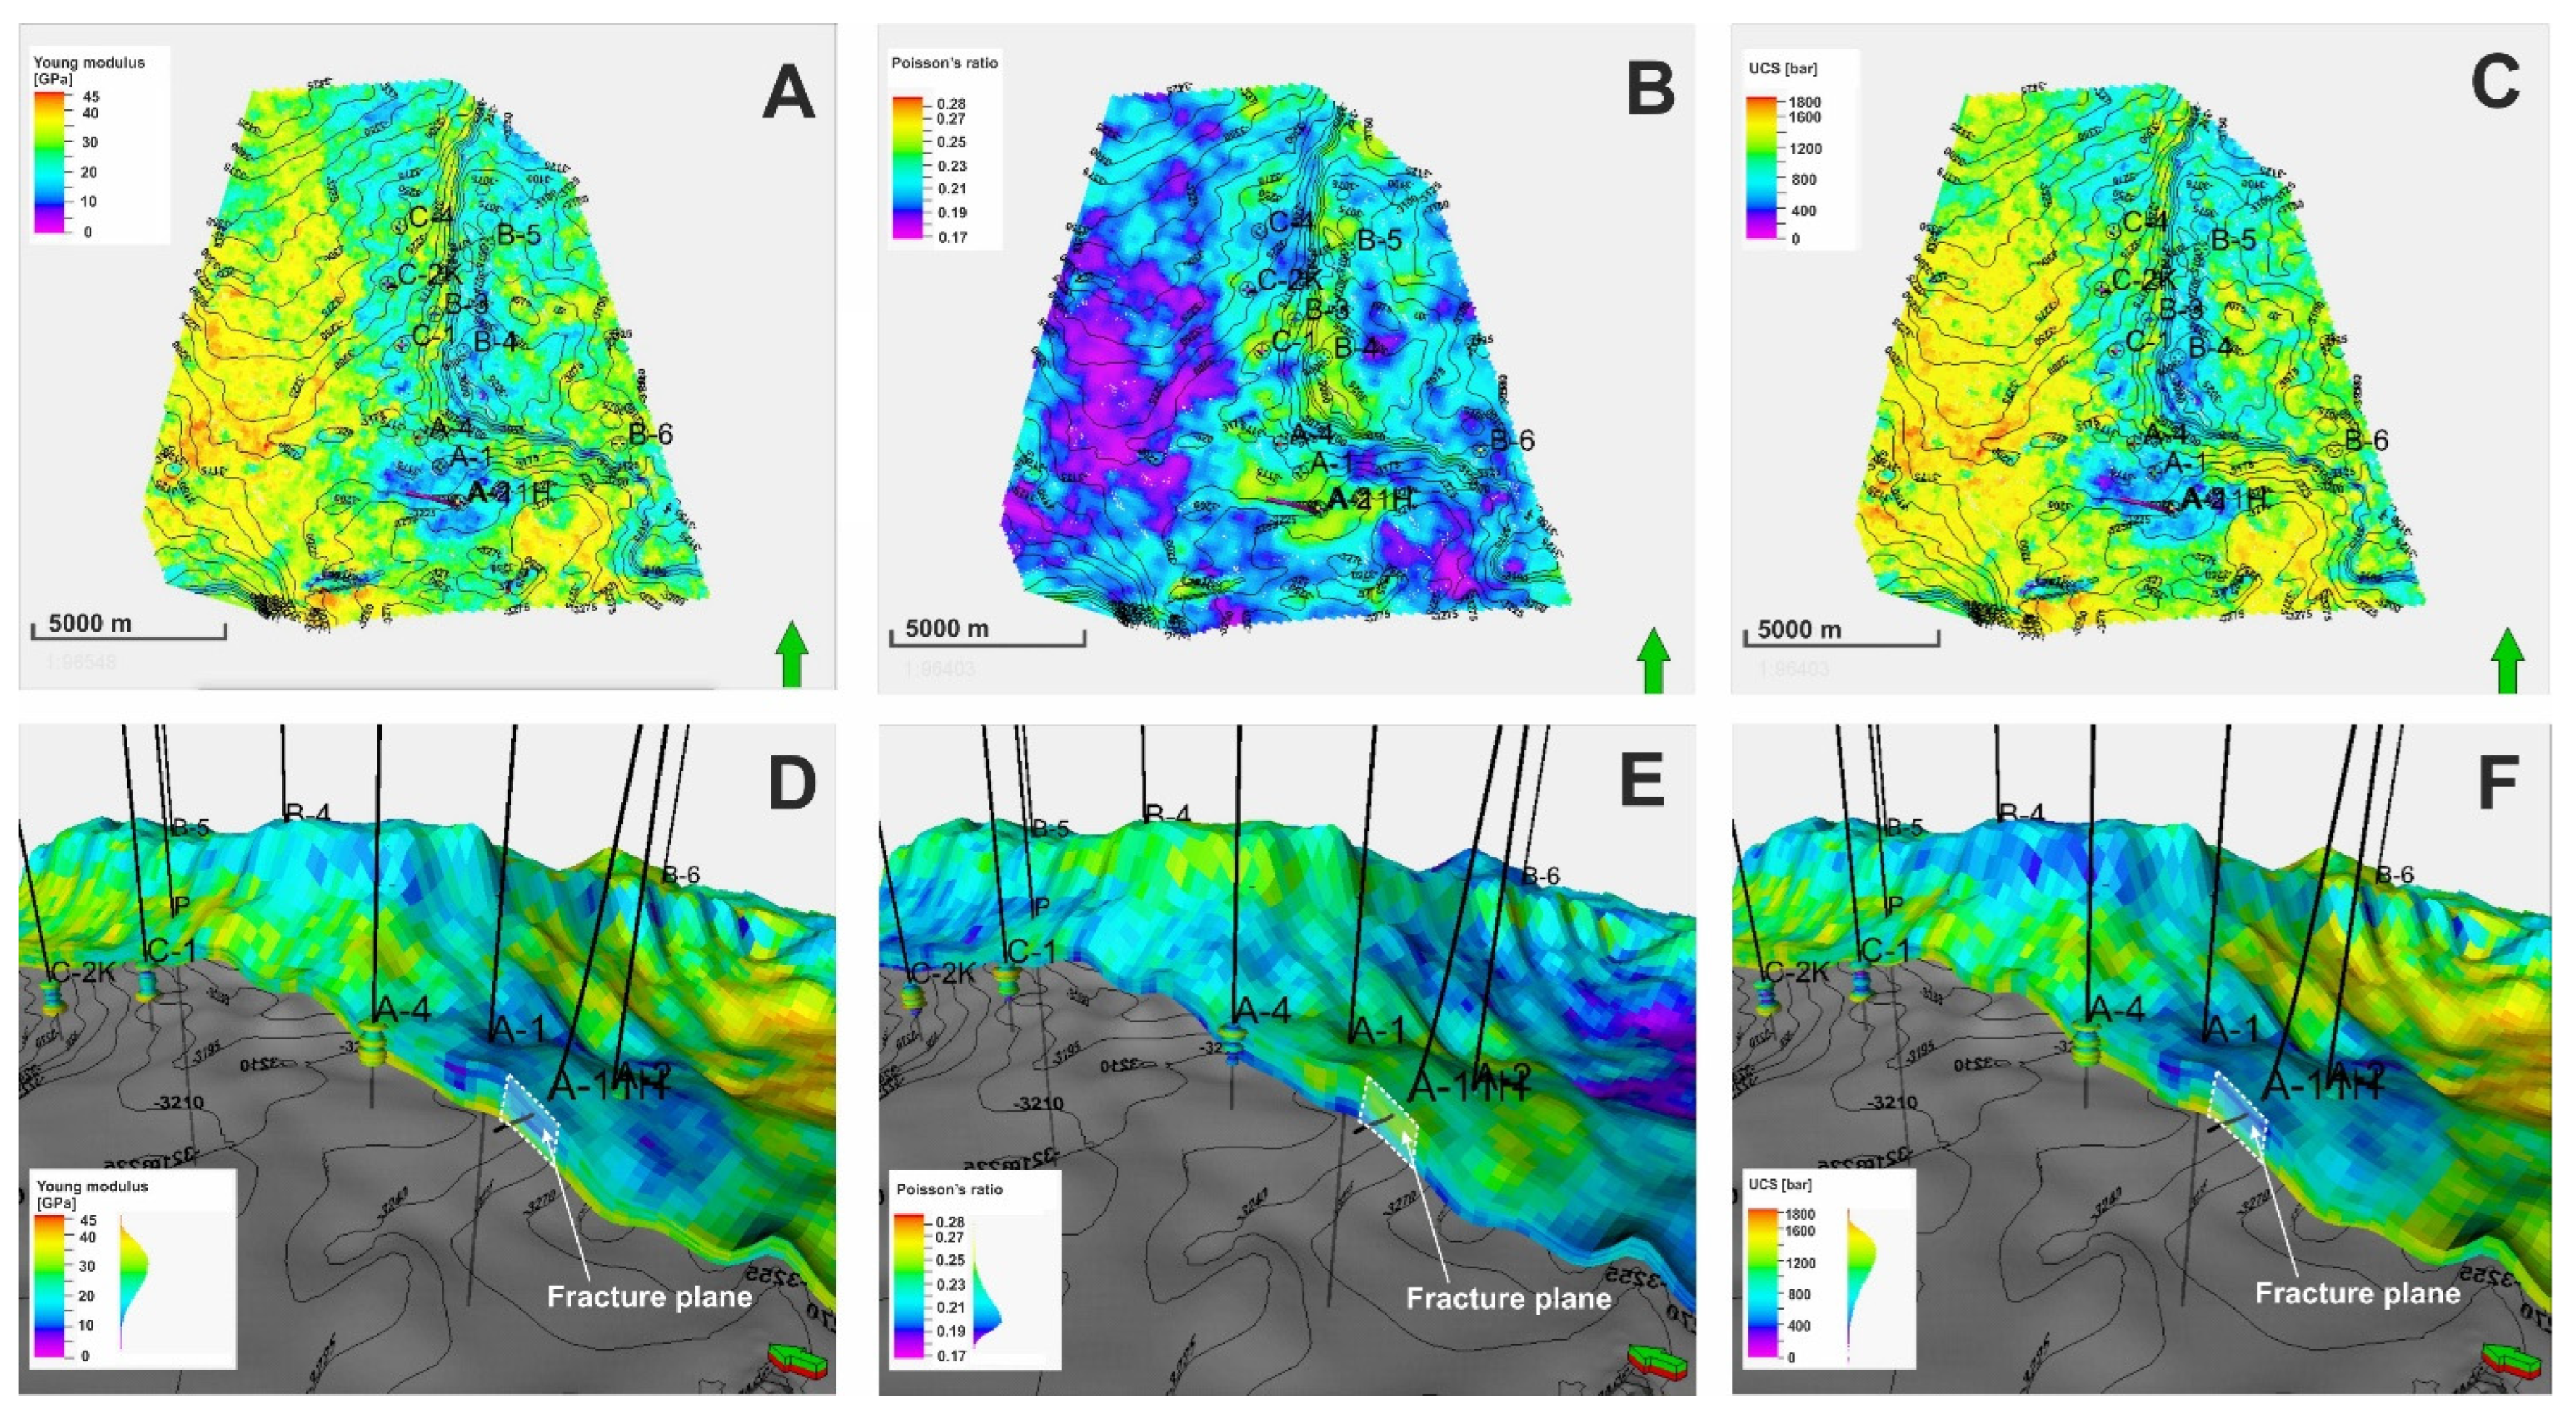
4.1. Modeling of Geomechanical Properties

Three-dimensional geomechanical models of elastic properties such as Young modulus and Poisson’s ratio, as well as strength properties including uniaxial compressive (UCS) and tensile strength (T), were constructed using borehole geophysical logging data together with the results of laboratory measurements of static geomechanical properties and 3D seismic data.
The variability in elastic properties along the borehole profile was defined by using sonic well-log data, including the velocity of compressional (vp) and shear waves (vs) and density log utilizing the following relationship [72,73]:
ν d y n = v p 2 v s 2 / 2 ( v p 2 v s 2 )
E d y n = ρ v s 2 [ 3 v p 2 4 v s 2 ) / ( v p 2 v s 2 ]
Dynamic elastic properties were then recalculated to the static equivalents using the linear regressions developed in the previous studies dedicated to the main dolomite reservoir rock [74].
For the estimation of the unconfined compressive strength curve, a relationship between compressional wave velocity and UCS of the dolomite rock developed by [74] in the study area was used. Tensile strength along the borehole profile was estimated, taking the reported dependence between UCS and tensile strength, which on average tends to be 10 times smaller than compressive strength [75,76,77].
The developed models of the elastic and strength properties are visualized for the reference borehole in the study area in Figure 1B. The 3D models of elastic and strength properties were built based on the 1D models in the borehole profiles and 3D seismic data. The modeling procedure involved upscaling the developed 1D models of elastic and strength properties by averaging the high-resolution data in the borehole profile to the vertical resolution of the 3D grid and proceeding with data analysis with the use of geostatistical tools. To analyze the data variability in the main dolomite reservoir, variogram models were used to capture the relationship between the data points in both vertical and horizontal directions. Defining the variogram parameters helped interpolate modeled parameters to reproduce realistic distributions of given parameters in the 3D grid. The examples of the 3D models of Poisson’s ratio, Young modulus, and uniaxial compressive strength are shown in Figure 4A,D, Figure 4B,E, and Figure 4C,F, respectively.
Based on the literature cited below, we assumed the values of other geomechanical properties of the overlying strata which are required for geomechanical simulations [78,79,80,81,82]. The assumed values of geomechanical properties used in geomechanical simulations are listed in Table 1.

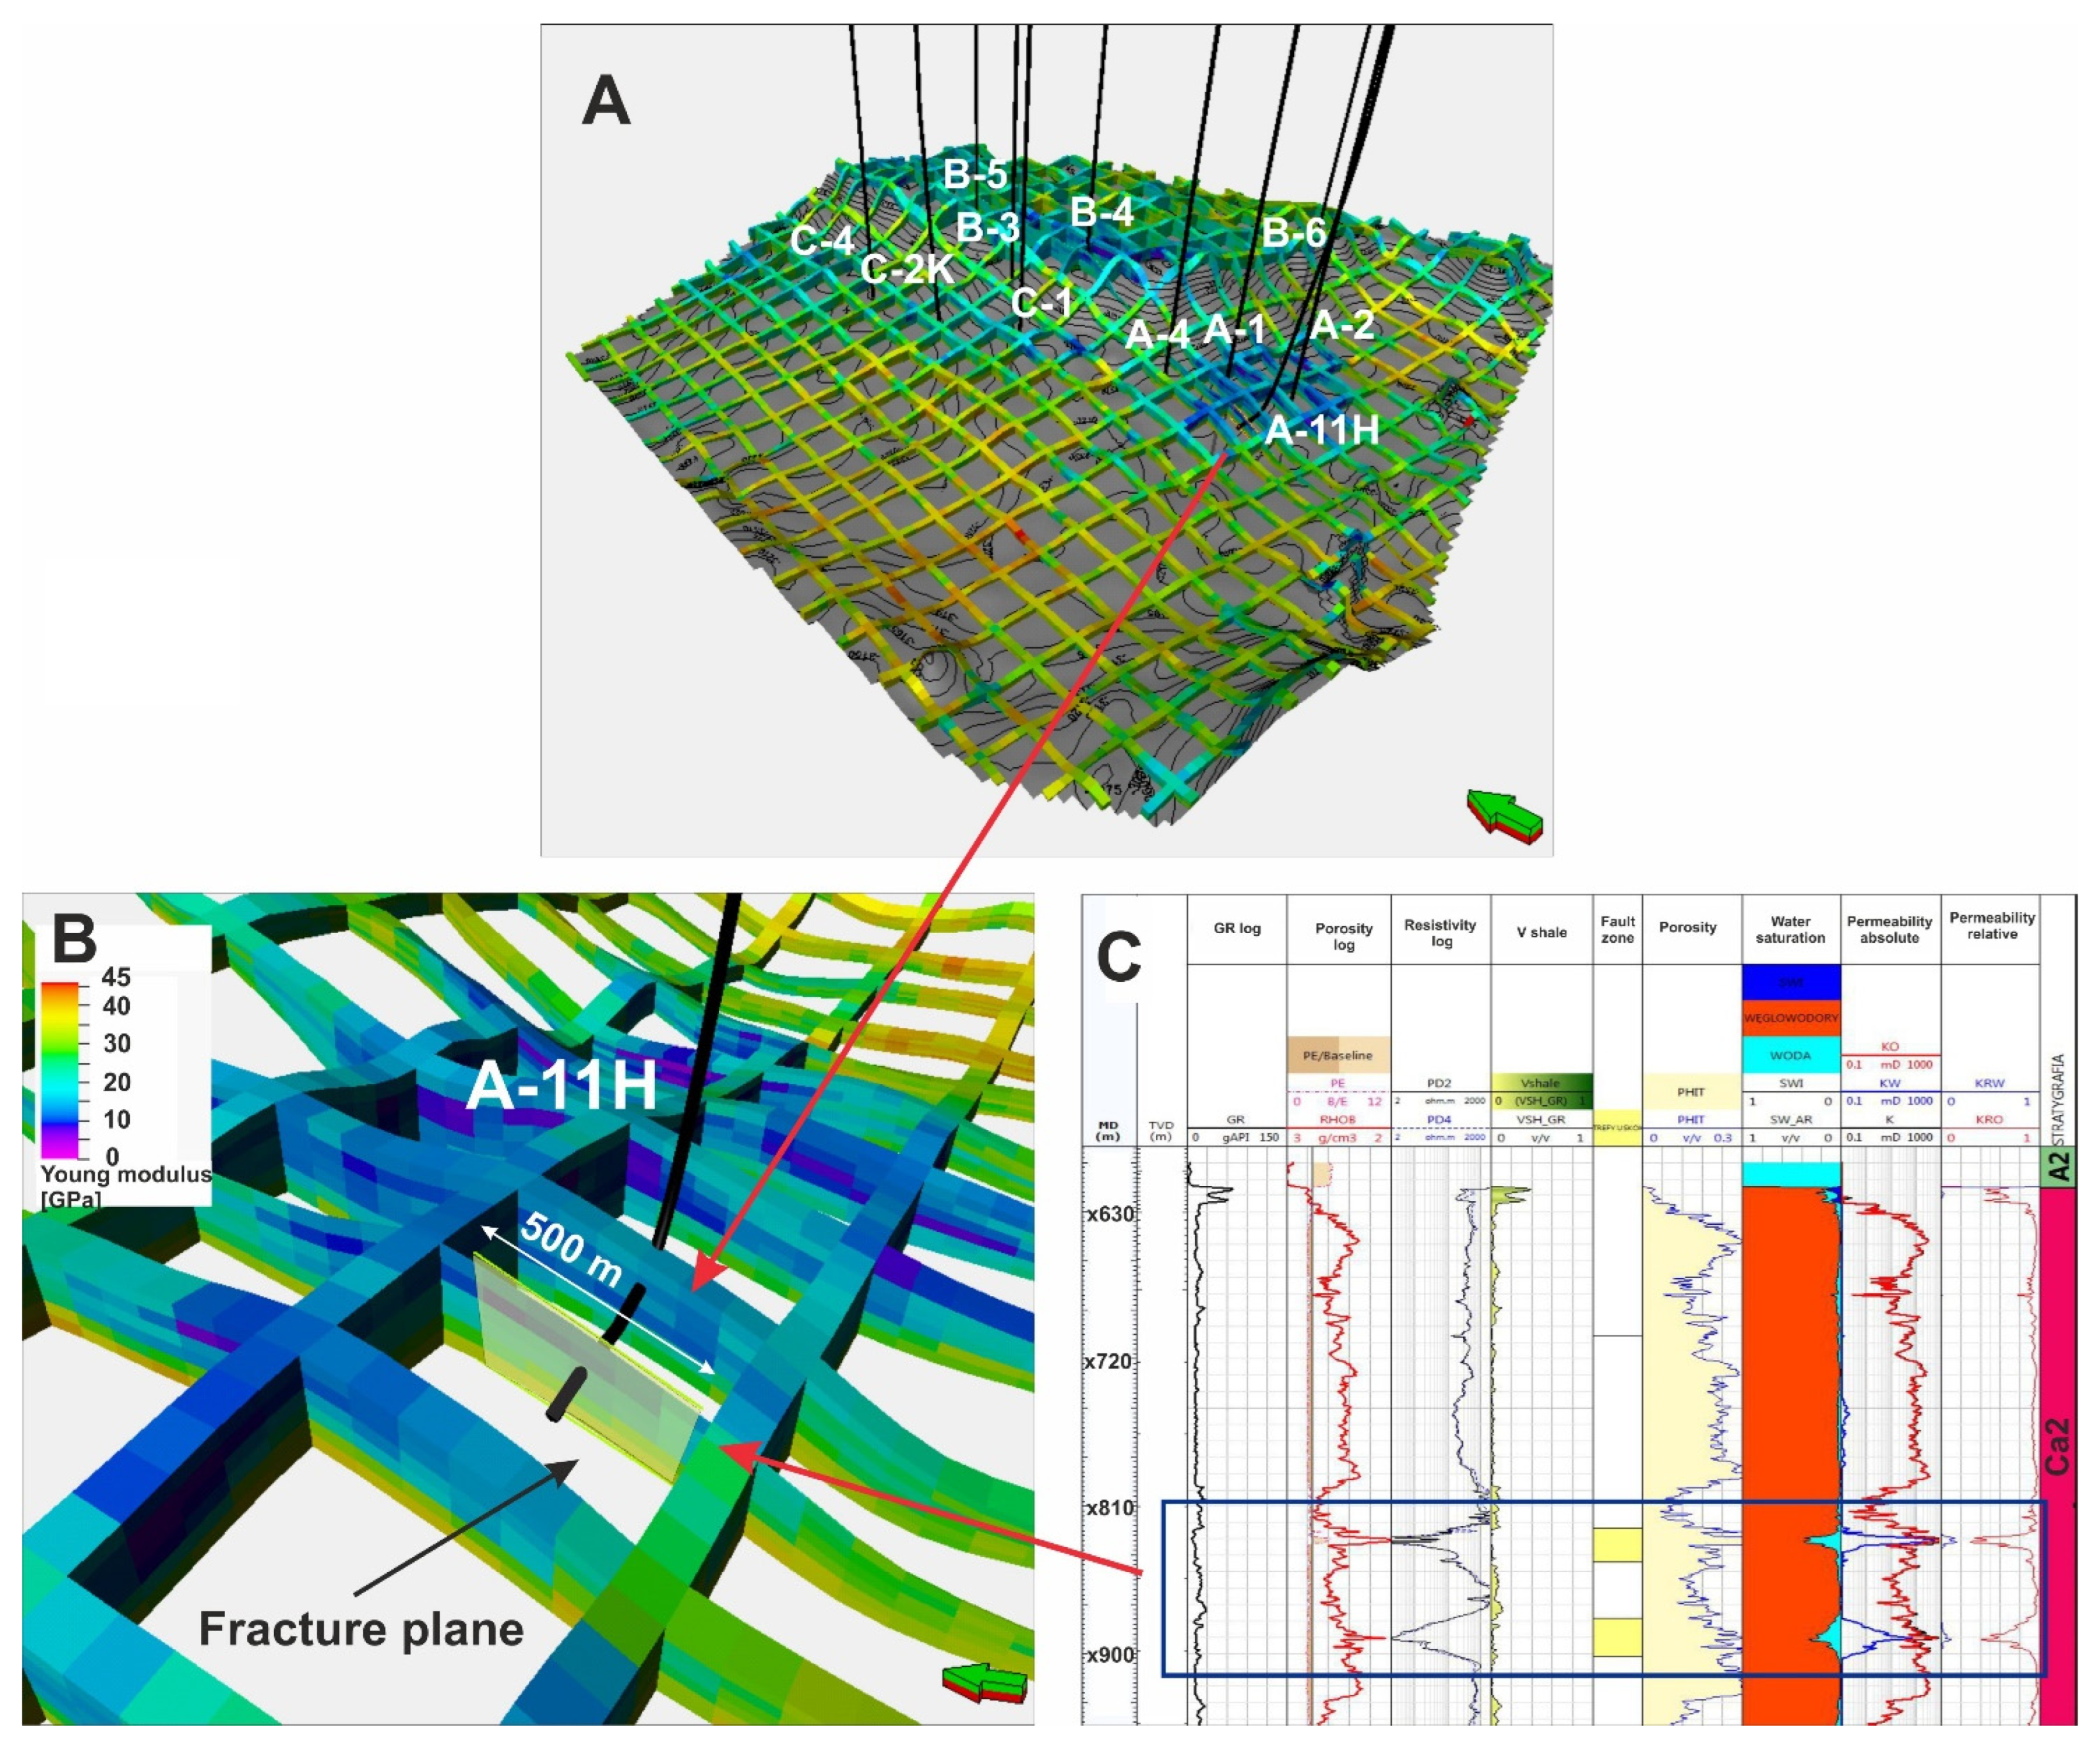
4.2. Fracture Properties

The presence of fractures reduces the strength properties of the rock, and the fractured areas become especially sensitive to deformations [83]. Therefore, the fracture zone should be considered and parametrized to fully capture the impact of stress field changes with pressure rise during the application of the EOR method and later on CO2 sequestration. The presence of the discontinuity zone and its location were deduced, taking into account the drilling report of the A-11H horizontal borehole, indicating a sudden inclination increase in the zone interpreted as a possible 10 m wide discontinuity zone (Figure 5A,C). At the same time, interpreted well logs indicate a permeability rise in this zone (Figure 5C). The implied discontinuity zone was not detected on the 3D seismic image, even though it was processed with the seismic attributes dedicated to fracture and fault detection. In the evaluated case of the main dolomite reservoir (Ca2), the fracture zone was introduced to the geomechanical model as a set of 10 discrete fracture planes with a spacing of 0.5 m and a length of 500 m (Figure 5B).
Estimated initial fracture zone dimensions and geological parameters are depicted in Table 2.
The fracture zone was parametrized using the Petrel Geomechanics materials library. The list of parameters describing the fracture zone can be found in Table 3.

4.3. Boundary Conditions

To determine the initial stress conditions, we used the load of the overlying rocks and tectonic stresses as boundary conditions. The direction and magnitude of the maximum horizontal stress were defined using literature data, where the azimuth of the σH was defined to be 6° based on the analysis of the breakout failure orientation on the borehole wall while the σh gradient was determined to be approx. 0.1707 bar/m based on minifrac tests in the nearest available borehole location [84]. In the reference borehole where the results were available, a normal stress regime was observed. The anisotropy between principal horizontal stresses was also assumed based on the findings from the same reference borehole to be 1.25 [84].

5. Dynamical Modeling

To construct a dynamic model of the analyzed structure, the geological model described in Section 3 was utilized. The dynamical model was supplemented with the following components:
-
Initial distributions of reservoir fluids (oil, gas, and water) under the hydrostatically balanced conditions were generated with the J-Leverett function [85] approach so that the fluid saturation depth profiles, as determined from geophysical measurements in all the wells, were reproduced;
-
Reservoir fluid transport properties (relative permeabilities)—a standard power-like Brooks–Corey model [86], krx = krx,max S r x n x (x = w,o,g), was adopted for the relative permeability, krx, and dependence upon the reduced fluid saturation, Srx, where S r x = S x S x , m i n S x , m a x S x , m i n . The exponent nx and endpoint parameters krx,max, Sx,min, and Sx,max were determined in the model calibration procedure, and their values are given in Table 4. Detailed information on the calibration procedure is given in Section 7.
-
A reservoir, hydrocarbon fluid thermodynamical model—a compositional, thermodynamical model of the reservoir hydrocarbon fluid (oil and gas) was constructed and calibrated independently of the reservoir model the history matching procedure, and using the measurement data obtained from the laboratory PVT studies [87], including the pressure of the saturation point, flash tests, differential liberation tests, and separator tests. The model employed the Soave–Redlich–Kwong equation of state and Lorenz–Bray–Clark viscosity model and was characterized by a complete set of EOS parameters for the effective eight-component fluid including both hydrocarbon and non-hydrocarbon ones (Table 5).

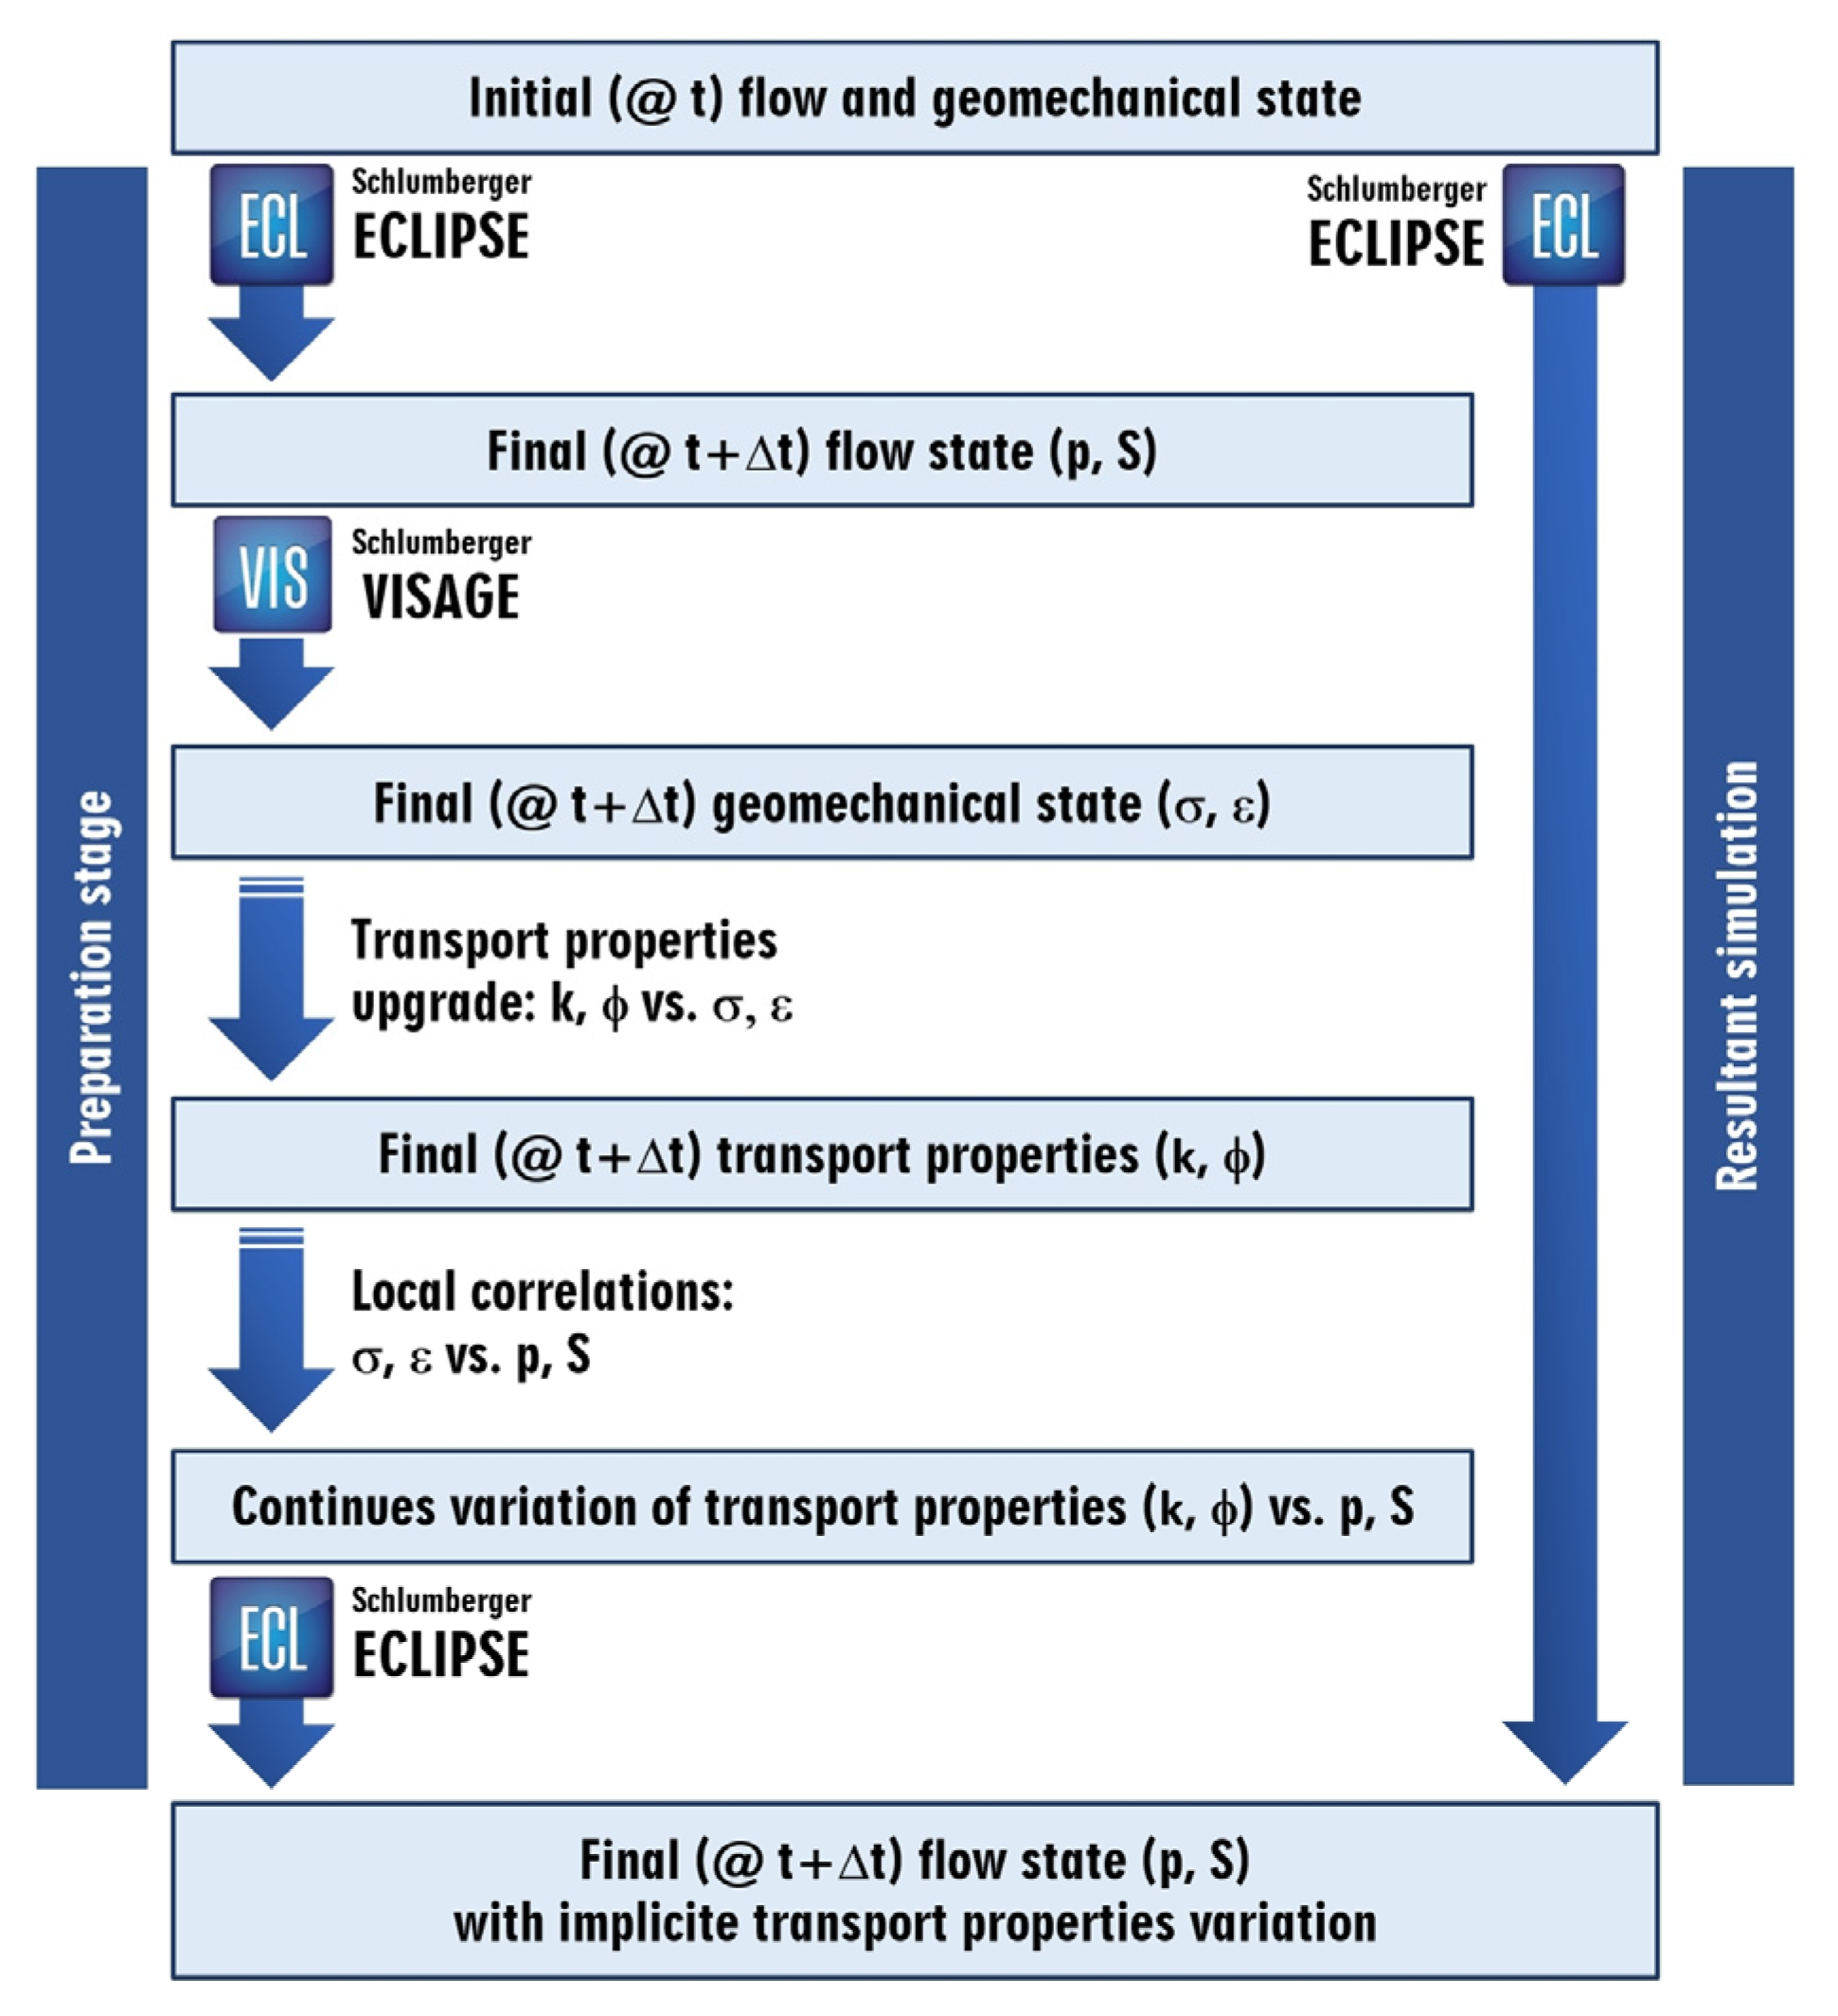
6. Two-Way Simulation Coupling

To study the influence of geomechanical effects upon the reservoir fluid flow, effective modeling of fluid flow through porous media and variations in the geomechanical state of these media at different pore pressures and reservoir fluid distributions is required [39,88,89,90,91]. In general, precise solutions to this problem require the use of numerical techniques to simultaneously solve coupled equations describing both fluid transport phenomena and geomechanical effects. This approach, called a fully coupled simulation [92,93,94], is characterized by complex numerical modeling that results in very high computational costs [95]).
An alternative approach uses partially coupled modeling [39,88,96] where an external coupling between separate numerical simulations of both key phenomena is employed. It requires multiple iterative simulations including fluid flow calculations at each time step and stress–displacement calculations at selected time steps only until a full consistency of the solutions is obtained. Another approach was proposed in [97] where local direct dependence between pore pressure variation and basic transport parameter variation via the geomechanical parameter changes is used. The schematic of this procedure is shown in Figure 6 for the time interval (t, t + Δt).
It is assumed that all basic variables (pore pressure, p; fluid saturation, S; stress tensor, σ; strain tensor, ε) describing the process evolve continuously in the time interval (t, t + Δt). This situation usually takes place when the number of active wells is fixed, their production/injection rates vary smoothly, and there are no failure events in the geomechanical status evolutions. An opposite situation takes place when, e.g., the drilling of new wells causes abrupt changes in the geomechanical status of the reservoir. Consequently, geomechanical simulations are performed at selected time moments coinciding with special events of discontinuous character. By identifying separate regions of a uniform variation in geomechanical state parameters with reservoir pressure changes during continuity intervals, specific correlations can be found for basic parameters (porosity, permeability) as direct functions of pressure in each of the spatial regions and time intervals. At first, correlations between pressure variation and geomechanical state parameters (stress tensor, σ; strain tensor, ε) are determined from the results of geomechanical simulations. Subsequently, the variation in transport properties (permeability, k; porosity, ϕ) as functions of the geomechanical parameters (e.g., volumetric strain) is applied according to adopted models (e.g., Kozeny–Carman model [98]) in matrix zones. An analogous approach is used to couple geomechanical effects and flow phenomena in fracture zones. Details of this approach are given in the sections below.

6.1. Correlation of Geomechanical State and Transport Parameters

For the reservoir matrix correlation between pore pressure changes and volumetric strain, changes were found to be relatively homogeneous. An analogous correlation between reservoir pressure variations and effective stress was established for the fracture zone of the A-11H well (Figure 7A). These results were grouped into six sets corresponding to six different groups combining two consecutive layers each, and the linear correlations of the groups were parametrized as shown in Figure 7B.

6.2. Fracture Response to Changes in Geomechanical State

The process of fracture effective permeability variations with changing pressure was applied to the fracture zone of the A-11H well during the history of reservoir operation and the forecast of CO2 injection into the main dolomite reservoir rock. To this end, a specific model correlating fracture effective apertures and geomechanical states of the fractured rock was adopted following the exponential law studied in [99].
The exponential law effectively describes the nonlinear decline in fracture aperture with increasing effective stress in the fractured rocks [100,101]. In that study, to calculate the equivalent permeability, k , a normal closure component, k n , and a shear dilation component, k s , are used in the form of empirical relationships [99] (4)–(6):
k = k n + k s ,
k n = f n 12 b 3 ,
k s = f d 12 d 3 ,
The effective aperture, b , as the function of normal effective stress, σ n , is given by [99] Equation (7):
b = b r + b m = b r + b m a x e x p α σ n ,
To calculate effective shear dilation of fractures, the relationship of the exponential dependency of stress ratio, σ r , and equivalent frictional coefficient, q , on shear dilation is utilized [99], as shown in Equations (8)–(10) below:
d = 0   f o r   σ r < q ,
d = d m a x 1 e x p γ σ r q   f o r   σ r q ,
σ r = σ m a x σ m i n
To simplify the analysis, we assumed cohesive strength to be negligible. According to Coulomb frictional criterion, the shear strength depends only on the frictional strength and is expressed as the frictional coefficient, μ, or equivalent frictional parameter, q , related to the angle of internal friction, φ, as given by [99] Equation (11):
q = ( μ 2 + 1 + μ ) 2 = 1 + s i n φ 1 s i n φ
The quantity mostly responsible for the permeability decline in the mechanism of the fracture closure is the horizontal stress, σ n , normal to the fracture plane.
In addition, parameters that determine possible fracture kinematics, namely slip tendency, Ts, and dilation tendency, Td, were calculated. A slip is likely to occur in a fracture plane when the resolved shear stress, τs, equals or exceeds the frictional resistance to sliding [61]. Therefore, the slip tendency is the ratio of maximum resolved shear stress to normal stress acting in the surface [102]. In the analyzed case, values of the slip tendency (0.15 < Ts < 0.25) are too low to meet the condition of the Beyerlee law [103] (Ts > 0.6). According to that condition, the fracture is not ideally oriented for the slip in the present stress field. The fracture normal dilation and the fluid transmission ability are directly related to the fracture aperture, which is dependent upon the effective normal stress [102]. The values of dilation tendency (0.67 < Td < 1.00) suggest that fracture reveals a considerable tendency for reactivation relating to extensional movement, increasing through the historical production phase. During the CO2-EOR phase, the fracture seems almost ideally oriented for reactivation in tensile or hybrid failure mode. Finally, during the pressure build-up of the CO2 sequestration period, the fracture tends to reverse back to the tensile failure mode, as shown below in Figure 8.
Nevertheless, after many geomechanical simulations were performed, it was noticed that shear stress-induced dilation is a negligible phenomenon and is not able to effectively affect changes in the fracture aperture with pressure variations. Finally, the calculated stress ratios are much lower than equivalent frictional coefficients ( σ r q ). As a result, the effective normal stress will be the main factor producing changes in the fracture aperture, which, in turn, is responsible for permeability variations. Fractures will tend to reactivate in the hybrid failure mode. After that, they will continue to vary the aperture rather than undergo tractional displacement, for pore pressures under initial reservoir pressure. When CO2 injection into a formation over initial reservoir pressure but below fracturing pressure is performed, fractures are more likely to experience tensile failure (Figure 9).
The above model of fracture dynamics was applied in the reservoir model calibrations and simulation forecasts as presented in the following sections. An example of explicate evolution of the fracture equivalent permeability is shown in Figure 9.

7. Model Calibration

The reservoir simulation model of the analyzed structure was calibrated based on the data obtained from the reservoir operator and covering 16 years of its operation with 11 producing wells. The calibration data consist of daily oil, gas, and water production from individual wells, bottom-hole pressures, and well test results. The calibration procedure was performed in a standard way; i.e., the oil production data were taken as the control data while the other measurements were matched with the modification of both global and local model parameters as listed below.

7.1. Calibration Results

The calibration process produced a satisfactory match of the simulation results and the historical operation data. An example of static bottom-hole pressure measurements vs. simulation results in an exemplary A-2K well is shown in Figure 10, and gas–oil ratio measurements vs. simulation results in the same well are shown in Figure 11.
The calibration process resulted in modifications of several model parameters of both global and local types. They included poorly determined quantities such as relative permeabilities, permeability anisotropies, well productivity indices, and skin-effect coefficients. In particular, parameters of the fracture zone identified at the A-11H well were estimated to produce bottom-hole pressure (BHP) consistent with the measured data as presented in Figure 12 for BHP. In addition, Figure 12 shows a small but distinct difference resulting from the consideration of geomechanical effects on the well performance. Similarly, the results of the gas–oil ratio for the cases taking into account and neglecting geomechanical effects are compared in Figure 13.
The fracture zone parameters determined by the calibration process included its geometrical sizes: its horizontal span of 500 m and vertical extension covering the total thickness of the Ca2 reservoir zone (see Figure 5B).

7.2. Model Characterization after Calibration

After the calibration process, the compositional simulation model of the analyzed structure is characterized by the following fundamental parameters:
-
Total area of the model: 234.0 km2 = 15.2 × 15.3 km;
-
Model type: single porosity and permeability;
-
Lateral dimensions of the model grid: 160 × 152 blocks;
-
Lateral sizes of model blocks: 100 × 100 m;
-
Lateral dimensions of the refined model zone: 5–25 × 100 m;
-
Layered structure: 15 layers;
-
Number of active blocks: 29,464;
-
Initial contact depth:
Oil–water contact: 3282 m b.s.l.;
Gas–oil contact: 3178 m b.s.l.;
-
Initial pressure: 430.2 bar (@ 3282 m b.s.l.);
-
Reservoir temperature (constant): 126.8 °C;
-
Total model pore volume: 50.84 million m3;
-
Average values of parameters:
Porosity: 9.6%;
Horizontal permeability: 52.52 mD;
Vertical permeability: 6.37 mD;
Average thickness of a single simulation layer: 2.46 m.

8. Simulation Results of Production/Injection Forecasts

The calibrated dynamical flow model of the analyzed structure described in the previous sections was utilized to perform simulation forecasts of reservoir behavior for various scenarios including primary production methods and enhanced oil recovery with CO2 injection, taking into account or neglecting the geomechanical effects and various widths of the fracture zone. The EOR with CO2 injection scenarios were followed by a CO2 sequestration stage. The complete set of scenarios presented and discussed in the following sections is listed in Table 6.

8.1. Technical and Operational Conditions of Production/Injection Forecasts

The oil production was initially performed by seven existing wells (A-1, A-2K, A-4, A-7H, A-11H, A-13K, and C-2K). In Scenarios 3–8, the CO2 injection was initially performed by two existing wells (C-1 and C-4). When the producing wells gradually ceased to produce due to the limiting factors listed below, they were converted into injecting ones. As a consequence, the number of producing wells was reduced to one (Scenarios 3 and 5) or zero (Scenarios 4, 6, 7, and 8) at the end of the 15-year interval of the simulated reservoir operation. Similarly, the number of injecting wells increased up to seven in all scenarios. The detailed time variations in these numbers are shown in Figure 14, Figure 15 and Figure 16 for Scenarios 3 and 4, 5 and 6, and 7 and 8, respectively. In the separate Scenarios 1 and 2 with no CO2 injection, the numbers of producing wells diminishing with time are shown in Figure 17.
The oil-producing wells were controlled by production rates estimated as annual average values of the last year’s historical data. The CO2-injecting wells were controlled by an injection rate of 500 rm3/day (where rm3 means cubic meters under reservoir conditions), the value resulting from the operator’s experience. The other production/injection constraints followed the historical restrictions accepted by the reservoir operator, including the following: minimum dynamical bottom-hole pressures, maximum permitted gas–oil ratio and water cut, minimum economic production oil rate, and maximum dynamical bottom-hole pressures at injecting wells. In addition, the reservoir production was also limited by the maximum allowable 3% of CO2 mole concentration in the total reservoir production stream. When this limit was exceeded, the oil-producing well with the largest contributions of CO2 production was reduced to obtain the CO2 concentration of the total production stream below the limit.

8.2. Results at Reservoir Level

The simulation forecast results for the reservoir performance including oil production rates, oil production totals, average reservoir pressures, and (where appropriate) CO2 injection rates together with CO2 injection totals are presented in Figure 18, Figure 19, Figure 20 and Figure 21 for Scenarios 1 and 2, 3 and 4, 5 and 6, and 7 and 8, respectively. The scenarios were grouped in pairs differing in the treatment of geomechanical effects: one neglecting these effects and the other taking them into account. In general, the simulation results at the reservoir level show that the geomechanical effects lead to a small reduction in oil production (below 7% of the total oil production) and a very small increase in CO2 injection (below 3% of the total CO2 injection). These variations result from a small contribution of the fracture zone to the total A-11H well productivity/injectivity potential and, as a consequence, to the total reservoir results.

8.3. Results at A-11H Well Level

The simulation forecast results for A-11H well including oil production rates, oil production totals, average reservoir pressures, and (where appropriate) CO2 injection rates together with CO2 injection totals are presented in Figure 22, Figure 23, Figure 24 and Figure 25 for Scenarios 1 and 2, 3 and 4, 5 and 6, and 7 and 8, respectively.
The simulation results for A-11H well provide the following evidence for the significance of the geomechanical effects in both primary and enhanced recovery processes:
-
The direct factor determining the geomechanical effects, as well as the oil production, is the reservoir pressure evolution;
-
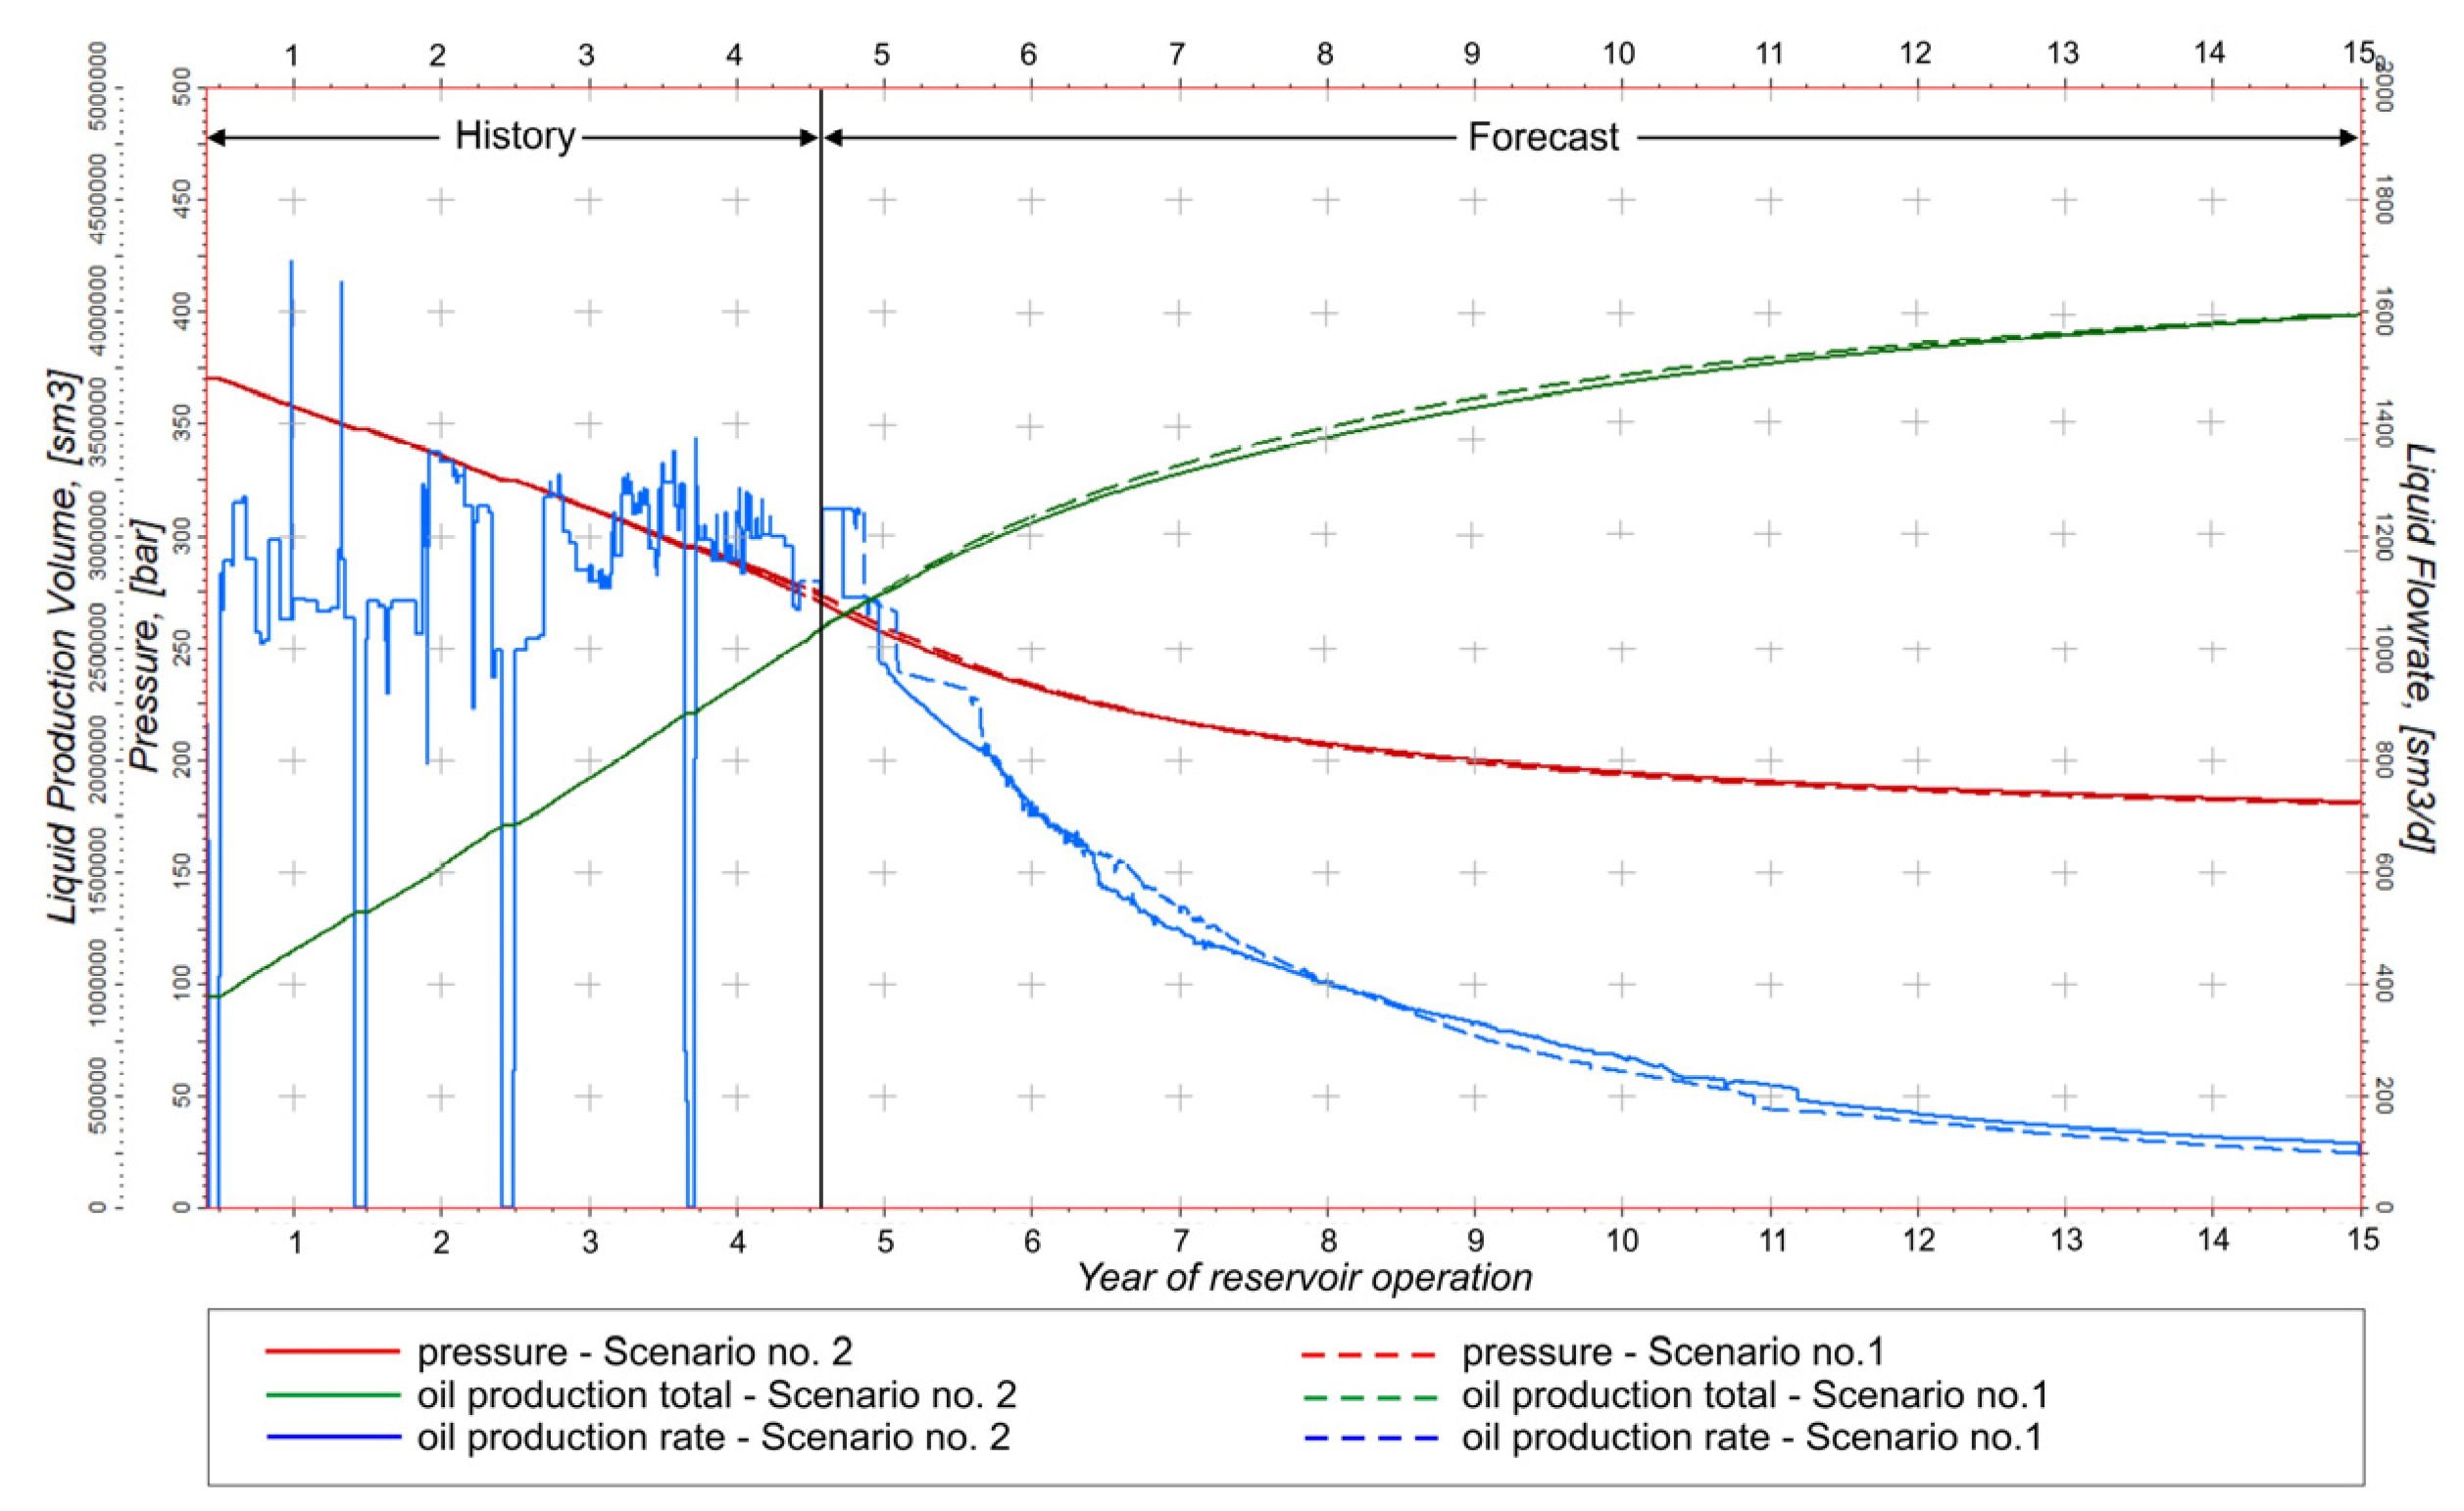
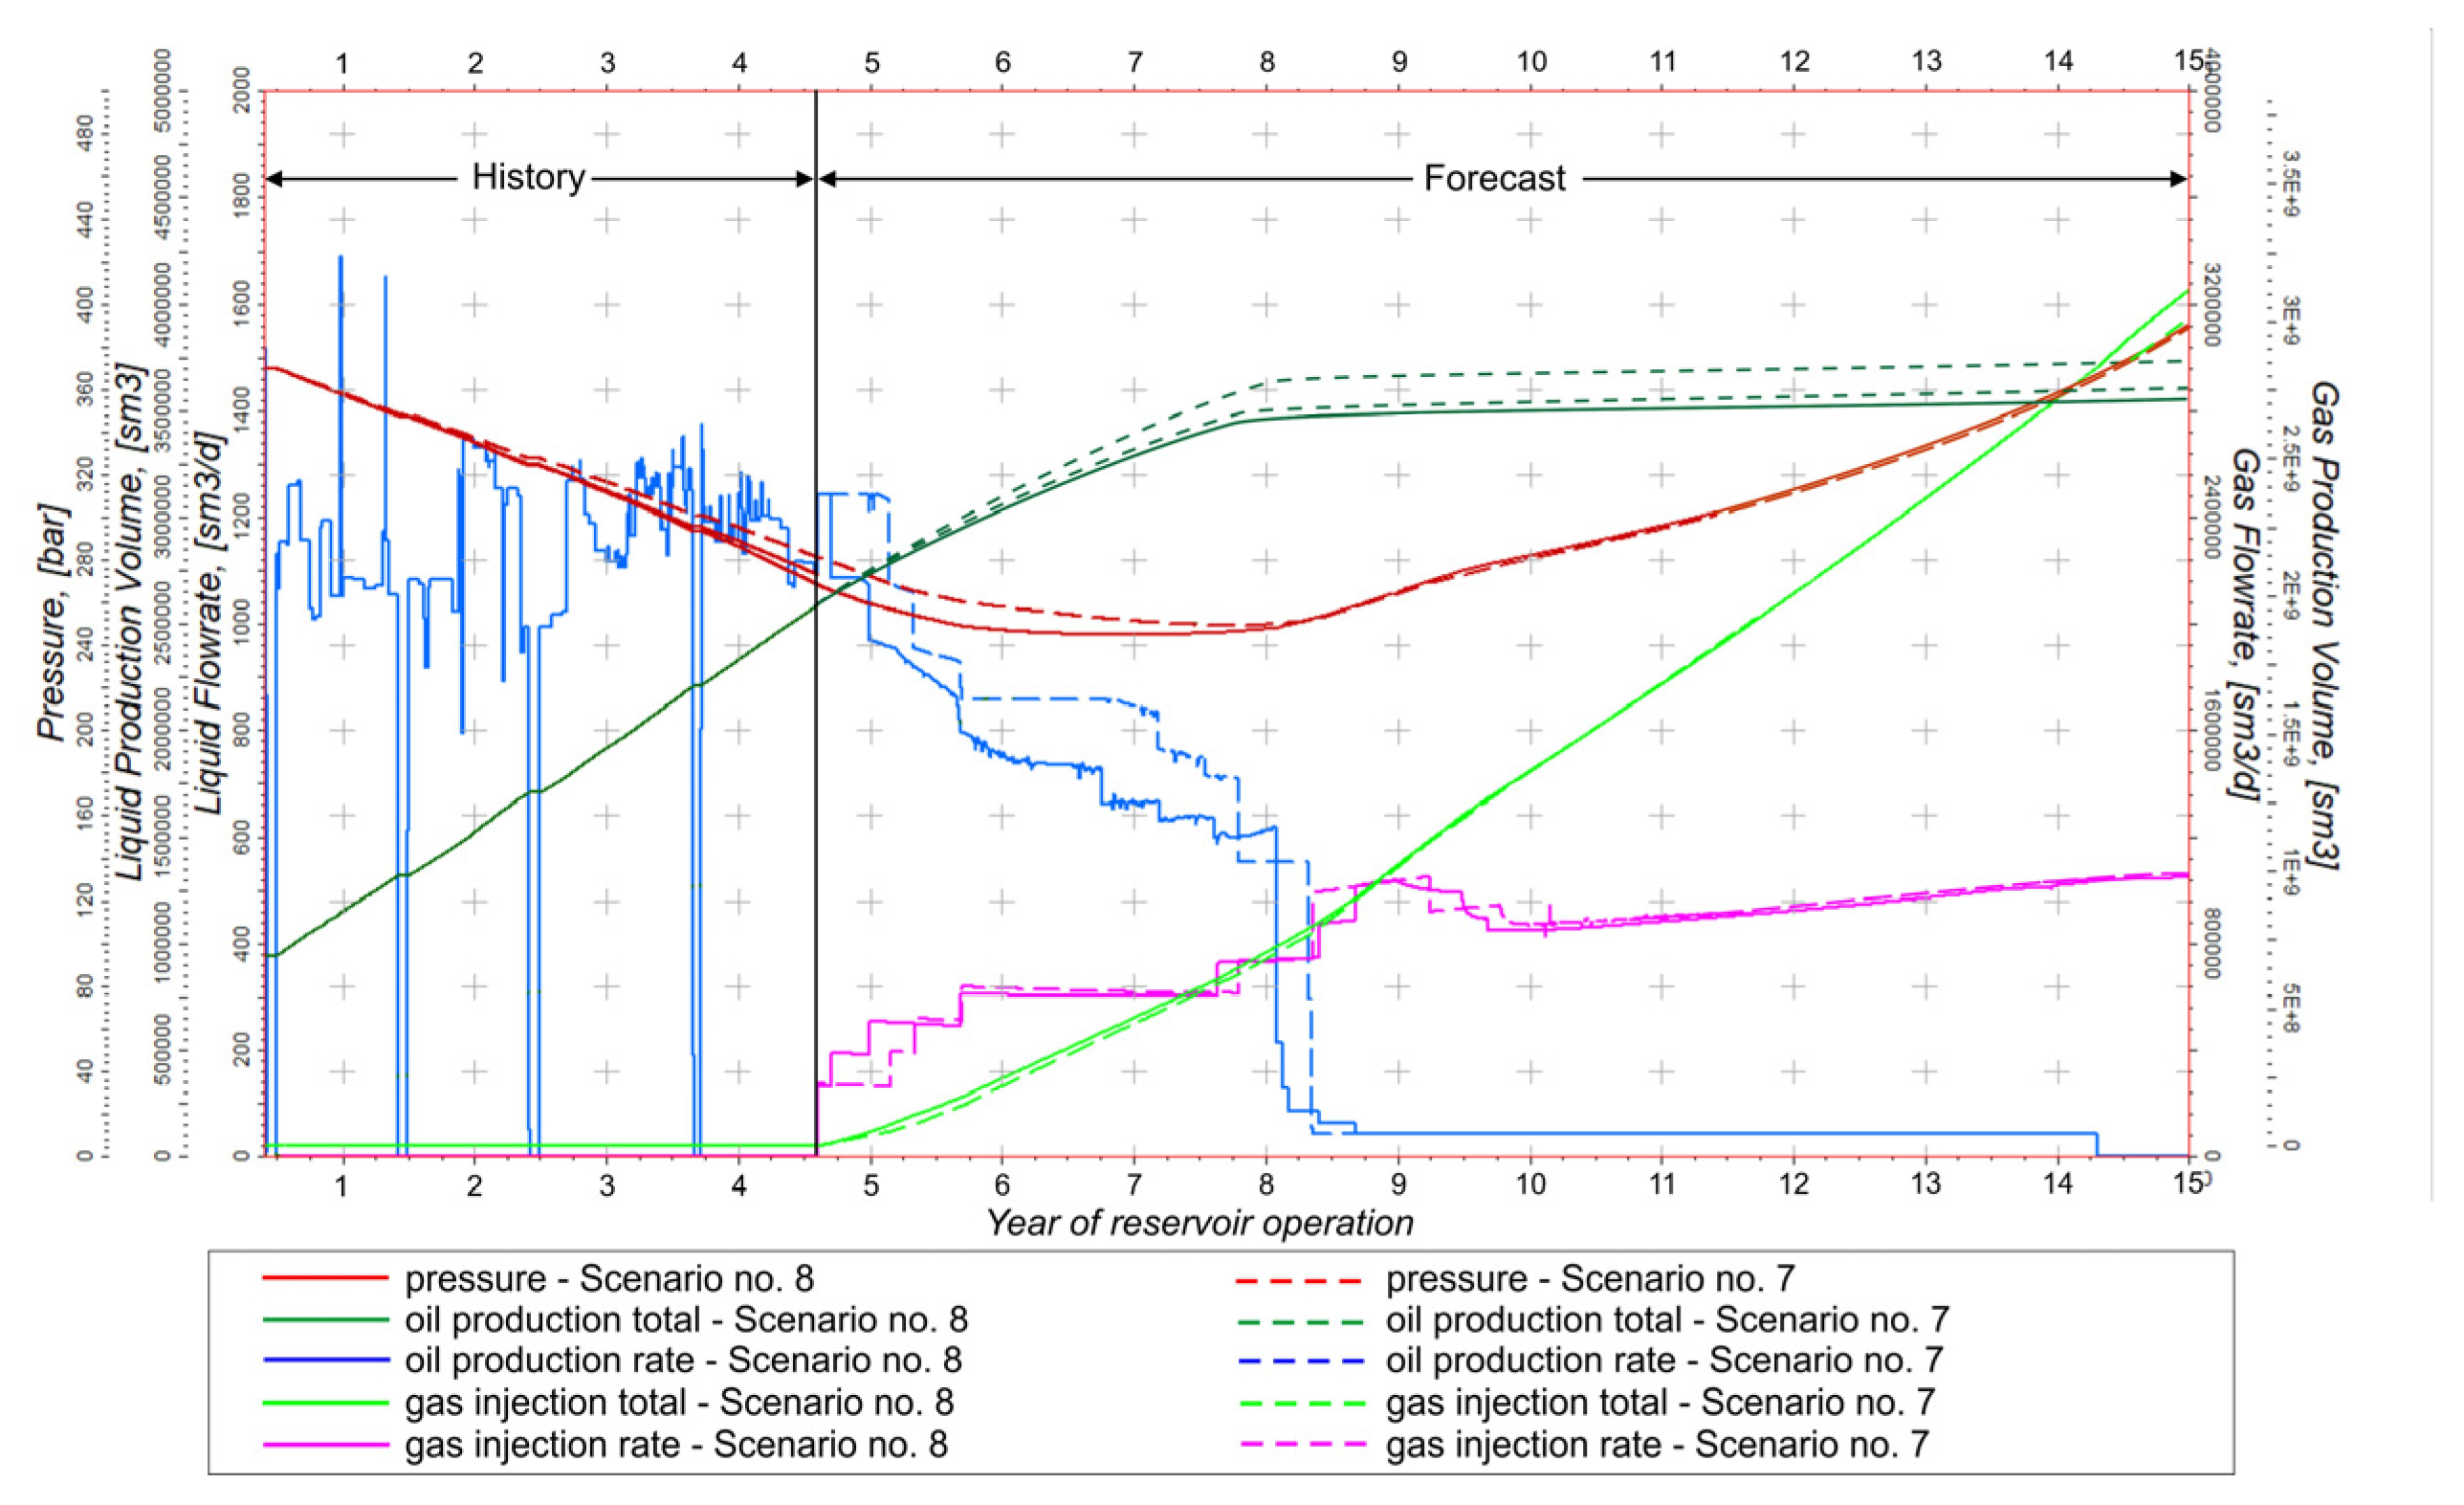
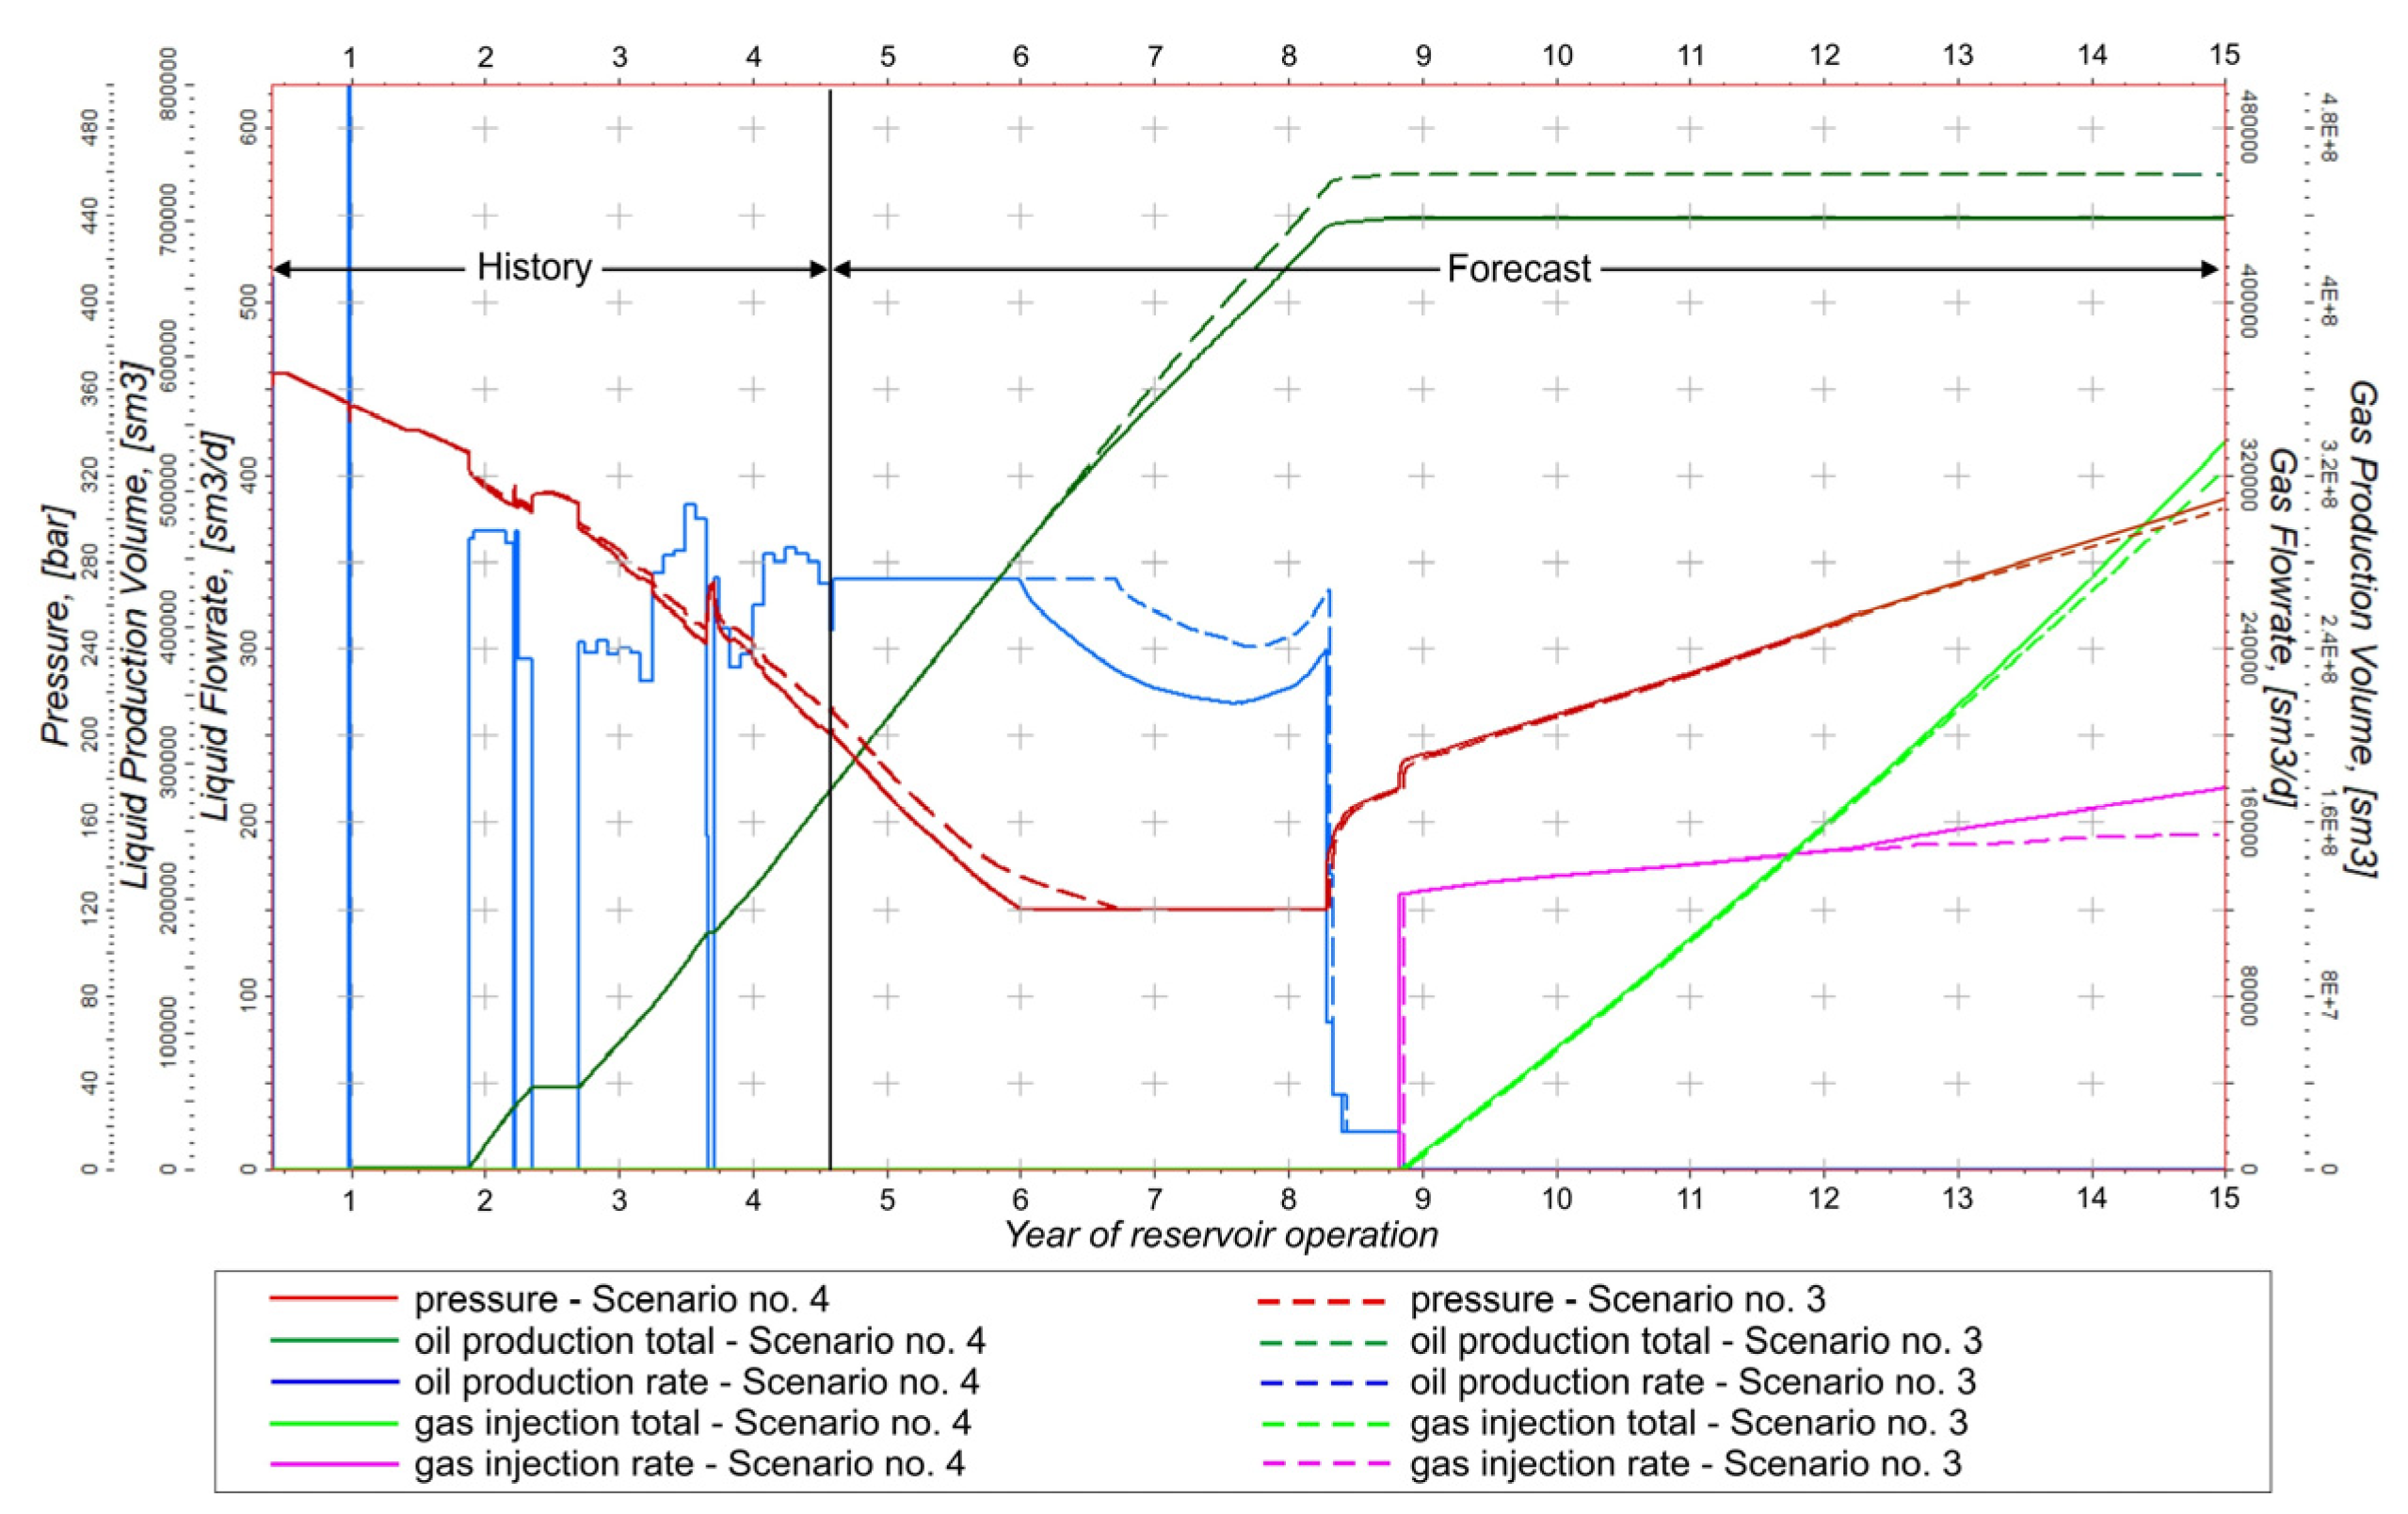
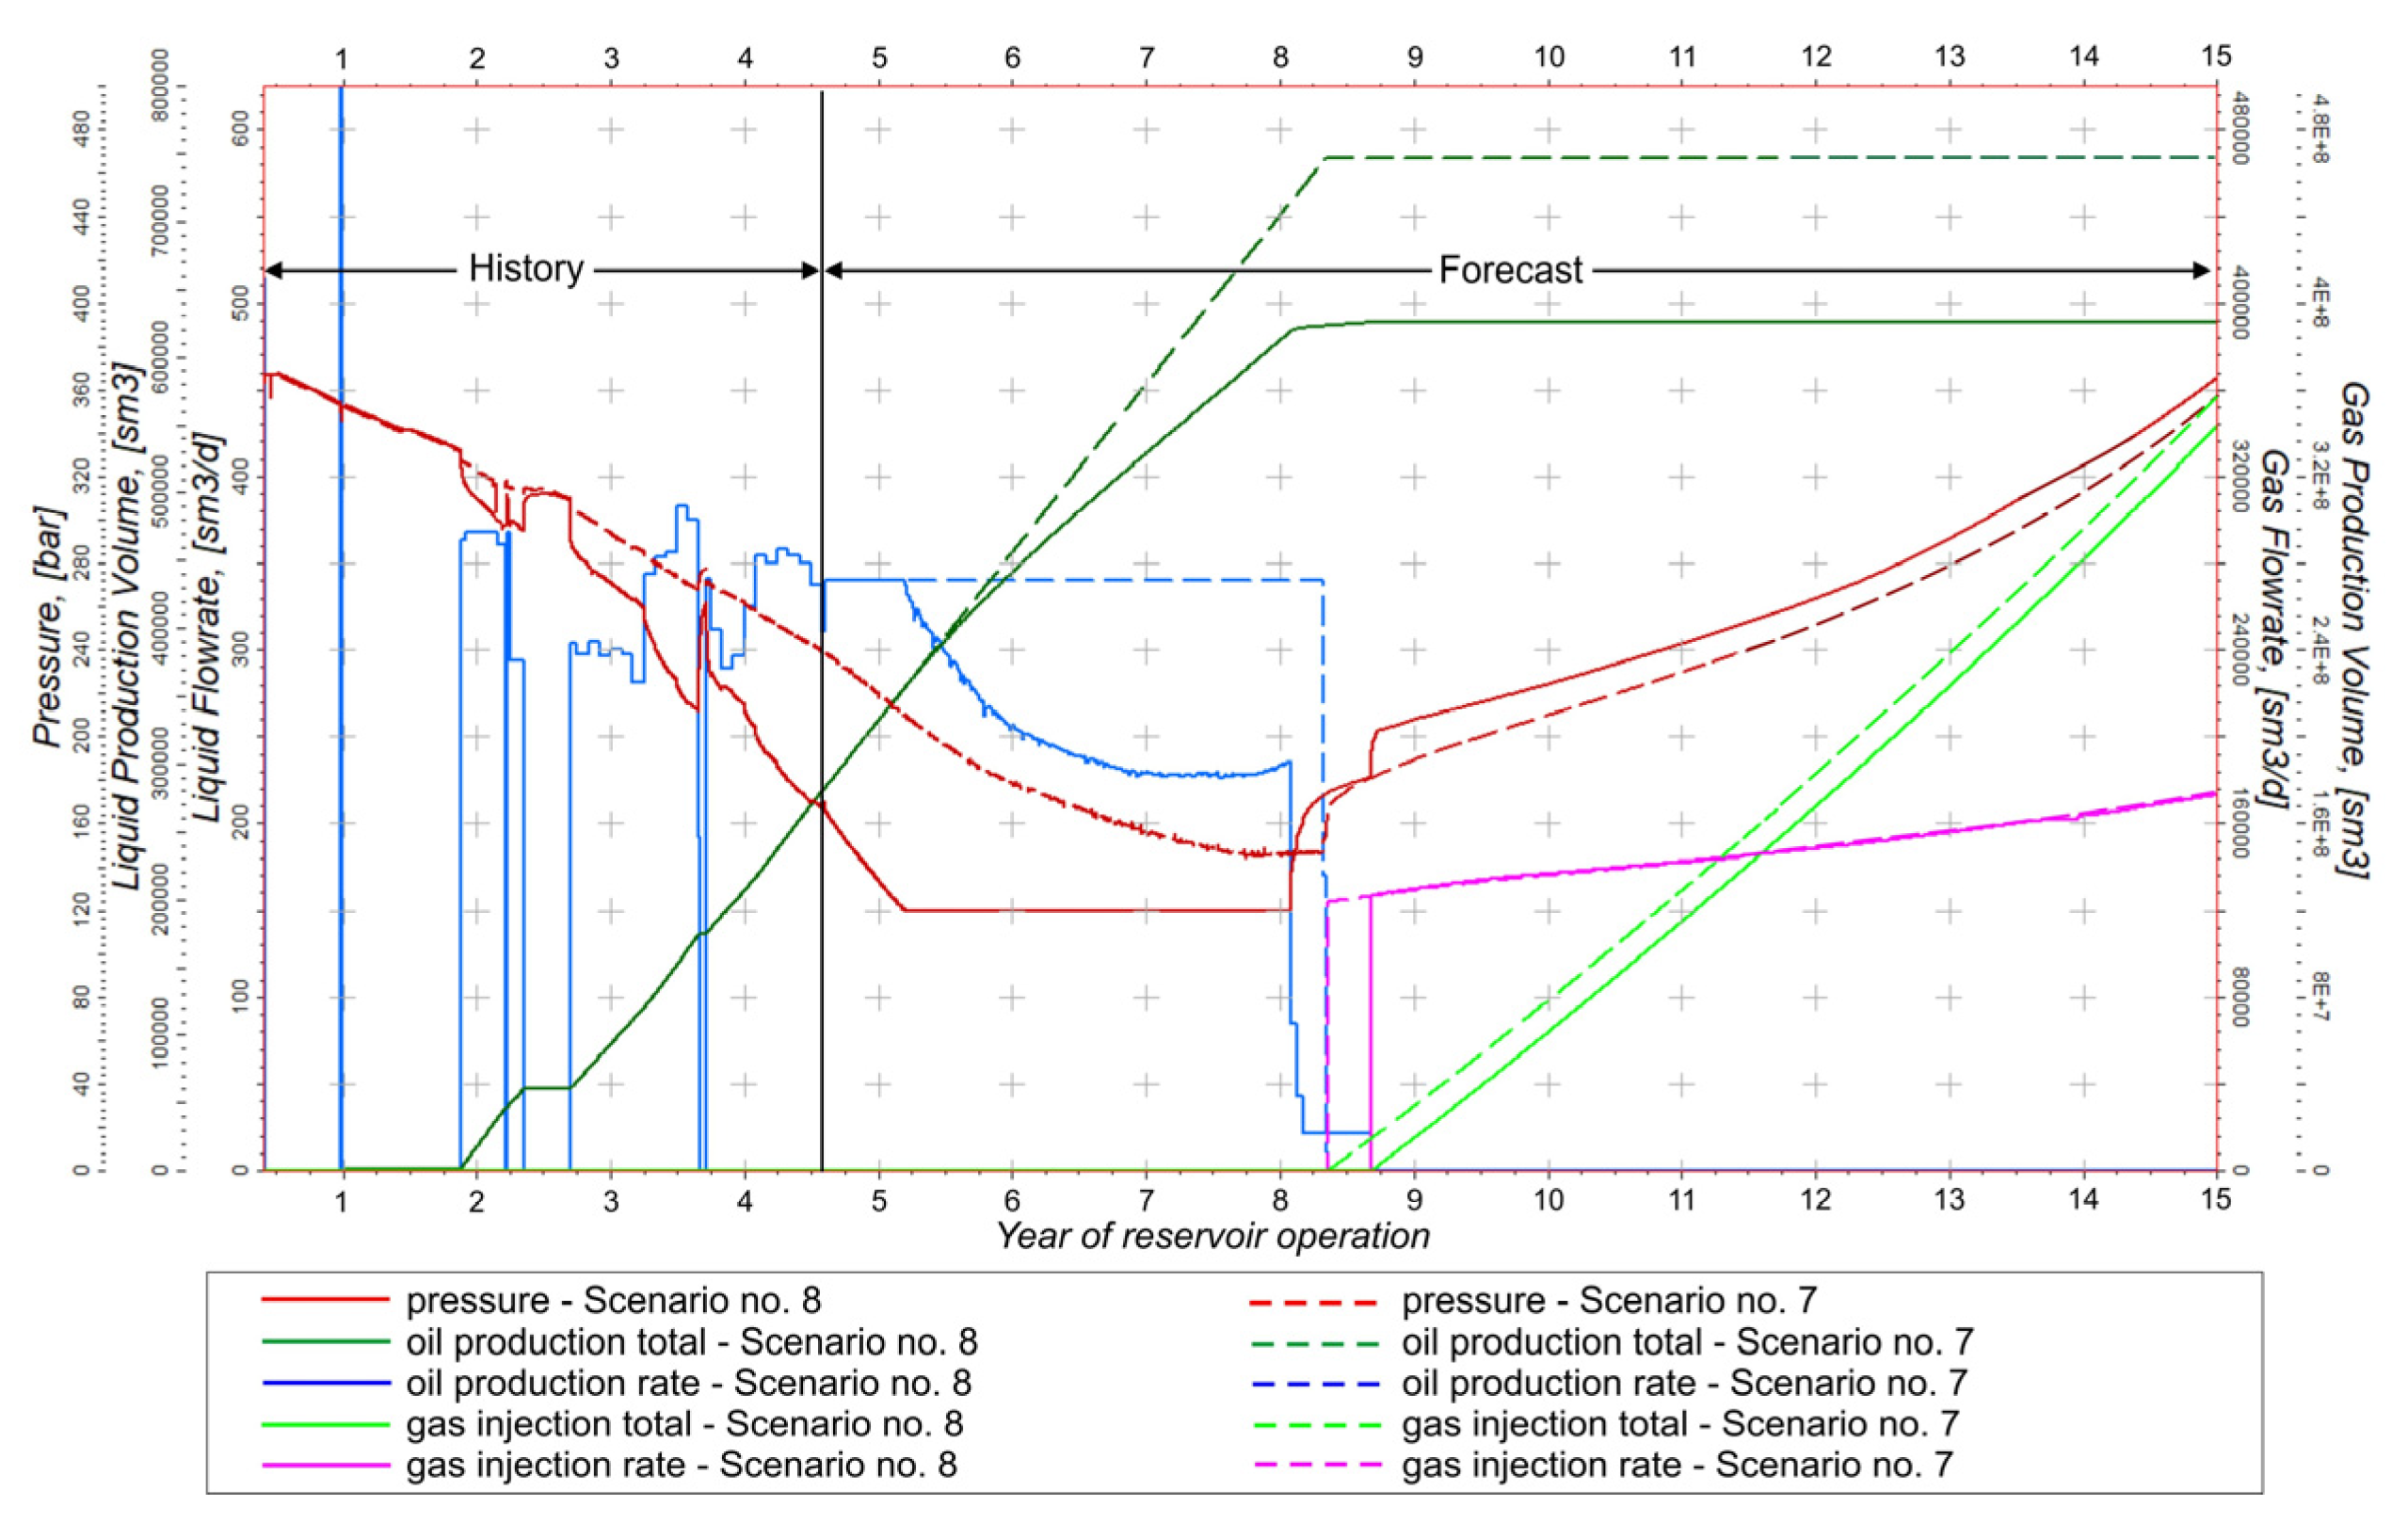
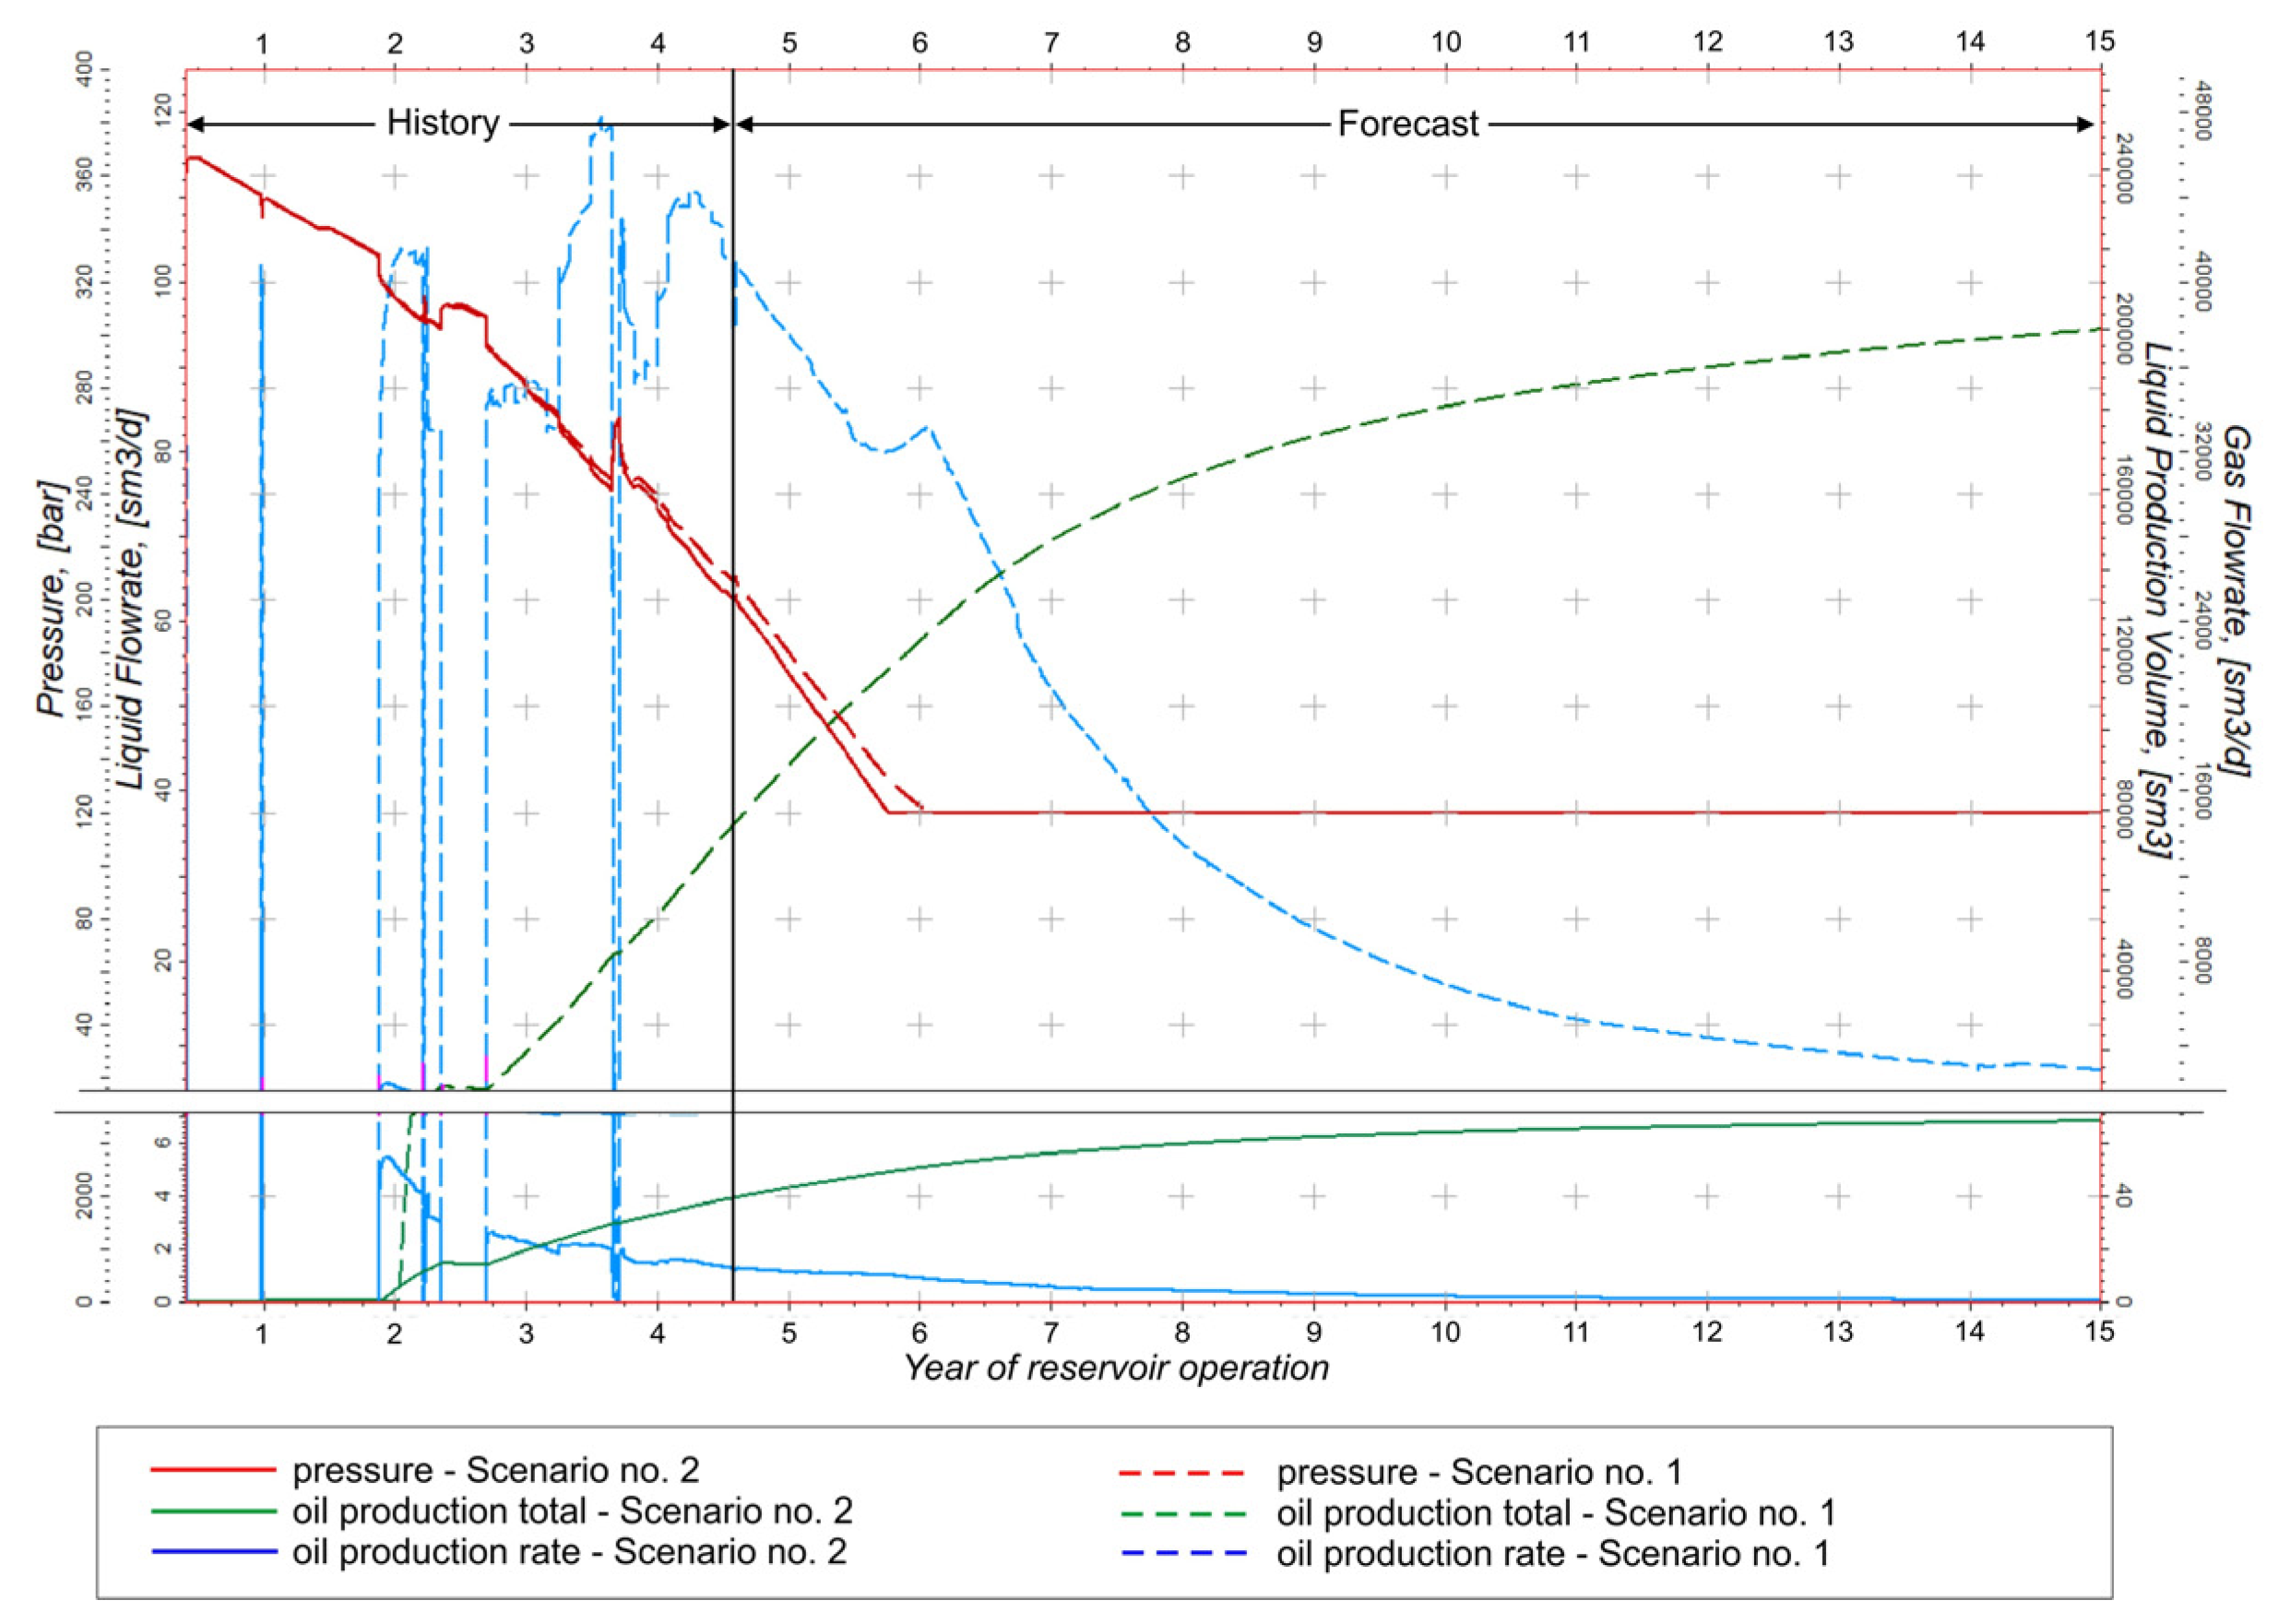
In particular, the injection of the CO2 makes the reservoir pressure decrease slower and, consequently, maintains the total oil production at a much higher level as can be seen by comparing basic scenarios (Scenario 1 and Scenario 2 of the total oil production after 81/3 years of operation equal to 0.53 and 0.62 × 10⁶ Sm3, respectively) with enhanced oil recovery scenarios (Scenario 3 and Scenario 4 of the total oil production after 81/3 years of operation equal to 0.71 and 0.77 × 10⁶ Sm3, respectively)—the solid and dashed curves in Figure 22 vs. the ones in Figure 23;
-
The decrease in the oil production in all the scenarios with the geomechanical effects included due to the fracture closure with pressure decline as can be seen by comparing scenarios with geomechanical effects taken into account (Scenario 1 and Scenario 3 of the total oil production after 81/3 years of operation equal to 0.53 and 0.71 × 10⁶ Sm3, respectively) with the scenarios with the geomechanical effects neglected (Scenario 2 and Scenario 4 of the total oil production after 81/3 years of operation equal to 0.62 and 0.77 × 10⁶ Sm3, respectively)—the solid curve vs. the dashed one in Figure 22 for the basic scenarios and the solid curve vs. the dashed one in Figure 23 for the enhanced recovery scenarios.
Another variation in the relative differences between oil production totals for scenarios with and without the geomechanical effects can be observed as a function of the fracture zone width. When CO2 injection is performed, the geomechanical effects reduce the oil production total by 5%, 14%, and 16% for the fracture zone width of 5, 18, and 65 m, respectively, as shown in Figure 23, Figure 24 and Figure 25. The larger the width, the bigger the difference, as can be explained by various contributions of the fracture zone to the well productivity. As a result, the geomechanical effects seem to be relatively stronger for scenarios with primary production than for those with CO2 injection. It is worth noting that the influence of the geomechanical effects in the fracture zone on the well productivity is partially compensated by the method applied to well control by a nominal production rate. Only when the bottom-hole pressure reaches its minimum level due to the increasing recovery is the production rate reduced to maintain the limiting pressure.

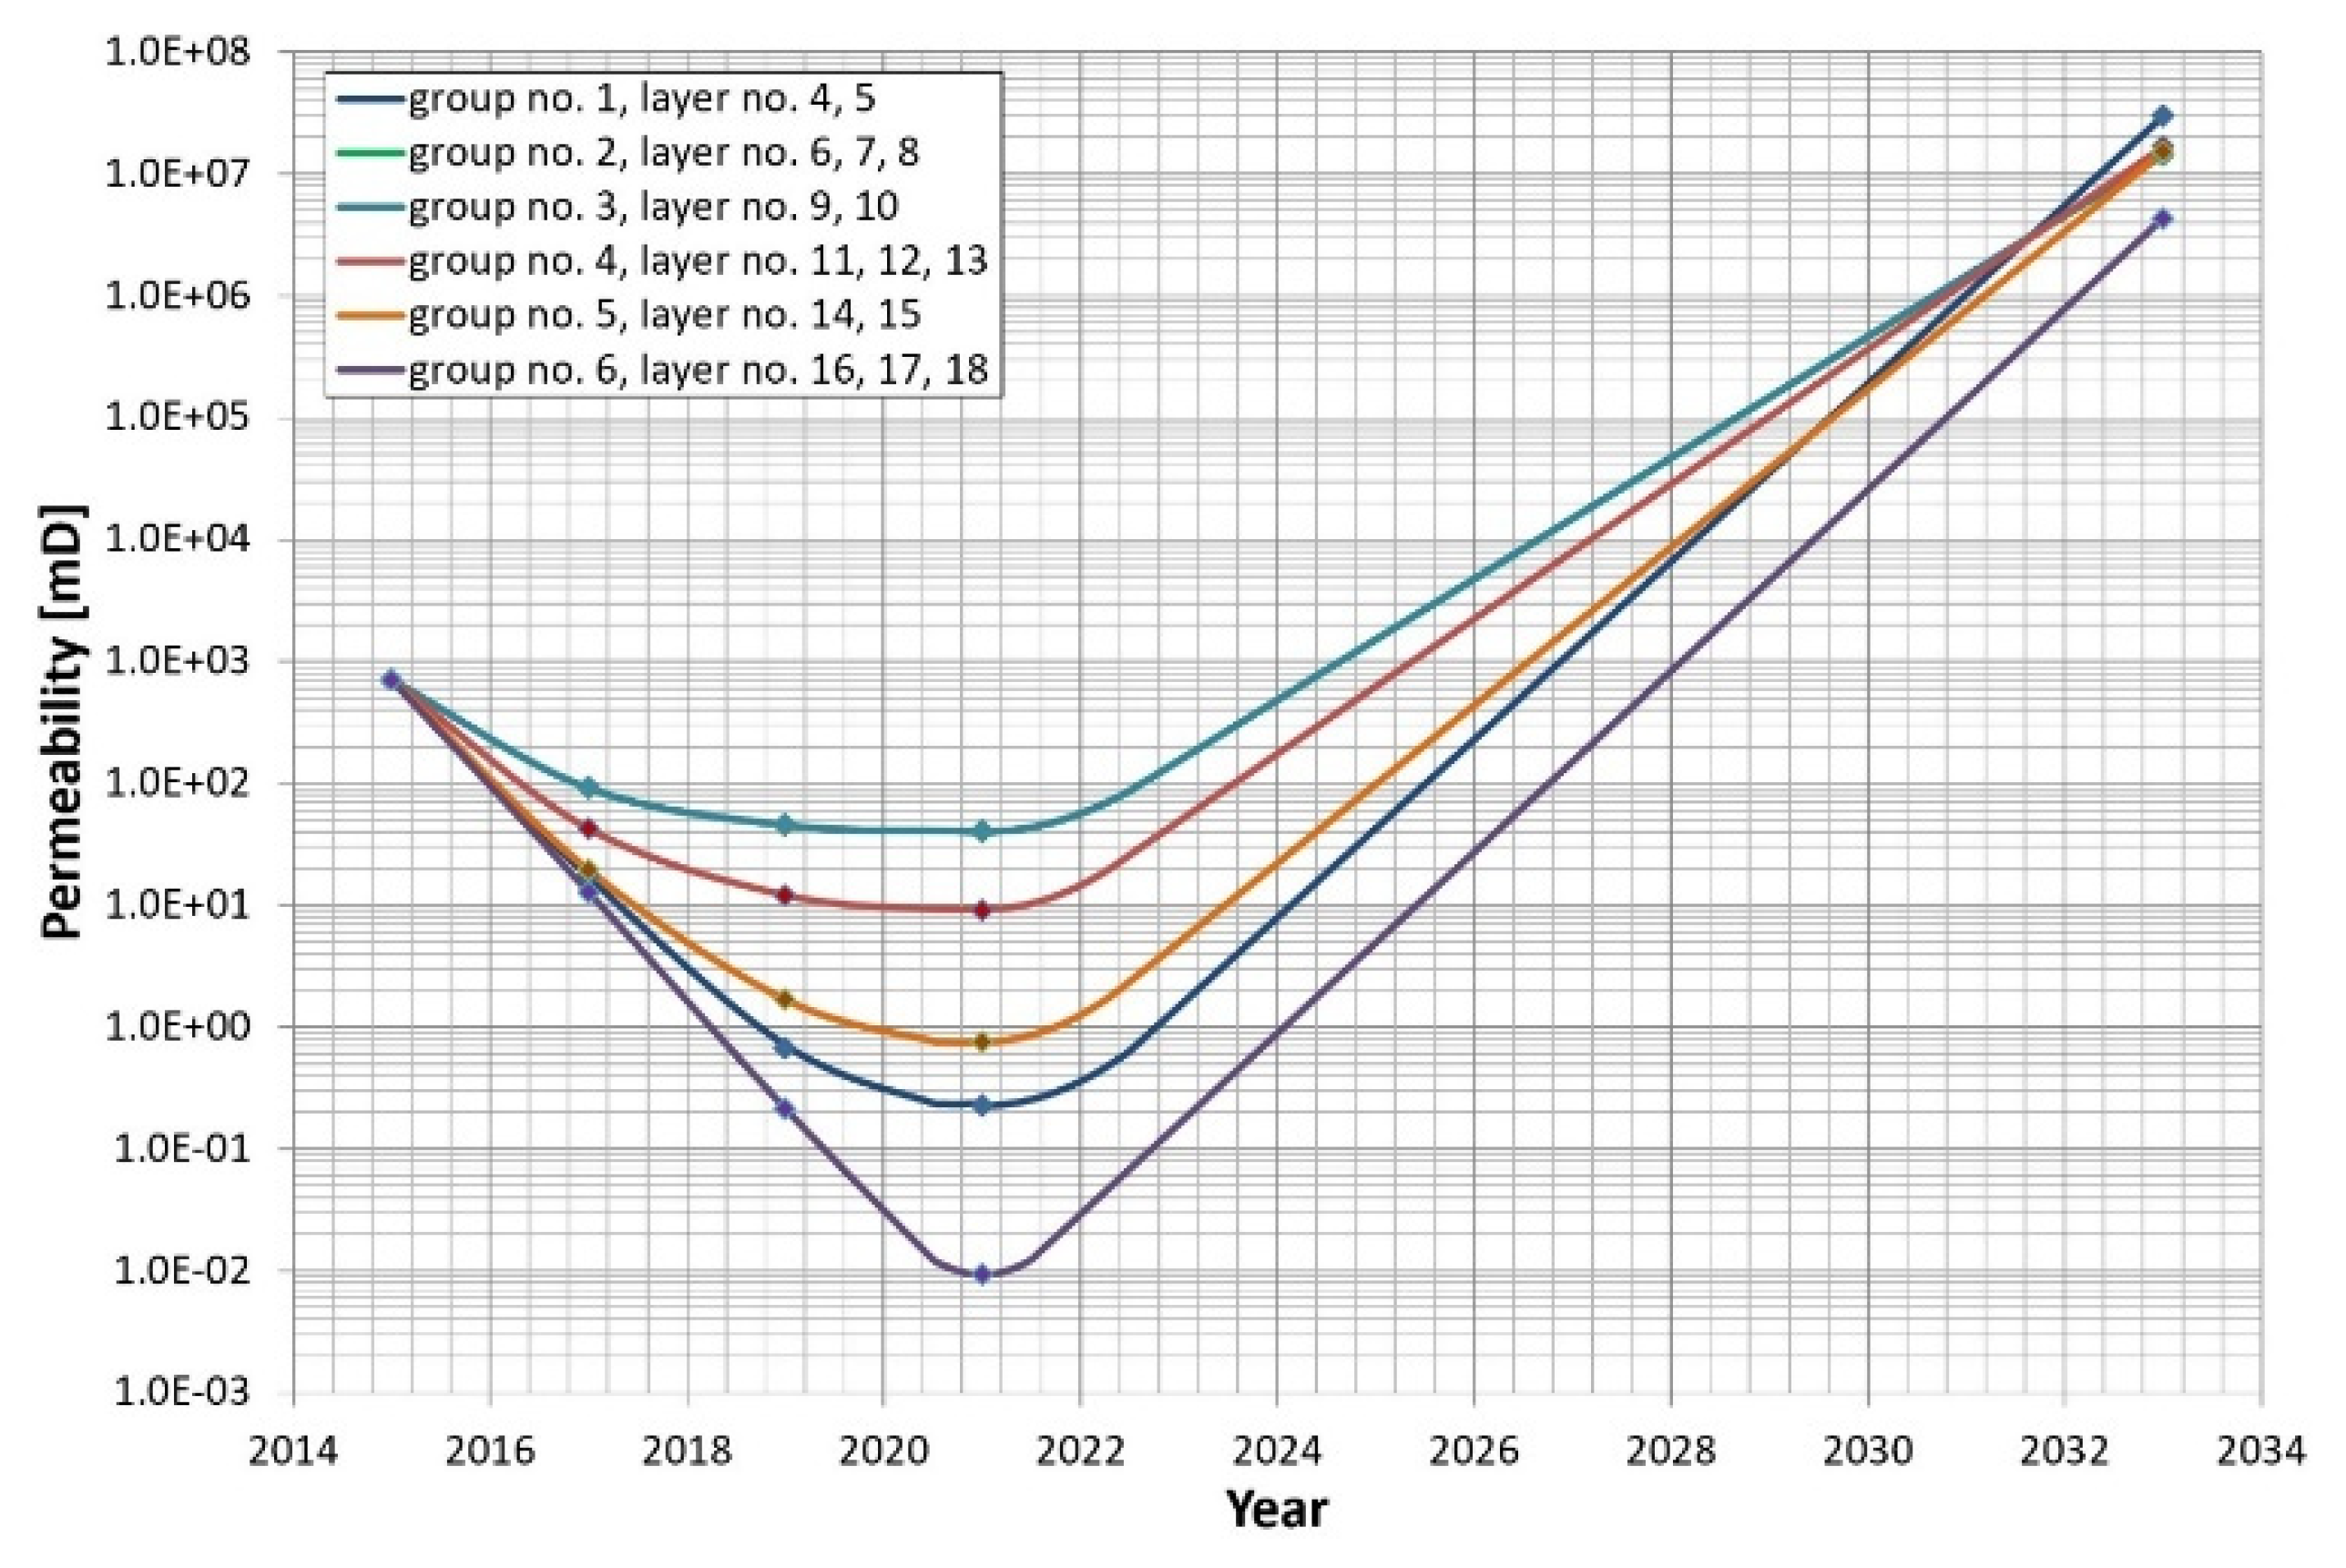
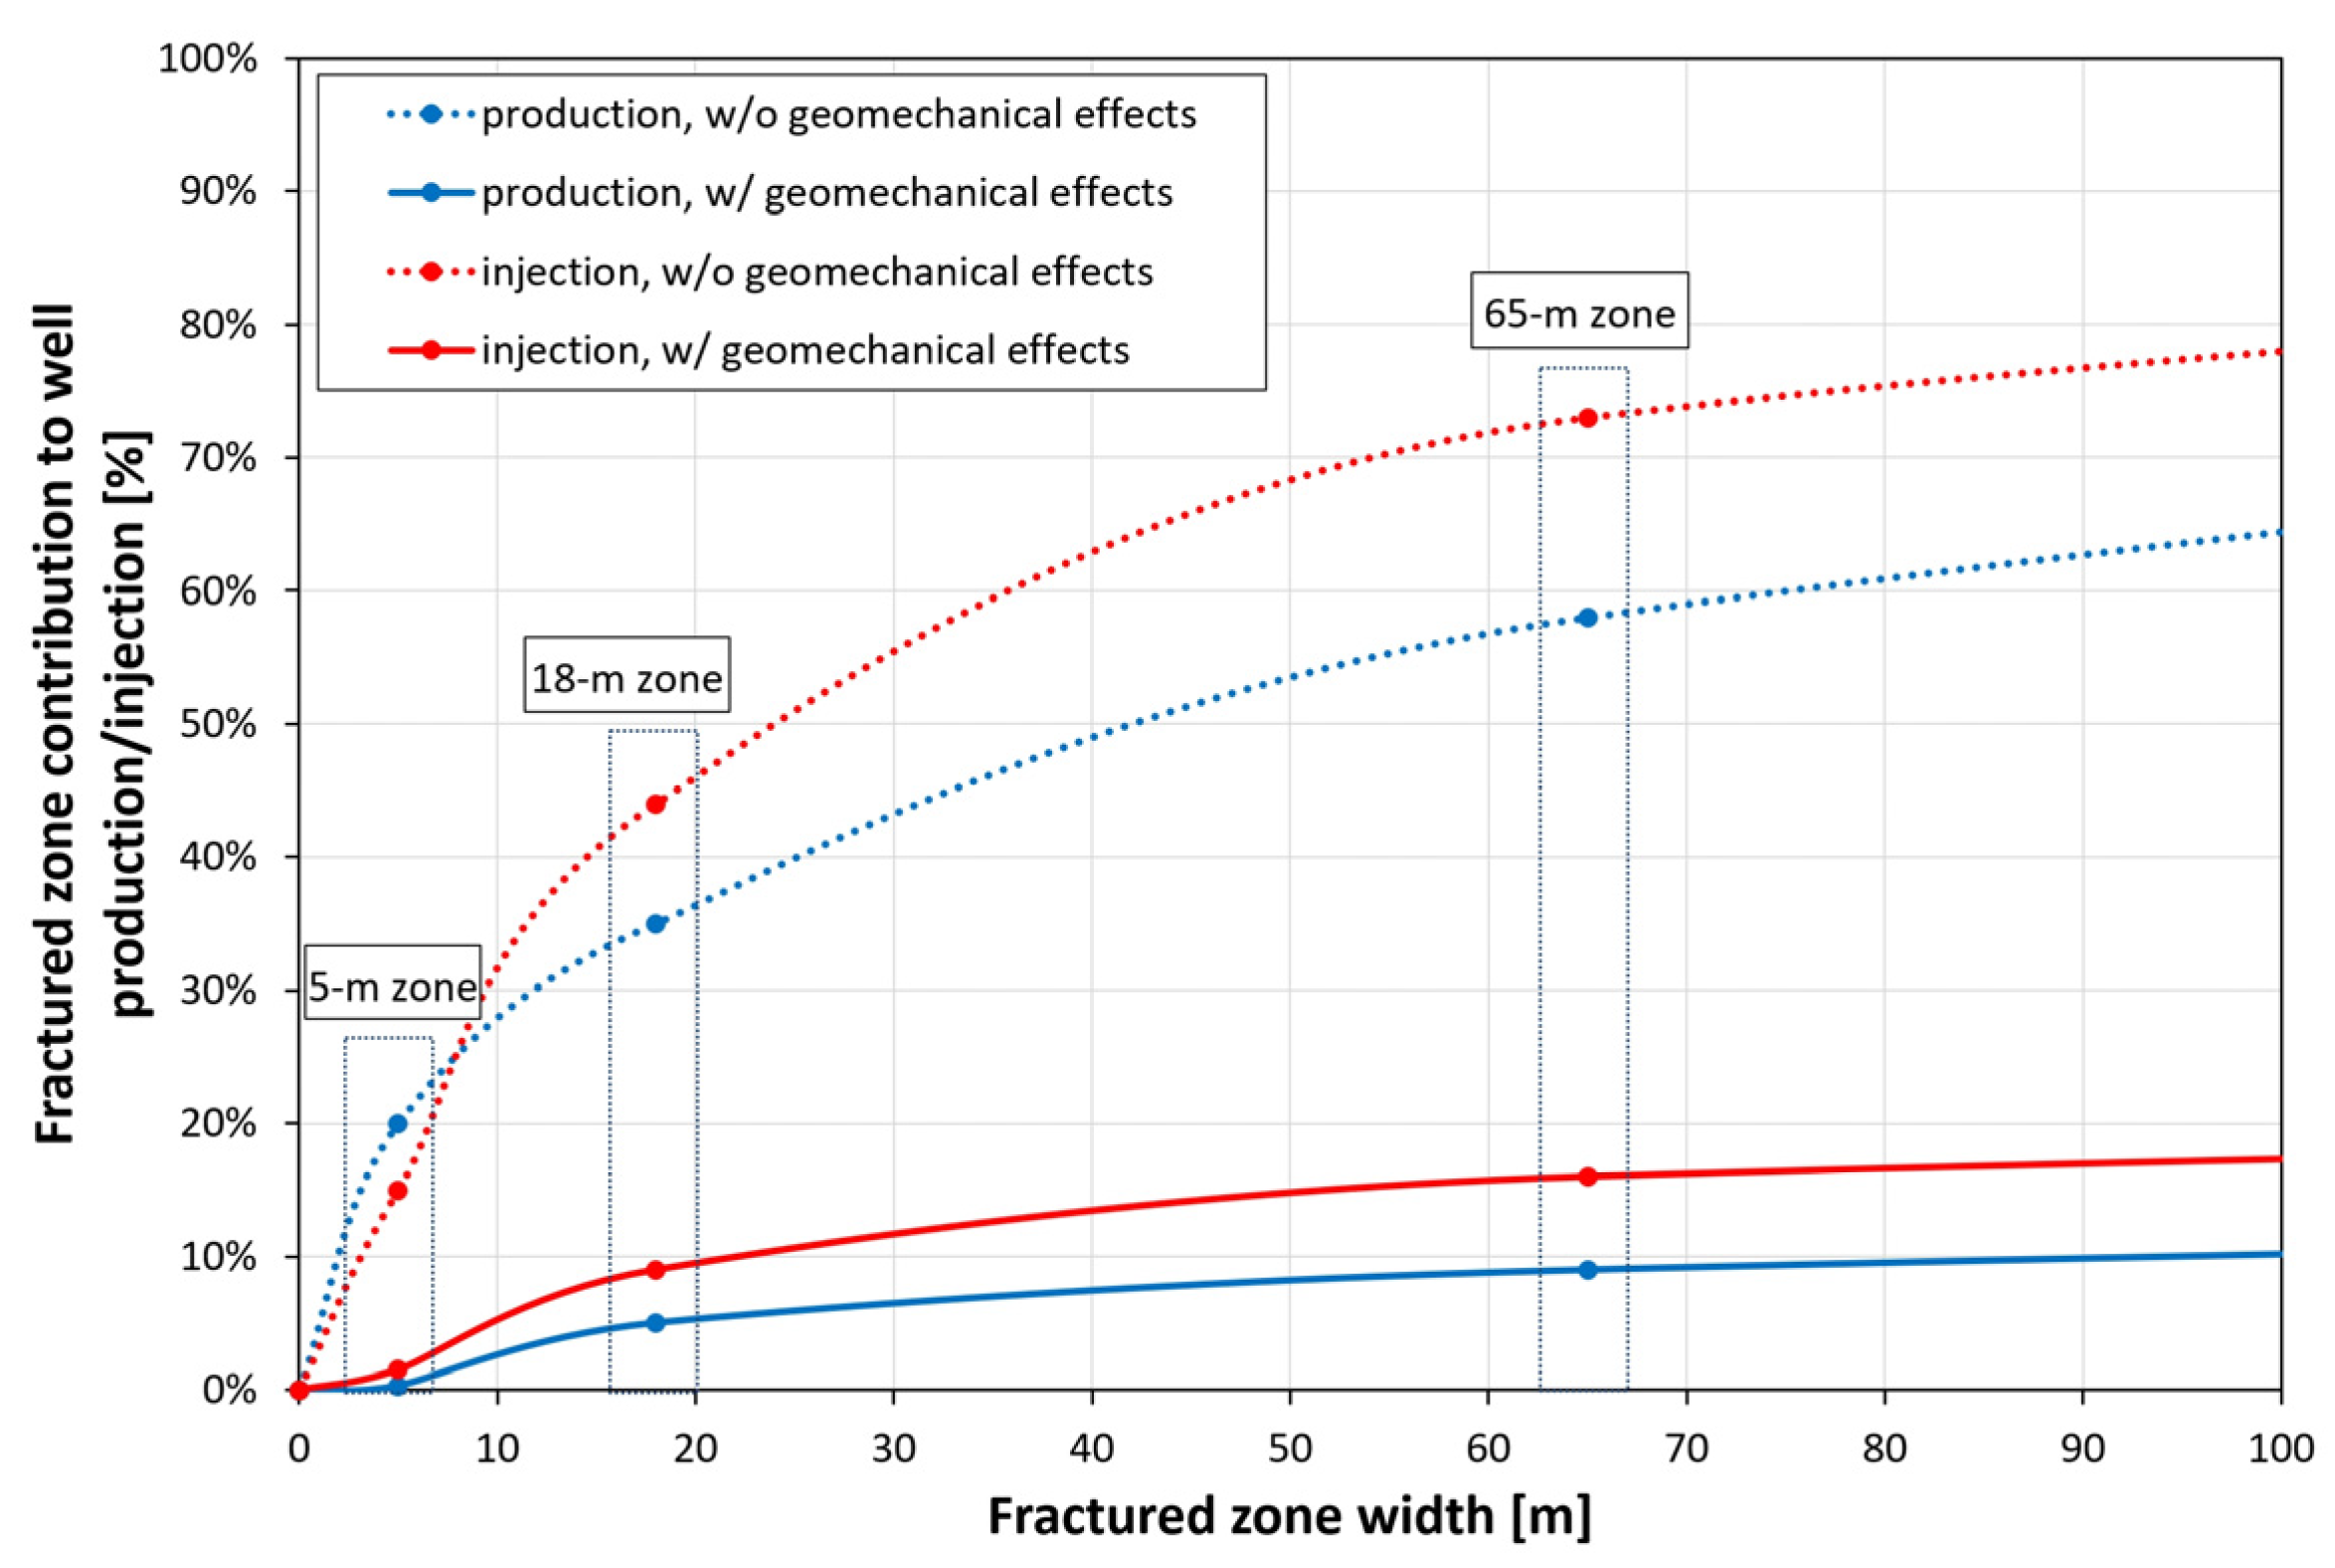
8.4. Results at the Fracture Zone Level

The analogous simulation results referring to the fracture zone of the A-11H well are presented for the same pairs of scenarios in Figure 26, Figure 27, Figure 28 and Figure 29. They show an impact of the geomechanical effects upon production and injection to be firmly manifested at the level of the zone. The geomechanical effects upon the production stage of the project are already observed in Scenarios 1 and 2, corresponding to the primary production method as presented in Figure 26. Scenario 2, where the geomechanical effects are included, results in a reduction in the oil production total by the approximate factor of 90 (from 20,000 sm3 down to 2180 sm3) due to the apparent closure of the fractures caused by pressure decline following reservoir fluid production—the enhanced effect already pointed out in the discussion of the simulation results at the well level.
The oil production rates and totals drastically fall during the production stage due to the fracture closure caused by the decreasing pressure for both the basic production scheme (the solid green curve vs. the dashed green one in Figure 26 for the total production reduction factor of 0.0003) and the EOR production method (the solid green curve vs. the dashed green one in Figure 27 for the total production reduction factor of 0.018). Unexpectedly, the CO2 injection rate increases very slowly, despite a rise in the bottom-hole pressure, and the injection of Scenario 3 including the geomechanical effects never reaches that of Scenario 4, i.e., the one without the geomechanical effects. Similar conclusions refer to Scenario 5 vs. Scenario 6 and Scenario 7 vs. Scenario 8. The slight rise in the CO2 injection rate during the sequestration stage is a result of the combination of several factors. When the injection stage is started, the injection gas saturation at the fracture zone connection with the well rises rapidly to its maximum level. That implies a rapid increase in the relative permeability of the injection phase and a constant increase in the injectivity index at the fracture zone scale. As a consequence, it can be inferred that the effective resistivity between the fracture zone and the well is relatively small when comparing it to the resistivity of the reservoir section around the wellbore itself. The effective resistivity of the near-wellbore reservoir initially dominates the injection process but decreases much slower than the effective resistivity of the fracture zone. Finally, the total resistivity of the reservoir system produces a delayed effect of the injection rate enhancement at the fracture zone level. Such an effect is most evident in cases of the scenarios with the geomechanics enabled and the fracture zone width of 5 m presented in Figure 27.
When variations in the fracture zone width are taken into account, another phenomenon can be noticed. When the fracture zone width increases, so does the total oil production separately for both the cases neglecting the geomechanical effects (176, 332, and 520 × 103 Sm3 for 5, 18, and 65 m width fracture zone, respectively; the dashed green curves in Figure 27, Figure 28 and Figure 29) and the cases including those effects (3.25, 68, and 160 × 103 Sm3 for 5, 18, 65 m width fracture zone, respectively; the solid green curves in Figure 27, Figure 28 and Figure 29). Hence, the total oil production dependence upon the fracture zone width for cases neglecting the geomechanical effects is larger than the analogous dependence for cases including the geomechanical effects. As a consequence, a rather unexpected conclusion follows: the geomechanical effects reduce the oil production total by a relatively higher degree for a narrower fracture zone than for a wider one, i.e., by a factor of 67, 7.0, and 6.4 (from 20%, 35%, and 58% down to 0.3%, 5%, and 9%) for the fracture zone width of 5, 18, and 65 m, respectively (the solid vs. dashed green curves in Figure 27, Figure 28 and Figure 29). The corresponding results are shown collectively in Figure 30.
Similar behavior can be observed in the contribution of the fracture zone to the injectivity of A11-H well—reduction in this fracture zone contribution due to the geomechanical effects is reported as follows: by a factor of 10, 4.9, and 4.6 (from 15%, 44%, and 73% down to 1.5%, 9%, and 16%) for 5, 18, and 65 m width of the fracture zone, respectively (the corresponding results are shown in Figure 30). Despite the increasing bottom-hole pressure during the injection period of the CO2-EOR and CO2 sequestration, the fracture zone reveals reduced injectivity due to the effects of partial fracture closure.
The fracture zone is analyzed for cases with its widths increasing geometrically: from 5 m through 18 m up to 65 m. This variation entails a nonlinear change in the production and injection results between the corresponding scenarios. The rise in the fracture zone width by the factor of 3.6 (from 5 m to 18 m) causes an almost double (by a factor of 1.75) increase in the zone contribution to the well oil production and an almost triple (by a factor of 2.9) increase in the zone contribution to the well gas injection for the scenarios neglecting geomechanical effects. In scenarios with the geomechanical effects, the zone contribution to the well oil production rises about 16 times and the zone contribution to the well gas injection rises 6 times. When the fracture zone width increases by the subsequent factor of 3.6 (from 18 m to 65 m), the zone contribution to the well oil production/CO2 injection rises by 1.7 times for the former scenarios. When taking into account the latter scenarios, the zone contribution to the well oil production/CO2 injection rises by a factor of 1.8, as can be deduced from the results presented in Figure 30.
The geomechanical effects resulted in much larger differences in the oil production for the scenarios with primary production than for those with CO2 injection. It is worth adding that the influence of the geomechanical effects in the fracture zone on the well productivity is partially compensated by the method of well control applying a nominal production rate. Only when the bottom-hole pressure reaches its minimum level due to decreased productivity is the production rate reduced to maintain the limiting pressure.

9. Fracture Propagation Analysis

To maintain the secure storage of CO2 in the analyzed reservoir formation after reaching the maximum CO2 allowance of the production wells, the integrity of the basal anhydrite A2—a sealing formation—has to be preserved [105]. Under the condition of the pre-existing fracture zone within the reservoir rock, the analysis of possible fracture propagation is critical.
For tracking the changes in the fracture zone vicinity, indicative parameters suggesting whether the fracture is propagating were used: failure mode, normal effective stress, and normal strain as resulted from geomechanical simulations calculated for particular time steps of the field production, application of CO2-EOR method, and CO2 sequestration.
To determine fracture propagation, a commonly used Mohr–Coulomb criterion was used with a tension cut-off [106,107,108]. The vicinity of the modeled fracture within the reservoir rock and directly overlying caprock (Figure 29) did not meet the failure criteria (Figure 29) and remained intact through the analyzed stages of CO2 injection [105]. In Figure 29, a Mohr–Coulomb diagram is shown, which is plotted for the grid cells located right above the top reservoir showing no signs of rock failure.
What is more, the results of geomechanical simulations revealed positive values of the normal stress and strain (Figure 31C,D, respectively), indicating no sign of tensile strain at the fracture zone and in its close vicinity, especially in the overlying basal anhydrite A2, suggesting, therefore, no fracture propagation [109] and the lack of rock failure.
The indicators mentioned above suggest a lack of failure and no further fracture propagation at the analyzed stages of CO2 injection.
All the above parameters confirmed no lateral or vertical propagation of the fracture zone during the history of hydrocarbon production and CO2 injection to the reservoir.

10. Summary and Conclusions

The studies described in this paper address the problem of geomechanical effects and their influence on the modeling of oil production and CO2 injection (CO2-EOR followed by CO2 sequestration). The studies are focused on natural fracture geomechanics and its results for the reservoir, well, and completion performance. The paper includes methods, assumptions, and results of these studies as applied to the geological structure of a domestic oil reservoir that is a potential object for CO2-EOR method application as well as a facility for a CO2 sequestration project.
In particular, an analysis was performed for the transport properties of an induced fracture zone as a function of its geomechanical state as well as the state of its neighborhood.
For this purpose, 3D geological structural and parametric models were constructed and implemented in a dynamical flow model and a static geomechanical one for both flow and geomechanical simulations. An effective method of direct dependence between pore pressure variation and basic geological parameter variation via the geomechanical parameter changes was employed in this study. By identifying separate regions of a uniform variation in geomechanical state parameters with reservoir pressure changes during continuity intervals, specific correlations are found for basic parameters (porosity, permeability) as direct functions of pressure in various reservoir regions and time intervals.
The constructed reservoir model of the analyzed structure, including the oil reservoir, screening caprocks, and other surrounding formations, was satisfactorily calibrated based on the data obtained from the reservoir operator and covering 16 years of its operation with 11 producing wells.
The calibrated reservoir model effectively coupled with geomechanical effects was utilized to perform simulation forecasts of reservoir behavior for various scenarios including primary production methods, enhanced oil recovery with CO2 injection followed by CO2 sequestration, and various extensions (widths) of the fracture zone.
The studies performed within the reported research allow us to draw the following conclusions:
General conclusions are as follows:
1.
The method proposed in the studies and comprising effectively coupled geomechanical and dynamical simulations of reservoir region and its extension allows us to take into account the influence of geomechanical effects upon transport properties of reservoir rock and, consequently, upon the operation of the reservoir in various stages including primary production, enhanced oil production by CO2 injection, and CO2 sequestration;
2.
The geomechanical effects induced primarily by the redistribution of reservoir pressure may drastically modify transport properties of fracture zones contributing to well performance and thus determining the operational results of the involved reservoir;
3.
The quantitative results of those geomechanical effects depend upon detailed properties of both geomechanical state evolution and geological characteristics of the reservoir;
4.
The following two correlations are key factors when the effective transport properties of the reservoir rock are a concern:
-
The correlation between the geomechanical state (stress and strain field) and the rock pore matrix and fracture characteristics;
-
The correlation between pore matrix/fracture characteristics and their effective transport properties.
Conclusions specific to the analyzed geological structure are as follows:
  • Assumed geometries of discontinuities and the reservoir stress field indicate that fractures are reactivated in tensile/hybrid failure mode caused by pressure build-up during CO2 injection; induced aperture changes result from the normal stress while the shear stress can be neglected;
  • Under the geomechanical stress state resulting from the simulations of both production and injection stages of the reservoir operation, the fracture zone will not propagate within the underlying main dolomite formation or the anhydrite caprock; hence, no CO2 leakage upward into the anhydrite formation via induced fractures is observed;
  • The geomechanical effects significantly determine simulation forecasts of oil production by an oil-producing well with completion including a fracture zone, and the pressure reduction results in fracture closure and a reduction in the fracture contribution to the well productivity depending on the size of the fractured zone;
  • The productivity reduction of the fracture zone alone may be as large as 60-fold (Figure 24) for primary production with a narrow fracture zone and 3-fold for the CO2-EOR production method with a wider fracture zone (Figure 27);
  • Similar results for geomechanical effects are found in well injectivity due to fracture apertures not regaining their primary size despite the increasing reservoir pressure during the injection phase of the CO2-EOR and CO2 sequestration;
  • In the cases of carbonate reservoir rocks with more frequent fracture occurrences, the evaluated geomechanical effects in the field performance are expected to be enhanced at the reservoir scale.

Author Contributions

Conceptualization, W.S. and M.S.-V.; methodology, W.S. and M.S.-V.; software, P.R. and K.S.; validation, W.S. and K.S.; formal analysis, P.R. and M.S.-V.; investigation, P.R. and M.S.-V.; resources, P.R. and K.S.; data curation, P.R. and M.S.-V.; writing—original draft preparation, W.S. and M.S.-V.; writing—review and editing, K.S.; visualization, P.R. and M.S.-V.; supervision, W.S.; project administration, K.S. All authors have read and agreed to the published version of the manuscript.

Funding

This research was carried out as part of the following project: Evaluation of the impact of fractures presence on the efficiency of CO2-EOR as well as the sequestration capacity and tightness of the geological structure, which is funded by the Polish Ministry of Science and Higher Education, Grant No. DK-4100-106/21. The authors would like to express their gratitude to the Polish Ministry of Science and Higher Education for funding this research.

Data Availability Statement

3rd Party Data. Restrictions apply to the availability of these data. Data was obtained from Polish Oil and Gas Company and are available from the authors with the permission of Polish Oil and Gas Company.

Conflicts of Interest

The authors declare no conflict of interest.

Nomenclature

b equivalent normal closure aperture;
b m a x maximum aperture;
b r residual aperture;
d equivalent shear dilation aperture;
d m a x maximum shear dilation;
EYoung modulus;
Edyndynamic Young modulus;
f d equivalent shear dilation frequency;
f n equivalent fracture frequency;
p pore pressure;
q equivalent frictional coefficient;
T tensile strength;
νPoisson’s ratio;
νdyndynamic Poisson’s ratio;
vpcompressional wave velocity;
vsshear wave velocity;
α Biot’s coefficient;
α stress coefficient for the normal closure aperture;
σ h minimum horizontal stress;
σ H maximum horizontal stress;
σ m a x maximum principal stress in the plane perpendicular to the fracture surface;
σ m i n minimum principal stress in the plane perpendicular to the fracture surface;
σ r ratio of maximum principal stress;
σvvertical stress;
γ stress coefficient for shear dilation;
ɛHtectonic strains parallel to the maximum horizontal stress direction;
ɛhtectonic strains parallel to the minimum horizontal stress direction;
ρrock density.

References

  1. Azzolina, N.; Gorecki, C.; Pu, H.; Peck, W.; Ayash, S.; Melzer, S.; Nakles, D.; Chatterjee, S. Statistical analysis of CO2 EOR production and injection data to examine ongoing and ultimate CO2 EOR incidental storage. In Proceedings of the Thirteenth Annual Conference on Carbon Capture, Utilization & Storage Conference, Pittsburgh, PA, USA, 28 April–1 May 2014; David L. Lawrence Convention Center: Pittsburgh, PA, USA, 2014. 20p. [Google Scholar]
  2. Ghedan, S. Global Laboratory Experience of CO2-EOR Flooding. In Proceedings of the 2009 SPE/EAGE Reservoir Characterization and Simulation Conference, Abu Dhabi, United Arab Emirates, 19–21 October 2009; Society of Petroleum Engineers: Richardson, TX, USA, 2009. 15p. [Google Scholar] [CrossRef]
  3. Holm, L. Carbon Dioxide Solvent Flooding for Increased Oil Recovery. Trans. AIME 1959, 216, 225–231. [Google Scholar] [CrossRef]
  4. Jarrell, P.M.; Fox, C.E.; Stein, M.H.; Webb, S.L. Practical Aspects of CO2 Flooding; Society of Petroleum Engineers Monograph Series, v. 22; Society of Petroleum Engineers: Richardson, TX, USA, 2002; 220p, ISBN 978-1-55563-096-6. [Google Scholar] [CrossRef]
  5. Martin, D.F.; Taber, J.J. Carbon Dioxide Flooding. J. Pet. Technol. 1992, 44, 396–400. [Google Scholar] [CrossRef]
  6. Mungan, N. Carbon Dioxide Flooding—Fundamentals. In Heavy Crude Oil Recovery; Springer: Dordrecht, The Netherlands, 1981; pp. 87–92. ISBN 978-94-009-6140-1. [Google Scholar] [CrossRef]
  7. Peng, B. CO2 Storage in the Oil Reservoir and Enhanced Oil Recovery; University of Petroleum, Enhanced Oil Recovery Research Center: Beijing, China, 11–15 July 2011; 39p. [Google Scholar]
  8. Remson, D. Storing CO2 and Producing Domestic Crude Oil with Next-Generation CO2-EOR Technology; DOE/NETL–2010/1417; National Energy Technology Laboratory: Albany, OR, USA, April 2010; 59p.
  9. Tzimas, E.; Georgakaki, A.; Cortes, C.G.; Peteves, S.D. Enhanced Oil Recovery Using Carbon Dioxide in the European Energy System; Report EUR 21895 EN, European Commission, Directorate General Joint Research Centre (DG JRC); Institute of Energy: Petten, The Netherlands, December 2005; 118p, ISBN 92-79-01044-1. EUR 21895 EN, JRC32102. [Google Scholar]
  10. Bradshaw, J.; Rigg, A. The GEODISC Program: Research into Geological Sequestration of CO2 in Australia. Environ. Geosci. 2001, 8, 166–176. [Google Scholar] [CrossRef]
  11. Streit, J.E.; Siggins, A.F. Predicting, monitoring and controlling geomechanical effects of CO2 injection. In Greenhouse Gas Control Technologies, Proceedings of the 7th International Conference on Greenhouse Gas Control Technologies, Vancouver, BC, Canada, 5–9 September 2004; Rubin, E.S., Keith, D.W., Gilboy, C.F., Eds.; Elsevier: Oxford, UK, 2005; pp. 643–651. ISBN 0-08-044881-X. TRN: 000600155. [Google Scholar]
  12. Islam, M.; Chakma, A. Storage and utilization of CO2 in petroleum reservoirs—A simulation study. Energy Convers. Manag. 1993, 34, 1205–1212. [Google Scholar] [CrossRef]
  13. Bachu, S. Sequestration of CO2 in geological media: Criteria and approach for site selection in response to climate change. Energy Convers. Manag. 2000, 41, 953–970. [Google Scholar] [CrossRef]
  14. Koide, H.; Tazaki, Y.; Noguchi, Y.; Nakayama, S.; Iijima, M.; Ito, K.; Shindo, Y. Subterranean containment and long-term storage of carbon dioxide in unused aquifers and in depleted natural gas reservoirs. Energy Convers. Manag. 1992, 33, 619–626. [Google Scholar] [CrossRef]
  15. Ennis-King, J.; Paterson, L. Reservoir engineering issues in the geological disposal of carbon dioxide. In Greenhouse Gas Control Technologies: Proceedings of the 5th International Conference on Greenhouse Gas Control Technologies; Williams, D.J., Durie, R.A., McMullan, P., Paulson, C.A.J., Smith, A.Y., Eds.; CSIRO Publishing: Cairns, Australia, 2001; pp. 290–295. ISBN 0-643-06672-1. TRN: 000900074. [Google Scholar]
  16. Al-Masri, W.; Papaspyrou, C.; Shapiro, A.; Suicmez, V. Study of the Feasibility of the Carbon Dioxide Injection in a North Sea Petroleum Reservoir. In Proceedings of the SPE Europec Featured at 80th EAGE Conference and Exhibition, Copenhagen, Denmark, 11–14 June 2018. [Google Scholar] [CrossRef]
  17. Ettehadtavakkol, A.; Lake, L.W.; Bryant, S.L. CO2-EOR and storage design optimization. Int. J. Greenh. Gas Control 2014, 25, 79–92. [Google Scholar] [CrossRef]
  18. Ghomian, Y.; Sepehrnoori, K.; Pope, G.A. Efficient Investigation of Uncertainties in Flood Design Parameters for Coupled CO2 Sequestration and Enhanced Oil Recovery. In Proceedings of the SPE International Conference on CO2 Capture, Storage, and Utilization, New Orleans, LA, USA, 10–12 November 2010. [Google Scholar] [CrossRef]
  19. Safi, R.; Agarwal, R.K.; Banerjee, S. Numerical simulation and optimization of CO2 utilization for enhanced oil recovery from depleted reservoirs. Chem. Eng. Sci. 2016, 144, 30–38. [Google Scholar] [CrossRef]
  20. Arnaut, M.; Vulin, D.; Lamberg, G.J.G.; Jukić, L. Simulation Analysis of CO2-EOR Process and Feasibility of CO2 Storage during EOR. Energies 2021, 14, 1154. [Google Scholar] [CrossRef]
  21. Karimaie, H.; Nazarian, B.; Aurdal, T.; Nøkleby, P.H.; Hansen, O. Simulation Study of CO2 EOR and Storage Potential in a North Sea Reservoir. Energy Procedia 2017, 114, 7018–7032. [Google Scholar] [CrossRef]
  22. Liu, Y.; Rui, Z. A Storage-Driven CO2 EOR for a Net-Zero Emission Target. Engineering 2022, 18, 79–87. [Google Scholar] [CrossRef]
  23. Liu, Y.; Rui, Z.; Yang, T.; Dindoruk, B. Using propanol as an additive to CO2 for improving CO2 utilization and storage in oil reservoirs. Appl. Energy 2022, 311, 118640. [Google Scholar] [CrossRef]
  24. Zhao, X.; Rui, Z.; Liao, X. Case studies on the CO2 storage and EOR in heterogeneous, highly water-saturated, and extra-low permeability Chinese reservoirs. J. Nat. Gas Sci. Eng. 2016, 29, 275–283. [Google Scholar] [CrossRef]
  25. Teklu, T.W.; Alameri, W.; Graves, R.M.; Tutuncu, A.N.; Kazemi, H.; Alsumaiti, A.M. Geomechanics Considerations in Enhanced Oil Recovery. In Proceedings of the SPE Canadian Unconventional Resources Conference, Calgary, AB, Canada, 30 October–1 November 2012. [Google Scholar] [CrossRef]
  26. Correa, A.C.F.; Newman, R.B.; Naveira, V.P.; de Souza, A.L.S.; Araujo, T.; da Silva, A.A.C.; Soares, A.C.; Herwanger, J.V.; Meurer, G.B. Integrated Modeling for 3D Geomechanics and Coupled Simulation of Fractured Carbonate Reservoir. In Proceedings of the OTC Brasil, Rio de Janeiro, Brazil, 29–31 October 2013. [Google Scholar] [CrossRef]
  27. Jabbari, H.; Ostadhassan, M.; Salehi, S. Geomechanical Modeling in CO2 Enhanced Oil Recovery. In Proceedings of the 49th U. S. Rock Mechanics/Geomechanics Symposium, San Francisco, CA, USA, 28 June–1 July 2015. ARMA-2015-262. [Google Scholar]
  28. Elyasi, A.; Goshtasbi, K.; Hashemolhosseini, H.; Barati, S. Coupled solid and fluid mechanics simulation for estimating optimum injection pressure during reservoir CO2-EOR. Struct. Eng. Mech. 2016, 59, 37–57. [Google Scholar] [CrossRef]
  29. Rahman, J.; Fawad, M.; Mondol, N.H. 3D Field-Scale Geomechanical Modeling of Potential CO2 Storage Site Smeaheia, Offshore Norway. Energies 2022, 15, 1407. [Google Scholar] [CrossRef]
  30. Chiaramonte, L.; Zoback, M.D.; Friedmann, J.; Stamp, V. Seal integrity and feasibility of CO2 sequestration in the Teapot Dome EOR pilot: Geomechanical site characterization. Environ. Geol. 2007, 54, 1667–1675. [Google Scholar] [CrossRef]
  31. White, J.A.; Chiaramonte, L.; Ezzedine, S.; Foxall, W.; Hao, Y.; Ramirez, A.; McNab, W. Geomechanical behavior of the reservoir and caprock system at the In Salah CO2 storage project. Proc. Natl. Acad. Sci. USA 2014, 111, 8747–8752. [Google Scholar] [CrossRef]
  32. Sharma, P.; Ghosh, S.; Tandon, A. Study of CO2 injection in a depleted oil reservoir using geomechanically coupled and non-coupled simulation models. Mater. Today Proc. 2022, 57, 1805–1812. [Google Scholar] [CrossRef]
  33. Chadwick, A.; Arts, R.; Bernstone, C.; May, F.; Thibeau, S.; Zweigel, P. Best Practice for the Storage of CO2 in Saline Aquifers, Observations and Guidelines from the SACS and CO2 STORE Projects; British Geological Survey Halstan & Co. Ltd.: Amersham, UK, 2008; ISBN 978-0-85272-610-5. [Google Scholar]
  34. Jia, C.-J.; Xu, W.-Y.; Wang, H.-L.; Wang, R.-B.; Yu, J.; Yan, L. Stress dependent permeability and porosity of low-permeability rock. J. Cent. South Univ. 2017, 24, 2396–2405. [Google Scholar] [CrossRef]
  35. Wójcicki, A. Realization Status and Prospects for the National Program. Assessment of Geological Formations and Structures for Safe Geological Storage of CO2, with the Monitoring Program; Prace Naukowe Instytutu Nafty i Gazu Państwowego Instytutu Badawczego: Kraków, Poland, 2013; Volume 170, pp. 361–365. [Google Scholar]
  36. Davies, P.B. Evaluation of the Role of Threshold Pressure in Controlling Flow of Waste-Generated Gas into Bedded Salt at the Waste Isolation Pilot Plant; Sandia Report prepared for the United States Department of Energy under Contract DE-AC04-76DP00789; Sandia National Laboratories: Albuquerque, NM, USA, 1991; Volume 23, pp. 17–19, RN: 23009058.
  37. Ibrahim, M.A.; Tek, M.R.; Katz, D.L. Threshold Pressure in Gas Storage; American Gas Association, Inc.: Arlington, VA, USA, 1970; ISBN 9780318127248. [Google Scholar]
  38. Tarkowski, R.; Stopa, J. Tightness of geological structure destined for underground carbon dioxide storage. Gospod. Surowcami Miner. 2007, 23, 129–137. [Google Scholar]
  39. Settari, A.; Mounts, F.M. A Coupled Reservoir and Geomechanical Simulation System. SPE J. 1998, 3, 219–226. [Google Scholar] [CrossRef]
  40. Settari, A.; Price, T.R.; Yee, C.T. Coupling of Fluid Flow and Soil Behavior to Model Injection into Unconsolidated Oil Sands. In Proceedings of the 1988 Petroleum Society of CIM Annual Technical Meeting, Calgary, AB, Canada, 12–16 June 1988. CIM 88-39-72. [Google Scholar]
  41. Minkoff, S.E.; Stone, C.M.; Arguello, J.G.; Bryant, S.; Eaton, J.; Peszynska, M.; Wheeler, M. Staggered in Time Coupling of Reservoir Flow Simulation and Geomechanical Deformation: Step 1—One-Way Coupling. In Proceedings of the SPE Reservoir Simulation Symposium, Houston, TX, USA, 14–17 February 1999. [Google Scholar] [CrossRef]
  42. Ito, Y.; Settari, A.; Kry, P.; Jha, K. Development and Application of Pseudo-Functions for Reservoir Simulation to Represent Shear Failure During the Cyclic Steam Process. In Proceedings of the SPE International Thermal Operations Symposium, Bakersfield, CA, USA, 8–10 February 1993. [Google Scholar] [CrossRef]
  43. Gutierrez, M. Fully Coupled Analysis of Reservoir Compaction and Subsidence. In Proceedings of the European Petroleum Conference, London, UK, 25–27 October 1994. [Google Scholar] [CrossRef]
  44. Du, J.; Wong, R. Development of a Coupled Geomechanics-Thermal Reservoir Simulator Using Finite Element Method. In Proceedings of the Canadian International Petroleum Conference, Calgary, AB, Canada, 7–9 June 2005. [Google Scholar] [CrossRef]
  45. Morkos, P.; Gildin, E. Development of Agile Framework for Model-Order Reduction of Large-Scale Geomechanical Models: A Novel Workflow for Coupled Simulations. In Proceedings of the SPE/AAPG/SEG Unconventional Resources Technology Conference, Virtual, 20–22 July 2020. [Google Scholar] [CrossRef]
  46. An, C.; Fang, Y.; Liu, S.; Alfi, M.; Yan, B.; Wang, Y.; Killough, J. Impacts of Matrix Shrinkage and Stress Changes on Permeability and Gas Production of Organic-Rich Shale Reservoirs. In Proceedings of the SPE Reservoir Characterisation and Simulation Conference and Exhibition, Abu Dhabi, United Arab Emirates, 8–10 May 2017. [Google Scholar] [CrossRef]
  47. Amirlatifi, A.; Eckert, A.; Nygaard, R.; Bai, B. Estimation of Reservoir Uplift, Seismicity and Failure Likelihood during CO2 Injection through Coupled Reservoir Simulation. In Proceedings of the Canadian Unconventional Resources Conference, Calgary, AB, Canada, 15–17 November 2011. [Google Scholar] [CrossRef]
  48. Xu, T.; Lindsay, G. Unique Multidisciplinary Approach to Model and Optimize Pad Refracturing in the Haynesville Shale. In Proceedings of the SPE/AAPG/SEG Unconventional Resources Technology Conference, Austin, TX, USA, 24–26 July 2017. [Google Scholar] [CrossRef]
  49. Han, H.; Higgins-Borchardt, S.M.; Mata, D.; Gonzales, V.M. In-Situ and Induced Stresses in the Development of Unconventional Resources. In Proceedings of the SPE/CSUR Unconventional Resources Conference–Canada, Calgary, AB, Canada, 30 September–2 October 2014. [Google Scholar] [CrossRef]
  50. Pei, Y.; Yu, W.; Sepehrnoori, K. Investigation of Vertical Fracture Complexity Induced Stress Interference in Multilayer Shale Gas Reservoirs with Complex Natural Fractures. In Proceedings of the SPE Annual Technical Conference and Exhibition, Virtual, 26–29 October 2020. [Google Scholar] [CrossRef]
  51. Lei, Z.; Yang, X.; Li, X.; Hu, D.; Wu, Y.; Peng, Y. Advanced Modeling of Horizontal Well Performance Under Different Re-fracturing Designs in Tight Oil Reservoir. In Proceedings of the SPE Europec Featured at 81st EAGE Conference and Exhibition, London, UK, 3–6 June 2019. [Google Scholar] [CrossRef]
  52. French, S.; Puspitasari, R.; Isherwood, A.; Cox, P.; Marsden, R.; Mbang, M.N.E.; Tan, C.P.; John, Z. 4-D Geomechanics to Predict Compaction and Subsidence for Development of Unconsolidated Sandstone Reservoirs: Fortuna Project Case Study, Offshore Equatorial Guinea. In Proceedings of the SPE/IADC Drilling Conference and Exhibition, The Hague, The Netherlands, 14–16 March 2017. [Google Scholar] [CrossRef]
  53. Shokri, A.R.; Chalaturnyk, R.J.; Nickel, E. Non-Isothermal Injectivity Considerations for Effective Geological Storage of CO2 at the Aquistore Site, Saskatchewan, Canada. In Proceedings of the SPE Annual Technical Conference and Exhibition, Calgary, AB, Canada, 30 September–2 October 2019. [Google Scholar] [CrossRef]
  54. Kim, G.W.; Kim, T.H.; Lee, K.S. Impact of Heterogeneous Hydro-Geomechanical Properties of Caprock on CO2 Leakage by Tensile Fracture Reactivation During CCS. In Proceedings of the Abu Dhabi International Petroleum Exhibition & Conference, Abu Dhabi, United Arab Emirates, 7–10 November 2016. [Google Scholar] [CrossRef]
  55. Restrepo, A.; Rendón, N.; Marin, R.; Lara, V.; Osorio, G.; Velásquez, J.; Lopez, C.; Ocampo, A. Geomechanics Coupled Simulation of Different Completion Schemes in a Stress Sensitive Reservoir. In Proceedings of the EAGE Annual Conference & Exhibition incorporating SPE Europe, London, UK, 10–13 June 2013. [Google Scholar] [CrossRef]
  56. Onaisi, A.; Samier, P.; Koutsabeloulis, N.; Longuemare, P. Management of Stress Sensitive Reservoirs Using Two Coupled Stress-Reservoir Simulation Tools: ECL2VIS and ATH2VIS. In Proceedings of the Abu Dhabi International Petroleum Exhibition and Conference, Abu Dhabi, United Arab Emirates, 13–16 October 2002. [Google Scholar] [CrossRef]
  57. Bourgeois, F.; Koutsabeloulis, N. Geomechanical Modeling of a Full Reservoir of the North Sea. In Proceedings of the SPE/EAGE Reservoir Characterization and Simulation Conference, Abu Dhabi, United Arab Emirates, 28–31 October 2007. [Google Scholar] [CrossRef]
  58. Wagner, R. Stratygrafia Osadów i Rozwój Basenu Cechsztyńskiego na Niżu Polskim. Prace Państwowego Instytutu Geologicznego, 146; Państwowy Inst. Geologiczny: Warszawa, Poland, 1994; OL924861M, LCCN: 95223745. [Google Scholar]
  59. Kotarba, M.; Wagner, R. Generation potential of the Zechstein Main Dolomite (Ca2) carbonates in the Gorzów Wielkopolski-Miedzychód-Lubiatów area: A geological and geochemical approach to microbial-algal source rock. Przegląd Geol. 2007, 55, 1025–1036. [Google Scholar]
  60. Czekański, E.; Kwolek, K.; Mikołajewski, Z. Hydrocarbon fields in the Zechstein Main Dolomite (Ca2) on the Gorzów Block (NW Poland). Przegląd Geol. 2010, 58, 695–703. [Google Scholar]
  61. Protas, A.; Wojtkowiak, Z. The Gorzów Block. Geology of the Lower Zechstein. In Guide to 71st Congress of the Polish Geological Society; Państwowy Inst. Geologiczny: Warszawa, Poland, 2000; pp. 163–171. [Google Scholar]
  62. Dadlez, R. Budowa Geologiczna Niecki Szczecińskiej i Bloku Gorzowa; Prace PIG, 96; Państwowy Inst. Geologiczny: Warszawa, Poland, 1979; ISBN 108322000200. LCCN: 81118351. [Google Scholar]
  63. Peryt, T.; Dyjaczyński, K. An isolated carbonate bank in the Zechstein Main Dolomite basin, western Poland. J. Pet. Geol. 1991, 14, 445–458. [Google Scholar] [CrossRef]
  64. Jaworowski, K.; Mikołajewski, Z. Oil- and gas-bearing sediments of the Main Dolomite (Ca2) in the Międzychód region: A depositional model and the problem of the boundary between the second and third depositional sequences in the Polish Zechstein Basin. Przegląd Geol. 2007, 55, 1017–1024. [Google Scholar]
  65. Slowakiewicz, M.; Mikolajewski, Z. Sequence stratigraphy of the Upper Permian Zechstein Main Dolomite carbonates in Western Poland: A new approach. J. Pet. Geol. 2009, 32, 215–233. [Google Scholar] [CrossRef]
  66. Słowakiewicz, M.; Mikołajewski, Z. Upper Permian Main Dolomite microbial carbonates as potential source rocks for hydrocarbons (W Poland). Mar. Pet. Geol. 2011, 28, 1572–1591. [Google Scholar] [CrossRef]
  67. Wagner, R.; Dyjaczyński, K.; Papiernik, B.; Peryt, T.M.; Protas, A. Palaeogeographic map of the Main Dolomite (Ca2) in Poland. In Balance and Hydrocarbon Potential of the Dolomite in the Main Perm Basin of Poland; Kotarba, M.J., Ed.; Archiwum WGGiOOE AGH: Kraków, Poland, 2000. [Google Scholar]
  68. Terzaghi, K. Stress Conditions for the Failure of Saturated Concrete and Rock. Reproduced in From Theory to Practice in Soil Mechanics. Proc. Am. Soc. Test. Mater. 1945, 45, 181–197. [Google Scholar]
  69. Zoback, M.D. Reservoir Geomechanics; Cambridge University Press: Cambridge, UK, 2010; ISBN -978-0-521-77069-9. [Google Scholar]
  70. Belyadi, H.; Fathi, E.; Belyadi, F. (Eds.) Chapter Thirteen: Rock Mechanical Properties and In Situ Stresses. In Hydraulic Fracturing in Unconventional Reservoirs; Gulf Professional Publishing: Oxford, UK, 2017; pp. 207–224. ISBN 9780128498712. [Google Scholar] [CrossRef]
  71. Guo, B.; Liu, X.; Tan, X. (Eds.) Petroleum Production Engineering, 2nd ed.; Gulf Professional Publishing: Oxford, UK, 2017; pp. i–iii. ISBN 9780128093740. [Google Scholar] [CrossRef]
  72. Bratton, T.; Cooper, I. Wellbore Measurements: Tools, Techniques, and Interpretation. In Advanced Drilling and Well Technology; Aadnoy, B., Cooper, I., Miska, S., Mitchell, R., Payne, M., Eds.; Society of Petroleum Engineers: Richardson, TX, USA, 2009; pp. 443–457. ISBN 978-1-55563-145-1. [Google Scholar]
  73. Herwanger, J.; Koutsabeloulis, N. Seismic Geomechanics: How to Build and Calibrate Geomechanical Models Using 3D and 4D Seismic Data; EAGE Publications, 181; EAGE: Bunnik, The Netherlands, 2011; ISBN 9781680156973. [Google Scholar]
  74. Słota-Valim, M.; Gołąbek, A.; Szott, W.; Sowiżdżał, K. Analysis of Caprock Tightness for CO2 Enhanced Oil Recovery and Sequestration: Case Study of a Depleted Oil and Gas Reservoir in Dolomite, Poland. Energies 2021, 14, 3065. [Google Scholar] [CrossRef]
  75. Kahraman, S.; Fener, M.; Kozman, E. Predicting the compressive and tensile strength of rocks from indentation hardness index. J. South. Afr. Inst. Min. Metall. 2012, 112, 331–339. [Google Scholar]
  76. Sheorey, P.R. Empirical Rock Failure Criteria; A.A. Balkema: Rotterdam Brookfield, VT, USA, 1997; ISBN 9054106700. [Google Scholar]
  77. Hoek, E. Rock Mechanics–An Introduction for the Practical Engineer Parts I, II, and III. Min. Mag. 1966, 144, 236–243. [Google Scholar]
  78. Karaman, K.; Cihangir, F.; Ercikdi, B.; Kesimal, A.; Demirel, S. Utilization of the Brazilian test for estimating the uniaxial compressive strength and shear strength parameters. J. South. Afr. Inst. Min. Met. 2015, 115, 185–192. [Google Scholar] [CrossRef]
  79. Yetkin, M.E.; Simsir, F.; Ozfirat, M.K.; Ozfirat, P.M.; Yenice, H. A Fuzzy Approach to selecting roof support in longwall mining. S. Afr. J. Ind. Eng. 2016, 27, 162–177. [Google Scholar] [CrossRef]
  80. Tajduś, A.; Cała, M. Regarding the possibility of vertical delamination of the rocks overlying the mining excavations in LGOM. In Proceedings of the XXV Winter School of Rock Mechanics and Geoengineering, Zakopane, Poland, 18–20 March 2022; KGBiG AGH: Kraków, Poland, 2002; pp. 701–712. [Google Scholar]
  81. Adach-Pawelus, K.; Butra, J.; Pawelus, D. Assessment of the mining excavations stability using numerical methods. In Aktualia i Perspektywy Górnictwa; Wydział Geoinżynierii, Górnictwa i Geologii Politechniki Wrocławskiej: Wrocław, Poland, 2018; ISBN 978-83-946706-8-9. [Google Scholar]
  82. Kolano, M.; Flisiak, D. Comparison of geomechanical properties of white rock salt and pink rock salt in Kłodawa salt diapir. Stud. Geotech. Et Mech. 2013, 35, 119–127. [Google Scholar] [CrossRef]
  83. Jiang, D.; Lin, S.; Williams, P. Deformation path in high-strain zones, with reference to slip partitioning in transpressional plate-boundary regions. J. Struct. Geol. 2001, 23, 991–1005. [Google Scholar] [CrossRef]
  84. Jarosiński, M. Recent tectonic stress regime in Poland based on analyses of hydraulic fracturing of borehole walls. Przegląd Geol. 2005, 53, 863–872. [Google Scholar]
  85. Leverett, M. Capillary Behavior in Porous Solids. Trans. AIME 1941, 142, 152–169. [Google Scholar] [CrossRef]
  86. Brooks, R.H.; Corey, A.T. Hydraulic Properties of Porous Media and Their Relation to Drainage Design. Trans. ASAE 1964, 7, 0026–0028. [Google Scholar] [CrossRef]
  87. Szott, W.; Pańko, A.; Łętkowski, P.; Malaga, M. Wykonanie Modeli Symulacyjnych dla złóż Ropy Naftowej Grotów–Międzychód–Lubiaków–Sowia Góra (Simulation Models of Grotów–Międzychód–Lubiaków–Sowia Góra Oil Field); INiG, Krosno; Dokumentacja wykonana dla PGNiG S.A.: Warszawa, Poland, 2007. [Google Scholar]
  88. Rutqvist, J.; Wu, Y.-S.; Tsang, C.-F.; Bodvarsson, G. A modeling approach for analysis of coupled multiphase fluid flow, heat transfer, and deformation in fractured porous rock. Int. J. Rock Mech. Min. Sci. 2002, 39, 429–442. [Google Scholar] [CrossRef]
  89. Settari, A.; Walters, D.A. Advances in Coupled Geomechanical and Reservoir Modeling with Applications to Reservoir Compaction. In Proceedings of the SPE Reservoir Simulation Symposium, Houston, TX, USA, 14–17 February 1999. [Google Scholar] [CrossRef]
  90. Thomas, L.K.; Katz, D.L.; Tek, M.R. Threshold Pressure Phenomena in Porous Media. Soc. Pet. Eng. J. 1968, 8, 174–184. [Google Scholar] [CrossRef]
  91. Vidal-Gilbert, S.; Nauroy, J.-F.; Brosse, E. 3D geomechanical modelling for CO2 geologic storage in the Dogger carbonates of the Paris Basin. Int. J. Greenh. Gas Control. 2009, 3, 288–299. [Google Scholar] [CrossRef]
  92. Lewis, R.W.; Sukirman, Y. Finite element modelling of three-phase flow in deforming saturated oil reservoirs. Int. J. Numer. Anal. Methods Géoméch. 1993, 17, 577–598. [Google Scholar] [CrossRef]
  93. Tortike, W.; Ali, S.F. Reservoir Simulation Integrated with Geomechanics. J. Can. Pet. Technol. 1993, 32. [Google Scholar] [CrossRef]
  94. Xikui, L.; Zienkiewicz, O. Multiphase flow in deforming porous media and finite element solutions. Comput. Struct. 1992, 45, 211–227. [Google Scholar] [CrossRef]
  95. Inoue, N.; Fontoura, S.A.B. Explicit coupling between flow and geomechanical simulators. In Proceedings of the International Con-ference on Computational Methods for Coupled Problems in Science and Engineering, Ischia Island, Italy, 8–10 June 2009. [Google Scholar]
  96. Tsang, C.-F. Linking thermal, hydrological, and mechanical processes in fractured rocks. Annu. Rev. Earth Planet. Sci. 1999, 27, 359–384. [Google Scholar] [CrossRef]
  97. Słota-Valim, K.; Szott, W.; Łetkowski, P.; Rucinski, P.; Milek, K. A coupled flow—Geomechanics study on the effectiveness of methane drainage in multi-seam coal mine with the use of long-reach directional drilling. In Proceedings of the 2022 International Pittsburgh Coal Conference, Virtual, 19–22 September 2022. [Google Scholar]
  98. Bear, J. Dynamics of Fluids in Porous Media; American Elsevier Publishing Company: New York, NY, USA, 1972; 764p, ISBN 9780444001146. [Google Scholar]
  99. Min, K.-B.; Rutqvist, J.; Tsang, C.-F.; Jing, L. Stress-dependent permeability of fractured rock masses: A numerical study. Int. J. Rock Mech. Min. Sci. 2004, 41, 1191–1210. [Google Scholar] [CrossRef]
  100. Min, K.-B.; Jing, L. Numerical determination of the equivalent elastic compliance tensor for fractured rock masses using the distinct element method. Int. J. Rock Mech. Min. Sci. 2003, 40, 795–816. [Google Scholar] [CrossRef]
  101. Min, K.-B.; Rutqvist, J.; Tsang, C.-F.; Jing, L. Thermally induced mechanical and permeability changes around a nuclear waste repository—A far-field study based on equivalent properties determined by a discrete approach. Int. J. Rock Mech. Min. Sci. 2005, 42, 765–780. [Google Scholar] [CrossRef]
  102. Ferrill, D.A.; Winterle, J.; Wittmeyer, G.; Sims, D.; Colton, S.; Armstrong, A.; Morris, A.P. Stressed Rock Strains Groundwater at Yucca Mountain, Nevada. GSA Today–A Publ. Geol. Soc. Am. 1999, 5, 1–8. [Google Scholar]
  103. Byerlee, J. Friction of rocks. Pure Appl. Geophys. 1978, 116, 615–626. [Google Scholar] [CrossRef]
  104. Ferrill, D.A.; Smart, K.J.; Morris, A.P. Resolved stress analysis, failure mode, and fault-controlled fluid conduits. Solid Earth 2020, 11, 899–908. [Google Scholar] [CrossRef]
  105. Hangx, S.; Spiers, C.; Peach, C. The mechanical behavior of anhydrite and the effect of deformation on permeability development–Implications for caprock integrity during geological storage of CO2. Energy Procedia 2011, 4, 5358–5363. [Google Scholar] [CrossRef]
  106. Labuz, J.F.; Zang, A. Mohr–Coulomb Failure Criterion. Rock Mech. Rock Eng. 2012, 45, 975–979. [Google Scholar] [CrossRef]
  107. Zhang, Y.; Langhi, L.; Schaubs, P.; Piane, C.D.; Dewhurst, D.; Stalker, L.; Michael, K. Geomechanical stability of CO2 containment at the South West Hub Western Australia: A coupled geomechanical–fluid flow modelling approach. Int. J. Greenh. Gas Control. 2015, 37, 12–23. [Google Scholar] [CrossRef]
  108. Pan, P.; Wu, Z.; Feng, X.; Yan, F. Geomechanical modeling of CO2 geological storage: A review. J. Rock Mech. Geotech. Eng. 2016, 8, 936–947. [Google Scholar] [CrossRef]
  109. Hoek, E.; Bieniawski, Z.T. Brittle fracture propagation in rock under compression. Int. J. Fract. 1965, 1, 137–155. [Google Scholar] [CrossRef]
Figure 1. Location of the study area marked with a red polygon on the map of the distribution of the paleoenvironments of main dolomite sedimentation on the tectonic sketch of Poland [67] (A). Lithological profile in the reference borehole in the zone of interest with geophysical borehole logging input data; GR—gamma ray, RHOB—rock density, vp—compressional wave velocity, vs—shear wave velocity (track 4); developed geomechanical logs of Young modulus (E), Poisson’s ratio (PR) unconfined compressive strength (UCS), and tensile strength (TENSILE) in the main dolomite reservoir (Ca2) (track 5) (B).
Energies 16 04219 g001
Figure 2. The structure of the main dolomite reservoir top with well locations (A); model division into considered zones (B); geometry of the basic model embedded with neighboring rocks for geomechanical simulations (C); distribution of reservoir thickness presented on the histogram (D).
Energies 16 04219 g002
Figure 3. Visualization of the 3D density of the reservoir and overlying rocks (A) and porosity model in the Ca2 reservoir rock in the fracture vicinity (B).
Energies 16 04219 g003
Figure 4. The distribution of average geomechanical properties in the main dolomite reservoir Ca2—Young modulus (A), Poisson’s ratio (B), and unconfined compressive strength (C) with the cross-section of these properties (Young modulus (D), Poisson’s ratio (E), UCS (F)) in the vicinity of the fracture.
Energies 16 04219 g004
Figure 5. Visualization of the fracture zone location on the background of Young modulus distribution in the main dolomite (Ca2) reservoir rock (A) with a focus on the fracture zone (B) with a detected increase in permeability based on the well-log data (C).
Energies 16 04219 g005
Figure 6. The applied procedure of dynamical and geomechanical model coupling.
Energies 16 04219 g006
Figure 7. Local correlations of effective normal stress changes vs. pore pressure in the fracture zone of A-11H well. (A) Changes for specific time steps. (B) Changes for identified layers in the fracture zone.
Energies 16 04219 g007
Figure 8. Relationship between maximum shear dilation tendency and normal opening tendency with associated rock failures and volume changes (modified after [104]). Evolution of the modeled fracture zone properties.
Energies 16 04219 g008
Figure 9. Local variations in fracture equivalent permeability vs. time, permeability grouped for reservoir flow model layers, the fracture zone at A-11H well. Note: The curve of group no. 3 is identical with the curve of group no. 2.
Energies 16 04219 g009
Figure 10. Bottom-hole pressure evolution of A-2K well.
Energies 16 04219 g010
Figure 11. Gas–oil ratio measurements vs. simulation results for A-2K well.
Energies 16 04219 g011
Figure 12. Bottom-hole pressure measurements vs. simulation results for A-11H well. Impact of the geomechanical effects upon the bottom-hole pressure—coupled vs. uncoupled models.
Energies 16 04219 g012
Figure 13. Gas–oil ratio measurements vs. simulation results for A-11H well. Impact of the geomechanical effects upon the bottom-hole pressure—coupled vs. uncoupled models.
Energies 16 04219 g013
Figure 14. Variation in the number of producing and injecting wells with time. Scenarios 3 and 4.
Energies 16 04219 g014
Figure 15. Variation in the number of producing and injecting wells with time. Scenarios 5 and 6.
Energies 16 04219 g015
Figure 16. Variation in the number of producing and injecting wells with time. Scenarios 7 and 8.
Energies 16 04219 g016
Figure 17. Variation in the number of producing and injecting wells with time. Scenarios 1 and 2.
Energies 16 04219 g017
Figure 18. Comparison of basic Scenarios 1 and 2 (see Table 6 for detailed descriptions of the scenarios). Oil production total, oil production rate, and average reservoir pressure.
Energies 16 04219 g018
Figure 19. Comparison of EOR Scenarios 3 and 4 (see Table 6 for detailed descriptions of the scenarios). Oil production total, oil production rate, gas injection total, gas injection rate, and average reservoir pressure.
Energies 16 04219 g019
Figure 20. Comparison of EOR Scenarios 5 and 6 (see Table 6 for detailed descriptions of the scenarios). Oil production total, oil production rate, gas injection total, gas injection rate, and average reservoir pressure.
Energies 16 04219 g020
Figure 21. Comparison of EOR Scenarios 7 and 8 (see Table 6 for detailed descriptions of the scenarios). Oil production total, oil production rate, gas injection total, gas injection rate, and average reservoir pressure.
Energies 16 04219 g021
Figure 22. Comparison of basic Scenarios 1 and 2 (see Table 6 for detailed descriptions of the scenarios). Oil production total, oil production rate, and bottom-hole pressure of A-11H well.
Energies 16 04219 g022
Figure 23. Comparison of EOR Scenarios 3 and 4 (see Table 6 for detailed descriptions of the scenarios). Oil production total, oil production rate, gas injection total, gas injection rate, and bottom-hole pressure of A-11H well.
Energies 16 04219 g023
Figure 24. Comparison of EOR Scenarios 5 and 6 (see Table 6 for detailed descriptions of the scenarios). Oil production total, oil production rate, gas injection total, gas injection rate, and bottom-hole pressure of A-11H well.
Energies 16 04219 g024
Figure 25. Comparison of EOR Scenarios 7 and 8 (see Table 6 for detailed descriptions of the scenarios). Oil production total, oil production rate, gas injection total, gas injection rate, and bottom-hole pressure of A-11H well.
Energies 16 04219 g025
Figure 26. Comparison of basic Scenarios 1 and 2 (see Table 6 for detailed descriptions of the scenarios). Oil production total and rate of the fracture zone at A-11H well, bottom-hole pressure at the fracture zone connection with A-11H well.
Energies 16 04219 g026
Figure 27. Comparison of EOR Scenarios 3 and 4 (see Table 6 for detailed descriptions of the scenarios). Oil production total and oil production rate of the fracture zone at A-11H well. CO2 injection total and CO2 injection rate of the fracture zone at A-11H well. Bottom-hole pressure at the fracture zone connection with A-11H well.
Energies 16 04219 g027
Figure 28. Comparison of EOR Scenarios 5 and 6 (see Table 6 for detailed descriptions of the scenarios). Oil production total and oil production rate of the fracture zone at A-11H well. CO2 injection total and CO2 injection rate of the fracture zone at A-11H well. Bottom-hole pressure at the fracture zone connection with A-11H well.
Energies 16 04219 g028
Figure 29. Comparison of EOR Scenarios 7 and 8 (see Table 6 for detailed descriptions of the scenarios). Oil production total and oil production rate of the fracture zone at A-11H well. CO2 injection total and CO2 injection rate of the fracture zone at A-11H well. Bottom-hole pressure at the fracture zone connection with A-11H well.
Energies 16 04219 g029
Figure 30. Fracture zone contribution to total A11-H well production/injection vs. various fracture zone widths.
Energies 16 04219 g030
Figure 31. Characterization of fracture zone and its vicinity (A) in terms of fracture propagation indicators: (B) Mohr–Coulomb diagram for the A2 basal anhydrite caprock; 3D distribution of normal effective stress (C) and normal strain (D).
Energies 16 04219 g031
Table 1. Geomechanical properties of lithological units.
Parameter (Unit)Cenozoic
(Clay, Sand, Gravel)
Cretaceous
(Clayey Shales)
Jurassic
(Sandy Shales)
Triassic
(Sandstones)
Zechstein
Rock SaltAnhydriteReservoir
Main Dolomite
Min–Max; Median
LimestoneRotliegend
(Underburden)
Porosity (%)3D model3D model3D model3D model3D model3D model0–25.8; 0.6
3D model
2.994
Density (g/cm3)3D model3D model3D model3D model3D model3D model2.21–2.96; 2.65 3D model2.752.3
Poisson ratio (-)0.30.320.190.170.30.250.12–0.4; 0.21 3D model0.180.3
Young’s modulus (GPa)0.545.5628.56.8952.693.2–52.7; 29.1 3D model42.0646.19
Rock strength UCS (bar)28480569.8507273.3903181.4–1861.5; 1120.6
3D model
149.3500
Friction angle (°)3032205929.086428.622.830
Biot constant (-)111100.100.70.81
Dilatation angle (°)000000000
Table 2. Fracture zone dimensions and geological initial parameters.
Dimension x, dx (m)5
Dimension y, dy (m)500
Dimension z, dz (m)33–45
Permeability x, kfx (mD)0.5–450
Permeability y, kfy (mD)700
Permeability z, kfz (mD)700
Porosity, ϕf (%)0.1
Table 3. The discontinuity zone properties assumed in the model (Petrel Reservoir Geomechanics software manual, 2013).
Fracture normal stiffness (bar/m)22,620
Fracture shear stiffness (bar/m)9048
Cohesion (bar)0.01
Friction angle (°)20
Dilation angle (°)10
Tensile strength (bar)0.01
Fracture spacing (m)0.5
Initial opening (-)0
Table 4. Calibration results of relative permeability curve parameters.
PhaseParameterInitial ValueValue after Calibration
waternw22
waterSw,min (=Srw)0.10.0528
waterSw,max11
oil (oil–water system)no22
oil (oil–water system)So,min0.40.4917
oil (oil–water system)So,max1.00.9964
oil (oil–gas system)no22
oil (oil–gas system)So,min1 − Sg,max1 − Sg,max
oil (oil–gas system)So,max1 − Sg,min1 − Sg,min
gasng22
gasSg,min (=Srg)0.10.1
gasSg,max10.9964
Table 5. Composition of the reservoir fluid after component grouping.
Component% mol
N231.588
CO20.612
H2S5.085
C119.353
C23.567
C3–C611.990
C7–C1112.270
C12+15.500
Table 6. Scenario list of simulation forecasts.
Scenario No.Scenario NameScenario Description
Production MethodGeomechanical
Effects
Fracture Zone Width (m/Blocks)
1Basic_w/o_geomechanics_5m_fracture_zonePrimaryDisabled5/1
2Basic_w/_geomechanics_5m_fracture_zonePrimaryEnabled5/1
3EOR_w/o_geomechanics_5m_fracture_zoneEOR with CO2 injection *Disabled5/1
4EOR_w/_geomechanics_5m_fracture_zoneEOR with CO2 injection *Enabled5/1
5EOR_w/o_geomechanics_18m_fracture_zoneEOR with CO2 injection *Disabled18/3
6EOR_w/_geomechanics_18m_fracture_zoneEOR with CO2 injection *Enabled18/3
7EOR_w/o_geomechanics_65m_fracture_zoneEOR with CO2 injection *Disabled65/5
8EOR_w/_geomechanics_65m_fracture_zoneEOR with CO2 injection *Enabled65/5
* followed by CO2 sequestration.
Disclaimer/Publisher’s Note: The statements, opinions and data contained in all publications are solely those of the individual author(s) and contributor(s) and not of MDPI and/or the editor(s). MDPI and/or the editor(s) disclaim responsibility for any injury to people or property resulting from any ideas, methods, instructions or products referred to in the content.

