Article

Microseismic Monitoring at the Farnsworth CO2-EOR Field

1
Los Alamos National Laboratory, Los Alamos, NM 87545, USA
2
Tom Bratton LLC, Littleton, CO 80127, USA
3
New Mexico Institute of Mining and Technology, Socorro, NM 87801, USA
4
Department of Earth and Atmospheric Sciences, University of Houston, Houston, TX 77004, USA
5
Energy and Geoscience Institute, University of Utah, Salt Lake City, UT 84112, USA
*
Authors to whom correspondence should be addressed.
Energies 2023, 16(10), 4177; https://doi.org/10.3390/en16104177
Submission received: 20 March 2023 / Revised: 2 May 2023 / Accepted: 16 May 2023 / Published: 18 May 2023
(This article belongs to the Special Issue Forecasting CO2 Sequestration with Enhanced Oil Recovery II)

Abstract

:
The Farnsworth Unit in northern Texas is a field site for studying geologic carbon storage during enhanced oil recovery (EOR) using CO 2 . Microseismic monitoring is essential for risk assessment by detecting fluid leakage and fractures. We analyzed borehole microseismic data acquired during CO 2 injection and migration, including data denoising, event detection, event location, magnitude estimation, moment tensor inversion, and stress field inversion. We detected and located two shallow clusters, which occurred during increasing injection pressure. The two shallow clusters were also featured by large b values and tensile cracking moment tensors that are obtained based on a newly developed moment tensor inversion method using single-borehole data. The inverted stress fields at the two clusters showed large deviations from the regional stress field. The results provide evidence for microseismic responses to CO 2 /fluid injection and migration.

1. Introduction

The Southwest Regional Partnership on Carbon Sequestration (SWP) is one of seven regional partnerships established in 2003 by the U.S. Department of Energy (DOE) to study carbon management strategies. The SWP is conducting Phase III field demonstrations in northern Texas using carbon dioxide (CO 2 ) for enhanced oil recovery (EOR) within the Farnsworth Unit (FWU) in Ochiltree County, Texas. The CO 2 -EOR project injects CO 2 from 100% anthropogenic CO 2 sources from the Arkalon Ethanol Plant in Kansas and the Agrium Fertilizer Plant in Texas. The primary goals of the project are examining the option of geologic carbon storage during CO 2 -EOR, quantifying storage capacity, and optimizing the balance between enhanced oil recovery and CO 2 storage [1].
In geologic carbon storage projects, the reservoir is subject to an increased pore pressure regime because of continuous CO 2 injection, which increases the potential of reactivating faults or fracture zones in the underlying crystalline basement. Monitoring for induced microseismicity is essential to map the pressure front, detect CO 2 leakage, and avoid damage to the storage facility or surface infrastructures, particularly when no seismically resolvable faults can be mapped on 2D/3D seismic data [2]. Microseismicity has been recorded at multiple CO 2 injection sites. For example, at the Weyburn Field in Saskatchewan, Canada, approximately 100 microseismic events with magnitudes ranging from −3 to −1 were recorded during five years of monitoring, and event occurrence seemed to be associated with injection or production rate changes [3]. At the Aneth CO 2 -EOR field in Utah, 3800 microearthquakes were detected, and the magnitude ranged from −1 to 1. These events correlated with fracture zones on opposite flanks of the reservoir but not with CO 2 injection or production activities [4,5]. At the In Salah Carbon Capture and Storage site, over 9000 events were recorded with a maximum magnitude of 1.7, and the microseismicity occurrences correlated well with the CO 2 injection rate [6].
Microseismic monitoring can effectively help evaluate potential geological risks through delineating fracture propagation and monitoring reservoir deformation and fluid migration during CO 2 injection. In this paper, we analyzed the microseismic data recorded at the Farnsworth CO 2 -EOR field and examined the relationship between induced microseismicity and injection activities. We first detected and located microseismic events to map the activated fracture planes during fluid injection. Then, we inverted moment tensors to study the fracturing mechanisms of the microseismic events. Furthermore, we examined the stress field perturbations accompanying injection. In the following sections, we first introduce the data and processing methodology used in this study. Then, we present our main results from the event locations, moment tensors, and the inverted stress field. Finally, we compare the microseismic events with the injection rate and pressure to better understand the subsurface fracturing process during CO 2 injection and migration at the Farnsworth CO 2 -EOR field.

2. Data

At the Farnsworth field, we have one vertical borehole (Figure 1) to monitor induced microseismicity during CO 2 injection and migration. The well is located in the middle of the project study area. The borehole geophone array consists of 16 three-component (3C) receivers at depths from 1345 to 1795 m with a vertical spacing of 30 m. In this paper, we analyzed continuously recorded borehole microseismic data from August 2019 to February 2022.
The project also deployed 20 surface seismic stations to monitor the microseismicity. Compared to borehole monitoring, the surface stations cover a larger aperture of the study area (about 3 by 3 km 2 ). However, the signals recorded by these surface seismic stations are much noisier than borehole data, and the data are not completely continuous. We only observed clear phase arrivals for a few regional events, where the time difference between S and P phase arrivals was larger than one second. Since we are mainly interested in the local events within the CO 2 injection area, only borehole data were used in our analysis.

3. Methodology

3.1. Geophone Orientation Calibration

Inside the vertical borehole, the horizontal channels of the geophones are misoriented; that is, the two horizontal components are not aligned in the north and east direction. Following the methods from Gaiser et al. [7] and DiSiena and Gaiser [8], we used the offset vertical seismic profiling (VSP) check shots with known source locations to calculate the rotation angles. As shown in Figure 2a, we first rotated the two horizontal components H 1 and H 2 to the radial (maximum P wave amplitude) and transverse directions, and the rotation angle was θ . Since the azimuth of the radial direction ( ϕ ) was known for a check shot, we calculated the azimuth of the horizontal channels as follows:
A Z H 1 = ϕ + ( 180 θ ) ,
where ϕ is the azimuth of test shot to receiver and θ is the rotation angle to rotate H 1 to the radial direction. Figure 2b shows the computed rotation angles of the first horizontal components ( H 1 ) for each geophone. The rotation angles were randomly distributed, which makes the rotation correction essential for the following analyses of borehole microseismic data. After correcting the geophone orientations, we also removed the instrument response from the waveform to convert the recorded digital counts to physical displacement.

3.2. Event Detection

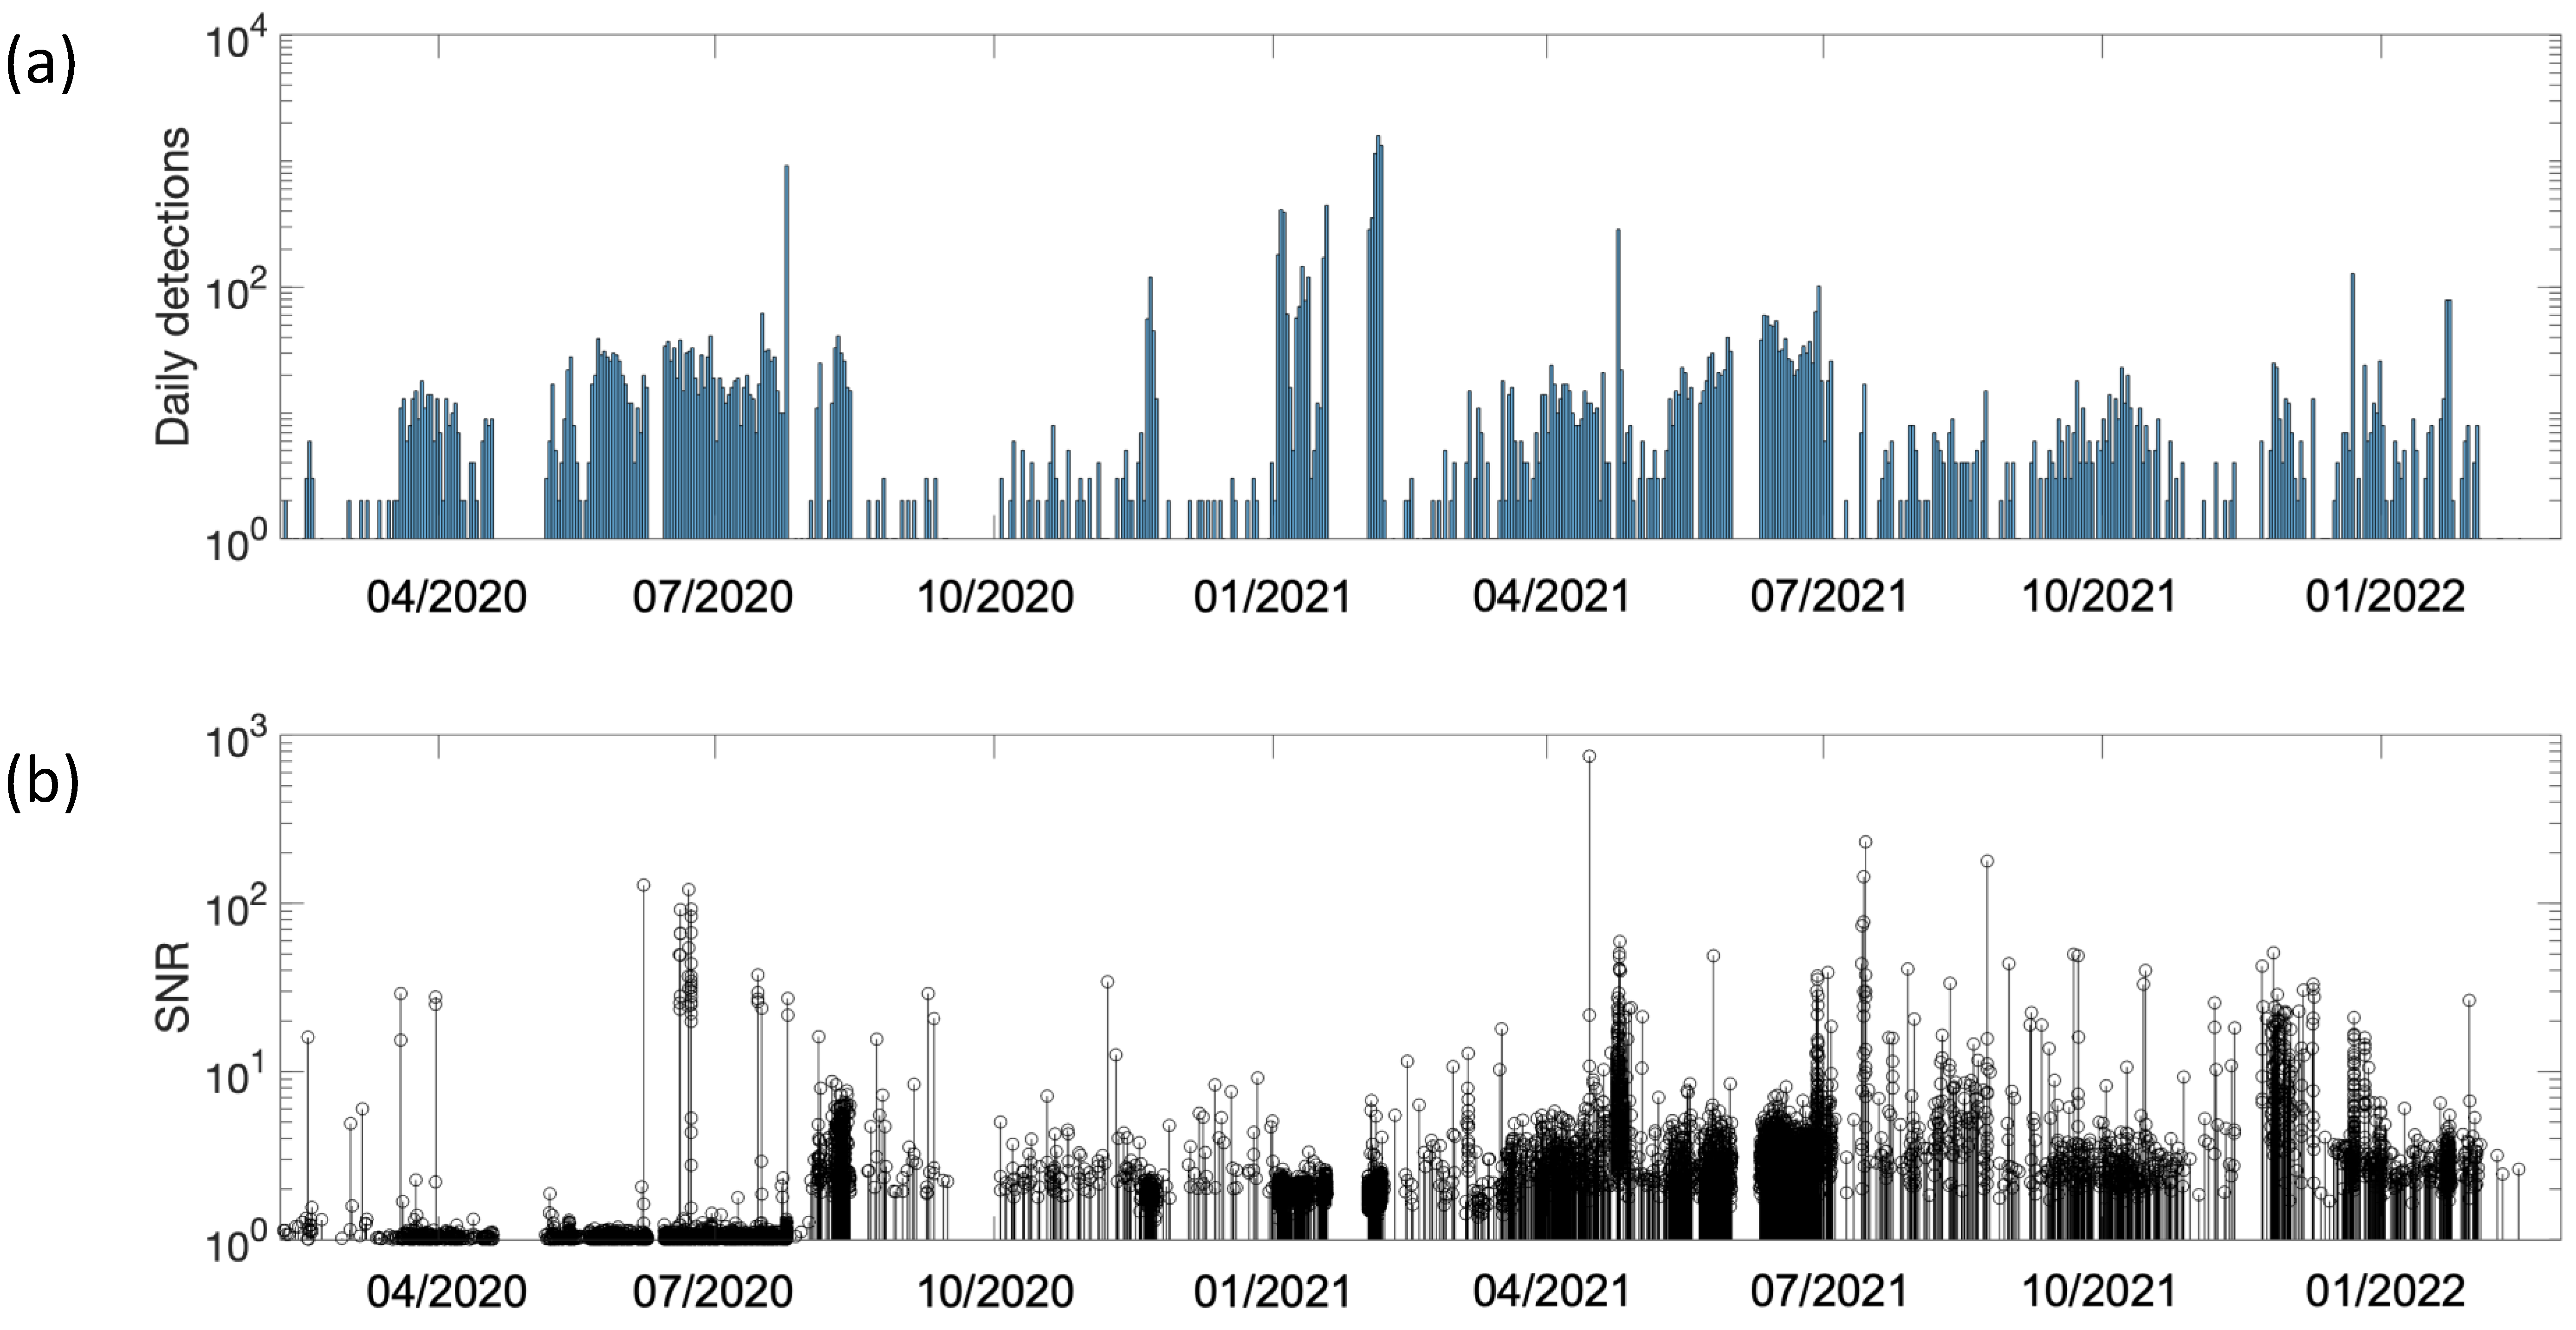
We examined the spectrograms of the waveform data and found signals in two different frequency ranges: 5 to 50 Hz and 150 to 350 Hz. For each frequency range, we applied bandpass filtering to the continuously recorded borehole microseismic data and used the short-term average/long-term average (STA/LTA) method [9] to automatically detect microseismic events on the continuous waveforms. For low-frequency signals, we used 0.1 s and 2 s for short- and long-term windows, respectively, and we detected 13,398 events from August 2019 to February 2022. Figure 3 shows all the detections from 2020 to 2022 with their signal-to-noise ratios (SNRs). Of all the detected events, we removed the borehole events that had apparent velocities around 1500 m/s and selected 932 events with SNRs larger than 2.0 for event location. For high-frequency signals, since it is difficult to obtain the accurate location and moment tensors, we only ran detection for a short period of time, from July 2019 to February 2020, and detected 278 events.

3.3. Waveform Denoising

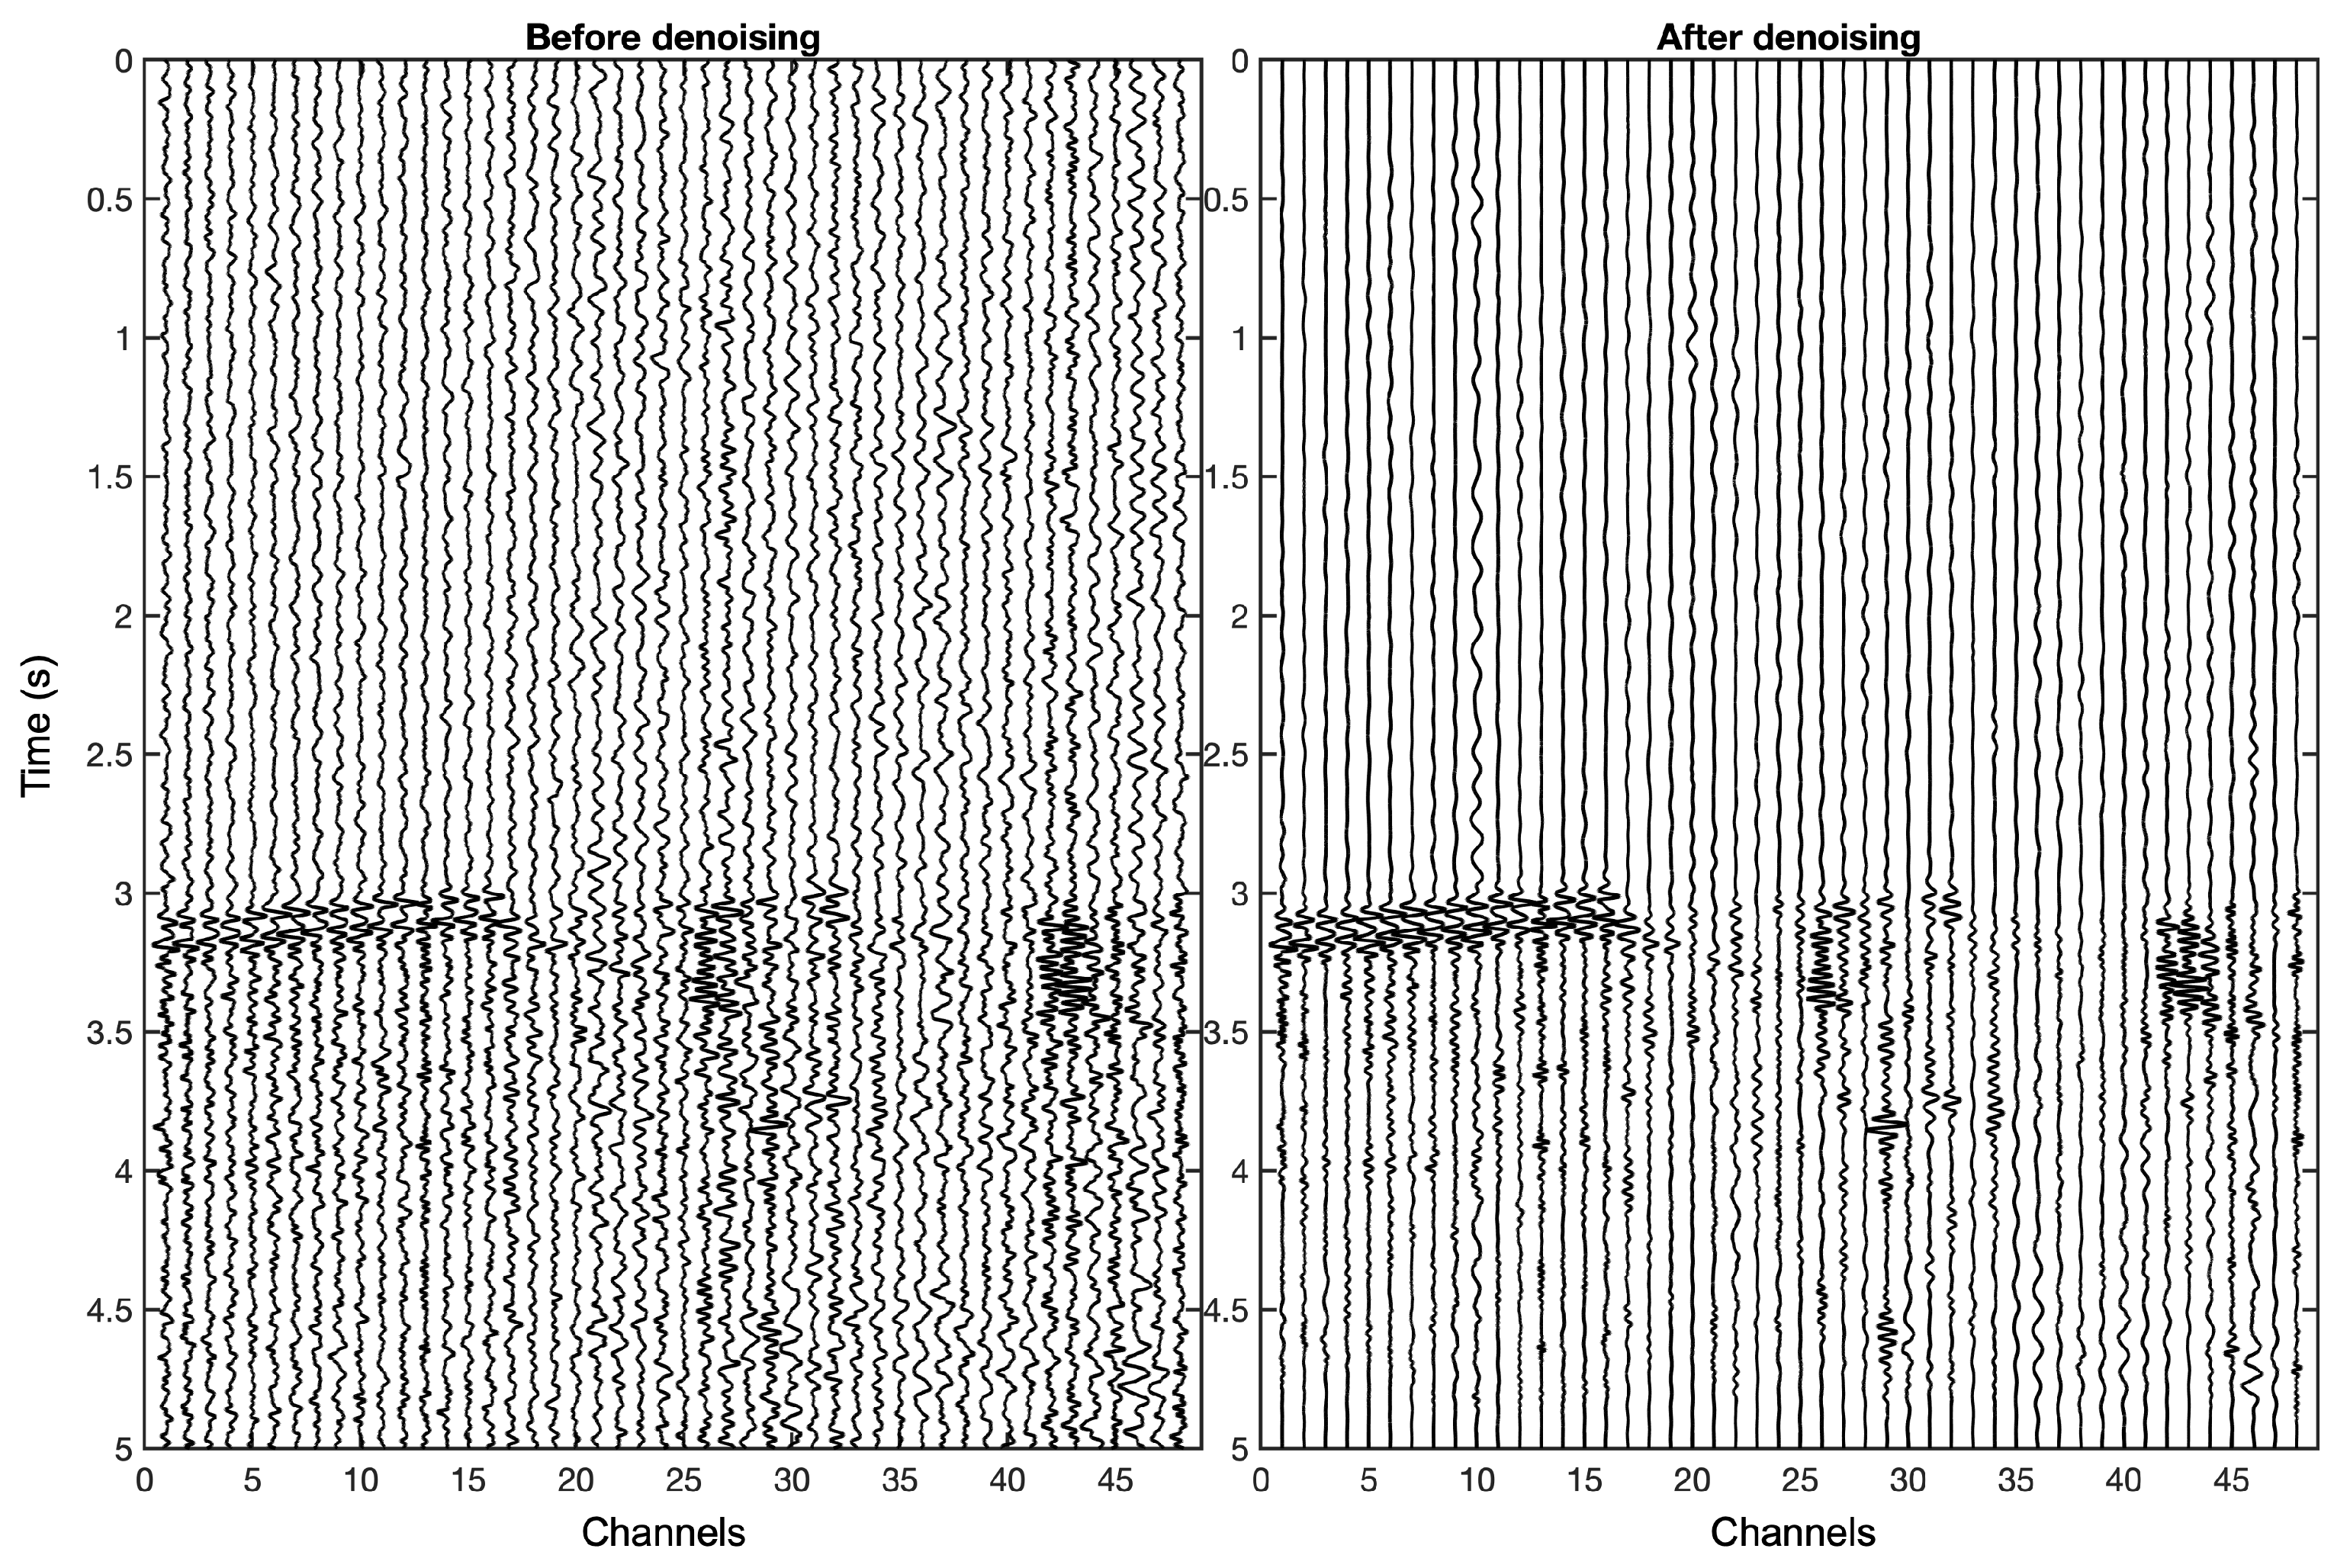
To improve the SNRs of the detected events, we applied a denoising algorithm [10] to the microseismic data. The denoising algorithm is based on synchrosqueezed continuous wavelet transform (SS-CWT) and the custom thresholding of single-channel data. The SS-CWT allows for adaptive filtering for frequency-varying noise and offers improvement in resolution over the conventional wavelet transform. The method has been successfully applied to field microseismic data and has proven to be effective in enhancing SNRs [10]. Figure 4 shows an example of waveform comparison before and after denoising for our borehole microseismic data. The result shows that the algorithm successfully removed the background noise and kept the signal. We applied the algorithm to all detected events and compared the SNRs in Figure 5. The median SNR for denoised waveform was improved from 2.5 to 8.

3.4. Event Location

After waveform denoising, we used 2D Kirchhoff migration [11] to locate the microseismic events. First, we computed a traveltime table using the resulting velocity models from an elastic waveform inversion (EWI) of the 3D VSP data. Then, based on the computed traveltime table, the microseismic waveforms were migrated and stacked for different event locations and origin times. The mesh point with the maximum value of the stacked image is the location of the microseismic event. The method does not require explicit phase picks and works well for borehole microseismic data.
Since we have only one vertical borehole array, we can only determine the event location in the 2D plane (depth and offset). Next, we performed hodogram analysis of three-component microseismic data to determine the event azimuth, where we cross-plotted the waveform of two horizontal channels and the slope of the cross-plot represented the azimuth of ray path [12]. For a homogeneous layered model, the receivers in the vertical well should have the same azimuth angle for one event. We took the average value of the azimuth angle of 16 receivers as the azimuth of an event. Finally, based on the 2D location and azimuth angle, we calculated the 3D locations for all microseismic events.

3.5. Magnitude Estimation

To estimate the moment magnitude of the located microseismic events, we first removed the effect of radiation pattern and geometric spreading [13] from the microseismic waveform. Then, we computed the source spectrum using Fourier transform and searched for the scalar seismic moment ( M 0 ) and the corner frequency by least-square fitting the source spectrum to Brune’s model [14]. The moment magnitude ( M w ) was then calculated using [15]
M w = 2 3 l o g 10 ( M 0 ) 6.07 .
Based on the magnitude, we calculated the b value and magnitude of completeness using the maximum likelihood estimator [16] in the seismicity analyzing package ZMAP [17].

3.6. Moment Tensor Inversion

For conventional full-waveform moment tensor inversion of microseismic events, studies have shown that, generally, two or three wells are required to provide better azimuth coverage and obtain reliable results [18,19,20]. We developed a novel full-waveform inversion method [21] to jointly invert for the origin time and moment tensors of the microseismic events using single-borehole microseismic data, which is a very challenging problem. First, we inverted for the event origin time t 0 and moment tensor M based on a weighted, normalized deconvolution misfit function [22] to mitigate the absolute waveform matching requirement in the conventional full-waveform MT inversion, as is demonstrated in the following equation:
ζ ( t 0 , M ) = N r τ 0 τ 0 | | w ( τ ) D τ 0 ( u , d ) | | 2 | | D τ 0 ( u , d ) | | 2 d τ ,
where | | · | | is the L 2 -norm, N r is the number of geophones, w ( t ) = t is a linear weighting function that penalizes large phase shifts, and D τ 0 is the deconvolution between synthetic u ( t ) and observation data d ( t ) . Since the misfit function in Equation (3) is not sensitive to the polarity of the waveform, after the estimation of t 0 and M based on ζ , we performed a second-round inversion by minimizing the zero-lag cross-correlation between the synthetic and observed waveforms [23]:
ψ ( t 0 , M ) = N r 0 T u ( t ) d ( t ) | | u ( t ) | | | | d ( t ) | | d t .
Synthetic and field data tests have shown that the newly developed method can accurately estimate moment tensors using microseismic data recorded with a single-borehole geophone array [21].
After we obtained the full moment tensor for each event, we decomposed it into isotropic (ISO), double couple (DC), and compensated linear vector dipole (CLVD) components [24]. The DC component represents shear faulting. The CLVD component has no simply physical meaning itself, but, combined with the ISO component, it can be interpreted as tensile faulting. For a pure tensile crack, the major dipole of the CLVD component is aligned with the normal to the crack surface, and the ISO component represents the volume change associated with the opening crack [25]. We used a Hudson plot [26] to visualize the moment tensor decomposition results. In the Hudson plot, the moment tensors are projected onto a skewed diamond plane, which is separated into four quadrants by a set of orthogonal lines in the middle. On the diamond plot, the origin of the coordinates represents pure shear faulting. The margins of the diamond represent pure tensile and compressive cracks. Points along the CLVD axis correspond to faulting on non-planar faults, and points in the second and fourth quadrants of the diamond correspond to shear-tensile sources.

3.7. Stress Inversion

After obtaining the moment tensor, we used the MSATSI software package [27] to invert for local stress field. The MSATSI software is based on the inversion method from Michael [28], which minimizes the difference between the slip vector and the resolved shear stress vector on each fault plane:
G m = d ,
where G is the data kernel matrix derived from the fault normal vector of each focal mechanism, d is the slip vector of each focal mechanism, and m is the model vector of the stress tensor. The program generates the orientations of three principal stresses ( σ 1 , σ 2 , σ 3 ) and a relative stress magnitude R among σ 1 , σ 2 , σ 3 . The inversion process requires a minimum of 20 focal mechanisms at each grid point to obtain reliable results. The inversion results are then compared to the regional stress field.

4. Results

4.1. Event Location and Magnitude

4.1.1. High-Frequency Events

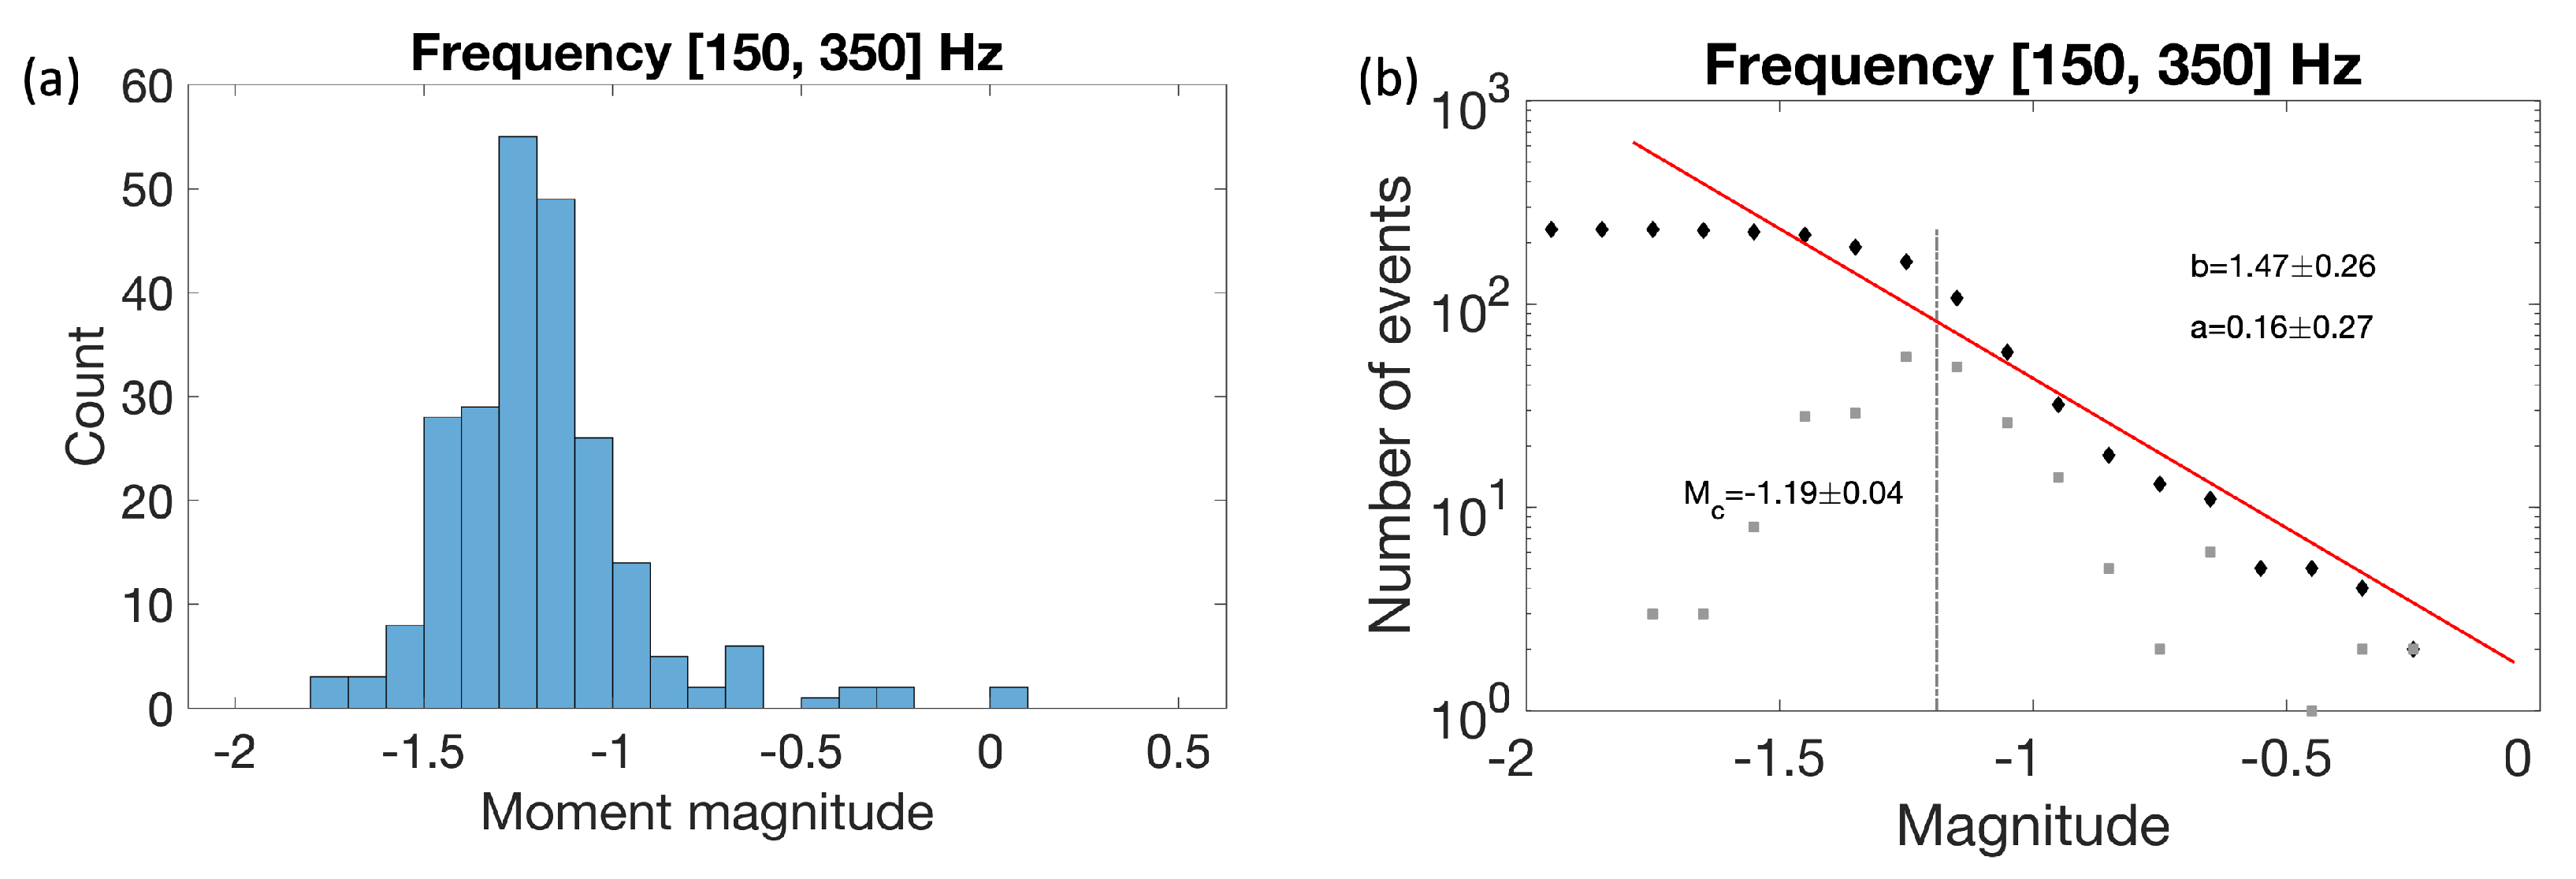
For high-frequency microseismic events, which are detected in the frequency range of [150, 350] Hz, we were only able to obtain the 2D location, because the hodogram analysis does not work well for high-frequency signals. Figure 6 shows the depth distribution of the events and comparison with the petrophysical logs. The events mainly occurred in the horizontal transverse isotropic (HTI) layer (4400–4600 ft in depth). It is possible that the vertical fractures in the HTI layer were reactivated during injection. Figure 7 shows the magnitude distribution for the high-frequency events. Most events had magnitudes from −1.5 to 0.5. The b value and the magnitude of completeness were 1.47 and −1.2, respectively.

4.1.2. Low-Frequency Events

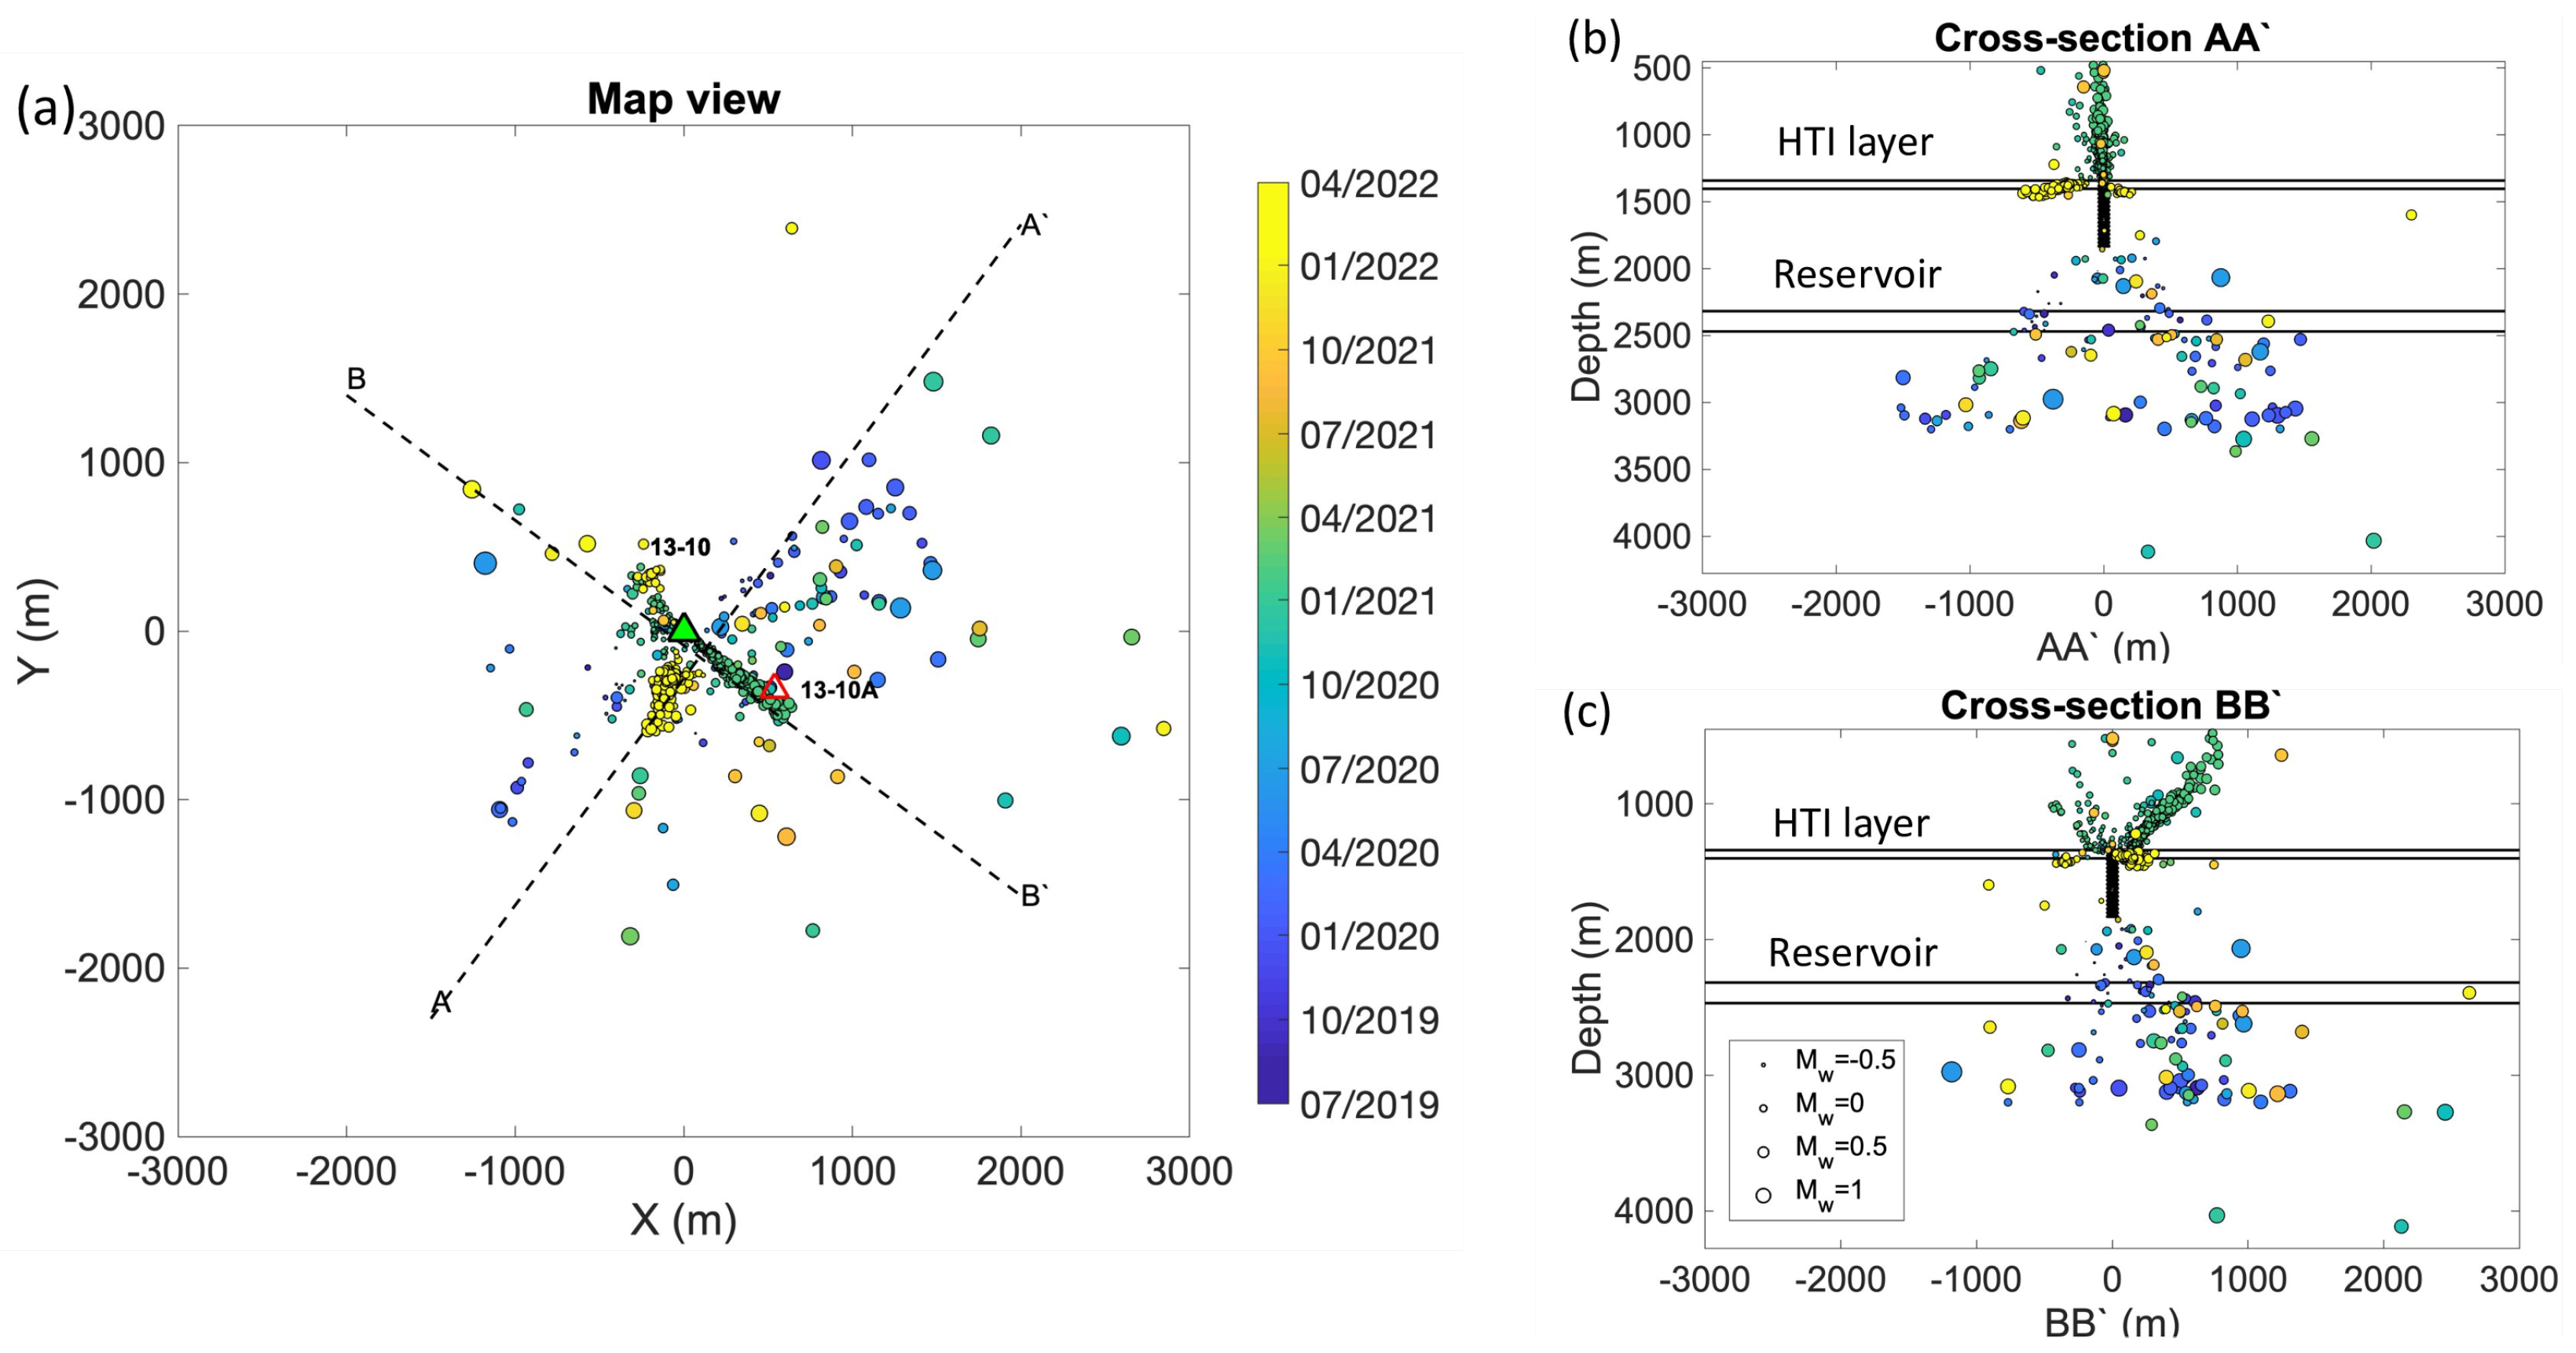
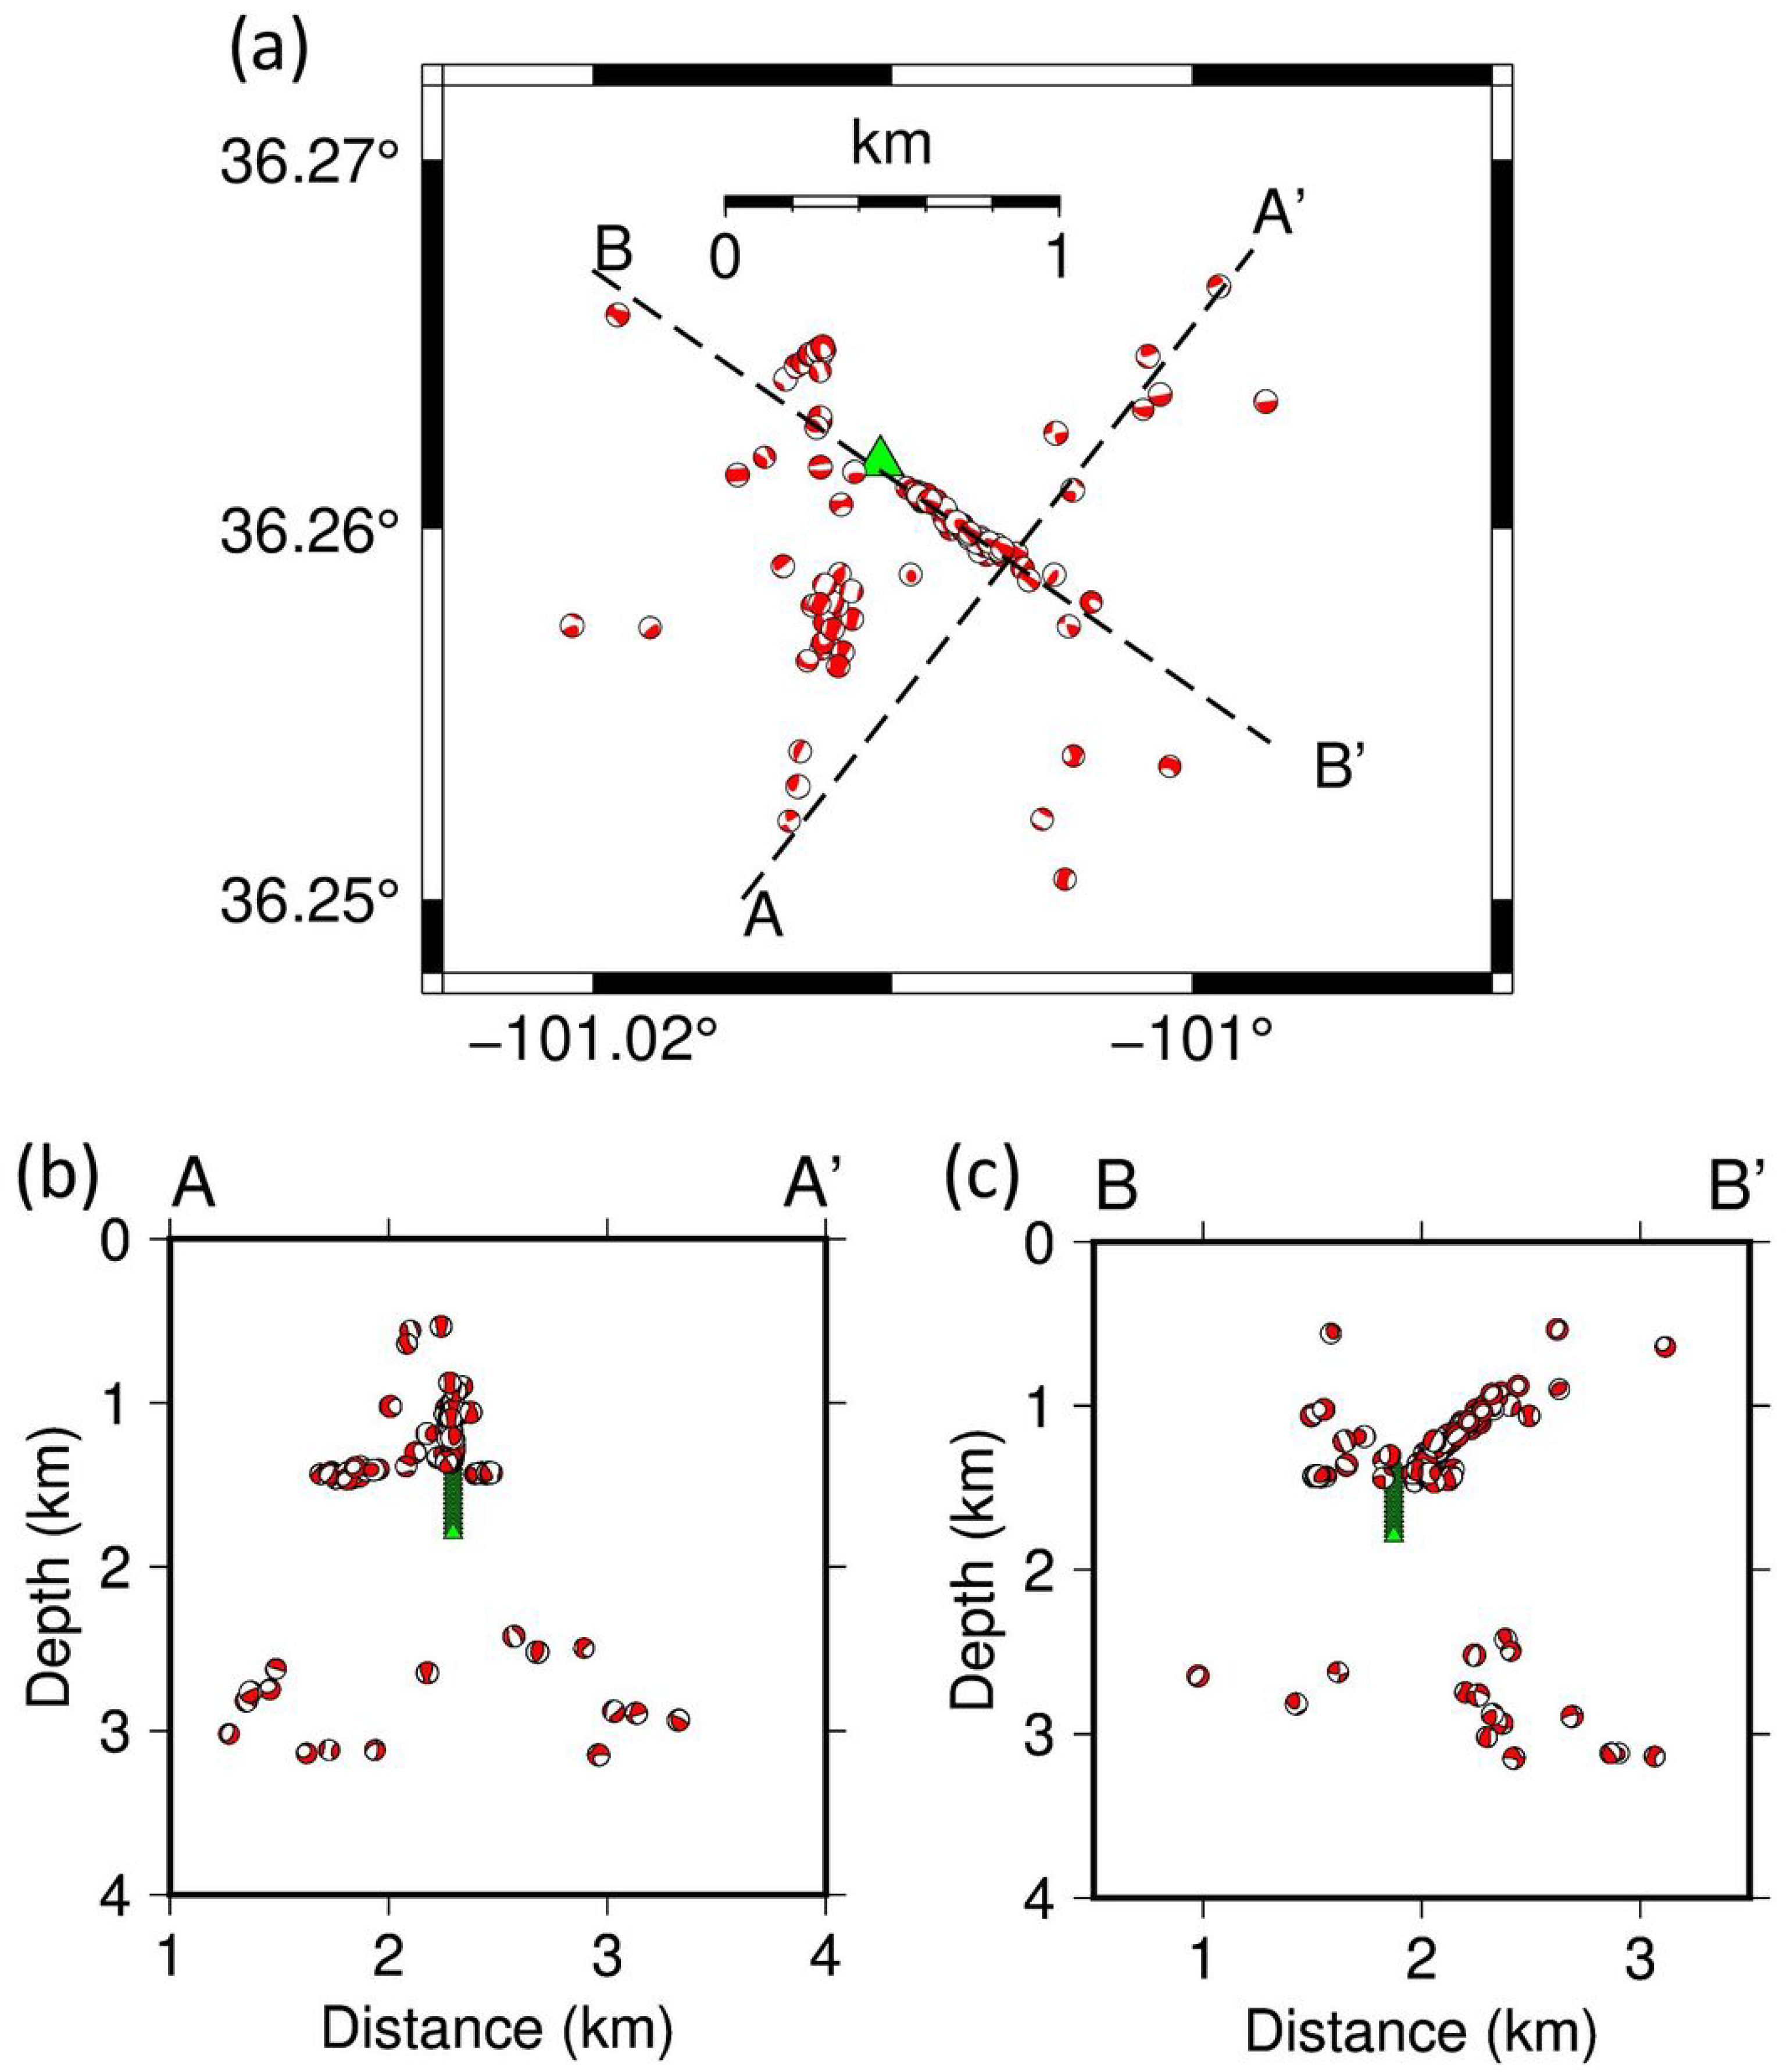
Figure 8 shows the location results for low-frequency microseismic events (5–50 Hz). We observed two shallow clusters, which were activated in February 2021 and in January 2022. The first cluster depicts a NW trending subvertical (azimuth −57°, dip angle 83°) fault plane. The events were mainly distributed on the path from injection well 13-10A to the monitoring well. The second cluster in January 2022 was oriented in the NS direction and formed a horizontal plane. Similar to the high-frequency events, the depth of the events was consistent with the HTI layer. At deeper depths (>2000 m), the events were scattered and had larger magnitudes than shallow events. The diffusion migration pattern was not evident, and only a few events occurred in the Morrow B reservoir.
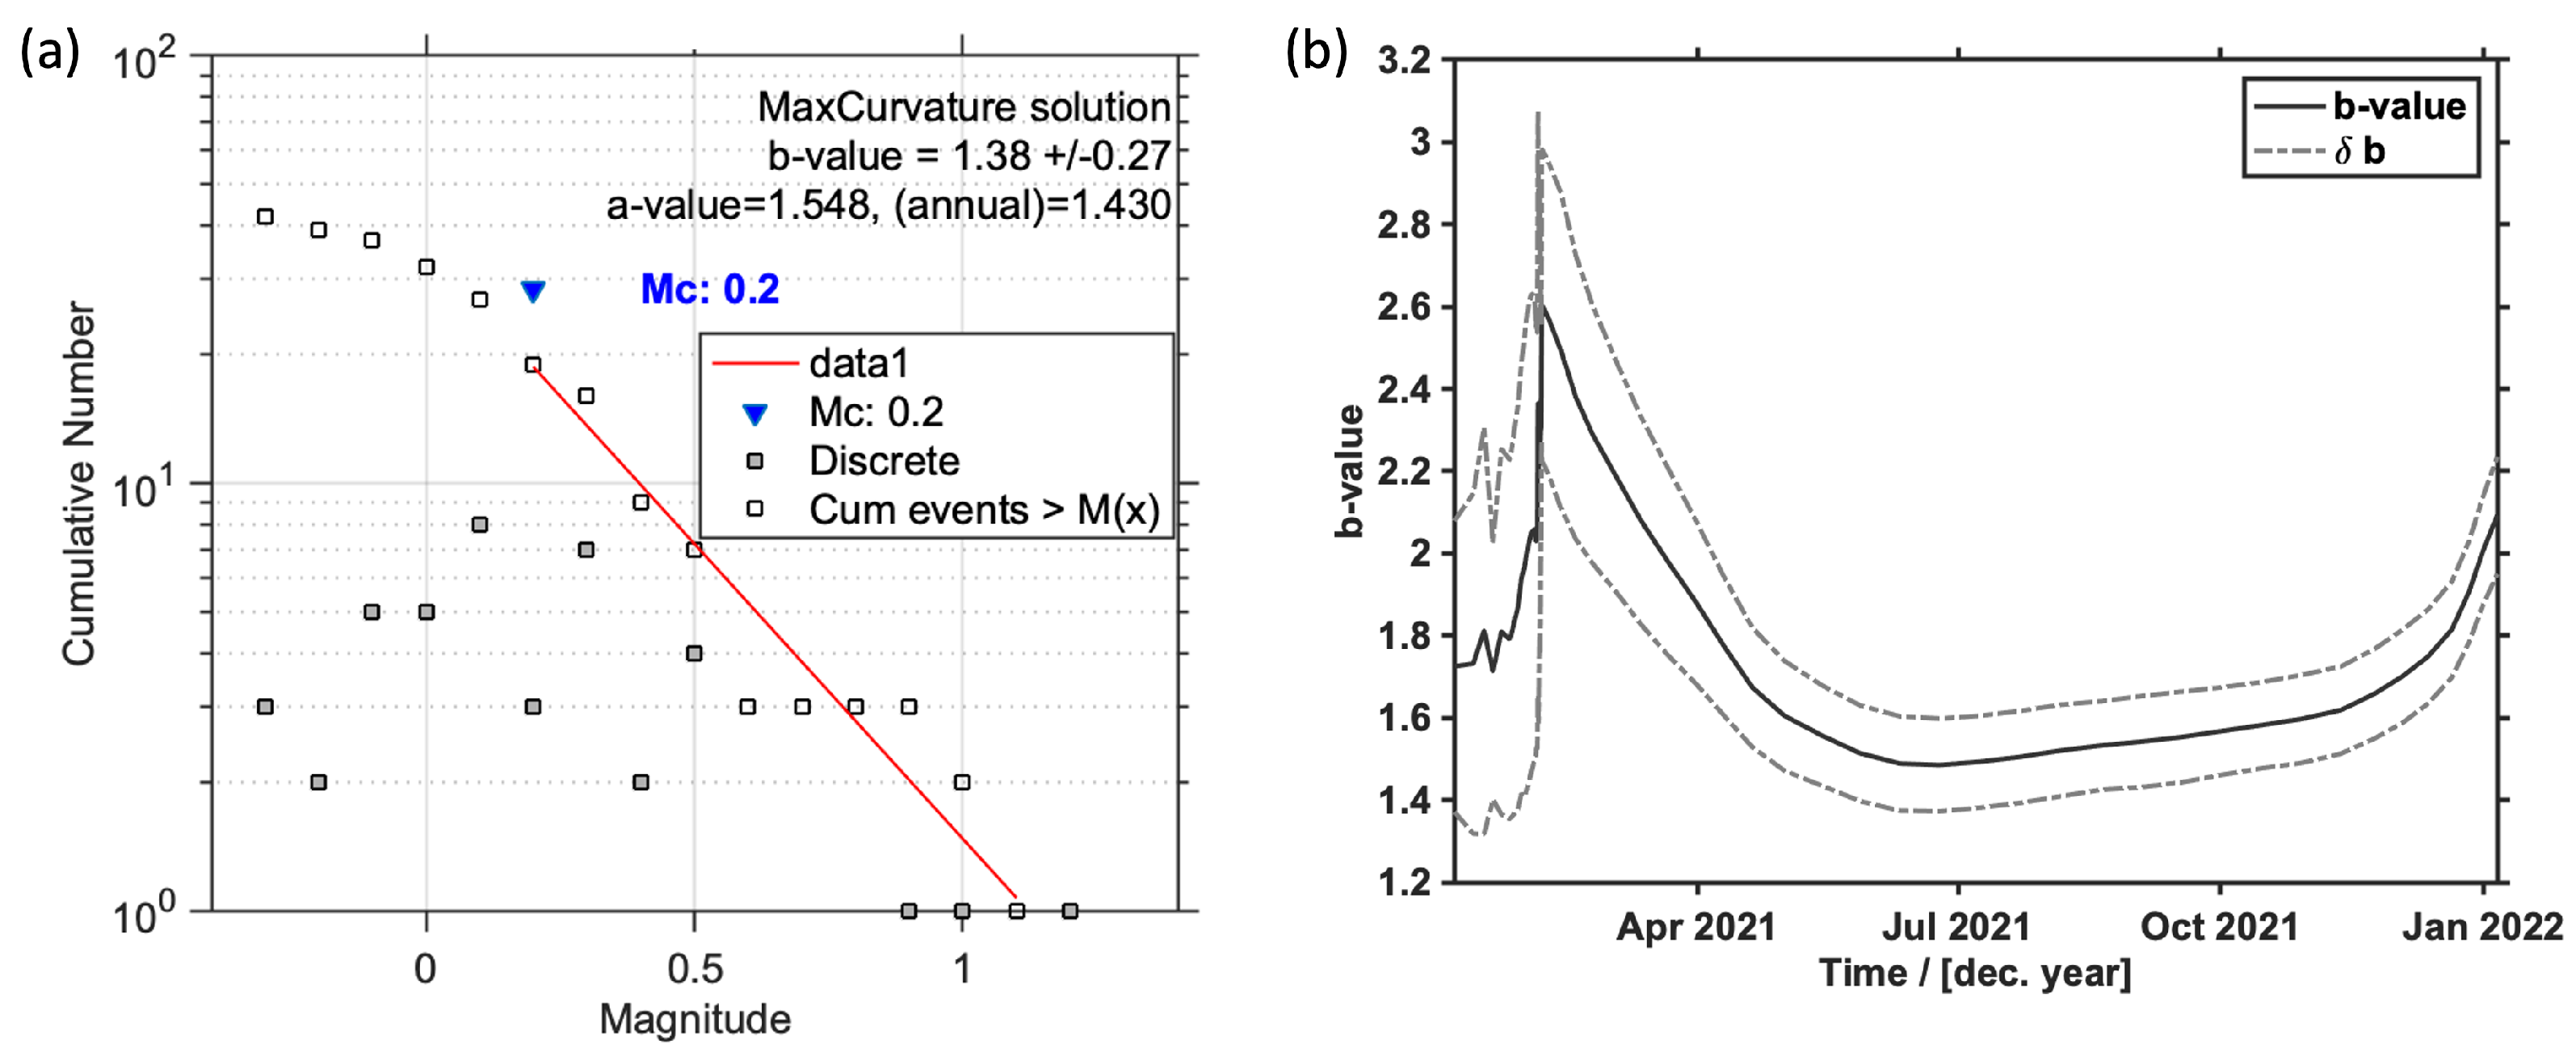
Figure 9 shows the magnitude distribution for low-frequency microseismic events (5–50 Hz). The majority of the low-frequency events were within the magnitude range of [−1, 0.5]. The estimated b value was 2.07, and the magnitude of completeness was 0.33. Compared to high-frequency events, the magnitudes of low-frequency events were slightly larger, and b values were much higher. To explore the spatial variations of the b values, we separated the shallow and deep microseismicity at a depth of 2000 m. For deeper events, the b value was 1.38, and the magnitude of completeness was 0.2 (Figure 10a). Since more events existed at shallow depths (<2000 m), we computed the b value variations over time. The results show that the two temporal clusters in February 2021 and January 2022 had b values significantly larger than 1.0 (Figure 10b), thus suggesting the influence of injection on the microseismicity [29,30].

4.2. Moment Tensors

Using the method from Gao et al. [21], we were able to compute the moment tensors for 125 microseismic events using single-borehole data. As shown in Figure 11, the events at deeper depths (>2000 m) showed a variety of mechanisms. Within the two shallow clusters, the moment tensors were similar to one another. The inverted full moment tensors were decomposed into isotropic (ISO), double couple (DC), and compensated linear vector dipole (CLVD) components. As shown on the Hudson plot in Figure 12, moment tensors at deeper depths were mainly shear slip events, which were possibly induced by reactivating existing fractures. Moment tensors at shallow depths had a larger CLVD and ISO component, thus suggesting fracture opening and closing under injection.

4.3. Stress Inversion

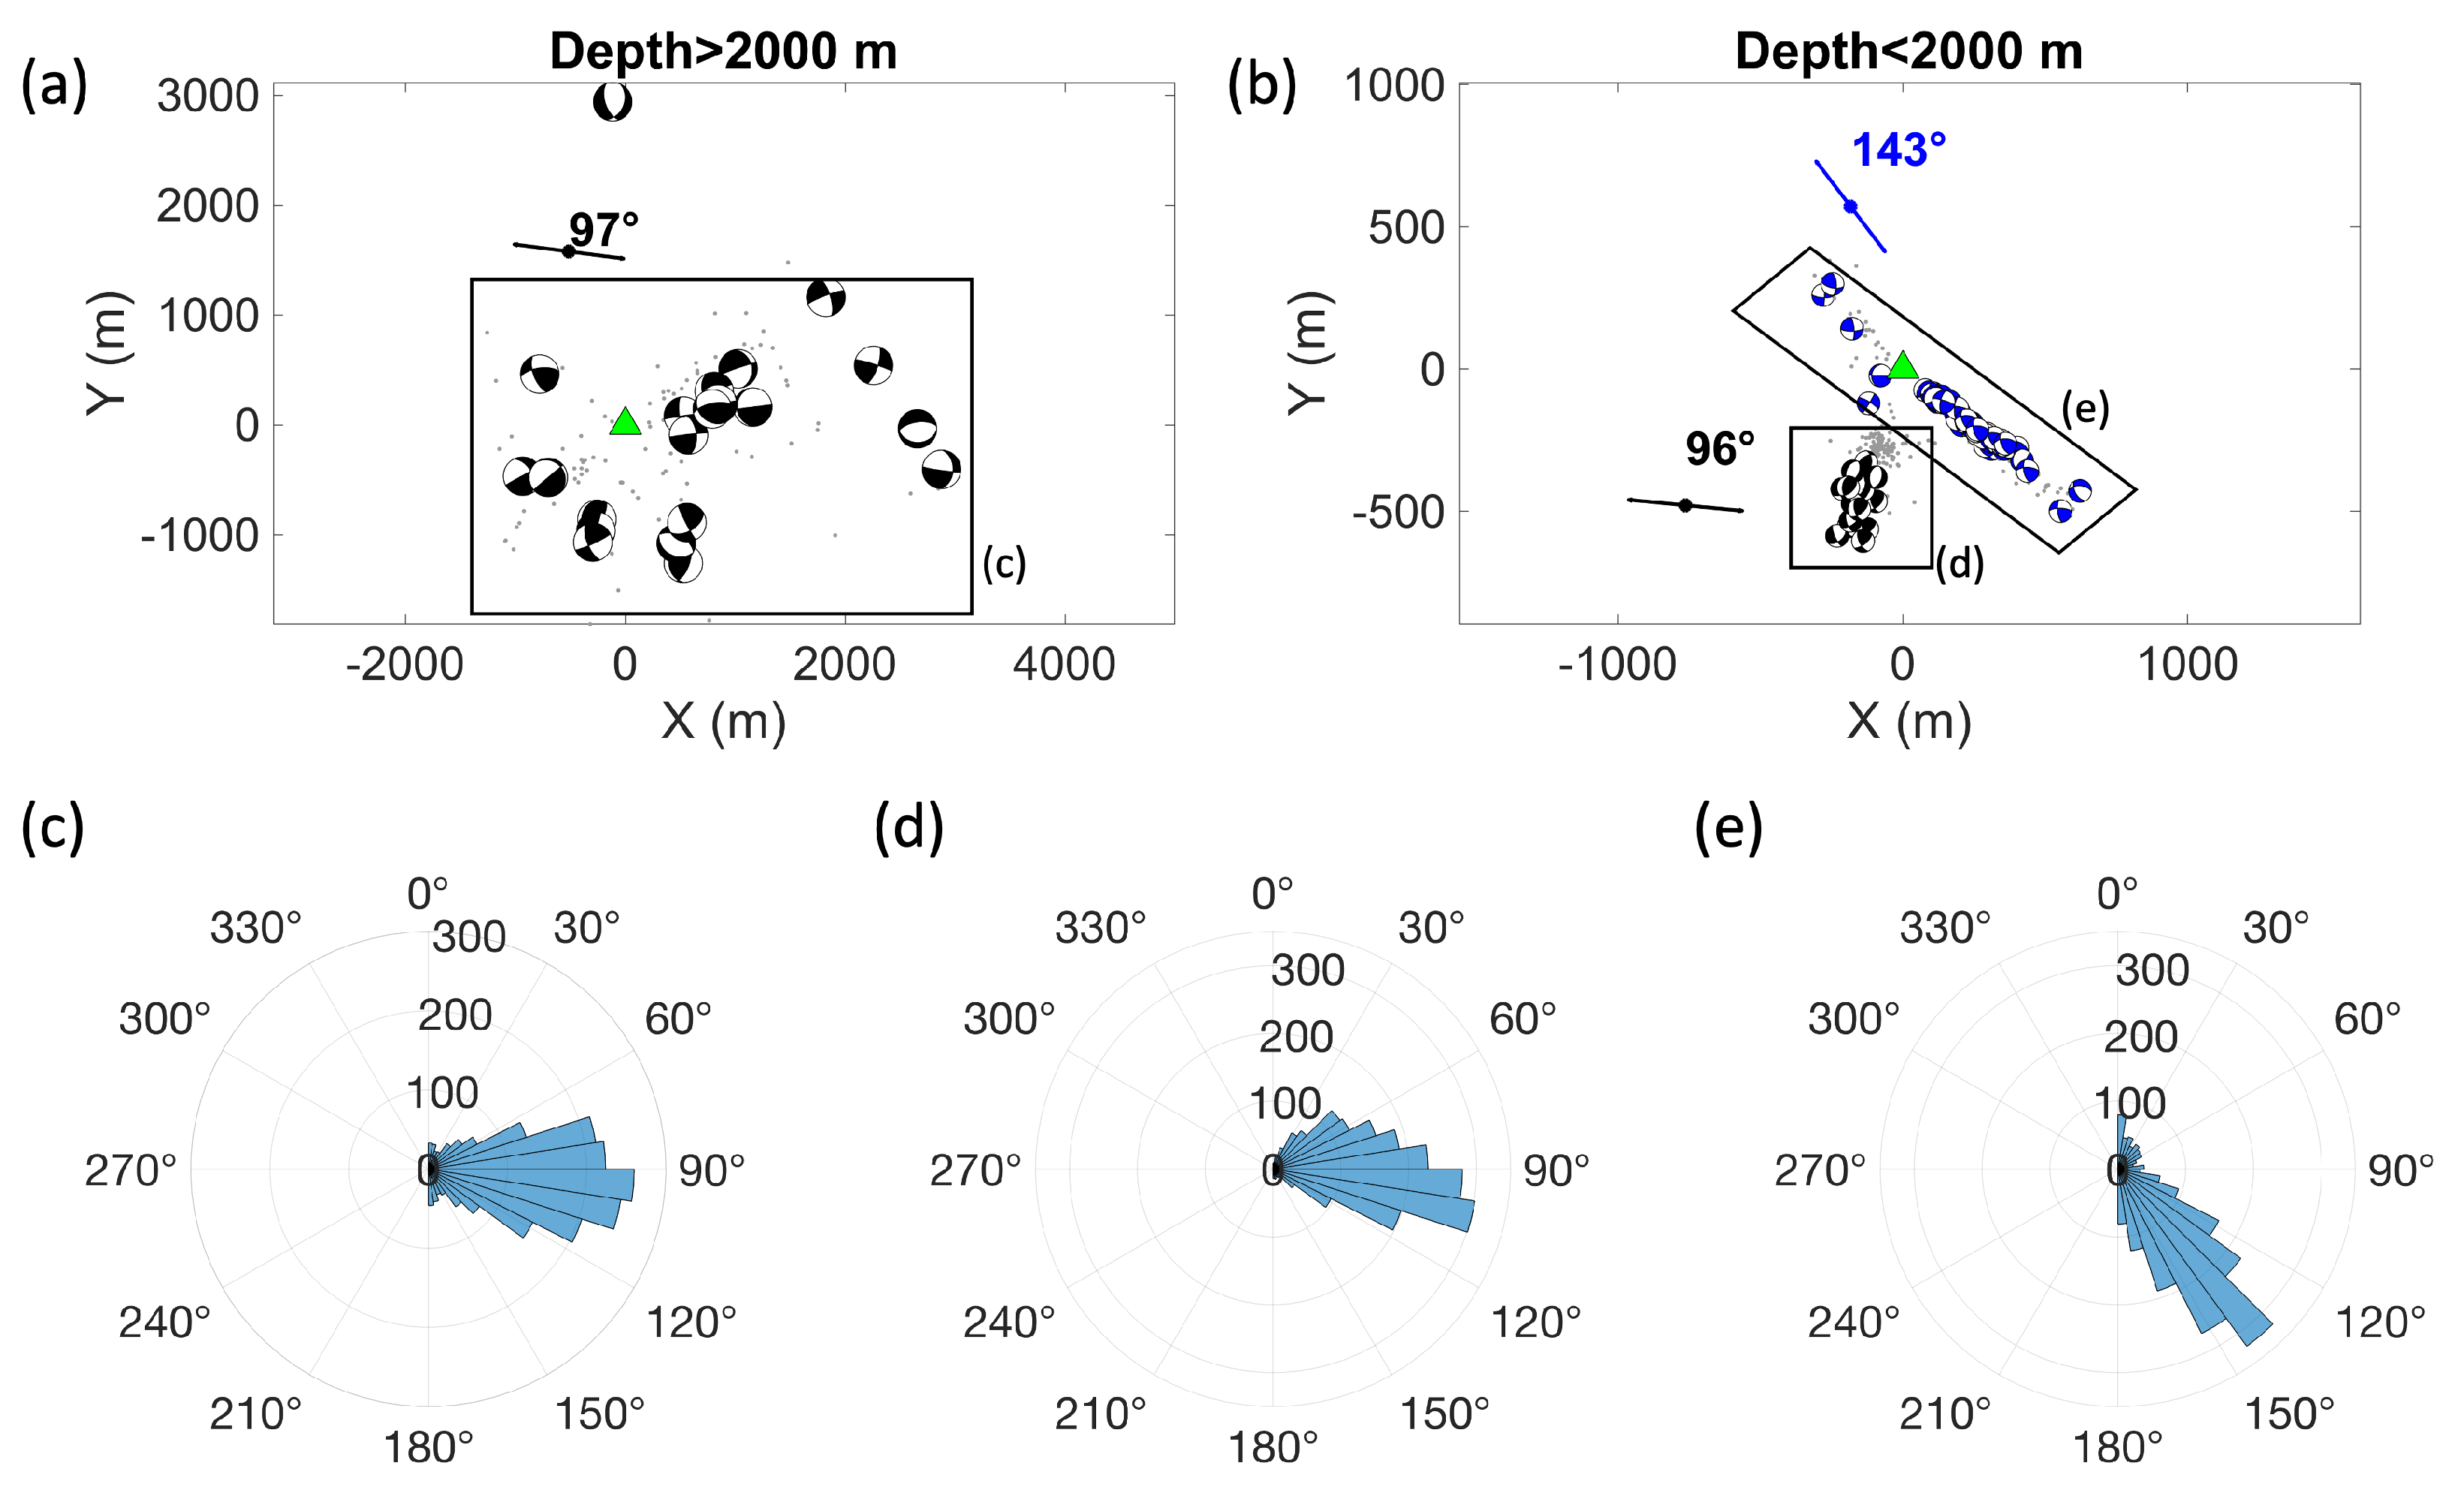
Based on the moment tensors we obtained, we inverted the local stress fields at three locations: (i) basement (depth > 2000 m) with 21 moment tensors, (ii) at the NS trending shallow cluster with 67 events, and (iii) at the NW trending shallow cluster with 20 events. For each location, we quantified the stress uncertainty using bootstrap resamplings. Figure 13 depicts the stress inversion results. The deeper events resulted in an oblique normal faulting regime, and the maximum horizontal stress orientation ( σ H m a x ) was 97° with a standard deviation of 34°. The inversion results are consistent with the regional stress field from Snee and Zoback [31]. The NS trending cluster showed an oblique faulting regime, and the σ H m a x orientation (96°) was better constrained than the deep region because of the larger number of events (standard deviation 29°). The NW trending cluster showed a reverse faulting regime with a maximum horizontal stress orientation of 143° and a standard deviation of 47°. We speculate that the local stress differences were induced by fluid injection. However, the relative large uncertainty of the inversion results and local geology could have also contributed to the stress heterogeneity. Without the in-site stress measurements, we are not able to conclusively explain the local stress variations.

5. Discussion

Figure 14a shows the five-spot well patterns, four injection wells at the corners, and a production well at the center. The CO 2 injection depth is within the Morrow B reservoir (2300–2500 m in depth). The CO 2 -EOR operations started in 2010, and the field is operated on a water alternating gas (WAG) cycle (Figure 15a). The average CO 2 injection rate from 2014 to 2020 was around 16,000 thousand standard cubic feet per day (Mscf/d). At the peak time, there were 14 active injection wells operating at the same time (Figure 15b).
In Figure 15, we compare the microseismic analysis results to the injection data from the primary CO 2 injection well 13-10A. Figure 15a shows the WAG injection rate, and Figure 15b shows the injection pressure measured in 13-10A. The pressure during CO 2 injection was higher than that of water injection. The microseismic event occurrence did not show significant difference for CO 2 and water injections, which was similar to the findings in Verdon et al. [32]. One striking feature we observed is that a temporal microseismic event cluster occurred when CO 2 injection pressure increased in February 2021 (Figure 15b,c). The moment tensors of the cluster had larger portions of CLVD components compared to the other events (Figure 15d). The observations suggest that the sudden pore pressure increase in February 2021 possibly created a new fracture, and the moment tensors of the induced microseismic events recorded the fracture opening and closing mechanism.
Our microseismic data analysis results reflect microseismic response of CO 2 /water injection. First, the temporal correlation between microseismicity burst and injection pressure increased (Figure 15b,c), which provides direct evidence of induced microseismicity. Second, as is consistent with the findings at other induced seismicity areas, e.g., geothermal field [29,30], fluid injection influences the magnitude distribution of microseismicity and usually results in higher b values compared with tectonically originated value of one. The b values of the two shallow clusters were significantly larger than 1.0. Next, the moment tensors of the shallow events showed large portions of CLVD components, which corresponded to tensile cracking. Finally, the inverted stress field at deeper depths is consistent with the regional stress field. However, the stress field at shallow depths displayed large deviations from the regional stress field. The above evidence suggest that the shallow clusters were probably induced by fluid injection.

6. Conclusions

Microseismic monitoring provides essential information on fracture creation and reactivation, as well as fluid migration during CO 2 injection. We analyzed the borehole microseismic data acquired during CO2 injection at the Farnsworth CO 2 -EOR field. We detected and located 932 microseismic events. The majority of the events occurred on two fracture planes at shallow depths. The relatively large b value suggests that these small-magnitude microseismic events were likely induced by CO 2 injection. We employed a recently developed moment tensor inversion method for single-borehole microseismic data and obtained a mix of shear events and tensile cracking events, which indicates that the CO 2 injection reactivated existing fractures at deeper depths and created new fractures at shallow depths. The inverted local stress perturbations from the regional stress field could potentially have been caused by CO 2 injections. The above results, along with the correlation between the microseismic event occurrence and the increased injection pressure, show microseismic responses to CO 2 /fluid injection. The findings help better understand the subsurface deformation and stress state changes during CO 2 /fluid injection at the Farnsworth CO 2 -EOR field.

Author Contributions

Conceptualization, L.H.; Methodology, K.G., D.L., Y.Z. and S.T.; Formal analysis, Y.Q. and J.L.; Resources, T.B., G.E.-k., W.A., T.I., M.C., R.B., Y.Z. and B.M.; Data curation, G.E.-k. and W.A.; Writing—original draft, Y.Q.; Writing—review & editing, D.L., T.C. and K.L.M.; Supervision, L.H.; Project administration, W.A.; Funding acquisition, L.H. and T.C. All authors have read and agreed to the published version of the manuscript.

Funding

This work was funded by: United States Department of Energy: 89233218CNA000001; United States Department of Energy: DE-FE0031684; United States Department of Energy: DE-FC26-05NT42591.

Data Availability Statement

Not applicable.

Acknowledgments

This work was supported by the U.S. Department of Energy (DOE) through the National Energy Technology Laboratory to the Los Alamos National Laboratory (LANL), which is operated by Triad National Security, LLC, for the National Nuclear Security Administration (NNSA) of the U.S. DOE under Contract No. 89233218CNA000001, and through New Mexico Tech. under DOE award numbers DE-FE0031684 and DE-FC26-05NT42591. We thank three anonymous reviewers for their valuable comments.

Conflicts of Interest

The authors declare no conflict of interest.

References

  1. Balch, R.; McPherson, B. Associated Storage with Enhanced Oil Recovery: A Large-Scale Carbon Capture, Utilization, and Storage Demonstration in Farnsworth, Texas, USA. In Geophysical Monitoring for Geologic Carbon Storage; Wiley Online Library: Hoboken, NJ, USA, 2022; pp. 343–360. [Google Scholar]
  2. van Wijk, J.; Hobbs, N.; Rose, P.; Mella, M.; Axen, G.; Gragg, E. Analysis of Geologic CO2 Migration Pathways in Farnsworth Field, NW Anadarko Basin. Energies 2021, 14, 7818. [Google Scholar] [CrossRef]
  3. White, D. Monitoring CO2 storage during EOR at the Weyburn-Midale Field. Lead. Edge 2009, 28, 838–842. [Google Scholar] [CrossRef]
  4. Rutledge, J.T. Interpreting reservoir microseismicity detected during CO2 injection at the Aneth Oil Field. In Proceedings of the AGU Fall Meeting Abstracts, San Francisco, CA, USA, 14–18 December 2009; Volume 2009, p. U41B–0021. [Google Scholar]
  5. Zhou, R.; Huang, L.; Rutledge, J. Microseismic event location for monitoring CO2 injection using double-difference tomography. Lead. Edge 2010, 29, 208–214. [Google Scholar] [CrossRef]
  6. Stork, A.L.; Verdon, J.P.; Kendall, J.M. Assessing the effect of velocity model accuracy on microseismic interpretation at the in Salah Carbon Capture and Storage site. Energy Procedia 2014, 63, 4385–4393. [Google Scholar] [CrossRef]
  7. Gaiser, J.E.; Ward, R.W.; DiSiena, J.P. Three component vertical seismic profiles: Polarization measurements of P-wave particle motion for velocity analysis. In SEG Technical Program Expanded Abstracts 1982; Society of Exploration Geophysicists: Houston, TX, USA, 1982; pp. 162–165. [Google Scholar]
  8. DiSiena, J.P.; Gaiser, J.E. Three-component vertical seismic profiles: An application of gal’perin’s polarization-position correlation technique. In SEG Technical Program Expanded Abstracts 1983; Society of Exploration Geophysicists: Houston, TX, USA, 1983; pp. 522–524. [Google Scholar]
  9. Allen, R.V. Automatic earthquake recognition and timing from single traces. Bull. Seismol. Soc. Am. 1978, 68, 1521–1532. [Google Scholar] [CrossRef]
  10. Mousavi, S.M.; Langston, C.A.; Horton, S.P. Automatic microseismic denoising and onset detection using the synchrosqueezed continuous wavelet transform. Geophysics 2016, 81, V341–V355. [Google Scholar] [CrossRef]
  11. Baker, T.; Granat, R.; Clayton, R.W. Real-time earthquake location using Kirchhoff reconstruction. Bull. Seismol. Soc. Am. 2005, 95, 699–707. [Google Scholar] [CrossRef]
  12. Han, L.; Wong, J.; Bancroft, J.C. Hypocenter location using hodogram analysis of noisy 3c microseismograms. In Consortium for Research in Elastic Wave Exploration Seismology (CREWES) Research Report; 2009; p. 29. [Google Scholar]
  13. Tian, Y.; Chen, X. A rapid and accurate two-point ray tracing method in horizontally layered velocity model. Acta Seismol. Sin. 2005, 18, 154–161. [Google Scholar] [CrossRef]
  14. Brune, J.N. Tectonic stress and the spectra of seismic shear waves from earthquakes. J. Geophys. Res. 1970, 75, 4997–5009. [Google Scholar] [CrossRef]
  15. Kanamori, H.; Brodsky, E.E. The physics of earthquakes. Rep. Prog. Phys. 2004, 67, 1429. [Google Scholar] [CrossRef]
  16. Bender, B. Maximum likelihood estimation of b values for magnitude grouped data. Bull. Seismol. Soc. Am. 1983, 73, 831–851. [Google Scholar] [CrossRef]
  17. Wiemer, S. A software package to analyze seismicity: ZMAP. Seismol. Res. Lett. 2001, 72, 373–382. [Google Scholar] [CrossRef]
  18. Vavryčuk, V. On the retrieval of moment tensors from borehole data. Geophys. Prospect. 2007, 55, 381–391. [Google Scholar] [CrossRef]
  19. Song, F.; Toksöz, M.N. Full-waveform based complete moment tensor inversion and source parameter estimation from downhole microseismic data for hydrofracture monitoring. Geophysics 2011, 76, WC103–WC116. [Google Scholar] [CrossRef]
  20. Li, H.; Chang, X.; Xie, X.B.; Wang, Y. Microseismic moment-tensor inversion and sensitivity analysis in vertically transverse isotropic mediaSMT inversion in anisotropic media. Geophysics 2021, 86, KS23–KS36. [Google Scholar] [CrossRef]
  21. Gao, K.; Huang, L.; Qin, Y.; Chen, T.; Coblentz, D.; El-kaseeh, G.; Bratton, T. Adaptive full-waveform moment-tensor inversion of microseismic data. In Proceedings of the SEG/AAPG/SEPM First International Meeting for Applied Geoscience & Energy, Denver, CO, USA, 26 September 2021; OnePetro: Richardson, TX, USA, 2021. [Google Scholar]
  22. Warner, M.; Guasch, L. Adaptive waveform inversion: Theory. Geophysics 2016, 81, R429–R445. [Google Scholar] [CrossRef]
  23. Zhang, Y.; Duan, L.; Xie, Y. A stable and practical implementation of least-squares reverse time migration. Geophysics 2015, 80, V23–V31. [Google Scholar] [CrossRef]
  24. Dziewonski, A.M.; Chou, T.A.; Woodhouse, J.H. Determination of earthquake source parameters from waveform data for studies of global and regional seismicity. J. Geophys. Res. Solid Earth 1981, 86, 2825–2852. [Google Scholar] [CrossRef]
  25. Vavryčuk, V. Moment tensor decompositions revisited. J. Seismol. 2015, 19, 231–252. [Google Scholar] [CrossRef]
  26. Hudson, J.A.; Pearce, R.G.; Rogers, R.M. Source type plot for inversion of the moment tensor. J. Geophys. Res. Solid Earth 1989, 94, 765–774. [Google Scholar] [CrossRef]
  27. Martínez-Garzón, P.; Kwiatek, G.; Ickrath, M.; Bohnhoff, M. MSATSI: A MATLAB package for stress inversion combining solid classic methodology, a new simplified user-handling, and a visualization tool. Seismol. Res. Lett. 2014, 85, 896–904. [Google Scholar] [CrossRef]
  28. Michael, A.J. Determination of stress from slip data: Faults and folds. J. Geophys. Res. Solid Earth 1984, 89, 11517–11526. [Google Scholar] [CrossRef]
  29. Bachmann, C.E.; Wiemer, S.; Goertz-Allmann, B.P.; Woessner, J. Influence of pore-pressure on the event-size distribution of induced earthquakes. Geophys. Res. Lett. 2012, 39. [Google Scholar] [CrossRef]
  30. Cheng, Y.; Chen, X. Characteristics of seismicity inside and outside the Salton Sea geothermal field. Bull. Seismol. Soc. Am. 2018, 108, 1877–1888. [Google Scholar] [CrossRef]
  31. Snee, J.E.L.; Zoback, M.D. State of stress in areas of active unconventional oil and gas development in North America. AAPG Bull. 2022, 106, 355–385. [Google Scholar] [CrossRef]
  32. Verdon, J.P.; Kendall, J.M.; Maxwell, S.C. A comparison of passive seismic monitoring of fracture stimulation from water and CO 2 injection. Geophysics 2010, 75, MA1–MA7. [Google Scholar] [CrossRef]
Figure 1. (a) Location of the Farnsworth CO 2 -EOR field. (b) Microseismic monitoring network, including 16 geophones in the vertical borehole 13–10 (green triangle) and 20 surface seismic stations (white triangles). Well 13-10A (red triangle) is the primary CO 2 injection well. (c) Depth view of the borehole geophones (green triangles). The Morrow B reservoir and one horizontal transverse isotropic (HTI) layer at shallow depth are highlighted.
Energies 16 04177 g001
Figure 2. (a) Method used to determine the orientation of the horizontal channels ( H 1 , H 2 ) of the borehole geophones. (b) The orientations of the first horizontal channel ( H 1 ). Each color represents a different geophone. The solid lines are the rotation angles, and the dashed lines show the 95% uncertainty.
Energies 16 04177 g002
Figure 3. (a) STA/LTA detection results on borehole microseismic data from the Farnsworth CO 2 -EOR field. (b) The signal-to-noise ratios (SNRs) of corresponding detected events in (a).
Energies 16 04177 g003
Figure 4. Comparison of borehole microseismic waveforms before and after denoising.
Energies 16 04177 g004
Figure 5. Comparison of SNRs before and after waveform denoising for detected microseismic events.
Energies 16 04177 g005
Figure 6. (a) Petrophysical logs for lithology and HTI anisotropy. (b) Depth distribution of high-frequency microseismicity. The depth is aligned for (a,b).
Energies 16 04177 g006
Figure 7. (a) Magnitude histogram and (b) magnitude-frequency distribution for high-frequency microseismic events from July 2019 to February 2020. The gray and black dots in (b) represent the frequency of events in each magnitude bin and the cumulative number of microseismic events of a certain magnitude or greater, respectively. The red line is the best-fitting l o g 10 N ( M ) = a b M line using maximum likelihood method, where M is the magnitude and N is the number of events.
Energies 16 04177 g007
Figure 8. Location results in (a) map view, (b) cross-section view AA’, and (c) cross-section view BB’ for low-frequency microseismic events from August 2019 to January 2022. The events are colored by event time. Reservoir layer and a shallow HIT layer are highlighted. The green triangles are borehole geophones, and the red triangle in (a) is the primary CO 2 injection well 13-10A.
Energies 16 04177 g008
Figure 9. (a) Magnitude histogram and (b) magnitude-frequency distribution for low-frequency microseismic events from August 2019 to January 2022. The gray and black dots in (b) represent the frequency of events in each magnitude bin and the cumulative number of microseismic events of a certain magnitude or greater, respectively. The red line is the best-fitting l o g 10 N ( M ) = a b M line using maximum likelihood method, where M is the magnitude and N is the number of events.
Energies 16 04177 g009
Figure 10. (a) Magnitude-frequency distribution for deep (depth > 2000 m), low-frequency microseismic events. (b) The b value variations over time for shallow (depth < 2000 m), low-frequency microseismic events. The solid line shows the b value, and the dashed lines show the 95% uncertainty.
Energies 16 04177 g010
Figure 11. Moment tensor inversion results shown in (a) map view and (b,c) cross-section views (AA’ and BB’). The green triangles are borehole geophones.
Energies 16 04177 g011
Figure 12. Hudson plot for moment tensors at (a) deeper depths (>2000 m, purple) and (b) shallow depths (<2000 m, green). Microseismic events in the reservoir are highlighted in red.
Energies 16 04177 g012
Figure 13. Stress inversion results for (a) deeper events (depth > 2000 m) and (b) two shallow clusters (depth < 2000 m). Green triangle is the vertical borehole. Black color represents oblique faulting regime, and blue color represents reverse faulting regime. (ce) Rose diagram of maximum horizontal stress orientations from bootstrap resamplings for each cluster denoted in (a,b).
Energies 16 04177 g013
Figure 14. (a) Spatial distribution of injection and production shows the five-spot well patterns. The injection wells are colored by injection start date. 13-10 is the monitoring well, and 13-10A is the primary CO 2 injection well. (b) CO 2 injection rate. The plot is colored by the number of active injection wells at every timestamp.
Energies 16 04177 g014
Figure 15. (a) Alternating CO 2 and water injection rate. (b) Injection pressure for well 13-10A. (c) Microseismic event distribution over time. (d) CLVD components for moment tensors.
Energies 16 04177 g015
Disclaimer/Publisher’s Note: The statements, opinions and data contained in all publications are solely those of the individual author(s) and contributor(s) and not of MDPI and/or the editor(s). MDPI and/or the editor(s) disclaim responsibility for any injury to people or property resulting from any ideas, methods, instructions or products referred to in the content.