Article

Investigation of the Effect of Injected CO2 on the Morrow B Sandstone through Laboratory Batch Reaction Experiments: Implications for CO2 Sequestration in the Farnsworth Unit, Northern Texas, USA

by
Eusebius J. Kutsienyo
1,*,
Martin S. Appold
1 and
Martha E. Cather
2
1
Department of Geological Sciences, University of Missouri, Columbia, MO 65211, USA
2
Petroleum Recovery Research Center, New Mexico Institute of Mining and Technology, Socorro, NM 87801, USA
*
Author to whom correspondence should be addressed.
Energies 2023, 16(12), 4611; https://doi.org/10.3390/en16124611
Submission received: 9 May 2023 / Revised: 31 May 2023 / Accepted: 2 June 2023 / Published: 9 June 2023
(This article belongs to the Special Issue Forecasting CO2 Sequestration with Enhanced Oil Recovery II)

Abstract

:
About one million tons of CO2 have been injected into the Farnsworth unit to date. The target reservoir for CO2 injection is the Morrow B Sandstone, which is primarily made of quartz with lesser amounts of albite, calcite, chlorite, and clay minerals. The impact of CO2 injection on the mineralogy, porosity, and pore water composition of the Morrow B Sandstone is a major concern. Although numerical modeling studies suggest that porosity changes will be minimal, significant alterations to mineralogy and pore water composition are expected. Given the implications for CO2 storage effectiveness and risk assessment, it is crucial to verify the accuracy of theoretical model predictions through laboratory experiments. To this end, batch reaction experiments were conducted to model conditions near an injection well in the Morrow B Sandstone and at locations further away, where the CO2 has been diluted by formation water. The laboratory experiments involved submerging thin sections of both coarse- and fine-grained facies of the Morrow B Sandstone in formation water samples with varying levels of CO2. The experiments were conducted at the reservoir temperature of 75 °C. Two experimental runs were conducted, one lasting for 61 days and the other for 72 days. The initial fluid composition used in the second run was the same as in the first. The mineralogy changes in the thin sections were analyzed using SEM and the Tescan Integrated Mineral Analyzer (TIMA), while changes in the composition of the formation water were determined using ICP-AES. During each experiment, a thin layer of white fine-grained particles consisting mainly of dolomite and silica formed on the surface of the thin sections, leading to significant reductions in Ca, Mg, and Sr in the formation water. This outcome is consistent with numerical model predictions that dolomite would be the primary mineral that would react with injected CO2 and that silica would be oversaturated in the formation water. Changes in mineral abundance in the thin sections themselves were much less systematic than in the theoretical modeling experiments, perhaps reflecting heterogeneities in the mineral grain size surface area to volume ratios and mineral distributions in the thin sections not considered in the numerical models.

1. Introduction

Subsurface storage of captured anthropogenic CO2 in suitable geological formations is an increasingly accepted technique for mitigating greenhouse gas emissions [1,2,3]. The Farnsworth Unit (FWU) in northern Texas has been an ongoing site for the investigation of CO2 injection, sequestration, and enhanced oil recovery (EOR) since 2010. The investigation has been conducted by the Southwest Partnership for CO2 Sequestration (SWP), one of seven regional CO2 sequestration partnerships initiated and funded by the U.S. Department of Energy. Much of the investigation of the FWU by the SWP has focused on numerical modeling of the physical and chemical behavior of the injected CO2 [4,5,6,7,8,9,10,11,12,13,14,15,16]. These models have made some important predictions about the fate of the injected CO2, including how the injected CO2 is partitioned among water, oil, gas, and mineral phases, how far and how quickly the injected CO2 will migrate from its sources, how hydrocarbon production will be affected, and how the hydraulic properties of the reservoir will be changed. The results of these modeling studies broadly resemble those from other modeling studies from other sites [17,18,19,20,21,22,23,24,25,26,27,28,29,30,31].
Many of the previous numerical modeling studies were calibrated to parameters such as fluid production history, tracer migration, and formation water composition. However, calibration to mineral evolution has been less frequently achieved because of the need for long-term repeated rock sampling from well bores or for laboratory experiments on the reaction of CO2-charged formation water with reservoir rock. Laboratory experiments for the Farnsworth Unit have been conducted by Wu et al. [32], who investigated the effects of CO2-enriched Morrow B formation water on the mineral composition, permeability, and mechanical integrity of an ankerite-siderite-cemented facies and a calcite-cemented facies in the Morrow B mineral matrix. Their experiments showed considerable carbonate mineral dissolution in both facies, but only the calcite-cemented facies underwent a significant change in permeability and mechanical strength. Because of the high fluid flux through the reservoir rock samples in Wu et al.’s [32] experiments, their results are mainly relevant to the immediate vicinity of the injection wells.
The present study, therefore, was focused on representing conditions further from the injection wells where fluxes of CO2-enriched formation water through the reservoir are lower. To that end, a series of fluid-static batch reaction experiments was conducted in which thin sections of Morrow B Sandstone were immersed in CO2-charged formation water in sealed reaction vessels at the 75 °C reservoir temperature, and changes in Morrow B mineralogy and formation water composition were tracked over time. Despite the brevity of the present study’s laboratory experiments relative to the intended millennia or longer duration of CO2 storage in the reservoir, the laboratory experiments provide insights into the chemical processes and changes expected from CO2 injection and storage and a benchmark for numerical modeling studies.

2. Geological Background

Thorough descriptions of the rocks in the FWU can be found in Munson [33], Gallagher [34], Cather et al. [35], and Perdure [36], from which the following summary is derived. The FWU is located on the southwestern flank of the Anadarko Basin in northern Texas, USA in a Lower to Middle Pennsylvanian stratigraphic succession (Figure 1).
The principal hydrocarbon reservoir in the FWU is the Morrow B Sandstone. The Morrow B is generally interpreted to consist of fluvial sand channels deposited during marine regressions as incisions in a broader expanse of marine shales deposited during marine transgressions (Figure 2). The channel sandstones in the Morrow B grade texturally upward from basal conglomerates to coarse-grained sandstones. Within the FWU, the Morrow B consists of a 2.5 to 4 km wide and up to 18 m thick sand channel embedded within shale [35]. Porosity and permeability of the Morrow B has a heterogeneous distribution, but averages about 14.5 percent and 45.2 mD, respectively [34]. The Morrow B is comprised mainly of quartz and albite with lesser amounts of chlorite, clay minerals, and carbonate minerals [34]. The Morrow B is overlain by a sequence of Atokan-age evaporites and limestones that serve as a seal for the hydrocarbon reservoir [35,37].
Hydrocarbons were discovered in the FWU in 1955 and were extracted by primary recovery until 1964 and by water flooding until 2010, at which point enhanced oil recovery by CO2 injection was begun, which also served as the vehicle for CO2 sequestration.

3. Experimental Methods

3.1. Sample Preparation and Initial Mineral Characterization

In order to carry out the batch reaction experiments, two drill core samples and two liters of formation water from the Morrow B Sandstone in the western FWU were acquired from the Department of Earth and Environmental Science at the New Mexico Institute of Mining and Technology. Both drill core samples were taken from well #13-10A, one from an upper location (sample U) at a depth of 7669.1 ft (2337.5 m) and the other from a lower location (sample L) at a depth of 7684.6 ft (2342.3 m, Figure 3). Sample U is from a fine-grained texture of the sandstone and sample L is from a coarse-grained texture of the sandstone. From each drill core sample, a billet was cut with dimensions of 4.5 cm × 2.5 cm × 2 cm. From each billet, two doubly polished thin sections, 30 µm in thickness were prepared and mounted on 5 cm × 2.5 cm glass slides. The two thin sections from sample U were labeled as 1310A.7669.1a and 1310A.7669.1b. The two thin sections from Sample L were labeled 1310A.7684.6a and 1310A.7684.6b.
The initial mineralogy of the four thin sections was characterized qualitatively using an Olympus BX-51 petrographic microscope in the petrology laboratory at the University of Missouri (Figure 4). The thin sections were then sent to the Société Générale de Surveillance (SGS) in Lakefield, Ontario, Canada for quantitative characterization of mineral abundances using the Tescan Integrated Modal Analysis (TIMA), a proprietary scanning electron microscope (SEM) technique.

3.2. Water Sample Analysis

The elemental composition of the formation water used in the batch reaction experiments was analyzed using inductively coupled plasma-atomic emission spectroscopy (ICP-AES) at the MU Agricultural Experiment Station Chemical Laboratories (AESCL).

3.3. Batch Reaction Experiments

Two sets of batch reaction experiments, a high-carbon and a low-carbon set of experiments, were conducted after the initial modal mineral abundances of the thin sections were quantitatively characterized. In the high-carbon experiment set, the thin sections 1310A.7684.6a and 1310A.7669.1a (representing the deeper fine-grained and shallower coarse-grained textures, respectively) were placed in a 100 mL polytetrafluoroethylene (PTFE) cylinder, which was filled with 62 mL of Morrow B formation water (Figure 5). A total mass of 3.48 g of frozen carbon dioxide (dry ice) was then added to the cylinder to achieve a total dissolved aqueous carbon concentration of 1.28 mol/L. This led to a calculated CO2 pressure in the vessel of about 9 MPa, determined using the Geochemist’s Workbench™ software. This total carbon concentration represents the CO2 saturated conditions in the Morrow B formation water in the immediate vicinity of well 13-10A during CO2 injection. In the low-carbon experiment set, the thin sections 1310A.7684.6b and 1310A.7669.1b (also representing the deeper fine-grained and shallower coarse-grained textures, respectively) were placed in a 100 mL PTFE cylinder filled with 62 mL of Morrow B formation water but a smaller mass (~0.226 g) of dry ice was introduced into the water. The resultant CO2 concentration of 0.083 mol/L in this low-carbon experiment set represents the total carbon concentration at the injection well (13-10A) after about 375 years after CO2 injection had ceased, or at a distance of a few hundred meters from the well during or shortly after injection, as predicted from the numerical reactive transport modeling study of Kutsienyo et al. [15]. This carbon concentration led to a calculated CO2 pressure in the vessel of about 0.5 MPa, also determined using the Geochemist’s Workbench™ software. The two sets of experiments test fundamentally different chemical conditions in the reservoir in that the high carbon experiments correspond to moderately acidic conditions with a pH of around 4.5 whereas the low carbon experiments correspond to more basic conditions with a pH of about 5.3 where the CO2 has been diluted by the ambient formation water.
Next, each PTFE vessel was placed into a Baoshishan™ hydrothermal autoclave made of stainless steel 304 alloy. Each autoclave reactor was then sealed, labeled, and monitored for one hour at room temperature before being placed into an oven preheated to the reservoir temperature of 75 °C.
The thin sections in both autoclaves were then allowed to react with their respective CO2-charged formation water solutions for 61 days. At that time, the autoclaves were removed from the oven and allowed to cool to room temperature before they were opened. The thin sections and reaction fluid were then removed from each autoclave, after which the elemental compositions of the fluids were analyzed using ICP-AES. The thin sections from each experiment were found to be coated with a white fine-grained precipitate. This precipitate was removed from the thin sections and analyzed using SEM. The thin sections were then sent to SGS for modal mineral analysis. Following the modal mineral analysis, the thin sections were returned to the authors and another round of experiments was begun with new 62 mL aliquots of formation water, charged with the same CO2 concentrations as before, and allowed to react for 72 days within the autoclaves at 75 °C. After the 72 days, the thin sections and reaction fluids were analyzed in the same way as for the earlier 61 day experiments. The batch reaction experiment durations were shorter than the current gas injection intervals in the field, but comparable to the CO2 gas injection intervals during the early EOR in the field.

4. Results

4.1. Aqueous Chemistry

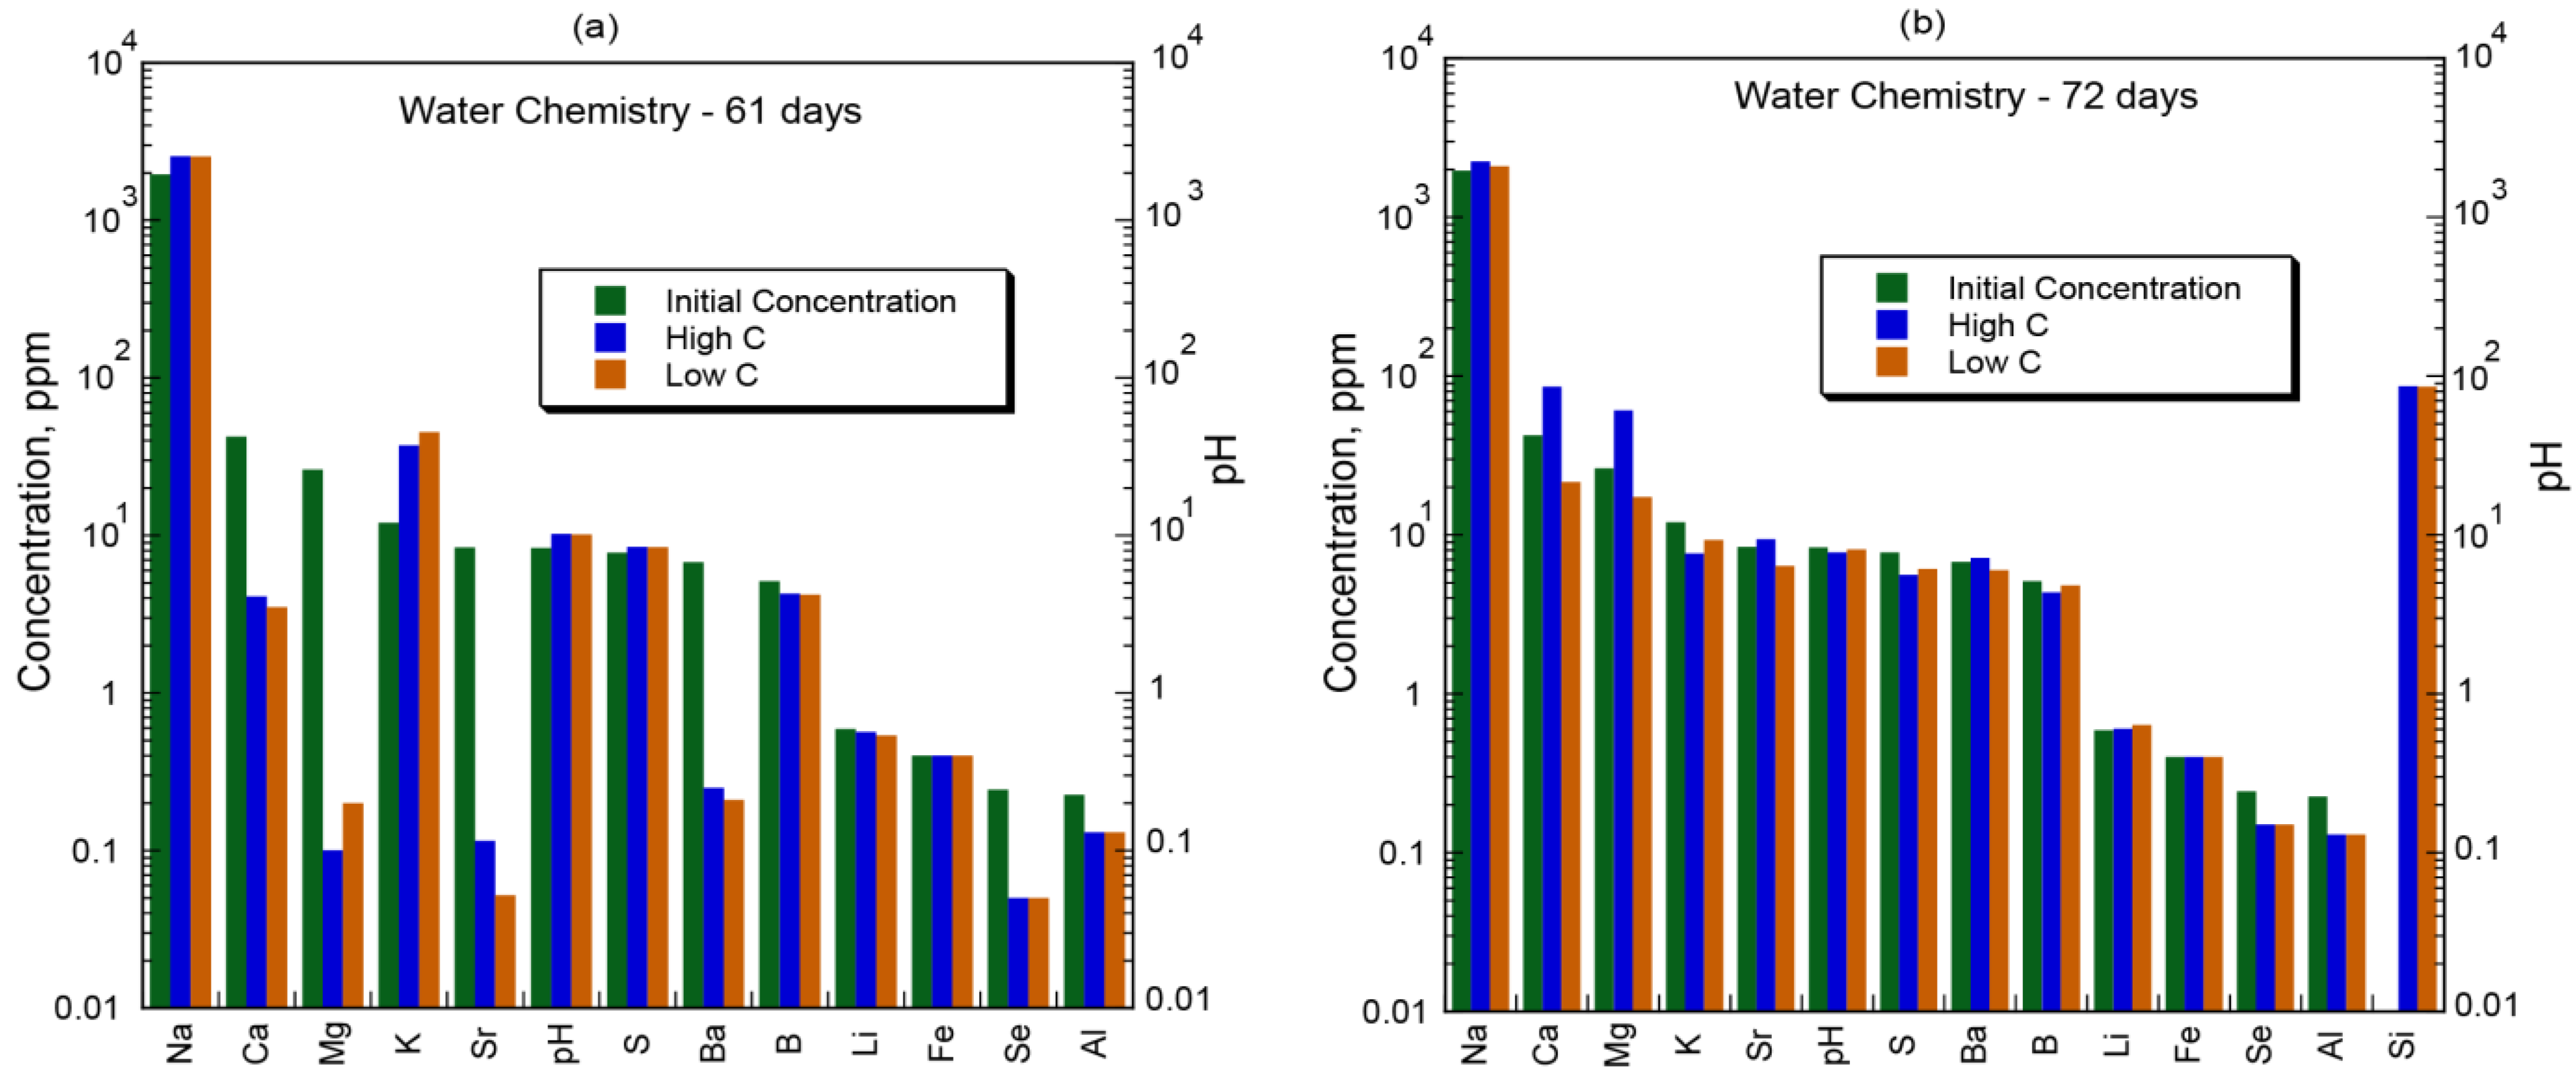
The results of the ICP-AES analyses of the batch reaction fluids are shown in Table 1 and in Figure 6, which compare the initial fluid composition to the fluid composition in the high- and low-carbon batch reaction experiments after 61 and 72 days. For both the high-C and low-C experiments over the first 61 days, the concentrations of Ca, Mg, Sr, Ba, Al, Se, Li, and B decreased, whereas the concentrations of S, K, and Na increased, as did the pH. The concentrations of Fe remained about constant (Figure 6a). For both the high-C and low-C experiments over the next 72 days, the concentrations of Na and Li increased slightly, the concentrations of K, S, Al, and Se and the pH decreased slightly, and the concentrations of Ca, Mg, Sr, and Ba increased in the high-C experiment but decreased in the low-C experiment. The concentrations of Fe and Si, which were not measured after the 61-day experiment, remained about constant (Figure 6b).

4.2. Mineral Chemistry

4.2.1. White Fine-Grained Precipitate

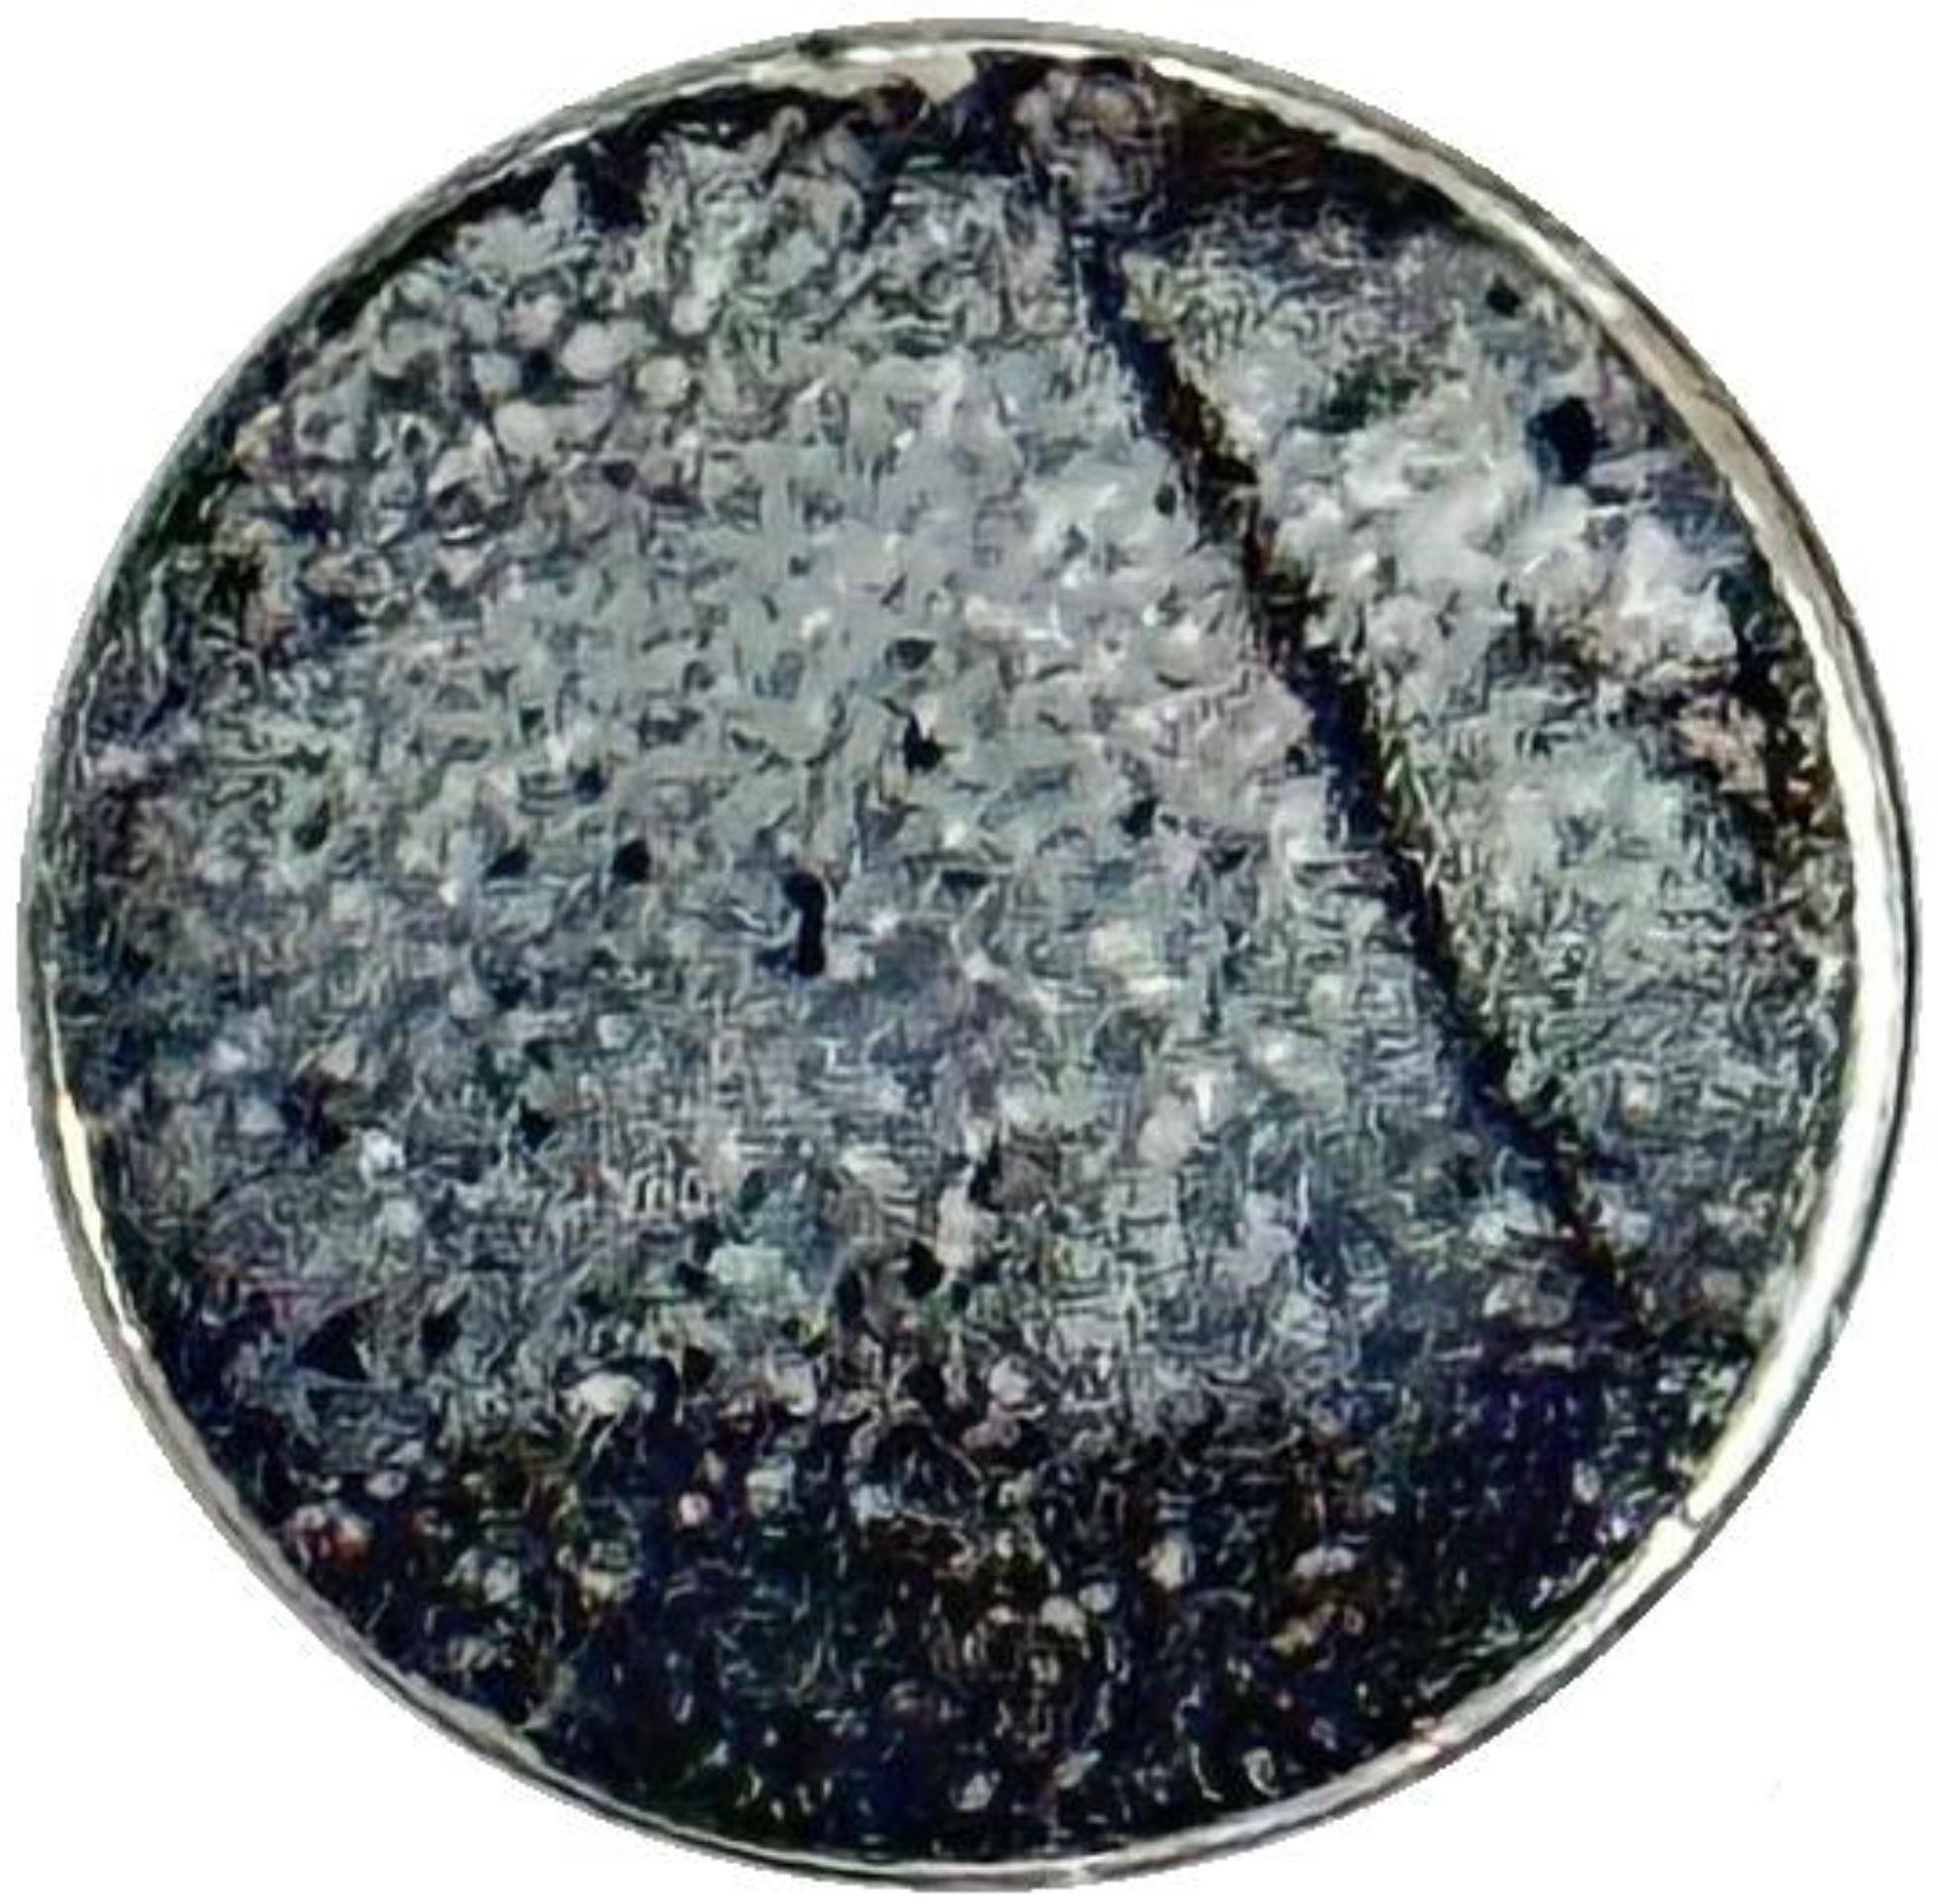
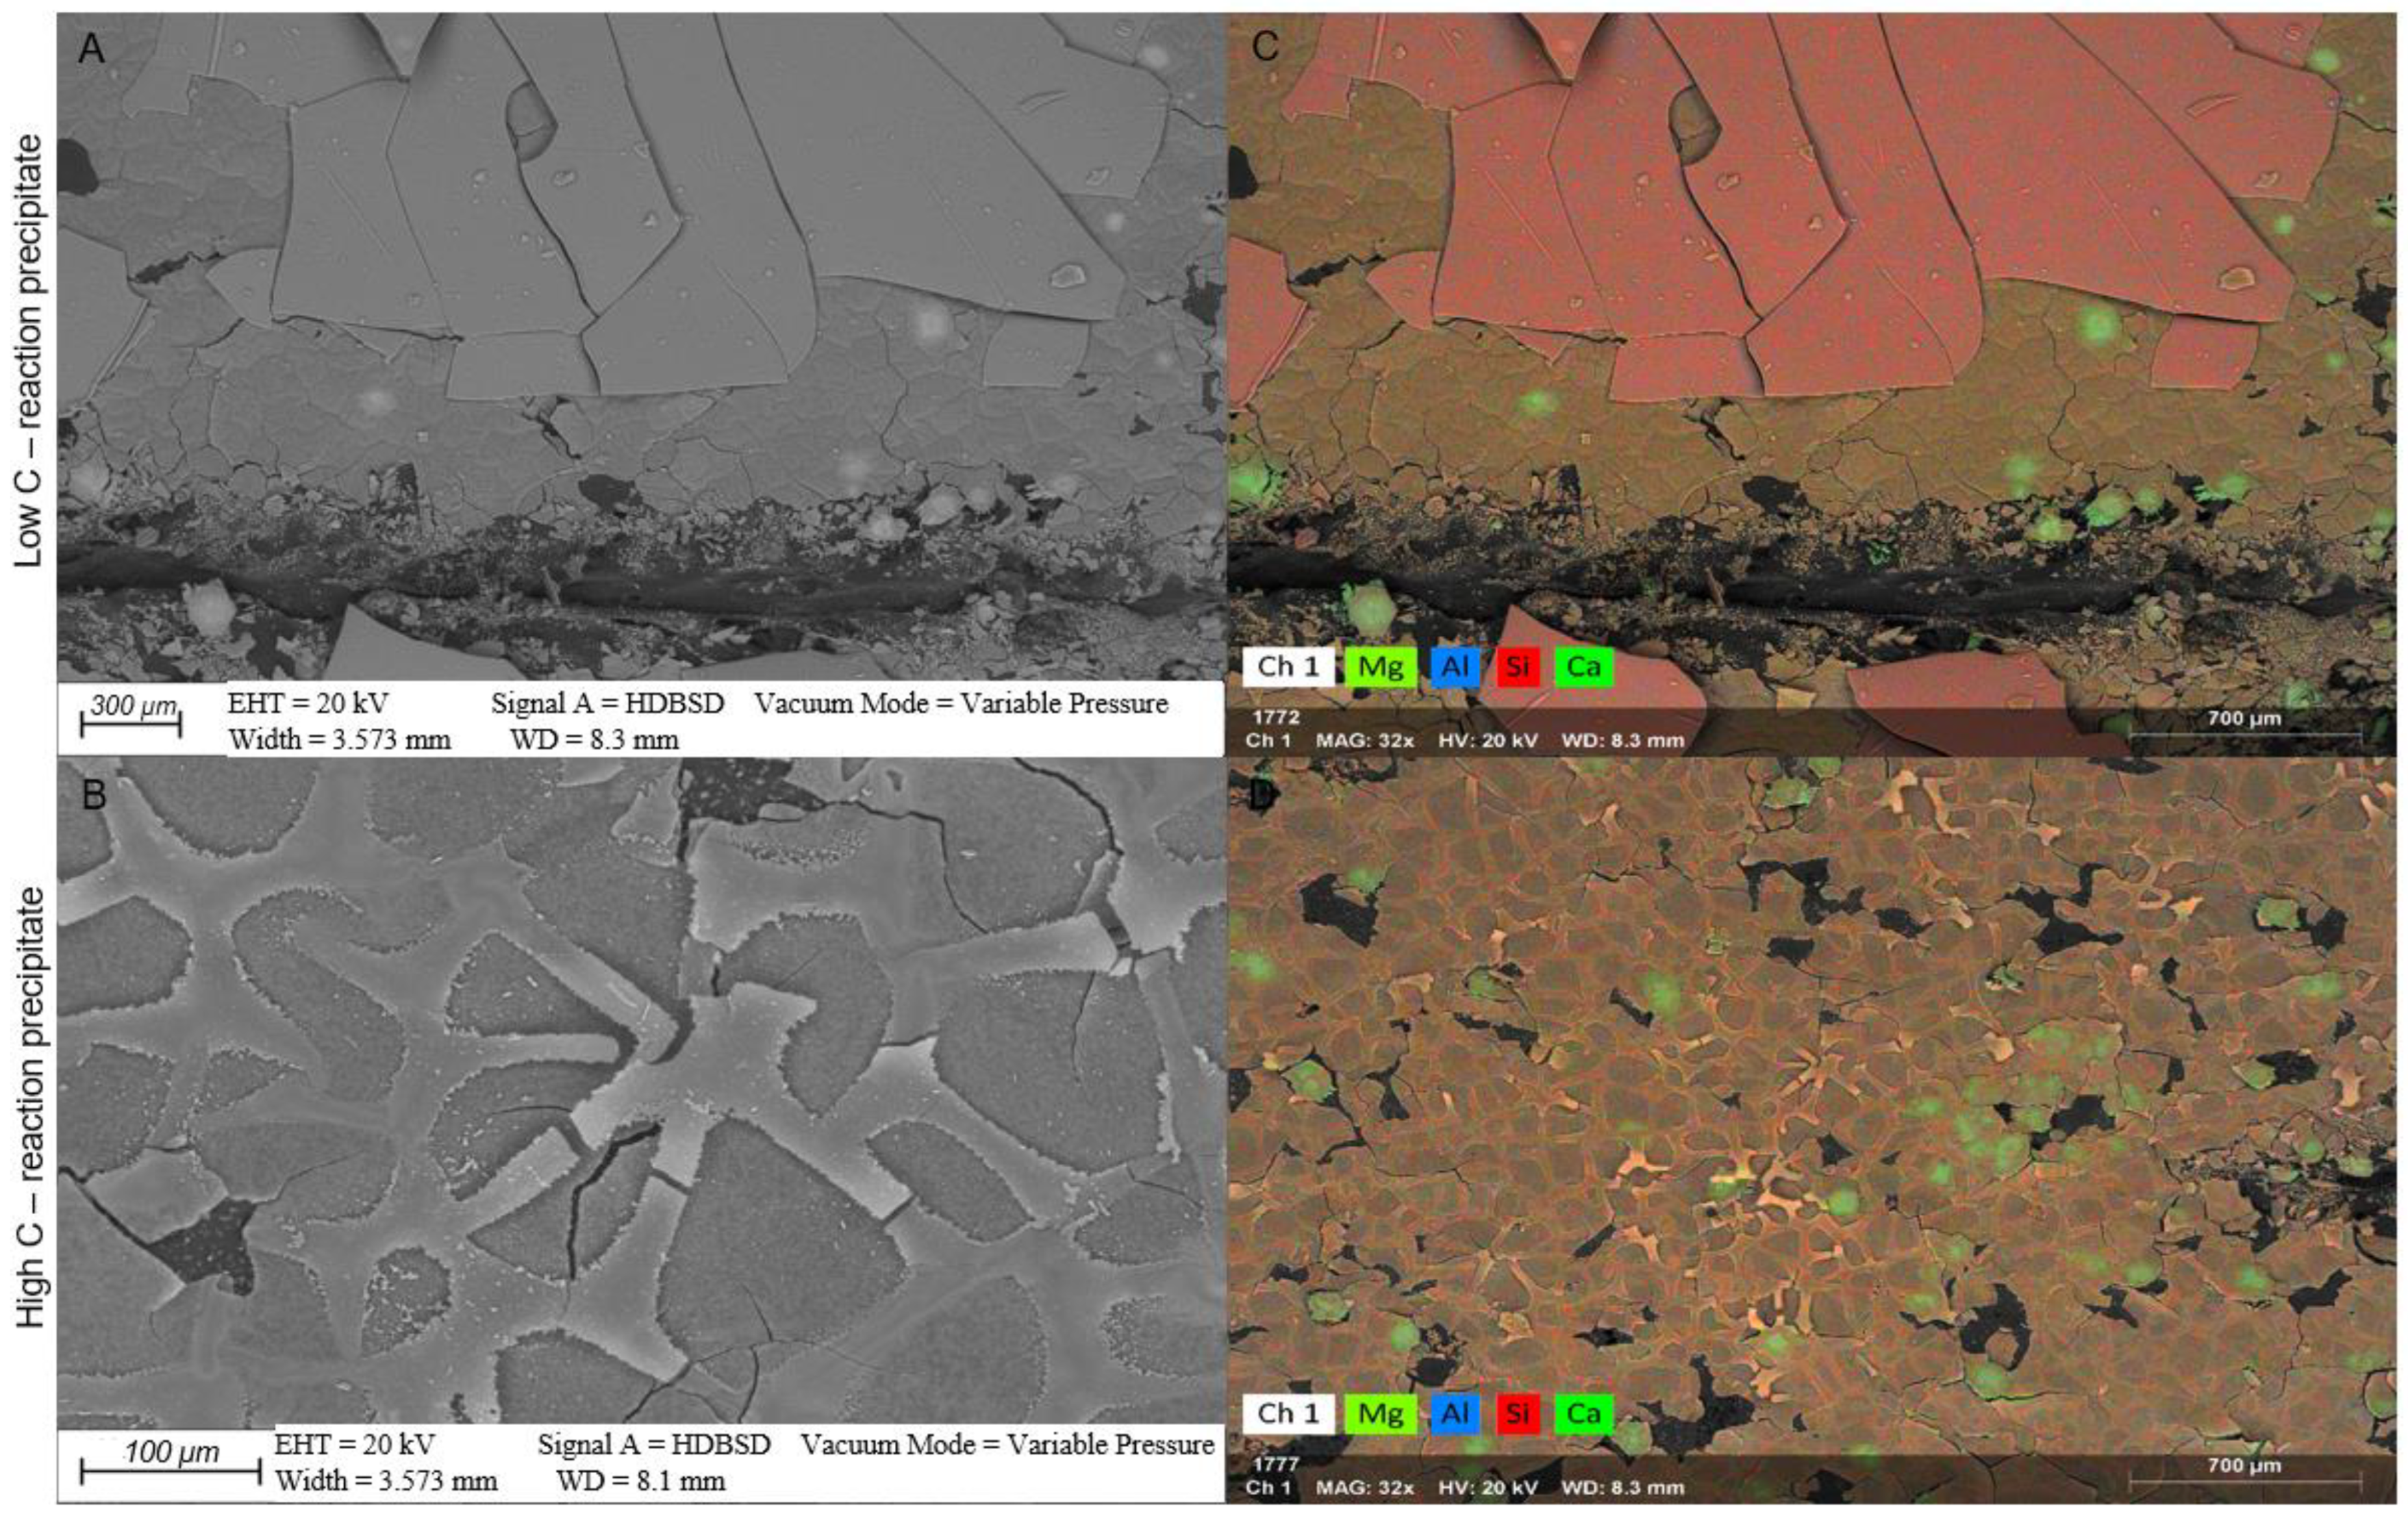
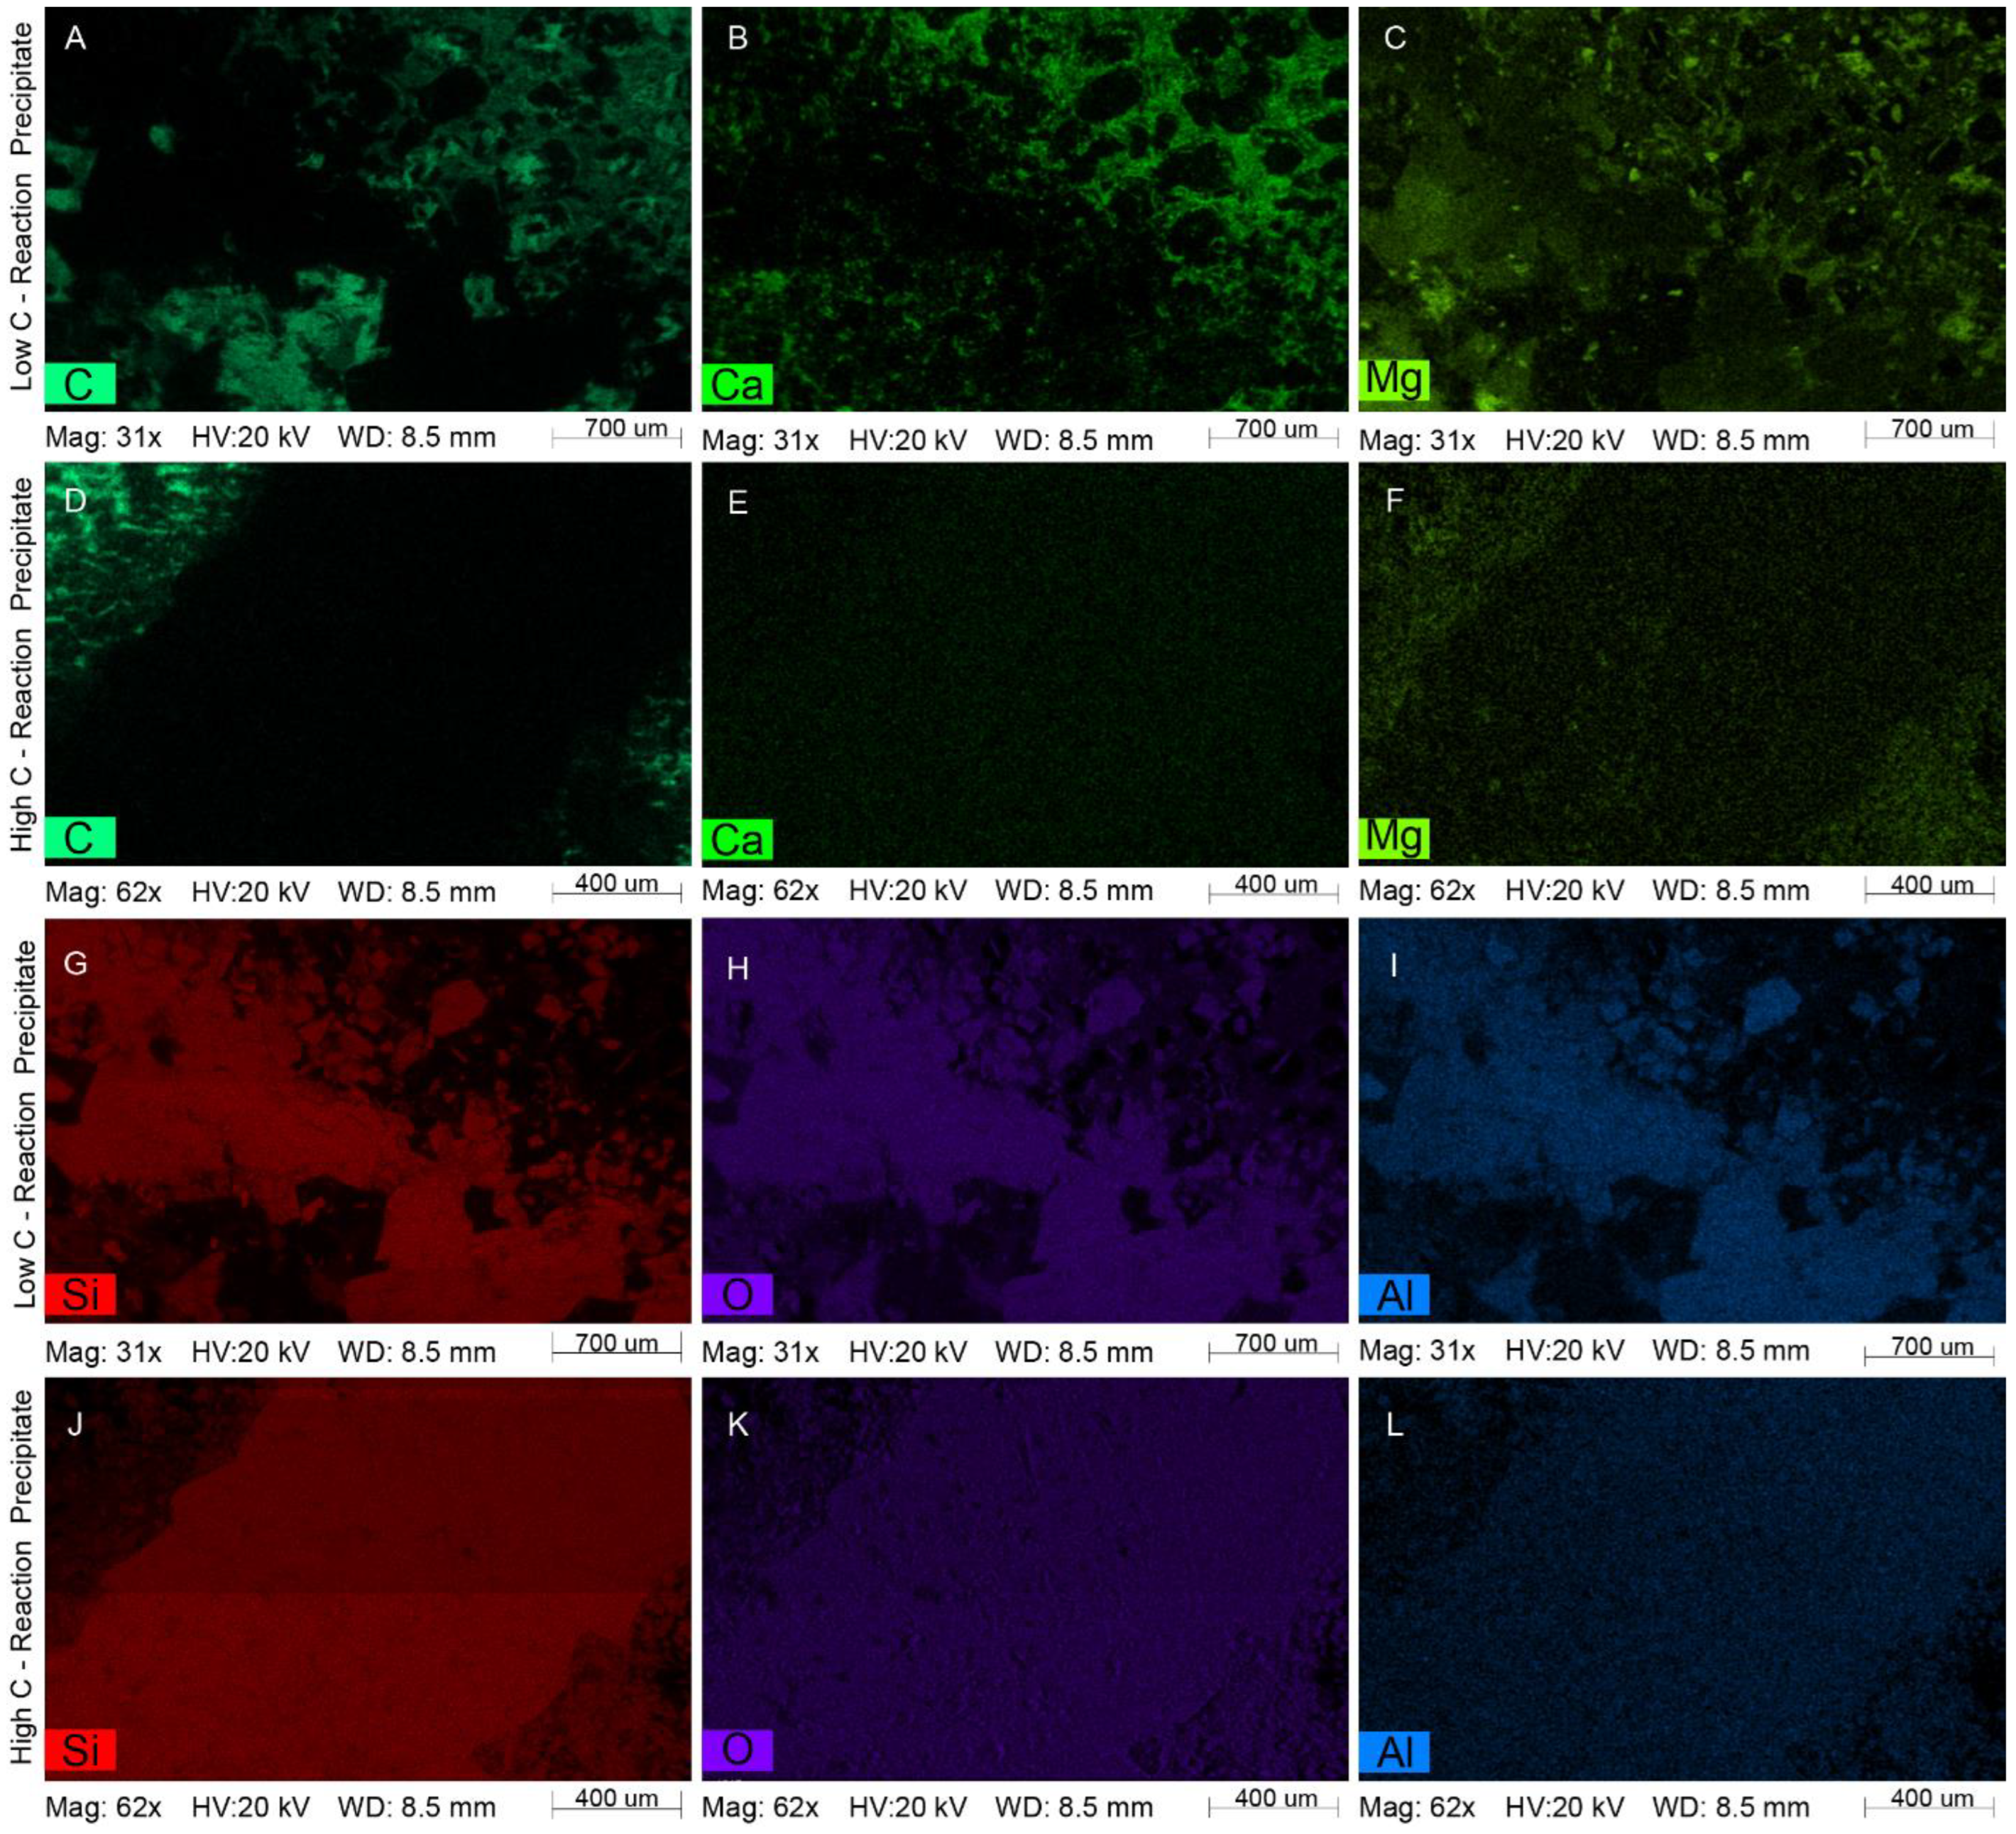
Figure 7 shows examples of the white fine-grained precipitate that coated all of the thin sections, some of which was removed from each thin section and put onto adhesive mounts for SEM analysis. Back scattered electron (BSE) images and composite elemental compositional maps of some of this precipitate obtained after 61 days and another 72 days of reaction time are shown in Figure 8 and Figure 9, respectively. The predominant red color of the compositional maps indicates that silicon is the predominant element in the particles. Underlying green tones in the compositional maps as well as some more intense green spots indicate a significant, if lesser, presence of Mg and Ca. This is further illustrated in Figure 10 and Figure 11, which show abundance maps for individual elements, confirming the predominance of Si in the precipitate with lesser amounts of Mg and Ca, respectively. These results suggest that silica and dolomite and/or calcite are the main constituents of the fine-grained white precipitate.

4.2.2. SGS Modal Minerals Analysis

Figure 12 shows BSE images of all four thin sections at the different stages of the experiments, i.e., the initial state, after 61 days of reaction, and after a further 72 days of reaction (133 days total). Black areas in the images represent pore space and the lighter gray areas represent the solid mineral matrix. A homogeneous gray area at the center-left of thin section 1310A.7684.6a (Figure 12H,I) represents an accidental loss of part of the thin section caused during at attempt to remove some of the white fine-grained precipitate. Little change in the proportion of pore space to mineral matrix (i.e., in porosity) over time is discernible. This is likely in part a function of the short experimental durations, which did not provide much time for mineral precipitation or dissolution, but is also consistent with the numerical modeling results of Kutsienyo et al. [6,15] which predicted minimal changes in reservoir porosity because of CO2 injection over time scales of up to 1000 years.
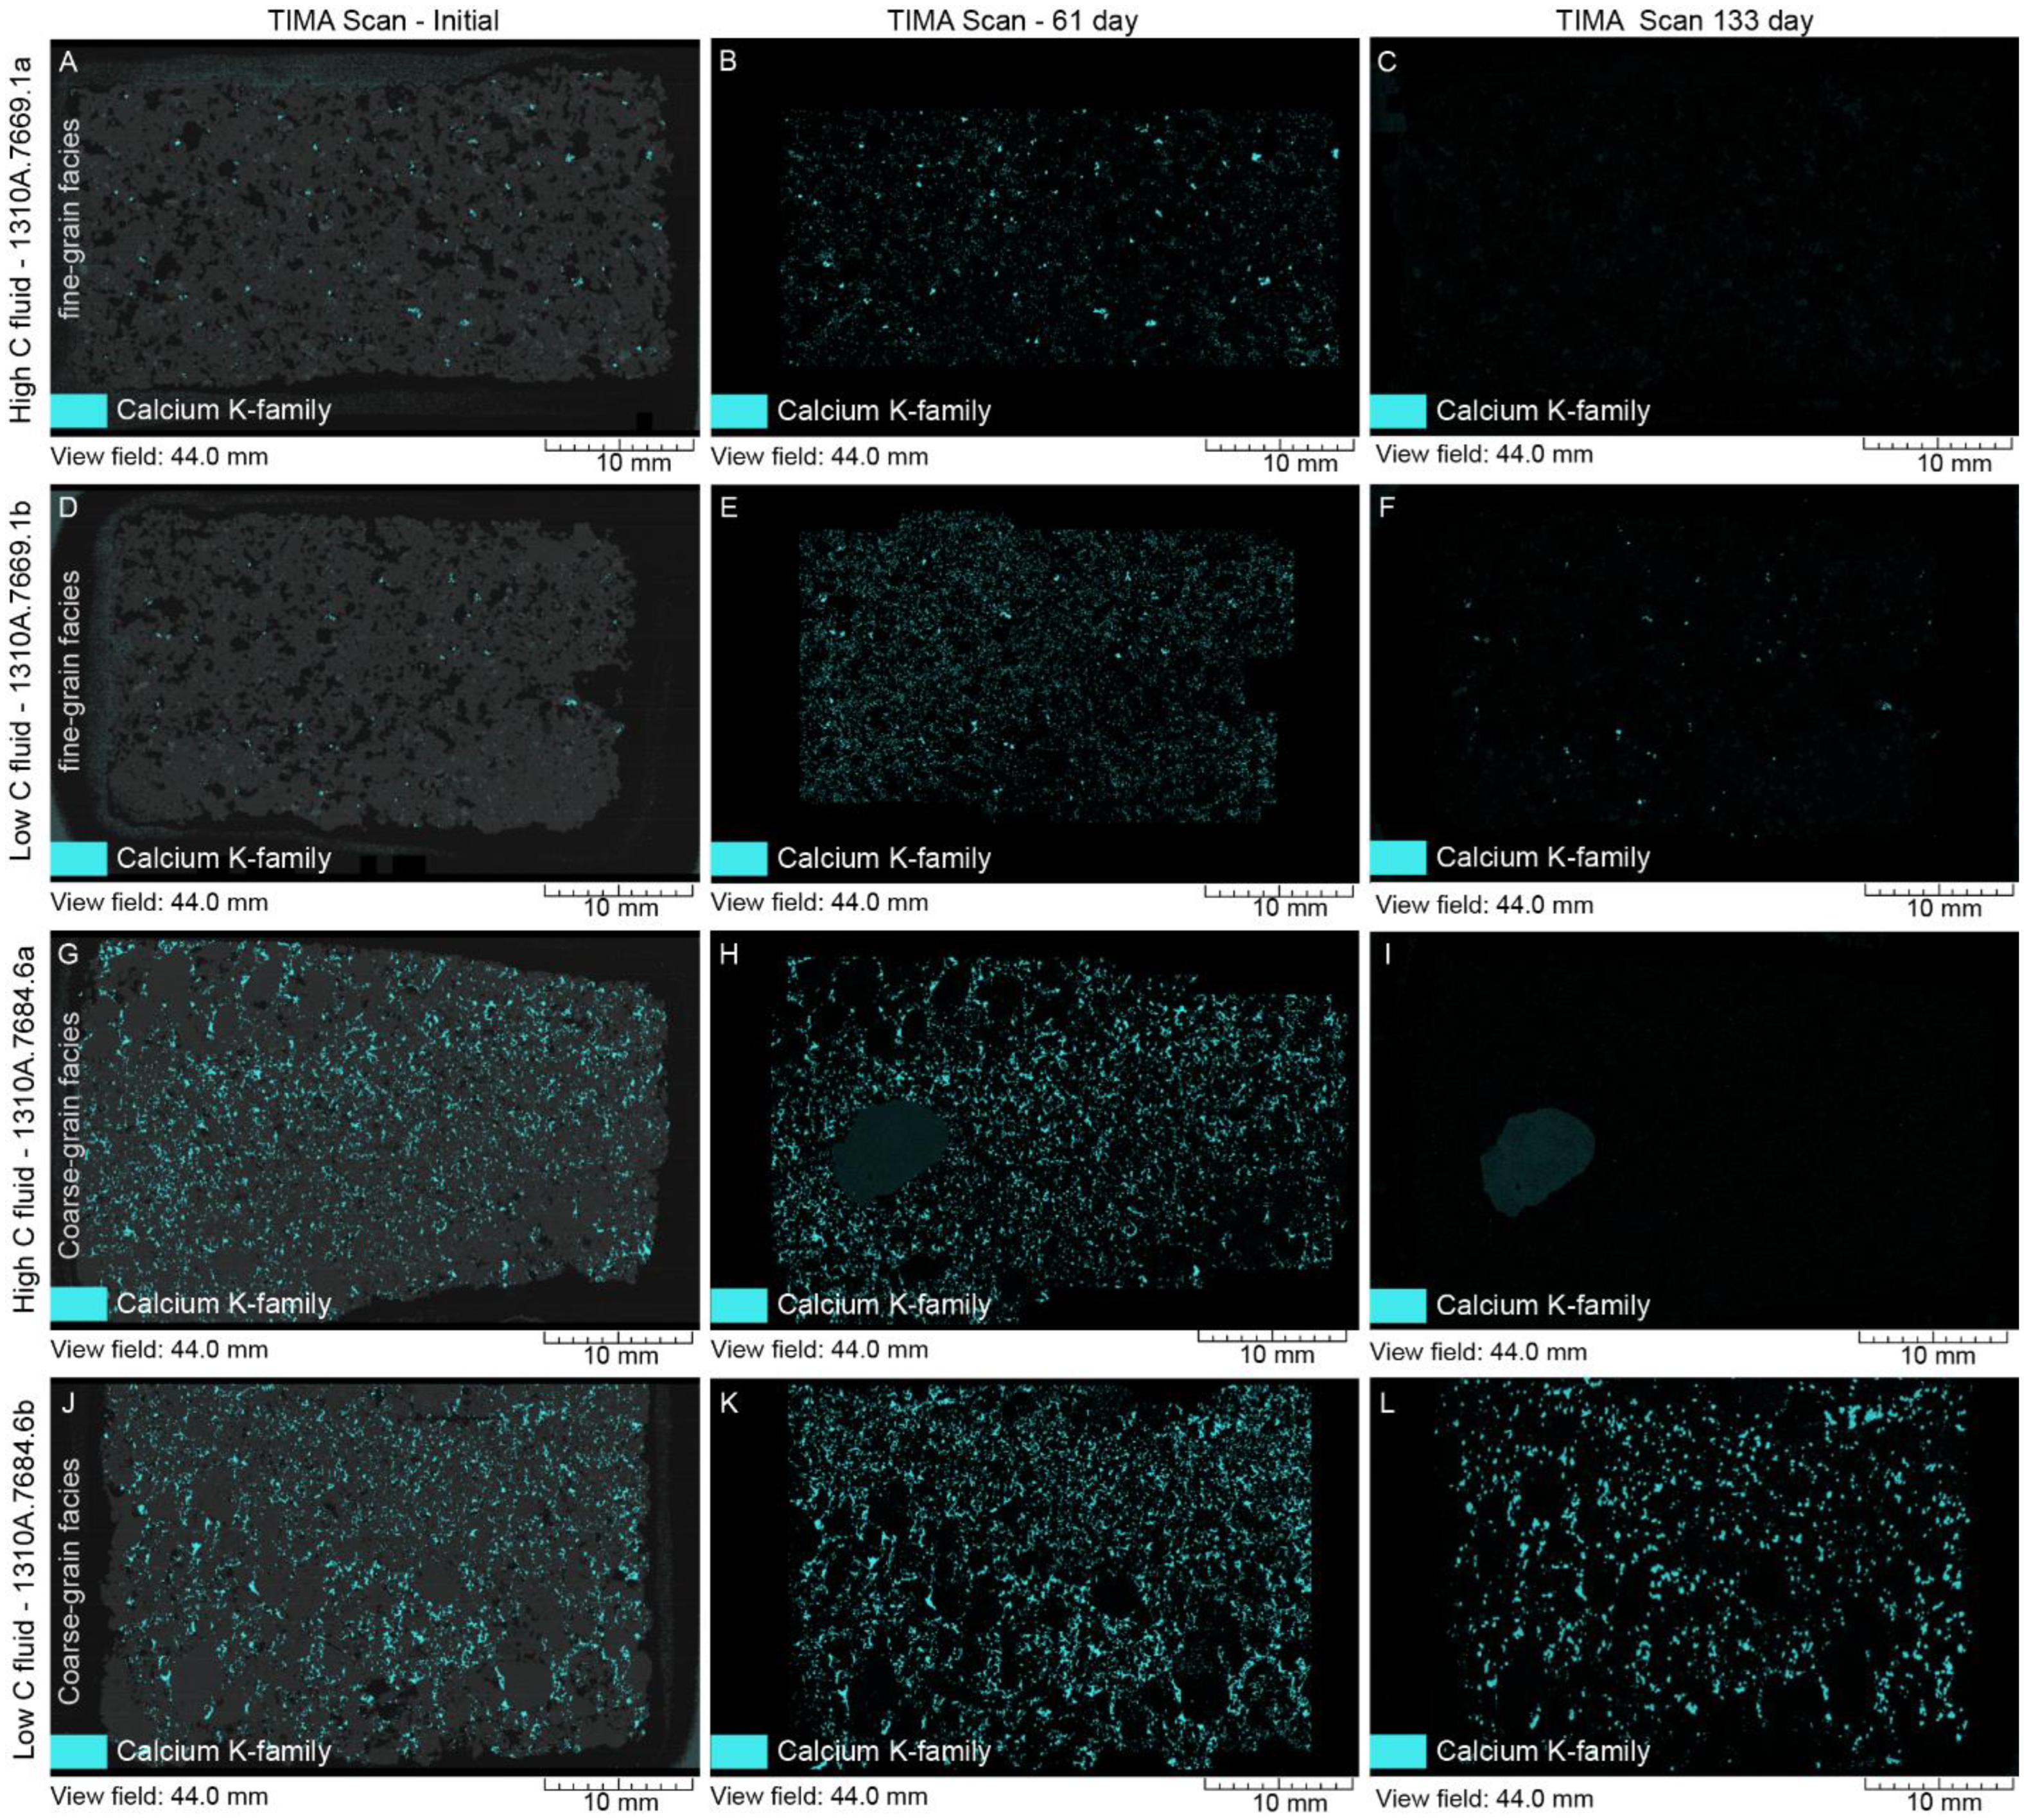
Figure 13 shows SEM energy dispersive X-ray (EDX) characterizations of the calcium content of the thin sections initially, and after 61 and 133 days of reaction time. The thin sections had steady or slight increases in calcium from 0 to 61 days, with marked decreases in calcium content after 133 days, particularly for the high-C experiments. The steady to slight increase in calcium content in the thin sections through 61 days corresponds to the decrease in calcium concentration in the experimental fluid after 61 days, indicating the precipitation of a calcium mineral, particularly a calcium carbonate mineral. The precipitation of a calcium carbonate mineral would have been promoted by the high pH of about 10.1 determined at the end of both the high-C and the low-C 61-day experiment. The reduction of the thin section calcium content between 61 and 133 days of reaction time suggests dissolution of some of the earlier formed calcium (carbonate) minerals. This is consistent with the lower pH of 7.9 and the increase in calcium content in both the high-C and low-C experimental fluid since the end of the 61 day experiment.
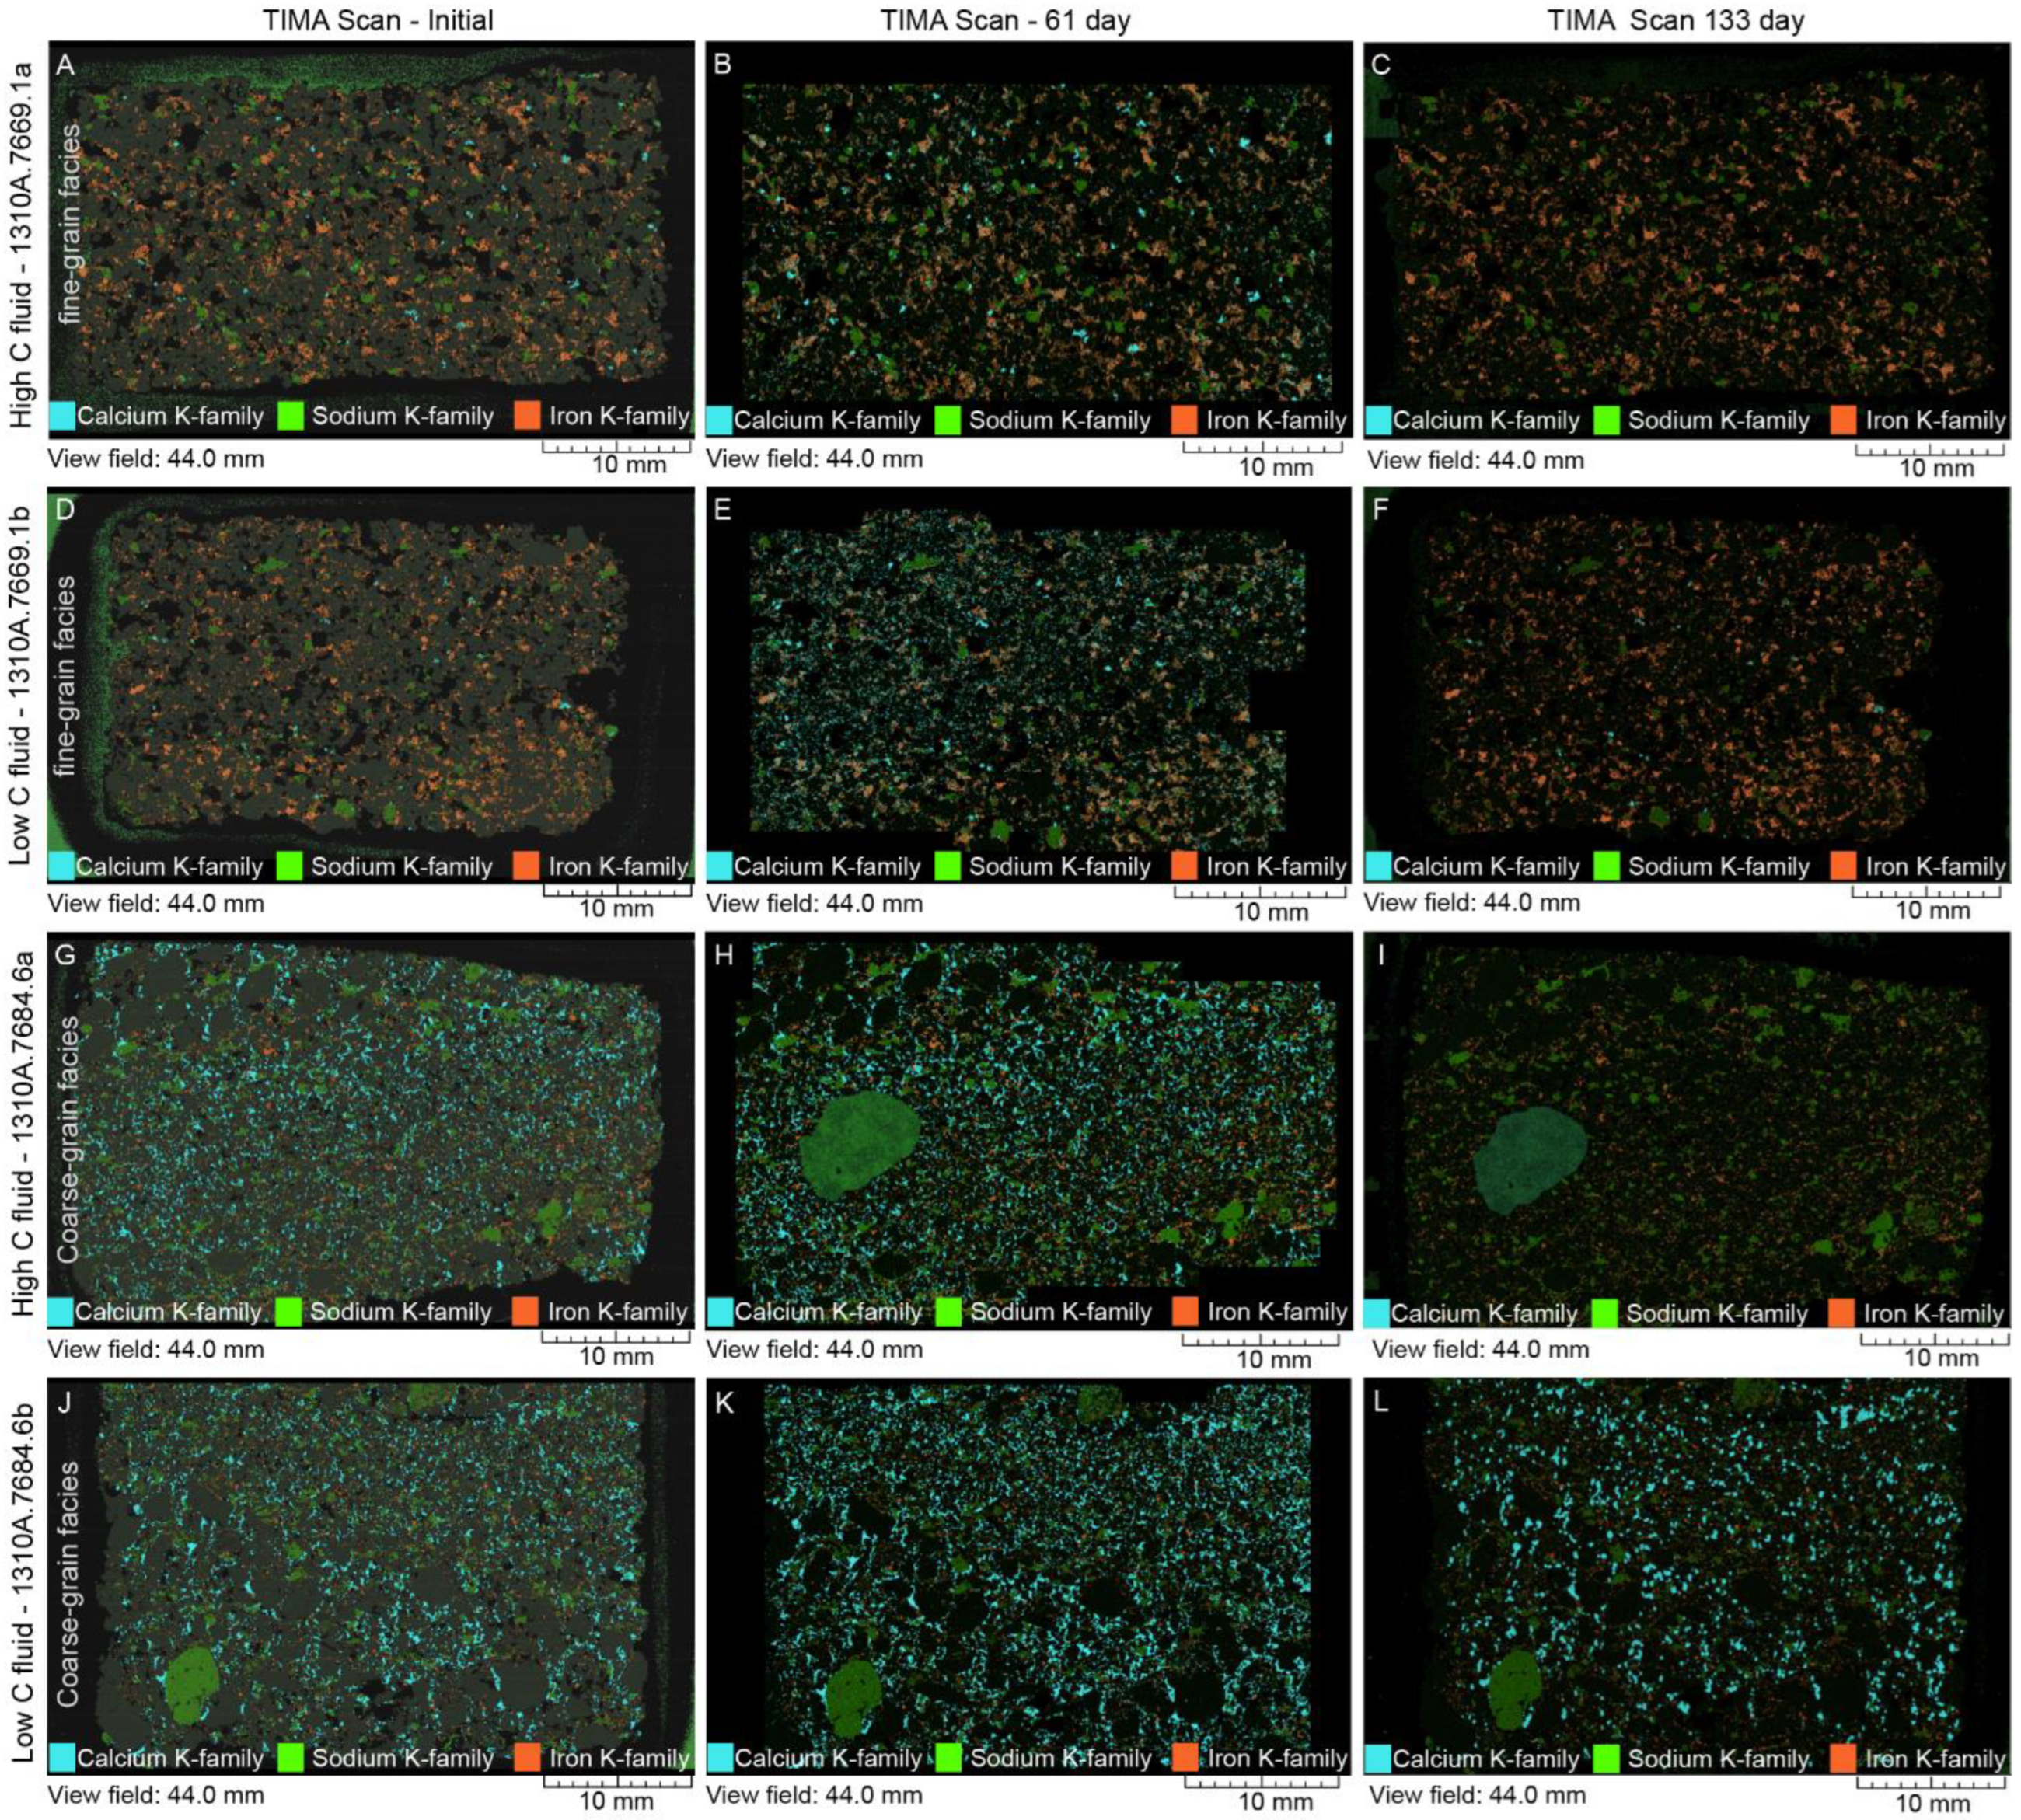
Figure 14 shows sodium, calcium, and iron content in the thin sections initially and after 61 and 133 days of reaction time. The images in Figure 14 show a proportional increase in iron by 133 days, which appears to have been caused by a decrease in calcium and sodium (most likely from dissolution of calcium carbonate minerals and albite). This is consistent with the increased fluid calcium concentrations noted above from 61 to 133 days, and the general increased fluid sodium concentrations after 61 and 72 days compared to the initial sodium concentrations.
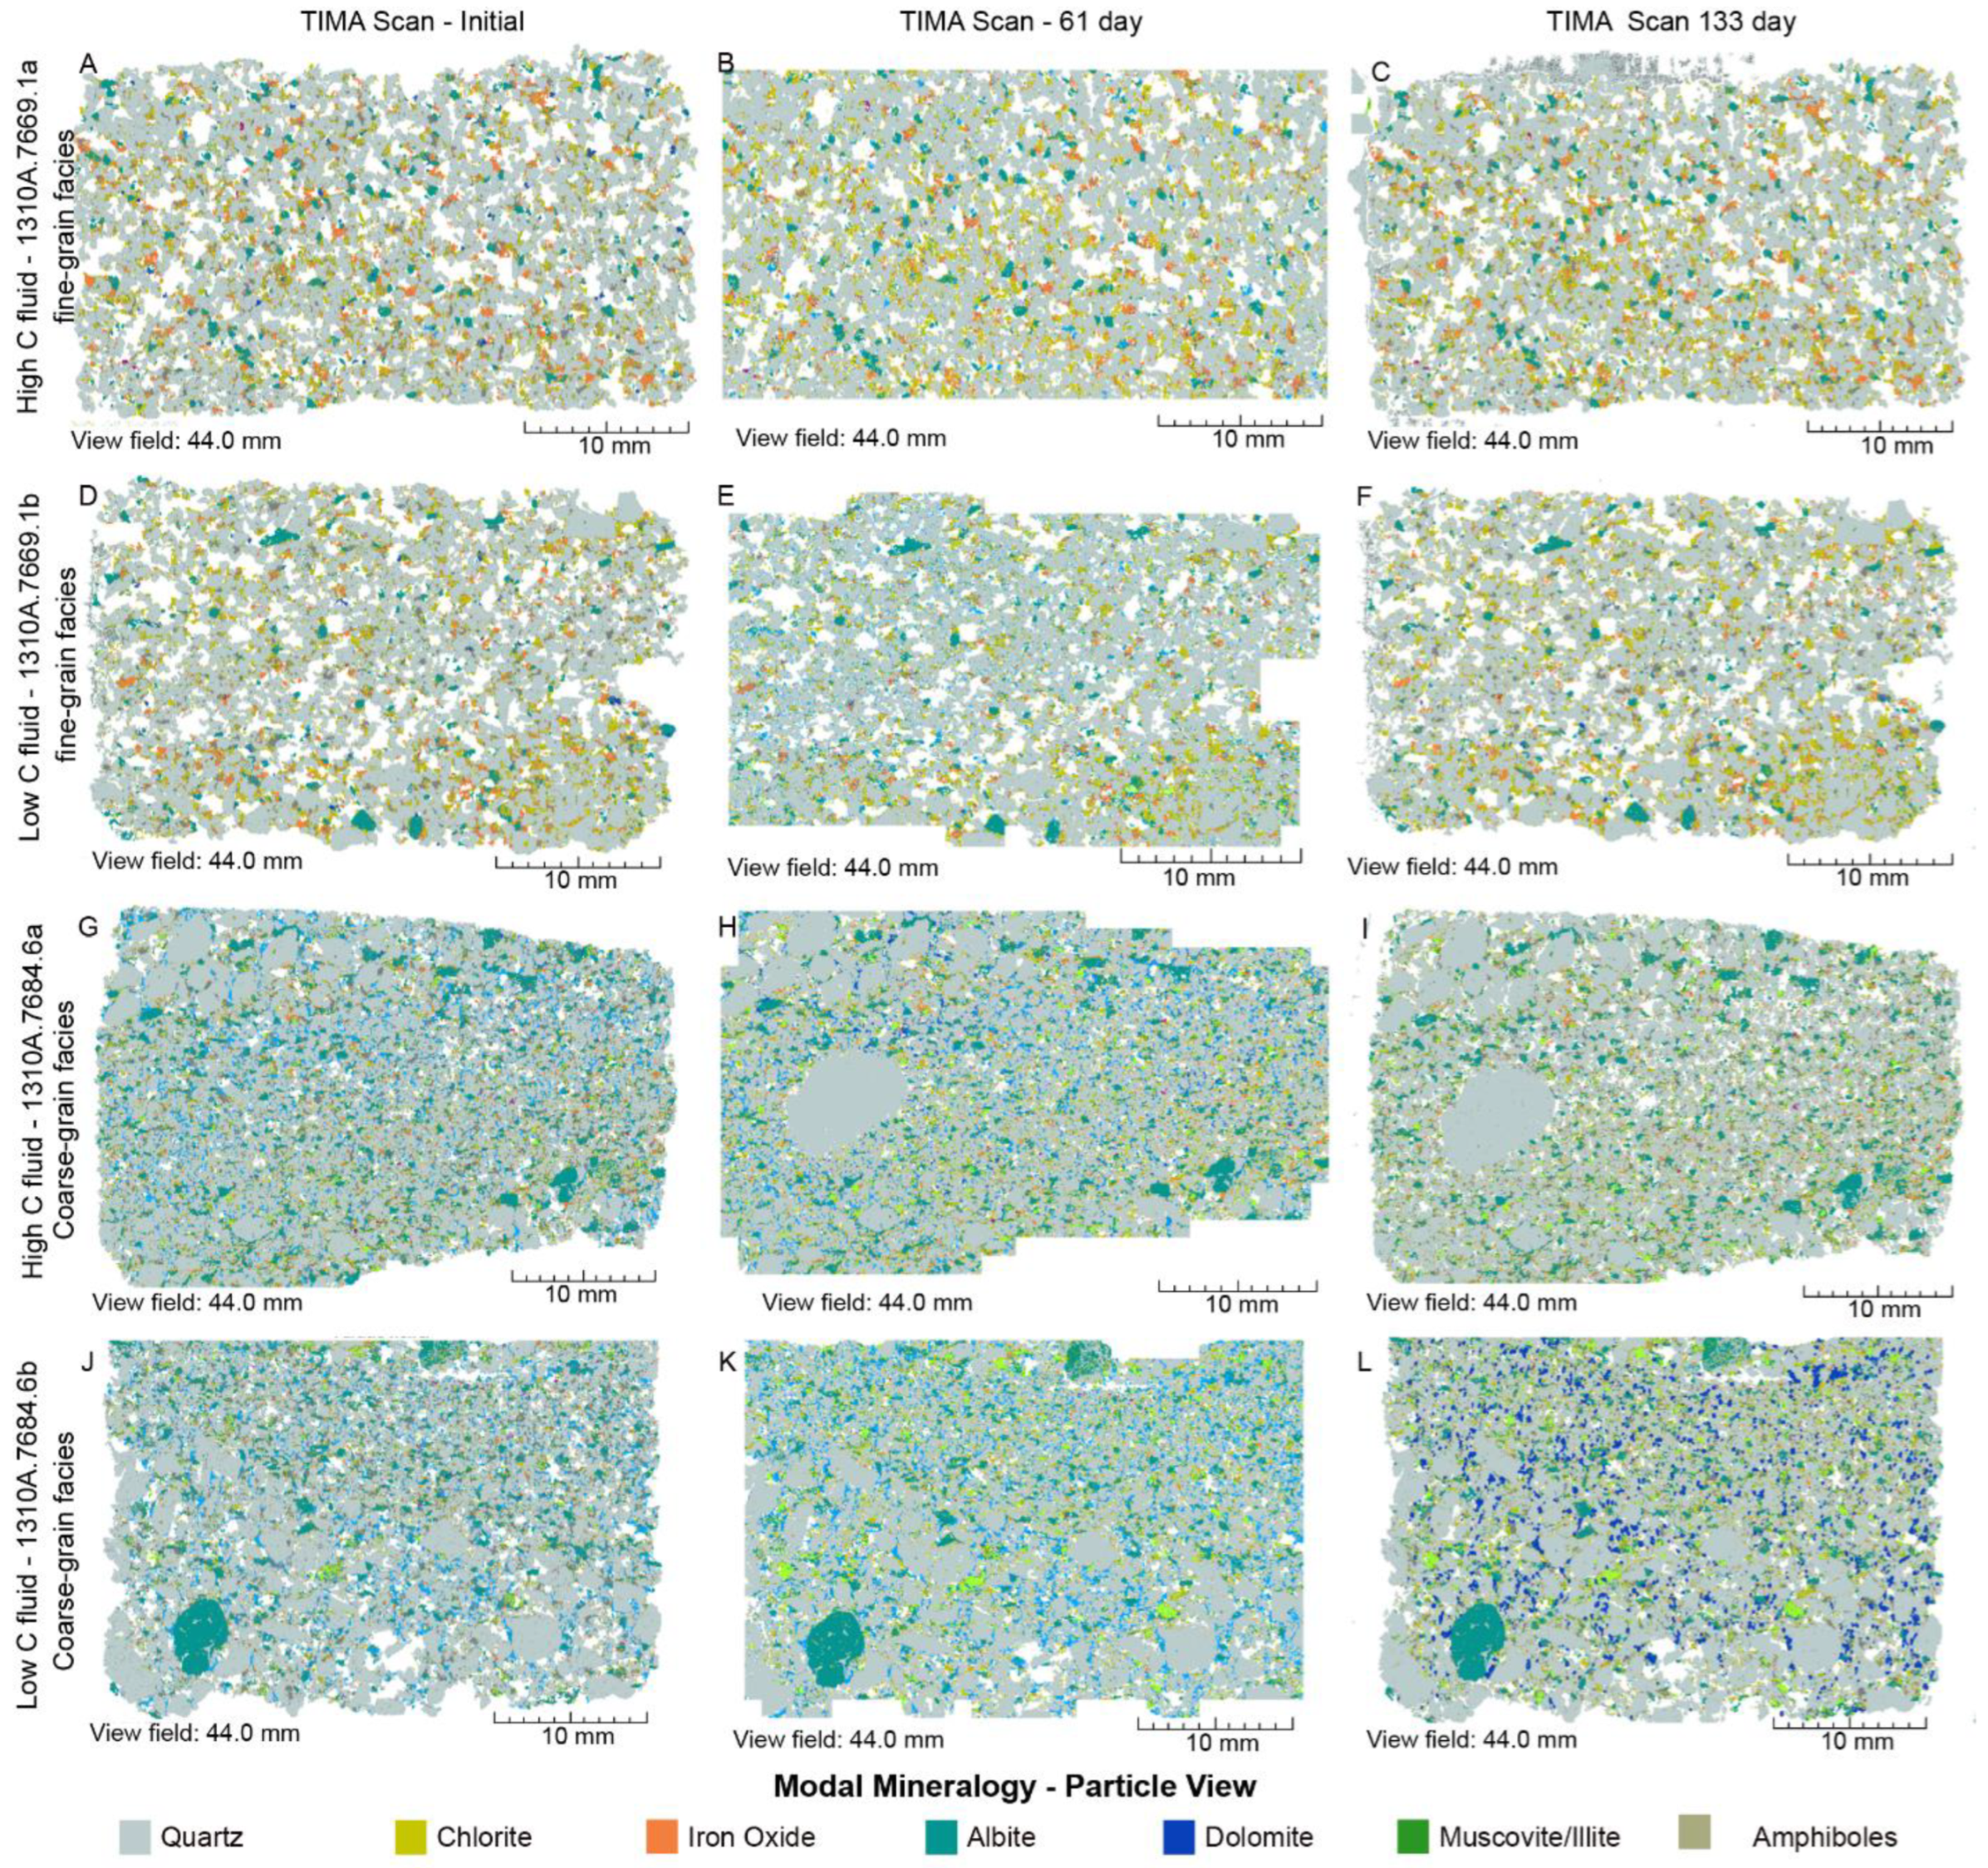
Figure 15 shows the distribution and abundances of minerals in each thin section over time, as determined by TIMA. The minerals detected by TIMA include quartz, chlorite, iron oxide, albite, dolomite, muscovite/illite, ankerite, kaolinite, calcite, rutile, epidote, and amphiboles, and are generally consistent with the minerals reported in previous petrographic studies [33,34].
Temporal changes in mineral abundance are difficult to discern in Figure 15, but are more clearly visible in Figure 16 and Figure 17. Figure 16 shows the volumetric percentage abundances of all of the carbonate minerals initially and after 61 and 133 days of reaction time. The first 61 days were predominantly a time of carbonate mineral precipitation, represented by calcite, dolomite, and ankerite. Exceptions are calcite and ankerite in the coarse-grained high-C fluid experiment, and ankerite in the coarse-grained low-C fluid experiment, which dissolved. Thus, over the first 61 days of the experiments, dolomite precipitated regardless of the carbon concentration of the fluid or the texture of the reservoir rock, and ankerite precipitated regardless of the carbon content of the fluid but only in the fine-grained facies.
The ensuing 72 day experiments were predominantly a time of carbonate mineral dissolution. The lone exception was the precipitation of dolomite in the coarse-grained low-C fluid. In the high-C fluid experiments, the carbonate minerals were completely dissolved away. Calcite was also completely dissolved away in the fine-grained low-C fluid experiment whereas dolomite and ankerite were only partially dissolved. Calcite and ankerite were partially dissolved in the coarse-gained low-C fluid experiment. Thus, overall, carbonate mineral dissolution was more pronounced in the high-C fluid than in the low-C fluid experiments, coinciding with the slightly lower pH of the high-C fluid compared to the low-C fluid, with texture not having a clear systematic effect. The extensive carbonate mineral dissolution during the 72-day experiment coincides with the large increase in the concentrations of Ca and Mg in the fluids during this time.
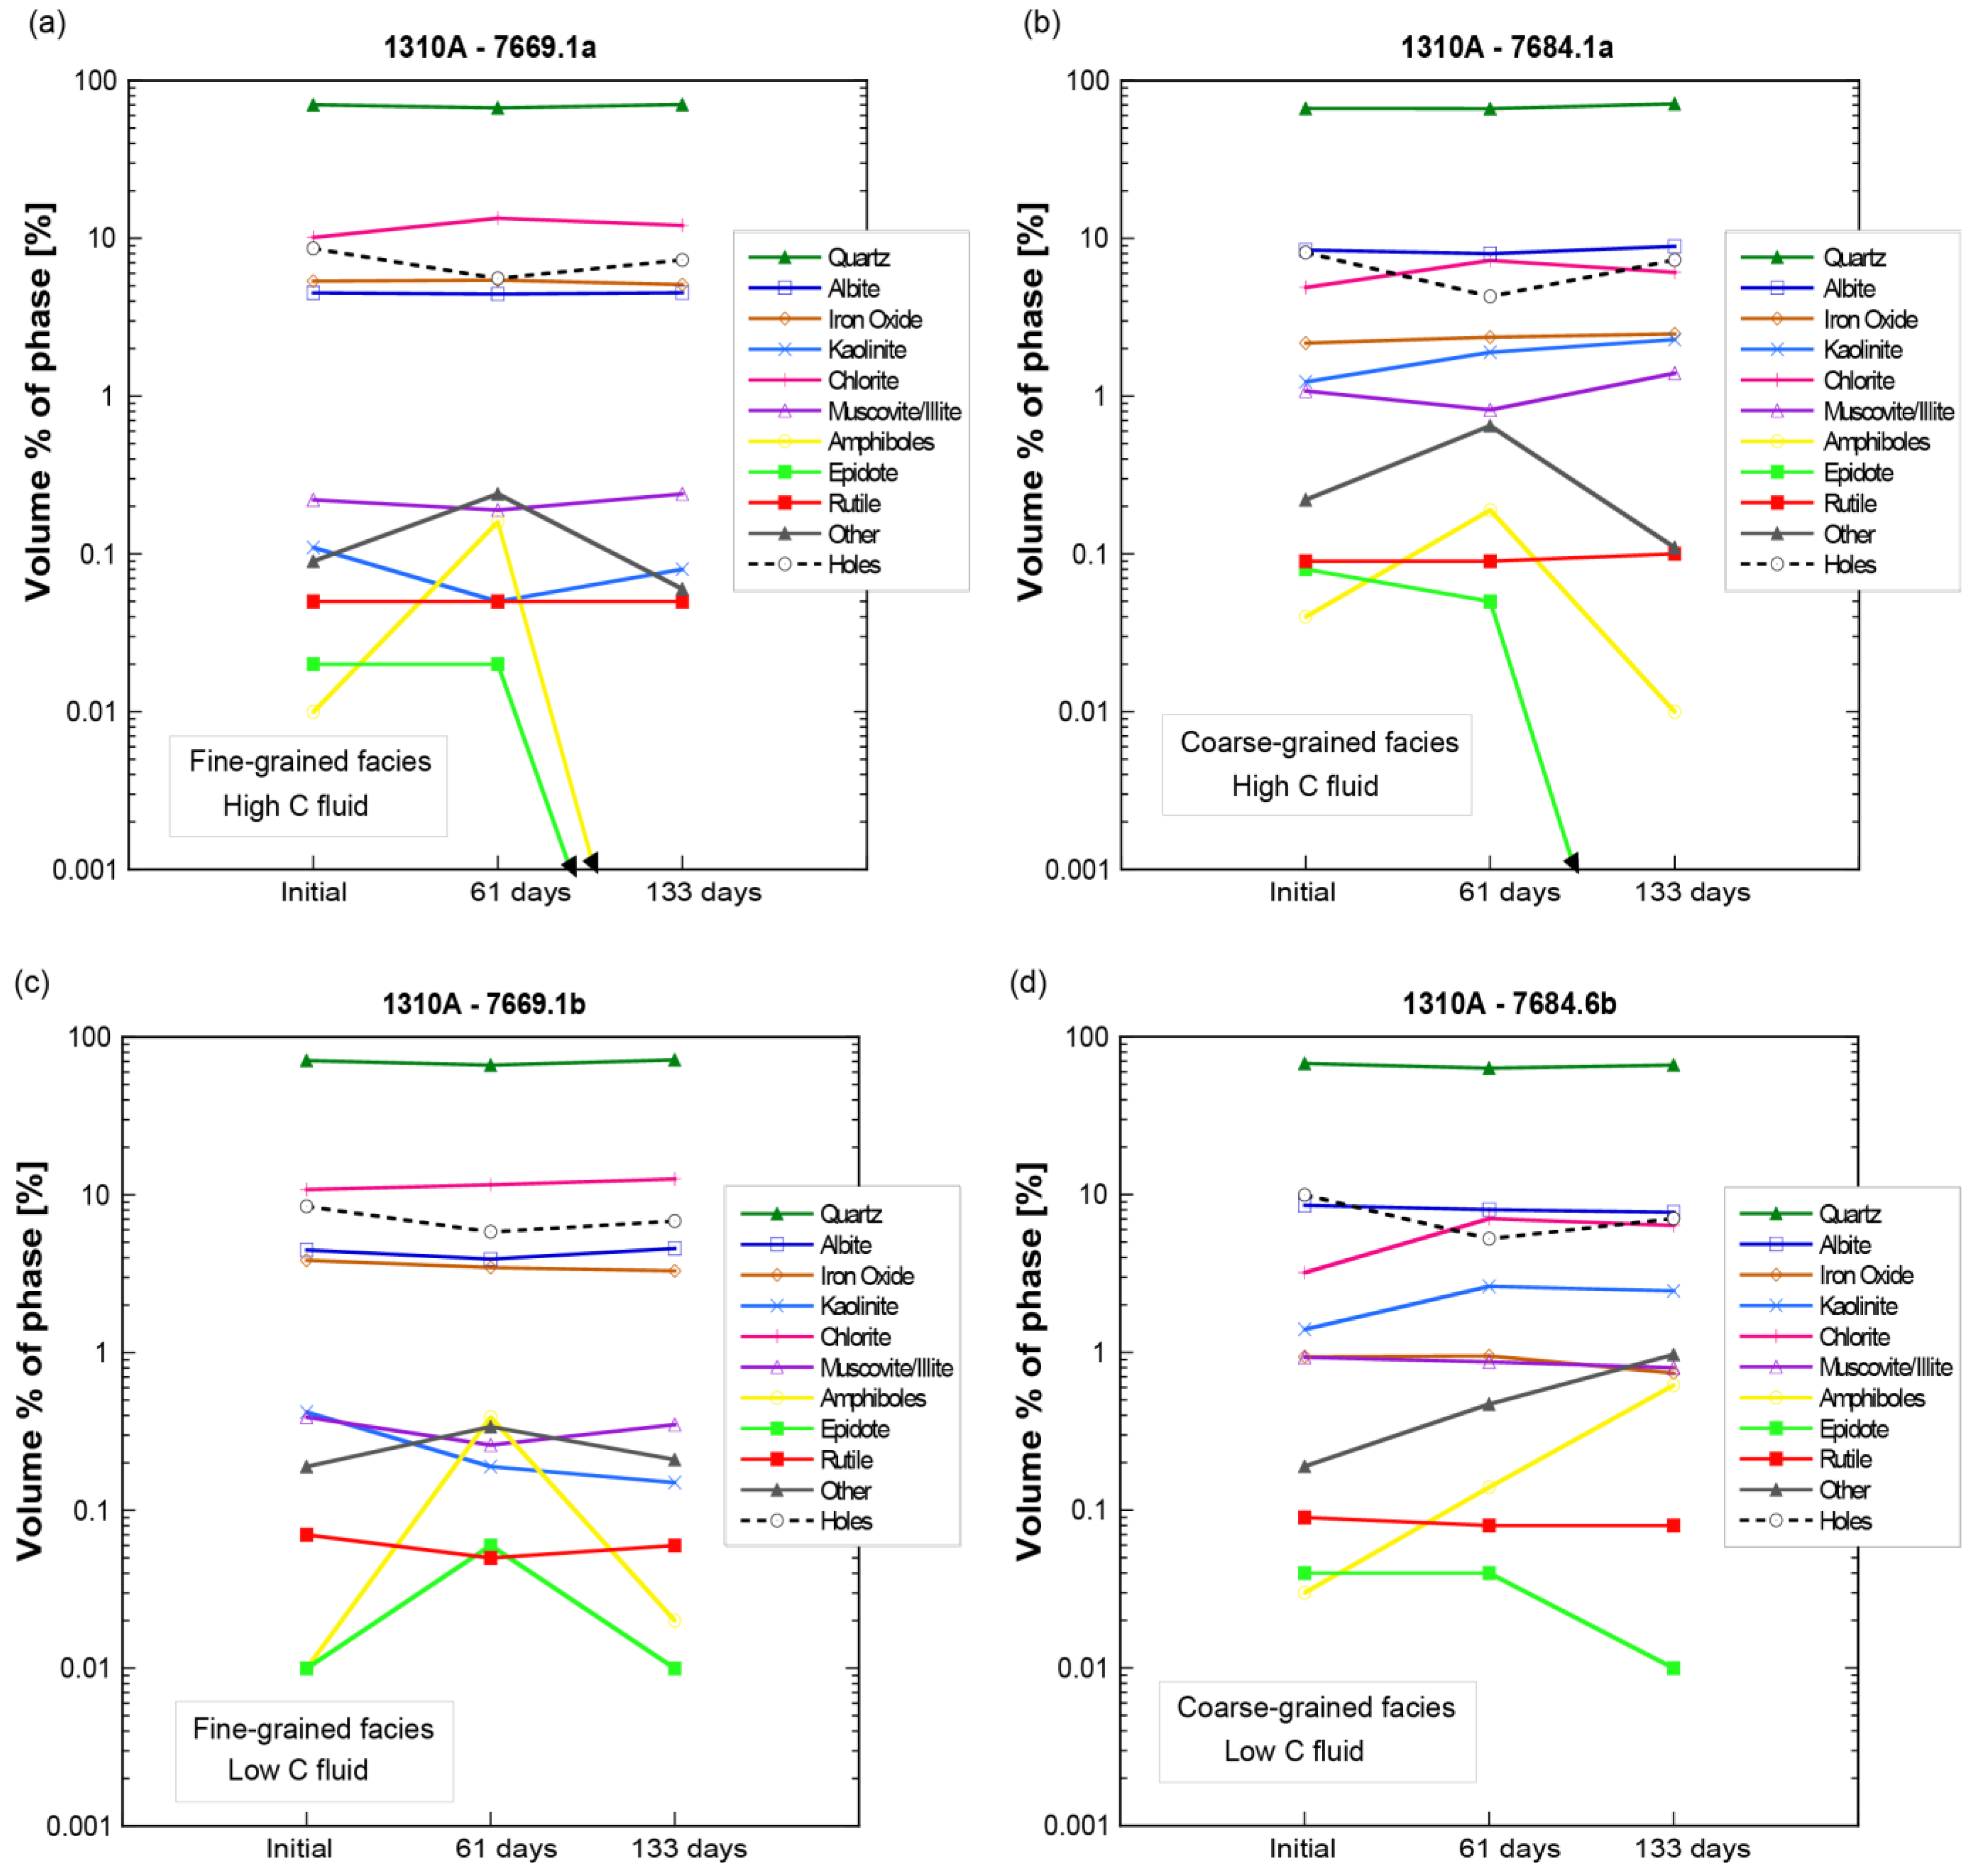
Figure 17 shows the volumetric abundances of the non-carbonate minerals as a function of reaction time. Although most of the changes in mineral abundances exceeded the 5–10% uncertainties of the TIMA analyses, few consistent systematic changes in mineral abundance occurred. Although silica precipitated heavily in fine-grained particles across the surfaces of the thin section as noted above, the abundance of quartz within the thin sections themselves remained relatively constant over time. The other major mineral constituents of the Morrow B, albite, chlorite, and iron oxides, also had relatively constant abundances over time, undergoing proportionally small amounts of precipitation or dissolution. The minor mineral constituents of the Morrow B showed some systematic differences during the reactions. The biggest recorded changes were the net decreases of amphibole and epidote in the high C experiments. Kaolinite had a small net decrease in abundance over the 133 days of the fine-grained facies experiments but a small net increase in the coarse-grained facies experiments. Rutile and iron oxides remained relatively constant over time. Muscovite had relatively constant abundances over time, the largest net change being a net increase in the high-carbon coarse-grained facies experiment. Many of the minerals in all of the experiments showed non-monotonic changes in abundances. That is, they precipitated during the first stage of the experiments and dissolved in the second stage, or vice versa.
The abundance of holes (i.e., porosity) exhibited this non-monotonic behavior, with holes consistently decreasing during the first stage of the experiments but increasing during the second stage. This indicates that the experiments underwent net mineral precipitation during the first stage and net dissolution during the second stage, corresponding with the prevailing carbonate mineral dissolution during the second stage of the experiments documented in Figure 16. The overall changes in hole abundance were on the order of a few percent.

4.3. Numerical Modeling and Predictions

In order to provide a more direct comparison of the above laboratory experiment results with numerical modeling predictions, a new suite of fluid-static reaction path simulations was computed. The model grid design used in the present study followed that described in Kutsienyo et al. [15]. The initial composition of the formation water in the model was the same as that of water used in the laboratory experiments shown in Table 1. The initial volume fractions of the minerals in the models were taken from the initial thin section TIMA analyses. The models were computed at the reservoir temperature of 75 °C and an initial reservoir pressure of 30 MPa. Initial carbon concentrations were the same as those used in the laboratory experiments. Although the bulk average mineral proportions in each thin section could be easily entered in the model input, spatial heterogeneity in initial mineral proportions were not known and thus could not be included in the models.
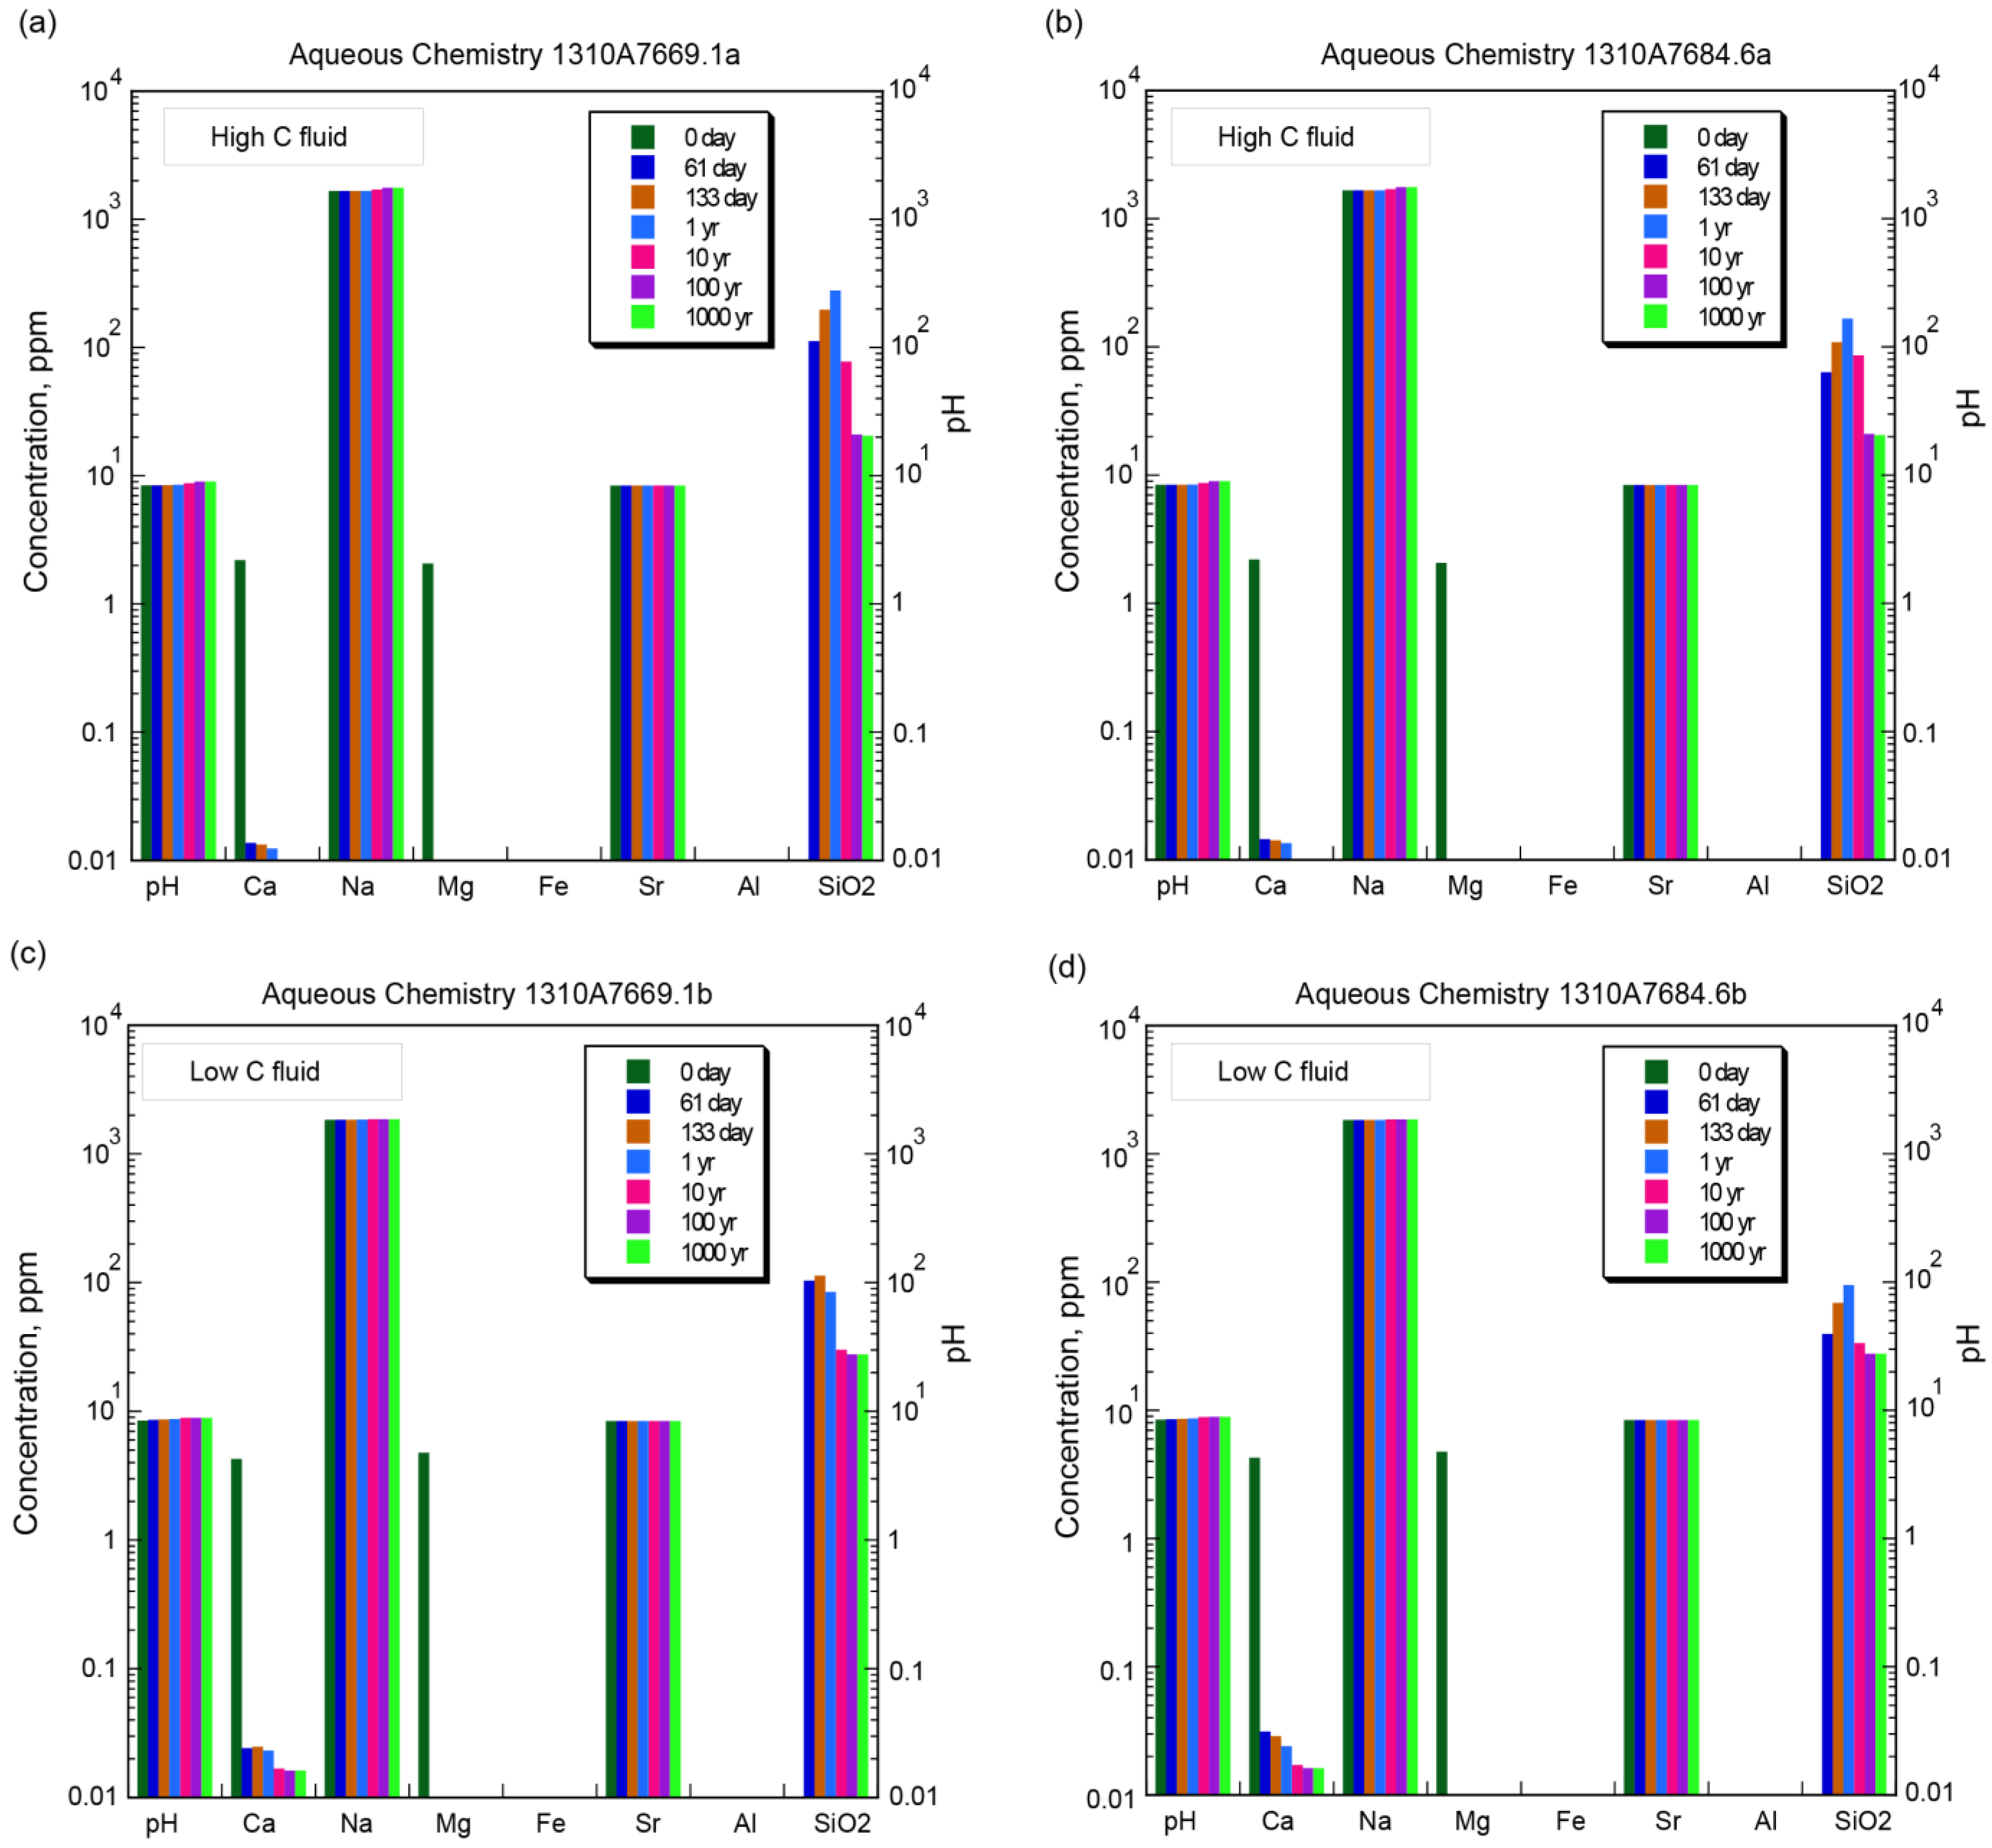
The reaction path models consistently predicted slight increases in sodium concentration and pH in the formation water over time (Figure 18). The laboratory experiments also showed slight increases in sodium concentration over time, but an initial increase in pH followed by a decrease. The models predicted relatively constant strontium concentrations in the formation water over time whereas in the laboratory experiments, strontium concentrations decreased significantly. The strontium decrease in the laboratory experiments was probably caused by the incorporation of strontium as a minor element in dolomite, which the reaction path models did not treat. The models consistently predicted calcium and magnesium to decrease sharply in the formation water over time, with magnesium decreasing more quickly. In addition, calcium concentrations remained somewhat higher in the low-C fluid model than in the high-C fluid model. In the laboratory experiments, calcium and magnesium also decreased significantly in the formation water over time. In both the reaction path models and the laboratory experiments, the decrease in calcium and magnesium was probably caused mainly by the precipitation of dolomite. Modeled silica concentrations in the formation water initially increased slightly, but after one year began to decrease. Silica concentration was not measured in the 61 day laboratory experiment but was found to decrease slightly in the second experiment from 62 to 133 days, probably reflecting the precipitation of quartz or other silica phases noted above.
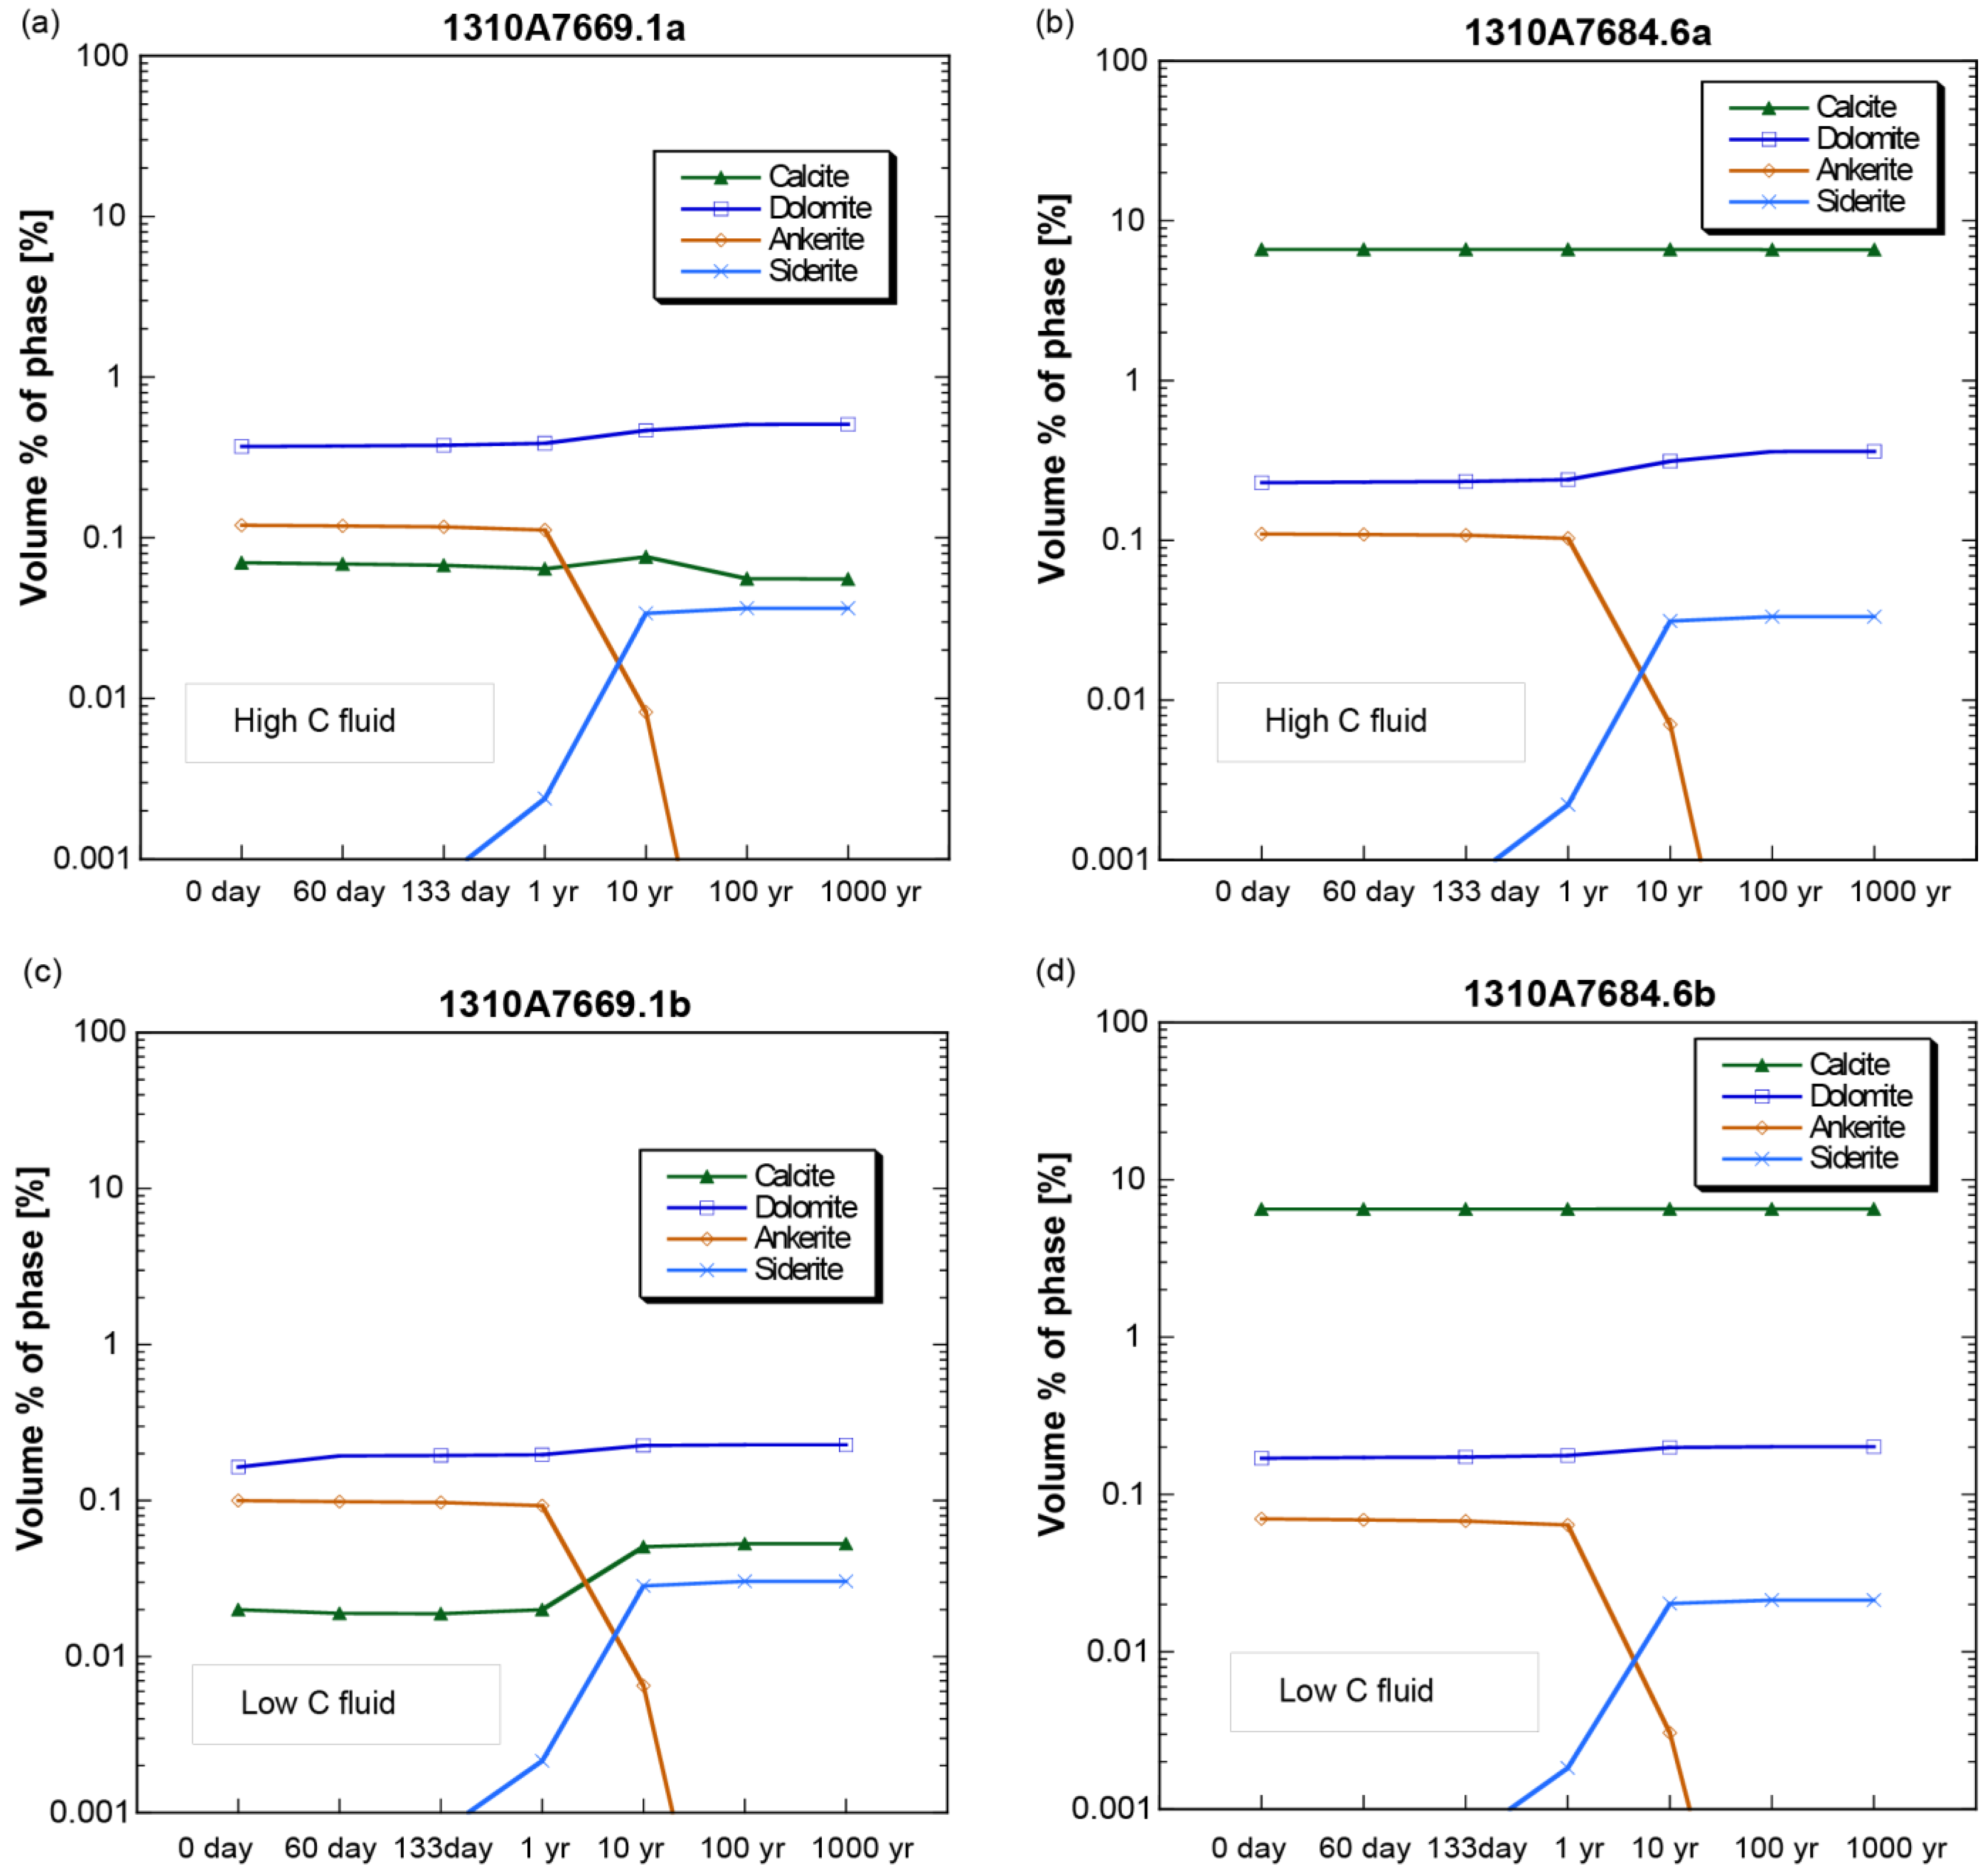
The reaction path models predicted conditions that were generally more favorable for the precipitation and preservation of carbonate minerals than was found to be the case in the laboratory experiments (Figure 19). Dolomite and siderite abundances increased over time in the models. Calcite in the models either remained about constant in abundance over time, decreased slightly, or increased. Only ankerite dissolved consistently in the models. In the high-C laboratory experiments, calcite, dolomite, and ankerite were predicted to dissolve sharply by the end of the experiments, though they dissolved or precipitated more gently during the first (61 day) stage of the experiments. Calcite, dolomite, and ankerite also dissolved by the end of the low-C experiments, except for dolomite in the coarse-grained facies, which continuously precipitated over time. Siderite was not detected in any of the laboratory experiments.
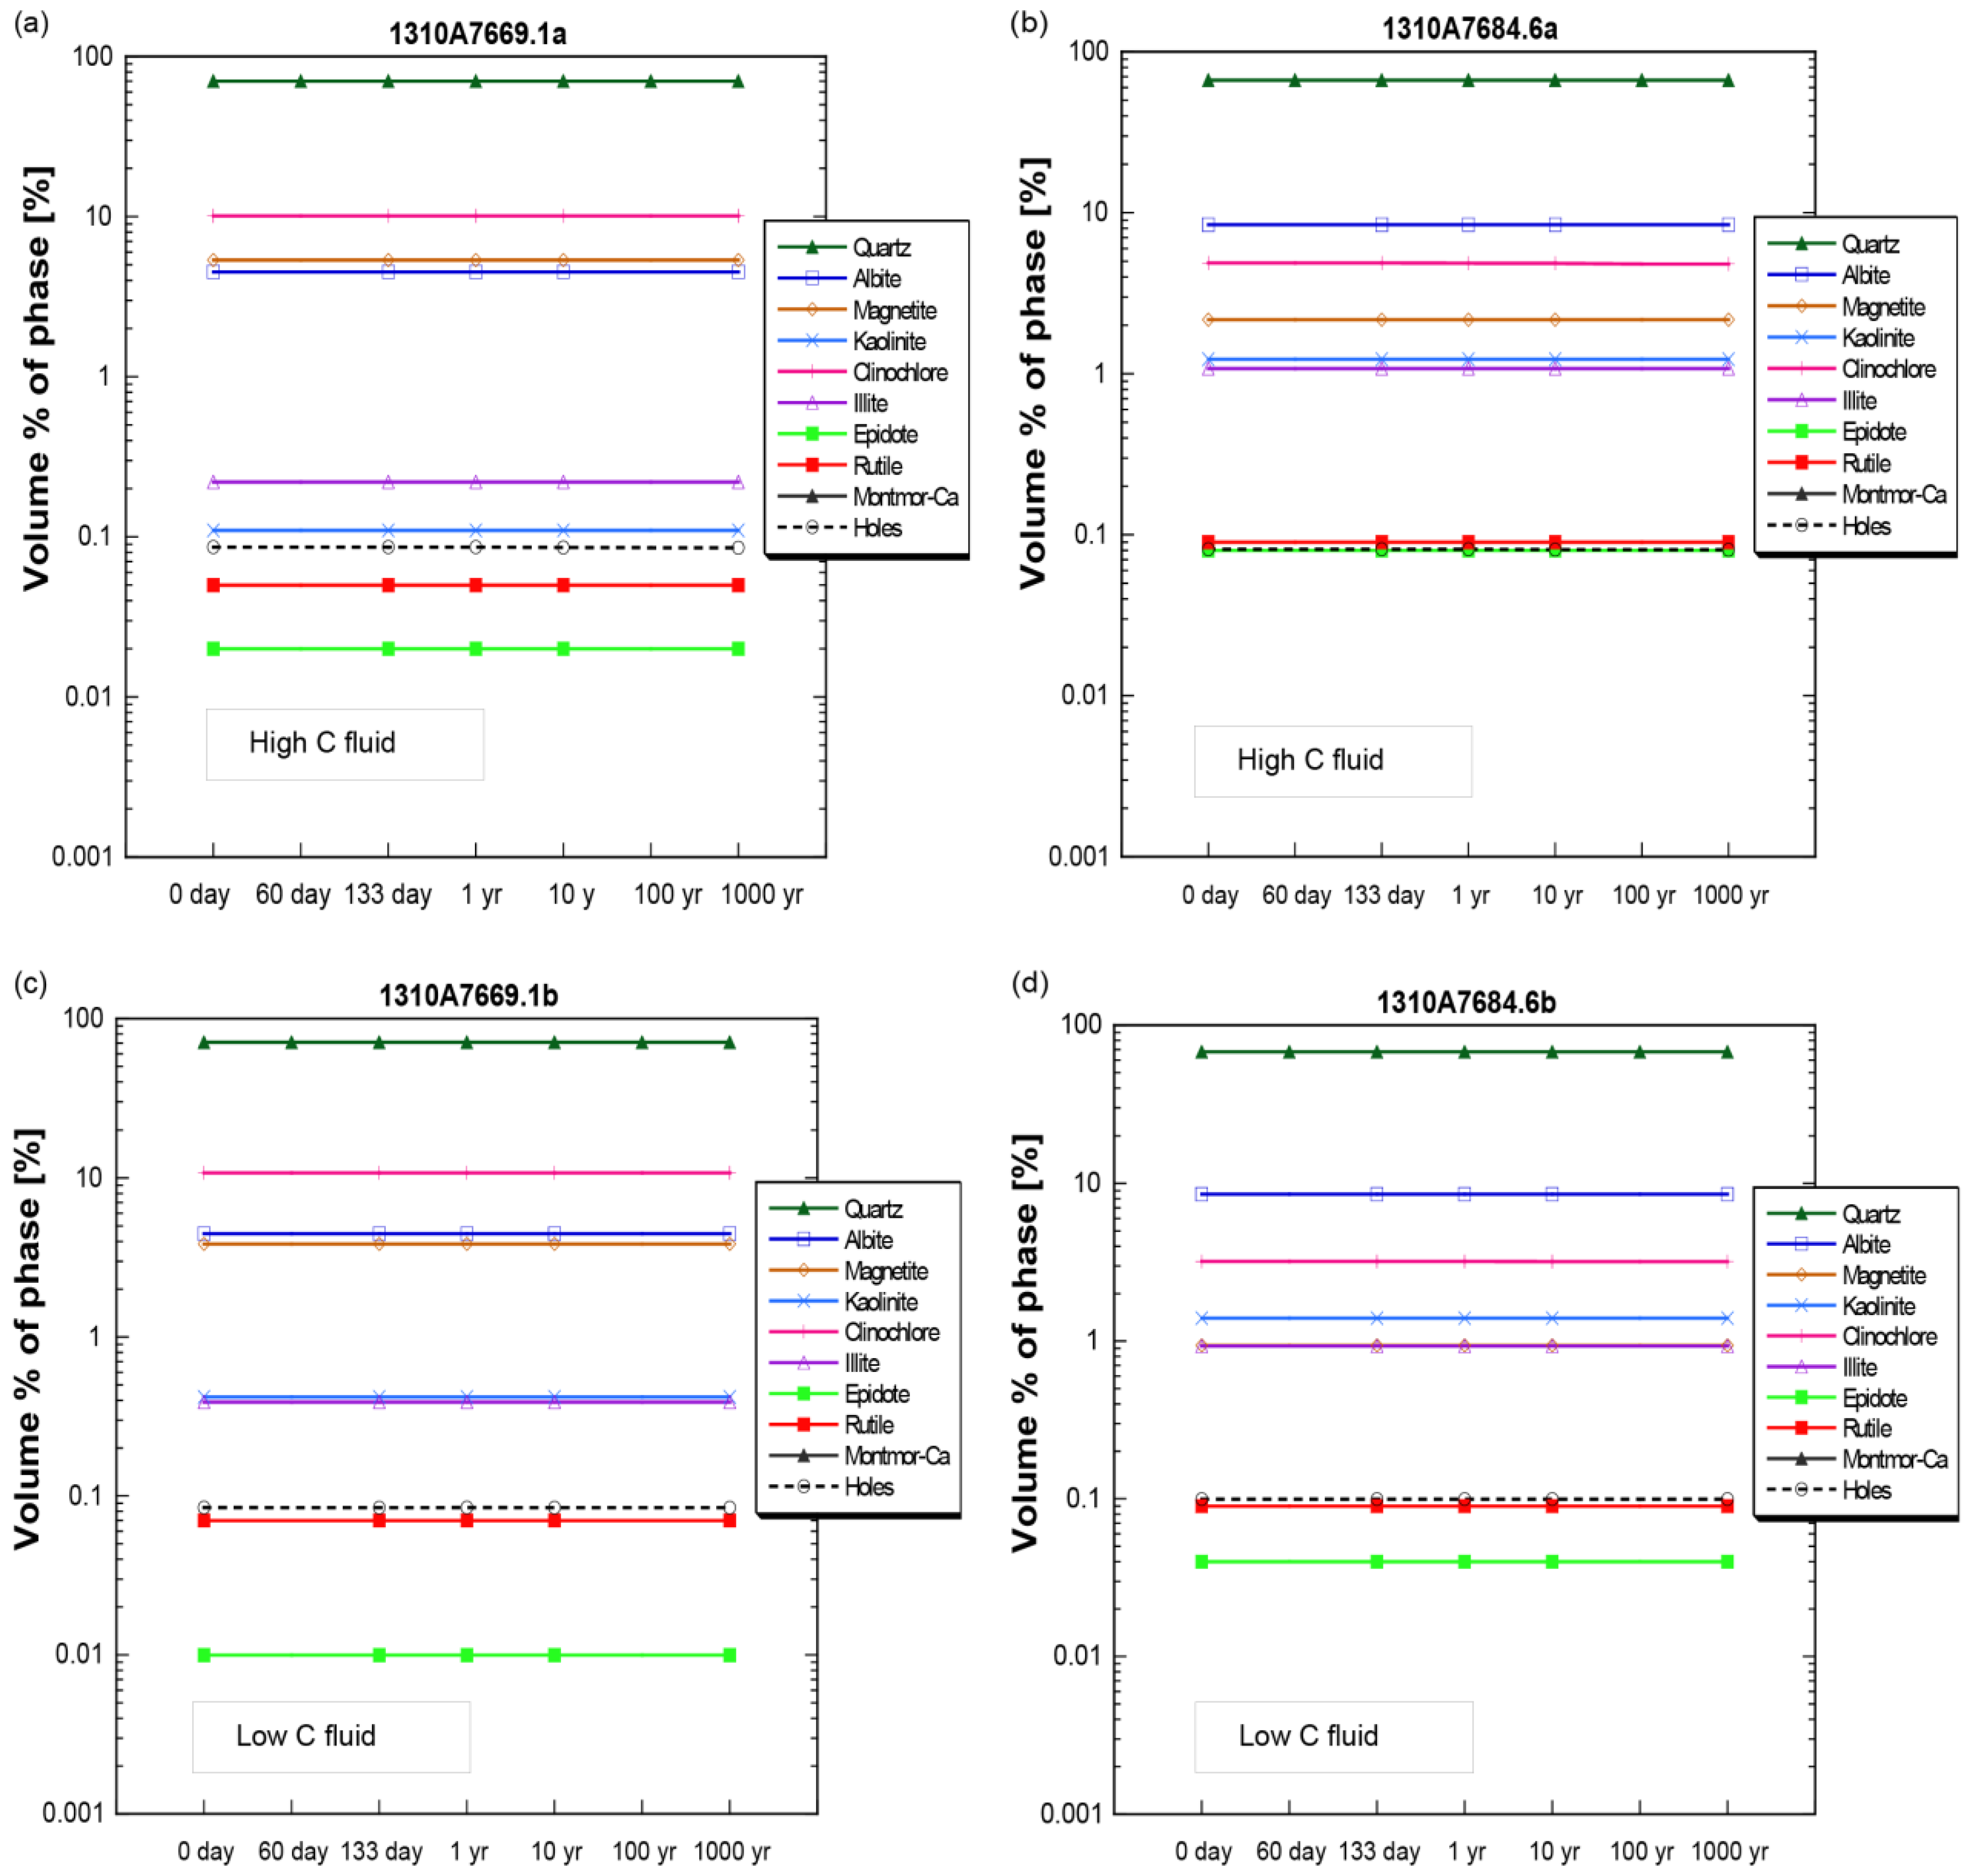
The non-carbonate minerals did not show any significant evolution in abundance over time, as shown in Figure 20. For the most part, the laboratory experiments also did not show large changes in mineral abundance, the biggest exceptions being amphibole and epidote (Figure 17).

5. Discussion

The main product of the laboratory experiments was the solid precipitate that coated the surfaces of the thin sections. The SEM analyses showed this precipitate likely to consist mainly of silica and dolomite. This result is generally consistent with the numerical reactive transport model results described in Kutsienyo et al. [15] and Kutsienyo et al. [6]. The experimental results are also consistent with the reaction path model results in the present study: the reaction path model results predict a steady increase in dolomite abundance over time, though the amount of silica precipitated in the reaction path models is too small to alter the proportional abundance of quartz significantly. Other modeling studies by Ahmmed et al. [4], Pan et al. [10], Khan [11], Kutsienyo et al. [12], Sun et al. [13], Kutsienyo et al. [15], Gyamfi et al. [8], and Kutsienyo et al. [6] consistently predicted silica to precipitate (as quartz) as well, and Khan [11] also predicted dolomite to precipitate. The experimental results are important because they demonstrate the intrinsic state of silica saturation of the Morrow B formation water and the importance of dolomite as a mineral sink for CO2, as predicted from the theoretical models.
Correspondence between the laboratory experiment results for mineral abundances within the thin sections and the theoretical modeling results was less consistent and less systematic. For example, dolomite, which in the laboratory experiments was abundant in the solid precipitates that coated the thin sections, was actually found to decrease over time in three of the four thin sections. The laboratory experiments tended to predict ankerite to precipitate before dissolving, whereas the theoretical models showed ankerite to dissolve continuously. The theoretical models predicted albite abundance to remain relatively constant but in three of the four laboratory experiments, albite underwent either net precipitation or dissolution. However, calcite, which was predicted to dissolve in all of the theoretical studies cited above except that of Khan [11], was also found to undergo net dissolution in the laboratory experiments, though not monotonically in that it precipitated during the first stage of the experiments (from zero to 61 days) and dissolved in greater amounts than it precipitated during the second stage of the experiments (from 62 to 133 days). In the present study, theoretical model calculations showed calcite to dissolve in one case, to remain about constant in abundance in two other cases, and to dissolve in the fourth case.
The laboratory experiments confirm, to some extent, the theoretical effect of carbon concentration on mineral solubility. Dissolution of carbonate minerals was more vigorous in the high-C laboratory experiments than in the low-C experiments. This is expected because higher carbon concentrations lead to higher concentrations of carbonic acid, which lowers the pH and increases carbonate mineral solubility. Non-carbonate minerals do not seem to have been affected strongly by the differences in carbon concentration in the experiments.
A notable difference between the laboratory experiments and the reaction path models is how variable the mineral abundances in the laboratory experiments are over time, whereas the mineral abundances in the reaction path models are relatively constant over time. This difference may be a function of the heterogeneity in grain size, surface area, and spatial distribution in the thin sections, whereas in the reactive transport models these grain properties are homogeneous. For example, undersaturated mineral grains with high surface area to volume ratios would dissolve faster and be consumed sooner during the first stage of the experiments, leaving a higher proportion of undersaturated mineral grains with lower surface area to volume ratios in the second stage of the experiments, which would dissolve more slowly. The same difference would be true for oversaturated mineral grains that are precipitating. This could explain the changes in slope seen in some of the mineral abundances versus time in the experimental results seen in Figure 17.
The reason for the reversal in slopes of some mineral abundances from stage 1 to stage 2 of the experiments is difficult to know, but may indicate that many of the mineral precipitation and dissolution reactions are near equilibrium; slight undetected differences in fluid composition could be enough to change whether a mineral is slightly supersaturated and precipitates, or is slightly undersaturated and dissolves. These differences in fluid composition could be localized at the pore scale and thus would not appear in the models, where compositions are homogenized, leading to more constant mineral abundances over time.

6. Conclusions

This study consisted of laboratory batch reaction experiments that were intended to represent field conditions in the Morrow B Sandstone in the FWU resulting from the injection of CO2. More specifically, the experiments were intended to investigate the changes in Morrow B Sandstone mineralogy that would occur because of exposure to CO2-charged formation water generated by CO2 injection. The experimental results were then compared to mineralogic changes predicted from previous numerical reactive solute transport modeling studies, and to new reaction path models from the present study. Despite the brevity of the laboratory experiments, they provide a useful test of the theoretical models.
The following conclusions can be drawn from the batch reaction experiments and numerical reaction path models:
  • The batch reaction experiments consistently formed a precipitate that coated the thin sections and consisted of a mixture of silica and dolomite, similar to theoretical model predictions.
  • In the thin sections themselves, carbonate minerals (ankerite, dolomite, and calcite) were found mostly to precipitate during the stage 1 experiments from 0 to 61 days, but largely dissolved during the second stage of the experiments by 133 days.
  • Mineral abundance changes over time in the laboratory experiments were much more variable and non-monotonic than in the theoretical reaction path models, perhaps reflecting heterogeneities in the mineral grain size surface area to volume ratios, and mineral distributions.
  • The laboratory experiments affirm the results of theoretical models that predict dolomite to be the principal carbonate mineral sink for injected CO2 in the FWU and the Morrow B Sandstone formation water’s supersaturation with respect to silica.

Author Contributions

Conceptualization, E.J.K. and M.S.A.; methodology, E.J.K. and M.S.A.; validation, E.J.K., M.S.A. and M.E.C.; formal analysis, E.J.K. and M.S.A.; investigation, E.J.K. and M.S.A.; resources, M.S.A. and M.E.C.; data curation, E.J.K.; writing—original draft preparation, E.J.K.; writing—review and editing, M.S.A. and M.E.C.; visualization, E.J.K.; supervision, M.S.A.; project administration, M.S.A.; funding acquisition, M.S.A. All authors have read and agreed to the published version of the manuscript.

Funding

This research was funded by the U.S. Department of Energy’s (DOE) National Energy Technology Laboratory (NETL) through the Southwest Regional Partnership on Carbon Sequestration (SWP) under Award No. DE-FC26-05NT42591.

Data Availability Statement

Publicly available datasets were analyzed in this study. This data can be found here: https://mospace.umsystem.edu/ accessed on 20 May 2023.

Conflicts of Interest

The authors declare no conflict of interest. The funders had no role in the design of the study; in the collection, analyses, or interpretation of data; in the writing of the manuscript; or in the decision to publish the results.

References

  1. Bachu, S.; Adams, J.J. Sequestration of CO2 in geological media in response to climate change: Capacity of deep saline aquifers to sequester CO2 in solution. Energy Convers. Manag. 2003, 44, 3151–3175. [Google Scholar] [CrossRef]
  2. Litynski, J.; Plasynski, S.; Spangler, L.; Finley, R.; Steadman, E.; Ball, D.; Nemeth, K.J.; McPherson, B.; Myer, L.U.S. Department of Energy’s Regional Carbon Sequestration Partnership Program: Overview. Energy Procedia 2009, 1, 3959–3967. [Google Scholar] [CrossRef] [Green Version]
  3. DOE. Issue Brief Carbon Capture, Utilization, and Storage: Climate Change, Economic Competitiveness, and Energy Security; DOE Issue Brief. 2016; pp. 1–12. Available online: https://www.energy.gov/epsa/downloads/carbon-capture-utilization-and-storage-climate-change-economic-competitiveness-and (accessed on 8 May 2023).
  4. Ahmmed, B.; Appold, M.S.; Fan, T.; McPherson, B.J.O.L.; Grigg, R.B.; White, M.D. Chemical Effects of Carbon Dioxide Sequestration in the Upper Morrow Sandstone in the Farnsworth, Texas, hydrocarbon unit. Environ. Geosci. 2016, 23, 81–93. [Google Scholar] [CrossRef]
  5. Ampomah, W.; Balch, R.; Cather, M.; Rose-Coss, D.; Dai, Z.; Heath, J.; Dewers, T.; Mozley, P. Evaluation of CO2 Storage Mechanisms in CO2 Enhanced Oil Recovery Sites: Application to Morrow Sandstone Reservoir. Energy Fuels 2016, 30, 8545–8555. [Google Scholar] [CrossRef]
  6. Kutsienyo, E.J.; Appold, M.S.; White, M.D.; Ampomah, W. Field-Scale reactive transport assessment of CO2 storage in the farnsworth unit through enhanced oil recovery practices. Greenh. Gases Sci. Technol. 2023. [Google Scholar] [CrossRef]
  7. Jia, W.; Xiao, T.; Wu, Z.; Dai, Z.; McPherson, B. Impact of mineral reactive surface area on forecasting geological carbon sequestration in a co2-eor field. Energies 2021, 14, 1608. [Google Scholar] [CrossRef]
  8. Gyamfi, B.A.; Ampomah, W.; Tu, J.; Sun, Q.; Erzuah, S.; Acheampong, S. Assessment of chemo-mechanical impacts of CO2 sequestration on the caprock formation in Farnsworth oil field, Texas. Sci. Rep. 2022, 12, 13023. [Google Scholar] [CrossRef]
  9. Ampomah, W.; Balch, R.S.; Grigg, R.B.; McPherson, B.; Will, R.A.; Lee, S.-Y.; Dai, Z.; Pan, F. Co-optimization of CO2-EOR and Storage Processes in Mature Oil Reservoirs. Greenh. Gases Sci. Technol. 2016, 7, 128–142. [Google Scholar] [CrossRef]
  10. Pan, F.; McPherson, B.J.; Esser, R.; Xiao, T.; Appold, M.S.; Jia, W.; Moodie, N. Forecasting evolution of formation water chemistry and long-term mineral alteration for GCS in a typical clastic reservoir of the Southwestern United States. Int. J. Greenh. Gas Control 2016, 54, 524–537. [Google Scholar] [CrossRef] [Green Version]
  11. Khan, R. Evaluation of the Geologic CO2 Sequestration Potential of the Morrow B Sandstone in the Farnsworth, Texas Hydrocarbon Field Using Reactive Transport Modeling. Master’s Thesis, University of Missouri-Columbia, Columbia, MO, USA, 2017. [Google Scholar]
  12. Kutsienyo, E.J.; Ampomah, W.; Sun, Q.; Balch, R.S.; You, J.; Aggrey, W.N.; Cather, M. Evaluation of CO2-EOR Performance and Storage Mechanisms in an Active Partially Depleted Oil Reservoir. In Proceedings of the SPE Europec Featured at 81st EAGE Conference and Exhibition, London, UK, 3–6 June 2019; pp. 1–19. [Google Scholar] [CrossRef]
  13. Sun, Q.; Ampomah, W.; Kutsienyo, E.J.; Appold, M.; Adu-Gyamfi, B.; Dai, Z.; Soltanian, M.R. Assessment of CO2 trapping mechanisms in partially depleted oil-bearing sands. Fuel 2020, 278, 118356. [Google Scholar] [CrossRef]
  14. You, J.; Ampomah, W.; Sun, Q.; Kutsienyo, E.J.; Balch, R.S.; Dai, Z.; Cather, M.; Zhang, X. Machine learning based co-optimization of carbon dioxide sequestration and oil recovery in CO2-EOR project. J. Clean. Prod. 2020, 260, 120866. [Google Scholar] [CrossRef]
  15. Kutsienyo, E.J.; Appold, M.S.; White, M.D.; Ampomah, W. Numerical Modeling of CO2 Sequestration within a Five-Spot Well Pattern in the Morrow B Sandstone of the Farnsworth Hydrocarbon Field: Comparison of the Toughreact, Stomp-Eor, and GEM Simulators. Energies 2021, 14, 5337. [Google Scholar] [CrossRef]
  16. Kutsienyo, E.J.; Ampomah, W.; Balch, R.; Cather, M.; Luhmann, A. Three-Phase Compositional Simulation Modeling Coupled with Reactive Transport: Application to Farnsworth Field CO2-EOR and Storage Project. Earth Sp. Sci. Open Arch. 2019. [Google Scholar] [CrossRef] [Green Version]
  17. Gunter, W.D.; Perkins, E.H.; McCann, T.J. Aquifer disposal of CO2-rich gases: Reaction design for added capacity. Energy Convers. Manag. 1993, 34, 941–948. [Google Scholar] [CrossRef]
  18. Weir, G.J.; White, S.P.; Kissling, W.M. Reservoir storage and containment of greenhouse gases. Transp. Porous Media 1996, 23, 37–60. [Google Scholar] [CrossRef]
  19. Bickle, M.; Chadwick, A.; Huppert, H.E.; Hallworth, M.; Lyle, S. Modelling carbon dioxide accumulation at Sleipner: Implications for underground carbon storage. Earth Planet. Sci. Lett. 2007, 255, 164–176. [Google Scholar] [CrossRef]
  20. Gherardi, F.; Xu, T.; Pruess, K. Numerical modeling of self-limiting and self-enhancing caprock alteration induced by CO2 storage in a depleted gas reservoir. Chem. Geol. 2007, 244, 103–129. [Google Scholar] [CrossRef] [Green Version]
  21. Xu, T.; Apps, J.A.; Pruess, K.; Yamamoto, H. Numerical modeling of injection and mineral trapping of CO2 with H2S and SO2 in a sandstone formation. Chem. Geol. 2007, 242, 319–346. [Google Scholar] [CrossRef] [Green Version]
  22. Akai, T.; Kuriyama, T.; Kato, S.; Okabe, H. Numerical modelling of long-term CO2 storage mechanisms in saline aquifers using the Sleipner benchmark dataset. Int. J. Greenh. Gas Control 2021, 110, 103405. [Google Scholar] [CrossRef]
  23. Zhan, J.; Niu, Z.; Li, M.; Zhang, Y.; Ma, X.; Fan, C.; Wang, R. Numerical Simulation and Modeling on CO2 Sequestration Coupled with Enhanced Gas Recovery in Shale Gas Reservoirs. Geofluids 2021, 2021, 9975296. [Google Scholar] [CrossRef]
  24. Gunter, W.D.; Wiwehar, B.; Perkins, E.H. Aquifer disposal of CO2-rich greenhouse gases: Extension of the time scale of experiment for CO2-sequestering reactions by geochemical modelling. Mineral. Petrol. 1997, 59, 121–140. [Google Scholar] [CrossRef]
  25. Gunter, W.D.; Perkins, E.H.; Hutcheon, I. Aquifer disposal of acid gases: Modelling of water-rock reactions for trapping of acid wastes. Appl. Geochem. 2000, 15, 1085–1095. [Google Scholar] [CrossRef]
  26. White, S.P.; Weir, G.J.; Kissling, W.M. Numerical simulation of CO2 sequestration in natural CO2 reservoirs on the Colorado Plateau. In Proceedings of the First National Conference on Carbon Sequestration, Washington, DC, USA, 14–17 May 2001. [Google Scholar]
  27. Johnson, J.W.; Nitao, J.J.; Knauss, K.G. Reactive transport modelling of CO2 storage in saline aquifers to elucidate fundamental processes, trapping mechanisms and sequestration partitioning. Geol. Soc. Spec. Publ. 2004, 233, 107–128. [Google Scholar] [CrossRef] [Green Version]
  28. Zwingmann, N.; Mito, S.; Sorai, M.; Ohsumi, T. Preinjection characterisation and evaluation of CO2 sequestration potential in the Haizume Formation, Niigata Basin, Japan. Geochemical modelling of water-minerals-CO2 interaction. Oil Gas Sci. Technol. 2005, 60, 249–258. [Google Scholar] [CrossRef] [Green Version]
  29. White, S.P.; Allis, R.G.; Moore, J.; Chidsey, T.; Morgan, C.; Gwynn, W.; Adams, M. Simulation of reactive transport of injected CO2 on the Colorado Plateau, Utah, USA. Chem. Geol. 2005, 217, 387–405. [Google Scholar] [CrossRef]
  30. Gaus, I.; Azaroual, M.; Czernichowski-Lauriol, I. Reactive transport modelling of the impact of CO2 injection on the clayey cap rock at Sleipner (North Sea). Chem. Geol. 2005, 217, 319–337. [Google Scholar] [CrossRef]
  31. André, L.; Audigane, P.; Azaroual, M.; Menjoz, A. Numerical modeling of fluid–rock chemical interactions at the supercritical CO2–liquid interface during CO2 injection into a carbonate reservoir, the Dogger aquifer (Paris Basin, France). Energy Convers. Manag. 2007, 48, 1782–1797. [Google Scholar] [CrossRef]
  32. Wu, Z.; Luhmann, A.J.; Rinehart, A.J.; Mozley, P.S.; Dewers, T.A.; Heath, J.E.; Majumdar, B.S. Chemo-mechanical Alterations Induced From CO2 Injection in Carbonate-Cemented Sandstone: An Experimental Study at 71 °C and 29 MPa. J. Geophys. Res. Solid Earth 2020, 125, e2019JB019096. [Google Scholar] [CrossRef]
  33. Munson, T.W. Depositional, Diagenetic, and Production History of the upper Morrowan Buckhaults Sandstone, Farnsworth Field Ochiltree County Texas. OCGS—Shale Shak. Dig. XIII 1989, XXXX–XXXXIV, 1–20. [Google Scholar]
  34. Gallagher, S.R. Depositional and Diagenetic Controls on Reservoir Heterogeneity: Upper Morrow Sandstone, Farnsworth Unit, Ochiltree County, Texas. Master’s Thesis, New Mexico Institute of Mining and Technology, Socorro, NM, USA, 2014; pp. 1–233. [Google Scholar]
  35. Cather, M.; Rose-Coss, D.; Gallagher, S.; Trujillo, N.; Cather, S.; Hollingworth, R.S.; Mozley, P.; Leary, R.J. Deposition, Diagenesis, and Sequence Stratigraphy of the Pennsylvanian Morrowan and Atokan Intervals at Farnsworth. Energies 2021, 14, 1057. [Google Scholar] [CrossRef]
  36. Perdure Petroleum, LLC. Farnsworth Unit, Texas (FWU) Monitoring, Reporting, and Verification Plan. 2021. Available online: https://www.epa.gov/system/files/documents/2021-07/fwu_decision.pdf (accessed on 8 May 2023).
  37. Van Wijk, J.; Hobbs, N.; Rose, P.; Mella, M.; Axen, G.; Gragg, E. Analysis of geologic CO2 migration pathways in farnsworth field, nw anadarko basin. Energies 2021, 14, 7818. [Google Scholar] [CrossRef]
  38. SWP. The Southwest Regional Partnership on Carbon Sequestration, 2022. Available online: https://www.netl.doe.gov/coal/carbon-storage/atlas/swp/phase-III/farnsworth (accessed on 9 December 2022).
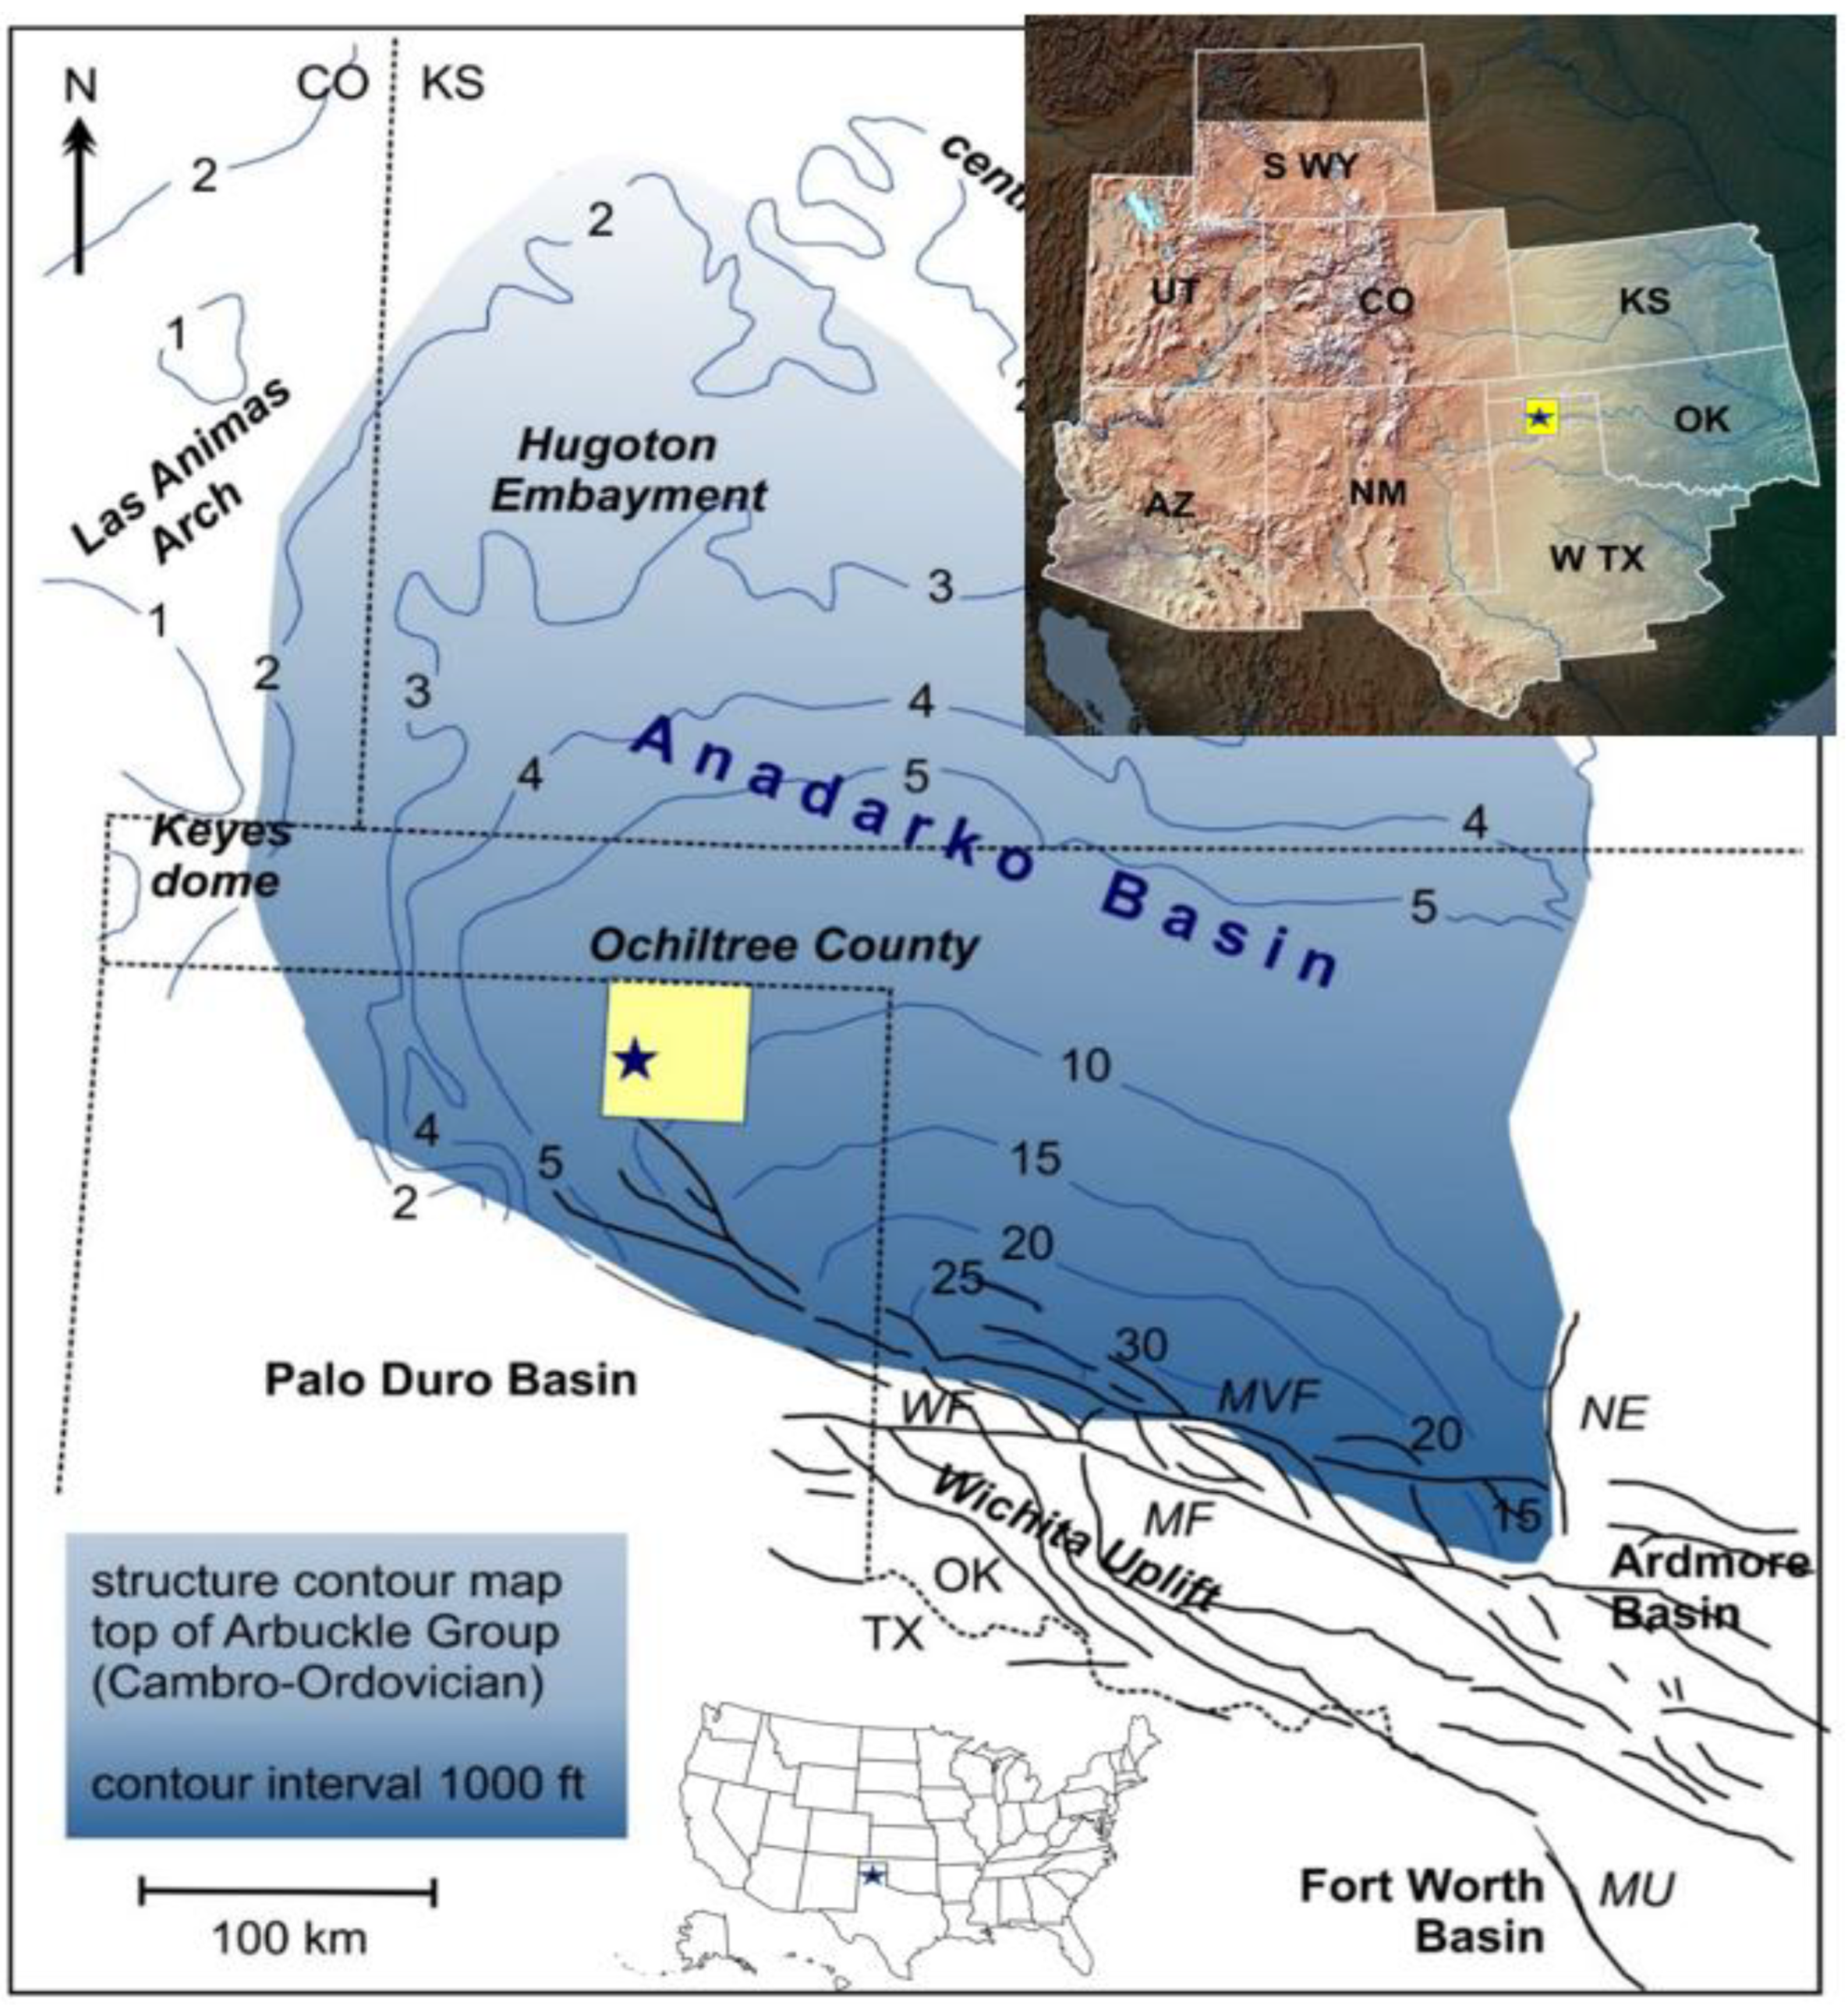
Figure 1. Location map of the Farnsworth Unit within the Anadarko Basin. The yellow square shows Ochiltree County in the northern part of the U.S. state of Texas. The black star represents the location of the Farnsworth Unit. The image is modified from Kutsienyo et al. [15] and Van Wijk et al. [37].
Energies 16 04611 g001
Figure 2. Depositional model of the Morrow B Sandstone in the Anadarko Basin. The core slab photographs are placed at their virtual positions within the conceptual model of an incised valley structure. The sectional core slabs in the image are approximately 10 cm in length [38].
Energies 16 04611 g002
Figure 3. (a) Stratigraphic column and core plug locations of the samples from the Morrow B used to prepare the thin sections. (b) The FWU well 13-10A core plug shows the texture of the sandstone along the length of the plug. Fine-grained textures predominate in the upper part of the plug and coarse-grained textures predominate in the lower part of the plug.
Energies 16 04611 g003
Figure 4. Photomicrographs of the four thin sections analyzed in the present study showing representative examples of the minerals (a) chlorite, (b) calcite, (c) plagioclase, (d) quartz, (e) chlorite, and calcite, (f) feldspar.
Energies 16 04611 g004
Figure 5. Photographs of equipment used for the batch experiments. (a) BaoshishanTM hydrothermal 304 stainless steel autoclave and white PTFE interior liner. (b) Oven containing the autoclaves in which the high-C and low-C batch reactions were conducted at 75 °C.
Energies 16 04611 g005
Figure 6. Comparison of the elemental concentrations of the initial Morrow B formation water with those of the high-C and low-C Morrow B Sandstone formation water solutions after (a) 61 days, and (b) a further 72 days of reaction with thin sections of the Morrow B mineral matrix.
Energies 16 04611 g006
Figure 7. Adhesive SEM analytical mount coated with white fine-grained precipitate removed from the surface of one of the four thin sections after a batch reaction experiment.
Energies 16 04611 g007
Figure 8. Back-scattered electron (BSE) images of the white fine-grained precipitate produced after 61 days from (A) the low-C experiment and (B) the high-C experiment. Composite elemental concentration maps for Mg, Al, Si, and Ca of the white fine-grained precipitate produced after 61 days from (C) the low-C experiment and (D) the high-C experiment.
Energies 16 04611 g008
Figure 9. BSE images of the white fine-grained precipitate produced after a further 72 days of reaction from (A) the low-C experiment and (B) the high-C experiment. Composite elemental concentration maps for Mg, Al, Si, and Ca of the white fine-grained precipitate produced after a further 72 days from (C) the low-C experiment and (D) the high-C experiment.
Energies 16 04611 g009
Figure 10. Elemental concentration maps for the white fine-grained precipitate produced after 61 days showing C, Ca, and Mg for (AC) the low-C experiment, (DF) the high-C experiment, and for Si, O, and Al for (GI) the low-C experiment, (JL) the high-C experiment, respectively.
Energies 16 04611 g010
Figure 11. Elemental concentration maps for the white fine-grained precipitate produced after a further 72 days showing C, Ca, and Mg for (AC) the low-C experiment, (DF) the high-C experiment, and for Si, O, and Al for (GI) the low-C experiment, (JL) the high-C experiment, respectively.
Energies 16 04611 g011
Figure 12. BSE images of each of the four thin sections initially before the experiments were started, after 61 days of reaction, and after a further 72 days of reaction (total of 133 days). Black areas represent pore space and the lighter gray shades represent the solid mineral matrix (AC) for thin section 1310.7669.1a after 0, 61, and 133 days of reaction. The same time series is shown in (DF) for thin section 1310.7669.1b, in (GI) for thin section 1310.7684.6a, and in (JL) for thin section 1310.7684.6b. The homogeneous gray area at left-center of the thin section images noted by the red arrows in H and I represent an accidental loss of thin section material caused during an attempt to remove the white fine-grained precipitate after the 61-day experiment.
Energies 16 04611 g012
Figure 13. SEM-EDX characterizations of the calcium content initially and after 61 and 133 days of reaction time, respectively, in thin sections (AC) 1310.7669.1a, (DF) 1310.7669.1b, (GI) 1310.7684.6a, and (JL) 1310.7684.6b.
Energies 16 04611 g013
Figure 14. SEM EDX characterizations of calcium, sodium, and iron content initially and after 61 and 133 days of reaction time, respectively, in thin sections (AC) 1310.7669.1a, (DF) 1310.7669.1b, (GI) 1310.7684.6a, and (JL) 1310.7684.6b.
Energies 16 04611 g014
Figure 15. Mineral abundances determined by TIMA for each of the four thin sections initially and after 61 and 133 days, respectively, for thin sections (AC) 1310.7669.1a, (DF) 1310.7669.1b, (GI) 1310.7684.6a, and (JL) 1310.7684.6b. Identified minerals are distinguished by color as shown in the legend.
Energies 16 04611 g015
Figure 16. Volumetric abundance of carbonate minerals in the thin sections as a function of reaction time. (a) Fine-grained facies in high-C fluid, (b) coarse-grained facies in high-C fluid, (c) fine-grained facies in low-C fluid, (d) coarse-grained facies in low-C fluid.
Energies 16 04611 g016
Figure 17. Volumetric abundance of non-carbonate minerals in the thin sections as a function of reaction time. (a) Fine-grained facies in high-C fluid, (b) coarse-grained facies in high-C fluid, (c) fine-grained facies in low-C fluid, (d) coarse-grained facies in low-C fluid.
Energies 16 04611 g017
Figure 18. Simulated changes in formation water chemistry in reaction path models for thin sections (a) 1310A7669.1a, (b) 1310A7684.6a, (c) 1310A7669.1b, (d) 1310A7684.6b at times of 61 days, 133 days, 1 year, 10 years, 100 years, and 1000 years.
Energies 16 04611 g018
Figure 19. Simulated changes in carbonate mineral abundances as a function of time integrated over the entire model domain calculated from the reaction path models for thin sections (a) 1310A7669.1a, (b) 1310A7684.6a, (c) 1310A7669.1b, and (d) 1310A7684.6b.
Energies 16 04611 g019
Figure 20. Simulated changes in non-carbonate mineral abundances as a function of time integrated over the entire model domain calculated from reaction path models for thin sections (a) 1310A7669.1a, (b) 1310A7684.6a, (c) 1310A7669.1b, and (d) 1310A7684.6b.
Energies 16 04611 g020
Table 1. Elemental concentrations (ppm) in the formation water.
Elements **Concentration *** (ppm *)
Initial61 Days72 Days
High CLow CHigh CLow C
S7.767.768.458.45.59
Ca42.342.34.13.585.8
K121237.345.27.65
Na19551955255025402240
Mg26.226.2<0.10.260.9
Fe<0.4<0.4<0.4<0.4<0.4
Li0.5910.5910.5650.5370.604
B5.135.134.274.214.35
Sr8.388.380.1150.0529.41
Ba6.756.750.250.217.17
Al0.2260.226<0.13<0.13<0.13
Se0.2430.243<0.05<0.050.15
pH8.3310.1910.157.768.1
* ppm = parts per million. ** Formation water samples were obtained from Well #20-02. *** Elemental concentrations were measured using ICP-AES.
Disclaimer/Publisher’s Note: The statements, opinions and data contained in all publications are solely those of the individual author(s) and contributor(s) and not of MDPI and/or the editor(s). MDPI and/or the editor(s) disclaim responsibility for any injury to people or property resulting from any ideas, methods, instructions or products referred to in the content.