Article

The Influence of a Photometric Distance on Luminance Measurements

by
Dariusz Czyżewski
Lighting Technology Division, Electrical Power Engineering Institute, Faculty of Electrical Engineering, Warsaw University of Technology, Koszykowa 75, 00-661 Warsaw, Poland
Energies 2023, 16(10), 4166; https://doi.org/10.3390/en16104166
Submission received: 8 May 2023 / Revised: 16 May 2023 / Accepted: 16 May 2023 / Published: 18 May 2023

Abstract

:
Luminance measurements are the least frequent of all photometric measurements. This article characterizes and systematizes the various methods of luminance measurement. In particular, the method of direct luminance measurement using modern luminance meters (ILMD) is described in detail. This paper presents the results of the study on the influence of the measurement distance on the luminance measurement results. Two ILMD meters (laboratory and portable) and a luminance standard were used in this study. The conducted research showed that an incorrectly chosen measuring distance can lead to significant measurement errors of up to several tens of percent. In addition, the possible impact of incorrect measurements on the design of an interior lighting installation was presented. It was shown that the selected interior lighting installation can consume more than 40 percent more electricity compared to the installation based on the correct luminance measurements of the luminaires with diffuse shades. In the final stage of the study, the definition of the photometric test distance for luminance measurements using ILMD was proposed. The test results can be particularly useful for the luminance measurements of OLEDs or the luminaires with diffuse luminous character. However, these results can also be used for luminance measurements of other light sources and luminaires.

1. Introduction

1.1. Photometric Measurements

Photometric measurements are among the most widely performed measurements in lighting technology. These measurements include luminous flux measurements, illuminance measurements, luminous intensity measurements and luminance measurements. Luminous flux measurements are the most common photometric measurements [1,2,3,4,5,6]. They make it possible to determine how much light is emitted from a light source or a luminaire. Thanks to these measurements, we can determine, among other things, the luminous efficacy of a light source [7,8] or the efficiency of a luminaire [9,10]. It is worth stressing that luminous flux measurements are indirect measurements. There is no concept of a photometric distance in these measurements, only the suitable size of the integrating sphere needs to be well chosen for the size of the light source. The measurement of luminous flux is straightforward, and the measuring equipment is widely available.
Illuminance measurements are another frequently performed measurement. These measurements make it possible to determine the indoor [11,12,13] and outdoor [14,15,16,17] lighting condition. Determining the illuminance distribution enables us to determine the main criterion values (the average illuminance and illuminance uniformity) given in the standardization requirements. The measurements are taken at the measurement points defined according to a standardized measurement grid. The measurement grid is defined differently for indoor [18], outdoor [19], workplaces and roads (for classes C and P) [20]. The measurement is conducted using a lux meter. By adjusting the photometric head or using a suitable adapter, the illuminance can be determined horizontally, vertically, cylindrically or spherically. Conducting measurement is simple and the measuring equipment is generally available and affordable.
Luminous intensity is the next frequently measured photometric quantity. The measurement is often carried out on a photometric bench as a comparative measurement with a luminous intensity standard for light sources [21], or using a goniophotometer [22,23] or an arm photometer [24,25] for luminaires [6,26,27]. An important feature of luminous intensity is determining it for a point light source in a specific direction. In the case of actual light sources, their size cannot be considered as a point light source. However, as we move away from such a light source, from a certain distance the dimensions of the light source can be treated as a point light source; then, the luminous intensity does not change, regardless of the increasing distance (r) between the light source and the observer. A change in distance is accompanied by a change in illuminance (E) at a given illuminated point (on the photometric head). From a certain distance, the luminous intensity can be determined from this Equation (1).
I = E r 2 [ c d ]
The highest measurement accuracy is obtained by measuring luminous intensity from a distance greater than the Photometric Test Distance (PTD). However, if the highest accuracy is not required, measurements from a distance shorter than the PTD are often acceptable. It needs to be emphasized that the size of the luminous surface, the type of luminous (directional or diffuse), and the measuring distance influence the measurement result.
A luminous intensity measurement is most often performed to determine the luminous intensity of a light source in a given direction or to determine Luminance Intensity Distribution (LID) of a luminaire. For light sources with a diffusing luminous surface, a light source can be assumed to be a point one if the distance between the light source and the illuminated point is five times bigger than the biggest dimension of the light source’s luminous surface. If the photometric inverse square law is met, the calculation (measurement) error will be less than 1%. It is getting more complicated in the case of complex optical systems, especially those with a narrow illumination angle (e.g., with a paraboloidal reflector or lens). For reflector systems, Equation (2) is used in order to approximate the PDT. In this equation, the PDT is defined as a multiple of the focal length (f) of a paraboloidal reflector.
r G O F 200 × f   [ m ] ,
where: f—focal length of the projector mirror.
The International Commission on Illumination (CIE) has issued the recommendations (CIE S 025/E:2015) that under far-field conditions, for LEDs with narrow luminous flux distribution and high glare limitation, a luminous intensity measurement should be performed from a distance determined from Equation (3) [6].
r G O F 15 × D   [ m ] ,
where: D—maximum dimension of the luminous surface [m].
In accordance with the UN Regulations No. 112 of 22 September 2014 [28], in automotive lighting technology for headlamps, a luminous intensity measurement is conducted from the distance of 25 m. It is assumed that for such a measuring distance, the condition of the Photometric Test Distance is fulfilled.
In measurement practice, the Photometric Test Distance can be determined experimentally by measuring the directional luminous intensity at several distances from the projector (along its optical axis). The distance from which the photometric inverse square law is met is referred to as the Photometric Test Distance. This procedure is used for complex optical systems and multi-source LED luminaires [29].
Compared to the previously discussed parameters, luminance is the least measured photometric quantity. This may be due to, on the one hand, the rather expensive measuring equipment, and, on the other hand, to the lack of qualified engineering and scientific staff. In the literature, the most common findings are those devoted to luminance distributions on streets [30,31]. The results of these studies make it possible to determine the fulfillment of standardization requirements and give the information about the distribution of luminance in the driver’s field of vision. The studies of luminance distributions on building surfaces are also found in the literature. This is important information for floodlighting of architectural objects [32,33,34]. Other studies are devoted to measuring luminance distributions on the selected surfaces on interiors [35,36]. Based on such measurements, the researchers often try to determine the occurrence of the discomfort glare [37,38,39]. However, regardless of whether the measurements concern outdoor or indoor areas, the determined luminance levels of light sources (nowadays most often LEDs) or the luminaires with reflector and lens technology cause some doubts. These doubts result from the levels of the luminance measured, as these levels are most often lowered. This may be due to the fact of using an inappropriate photometric distance when measuring the luminance.
Even fewer studies present the results of measurements of luminance distributions on the surface of light sources, mainly the currently popular LEDs. Such studies make allow to determine the luminance levels on the LED surface, the luminance uniformity and the nature of the luminance change for different beam angles [40,41,42,43,44]. In addition, these measurements determine how the distribution of LED luminance changes with the changes in power levels. Such tests are essential in the design process of complex optical systems forming the unusual or specialised Luminance Intensity Distribution. However, there is the question of how to perform such measurements properly, especially using modern luminance meters. Another question concerns the issue of how the photometric distance affects the results of luminance measurements.
These above mentioned problems have led to the need to address the issue of the distance selection in luminance measurements. Therefore, this study aims to determine how the distance between the light source and a modern digital meter affects the accuracy of luminance measurements.

1.2. A Photometric Distance in Luminance Measurements

In general, considering the way the measurements are performed and the type of measurement equipment used, two main methods for measuring and determining luminance can be distinguished together with their variants:
  • Indirect methods of the luminance measurement:
    a photometric method using illuminance measurement,
    a photometric method using measurement of the luminous flux of a light source,
    a spectrometric method (colorimetric method) using measurements of the spectral distribution of the light source;
  • Direct methods for measuring luminance:
    using a conventional luminance meter,
    using a matrix (digital) luminance meter—ILMD (Image Luminance Measuring Device).
According to the presented division, indirect methods are divided into photometric and colorimetric ones. The photometric method using the illuminance measurement makes it possible to determine the average luminance of a luminous surface in a given direction (γ). This method is based on the transformed luminance equation according to the known Equation (4). During the indirect measurement, the photometric head is placed at a distance r from the light source (a luminaire) so that it is perpendicular to the given measurement direction. Then, knowing the apparent area of the light source (as seen from the direction of observation) and the indication of the luminance meter (E), the average luminance of the light source determined from the given direction (γ) can be calculated. In this method, for the measurement to be correct, the distance between the light source and the photometric head should be such that the photometric distance law can be applied. The idea is that the distance should be sufficient enough to treat the light source as a point light source. So, the measurements are made in the same way as when determining the luminous intensity from a given direction.
L ś r ( γ ) = E   r 2 d S c o s γ   [ cd m 2 ] ,
The method using the measurement of luminous flux is another indirect photometric for determining the average luminance seen from a given direction. With some simplification and assuming a uniform luminance distribution over the surface area of the light source, the so-called dimension luminance can be determined from the known relation (5) [25]. With the dimension luminance defined in this way, it is assumed that the total luminous flux radiated from the light source comes from the surface area of the Luminance Intensity Distribution described in this source. The measurement distance is irrelevant, as the physical measurement concerns only the luminous flux. However, this is only an approximate method of determining the luminance of a light source and assumes a constant value in each direction.
L g = Φ o π   S g   [ cd m 2 ] ,
where:
Lg—dimension luminance [cd/m2],
Φo—luminous flux of the light source [lm],
Sg—the surface area of the light source [m2].
The spectrometric (colorimetric) method is the last indirect method which uses the measurements of the spectral distribution from a given direction. In this way, with a correctly calibrated instrument, a given photometric quantity can be determined. Then, using, for example, Equation (4), the average luminance of the light source from a given direction can be determined.
However, the direct methods are the key methods for measuring luminance. In the 20th century, classic luminance meters were the most popular meters. They are still in use today due to their affordability and the ease of use. Classical luminance meters are usually equipped with the complex optics which task to extend (in the meter) the path of the light rays and thus allowing the luminance to be measured on a luminous surface. Then, the light rays fall on a radiation detector which is pre-calibrated by the manufacturer. The principle of the measurement is to extract a narrow solid angle associated with the light emission (from the measured luminous surface) from the whole half-space [45,46].
Theoretically, luminance measurement using modern meters does not depend on a distance. Practically, the person taking the measurement sees the entire perspective in the viewfinder of the device (as in a camera) and the area (usually a circle) in which the average luminance measurement is taken. At this point, it is important to make sure that the measurement field (the area of the circle seen through the lens) covers only the area which the average luminance is to be determined. It is also important to remember to set the focus on the measured image [47]. In this way, the average luminance can be determined in the measurement field.
For classical luminance meters, the photometric test distance is the distance for which the entire measuring field of the meter covers the entire measured area. There are classical luminance meters available which allow the measurement area to be set to different (angular) sizes (different diameters of the measurement area, usually a circle, seen through the lens by the user) [48,49]. It is then easier to adjust the distance so that the measuring area covers the entire area which the average luminance is to be measured. In addition, if the meter allows to set the measurement field to be sufficiently small, it is possible to also determine the luminance distribution in a simplified manner by, for example, dividing the larger area to be measured into many parts. In this way, the point luminance can be measured in the center of each part. There are also classical luminance meters with a measurement field adapted to the particular application. For example, for meters designed to measure luminance in road lighting, the measuring field has an angular range of 2′ × 20′ [48]. In this case, according to the standard: “For every type of luminance meter, in every case of grind point measurement the angular subtense of the measured road surface shall be not be greater than 2 min of arc in the vertical plane and not greater than 20 min of arc in the horizontal plane” [50].
The Image Luminance Measuring Device (ILMD) is currently the most technologically advanced of all the luminance meters [51,52,53,54]; it allows direct luminance measurements to be made. The principle of the operation of an ILMD is similar to that of a digital camera. Some portable matrix meter designs are built on the basis of digital cameras [55,56]. A typical laboratory ILMD consists of a lens (consisting of a set of lenses), a Vλ filter, a photosensitive sensor (Charge Coupled Device (CCD) or Complementary Metal-Oxide-Semiconductor (CMOS)) [57,58], a low noise analogue electronic, an analogue-to-digital converter and a digital data transfer. Lenses can usually be exchanged in the ILMD and they can be either fixed or zoom [59].
After passing through a Vλ filter, the image from the lens is projected onto a photosensitive matrix. Good quality meters have monochromatic matrices with low noise and high sensitivity CCD, and it ensures a high measurement accuracy. The sensor (matrix) can have from one million to tens of millions of pixels. ILMDs are calibrated so that the recorded image on the matrix can be represented as a luminance distribution over the entire recorded image. For example, a single measurement can replace the tens or hundreds of measurements needed to assess the condition of road lighting [30,31,60,61,62].
The limiting photometric distance for direct measurements taken with an ILMD meter is a separate issue which is rather not researched. The author’s measurement experience shows the complexity of the problem. It is essential to determine the photometric test distance when measuring high-luminance light sources. There can be big discrepancies in the obtained results when examining this type of light sources.
Figure 1 shows the results of measurements of the luminance distribution on the LED surface, where Figure 1a shows the measurement from the distance of 180 mm (large LED image), and Figure 1b is the measurement from the distance of 818 mm (left LED image). Although the same source (LED) was measured, two different maximum luminance results were obtained. From a close distance, the maximum luminance was 13.66 Mcd/m2 (million cd/m2), while from further away (right image), it was only 9.86 Mcd/m2. The key question is: which result is correct?
One research paper addresses the issue of the influence of selection of luminance photometric distance on the measurement results [63]. Based on the research, recommendations were given on how to perform LED measurements to maintain a high accuracy of the results for different measurement methods. For measurements using a state-of-the-art luminance matrix meter (ILMD), it was recommended that the image of the measured source should cover at least 3000 px (pixels) to ensure 90% accuracy in the measurement of maximum and average luminance on the LED surface. For higher measurement accuracy for luminance measurement on the LED surface reaching 99%, it is recommended that the measurement distance should be chosen to ensure a minimum coverage of 20,000 px for average luminance and 40,000 px for maximum luminance. While analyzing these results, there is a question of how the high luminance gradient and its high levels (of the order of millions of cd/m2) on the surface of the tested LEDs may have influenced the measurement results.
On the basis of the discussed research, there is the issue of whether for a light source with much lower luminance, high luminance uniformity and many times larger surface area (for example, OLED or diffusing luminaires), the photometric distance would also affect the measurement results. Then, another question worth addressing concerns the idea if using another ILMD meter would confirm the results obtained through the practical measurements rather than the theoretical analysis. All the above mentioned considerations determined the decision to research the aspect of the distance selection in luminance measurements taken using digital ILMD meters.

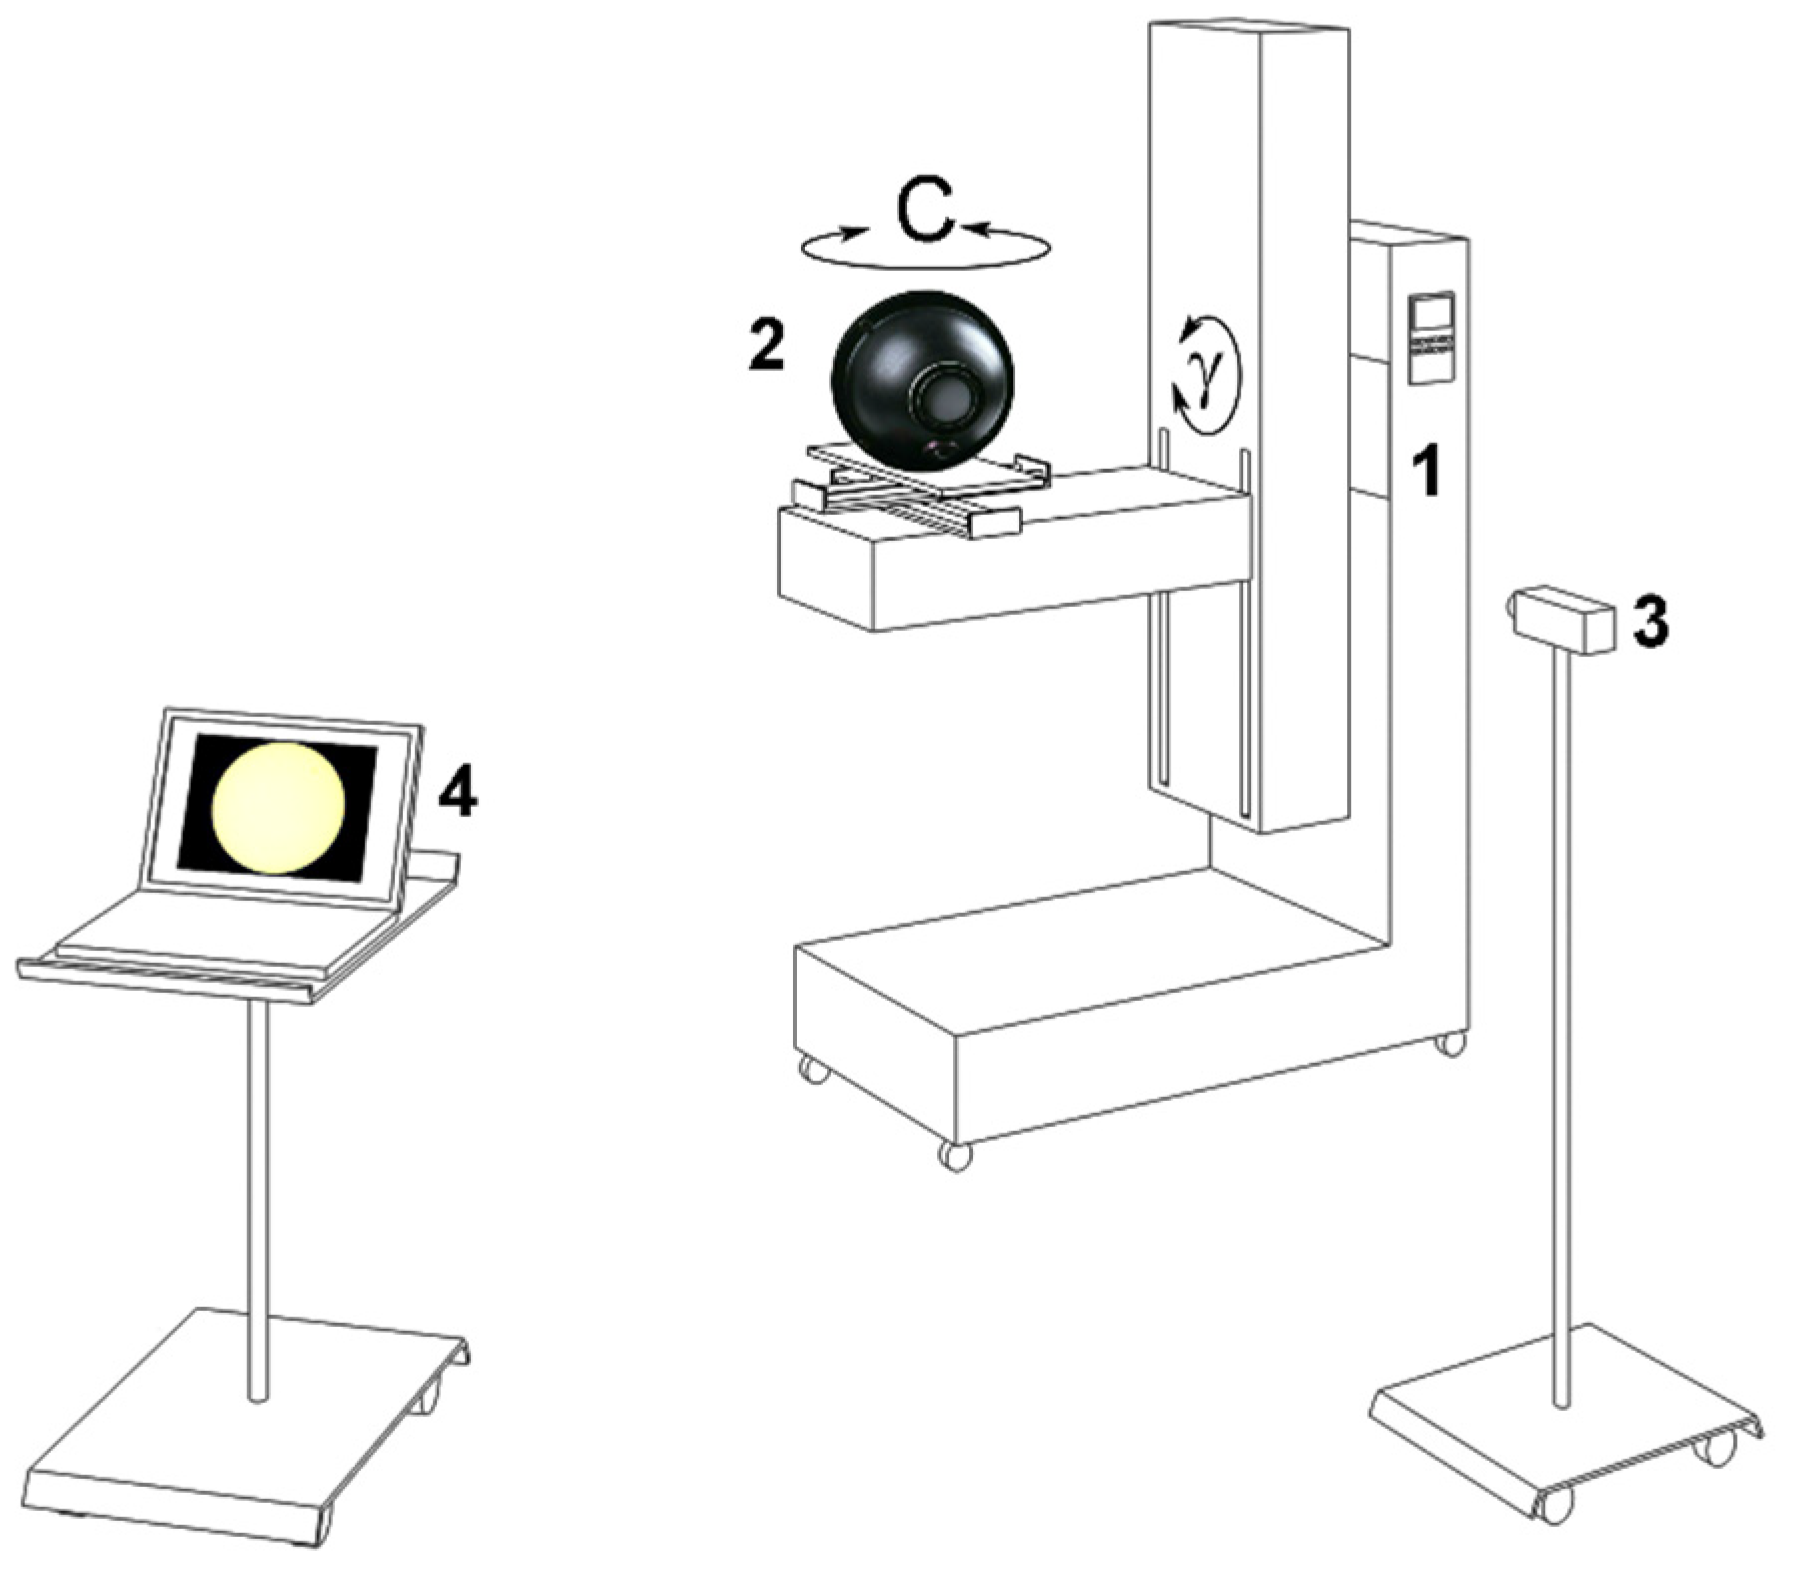
2. Materials and Methods

The test was carried out in a photometric darkroom at a technical university in the European Union. The measuring set-up, shown in Figure 2, consisted of the following components: a goniometer (Spectro Color, Łódź, Poland), the LN-3 luminance standard (from LMT) [57], a GLL 3-80 P laser level (Bosch, Gerlingen, Germany), an LMK98-3 Color—a modern laboratory luminance meter and an LMK Mobile Air—a modern portable luminance meter (both from Techno Team, New York, NY, USA) [55,56], a classic LS-100 luminance meter (Konica Minolta, Tokyo, Japan) [64,65], a Disto D510 rangefinder (Leica Geosystems, St. Gallen, Switzerland), a B520 lux meter with a dedicated photometric head (LMT, Berlin, Germany) and two tripods. The luminance standard (2) was set up on the goniometer table (1). In front of the standard, luminance meters (3) were set up on a tripod. A laptop (4) was used to view and analyze the measurement results. A laser cross level allowed the standard and luminance meters to be aligned coaxially. The distance was controlled with a rangefinder.
The main aim of the measurements was to verify the measurement accuracy of two state-of-the-art luminance meters (ILMDs)—i.e., a laboratory meter and a portable meter. The parameters of the meters used in the research are summarized in Table 1.
The measurements were taken in complete darkness. The luminance standard had its own separate power supply and temperature stabilization [66]. The reference luminance was 889 cd/m2 with a color temperature closest to 2858 K.
With a laser spirit level, the concentricity of the luminance standard and luminance meters was controlled. A goniometer allowed correction of the height and concentricity of the measurement system. A rangefinder was used to determine the distances between the standard and the meters.
For the laboratory ILMD, the measurements were taken from the distances for which the manufacturer had calibrated the meter. So, the measurements were taken from distances of 280 mm, 306 mm, 486 mm, 655 mm, and 818 mm, and additionally from distances of 1354 mm, 1737 mm, 3778 mm, 8049 mm and 11465 mm. A 50-mm lens was used in all measurements. In contrast, for the ILMD portable meter, the measurements were taken from distances of 300 mm, 500mm, 700 mm, 1000 mm, 2000 mm, 4000 mm, 6000 mm and 8000 mm, for a focal length set at 50mm and 17mm (two extreme settings). After each change of distance, the luminance distribution on the surface of the luminance standard scatter plate was measured. The measurements were intended to demonstrate the constancy or variability of the results obtained for different measurement distances. The analysis of the obtained results would allow the measurements to be compared with those obtained in other studies that concerned high-luminance LEDs [63].
This research did not include the other possible sources of measurement error in ILMD meters, as the aim of this research was not to provide the guidelines for constructing a new, improved luminance meter. The research objective was to demonstrate the correlation between a measurement distance and the luminance results. The tests were carried out using popular matrix luminance meters, often used in scientific research and engineering measurements. In particular, the accuracy of measurements made with the laboratory meter was positively verified in the design of complex optical systems [67,68,69,70].
The detailed results of tests using the classic luminance meter (LS100) and the indirect method for determining luminance (B520) will not be presented here due to the simplicity of carrying out these tests. In conclusion of this paper, the proposals for determining the photometric distance for all the analyzed measurement methods will be included.

3. Results

Firstly, the luminance standard and an ILMD laboratory luminance meter were used for this research. The measurements taken with the LMK98-3 Color meter equipped with a 50-mm lens, which allowed the image focusing, were chosen for the analysis. The measurements were made for the measurement distances selected and set by the manufacturer and mentioned in Section 2 of this paper.
The first measurement from a distance of 280 mm did not cover the entire luminous surface of the luminance standard. This measurement covered only the central part of the circular luminous surface. This allowed the measurement accuracy of the laboratory ILMD to be assessed. The result of the measurement is shown in Figure 3. Figure 3 shows the luminance distribution over the entire surface area of the photosensitive matrix. A pseudo-color scale is described next to the figure, indicating which luminance level corresponds to which color in the figure.
Only the measurement made from a distance of 655 mm covered the entire illuminating surface of the luminance standard. The intermediate measurements (between 280 mm–655 mm) were not analyzed. The results of the measurements for successive measurement distances selected for the analysis are shown in Figure 4. The left figures show the measured object in the whole image recorded by the meter. The right figures contain only a magnified image of the measured luminous surface of the luminance standard. In the center, there is a pseudo-color scale indicating the individual luminance levels.
Secondly, the luminance standard and an ILMD portable luminance meter were used for this research. The measurements taken with the LMK Air Mobile meter equipped with a 17 mm–50 mm lens, which allowed for image focus and focal length changes, were selected for the analysis. The measurements were taken for the extreme focal lengths, namely 17 mm and 50 mm. The previously mentioned measurement distances were selected: 280 mm, 500 mm, 700 mm, 1000 mm, 2000 mm, 4000 mm, 6000 mm and 8000 mm. In addition, the following parameters—ISO 100, aperture F4, and exposure time 0.01013 s—were set. After changing the distance, the focus was set manually each time.
The first measurement from the distance of 280 mm and for a focal length of 50 mm covered the entire luminous surface of the luminance standard. Based on this measurement, the accuracy of the measurement taken by a portable ILMD was assessed. The result of the measurement is shown in Figure 5, where the image of the luminance distribution covers the largest part of the surface of the light-sensitive matrix (compared to the other measurements). Next to Figure 5, as in previous cases, the pseudo-color scale is described.
The next measurement results for the next measurement distances selected for the analysis are shown in Figure 6. The arrangement of the figures is the same as for the measurements taken using the laboratory ILMD. The left figures show the measured object against the area recorded by the portable meter. The right figures contain a magnified image of the measured luminous surface of the luminance standard. In the center, there is a pseudo-color scale indicating the individual luminance levels.
It was decided to present the smallest of the images recorded with the ILMD portable meter as the last one. The measurement was also taken from the distance of 8000 mm but at the focal length of 17 mm. The measurement results are shown in Figure 7.

4. Discussion

4.1. The Analysis Photometric Measurements

In the first step of the analysis, the accuracy of the luminance measurement was determined using two ILMD meters. For the laboratory luminance meter, the measurement accuracy was determined from the luminance distribution measurement shown in Figure 3. The measurement accuracy for the portable luminance meter was determined from the measurement of the luminance distribution shown in Figure 5. The average luminance measurement error was determined from Equation (6). The luminance reference value was 889 cd/m2, which was provided by the luminance reference manufacturer.
Δ L a v r = | L x L s d L   s d | · 100   [ % ] ,
where,
Lx—average luminance on the surface of the reference plate measured ILMD [cd/m2],
Lsd—average luminance of the reference plate of 889 [cd/m2].
ΔLavr—measurement deviation of the average luminance with a given ILMD [%].
The results of the measurements are summarized in Table 2.
The obtained results presented in Table 2 confirm the high quality of the ILMD meters used in the study. The measured average luminance of the reference plate using the laboratory meter differs from the reference value by only 1 cd/m2, resulting in a measurement deviation of 0.11%. In the case of the portable meter, the difference between the measured value and the reference value is 21.7 cd/m2, resulting in a measurement error of 2.54%. Both results are excellent and confirm the use of the mentioned above meters in further research.
The main stage of the study was to determine the influence of the photometric distance on the luminance levels on the surface of the reference plate. The detailed measurement results and their preliminary analysis are summarized in Table 3. These results relate to the LMK 98-3 Color laboratory meter.
In Table 3, the first column contains the distances from which the measurements were taken. The second column presents the results of the average luminance, and the third column shows the results of the maximum luminance measurements. The fourth column contains the number of pixels covered by the luminance reference image on the meter matrix. The fifth and sixth columns present the calculations of the percentage results of each measurement related to the result obtained for the distance of 655 mm for the average and the maximum luminance, respectively. The result for the 655 mm was chosen as the reference, because from this distance the luminance meter could measure the entire surface of the luminance standard. The last column contains the results of the number of pixels the image covered for a given distance and related to the total number of pixels recorded by the meter. The results are expressed as a percentage.
The results are summarized in Figure 8 for the average and maximum luminance to facilitate the analysis of how the image size (expressed in the number of pixels) changes with the changing measurement distance for a laboratory ILMD.
Analyzing the measurement results presented in Table 3 and Figure 8, it can be seen that the measured average luminance on the reference surface changes with the measurement distance. It was found that the greater the measurement distance, the fewer pixels are covered by the reference image on the ILMD laboratory matrix and the lower the value of the measured average luminance. If the measurement from the closest possible distance (655 mm) is taken as a reference one, where the image of the reference surface was all seen and occupied almost 55% of the entire photosensitive matrix, the following conclusions can be drawn:
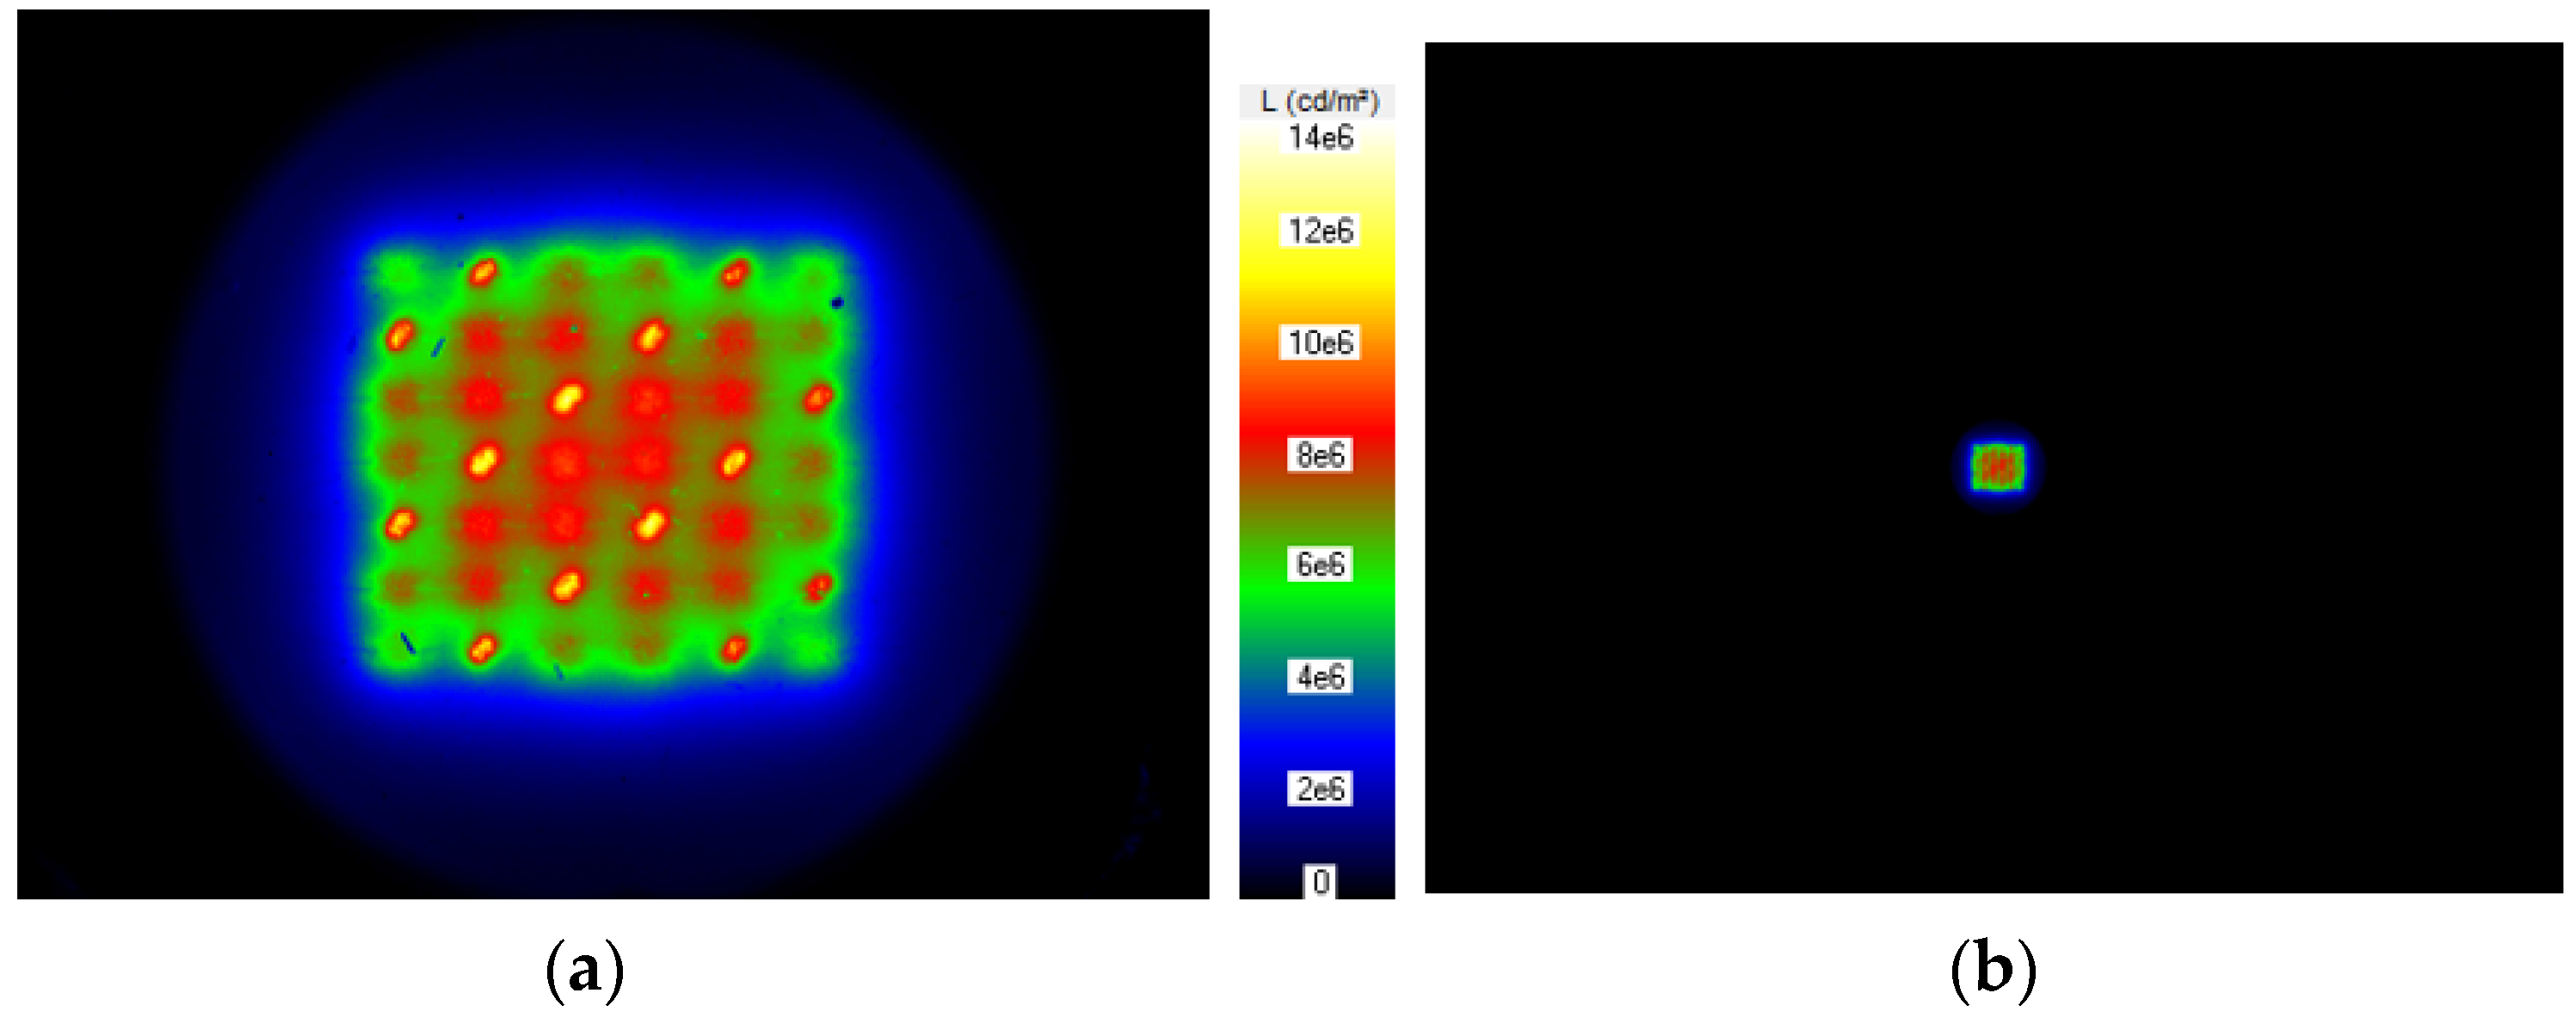
  • the average luminance can be measured with 99% accuracy if the measured image covers at least 140,000 pixels,
  • the average luminance can be measured with 95% accuracy if the measured image covers at least 14,000 pixels,
  • the average luminance can be measured with 90% accuracy if the measured image covers at least 3200 pixels.
In addition, it was found that the measured maximum luminance on the reference surface also changes with the measurement distance. As in the case of the average luminance, it was determined that the greater the measurement distance, the lower the value of the measured maximum luminance. If the measurement from the nearest possible distance (655 mm) is taken as a reference one, the following conclusions can be drawn:
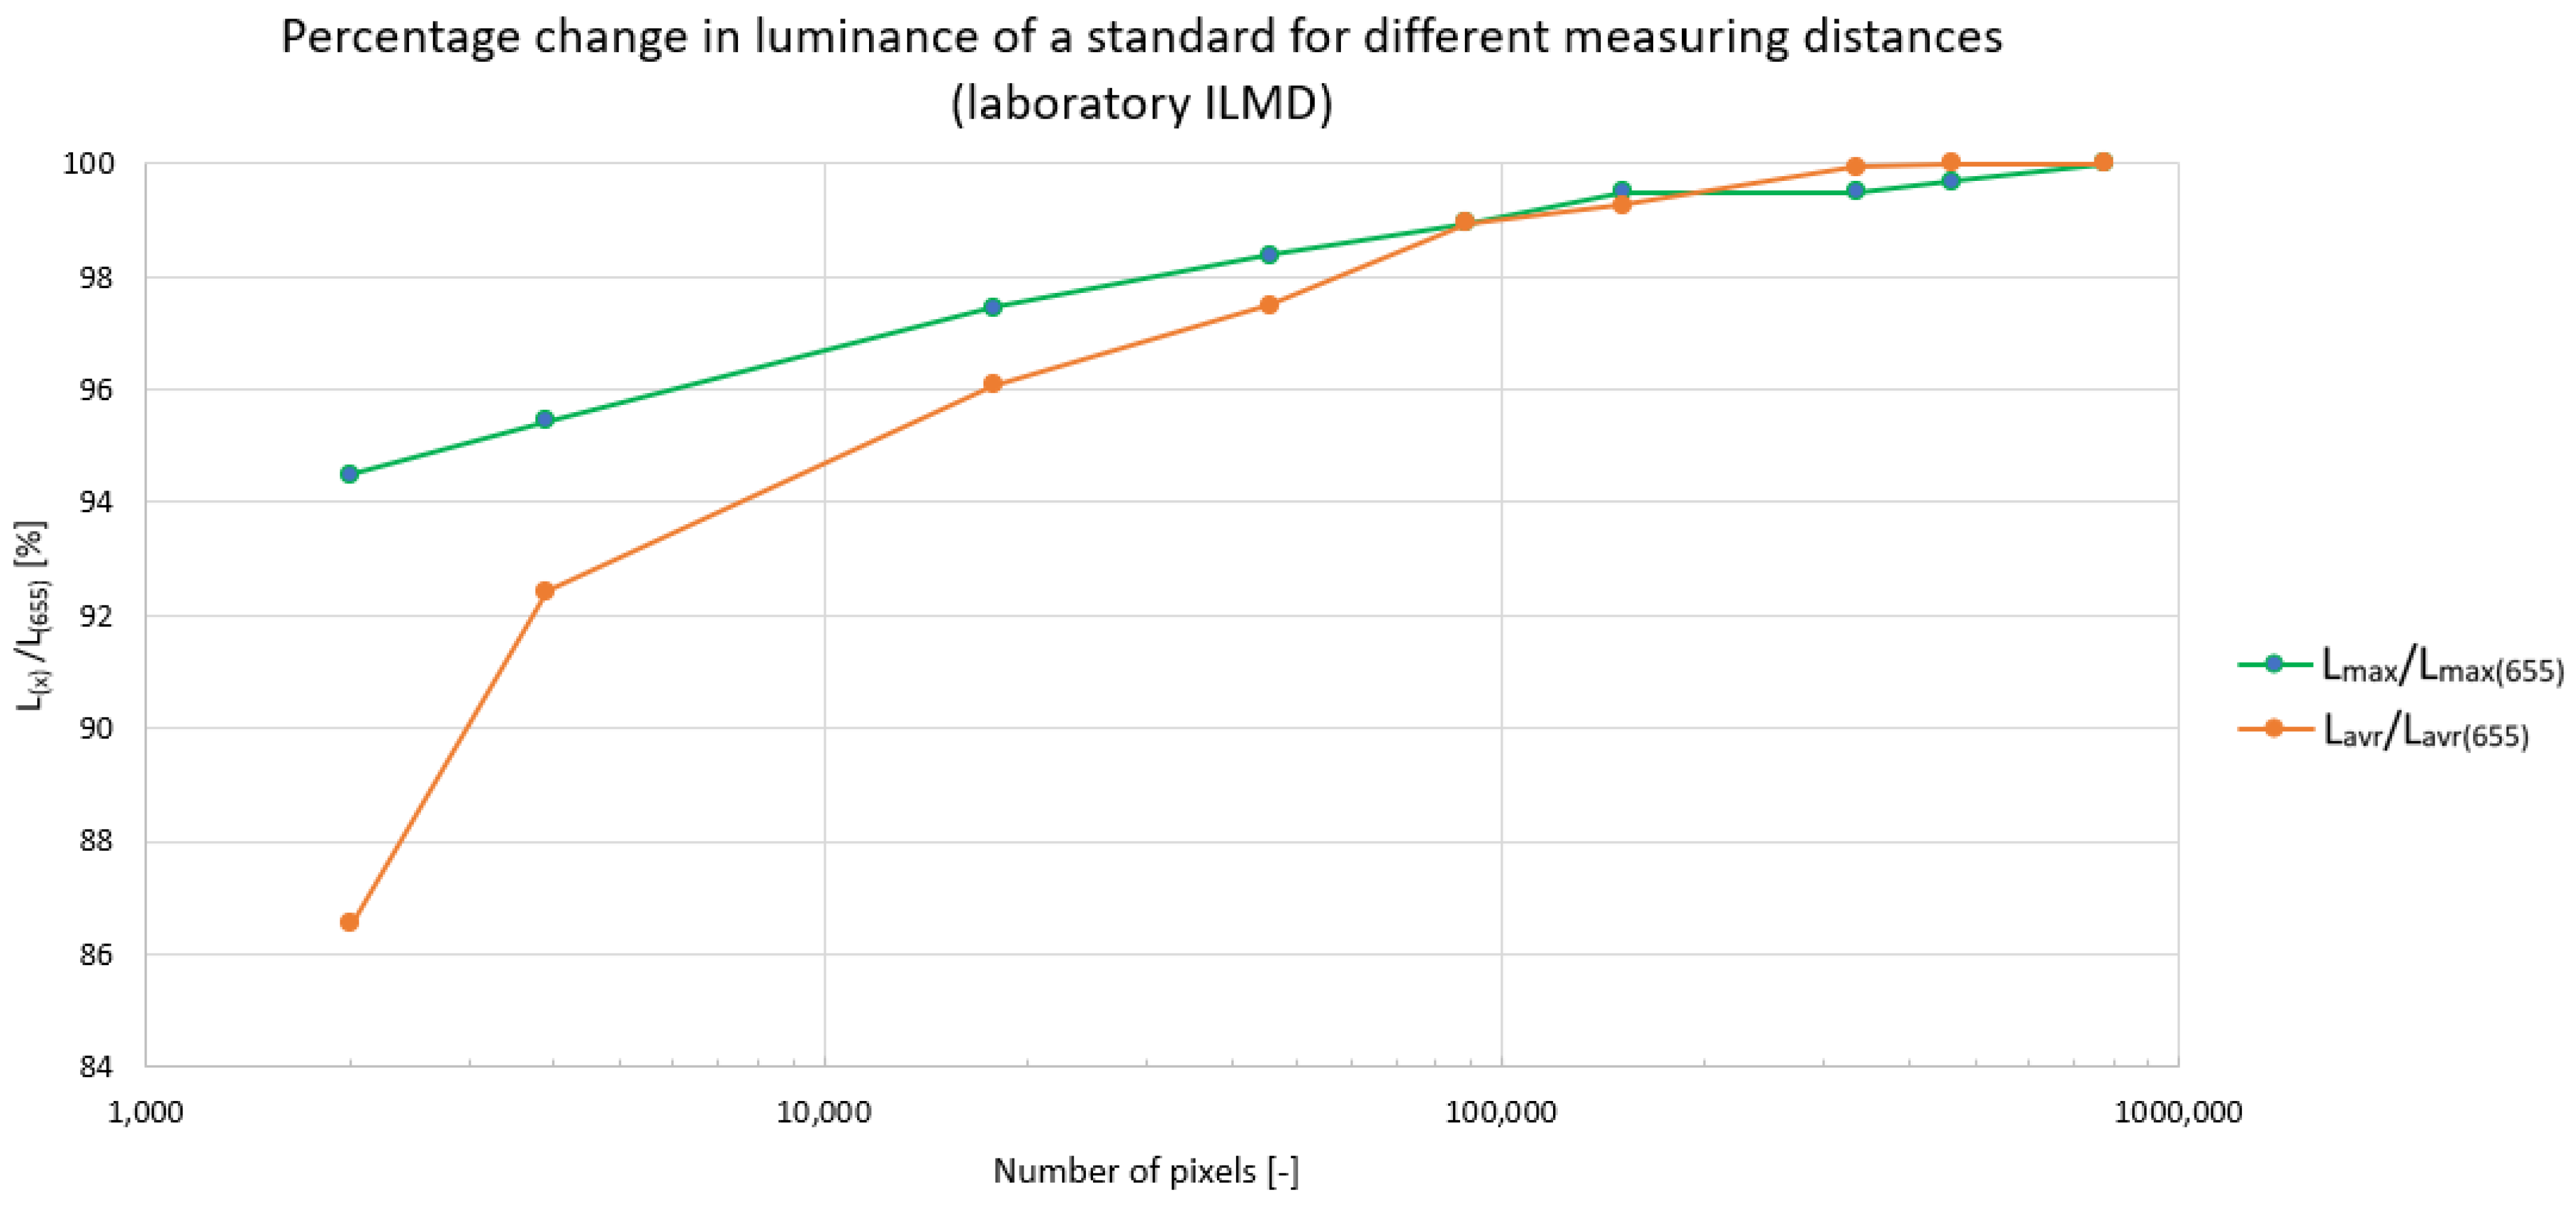
  • the maximum luminance can be measured with 99% accuracy if the measured image covers at least 98,000 pixels,
  • the maximum luminance can be measured with 95% accuracy if the measured image covers at least 3100 pixels,
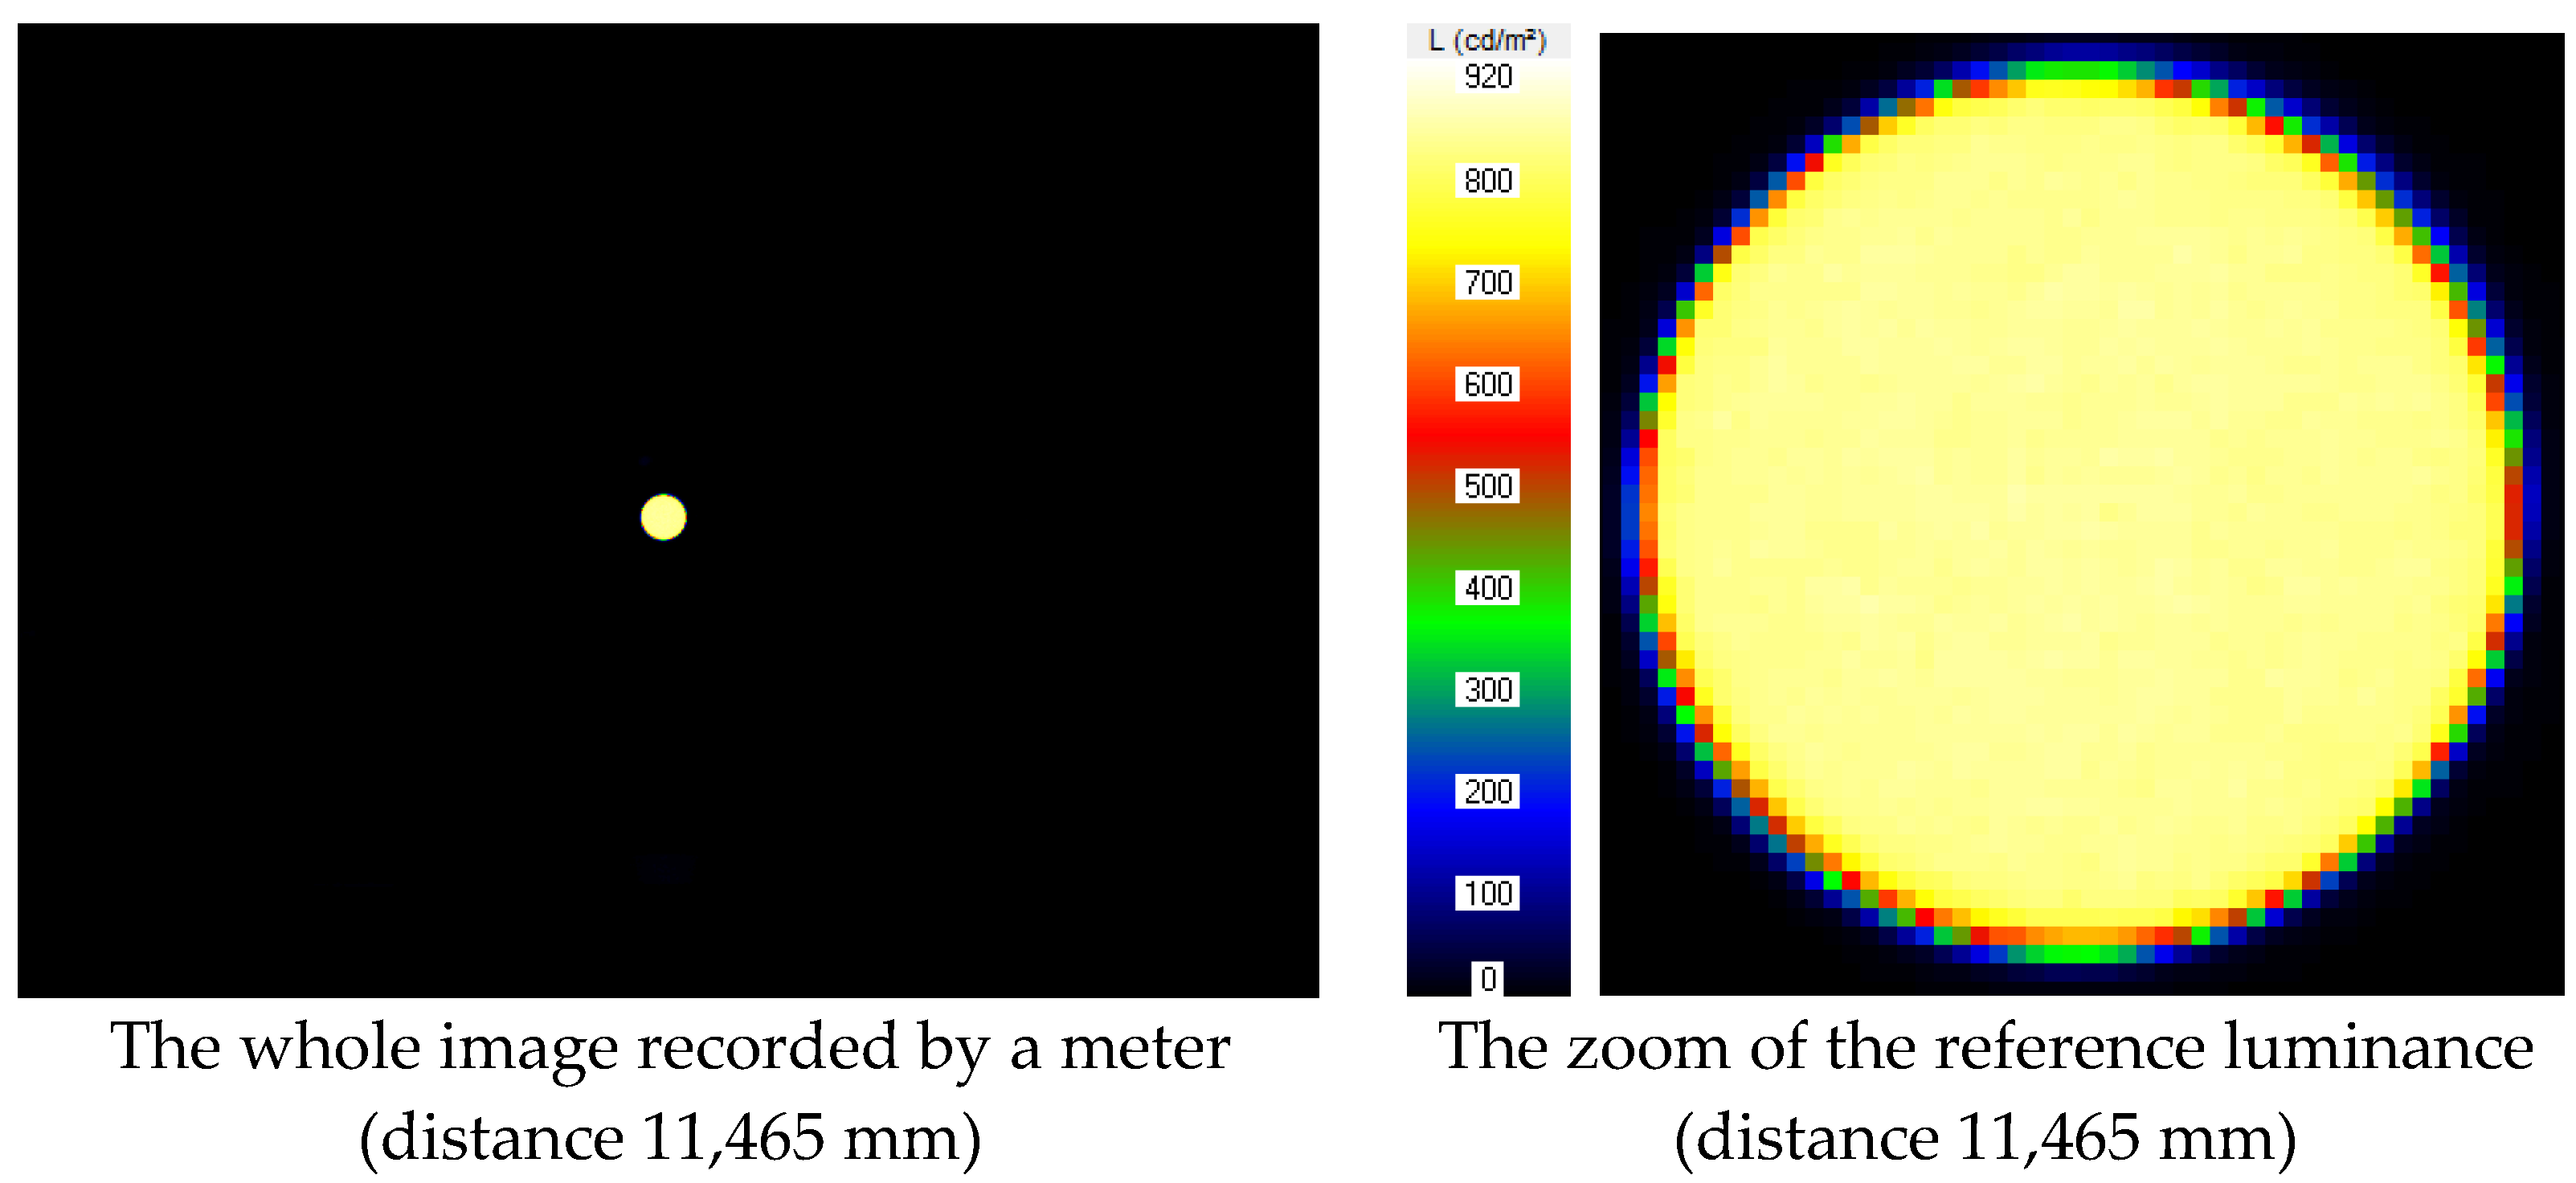
  • the measurement from the longest distance, where the measured image covered only about 2000 pixels, ensures a maximum luminance measurement accuracy of more than 94%.
The further measurement results taken with a portable luminance meter (LMK Air Mobile) are included in Table 4. The measurements taken at the focal length of 50 mm and the last measurement at the focal length of 17 mm were selected for the analysis. In the calculations (columns 5 and 6), the largest possible recorded image from a distance of 280 mm was the reference one.
The presentation of the measurement and calculation results is the same as in Table 3.
Figure 9 shows the results for the average luminance to facilitate the analysis of how the image size (expressed in the number of pixels) changes with changing measurement distance for Air Mobile ILMD.
Analyzing the measurement results shown in Table 4 and Figure 9, it can be seen that the measured average luminance on the reference surface changes with the measurement distance (for Air Mobile ILMD). As in the case of a laboratory meter, it was found that the greater the measurement distance, the fewer pixels are covered by the reference image on the matrix (Air Mobile ILMD) and the lower the value of the measured average luminance. As the measurement distance increases, the average luminance decreases faster than the maximum luminance. If the measurement of the average luminance from the closest possible distance of 280 mm (where the image of the reference surface covered more than 51% of the entire photosensitive matrix) is considered as the reference, the following conclusions can be drawn:
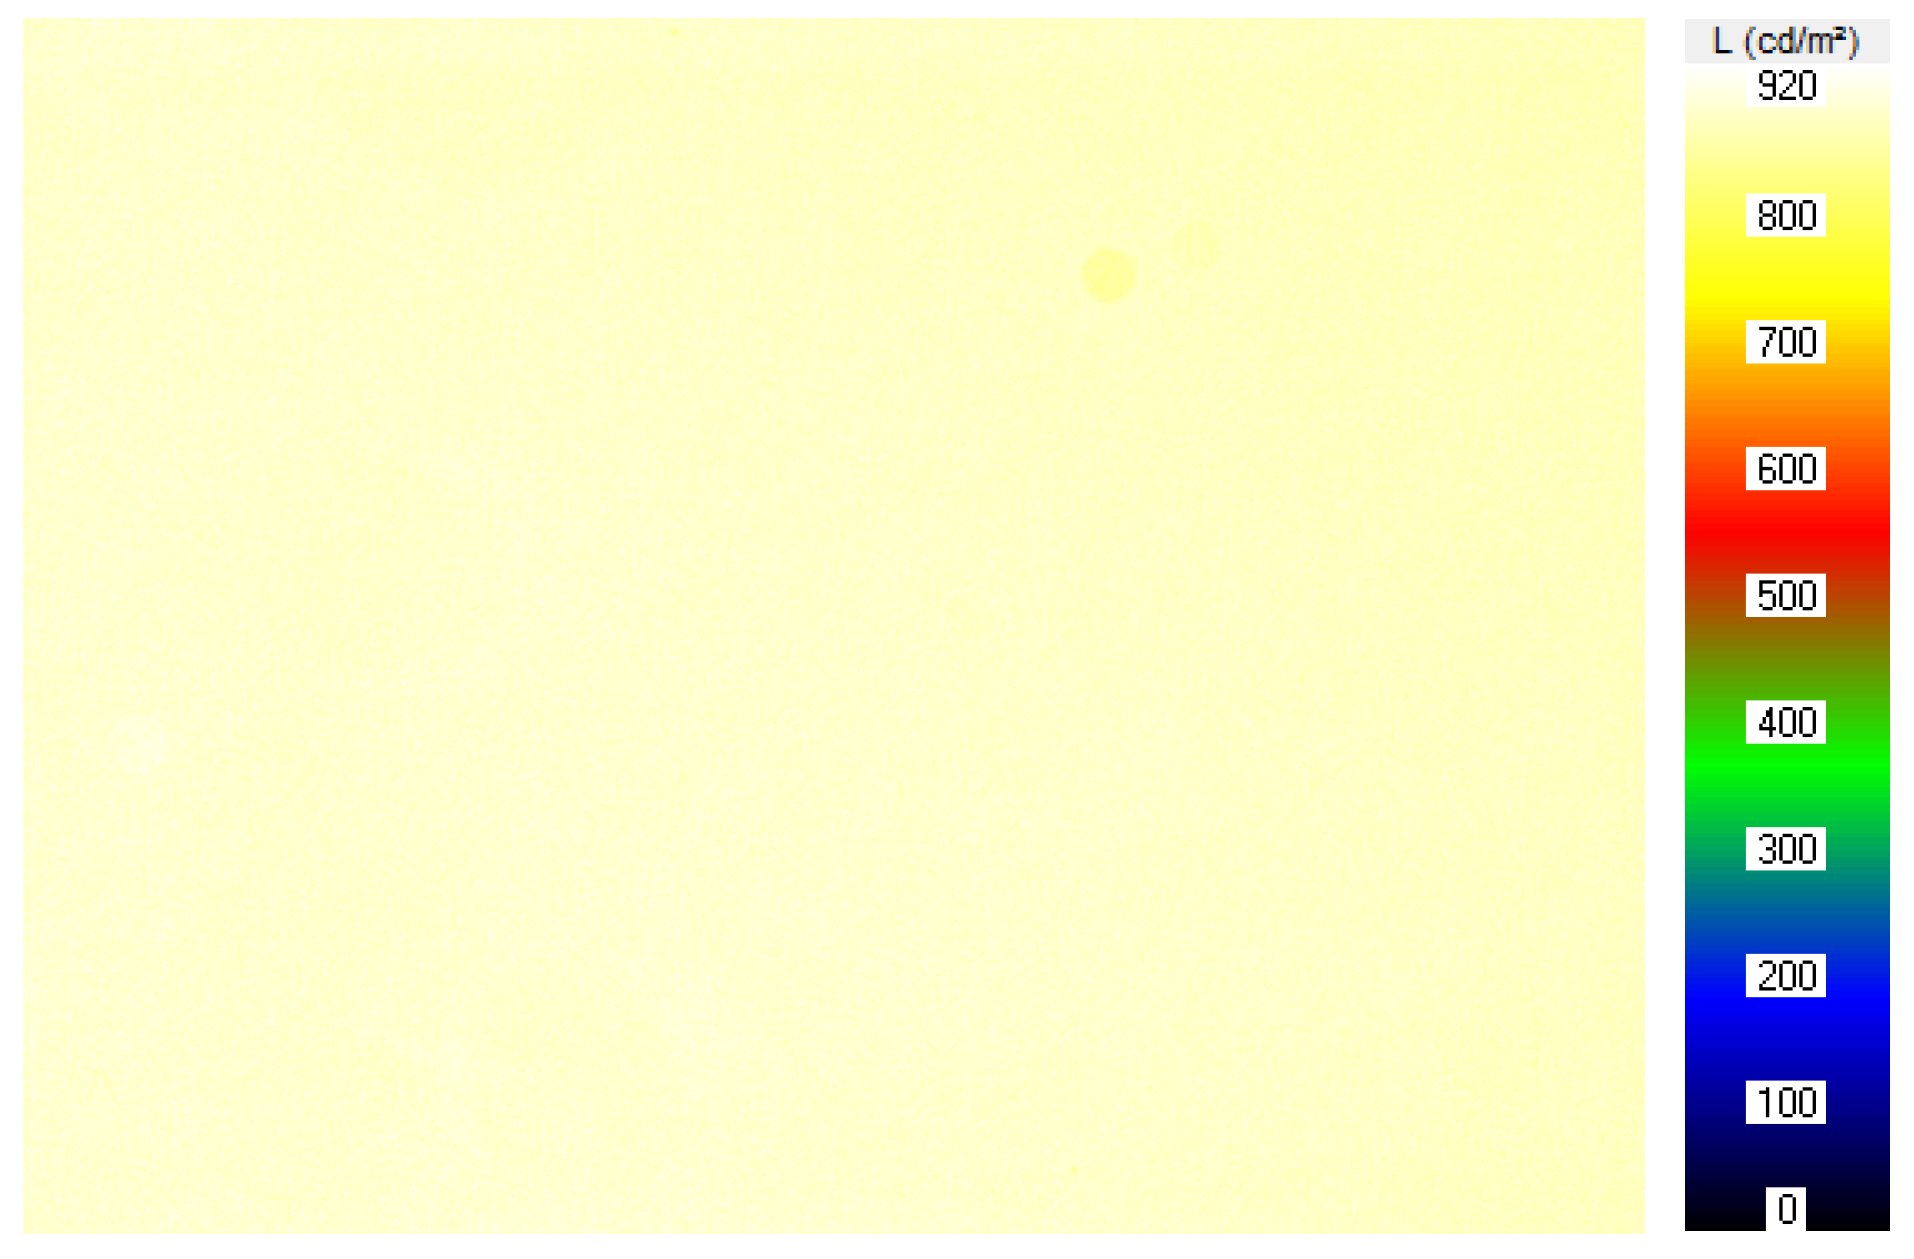
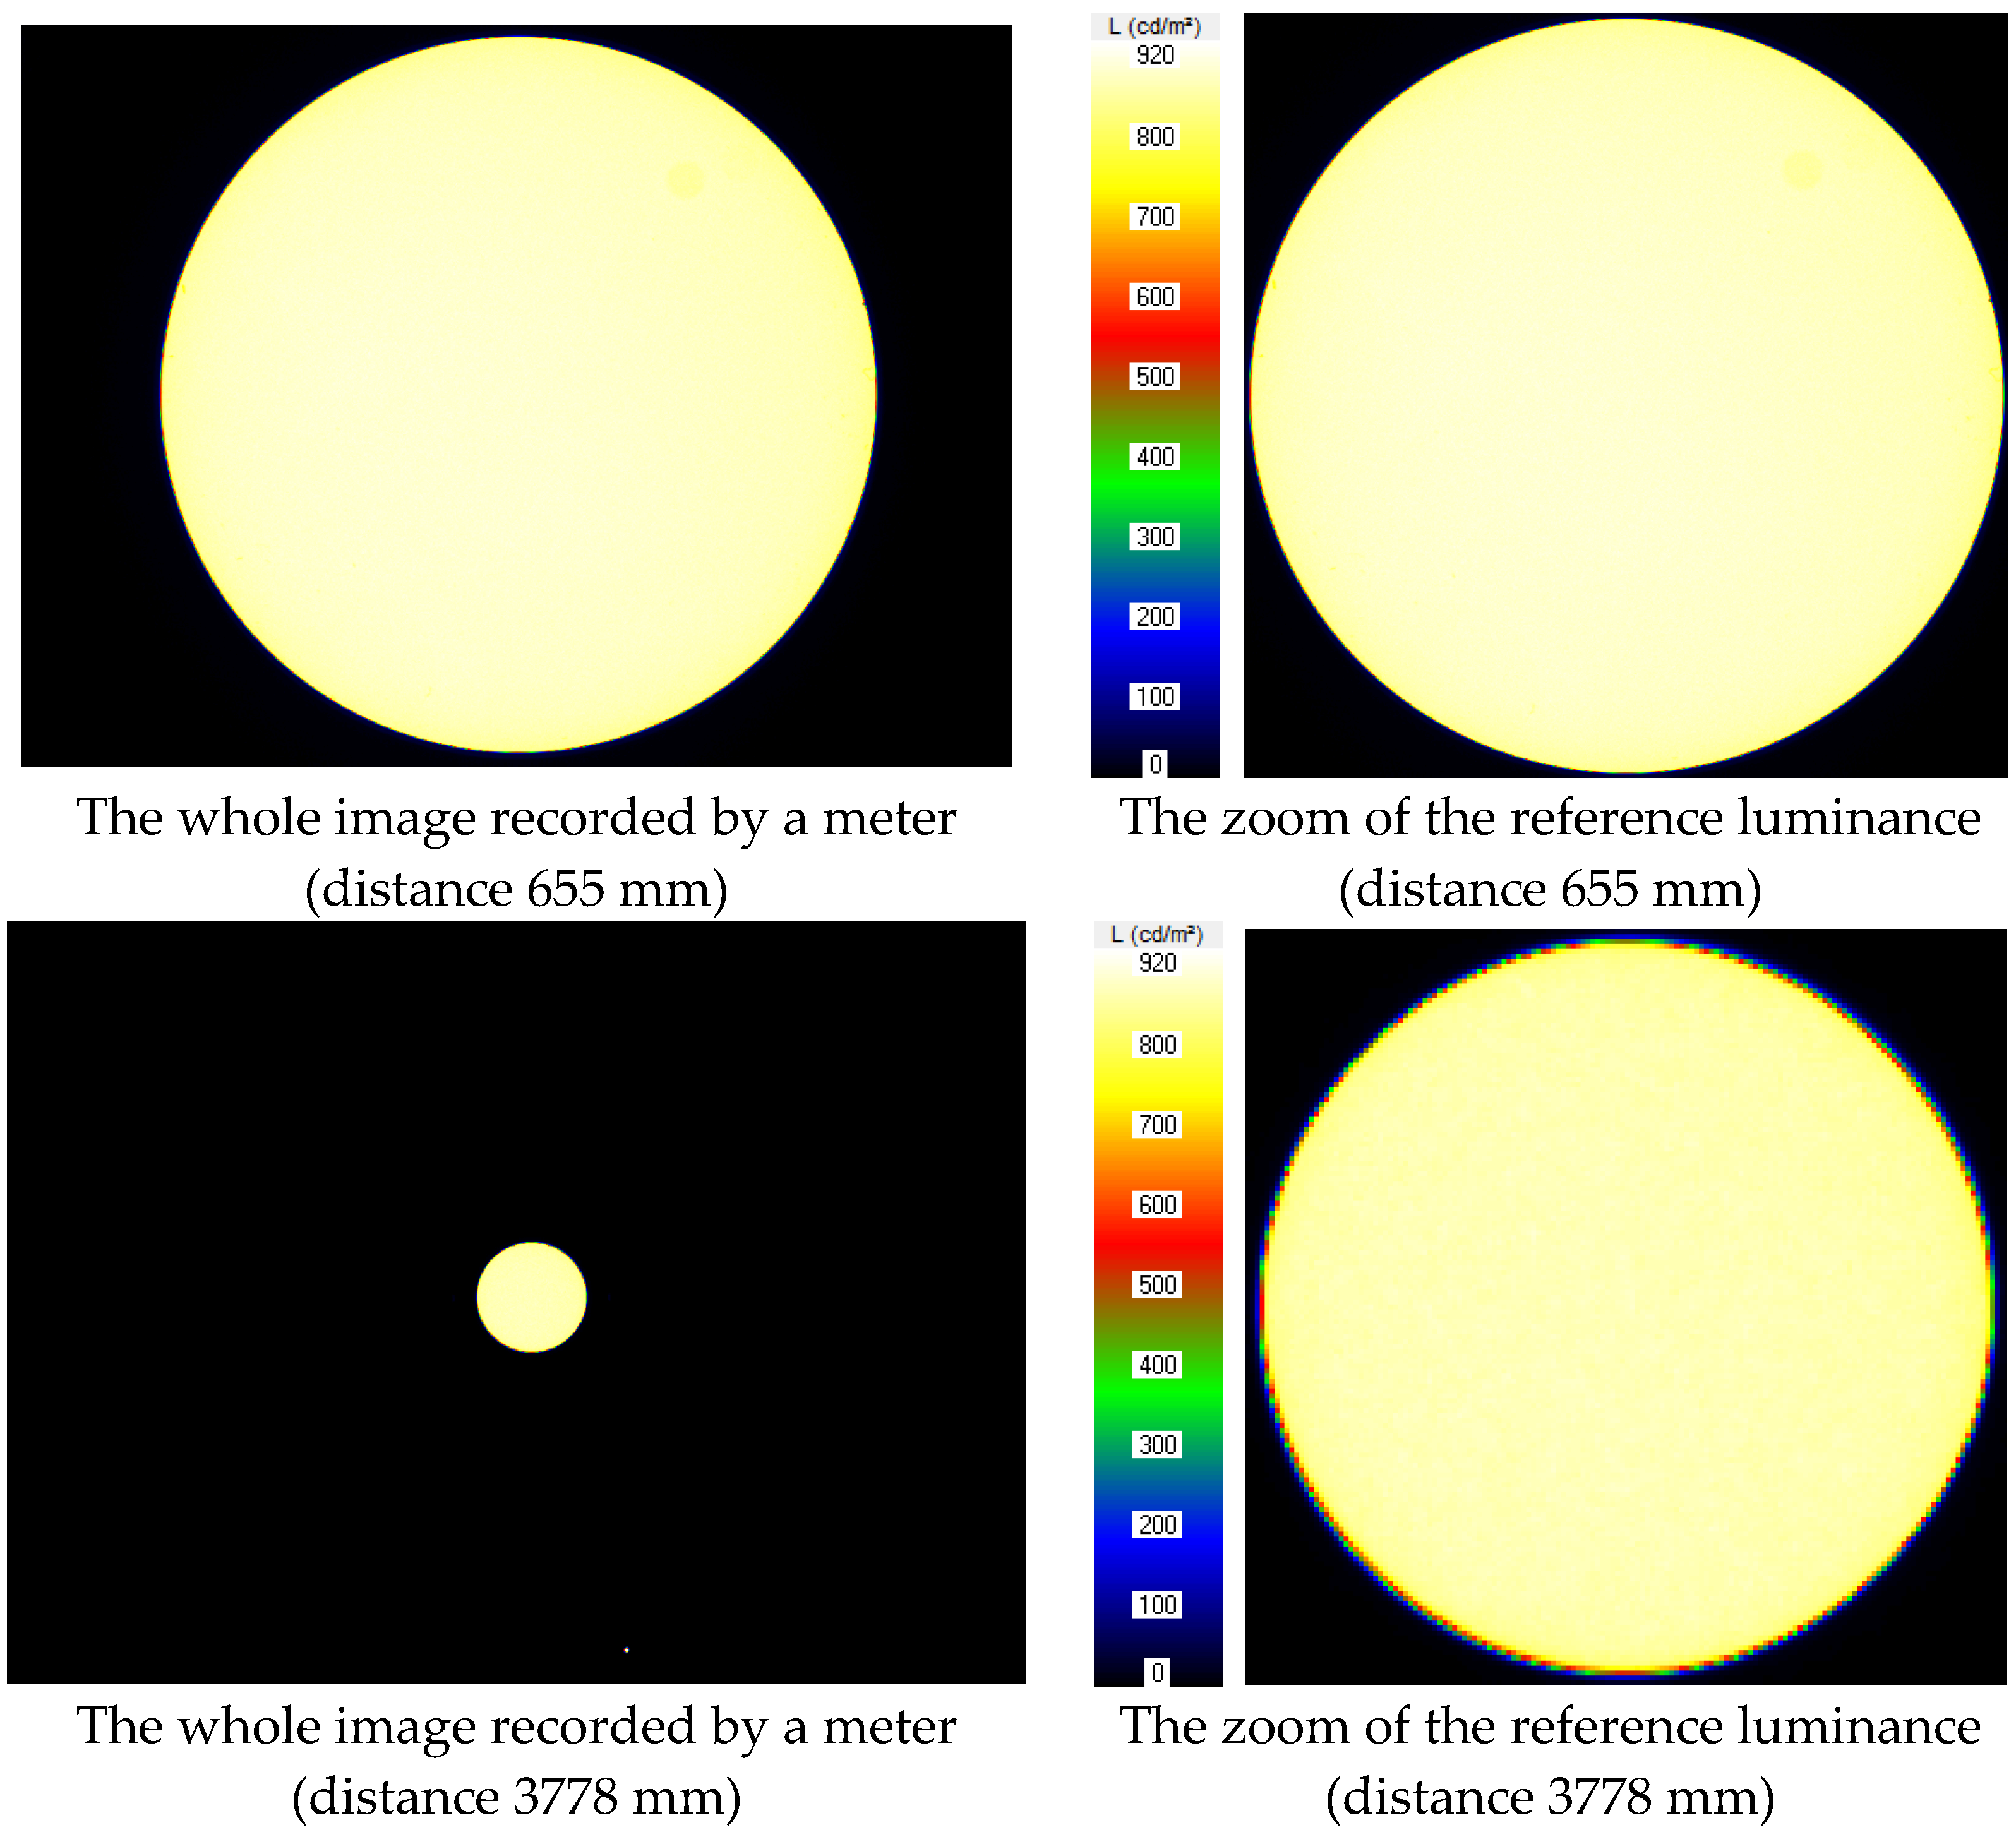
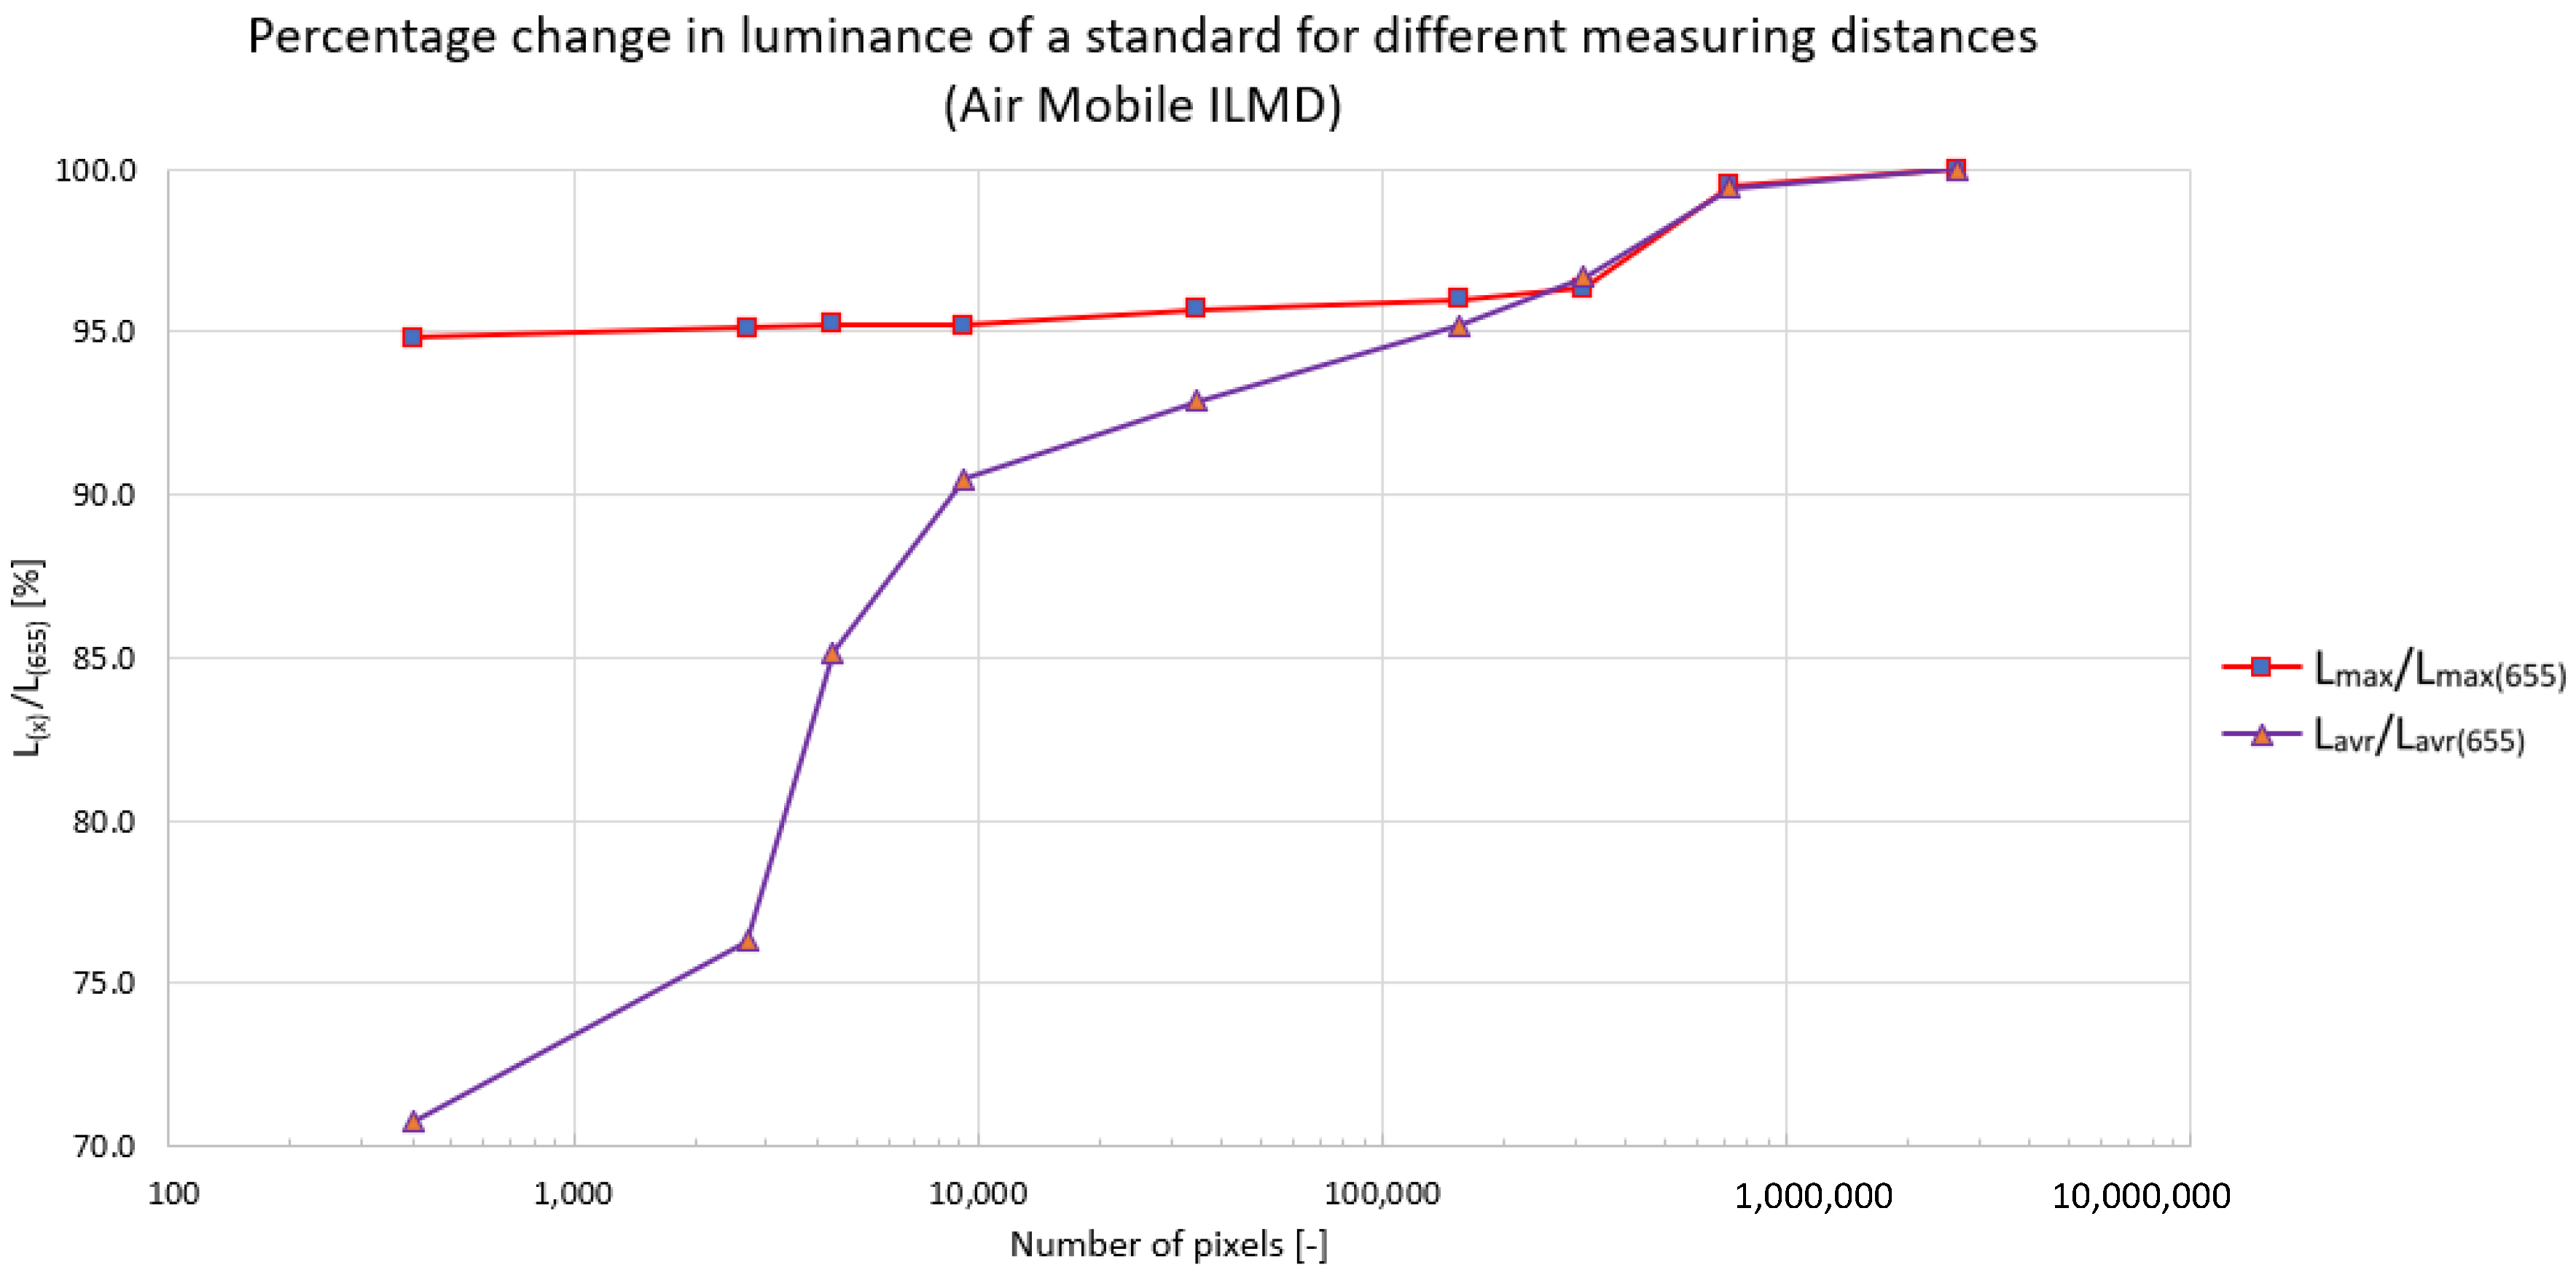
  • the average luminance can be measured with 99% accuracy if the measured image covers at least 660,000 pixels,
  • the average luminance can be measured with 95% accuracy if the measured image covers at least 144,000 pixels,
  • the average luminance can be measured with 90% accuracy if the measured image covers at least 8900 pixels.
In addition, it was found that the measured maximum luminance on the reference surface also changes with the measurement distance. As in the case of the average luminance, it was determined that the greater the measurement distance, the lower the value of the measured maximum luminance. If the measurement from the nearest possible distance (280 mm) is taken as a reference, the following conclusions can be drawn:
  • the maximum luminance can be measured with 99% accuracy if the measured image covers at least 91,000 pixels,
  • the maximum luminance can be measured with 95% accuracy if the measured image covers at least 1800 pixels,
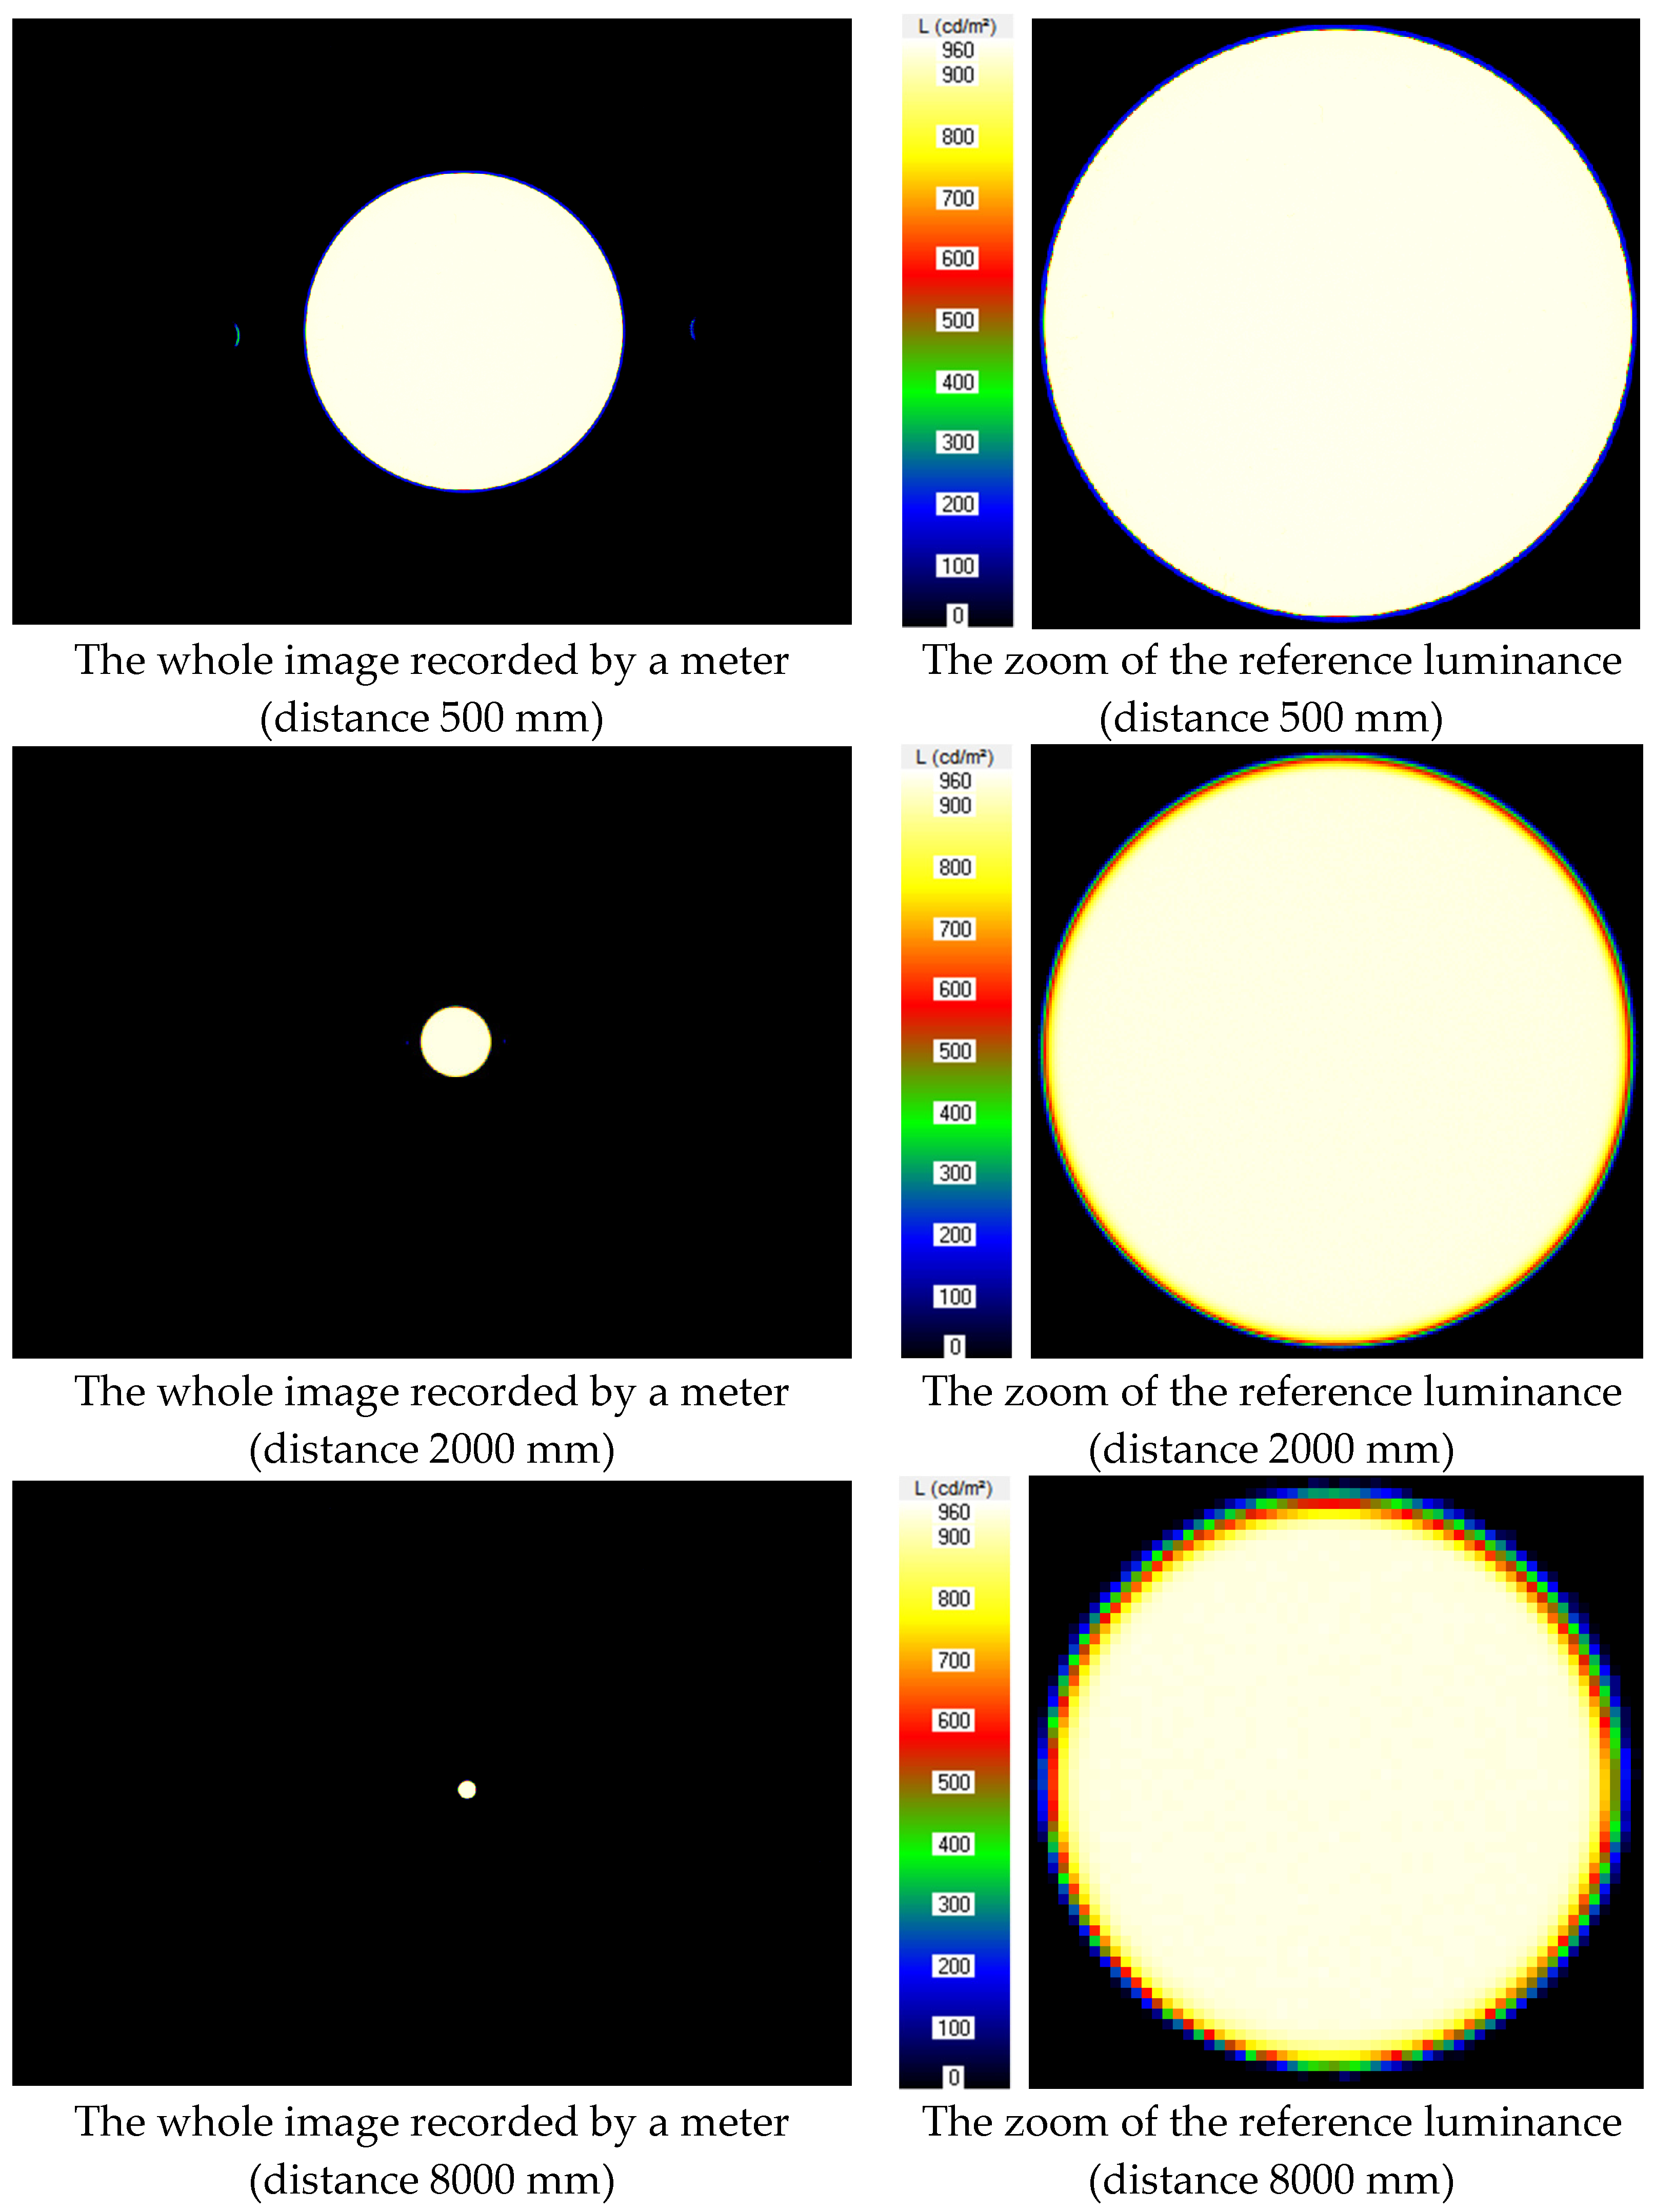
  • measurement from the greatest distance, where the measured image covered only about 400 pixels, ensures a maximum luminance measurement accuracy of more than 94%.
Following the adopted analysis methodology, the influence of the measurement accuracy was related to results where the measured area (reference surface) covered the biggest part of the matrix of the given ILMD. The carried-out measurements concerned a rather large diffusing reference surface. This surface had a very uniform luminance distribution. Hence, it seems interesting to compare the obtained measurement results with those presented in the literature for measurements of high-illuminance LEDs with an uneven luminance distribution on their luminous surface [63].
Table 5 compares what minimum number of pixels the measured image needs to cover to ensure the adequate accuracy of the average luminance measurement. The comparison was made for different measured surfaces and different ILMD meters. The similar comparison for the maximum luminance is shown in Table 6.
When analysing the accuracy results of the average luminance measurement from Table 5, they seem to be quite interesting. It appears that when measuring a reference surface with an even luminance distribution, there should be a higher number of pixels covered by the light source image than in the case of LED sources with an uneven luminance distribution. However, this phenomenon can be explained. The size of the output image is the decisive factor—i.e., how many pixels are occupied by the first—possibly the biggest recorded image of the light source. So, it was this image that provided the reference according to the adopted measurement methodology. For example, using the ILMD laboratory meter when measuring high-luminance LEDs, the reference image for LED1 occupied 56,640 px, and for LED3 it occupied 149,600 px. In relation to these reference images, the measured images covering about 6000 px for LED1 and about 50,000 px for LED3 ensure the measurement accuracy of 99% [63]. It all depends on the output size of the image and the uniformity of the luminance distribution on a given image. However, in the case of the laboratory ILMD, when measuring the reference surface, the reference image occupied 777,000 px, while the image providing 99% measurement accuracy occupied 140,000 px. Hence, it can be concluded that the larger the reference image, the smaller the image providing a given accuracy of the average luminance measurement.
The interpretation of the maximum luminance measurement results shown in Table 6 is simpler. Here, the influence of the reference image is much smaller, especially for the measurements of the reference surface. Hence, it can be concluded that for a surface with an even luminance distribution, the measurement accuracy of 99% can be obtained for distances from which the recorded image is covering approximately 100,000 px. The accuracy of 95% is provided by an image covering approximately 3000 px. It is worth pointing out that regardless of which meter is used and which surface is measured (even or uneven), the image covering 2000 px. ensures the maximum luminance measurement accuracy of 90%.

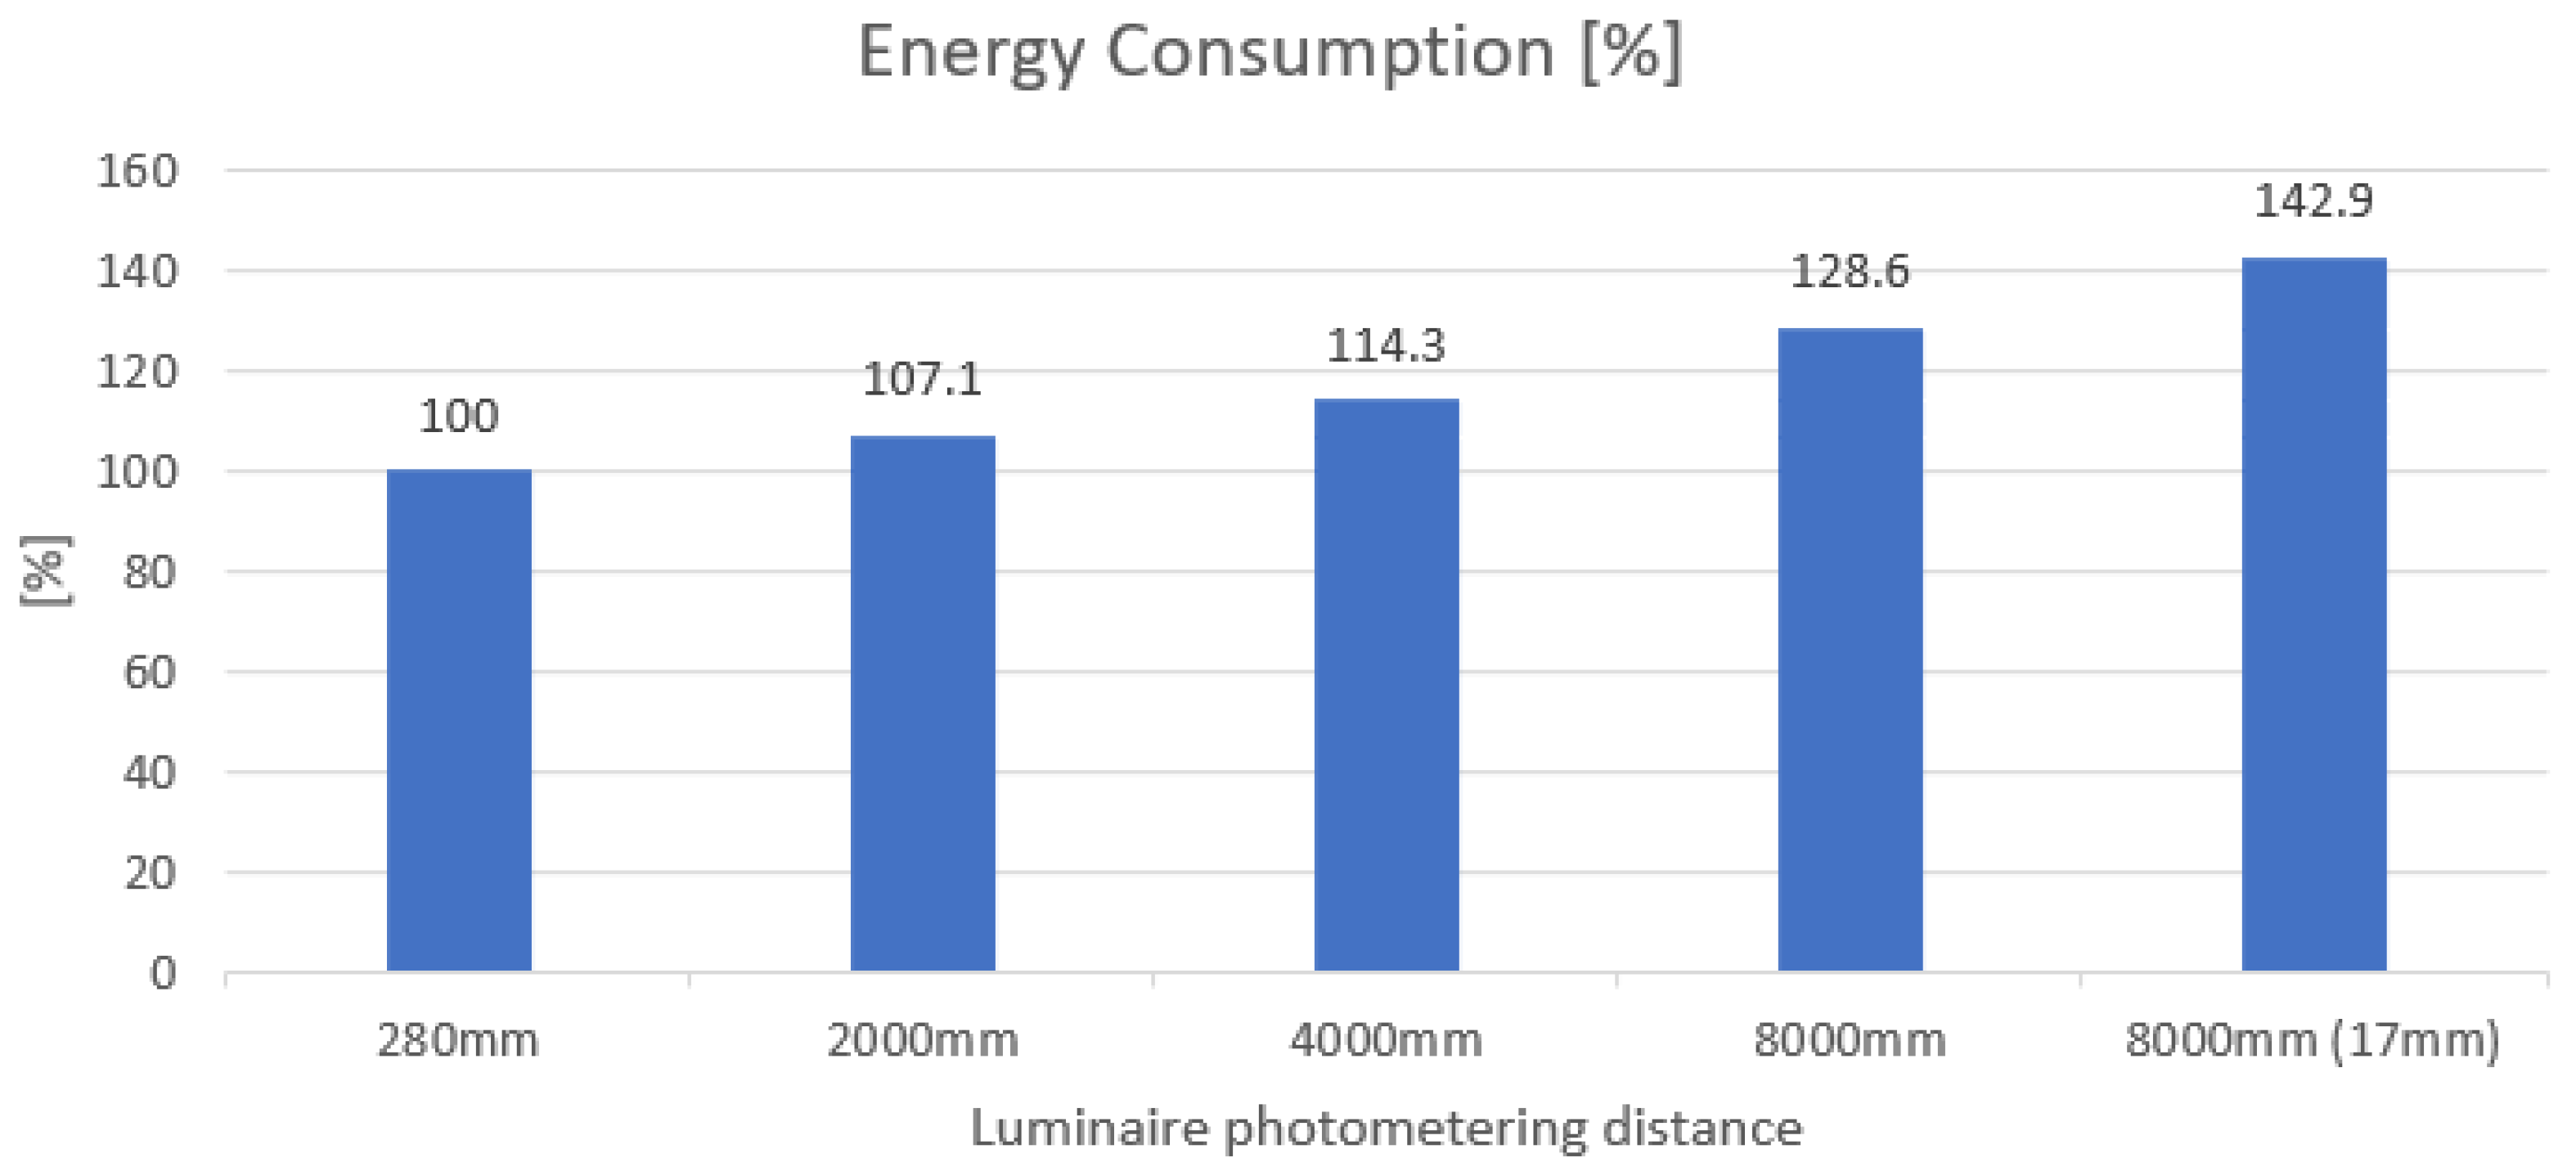
4.2. The Impact of Luminaire Photometric Measurements on Indoor Electricity Consumption

The potential impact of a wrongly photometrically measured luminaire on the illuminance distribution results on task area and electricity consumption in the interior was also examined. For this purpose, a luminaire with a shape and distribution character similar to the luminance reference used in the study was selected. This type of luminaire was used for the reception desk of the following dimensions: its length of 4 m, its width of 4 m and its height of 2.5 m. The typical ceiling/wall/floor reflectance values of 0.7/0.5/0.2 respectively were also selected. The luminaires were arranged in the way to ensure meeting the lighting requirements. For the purpose of this work, four parameters characterizing the lighting condition in the interior were considered. These parameters were: the average maintained illuminance on the task area (Ēm), illuminance uniformity on the task area (Uo), colour rendering index (Ra) and CIE unified glare rating limit (RUGL). The basic lighting requirements are included in Table 7 and the luminaire data is shown in Table 8. The lighting installation was assumed to be in operation for 1900 h (8 h per day, excluding Saturdays, Sundays and public holidays), and the maintenance factor was assumed to be 0.8.
The proportional relationship between luminance, luminous intensity and luminous flux was assumed in determining the effect of luminance measurement distance on the efficiency of the lighting installation. The luminance measurements were assumed to be made using an Air Mobile LMK meter. Luminance Intensity Distribution of luminaire was determined on this assumption. The measurement errors for a given photometric distance were considered to be the same as for the measurement of the reference surface (Table 4).
For this study, the following five luminaire luminance measurement distances were selected: 280 mm (reference), 1000 mm, 4000 mm, 8000 mm, and 8000 mm (zoom 17 mm). It was discovered that as the photometric distance was increasing, the measured luminance and measured luminosity decreased, meaning that the measured luminous flux of the luminaire decreased. So, for the lower luminaire luminous flux, the number of luminaires needs to be increased in order to light the selected room correctly; thus, the actual energy intensity of the lighting installation increases. However, the actual luminance (and luminous flux) of the luminaires is higher—i.e., the same as in the reference installation (for the measuring distance of 280 mm). The simulation calculations were made using the Dialux software. The results of the calculations are summarized in Table 9.
For each luminaire photometric distance, the number of luminaires and their uniform distribution in a given room were selected (Table 9, column 2). Next, the photometric calculations of the lighting installation were made and presented in the following order: Maintained illuminance (Ēm)/Illuminance uniformity (Uo)/Colour rendering index (Ra)/CIE Unified Glare Rating limit value (RUGL). On this basis, the total power (Table 9, column 4), unit power (Table 9, column 5) and annual electricity consumption (Table 9, column 6) were calculated.
By analyzing the obtained results, it can be concluded that increasing the photometric luminaire distances results in apparently lower luminance (and luminous flux) results and, consequently, makes it necessary to use more luminaires to light the same room. So, it impacts the increase of energy consumption. Figure 10 summarizes the energy consumption for each case based on the collected calculation results in Table 9. The results for the photometric distance of 280 mm were considered as a reference and the energy consumption for this distance was assumed to be 100%.
The increase in the luminance measurement distance of the luminaire from 280 mm to 2000 mm would result in the potential increase in the energy consumption in the analyzed room by more than 7%. The further increase in the measuring distance to 4000 mm would increase the energy consumption by over 14%. Measuring the luminance of the luminaires from the greatest distance of 8000 mm would increase the energy consumption by over 28% for a 50-mm zoom and by almost 43% for the measurements taken with a 17-mm zoom.
The conducted analysis has confirmed the thesis that taking luminance measurements from the wrong distance and not according to the limiting photometric distance can cause severe errors in the design of lighting installations. This applies to both interior and exterior lighting, including road lighting.

5. Conclusions

In the conducted tests, two matrix luminance meters were used: a laboratory meter and a portable meter. The luminance standard was used as a light source and it provided a constant luminance over the entire standard area. The obtained measurement results have shown the influence of the photometric distance on the luminance measurement results.
Based on the obtained test results, the luminance measurement distance can be chosen in such a way as to ensure the expected accuracy of the results by determining the appropriate size of the output image on the photosensitive matrix of the ILMD meter. So, the larger the size of an output image, the more accurate measurement result. The limiting measurement distance is best determined separately for the given measurement system: a light source–a matrix luminance meter. The definition of the limiting photometric distance given in the literature [63] should be considered valid, but with the addition of the measurement direction, defined as the following:
The photometric test distance for luminance measurements taken using an ILMD meter is the distance from which the measured image is projected onto a sufficient number of pixels of the photosensitive matrix to ensure that the luminance meter readings for a given measurement direction remain constant.
In the case of classical luminance meters, the limiting photometric distance is the one for which the entire measuring area of the luminance meter covers only the measured light source as seen from a given direction. The selection of the measuring distance facilitates the possibility of changing the measuring area (viewing angle) of the meter if the meter has this functionality.
However, in the indirect method, the limiting distance of measurement is the distance from which the law of the photometric distance law can be applied for a given direction of measurement. In this method, the precision of determining the luminous surface as seen from a given direction is also essential.
The tests carried out for the ILMD meters have shown that the measurement of maximum luminance is less sensitive to the changes in photometric distance than the measurement of the average luminance. It has been demonstrated that the average luminance can be measured with 90% accuracy when the measurement distance ensures that the light source image covers at least 9000 px of the ILMD meter matrix; it is so, regardless of which meter is used (Laboratory or Air Mobile) and which source is being measured (the reference with a uniform distribution or LED with a large gradient in luminance distribution). In case of measuring the maximum luminance, it can be measured with 90% accuracy when the measurement distance ensures that the light source image covers at least 2000 px of the photosensitive matrix, regardless of the meter and light source.
The conducted study has shown that a wrongly chosen measuring distance and an incorrect luminance measurement result could increase energy consumption by up to 43% in the case of the analyzed interior lighting system. These results have been related to correctly performed luminance measurements.
The conducted measurements showed that the measurement results can have a varying accuracy, regardless of the luminance level and luminance distribution on the surface of the light source. The correct distance between the light source and an ILMD meter needs to be selected to ensure a high measurement accuracy. The smaller the image recorded by a luminance meter, the lower the accuracy.
The results of the conducted tests will allow other researchers to estimate the accuracy of the luminance measurement in an easy way. In addition, these results will facilitate the selection of the correct photometric distance, especially for the meters used in the tests.

Funding

This research received no external funding.

Data Availability Statement

Not applicable.

Acknowledgments

Article Preparation Charge was covered by the Electrical Power Engineering Institute at The Warsaw University of Technology, and the Open Access Charge was covered by the IDUB program at the Warsaw University of Technology.

Conflicts of Interest

The author declares no conflict of interest.

References

  1. Li, T.; Lin, F.; Huang, B.; Ji, M.; Shi, L.; Xia, M.; Lai, L. The total luminous flux measurement of high-power LEDs. Proc. SPIE 2019, 11334, 151–156. [Google Scholar]
  2. Markovič, M.; Orgulan, A.; Sukič, P. Measuring System for Determining the Quality of LED Light Sources and an Overview of LED Light Bulbs for Household Use. Sensors 2022, 22, 8351. [Google Scholar] [CrossRef] [PubMed]
  3. Romero, R.J.A.; Caro-Ruiz, C. Uncertainty estimation in luminous flux measured with goniophotometers using monte carlo method. In Proceedings of the 2020 IEEE PES Transmission and Distribution Conference and Exhibition—Latin America, T and D LA, Montevideo, Uruguay, 28 September–2 October 2020. [Google Scholar]
  4. Lin, F.; Li, T.; Yin, D.; Lai, L.; Xia, M. Research on effects of baffle position in an integrating sphere on the luminous flux measurement. In Proceedings of the 8th International Symposium on Advanced Optical Manufacturing and Testing Technologies: Optical Test, Measurement Technology, and Equipment, Suzhou, China, 26–29 April 2016; pp. 347–352. [Google Scholar]
  5. Zalesińska, M.; Zabłocka, J.; Wandachowicz, K. Measurement and evaluation of selected parameters for non-directional household lamps. Prz. Elektrotech. 2018, 1, 190–194. [Google Scholar] [CrossRef]
  6. CIE. International Commission on Illumination CIE S 025/E:2015 Test Method for Led Lamps, Led Luminaires and Led Modules; CIE: Vienna, Austria, 2015. [Google Scholar]
  7. Xu, Y.; Hu, H.; Chen, L.; Song, G.; Zhuang, W. Analysis on the high luminous flux white light from GaN-based laser diode. Appl. Phys. B Lasers Opt. 2010, 98, 83–86. [Google Scholar] [CrossRef]
  8. Narukawa, Y.; Ichikawa, M.; Sanga, D.; Sano, M.; Mukai, T. White light emitting diodes with super-high luminous efficacy. J. Phys. D Appl. Phys. 2010, 43, 354002. [Google Scholar] [CrossRef]
  9. Gasparovsky, D.; Raditschova, J. Lighting properties and efficiency of luminaires exceeding their lifetime. In Proceedings of the CIE Centenary Conference “Towards a New Century of Light”, Paris, France, 15–16 April 2013; pp. 15–16. [Google Scholar]
  10. Pan, J.; Qian, F.; Min, F.; Li, Y.; CIE. Total luminous flux and chromacity measurement for led luminaires using absolute interating sphere method. In Proceedings of the 27th Session of the CIE, Sun City, South Africa, 10–15 July 2011; Volume 1, pp. 478–481. [Google Scholar]
  11. Alawadhi, E.M. Effect of an incompletely closed window shutter on indoor illuminance level and heat gain. Energy Build. 2016, 110, 112–119. [Google Scholar] [CrossRef]
  12. Oshio, K.; Tsujimoto, M.; Taniguchi, K.; Obo, T.; Kubota, N. 2D-SLAM of Illuminance Measurement Robot using 3D-LiDAR and IMU on Slopes. In Proceedings of the 2022 Joint 12th International Conference on Soft Computing and Intelligent Systems and 23rd International Symposium on Advanced Intelligent Systems (SCIS&ISIS), Ise, Japan, 29 November–2 December 2022; pp. 1–6. [Google Scholar]
  13. Li, D.H.W.; Cheung, G.H.W.; Cheung, K.L. Evaluation of simplified procedure for indoor daylight illuminance determination against data in scale model measurements. Indoor Built Environ. 2006, 15, 213–223. [Google Scholar] [CrossRef]
  14. Jaskowski, P.; Tomczuk, P.; Chrzanowicz, M. Construction of a Measurement System with GPS RTK for Operational Control of Street Lighting. Energies 2022, 15, 9106. [Google Scholar] [CrossRef]
  15. Bhandary, S.K.; Dhakal, R.; Sanghavi, V.; Verkicharlai, P.K. Ambient light level varies with different locations and environmental conditions: Potential to impact myopia. PLoS ONE 2021, 16, e0254027. [Google Scholar] [CrossRef]
  16. Nabavi Niaki, M.S.; Saunier, N.; Miranda-Moreno, L.F.; Amador, L.; Bruneau, J.F. Method for road lighting audit and safety screening at urban intersections. Transp. Res. Rec. 2014, 2458, 27–36. [Google Scholar] [CrossRef]
  17. Fiorentin, P.; Scroccaro, A. The importance of testing road lighting plants: A simple system for their assessment. In Proceedings of the 2009 IEEE Intrumentation and Measurement Technology Conference, I2MTC 2009, Singapore, 5–7 May 2009. [Google Scholar]
  18. EN 12464-1:2021; Light and Lighting—Lighting of Work Places—Part 1: Indoor Work Places. CEN: Brussels Belgium, 2021.
  19. EN 12464-1: 2014; Light and Lighting—Lighting of Work Places—Part 2: Outdoor Work Places. CEN: Brussels Belgium, 2014.
  20. EN 13201-2:2015; Road Lighting—Part 2: Performance Requirements. CEN: Brussels Belgium, 2015; p. 23.
  21. Samedov, F.; Bazkir, Ö. Realization of photometric base unit of candela traceable to cryogenic radiometer at UME. EPJ Appl. Phys. 2005, 30, 205–213. [Google Scholar] [CrossRef]
  22. Mũoz-Martínez, V.F.; Serón-Barba, J.; Molina-Mesa, R.; Gómez-De-Gabriel, J.M.; Fernández-Lozano, J.; García-Cerezo, A. Double reflection goniophotometer. Metrologia 2006, 43, 185–194. [Google Scholar] [CrossRef]
  23. Legierski, M.; Michałek, P. Concept and implementation of H-V goniophotometer for fast measurement of luminous intensity distribution in C-γ system. Prz. Elektrotech. 2020, 1, 77–80. [Google Scholar] [CrossRef]
  24. Sauter, G. Goniophotometry: New calibration method and instrument design. In Metrologia; IOP Publishing: Bristol, UK, 1995. [Google Scholar]
  25. Oleszyński, T. Miernictwo Techniki Świetlnej (Eng. Metrology of Lighting Technology); PWN: Warsaw, Poland, 1957. [Google Scholar]
  26. CIE. International Commission on Illumination Technical Report No. 121: The Photometry and Goniophotometry of Luminaires; CIE: Vienna, Austria, 1996. [Google Scholar]
  27. CIE. International Commission on Illumination Technical Report No. 70: The Measurement of Absolute Luminous Intensity Distribution; CIE: Vienna, Austria, 1987. [Google Scholar]
  28. United Nations. United Nations Regulations 112—Uniform Provisions Concerning the Approval of Motor Vehicle Headlamps Emitting an Asymmetrical Passing-Beam or a Driving-Beam or Both and Equipped with Filament Lamps and/or Light-Emitting Diode (LED) Modules; United Nations: Geneva, Switzerland, 2014. [Google Scholar]
  29. Skarżyński, K.; Żagan, W.; Krajewski, K. Led luminaires: Many chips—Many photometric and lighting simulation issues to solve. Energies 2021, 14, 4646. [Google Scholar] [CrossRef]
  30. Czyzewski, D. Monitoring of the lighting conditions of a street illuminated with road lights equipped with LEDs. Prz. Elektrotech. 2010, 86, 170–172. [Google Scholar]
  31. Buyukkınacı, B.; Onaygil, S.; Guler, O.; Yurtseven, M.B. Comparison of road lighting calculations with measurements using conventional and camera luminance meters. Light Eng. 2016, 24, 56–63. [Google Scholar]
  32. Krupiński, R. Luminance distribution projection method in dynamic floodlight design for architectural features. Autom. Constr. 2020, 119, 103360. [Google Scholar] [CrossRef]
  33. Skarzynski, K. Field measurement of Floodlighting Utilisation Factor. In Proceedings of the 2016 IEEE Lighting Conference of the Visegrad Countries, Lumen V4 2016, Karpacz, Poland, 13–16 September 2016. [Google Scholar]
  34. Krupinski, R. Virtual reality system and scientific visualisation for smart designing and evaluating of lighting. Energies 2020, 13, 5518. [Google Scholar] [CrossRef]
  35. Sielachowska, M.; Tyniecki, D.; Zajkowski, M. Luminance distribution measurements in a classroom using the Skywatcher system. Prz. Elektrotech. 2019, 1, 267–270. [Google Scholar] [CrossRef]
  36. Piccoli, B.; Soci, G.; Zambelli, P.L.; Pisaniello, D. Photometry in the workplace: The rationale for a new method. Ann. Occup. Hyg. 2004, 48, 29–38. [Google Scholar]
  37. Hirning, M.B.; Isoardi, G.L.; Cowling, I. Discomfort glare in open plan green buildings. Energy Build. 2014, 70, 427–440. [Google Scholar] [CrossRef]
  38. Geerdinck, L.M.; Van Gheluwe, J.R.; Vissenberg, M.C.J.M. Discomfort glare perception of non-uniform light sources in an office setting. J. Environ. Psychol. 2014, 39, 5–13. [Google Scholar] [CrossRef]
  39. Wolska, A.; Sawicki, D. Practical application of HDRI for discomfort glare assessment at indoor workplaces. Meas. J. Int. Meas. Confed. 2019, 151, 107179. [Google Scholar] [CrossRef]
  40. Czyżewski, D. Research on luminance distributions of chip-on-board light-emitting diodes. Crystals 2019, 9, 645. [Google Scholar] [CrossRef]
  41. Zheng, L.; Guo, Z.; Yan, W.; Lin, Y.; Lu, Y.; Kuo, H.C.; Chen, Z.; Zhu, L.; Wu, T.; Gao, Y. Research on a Camera-Based Microscopic Imaging System to Inspect the Surface Luminance of the Micro-LED Array. IEEE Access 2018, 6, 51329–51336. [Google Scholar] [CrossRef]
  42. Czyzewski, D. Selected problems of defining the luminous area of electroluminescent diodes. Prz. Elektrotech. 2008, 84, 129–131. [Google Scholar]
  43. Chaves, J.; Falicoff, W.; Benitez, P.; Miñano, J.C.; Parkyn, W.A.; Dross, O. Luminance enhancement of LED light sources for etendue-limited applications. In Proceedings of the Nonimaging Optics and Efficient Illumination Systems III, San Diego, CA, USA, 13–15 August 2006. [Google Scholar]
  44. Czyzewski, D. Luminance distribution of LED luminous surface. Prz. Elektrotech. 2010, 86, 166–169. [Google Scholar]
  45. Cai, H. Camera aided luminance measurement of the luminous surfaces of different light sources. In Proceedings of the AEI 2011: Building Integrated Solutions—Proceedings of the AEI 2011 Conference, Oakland, CA, USA, 30 March–2 April 2011. [Google Scholar]
  46. Graef, K.; Schaeffel, F. Control of accommodation by longitudinal chromatic aberration and blue cones. J. Vis. 2012, 12, 14. [Google Scholar] [CrossRef]
  47. Czyżewski, D. The leds luminance distribution measurement quality dependency on image focusing. Photonics Lett. Pol. 2020, 12, 121–123. [Google Scholar] [CrossRef]
  48. Website of Lichtmesstechnik Gmbh Berlin. LUMINANCE METERS LMT L 1009. Available online: https://lmt.de/index.html@p=401.html (accessed on 5 May 2023).
  49. Website of Konica Minolta Chroma Meter CS-200. Available online: https://www.konicaminolta.com/instruments/download/catalog/light/pdf/cs200_catalog_eng.pdf (accessed on 13 May 2023).
  50. CEN/TC EN 13201-4:2015; Road lighting—Part 4: Methods of Measuring Lighting Performance. CEN: Brussels, Belgium, 2015.
  51. Website of GL OPTIC. GL OPTICAM. Available online: https://gloptic.com/products/luminance-cameras/#products (accessed on 15 May 2023).
  52. Website of TechnoTeam Vision USA Inc. LMK 6 Color. Available online: https://www.technoteamvision.com/product_overview/photometer_colorimeter/products/lmk_6_color/index_eng.html (accessed on 15 May 2023).
  53. Website of KONICA MINOLTA CA-2500. Available online: https://www.konicaminolta.eu/eu-en/hardware/measuring-instruments/light-and-display-measurement/luminance-meters/ca-2500 (accessed on 15 May 2023).
  54. Website of Hangzhou Hoptek Technology Co. CX-1000 Imaging Luminance Meter. Available online: https://hoptek.net/en/products/detail/CX1000.html (accessed on 15 May 2023).
  55. Salamone, F.; Sibilio, S.; Masullo, M. Assessment of the Performance of a Portable, Low-Cost and Open-Source Device for Luminance Mapping through a DIY Approach for Massive Application from a Human-Centred Perspective. Sensors 2022, 22, 7706. [Google Scholar] [CrossRef]
  56. Brebenariu, D.; Galatanu, C.D. Measuring Luminance with Digital Photometric Camera in Short Tunnels. In Proceedings of the EPE 2020—Proceedings of the 2020 11th International Conference and Exposition on Electrical and Power Engineering, Iasi, Romania, 22–23 October 2020. [Google Scholar]
  57. Hain, R.; Kähler, C.J.; Tropea, C. Comparison of CCD, CMOS and intensified cameras. Exp. Fluids 2007, 42, 403–411. [Google Scholar] [CrossRef]
  58. Xiong, P. Comparison of CCD and CMOS image sensors. Bandaoti Guangdian/Semicond. Optoelectron. 2004, 25, 1–4. [Google Scholar] [CrossRef]
  59. Website ManualZZ Luminance and Color Measuring Camera LMK 98. Available online: https://manualzz.com/doc/31466295/luminance-and-color-measuring-camera-lmk-98 (accessed on 5 May 2023).
  60. Rusu, A.V.; Galatanu, C.D.; Livint, G.; Lucache, D.D. Measuring average luminance for road lighting from outside the carriageway with imaging sensor. Sustainability 2021, 13, 9029. [Google Scholar] [CrossRef]
  61. Tyukhova, Y.; Waters, C. An assessment of high dynamic range luminance measurements with LED lighting. LEUKOS—J. Illum. Eng. Soc. N. Am. 2014, 10, 87–99. [Google Scholar] [CrossRef]
  62. Zalesinska, M.; Wandachowicz, K. On the quality of street lighting in pedestrian crossings. Energies 2021, 14, 7349. [Google Scholar] [CrossRef]
  63. Czyżewski, D. The Photometric Test Distance in Luminance Measurement of Light-Emitting Diodes in Road Lighting. Energies 2023, 16, 1199. [Google Scholar] [CrossRef]
  64. Beltrán, L.O.; Mogo, B.M. Assessment of luminance distribution using HDR photography. In Proceedings of the Solar World Congress 2005: Bringing Water to the World, Including Proceedings of 34th ASES Annual Conference and Proceedings of 30th National Passive Solar Conference, Orlando, FL, USA, 6–12 August 2005. [Google Scholar]
  65. Hiscocks, P.D. Measuring Luminance with a Digital Camera; Syscomp Electronic Design Limited: Richmond Hill, ON, Canada, 2014. [Google Scholar]
  66. Hoang, N.D.; Cao, X.Q.; Nguyen, H.L. Research and development of a luminance responsivity standard system at the Vietnam Metrology Institute. Vietnam J. Sci. Technol. Eng. 2020, 62, 3–6. [Google Scholar] [CrossRef]
  67. Słomiński, S. Mapowanie Rozkładu Luminacji Źródła Światła w Obliczeniach Fotometrycznych Odbłyśników Zwierciadlanych (eng. Mapping the Luminance Distribution of a Light Source in Photometric Calculations of Specular Reflectors). Doctoral Dissertation, OWPW, Warsaw, Poland, 2010. [Google Scholar]
  68. Żagan, W.; Zalewski, S.; Słomiński, S.; Kubiak, K. Methods for designing and simulating optical systems for luminaires. Bull. Pol. Acad. Sci. Tech. Sci. 2020, 68, 739–750. [Google Scholar] [CrossRef]
  69. Słomiński, S. Luminance mapping to the light source model—Possibilities to use a MML in the lighting technology field. Prz. Elektrotech. 2011, 201, 87. [Google Scholar]
  70. Słomiński, S. Advanced modelling and luminance analysis of LED optical systems. Bull. Pol. Acad. Sci. Tech. Sci. 2019, 67, 1107–1116. [Google Scholar] [CrossRef]
Figure 1. Luminance distribution on the LED surface, (a) from the distance of 180 mm, and (b) from the distance of 818 mm.
Energies 16 04166 g001
Figure 2. The measuring set-up for luminance measurements.
Energies 16 04166 g002
Figure 3. The view of the luminance distribution on the surface with reference luminance for 280 mm measurement distances (LMK 98-3 Color).
Energies 16 04166 g003
Figure 4. The view of the luminance distribution on the surface with reference luminance for different measurement distances (the left picture shows the view of the whole image recorded be a meter and the right picture shows the zoom of the reference luminance).
Energies 16 04166 g004aEnergies 16 04166 g004b
Figure 5. The view of the luminance distribution on the surface with reference luminance for 280 mm measurement distances (LMK Air Mobile).
Energies 16 04166 g005
Figure 6. The view of the luminance distribution on the surface with reference luminance for different measurement distances (the left picture shows the whole image recorded by the Mobile ILMD (for 50 mm focal length), and the right picture shows the zoom of the reference luminance).
Energies 16 04166 g006
Figure 7. The view of the luminance distribution on the surface with reference luminance for different measurement distances (the left picture shows the whole image recorded by the Mobile ILMD (for the focal length of 17 mm), and the right picture shows the zoom of the reference luminance.
Energies 16 04166 g007
Figure 8. The relative average (orange color) and maximum (green color) luminance (related to Lmax for 655 mm) for standard luminance as the function of pixel number (laboratory ILMD).
Energies 16 04166 g008
Figure 9. The relative average (purple color) and maximum (red color) luminance (related to Lmax for 655 mm) for standard luminance as the function of pixel number (laboratory ILMD).
Energies 16 04166 g009
Figure 10. The comparison of the energy intensity of lighting installations in which luminaires were measured from different measuring distances.
Energies 16 04166 g010
Table 1. Technical parameters of the LMK98-3 Color luminance meter and the LMK Mobile Air.
ParameterLMK98-3 ColorLMK Mobile Air
sensorCCD Sony ICX 285 ALCMOS Canon APS-C
resolution
(luminance image resolution)
1380 (H) × 1030 (V)5566 (H) × 3706 (V)
(2748(H) × 1834(V))
pixel ratio6.45 μm × 6.45 μm4.1 μm × 41.1 μm
sensor area8.9 (H) × 6.64 (V) mm 22.5 (H) × 15.0 (V) mm
video signal12 bit digital 14 bit digital
uniformity ∆L in % ∆L ± 2% (f22 ≤ 4%)
Table 2. Measurement accuracy of the meters: the LMK98-3 Color and the LMK Mobile Air.
ParameterLMK98-3 ColorLMK Mobile Air
The measured average luminance of the reference plate [cd/m2]890911.7
The reference luminance [cd/m2]889889
Luminance measurement deviation [%]0.112.54
Table 3. The summary of test results and calculations, the influence of varying the photometric distance on the maximum and average luminance results for the surface with reference luminance. Measurements were made using the LMK 98-3 Color luminance meter.
Photometric Distance
[mm]
Summary of Reference Luminance Research Results (LMK 98-3 Color)Summary of Reference Luminance Calculation Results
Lavr LmaxNumber of Pixels (Px)Lavr(x)/Lavr(655) · 100Lmax(x)/Lmax(655) · 100Px/Px(all pixels) · 100
[cd/m2][cd/m2][-][%][%][%]
655871.1911.4777,00010010054.9
818871.0908.6463,90099.9999.732.8
940870.5906.9334,50099.999.523.6
1354862.7904.6151,10099.2599.010.7
1737860.8901.988,98098.9698.86.3
2401849.3896.645,46097.598.43.2
3778836.9888.217,81096.197.51.3
8049805.2869.8390592.495.40.3
11,465753.9861.3200586.594.50.1
Table 4. The summary of test results and calculations, the influence of varying photometric distance on the maximum and average luminance results for the surface with reference luminance. Measurements were made using the LMK Air Mobile (zoom 50 mm) luminance meter. The last measurement was taken for 17 mm zoom.
Photometric Distance
[mm]
Summary of Reference Luminance Research Results (LMK Air Mobile)
for the Focal Length of 50 mm
Summary of Reference Luminance Calculation Results
Lavr LmaxNumber of pixels (Px)Lavr(x)/Lavr(180) · 100Lmax(x)/Lmax(180) · 100Px/Px(all pixels) · 100
[cd/m2][cd/m2][-][%][%][%]
280911.7956.32,635,000100.0100.051.1
500906.6951.5724,70099.499.514.0
700881.6921.2314,30096.796.36.09
1000868.1918.1155,20095.296.03.01
2000846.9915.334,82092.995.70.67
4000824.8910.3926190.595.20.18
6000776.4910.9437385.295.30.08
8000695.6909.6270176.395.10.05
8000 (zoom 17 mm)644.9906.940170.794.80.008
Table 5. Measurement accuracy of the average luminance of the meters: the Laboratory ILMD and the Air Mobile ILMD.
Measurement
Accuracy
Recommended Minimum Number of Pixels to Ensure the Specified Accuracy of Average Luminance Measurement Lavr [-]
Laboratory ILMD
Measured High-Luminance LED
Laboratory ILMD
Measured Standard
Luminance
Air Mobile ILMD
Measured Standard
Luminance
99 [%]20,000140,000660,000
95 [%]500014,000144,000
90 [%]300032008900
Table 6. Measurement accuracy of the maximum luminance of the meters: the Laboratory ILMD and the Air Mobile ILMD.
Measurement
Accuracy
Recommended Minimum Number of Pixels to Ensure the Specified Accuracy of Maximum Luminance Measurement Lmax [-]
Laboratory ILMD
Measured High-Luminance LED
Laboratory ILMD
Measured Standard
Luminance
Air Mobile ILMD
Measured Standard
Luminance
99 [%]50,00098,00091,000
95 [%]20,00031001800
90 [%]2000for 2000
accuracy 94.5%
400
Table 7. Basic lighting requirements for the analyzed reception desk [18].
Required ParameterRequired Value
Average maintained illuminance (Ēm)min. 300 [lx]
Illuminance uniformity (Uo)min. 0.6 [-]
Colour rendering index (Ra)min. 80 [-]
CIE Unified Glare Rating limit value (RUGL)max. 22 [-]
Table 8. Technical data of the used luminaire.
Technical ParameterLuminaire
Luminaire photometric intensity curves (LPIC)Energies 16 04166 i001
Light source typePL-C/2P
Number of source1
Luminaire luminous flux900 [lm]
Luminaire power17.3 [W]
CCT4000 [K]
Ra80 [-]
Table 9. The analysis of the effect of the luminaire photometric distance on lighting installation design results.
Luminaire Photometric DistanceNumber of Luminaires
(Distribution)
Calculation ResultsĒm/Uo/Ra/RUGLPower InstalledPower Density per 100 lxAnnual Energy ConsumptionLENI
[mm][-][lx/-/-/-][W][W/m2/100 lx][kWh][kWh/m2]
280 mm (reference)28 (7 × 4)304/0.72/80/22484.49.96920.3657.52
1000 mm30 (6 × 5)302/0.72/80/21519.010.73986.1061.63
4000 mm 32 (8 × 4)315/0.72/80/21553.610.981051.8465.74
8000 mm36 (6 × 6)300/0.71/80/21622.812.971183.3273.96
8000 mm (zoom 17 mm)40 (8 × 5)309/0.71/80/21692.014.001314.8082.18
Disclaimer/Publisher’s Note: The statements, opinions and data contained in all publications are solely those of the individual author(s) and contributor(s) and not of MDPI and/or the editor(s). MDPI and/or the editor(s) disclaim responsibility for any injury to people or property resulting from any ideas, methods, instructions or products referred to in the content.

