Article

Numerical Simulation of the Proppant Settlement in SC-CO2 Sand-Carrying Fluid in Fracturing Fractures

1
State Key Laboratory of Coal Resources and Safe Mining, China University of Mining and Technology, Xuzhou 221116, China
2
School of Mining, China University of Mining and Technology, Xuzhou 221116, China
*
Author to whom correspondence should be addressed.
Energies 2023, 16(1), 11; https://doi.org/10.3390/en16010011
Submission received: 16 November 2022 / Revised: 15 December 2022 / Accepted: 19 December 2022 / Published: 20 December 2022

Abstract

:
Supercritical CO2 fracturing has unique advantages for improving unconventional reservoir recovery. Supercritical CO2 can penetrate deep into the reservoir and increase reservoir reform volume, and it is less damaging to reservoir and easy to flow back. However, when the supercritical CO2 flows as the sand-carrying fluid in the fracture, the settlement of the proppant is still worth studying. Based on the study of supercritical CO2 density and viscosity properties, assuming that the reservoir has been pressed out of the vertical crack by injecting prepad fluid, the proppant characteristics in sand-carrying fluid under different conditions were studied by numerical simulation. After the analysis, the proppant accumulation and backflow will occur at the end of the crack. Large sand diameters, high fluid flow rates, high sand concentrations, high reservoir temperatures, and low reservoir pressures can help to shorten deposition time, and the small particle size, high fluid flow rate, low sand concentration, low reservoir temperature, and high reservoir pressure can help increase the uniformity of sand deposition. Shortening the sand deposition time can help to complete the fracturing efficiently, and increasing the deposition uniformity can improve the fracture conductivity. This article has studied the proppant settling and crack formation characteristics. It is hoped that this study can provide theoretical support for field fracturing and provide theoretical assistance to relevant researchers.

1. Introduction

Unconventional resources are an important area for oil and gas exploration and development in the future, and there are many methods for reservoir modification and stimulation at present [1]. CO2 fracturing is one of the core technologies for oil-gas industrial development [2,3]. Since the 1980s, North America has used the fracturing fluid system based on liquid CO2 for reservoir reconstruction. In 1981, hydrated ethanol/CO2 emulsions were successfully used for fracturing in the Western Canadian Sedimentary Basin (WCSB), and these fracturing fluids had completed more than 3000 fracturing operations in the WCSB area by 2008 [4]. In 1993, the United States implemented a CO2 sand fracturing operation in the Big Sandy field for the first time; since then, carbon dioxide fracturing technology has gradually developed. CO2 fracturing has unique advantages over other fracturing methods [5,6]. Experimental and site construction show that after CO2 fracturing, the yield is five times higher than that of nitrogen foam fracturing [7,8].
When temperature and pressure conditions reach the critical point of carbon dioxide, that is, the temperature is higher than 31.06 °C and the pressure is higher than 7.38 MPa, the interface between gas and liquid carbon dioxide disappears completely and finally becomes a compressible high-density fluid, i.e., supercritical carbon dioxide [9,10,11]. Supercritical CO2 fracturing employs non-aqueous media (CO2, chemical reagents, etc.) as fracturing fluids to fracture unconventional reservoirs. In theory, supercritical CO2 fracturing can produce more microcracks without causing clay expansion and reduce the negative impact on the reservoir. At the same time, it can use unconventional reservoirs to store a large amount of CO2 gas to achieve greenhouse gas emission reduction [12,13].
At present, domestic and foreign researchers have conducted a large number of SC-CO2 applications in oil and natural gas development. Studies have shown that the proppant suspension and sedimentation in fracturing fluid are crucial to fracture morphology and conductivity capability. At present, the numerical models describing proppant transport laws can be divided into two categories: continuum theory model and sedimentation theory model. The continuum theory model treats the fracturing fluid and proppant particles as a continuous medium to describe the fracturing fluid flow and proppant transport process. Based on the continuum theory, Wasp and Aude (1970) used Froude number correlations to calculate the deposition rate of particles in the mixed phase and compared the solid suspension state under different transport conditions [14]. Wasp and Aude pointed out that the inhomogeneity degree which can be tolerated in pipelines is dependent on the specific application; Clifton and Wang (1988) obtained proppant transport equations by establishing proppant motion equations and fracturing fluid motion equations [15]. Based on the slurry transport and settling experiments, Barree and Conway (1994) obtained a new slurry transport model and applied it to 3D fracture simulation [16]. Studies have shown that the model has good accuracy in simulating the proppant slurry delivery process. Sharma and Gadde (2005) presented a model of the proppant particle velocity in the channel flow, indicating that the proppant has a retarding or accelerating effect relative to the fluid depending on the ratio of the proppant size to the crack width [17]. Wood and Wheeler et al. (2007) defined a Slurry Properties Index for a given proppant condition and fluid composition [18]. Based on this index, the minimum horizontal flow rate required for solid-phase suspension is deduced to guide the fracturing design.
However, for low-viscosity fracturing fluids, the sedimentation theory model is a better choice. Proppants tend to settle in a low-viscosity fluid to form a packed bed. Based on sedimentation theory, Clark and Quadir (1981) pointed out that the sedimentation rate of particles in fracturing fluid is the main factor that determines the proppant distribution in hydraulic fractures and predicts the terminal settling velocities of proppants under different fracturing conditions [19]. Patankar et al. (2002) studied the influence of the lifting force acting on the particle deposition through two-dimensional numerical simulations and laboratory experiments and played a catalytic role in the study of proppant settlement [20]. Gadde et al. (2004) proposed a new model for proppant transport and settlement in hydraulic cracks and studied the influence of different factors on proppant settling velocity [21]. At the same time, the new proppant settlement model was incorporated into the three-dimensional hydraulic fracture simulator (UTFRAC-3D) [22,23]. The above studies provide a good basis for revealing the motion of proppant in fracturing fluids.
In the field of fluid mechanics, the coupled computational fluid dynamics-discrete element method (CFD-DEM) is gradually becoming widely used [24,25,26]. CFD represents computational fluid dynamics, and DEM represents the discrete element method [27,28]. The fluid and solid are coupled through the exchange of momentum and energy. Because DEM reveals the essence of particle motion, the coupled CFD-DEM has been widely used in many applications related to fluid–particle interaction [29,30]. Considering the typical heat transfer between particles and between fluids and particles, Zhang and Tahmasebi (2019, 2018) established a coupling multiphysical and micromechanical model based on DEM [24,25]. A series of studies have been performed on fluid flow and particle movement in porous media. The CFD-DEM method is evidently very suitable for simulating the flow characteristics of liquid and solid mixtures at the microscale and other flow conditions. The above research provides theoretical support for the development of this study.
In the actual hydraulic fracturing process, because the fracturing conditions can reach the CO2 critical point, the CO2 fracturing fluid will flow in a supercritical state in the fracture. The physical parameters of the fracturing fluid will also change significantly with temperature and pressure conditions. In this study, in order to describe the characteristics of proppant suspension and settling in SC-CO2 fracturing fluid, firstly the changes in density and viscosity of supercritical carbon dioxide under different temperature and pressure conditions were analyzed. Secondly, ICEM CFD and FLUENT software were used to simulate the proppant settlement under different fracturing conditions. In the current research, the application of ICEM CFD and FLUENT software mainly focuses on the flow of liquid or the mixed fluid of liquid and solid and on the flow in the pipeline or microporosity [31,32,33,34]. However, there is no research on the sedimentation of mixed fluid in underground high-temperature and high-pressure fractures. Therefore, this study is the first to obtain the settling characteristics of proppant in supercritical CO2 in reservoir fractures.

2. The Change Characteristics of SC-CO2 Density and Viscosity

For carrying proppants, the density and viscosity of the fracturing fluid are important factors that affect the ability of proppant to suspend and settle. The density and viscosity of supercritical CO2 are greatly affected by pressure and temperature, and the flow of CO2 fracturing fluid in the reservoir can easily reach the critical condition. Therefore, here we analyze the effect of temperature and pressure on the density and viscosity of CO2 fracturing fluids.

2.1. SC-CO2 Density Variation

There is a connection between the density, pressure, volume, and amount of gas. For actual gas, there is an interaction force between gas molecules, and the volume of actual gas molecules cannot be ignored, which is quite different from the ideal gas state equation. Table 1 shows the statistics of current actual gas state equations.
As can be seen from Table 1, researchers have proposed a large number of actual gas state equations such as RK, SRK, PR, and PT equations, etc., but different equations have certain limitations [35,36] and only have better performance under certain temperature and pressure conditions. In contrast, the Span & Wagner equation of state used experimental data to fit the actual gas state equation in the form of Helmholtz free energy [37], which has high accuracy and a wide range of uses overall. This model calculates temperatures up to 1100 K (827 °C) and pressures up to 800 MPa (8000 bar) and can be used to calculate the state parameters near the CO2 critical point. Meanwhile, in order to simplify the calculation, the empirical formula proposed by Ouyang (2011) [38] was used.
The CO2 density expression is
ρ C O 2 = A 0 + A 1 P + A 2 P 2 + A 3 P 3 + A 4 P 4
where ρ C O 2 denotes CO2 density, kg/m3; P denotes the pressure, 0.0069 MPa; and A 0 ~ A 4 denotes correlation coefficients, which can be obtained by
A i = b i 0 + b i 1 T + b i 2 T 2 + b i 3 T 3 + b i 4 T 4 i = 0 , 1 , 2 , 3 , 4
where b i 0 ~ b i 4 denotes correlation coefficients, which are given in Table A1 and Table A2 (Appendix A), and T denotes the temperature, °C.
Figure 1 shows the influence of temperature and pressure on CO2 density.
As shown in Figure 1, the density of SC-CO2 is between that of gaseous CO2 and liquid CO2. At a certain temperature, SC-CO2 viscosity increases with increasing pressure, and the increase in density is more pronounced at relatively low temperatures (40~60 °C), while density changes gently under high pressure (above 15 MPa). When the pressure is certain, the density of SC-CO2 is reduced by the increase in temperature and decreases rapidly under low pressure (Around 10 MPa). The greater the density of the sand-carrying fluid, the more favorable the suspension of the proppant. Therefore, in terms of SC-CO2 density, the sand-carrying fluid has a higher ability to carry proppant under conditions of about 40 °C and high pressure.

2.2. SC-CO2 Viscosity Variation

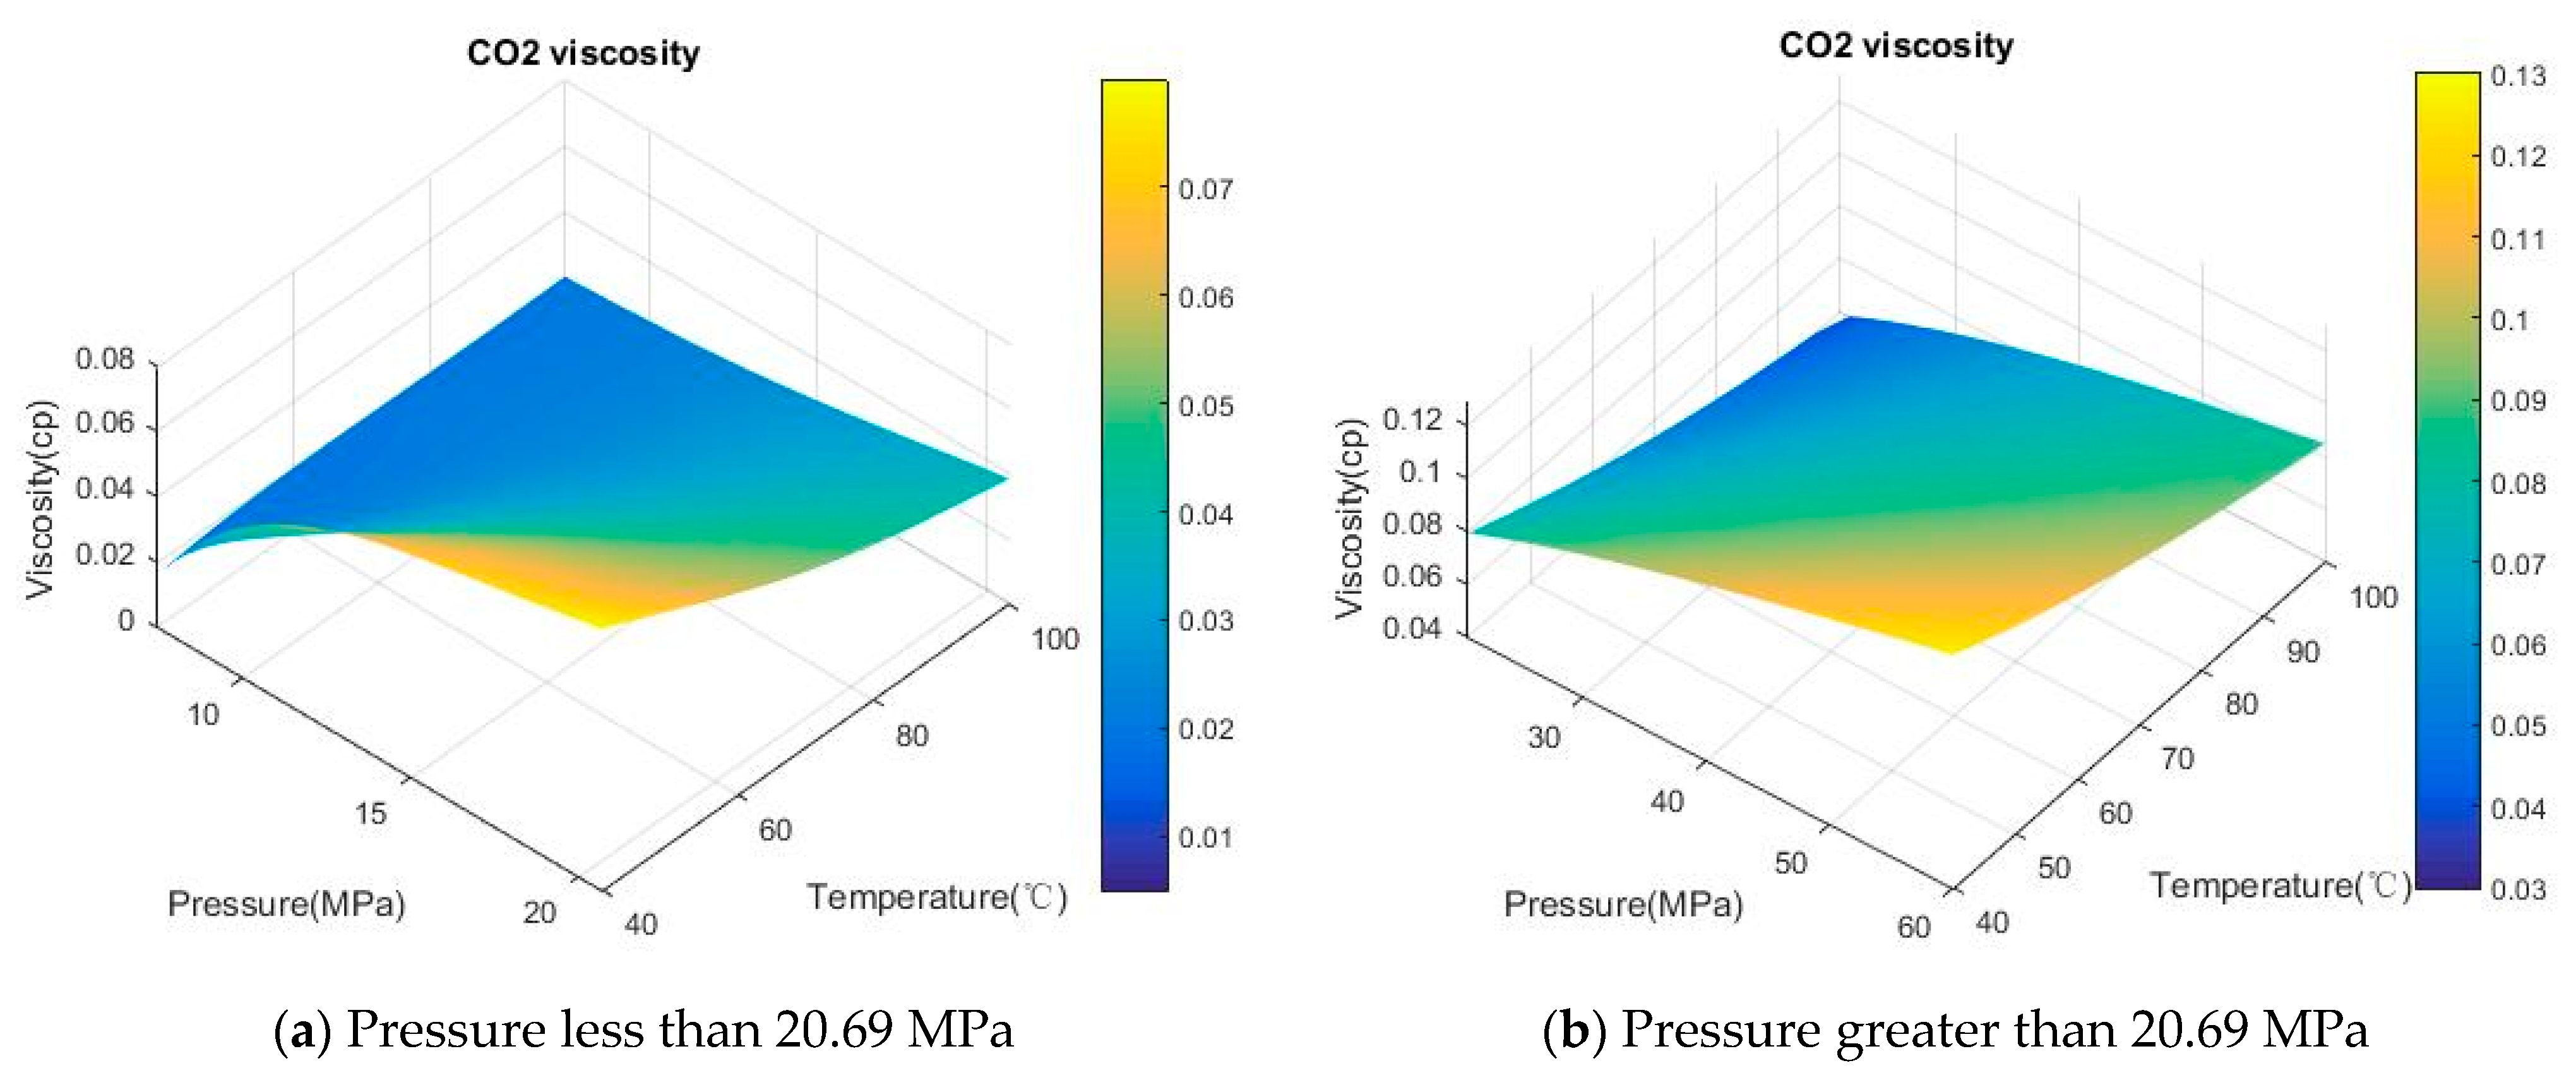
In 1990, Vesovic et al. obtained a formula for calculating CO2 viscosity by analyzing and summarizing a large amount of experimental data [39]. According to the experimental data supplemented in the later period, in 1998 Fenghour revised the fitting formula of the residual viscosity in Vesovic’s model, taking into account the effects of temperature and density on the residual viscosity, and improved the model accuracy. As shown in Figure 2, the variation of the viscosity of CO2 was obtained using the viscosity model proposed by Fenghour (1998) [40].
The fluid viscosity is formed by the internal friction generated by the relative motion between different molecules. According to the mechanism of viscosity, the viscosity can represent the sum of zero-density viscosity, residual viscosity, and singular viscosity [41,42]. Among them, the ratio of singular viscosity to total viscosity is relatively low, generally less than 0.01. The viscosity calculation formula can be expressed as
η ( T , ρ C O 2 ) = η 0 + Δ η ( T , ρ C O 2 ) + Δ η c ( T , ρ C O 2 )
where η denotes total fluid viscosity, Pa·s; η 0 denotes zero-density viscosity, Pa·s; Δ η denotes residual viscosity, Pa·s; and Δ η c denotes singular viscosity, Pa·s.
Among them, the zero-density viscosity calculation can be expressed as
η 0 ( T ) = 1.00697 ( T + 273.15 ) 0.5 G η ( T )
where η 0 ( T ) denotes the zero-density viscosity, μPa·s, and G η ( T ) denotes the reduced effective cross-section, which can be represented by the empirical equation
ln G η ( T ) = i = 0 4 ( a i ln ( T + 273.15 ) ) i
( T + 273.15 ) = k ( T + 273.15 ) / ε , ε / k = 251.196 K
where T denotes the reduced temperature, °C; ε / k denotes the energy scaling parameter, K; and a 0 a 4 denote empirical coefficients, which are listed in Table A3 (Appendix B).
The formula for calculating the residual viscosity is
η ( ρ C O 2 , T ) = d 11 ρ C O 2 + d 21 ρ C O 2 2 + d 64 ρ C O 2 6 ( T + 273.15 ) 3 + d 81 ρ C O 2 8 + d 82 ρ C O 2 8 ( T + 273.15 )
where d 11 , d 21 , d 64 , d 81 , d 82 denote empirical coefficients, which are listed in Table A3 (Appendix B).
From Figure 2, the viscosity of SC-CO2 is about 0.02~0.12 cp. Under certain temperature conditions, the SC-CO2 viscosity increases with increasing pressure and increases faster at 40~60 °C. Meanwhile, under certain pressure conditions, the viscosity of SC-CO2 decreases with increasing temperature and decreases rapidly at 10~15 MPa. The higher the viscosity of the sand-carrying fluid, the less likely the proppant is to settle and the more beneficial it is to proppant suspension and migration. At conditions of similar density, high pressure, and 40 °C, the proppant is better carried by the sand-carrying liquid.

3. Numerical Simulation of Proppant Settlement

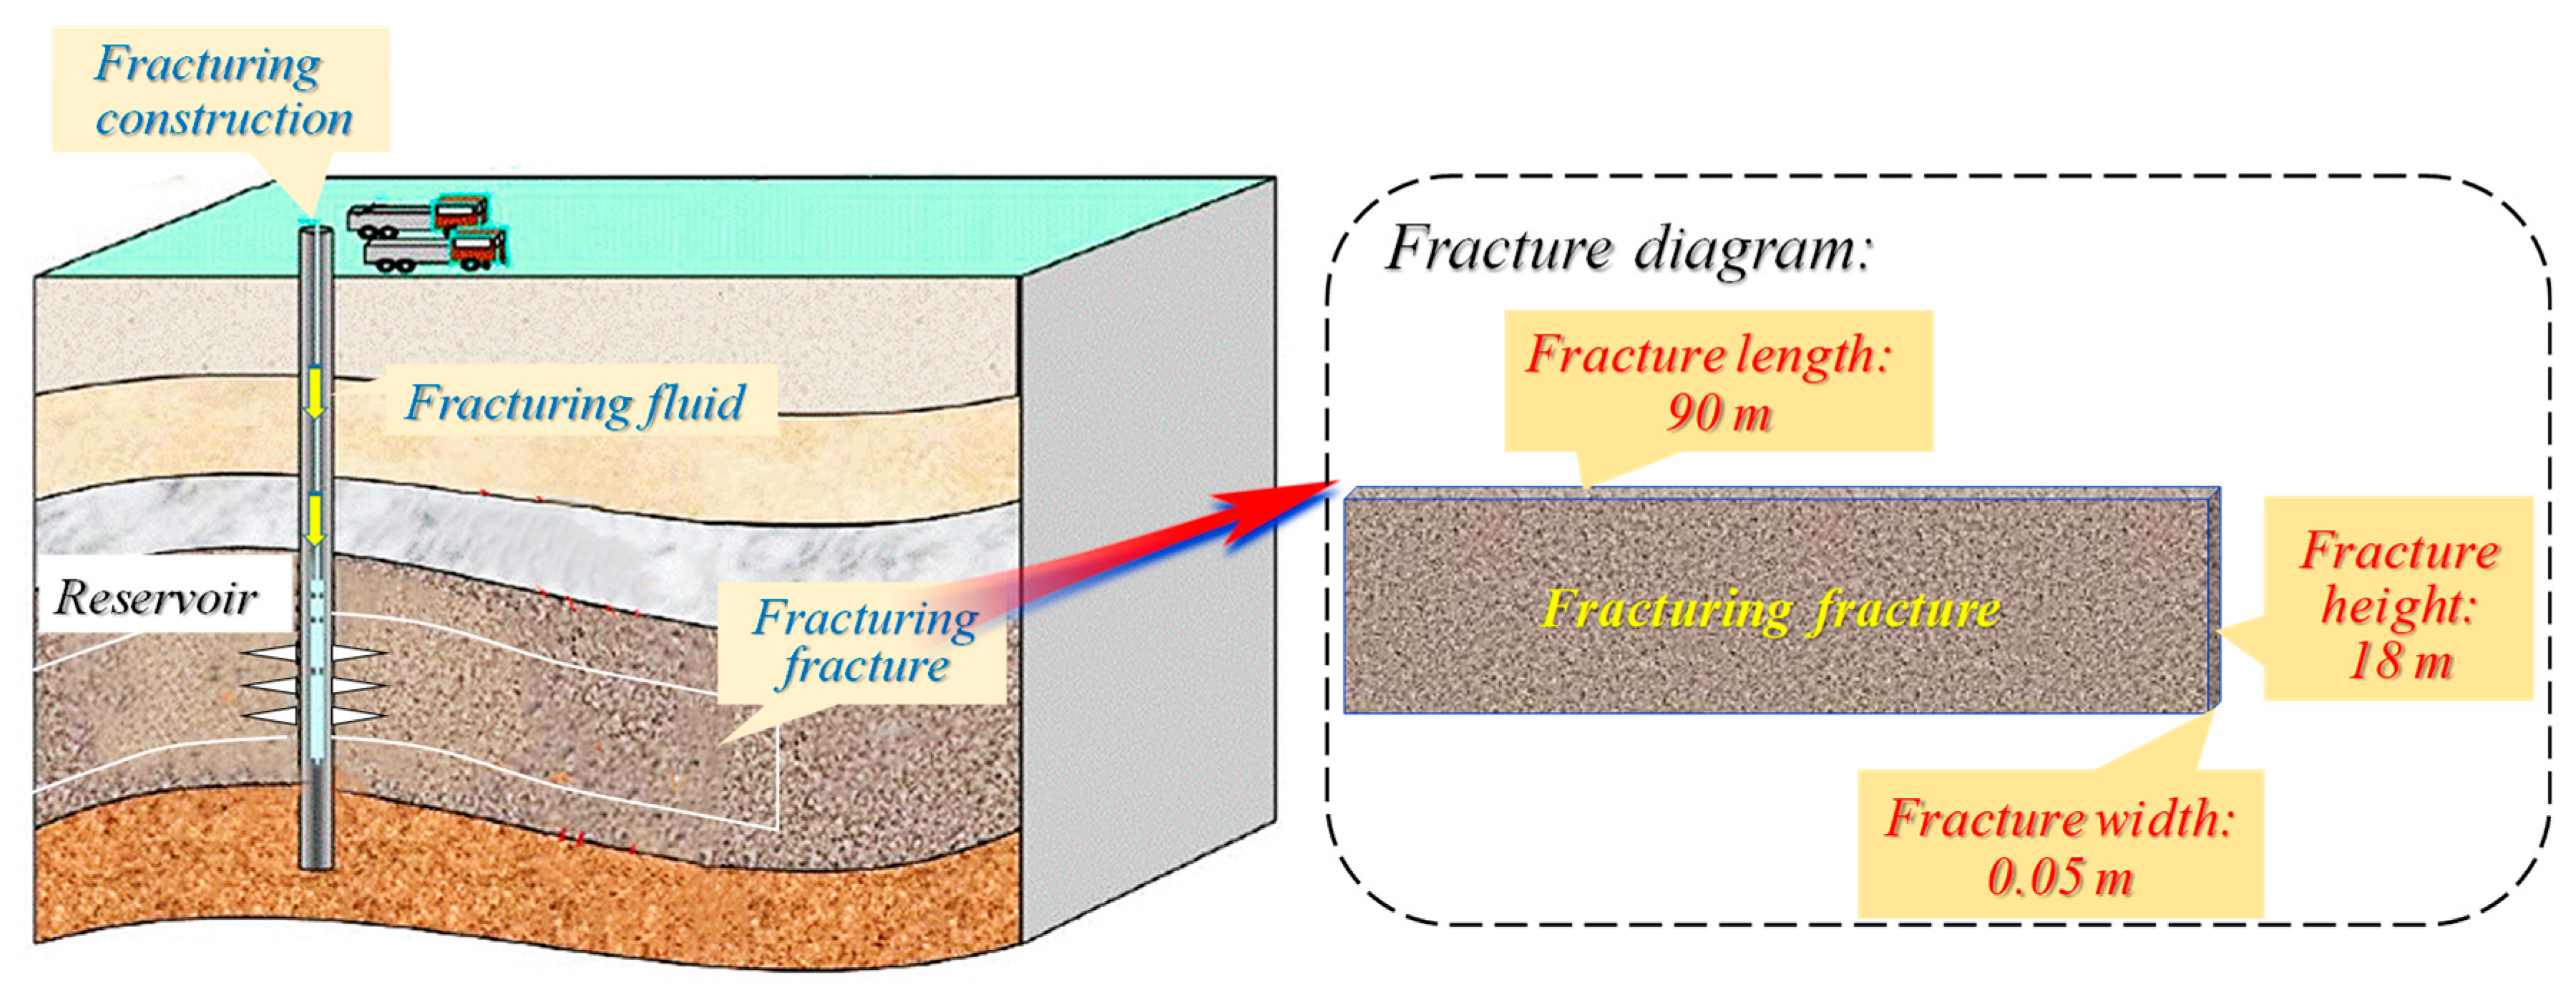
In this study, a shale gas well in China’s Sichuan Basin is analyzed as a case. The fracturing construction and fracture diagrams are shown in Figure 3. The characteristics of the shale gas reservoir are shown in Table 2.
First, the ICEM CFD is used to establish a long and narrow fracture model (90 m-long, 18 m-high, and 5 cm-wide rectangular rectangles), with one end as the fluid inlet and one end as the closed boundary. The supercritical CO2 sand-carrying liquid entered from the left side at a certain flow velocity (speed inlet boundary), and other boundaries were closed boundaries. When the sand-carrying liquid volume filled the entire crack, the fluid stopped entering ().
Then, the fluid parameters were set, including the selection of sand-carrying fluid (supercritical CO2) and proppant (Ceramsites), as well as the particle size, density, and sand ratio. The parameters involved include sand diameter: 0.6 mm; sand concentration: 0.4; sand density: 2650 kg/m3.
Then, the fluid flow conditions were set, including temperature, pressure, and flow rate. The flow conditions were temperature: 60 °C; pressure: 30 MPa; sand-carrying fluid inlet flow rate: 1 m/s.
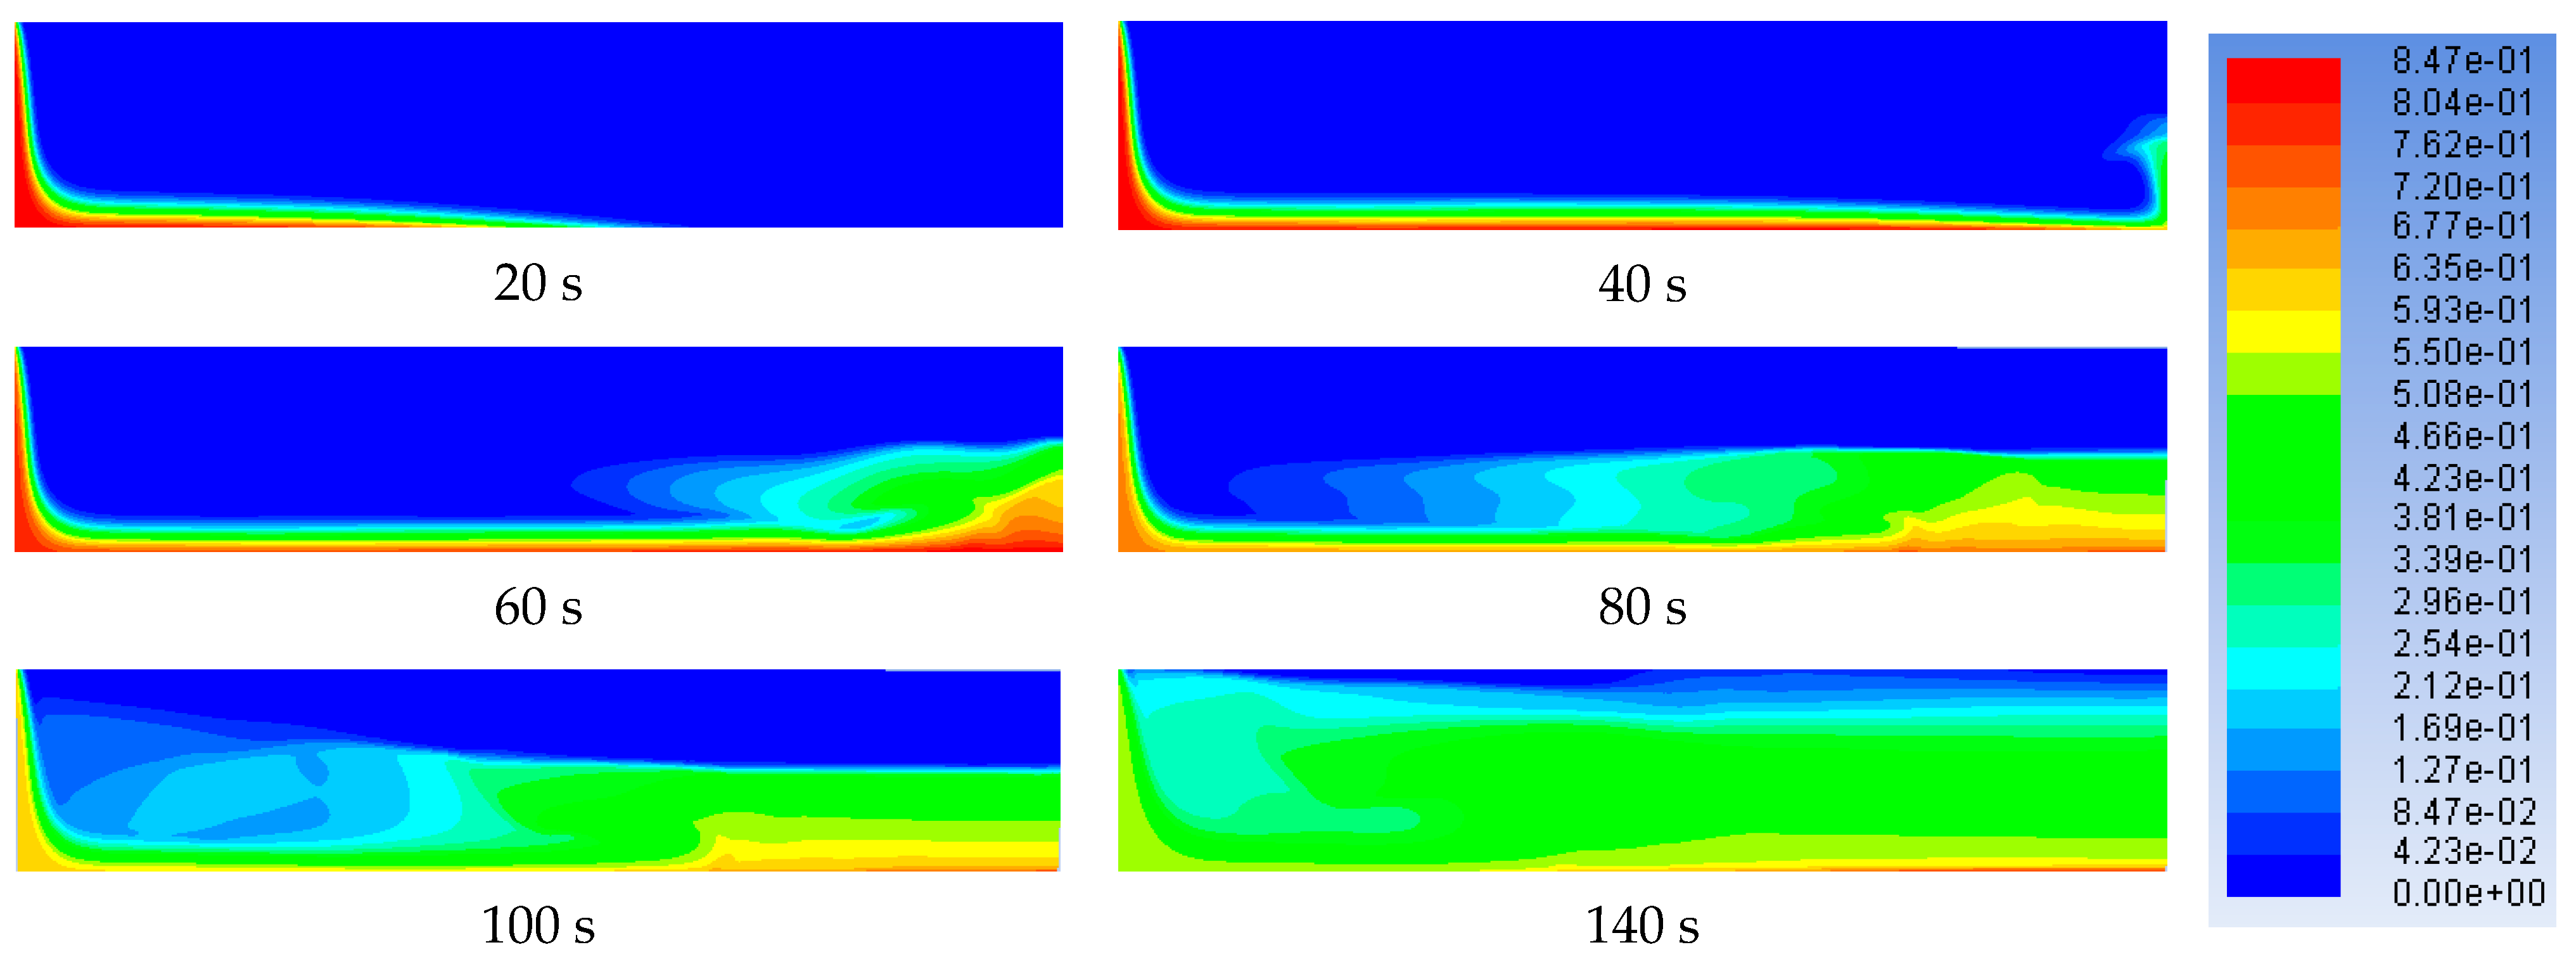
Finally, under the above conditions, the settlement characteristics of proppant at the characteristic time points of the flow process (such as 20 s, 40 s, 60 s, 80 s, 100 s, 140 s) after supercritical CO2 flows into the fracture were simulated.
The key parameters involved in the model establishment process are shown in Table 2.
Figure 4 shows the sand concentration distribution cloud map at different times (20 s; 40 s; 60 s; 80 s; 100 s; 140 s). The flow conditions were temperature: 60 °C; pressure: 30 MPa; sand diameter: 0.6 mm; sand-carrying fluid inlet flow rate: 1 m/s; sand concentration: 0.4; sand density: 2650 kg/m3.
At a temperature of 60 °C and a pressure of 30 MPa, the supercritical CO2 has a density of 829.78 kg/m3 and a viscosity of 0.0768 mPa·s. As can be seen from Figure 4, when supercritical CO2 carries sand into the fracture, the liquid phase and sand will fall under the action of gravity while flowing horizontally. While falling, it produces a forward velocity that accelerates the sand flow. When the gravel reaches the top of the fracture, it will also return due to impact on the wall and show stacking and reflux phenomena at the end of crack. Due to the large differences in liquid- and solid-phase densities and small CO2 viscosities, sedimentation will continue to occur during the sand flow. After a period of time, when the fluid no longer enters the fracture, it tends to be stable.

3.1. Solid Particle Diameter

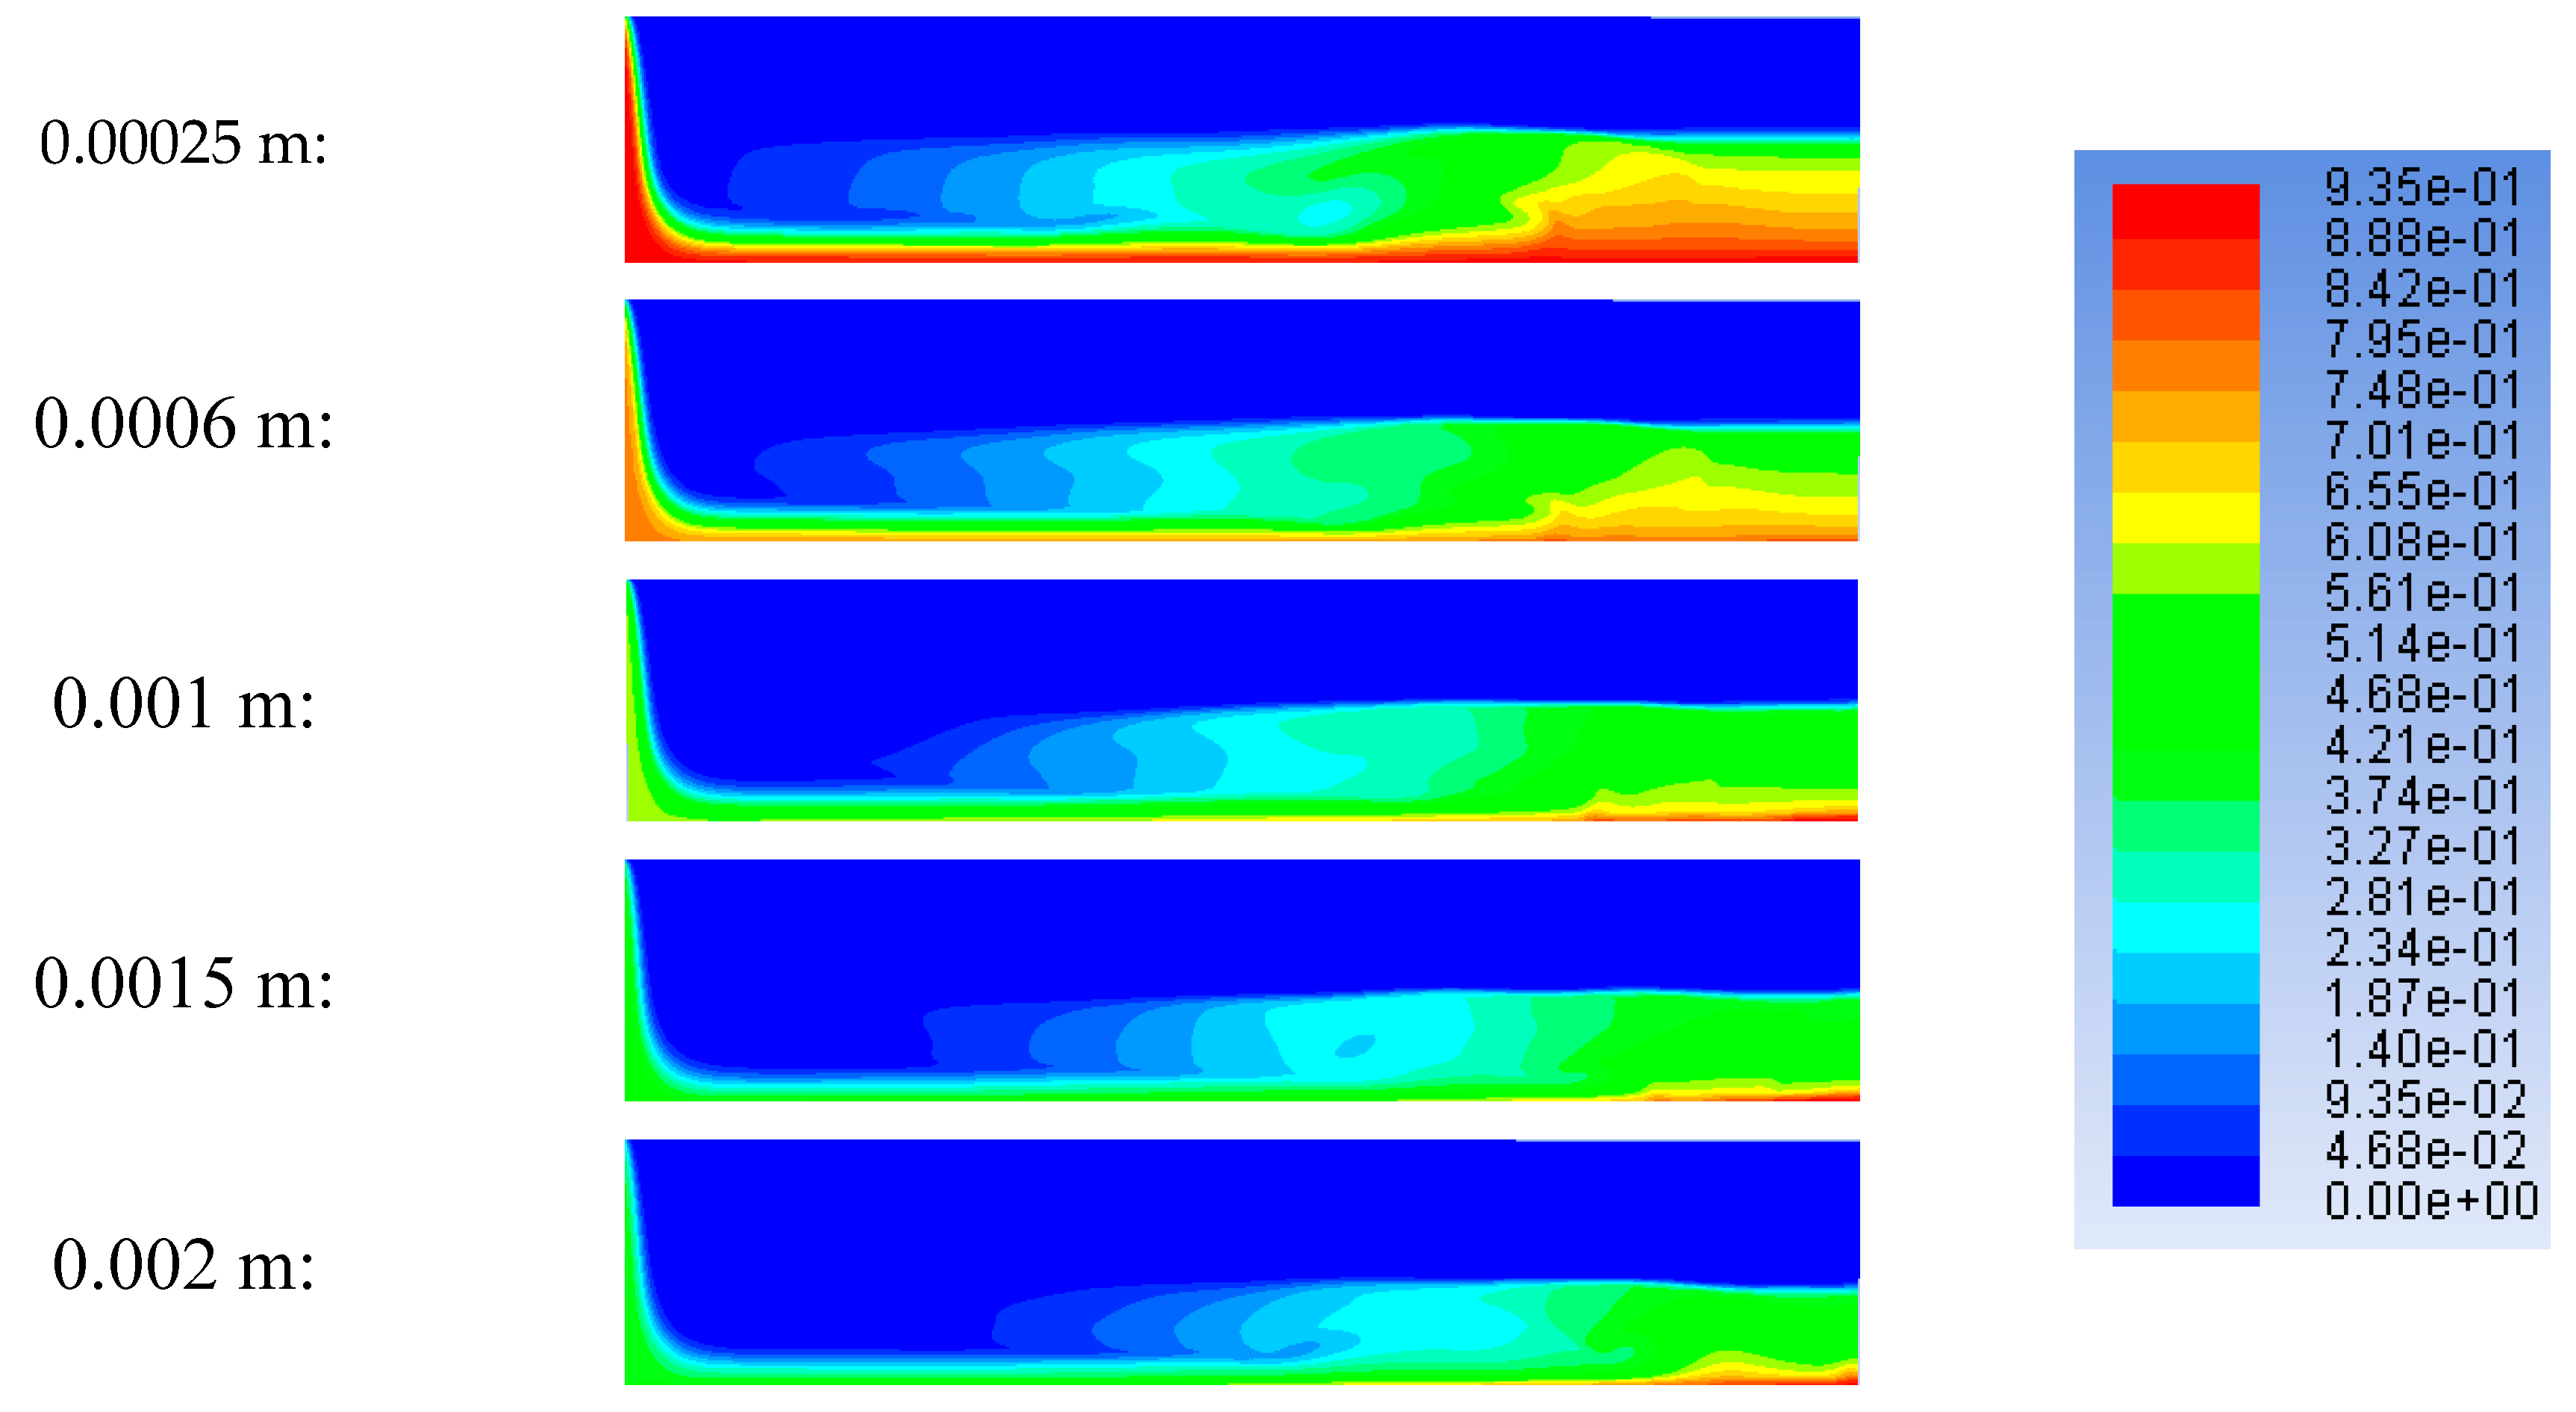
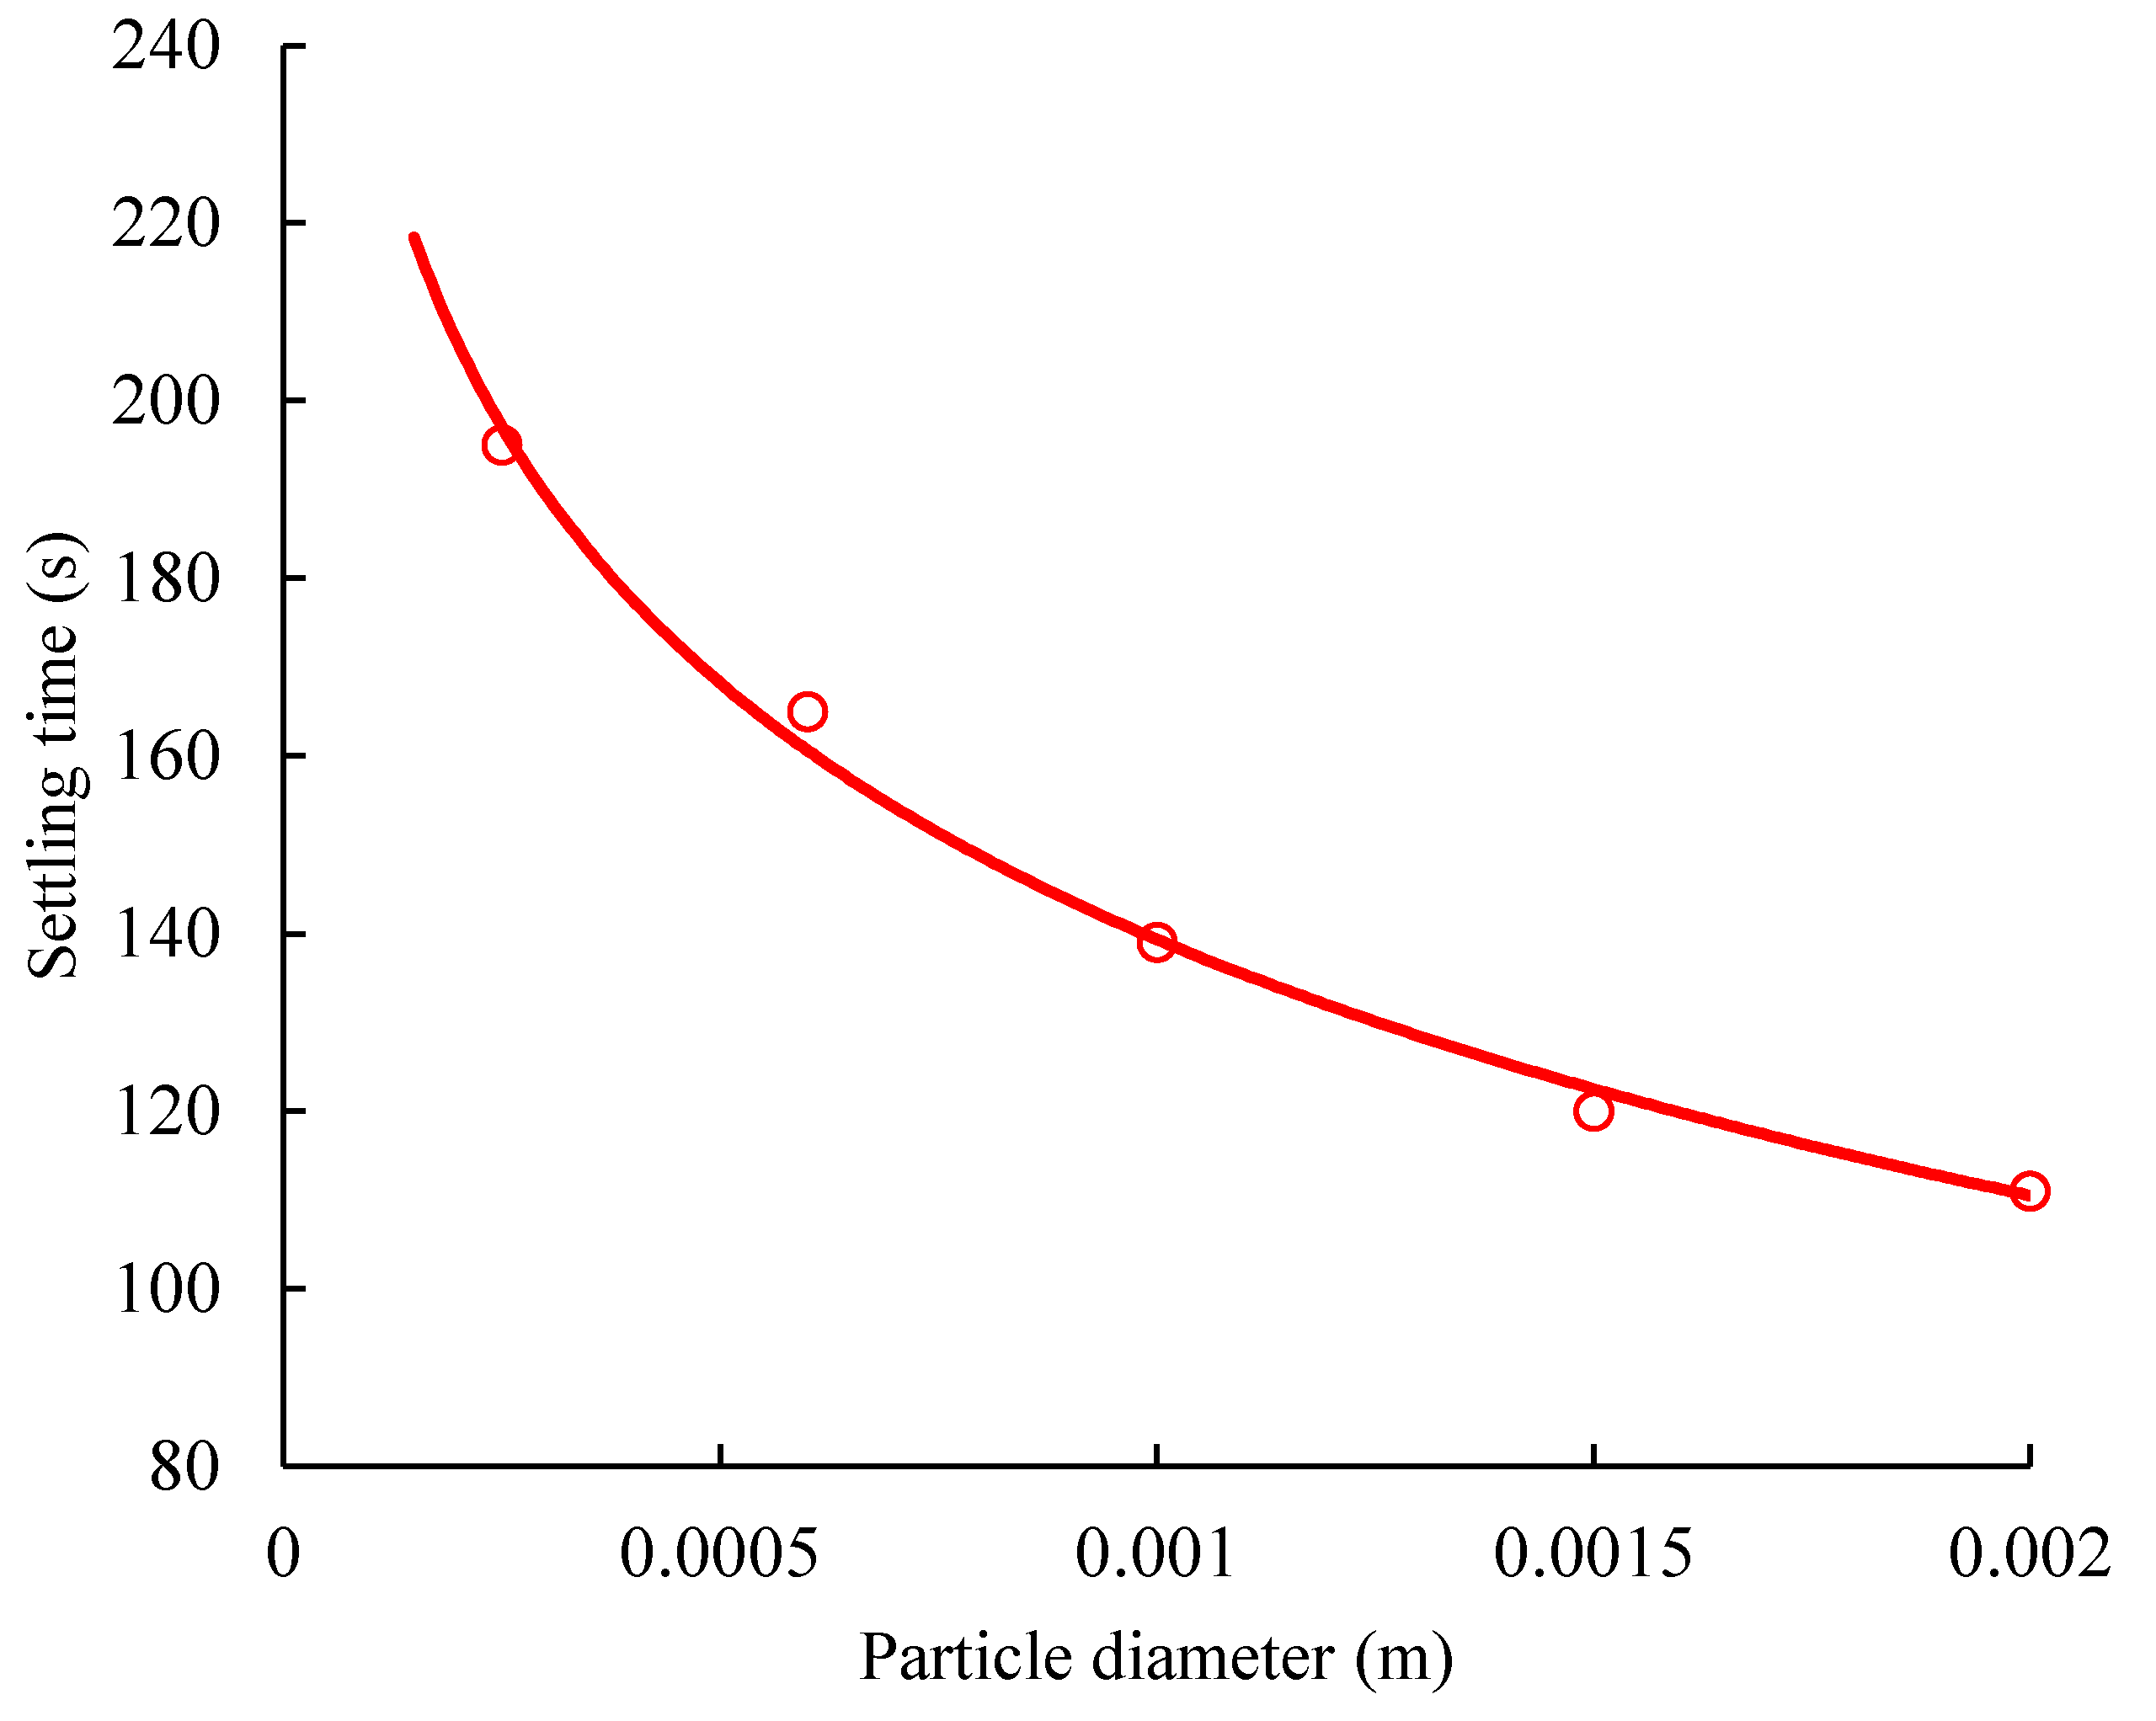
In order to study the sedimentation characteristics of solid particles with different sizes in the sand-carrying liquid, we set five different particle sizes: 0.00025 m; 0.0006 m; 0.001 m; 0.0015 m; and 0.002 m. The flow conditions were temperature: 60 °C; pressure: 30 MPa; inlet flow rate of sand-carrying fluid: 1 m/s; sand concentration: 0.4; sand density: 2650 kg/m3. The distribution of sand sedimentation after 80 min of flowing in the five cases is as follows.
From Figure 5 and Figure 6, it can be seen that the smaller the particle size, the faster the particles flow with the liquid phase, and the particles will quickly reach the end of the fracture and flow back. The smaller the particle size, the longer the particles are suspended in the liquid phase and the less likely sedimentation is to occur. On the contrary, the sand particles with a larger particle size finally reach a shorter deposition stability time. However, the sand distribution in the cracks will be more uniform when the sand diameter is small.

3.2. Fluid Velocity

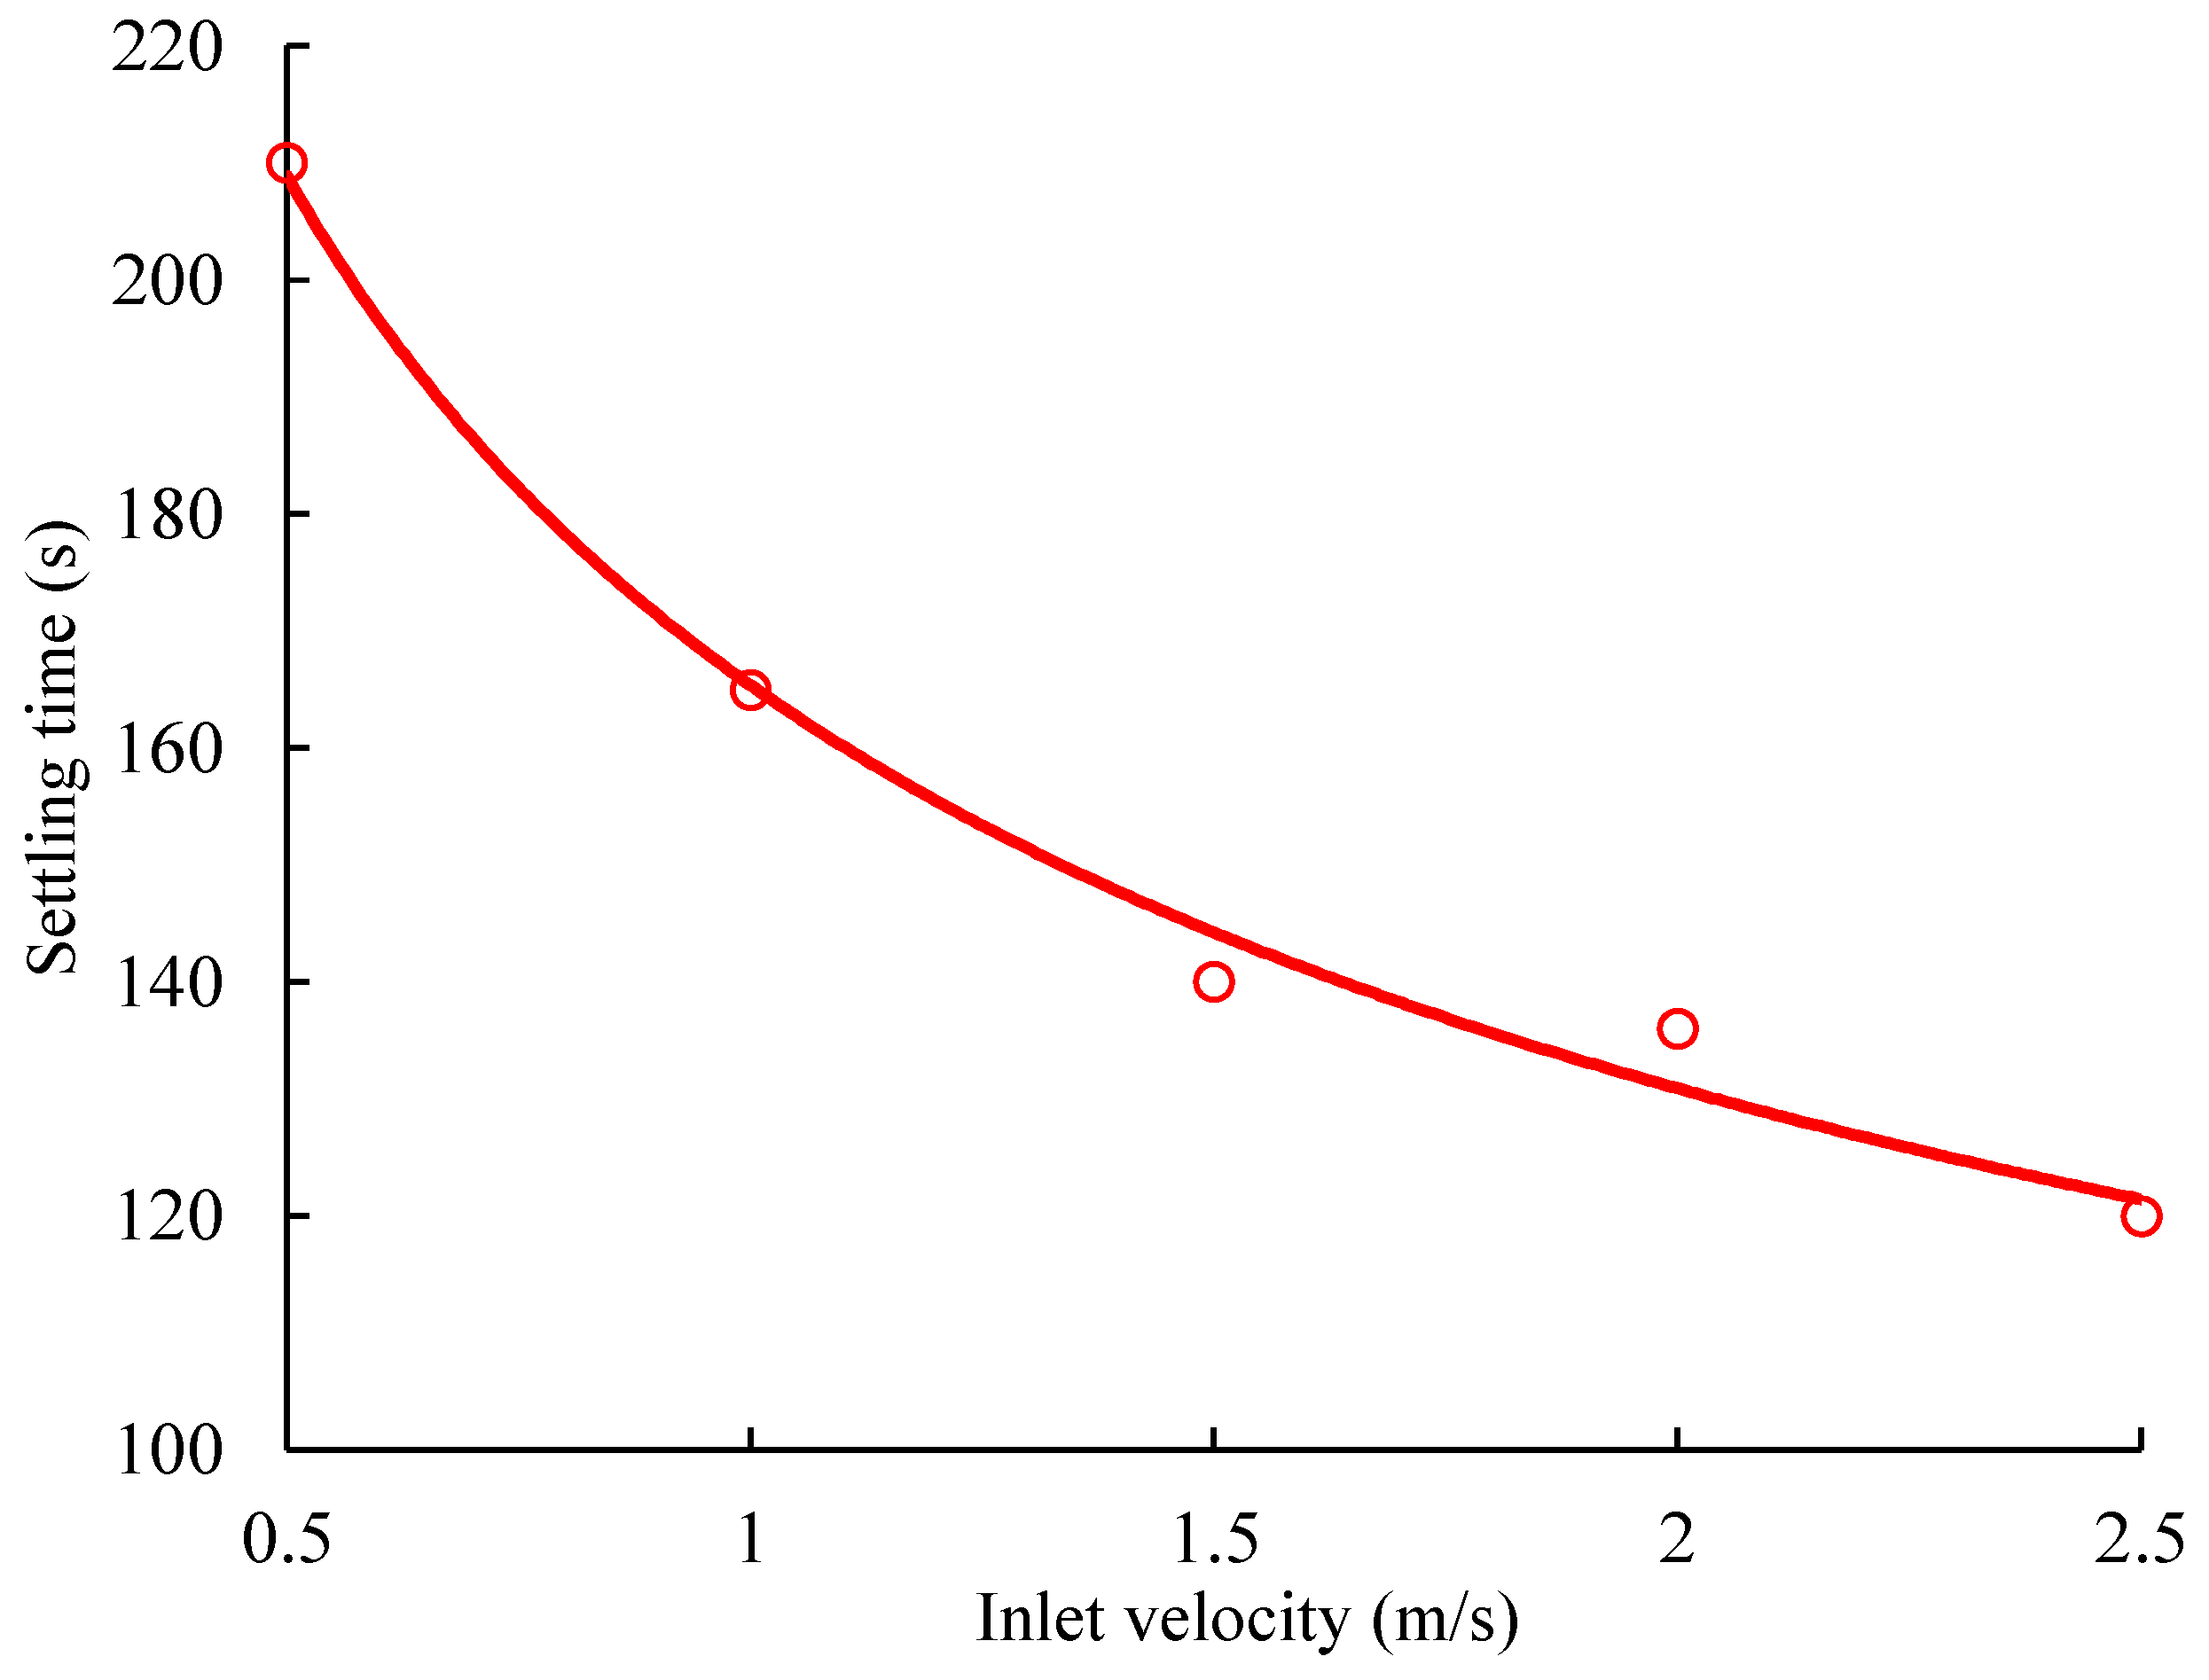
In order to study the sedimentation characteristics of solid particles under different sand-carrying and solid-phase particle flow speeds, we set five different inlet velocity sizes: 0.5 m/s; 1 m/s; 1.5 m/s; 2 m/s; and 2.5 m. The flow conditions were temperature: 60 °C; pressure: 30 MPa; solid particle diameter: 0.0006 m; sand concentration: 0.4; sand density: 2650 kg/m3. The sand distribution after 80 min in the five cases is as follows.
It can be seen from Figure 7 and Figure 8 that the fluid velocity has a significant effect on the sedimentation characteristics of solid particles. When the flow rate is low, the flow of sand-carrying fluid and sand is relatively stable, and sand is more prone to sedimentation. A lot of gravel does not reach the end of the crack and is deposited at the bottom. At high flow rates, most of the sand will be deposited by hitting the trailing edge of the fracture, and eventually the sand will be more evenly distributed. As can be seen from Figure 8, it takes a long time for the sand deposition to stabilize at a low flow rate, and the deposition stability time at a high flow rate significantly decreases. Due to the increased turbulence of the fluid at high flow rates, the settling time becomes gentle at 1.25 m/s~2.25 m/s.

3.3. Sand Concentration

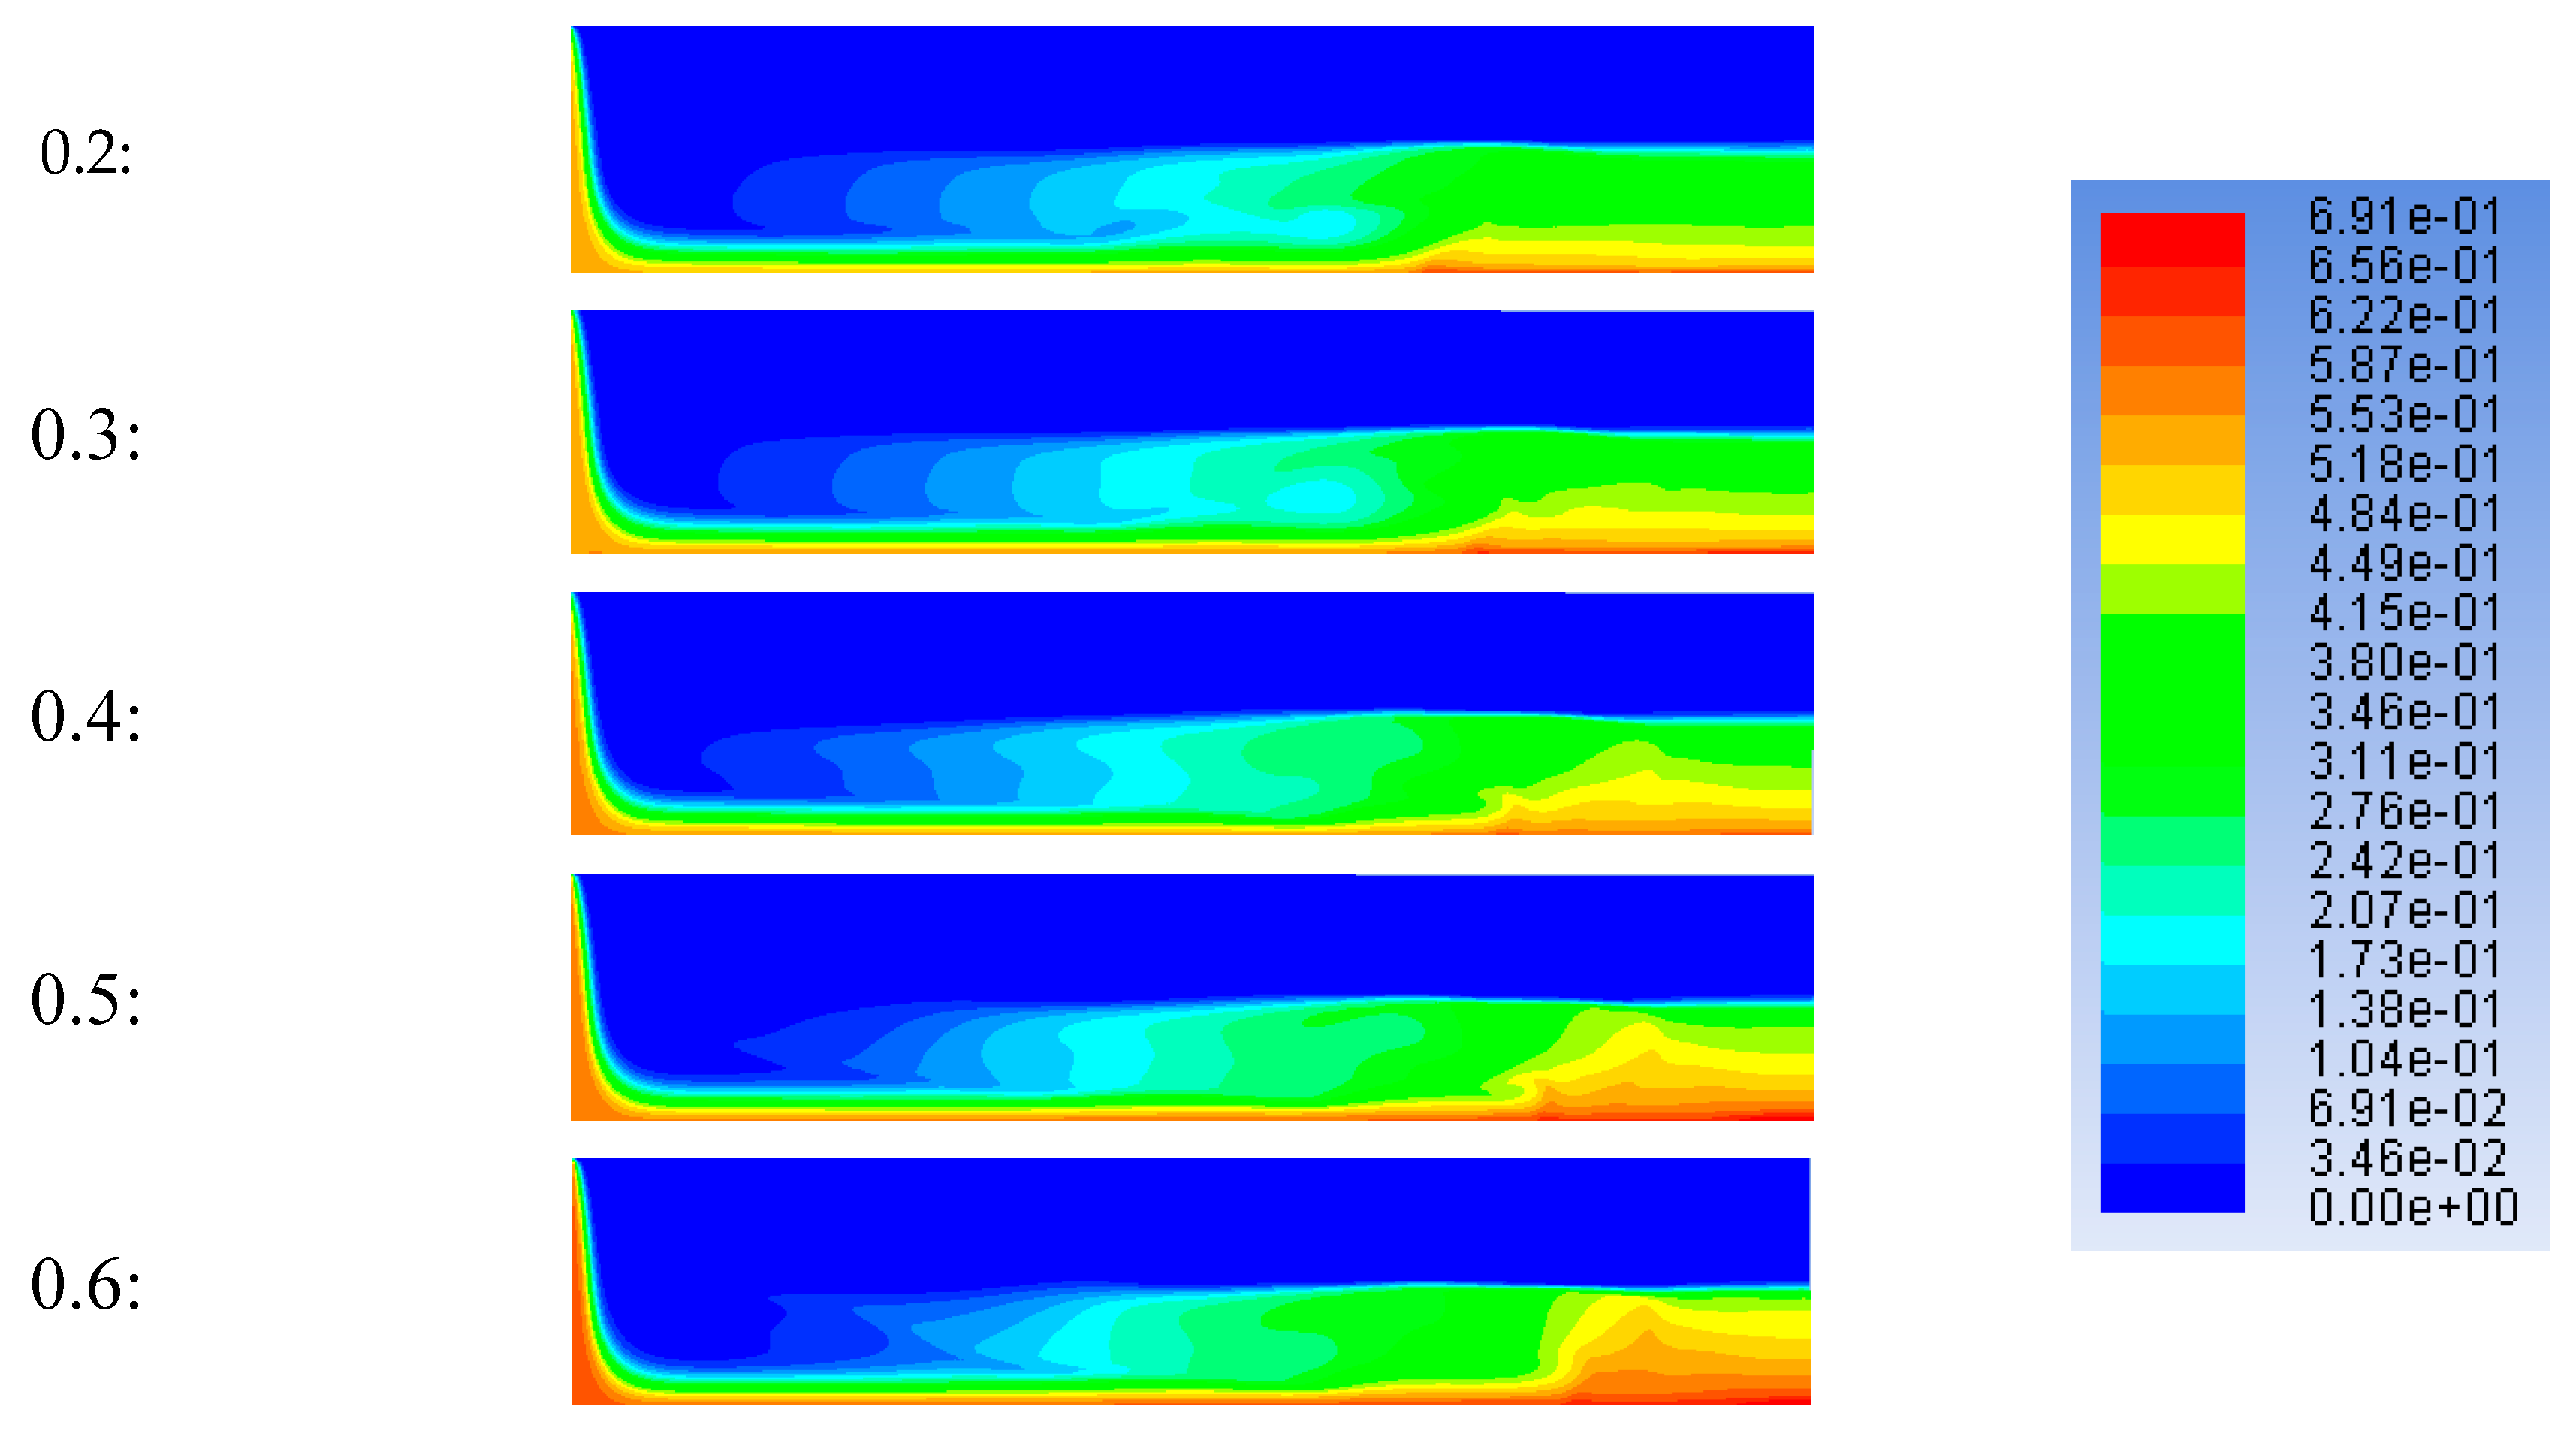
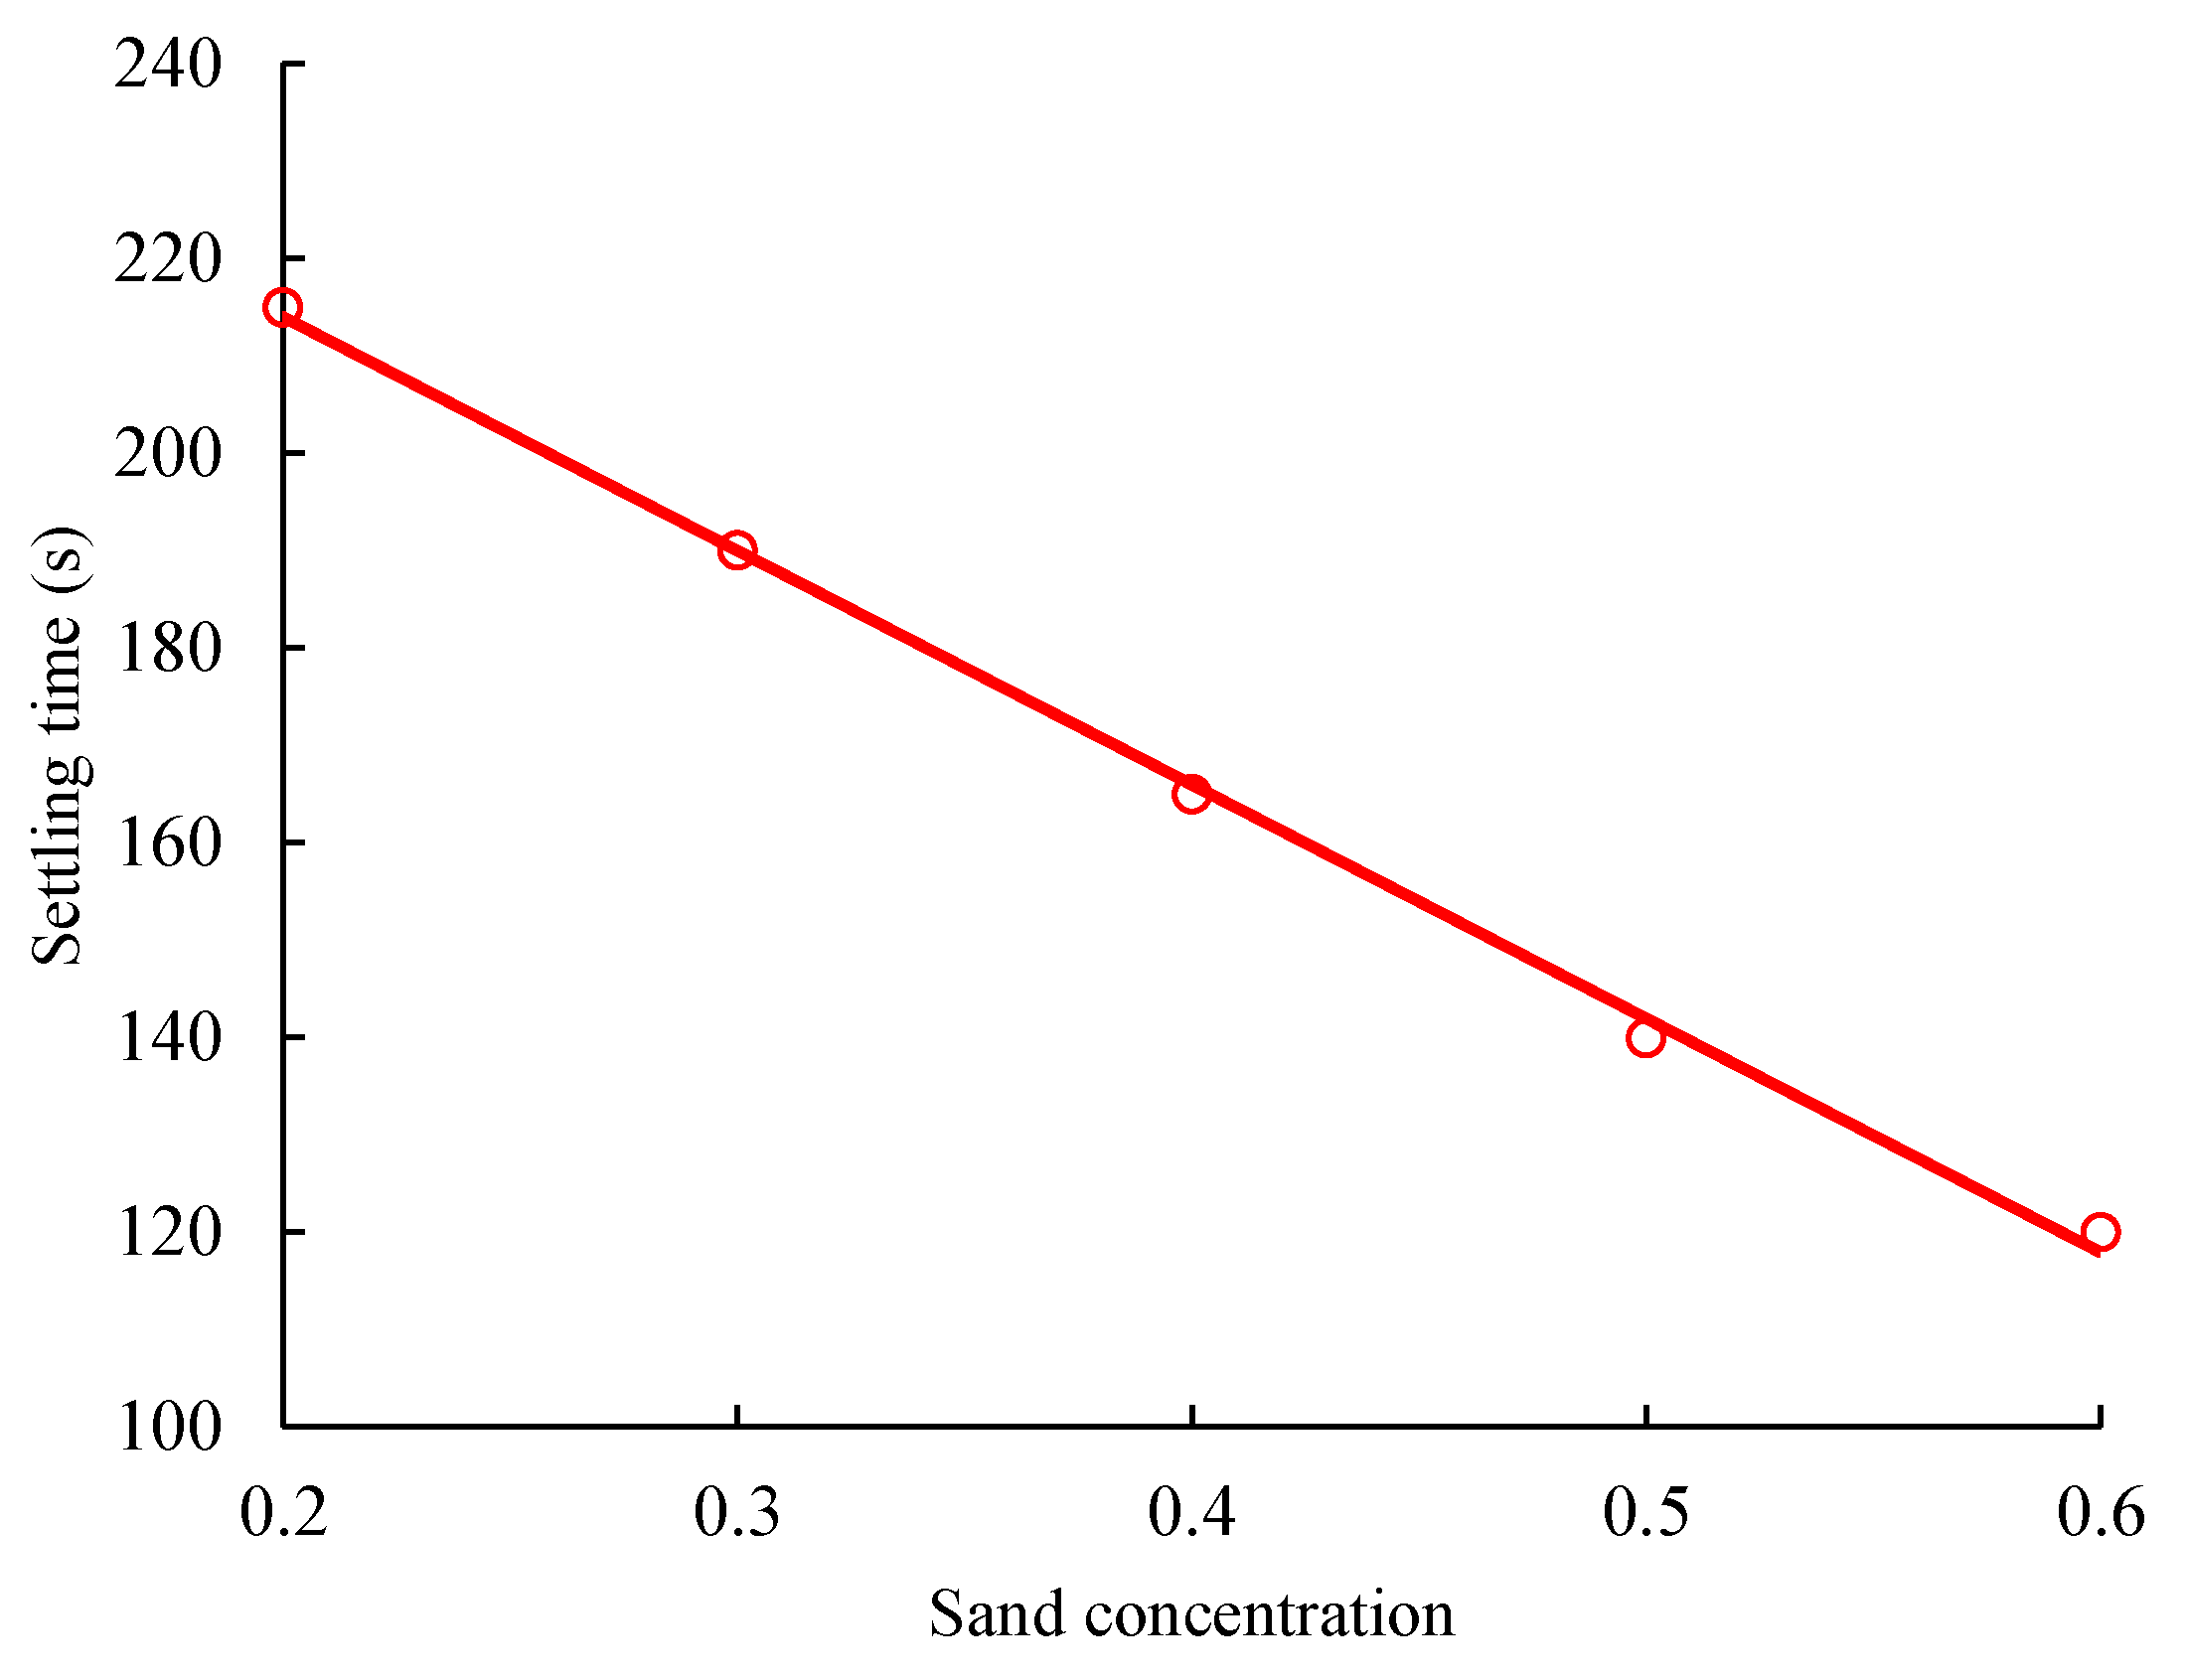
For obtaining the sedimentation characteristics of solid particles under different sand concentrations, we set five different sand concentrations: 0.2; 0.3; 0.4; 0.5; and 0.6. The flow conditions were temperature: 60 °C; pressure: 30 MPa; solid particle diameter: 0.0006 m; inlet flow rate of sand-carrying fluid: 1 m/s; sand density: 2650 kg/m3. The sand distribution after 80 min in the five cases is as follows.
As can be seen from the Figure 9 and Figure 10, the higher the sand concentration, the faster the sand front moves. The higher the concentration of sand, the greater the overall density of the sand-carrying liquid, the faster the settling velocity, and the shorter the settling time. However, at high concentrations, sand tends to accumulate at the tail of the fracture, and sand concentration at high concentrations is not as uniform as at low concentrations.

3.4. Flow Temperature

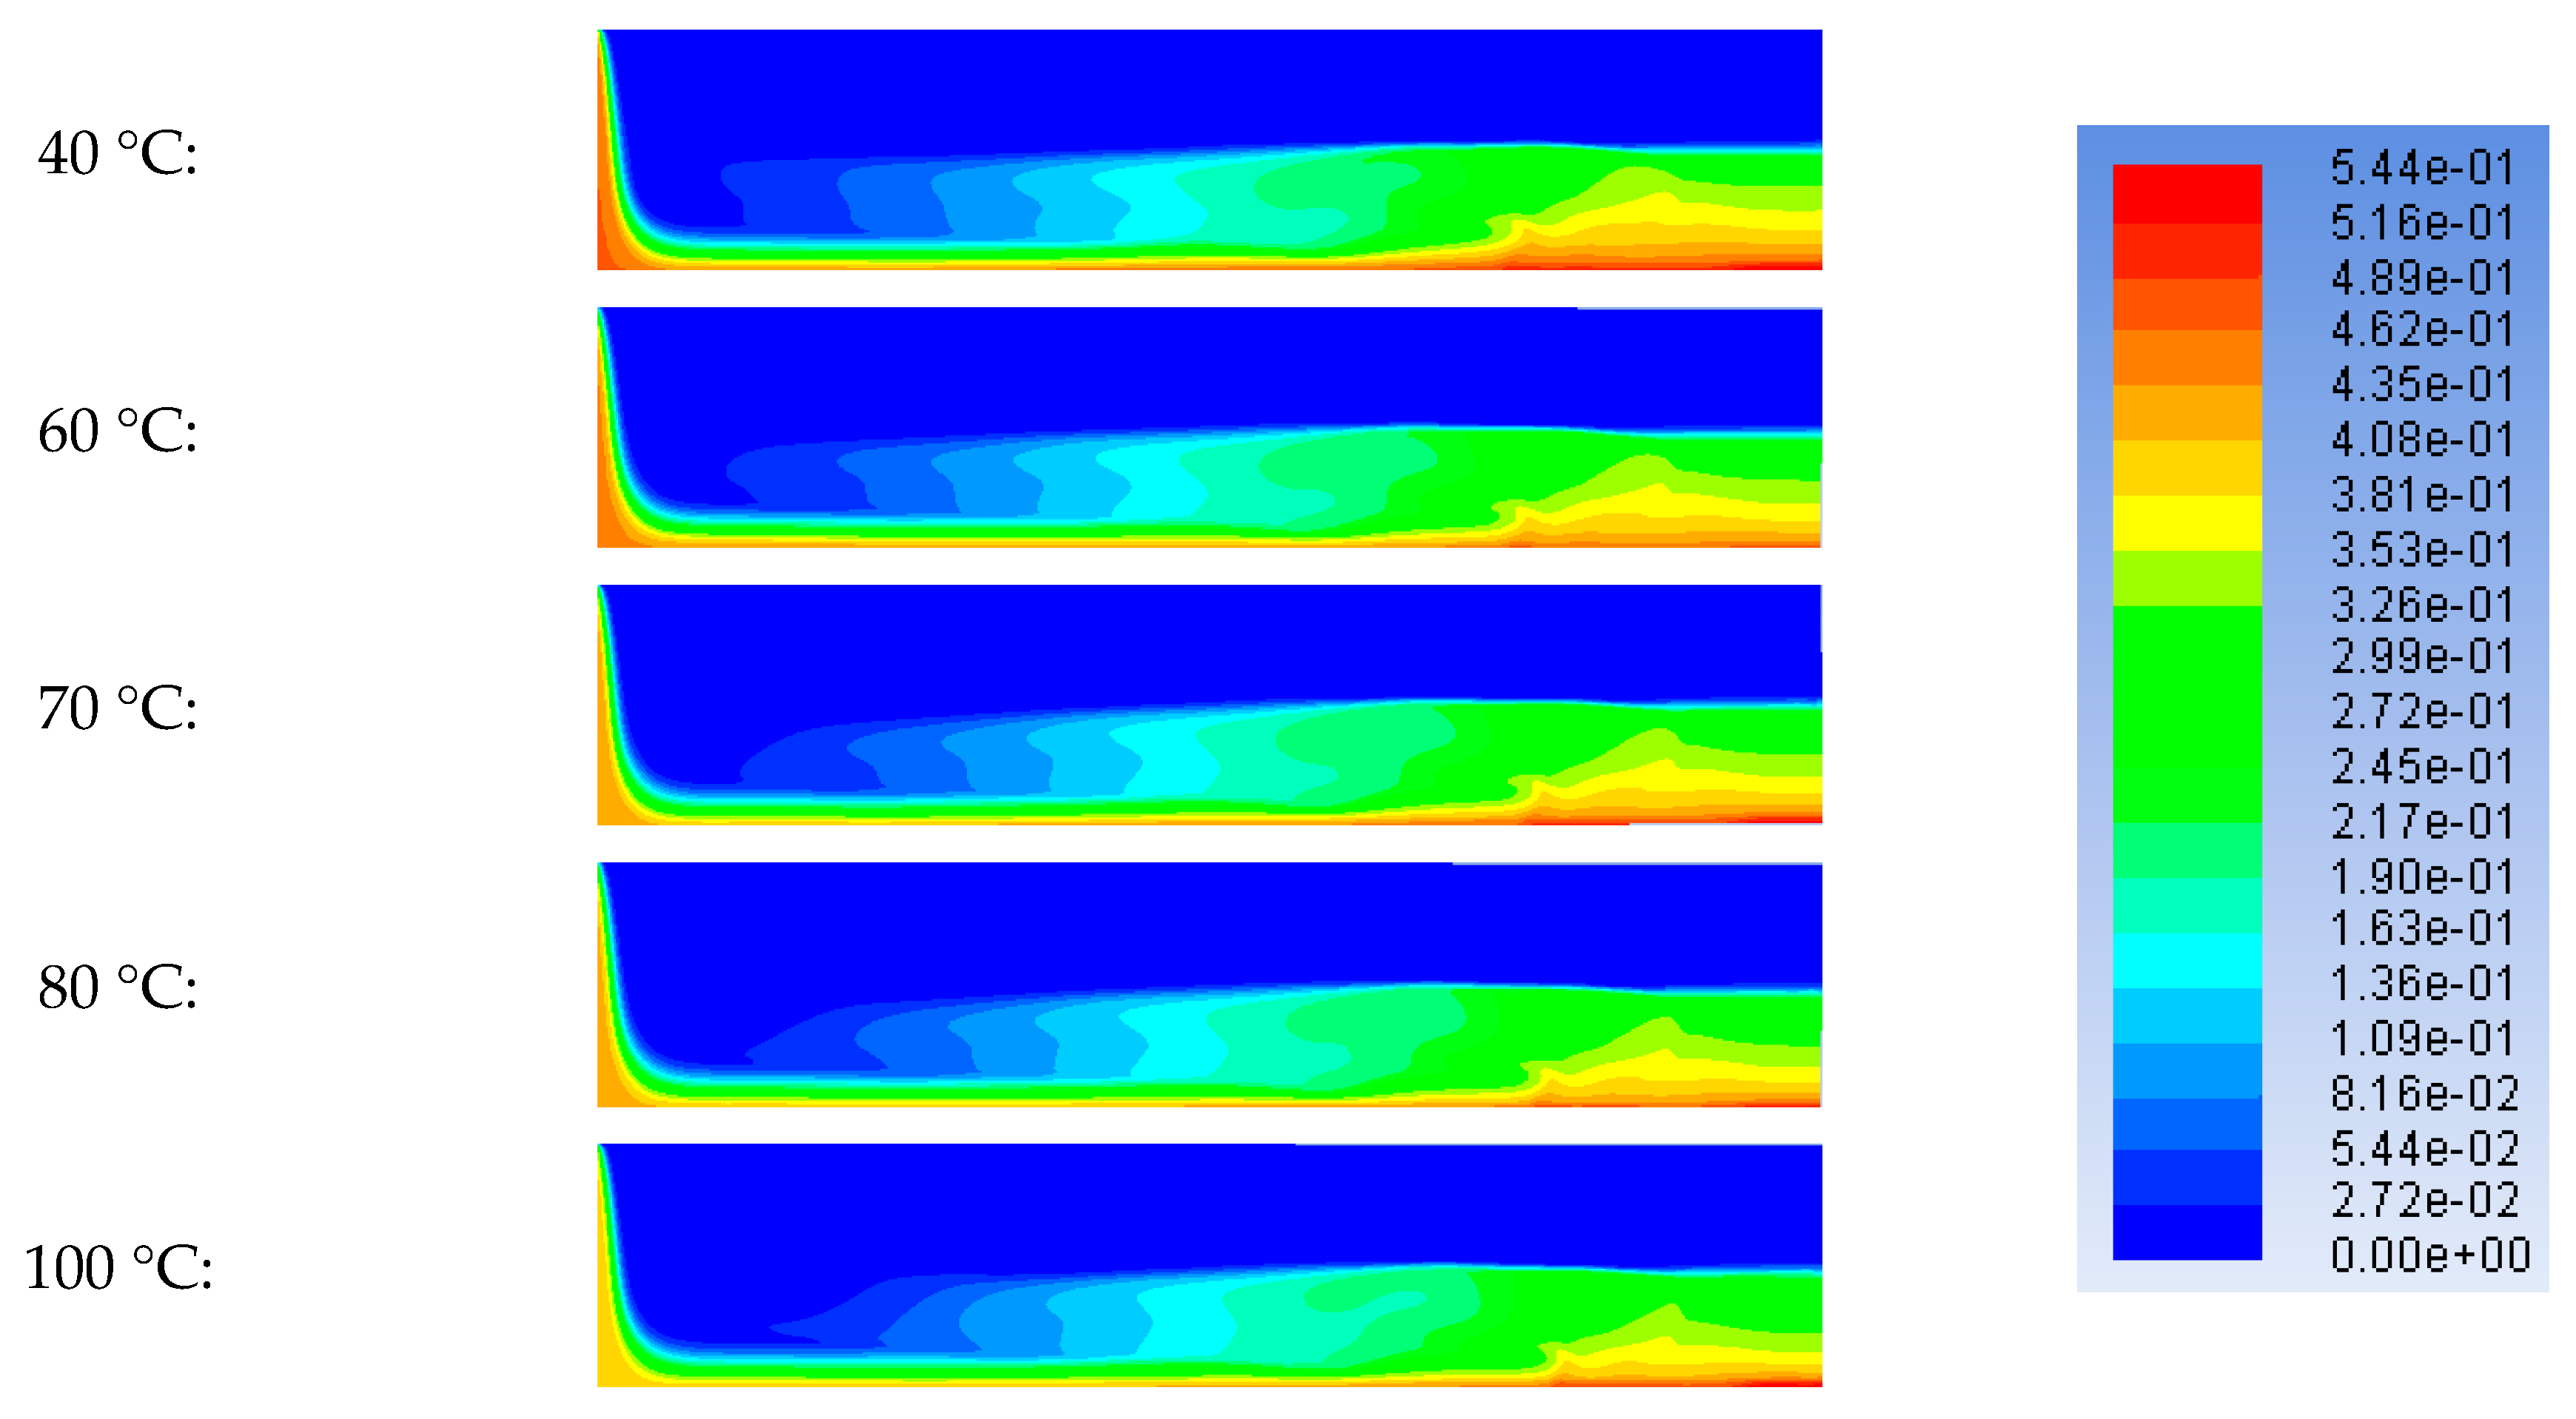
In order to obtain the effect of flow temperature on sand deposition in sand-carrying liquid, we set five different flow temperatures: 40 °C; 60 °C; 70 °C; 80 °C; and 100 °C. The flow conditions were pressure: 30 MPa; solid particle diameter: 0.0006 m; inlet flow rate of sand-carrying fluid: 1 m/s; sand concentration: 0.4; sand density: 2650 kg/m3. The sand distribution after 80 min in the five cases is as follows.
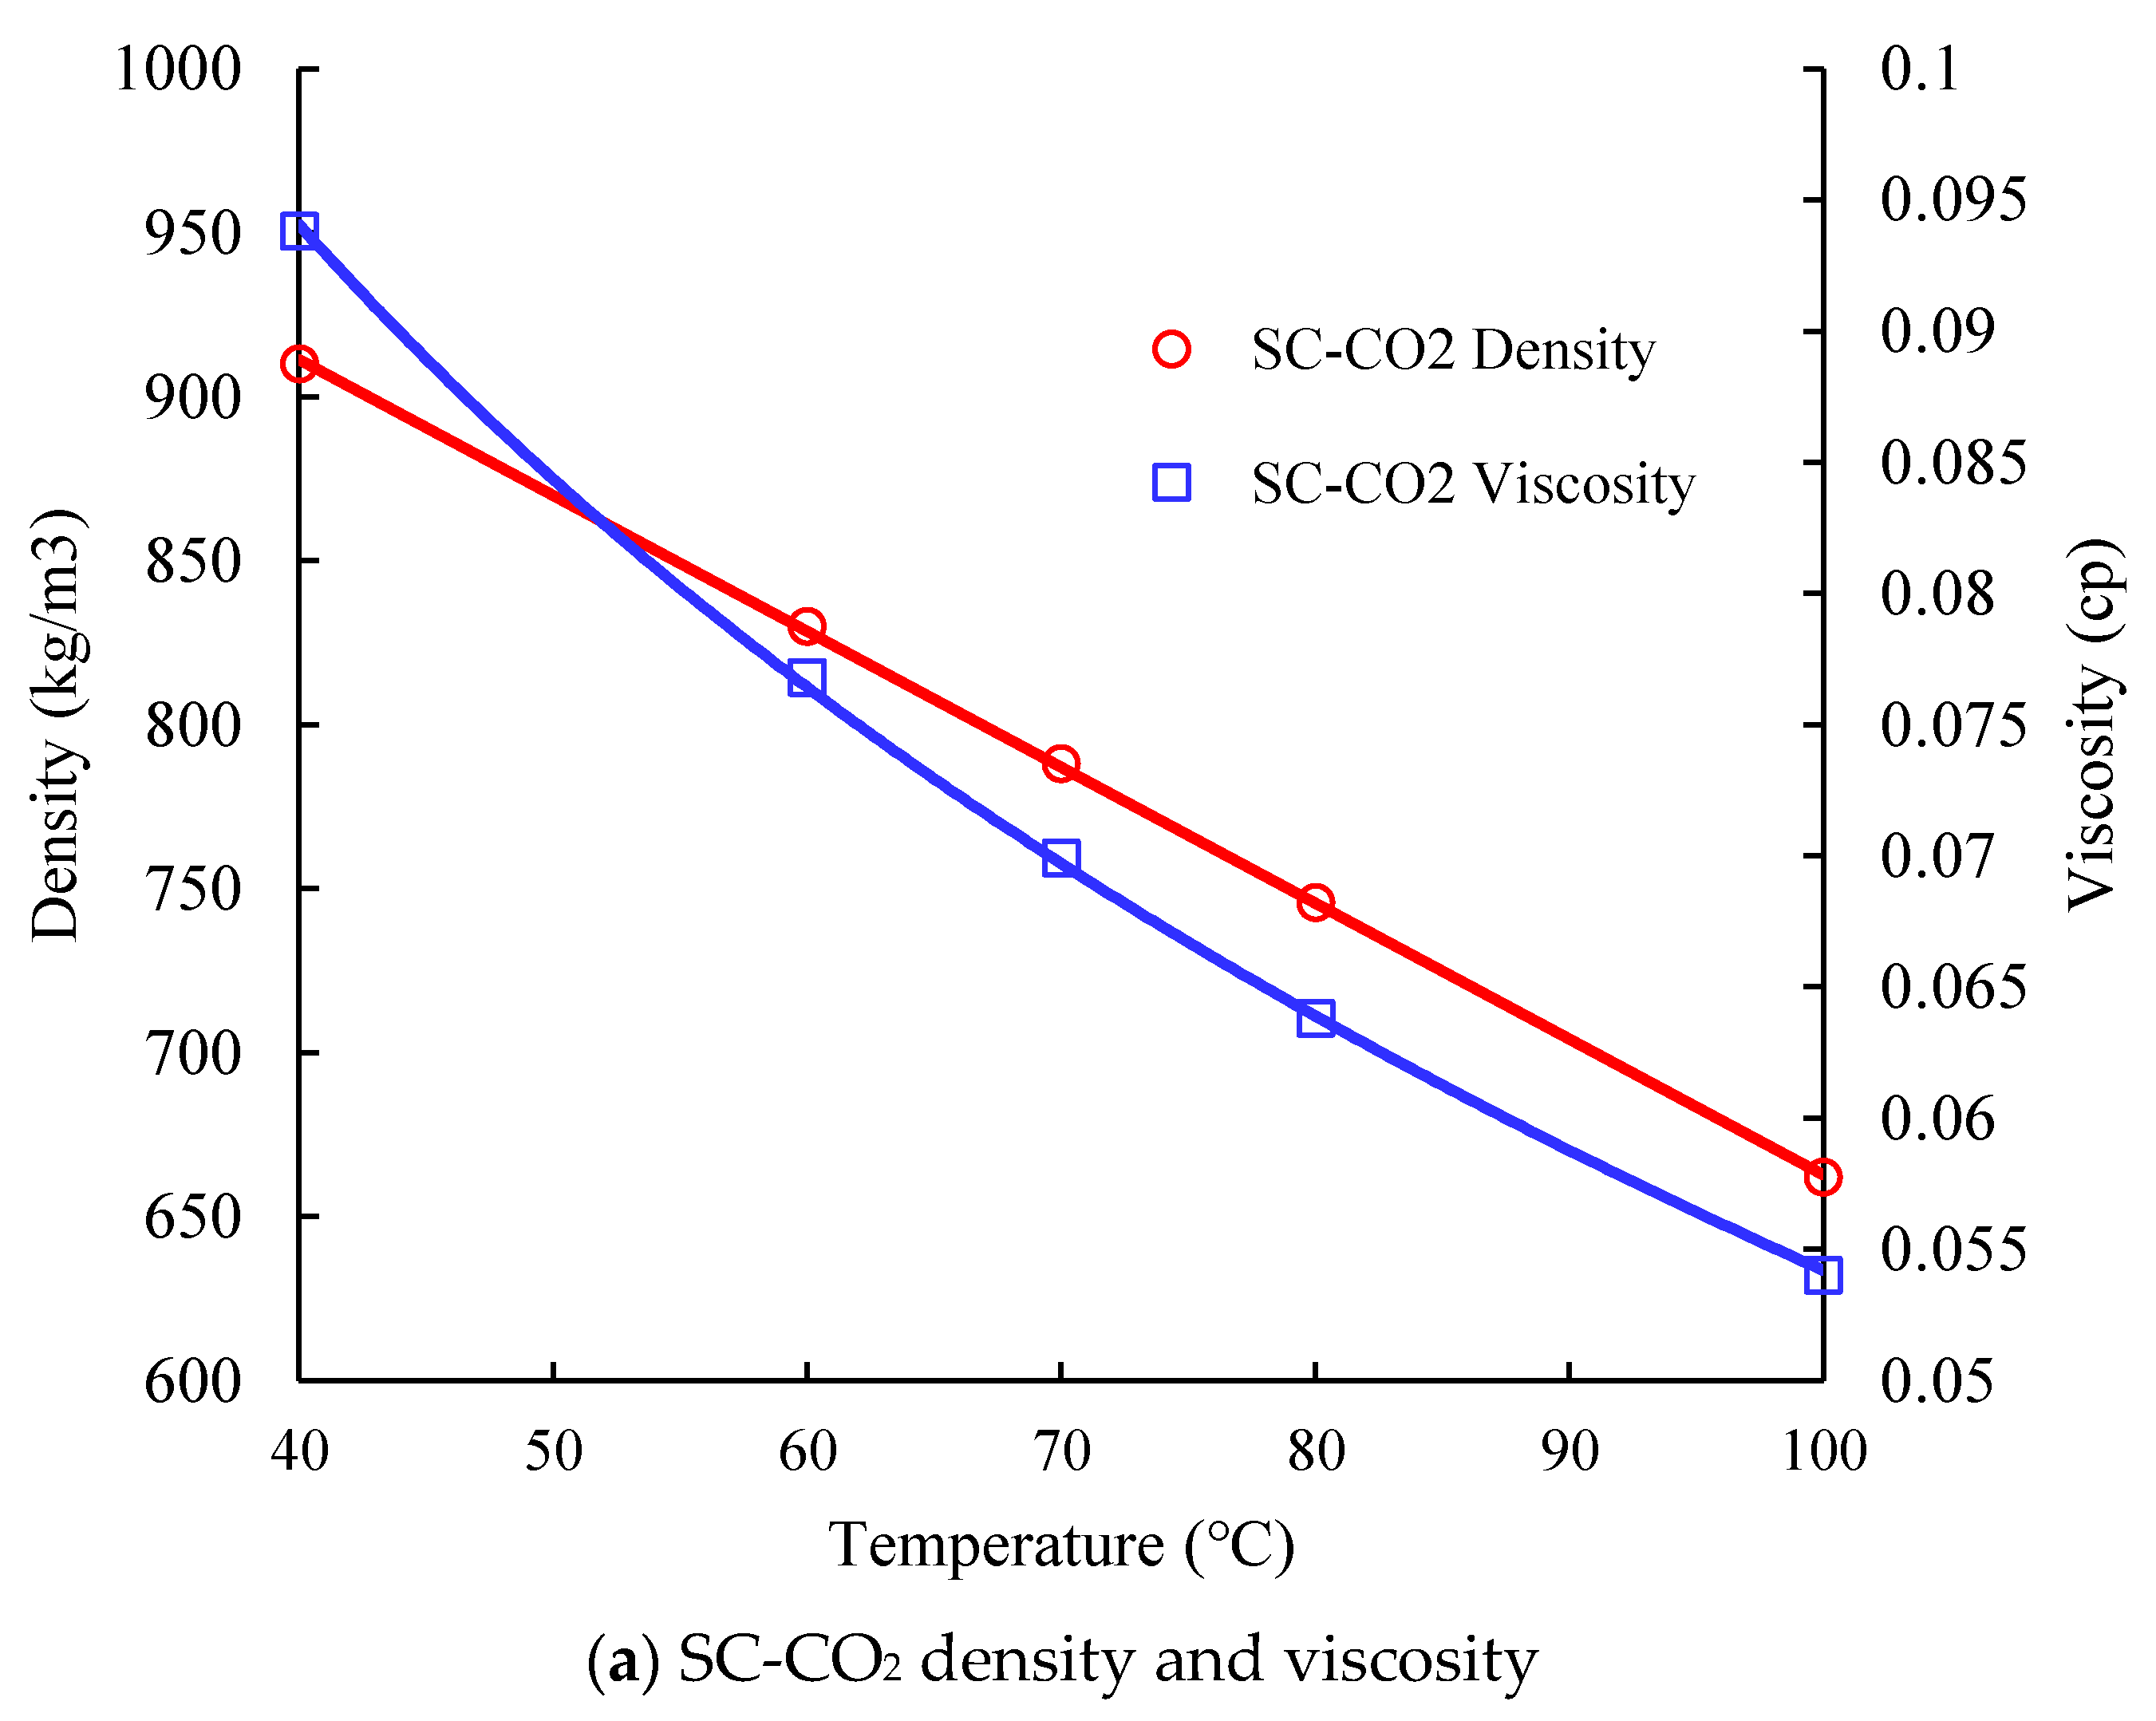
In Figure 11 and Figure 12, the flow temperature mainly affects the sedimentation of sand by affecting the density and viscosity of supercritical CO2. When the pressure is constant (30 MPa), the temperature increases from 40 °C to 100 °C, and the density and viscosity gradually decrease. Therefore, the sand-carrying capacity of the liquid phase decreases with increasing temperature, and the shorter the final settling time, the more uneven the distribution of sand.

3.5. Average Pressure

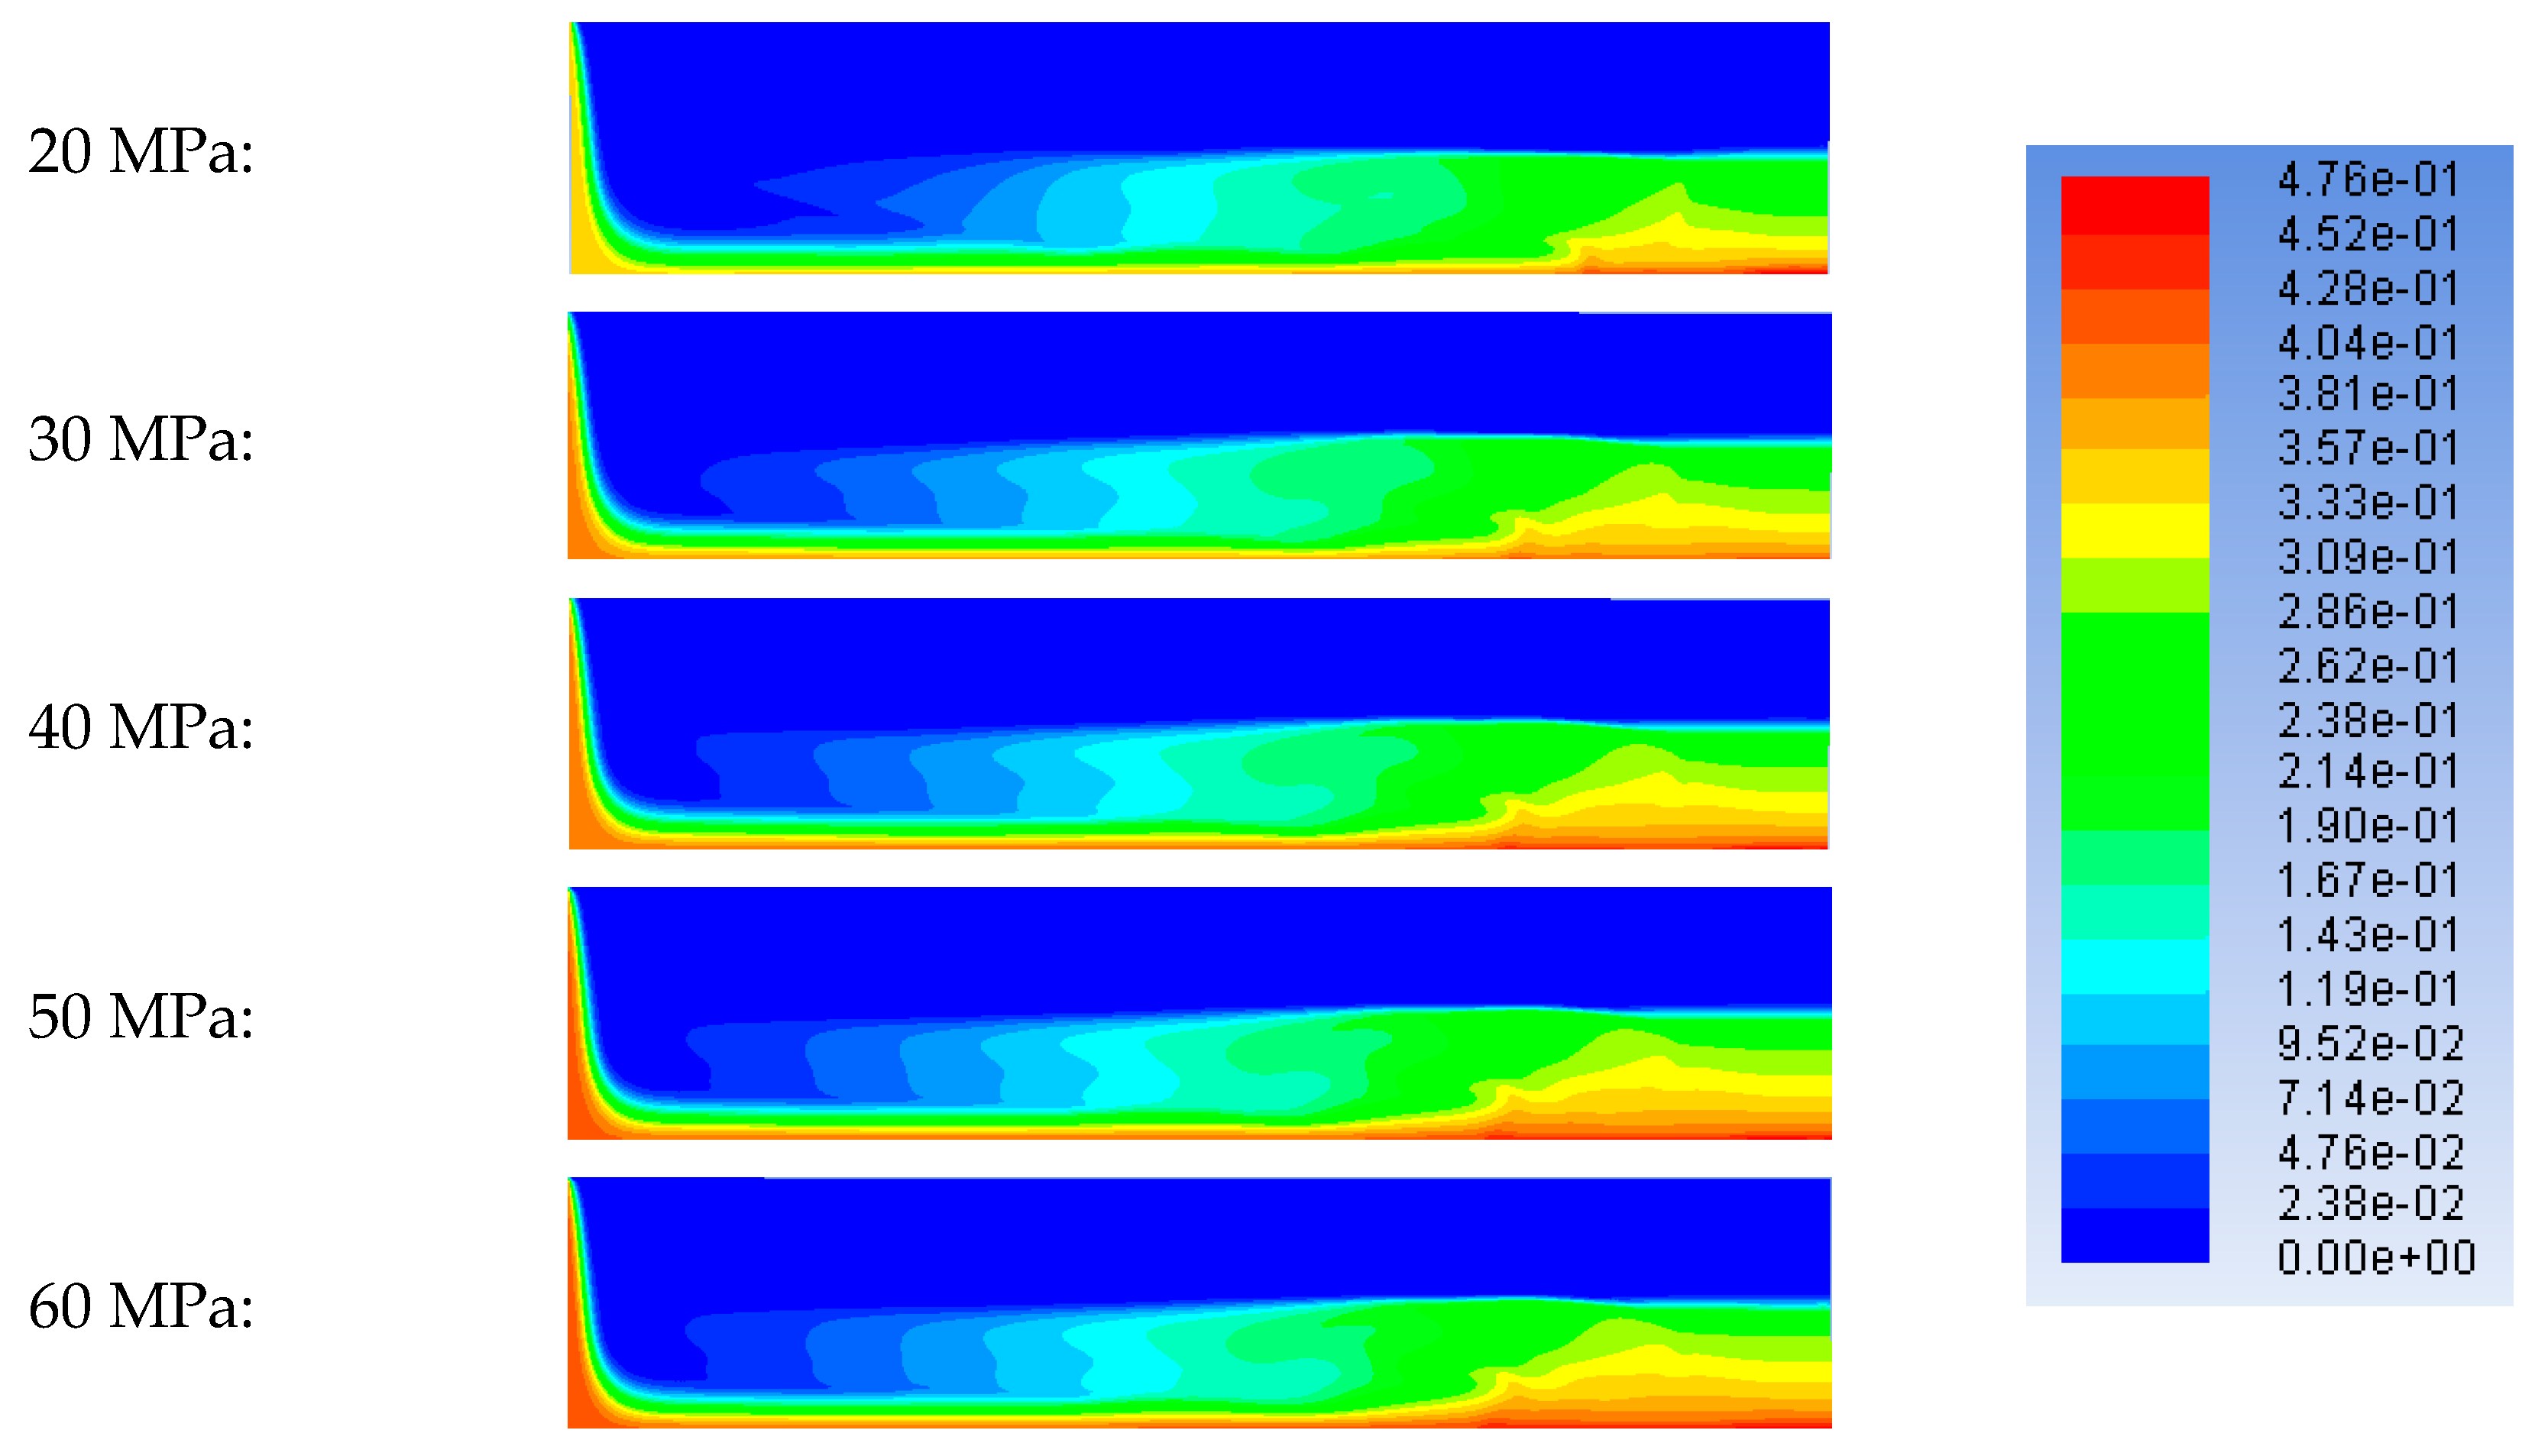
In order to obtain the effect of average pressure on sand deposition in sand-carrying liquid, we set five different flow temperatures: 20 MPa; 30 MPa; 40 MPa; 50 MPa; and 60 MPa. The flow conditions were flow temperature: 60 °C; solid particle diameter: 0.0006 m; inlet flow rate of sand-carrying fluid: 1 m/s; sand concentration: 0.4; sand density: 2650 kg/m3. The sand distribution after 80 min in the five cases is as follows.
In Figure 13 and Figure 14, pressure affects the density and viscosity of supercritical CO2. When the flow temperature is 60 °C, the average pressure rises from 20 MPa to 60 MPa, and the density and viscosity of supercritical CO2 gradually increase. At the same time, the sand front moves faster, the sand-carrying capacity of the liquid phase increases slightly, and the final stable time increases but the sand deposition uniformity increases.
In summary, solid particle diameter, fluid velocity, sand concentration, flow temperature, and average pressure all have an effect on the sedimentation of the proppant in the fracture, and they will ultimately affect the fracturing process and the fracturing effect.

4. Conclusions

This article studies the sedimentation characteristics of proppant in sand-carrying fluid by numerical simulation during supercritical CO2 fracturing. Several meaningful conclusions can be drawn:
(1)
For cracks with a certain height and length, when the SC-CO2 sand-carrying liquid enters the crack at a certain speed under the action of gravity and viscous forces, the proppant will continuously deposit and the accumulation and backflow will occur at the end of the crack.
(2)
The large sand diameters, high fluid flow rates, high sand concentrations, high reservoir temperatures, and low reservoir pressures can help to shorten deposition time, and shortening the sand deposition time can help to complete the fracturing efficiently.
(3)
The small particle size, high fluid flow rate, low sand concentration, low reservoir temperature, and high reservoir pressure help increase the uniformity of sand deposition, and increasing the deposition uniformity can improve the fracture conductivity.
(4)
According to the reservoir conditions, the reasonable adjustment of the fracturing parameters can significantly improve the fracturing effect, and we hope that the results of this study can play a guiding role in field construction.

Author Contributions

Supervision, Z.S.; Data curation, D.C. All authors have read and agreed to the published version of the manuscript.

Funding

The authors acknowledge the financial support from National Natural Science Foundation Projects of China (No. 51604261 and No. 52104099) and Natural Science Foundation Projects of Jiangsu Province (No. BK20210508). We also acknowledge China University of Mining & Technology for the permission to publish this article.

Data Availability Statement

Data will be available on request.

Conflicts of Interest

The authors declare no conflict of interest.

Appendix A. SC-CO2 Density Calculation Correlations

Table A1. Value of correlation coefficients b i 0 ~ b i 4 (P ≤ 20.69 MPa).
Symbolbi0bi1bi2bi3bi4
i = 0−2.15 × 1051.17 × 104−2.30× 1021.97−6.18 × 10⁻³
i = 14.76 × 10²−2.62 × 105.22 × 10−1−4.49 × 10−31.42 × 10−5
i = 2−3.71 × 10−12.07 × 10−2−4.17 × 10−43.62 × 10−6−1.16 × 10⁻⁸
i = 31.23 × 10⁻⁴−6.93 × 10−61.41 × 10−7−1.23 × 10−93.95 × 10−12
i = 4−1.47 × 10−88.34 × 10−10−1.70 × 10−111.50 × 10⁻¹³−4.84 × 10⁻¹⁶
Table A2. Value of correlation coefficients b i 0 ~ b i 4 (P > 20.69 MPa).
Symbolbi0bi1bi2bi3bi4
i = 06.90 × 1022.73−2.25 × 10⁻²−4.65 × 10−33.44 × 10−5
i = 12.21 × 10⁻¹−6.55 × 10−35.98 × 10−52.27 × 10⁻⁶−1.89 × 10⁻⁸
i = 2−5.12 × 10−52.02 × 10−6−2.31 × 10⁻⁸−4.08 × 10−103.89 × 10⁻¹²
i = 35.52 × 10⁻⁹−2.42 × 10−103.12 × 10−123.17 × 10⁻¹⁴−3.56 × 10⁻¹⁶
i = 4−2.18 × 10−131.01 × 10⁻¹⁴−1.41 × 10⁻¹⁶−8.96 × 10−191.22 × 10⁻²⁰

Appendix B. SC-CO2 Viscosity Correlations

Table A3. Viscosity calculation coefficients.
CoefficientValueCoefficientValue
a00.235156d114.071119 × 10−3
a1−0.491266d217.198037 × 10−5
a20.05211155d642.411697 × 10−17
a30.05347906d812.971072 × 10−23
a4−0.01537102d82−1.627888 × 10⁻²³

References

  1. Sun, F.; Yao, Y.; Li, X.; Li, G.; Miao, Y.; Han, S.; Chen, Z. Flow Simulation of the Mixture System of Supercritical CO2 & Superheated Steam in Toe-Point Injection Horizontal Wellbores. J. Pet. Sci. Eng. 2018, 163, 199–210. [Google Scholar] [CrossRef]
  2. Jia, C.; Zheng, M.; Zhang, Y. Unconventional Hydrocarbon Resources in China and the Prospect of Exploration and Development. Pet. Explor. Dev. 2012, 39, 139–146. [Google Scholar] [CrossRef]
  3. Lillies, A.T. Sand Fracturing with Liquid Carbon Dioxide. In Proceedings of the Annual Technical Meeting, Calgary, AB, Canada, 6–9 June 1982. PETSOC-82-33-23. [Google Scholar] [CrossRef]
  4. Gupta, D.; Hlidek, B.; Hill, E.; Dinsa, H. Fracturing fluid for low-permeability gas reservoirs: Emulsion of carbon dioxide with aqueous methanol base fluid: Chemistry and applications. In Proceedings of the SPE Hydraulic Fracturing Technology Conference, College Station, TX, USA, 29–31 January 2007. SPE-106304-MS. [Google Scholar] [CrossRef]
  5. Yost, A.B.; Mazza, R.L.; Remington, R.E. Analysis of Production Response to CO2/Sand Fracturing: A Case Study. In Proceedings of the SPE Eastern Regional Meeting, Charleston, WV, USA, 8–10 November 1994. SPE-29191-MS. [Google Scholar] [CrossRef]
  6. Tulissi, M.G.; May, R.E. A Comparison of Results of Three Different CO2 Energized Frac Fluids: A Case History. In Proceedings of the SPE Gas Technology Symposium, Calgary, AB, Canada, 30 April–2 May 2002. SPE-75681-MS. [Google Scholar] [CrossRef]
  7. Friehauf, K.E.; Mukul, M.S.; Sullivan, R.B. Application of a New Compositional Model for Hydraulic Fracturing with Energized Fluids: A South Texas Case Study. In Proceedings of the SPE Hydraulic Fracturing Technology Conference, The Woodlands, TX, USA, 19–21 January 2009. SPE-119265-MS. [Google Scholar] [CrossRef]
  8. Li, Y.; Chi, Y.; Zhao, C.; Miao, Y.; Han, S.; Chen, L. Modelling fluid flow in carbon fibre porous media based on X-ray microtomography and lattice Boltzmann method. Compos. Struct. 2022, 300, 116085. [Google Scholar] [CrossRef]
  9. Heidaryan, E.; Hatami, T.; Rahimi, M.; Moghadasi, J. Viscosity of Pure Carbon Dioxide at Supercritical Region: Measurement and Correlation Approach. J. Supercrit. Fluids 2011, 56, 144–151. [Google Scholar] [CrossRef]
  10. Pham, H.S.; Alpy, N.; Mensah, S.; Tothill, M.; Ferrasse, J.H.; Boutin, O.; Quenaut, J.; Rodriguez, G.; Saez, M. A Numerical Study of Cavitation and Bubble Dynamics in Liquid CO2 Near the Critical Point. Int. J. Heat Mass Transf. 2016, 102, 174–185. [Google Scholar] [CrossRef]
  11. Sun, Z.; Huang, B.; Liu, Y.; Jiang, Y.; Zhang, Z.; Hou, M.; Li, Y. Gas-phase production equation for CBM reservoirs: Interaction between hydraulic fracturing and coal orthotropic feature. J. Pet. Sci. Eng. 2022, 213, 110428. [Google Scholar] [CrossRef]
  12. Sinal, M.L.; Lancaster, G. Liquid CO Fracturing: Advantages and Limitations. J. Can. Pet. Technol. 1987, 26, 26–30. [Google Scholar] [CrossRef]
  13. Wang, H.; Li, G.; Shen, Z. A Feasibility Analysis on Shale Gas Exploitation with Supercritical Carbon Dioxide. Energy Sources Part A Recovery Util. Environ. Eff. 2012, 34, 1426–1435. [Google Scholar] [CrossRef]
  14. Wasp, E.J.; Aude, T.C. Deposition velocities, transition velocities, and spatial distribution of solids in slurry pipelines. In Proceedings of the 1st International British Hydromechanics Research Association Hydraulic Transport of Solids in Pipes Conference, War Wickshire University, Conventry, UK, 1–4 September 1970; Available online: https://trid.trb.org/view/19585 (accessed on 18 December 2022).
  15. Clifton, R.J.; Wang, J.-J. Multiple fluids, proppant transport, and thermal effects in three dimensional simulation of hydraulic fracturing. In Proceedings of the SPE Annual Technical Conference and Exhibition, Houston, TX, USA, 2–5 October 1988. SPE-18198-MS. [Google Scholar] [CrossRef]
  16. Barree, R.D.; Conway, M.W. Experiment and numerical modeling of convective proppant transport. In Proceedings of the SPE Annual Technical Conference and Exhibition, New Orleans, LA, USA, 25–28 September 1994. SPE-28564-MS. [Google Scholar] [CrossRef]
  17. Sharma, M.M.; Gadde, P.B. The Impact of Proppant Retardation on Propped Fracture Lengths. In Proceedings of the SPE Annual Technical Conference and Exhibition, Dallas, TX, USA, 9–12 October 2005. SPE-97106-MS. [Google Scholar] [CrossRef]
  18. Wood, W.D.; Wheeler, R.S. A New Correlation for Relating the Physical Properties of Fracturing Slurries to the Minimum Flow Velocity Required for Transport. In Proceedings of the SPE Hydraulic Fracturing Technology Conference, College Station, TX, USA, 29–31 January 2007. SPE-106312-MS. [Google Scholar] [CrossRef]
  19. Clark, P.E.; Quadir, J.A. Prop transport in hydraulic fractures: A critical review of particle settling. In Proceedings of the SPE/DOE Low Permeability Gas Reservoirs Symposium, Denver, CO, USA, 27–29 May 1981. SPE-9866-MS. [Google Scholar] [CrossRef]
  20. Patankar, N.A.; Joseph, D.D.; Wang, J.; Barree, R.D.; Conway, M.; Asadi, M. Power Law Correlations for Sediment Transport in Pressure Driven Channel Flows. Int. J. Multiph. Flow 2002, 28, 1269–1292. [Google Scholar] [CrossRef] [Green Version]
  21. Gadde, P.B.; Liu, Y.; Norman, J.; Bonnecaze, R.; Sharma, M.M. Modeling Proppant Settling in Water-Fracs. In Proceedings of the SPE Annual Technical Conference and Exhibition, Houston, TX, USA, 26–29 September 2004. SPE-89875-MS. [Google Scholar] [CrossRef]
  22. Miao, Y.; Zhao, C.; Zhou, G. New rate-decline forecast approach for low-permeability gas reservoirs with hydraulic fracturing treatments. J. Pet. Sci. Eng. 2020, 190, 107112. [Google Scholar] [CrossRef]
  23. Miao, Y.; Zhao, C.; Zhou, G. Gas Flowrate Evaluation in Coal Coupling the Matrix Shrinkage Effect Caused by Water Extraction. J. Energy Resour. Technol. 2021, 144, 032301-2. [Google Scholar] [CrossRef]
  24. Zhang, X.; Tahmasebi, P. Micromechanical evaluation of rock and fluid interactions. Int. J. Greenh. Gas Control 2018, 76, 266–277. [Google Scholar] [CrossRef]
  25. Zhang, X.; Tahmasebi, P. Effects of grain size on deformation in porous media. Transp. Porous Media 2019, 129, 321–341. [Google Scholar] [CrossRef]
  26. Zhang, X.; Tahmasebi, P. Coupling irregular particles and fluid: Complex dynamics of granular flows. Comput. Geotech. 2022, 143, 104624. [Google Scholar] [CrossRef]
  27. Tsuji, Y.; Tanaka, T.; Ishida, T. Lagrangian numerical simulation of plug flow of cohesionless particles in a horizontal pipe. Powder Technol. 1992, 71, 239–250. [Google Scholar] [CrossRef]
  28. Yang, S.; Luo, K.; Fang, M.; Zhang, K.; Fan, J. Parallel CFD–DEM modeling of the hydrodynamics in a lab-scale double slot-rectangular spouted bed with a partition plate. Chem. Eng. J. 2014, 236, 158–170. [Google Scholar] [CrossRef]
  29. Garg, R.; Galvin, J.; Li, T.; Pannala, S. Open-source MFIX-DEM software for gas-solids flows: Part I-verification studies. Powder Technol. 2012, 220, 122–137. [Google Scholar] [CrossRef]
  30. Gopalakrishnan, P.; Tafti, D. Development of parallel DEM for the open source code MFIX. Powder Technol. 2013, 235, 33–41. [Google Scholar] [CrossRef]
  31. Faizov, A.R.; Churakova, S.K.; Sidorov, G.M. Calculation of Pressure Drop in Unirrigated Packed Contact Devices Applying ANSYS Fluent Software. Chem. Pet. Eng. 2018, 54, 130–135. [Google Scholar] [CrossRef]
  32. Trofa, M.; D’Avino, G.; Sicignano, L. CFD-DEM simulations of particulate fouling in microchannels. Chem. Eng. J. 2019, 358, 99–100. [Google Scholar] [CrossRef]
  33. Licheng, M.A.; Lubin, W.E.I.; Xinyu, P.E.I. CFD-DEM simulations of particle separation characteristic in centrifugal compounding force field. Powder Technol. 2019, 343, 11–18. [Google Scholar]
  34. Wang, S.; Luo, K.; Hu, C. CFD-DEM study of the effect of ring baffles on system performance of a full-loop circulating fluidized bed. Chem. Eng. Sci. 2019, 196, 130–144. [Google Scholar] [CrossRef]
  35. Sun, Z.; Wang, S.; Xiong, H.; Wu, K.; Shi, J. Optimal nanocone geometry for water flow. AIChE J. 2022, 68, e17543. [Google Scholar] [CrossRef]
  36. Sun, Z.; Huang, B.; Yan, S.; Wang, S.; Wu, K.; Yu, W.; Li, Y.; Wang, S. Nanoconfined Methane Thermodynamic Behavior below Critical Temperature: Liquid–Vapor Coexistence Curve under Wettability Effect. Ind. Eng. Chem. Res. 2022, 61, 4971–4979. [Google Scholar] [CrossRef]
  37. Span, R.; Wagner, W. A New Equation of State for Carbon Dioxide Covering the Fluid Region from the Triple-Point Temperature to 1100 K at Pressures up to 800 MPa. J. Phys. Chem. Ref. Data 1996, 25, 1509–1596. [Google Scholar] [CrossRef] [Green Version]
  38. Ouyang, L.-B. New Correlations for Predicting the Density and Viscosity of Supercritical Carbon Dioxide Under Conditions Expected in Carbon Capture and Sequestration Operations. Open Pet. Eng. J. 2011, 5, 13–21. [Google Scholar] [CrossRef] [Green Version]
  39. Vesovic, V.; Wakeham, W.A.; Olchowy, G.A.; Sengers, J.V.; Watson, J.T.R.; Millat, J. The transport properties of carbon dioxide. J. Phys. Chem. Ref. Data 1990, 19, 763–808. [Google Scholar] [CrossRef]
  40. Fenghour, A.; Wakeham, W.A. The viscosity of carbon dioxide. J. Phys. Chem. Ref. Data 1998, 27, 31–44. [Google Scholar] [CrossRef]
  41. Yu, P.; Dempsey, D.; Archer, R. A three-dimensional coupled thermo-hydro-mechanical numerical model with partially bridging multi-stage contact fractures in horizontal-well enhanced geothermal system. Int. J. Rock Mech. Min. Sci. 2021, 143, 104787. [Google Scholar] [CrossRef]
  42. Yu, P.; Dempsey, D.; Archer, R. Techno-Economic feasibility of enhanced geothermal systems (EGS) with partially bridging Multi-Stage fractures for district heating applications. Energy Convers. Manag. 2022, 257, 115405. [Google Scholar] [CrossRef]
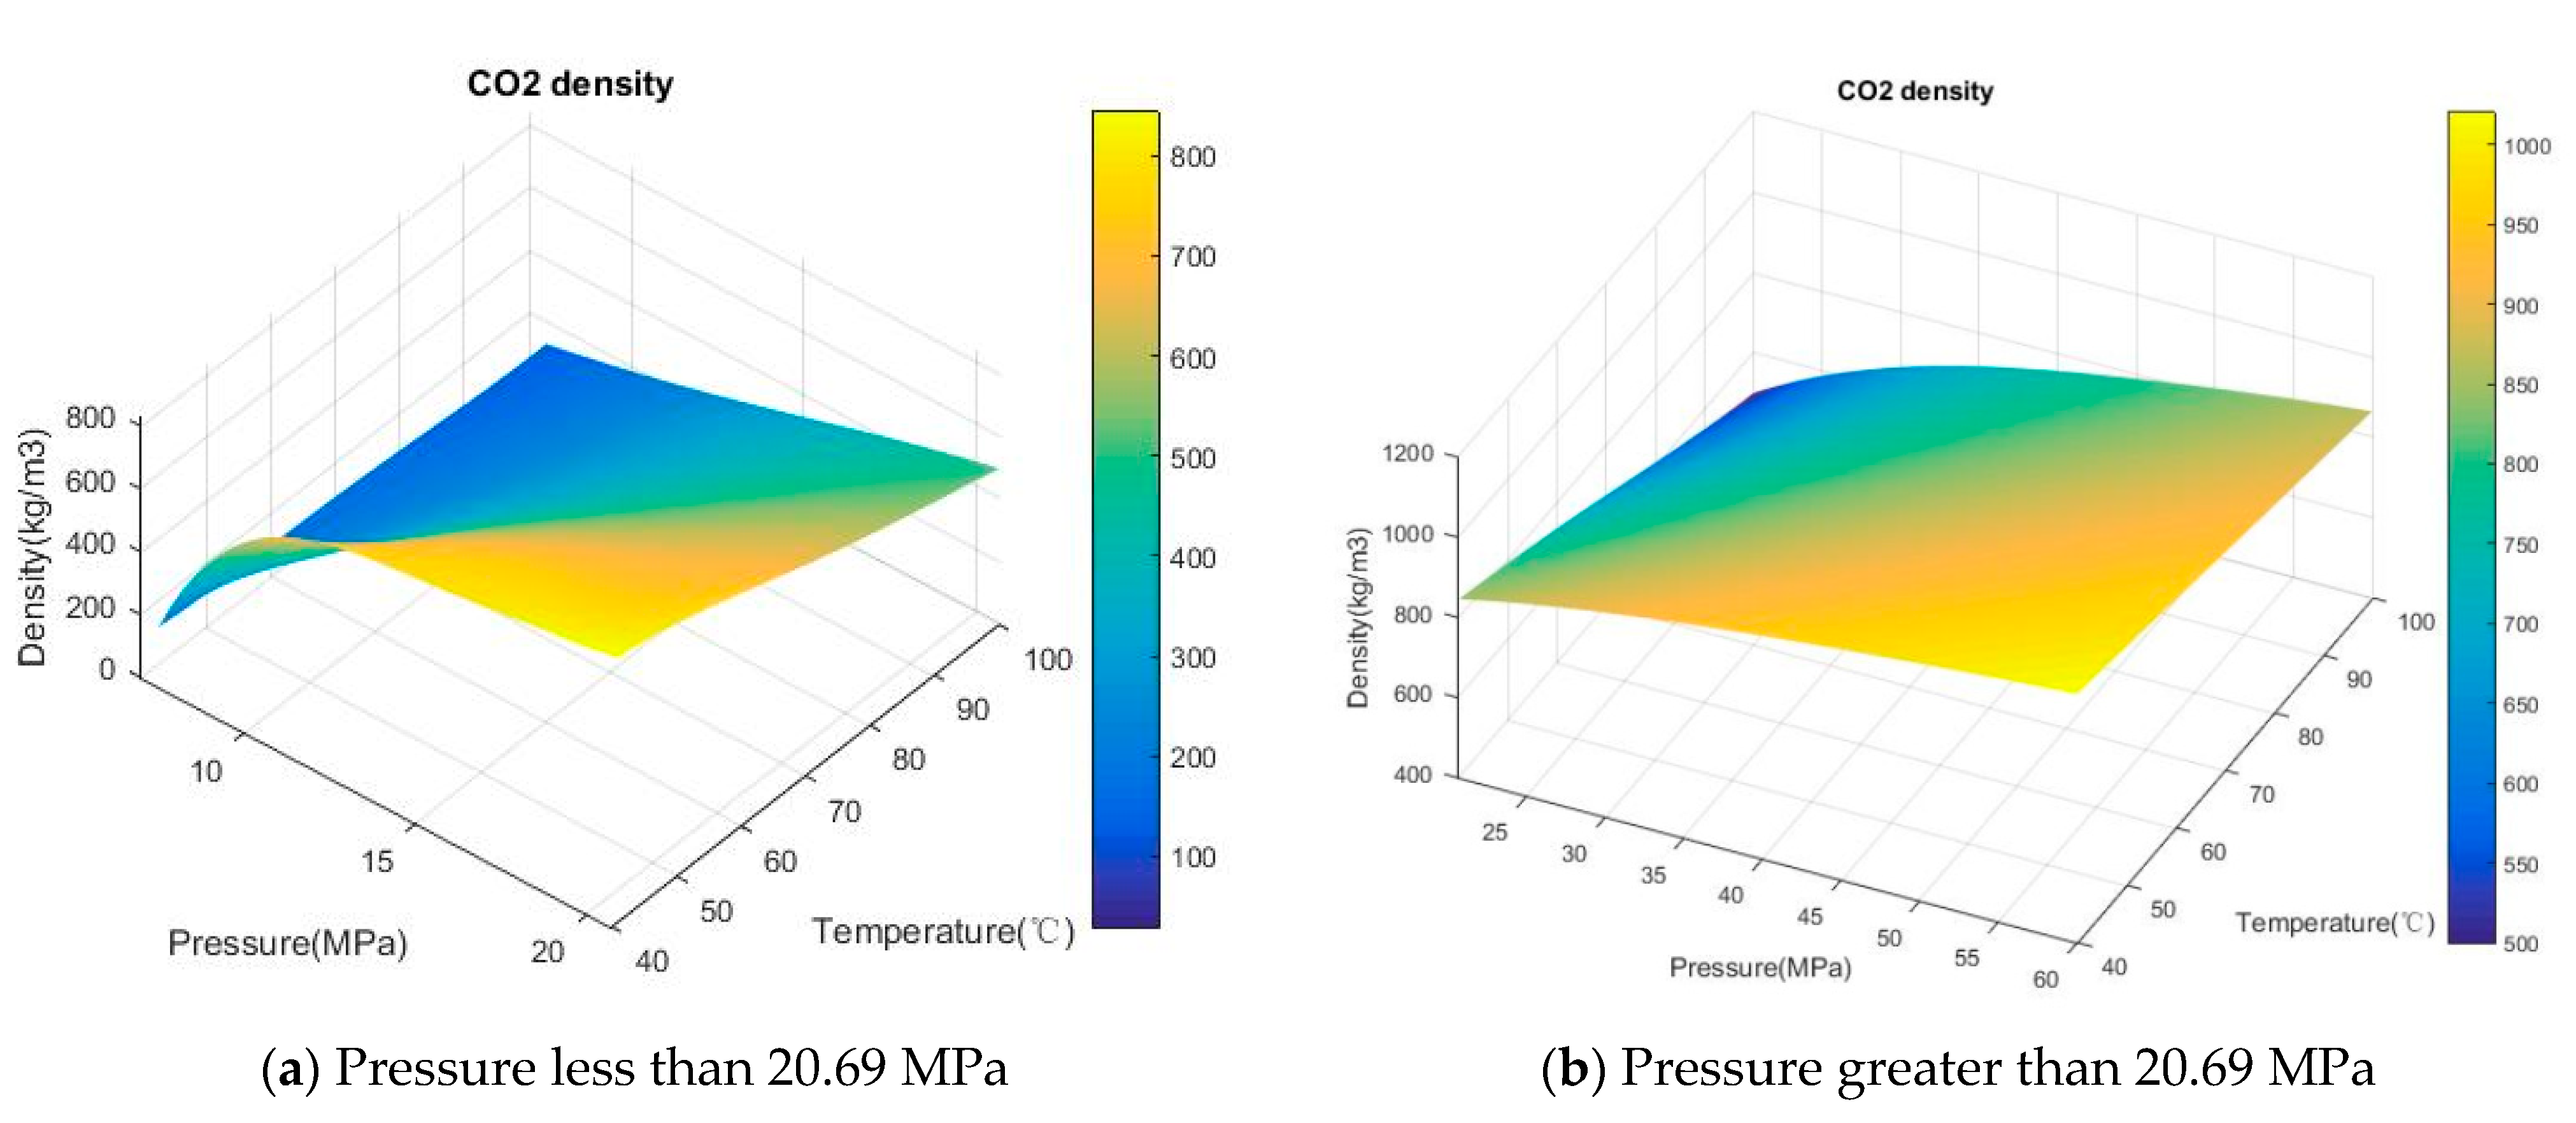
Figure 1. The relationship between SC-CO2 density and temperature-pressure.
Energies 16 00011 g001
Figure 2. The relationship between SC-CO2 viscosity and temperature-pressure.
Energies 16 00011 g002
Figure 3. Fracturing construction and fracture diagrams.
Energies 16 00011 g003
Figure 4. Gravel settlement diagrams at different flow moments.
Energies 16 00011 g004
Figure 5. Gravel settlement diagram with different particle sizes.
Energies 16 00011 g005
Figure 6. Settling time at different particle diameters.
Energies 16 00011 g006
Figure 7. Gravel settlement diagram with different fluid velocity.
Energies 16 00011 g007
Figure 8. Settling time at different inlet velocities.
Energies 16 00011 g008
Figure 9. Gravel settlement diagram with different sand concentrations.
Energies 16 00011 g009
Figure 10. Settling time at different sand concentrations.
Energies 16 00011 g010
Figure 11. Gravel settlement diagram with different flow temperatures.
Energies 16 00011 g011
Figure 12. SC-CO2 physical properties and sand settling time at different flow temperatures.
Energies 16 00011 g012aEnergies 16 00011 g012b
Figure 13. Gravel settlement diagram with different average pressures.
Energies 16 00011 g013
Figure 14. SC-CO2 physical properties and sand settling time at different average pressures.
Energies 16 00011 g014
Table 1. Actual gas state equation.
PresenterState Equation
Van der Waals (VdW) (1887) P = R T V b a V 2
Redlich & Kwong (RK) equation (1949) P = R T V b a / T V ( V + b )
Soave-Redlich-Kwong (SRK) (1972) P = R T V b a ( T ) V ( V + b )
Peng-Robinson (PR) (1976) P = R T V b a ( T ) V ( V + b ) + b ( V b )
Patel-teja (PT) (1982) P = R T V b a ( T ) V ( V + b ) + c ( V b )
Span & Wagner (1994) M p ( δ , τ ) ρ R T = 1 + δ ϕ δ r
Table 2. Basic parameters of shale gas reservoir.
ParameterValueParameterValue
Reservoir temperature60 °CReservoir pressure30 MPa
Reservoir depth3650 mSand-carrying fluidSupercritical CO2
Porosity1.38%ProppantCeramsites
Gas layer thickness34 mSand-carrying fluid inlet flow rate1 m/s
Gas content2.48 m3/tSand diameter0.6 mm
Organic carbon (TOC) mass fraction3.5%Sand concentration0.4
Vitrinite reflectance2.2%Sand density2650 kg/m3
Disclaimer/Publisher’s Note: The statements, opinions and data contained in all publications are solely those of the individual author(s) and contributor(s) and not of MDPI and/or the editor(s). MDPI and/or the editor(s) disclaim responsibility for any injury to people or property resulting from any ideas, methods, instructions or products referred to in the content.