


Photovoltaic Electrification and Water Pumping Using the Concepts of Water Shortage Probability and Loss of Power Supply Probability: A Case Study


Abstract
:1. Introduction
1.1. Photovoltaic Water Pumping
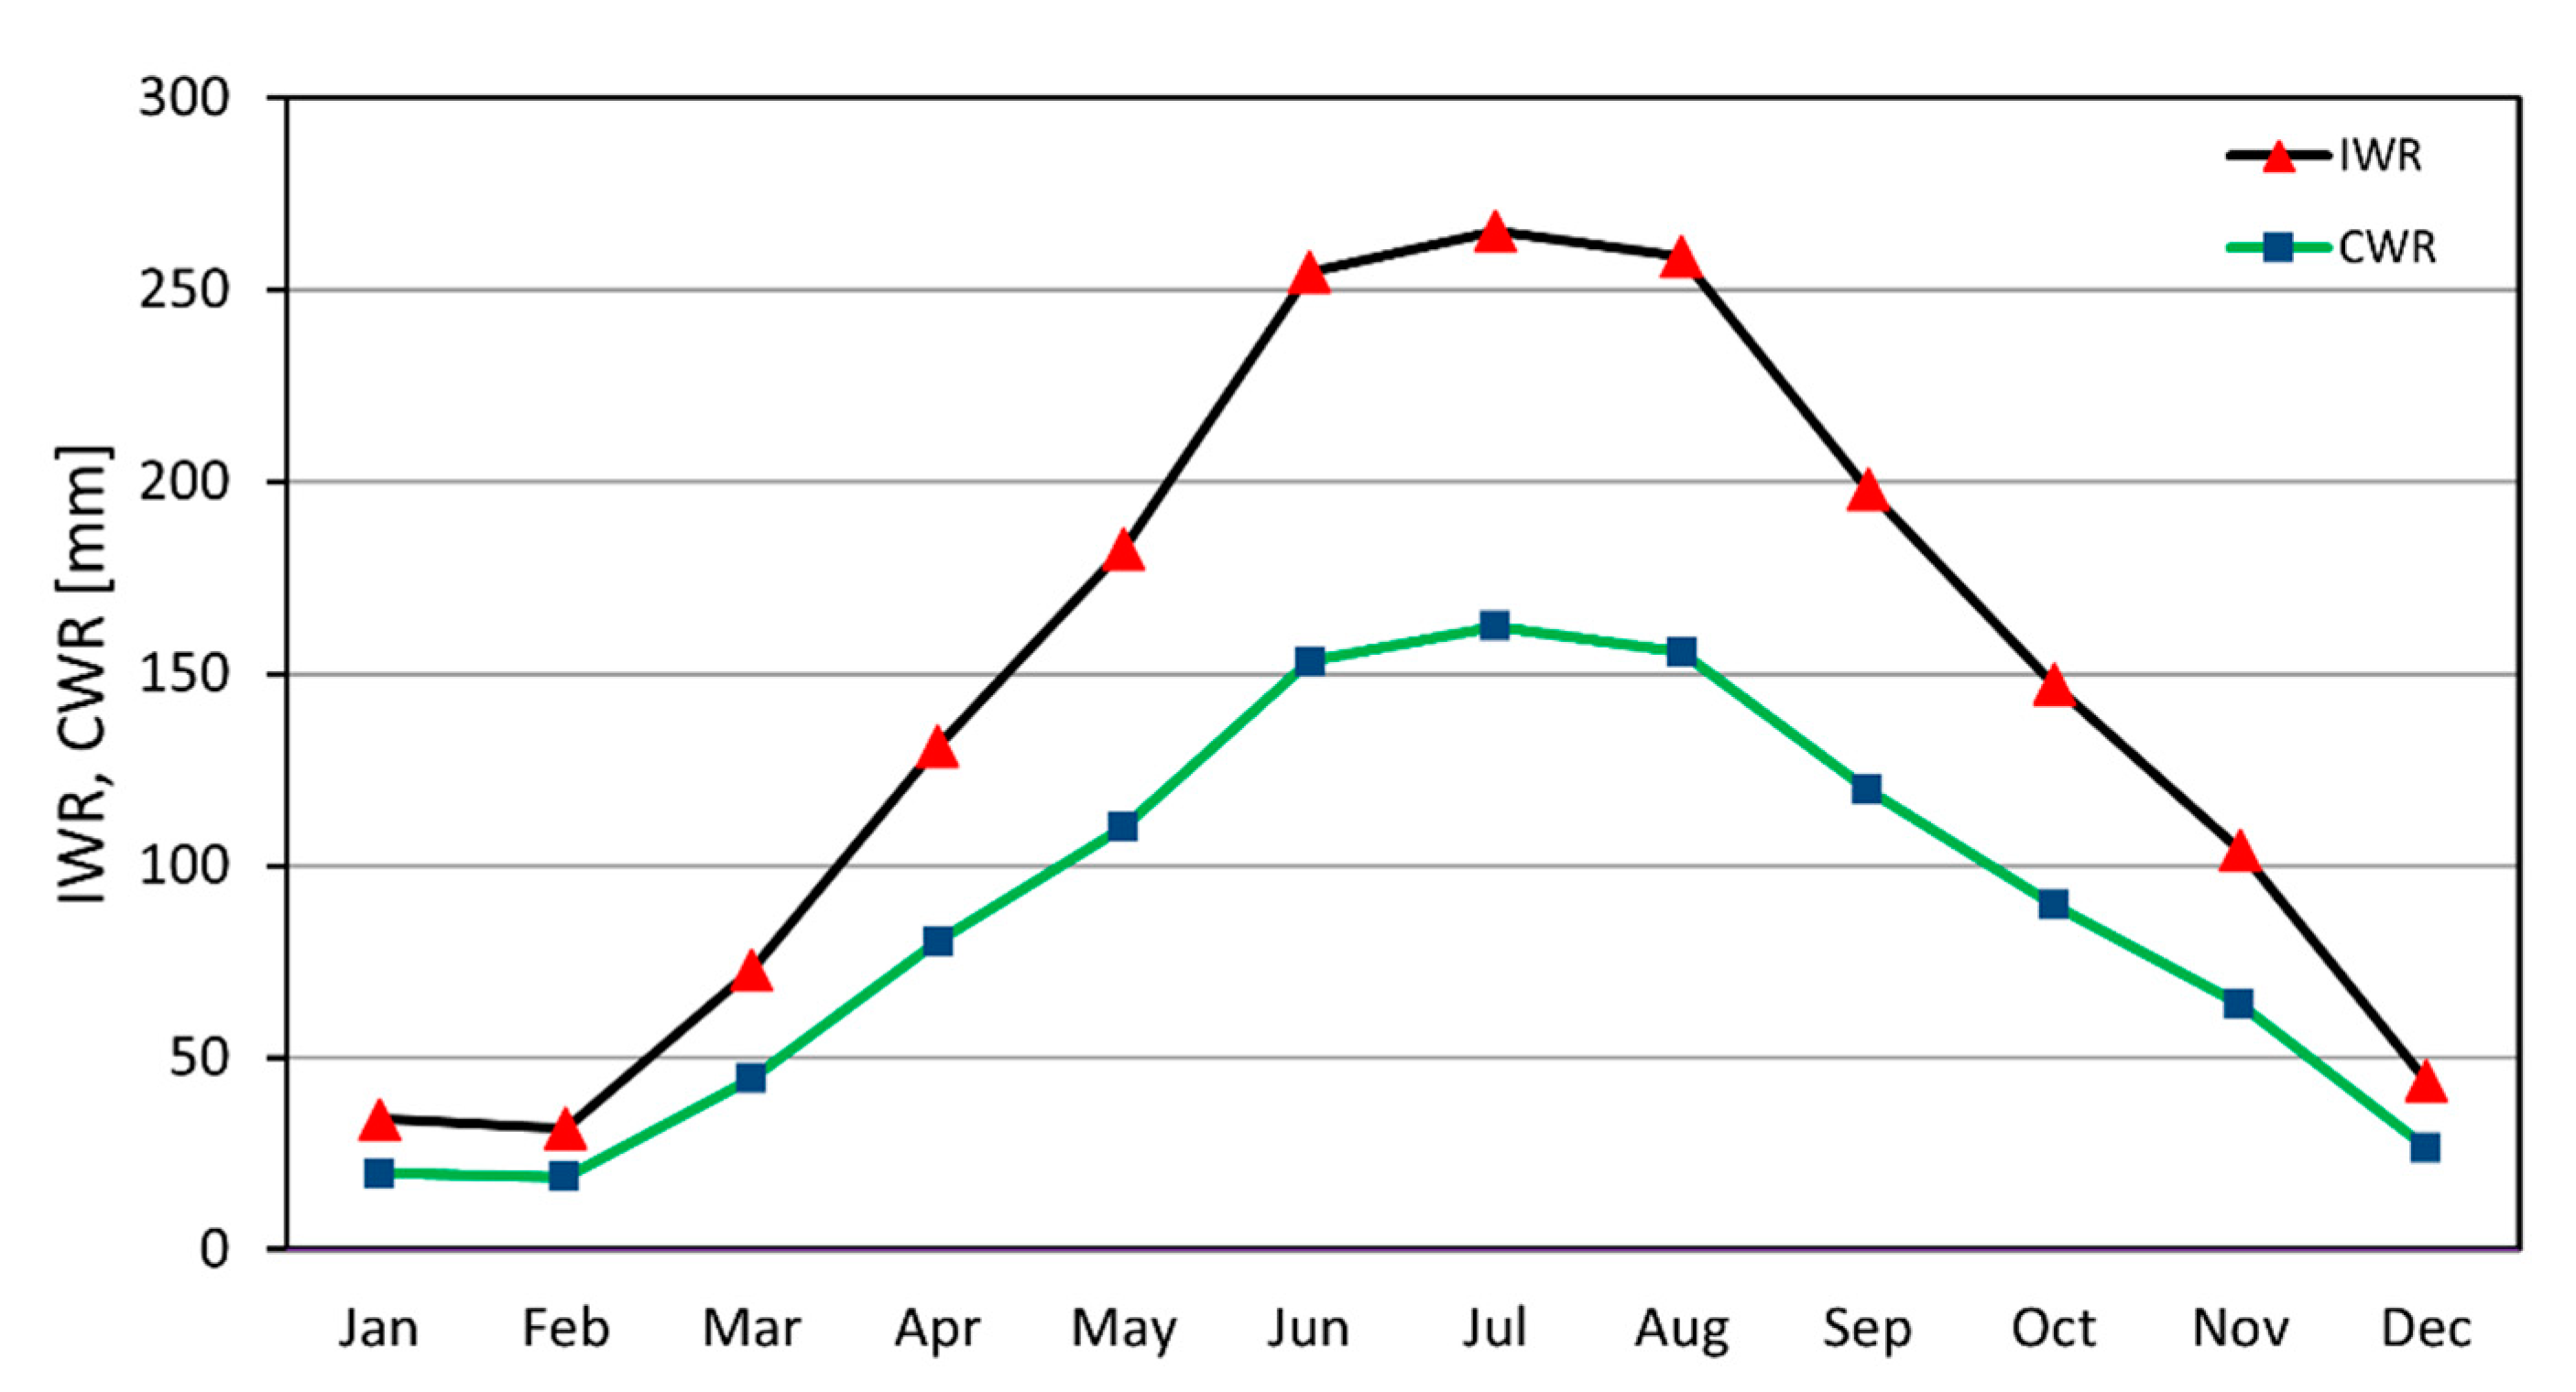
1.2. The Concept of Water Shortage Probability (WSP)
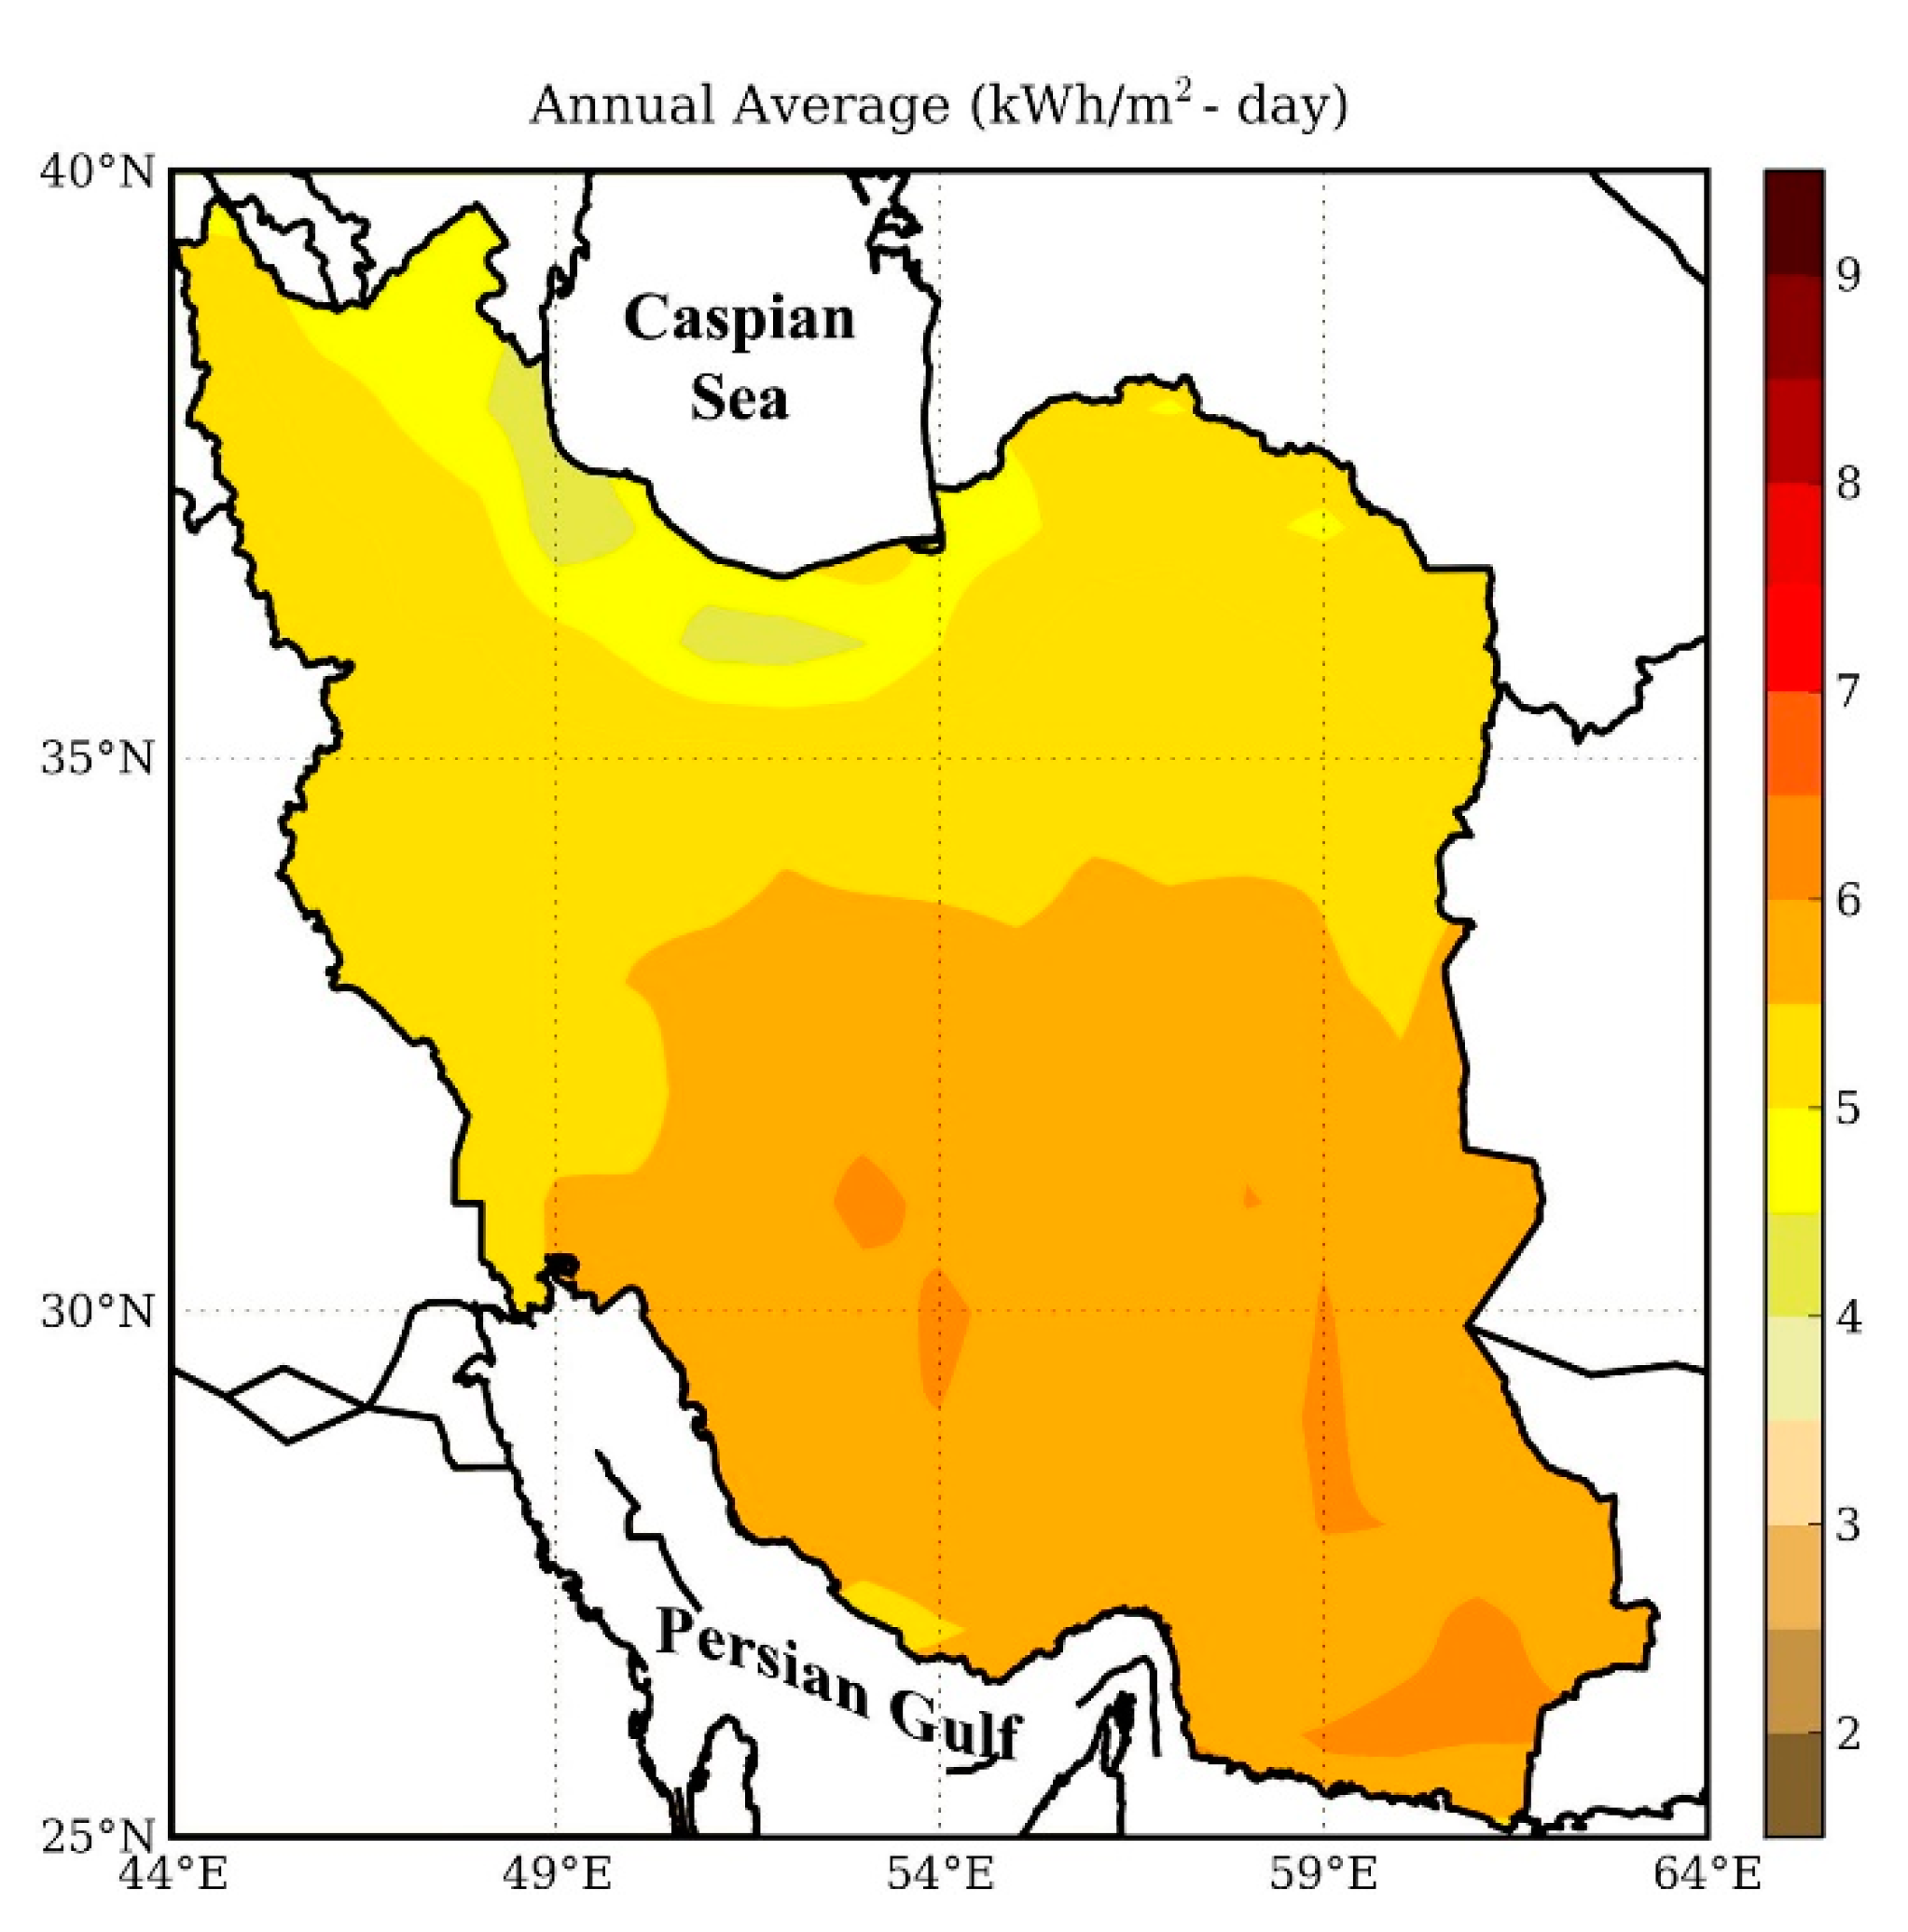
1.3. Photovoltaic Electricity in Iran
1.4. Aim of This Study
1.5. Principal Contributions of This Study
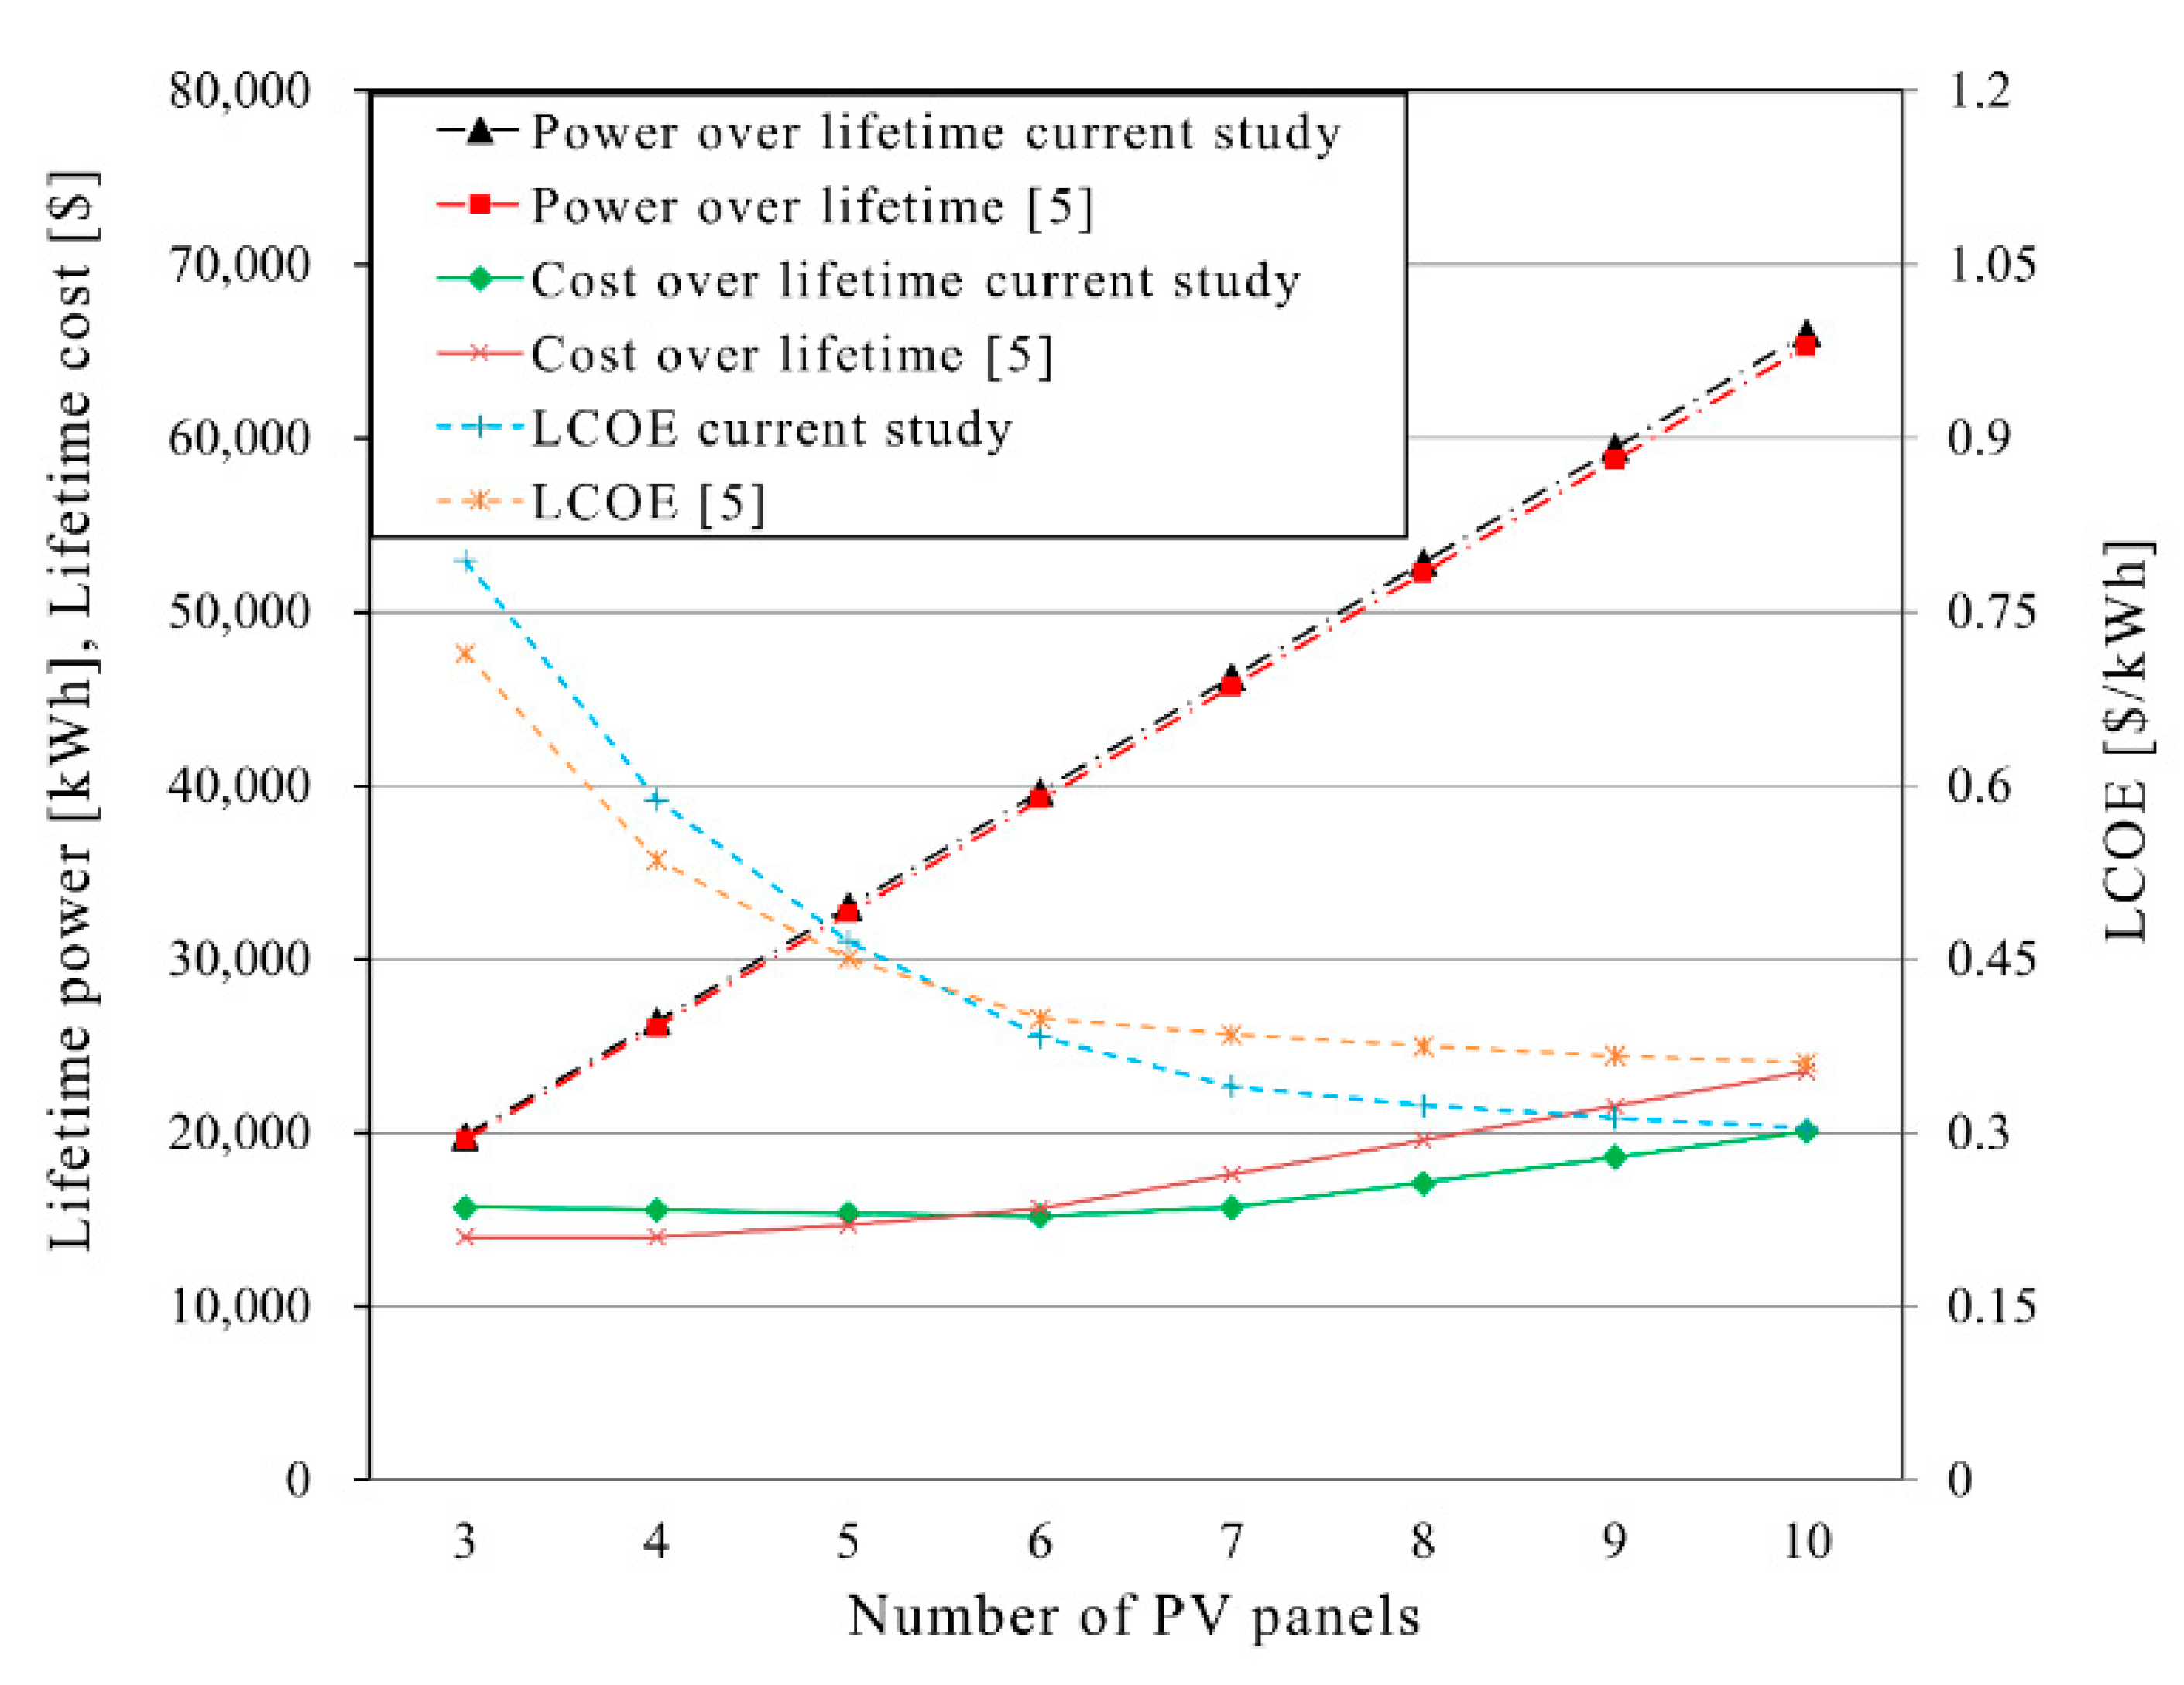
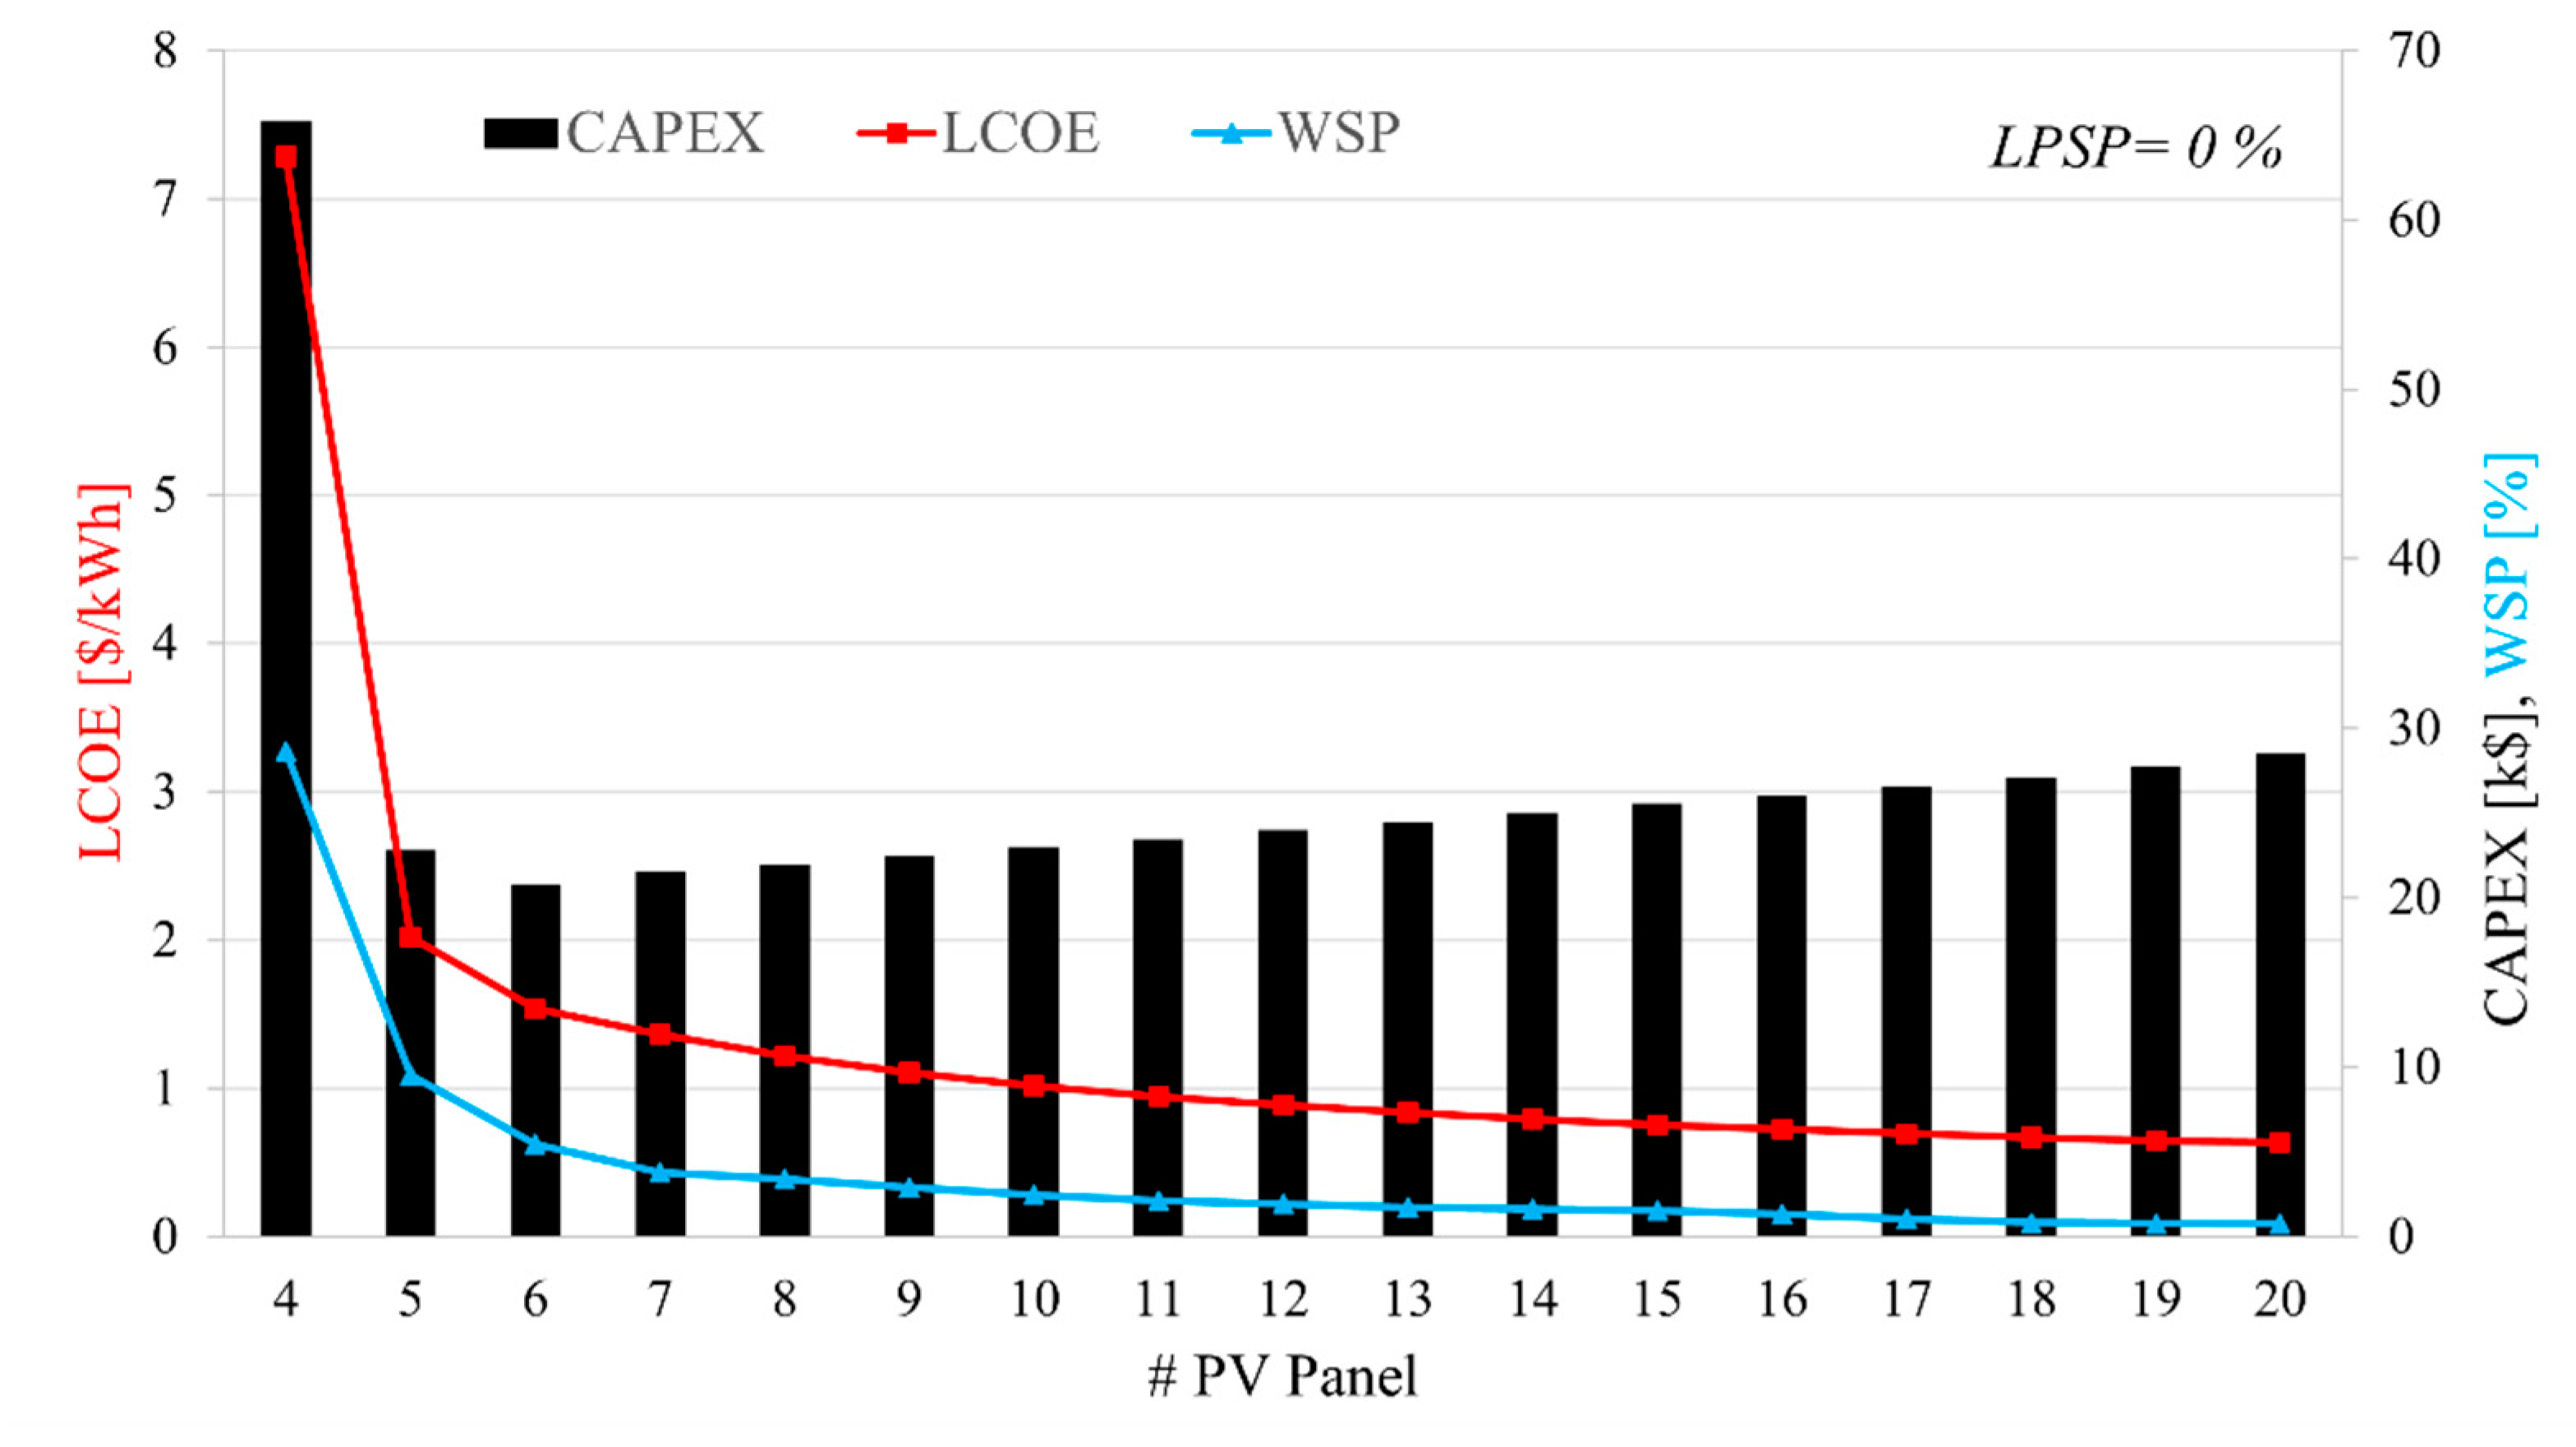
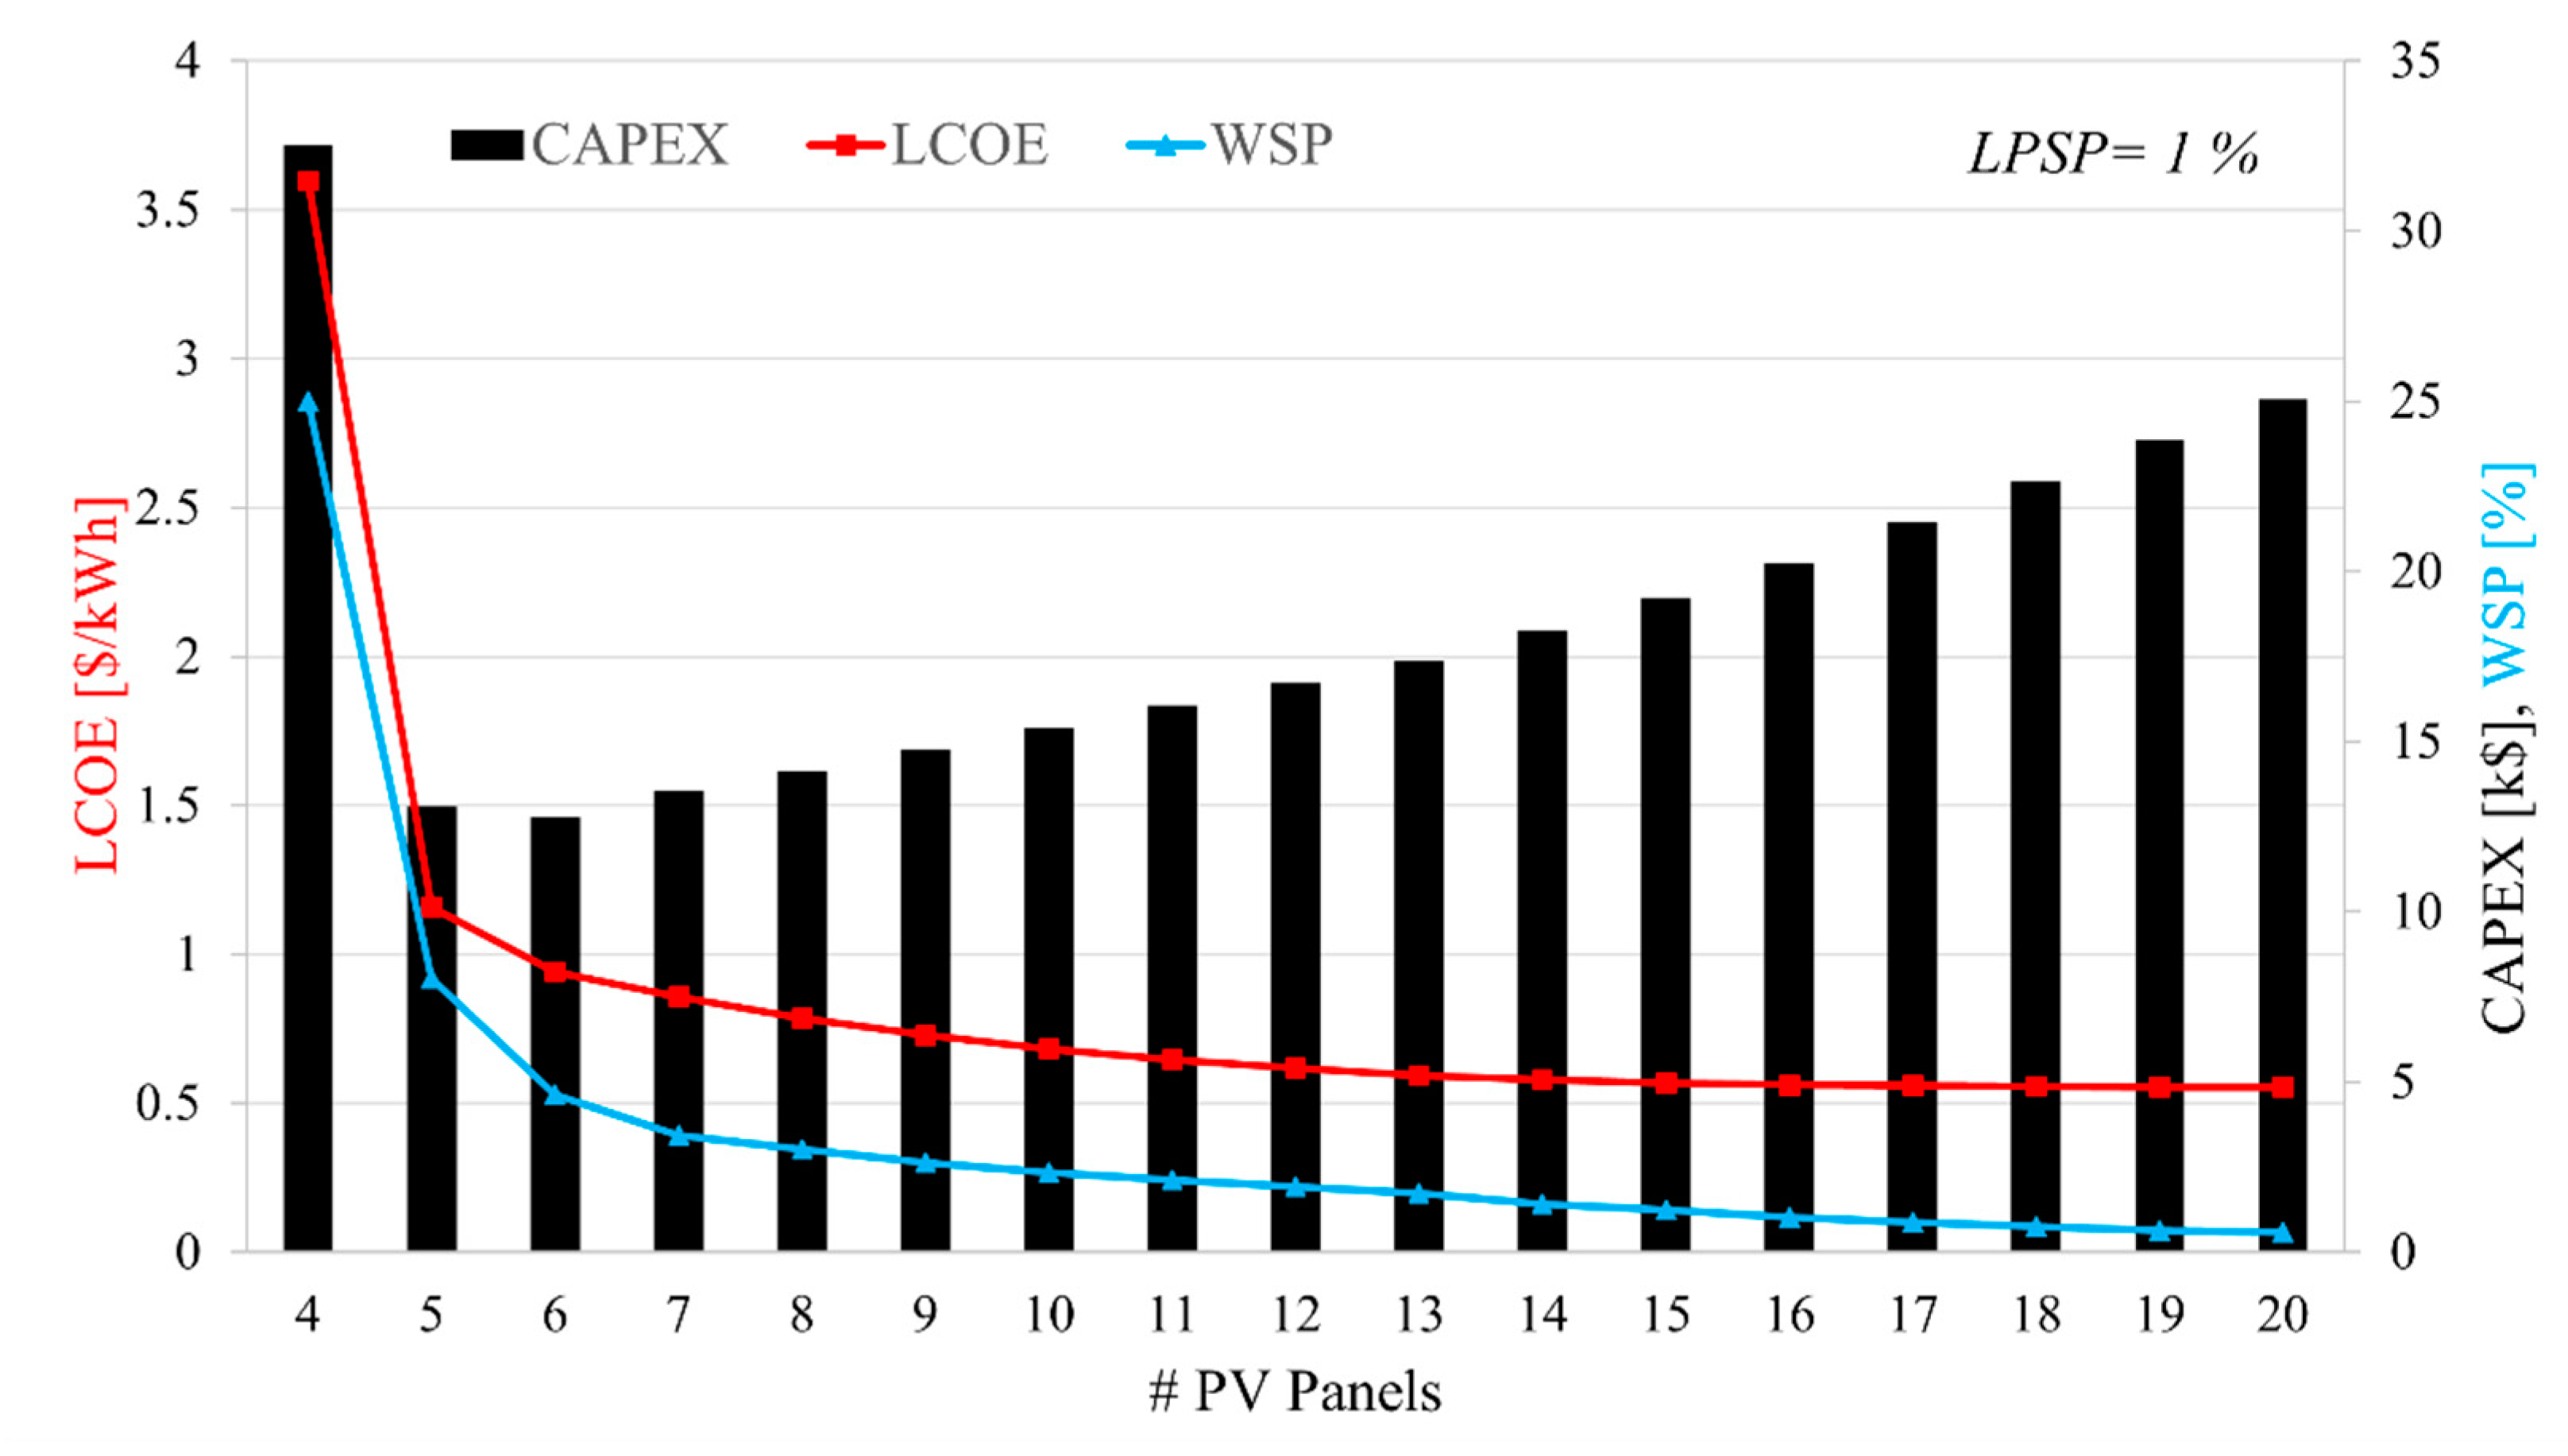
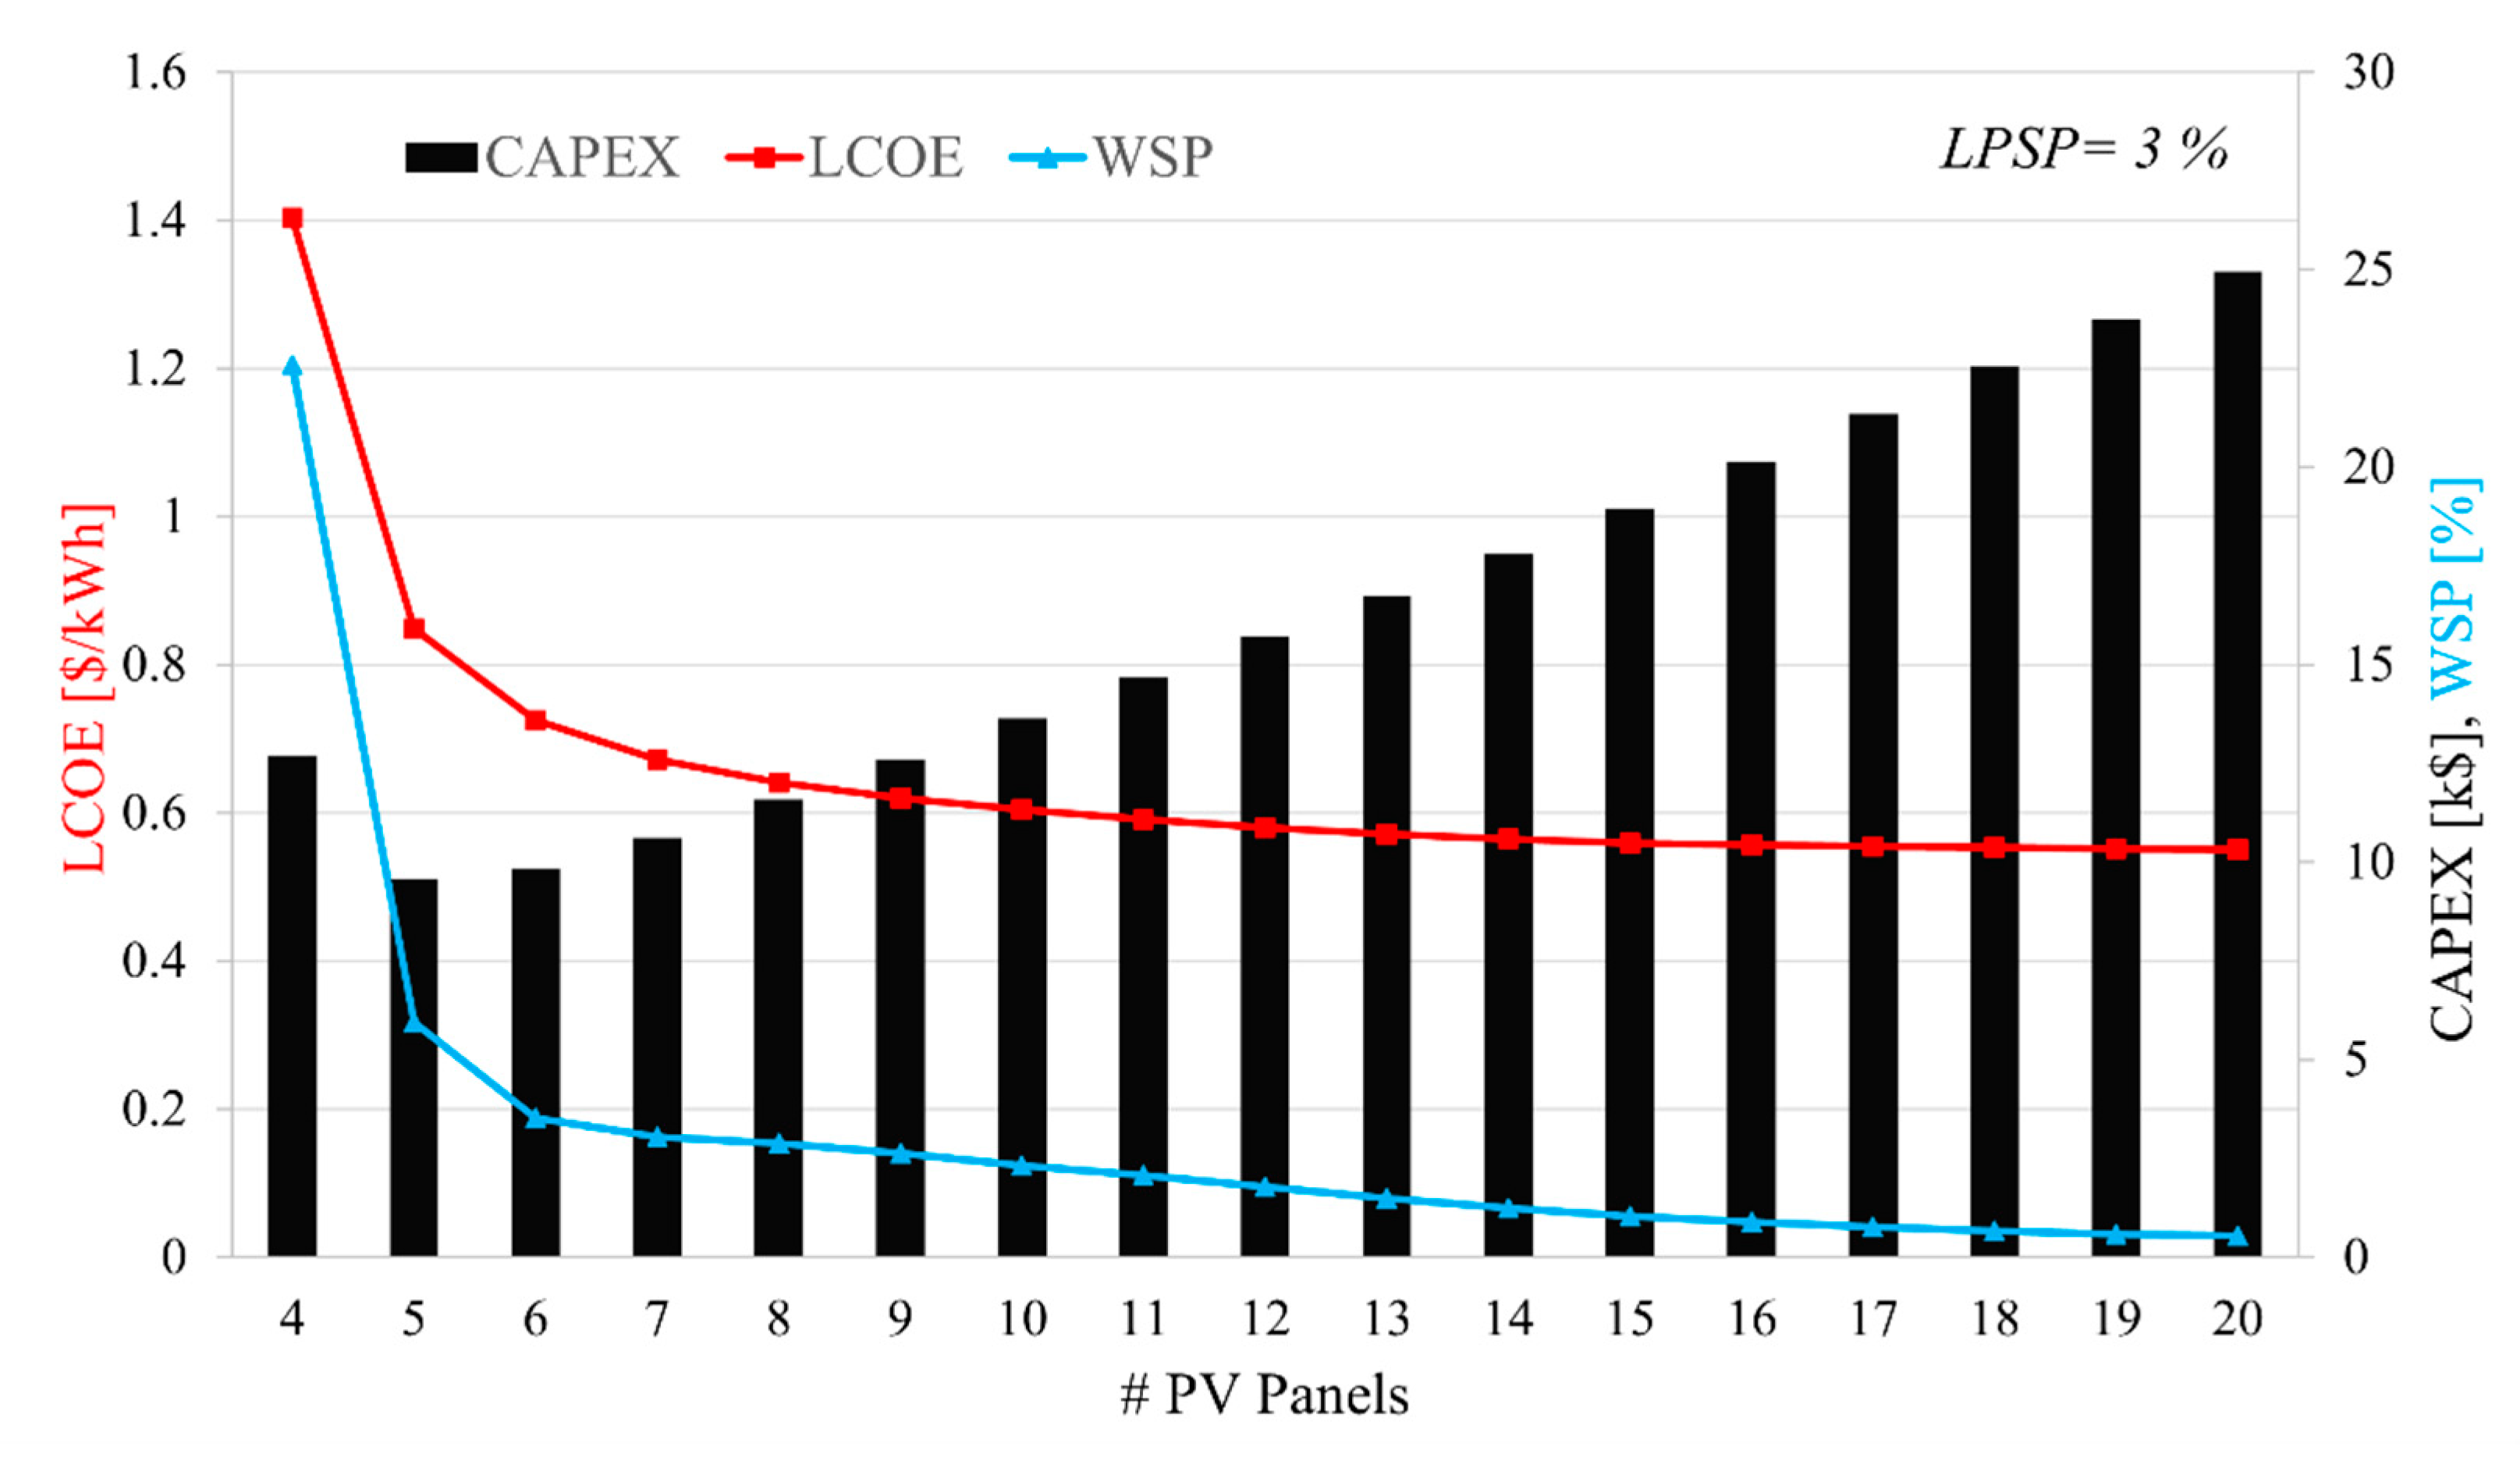
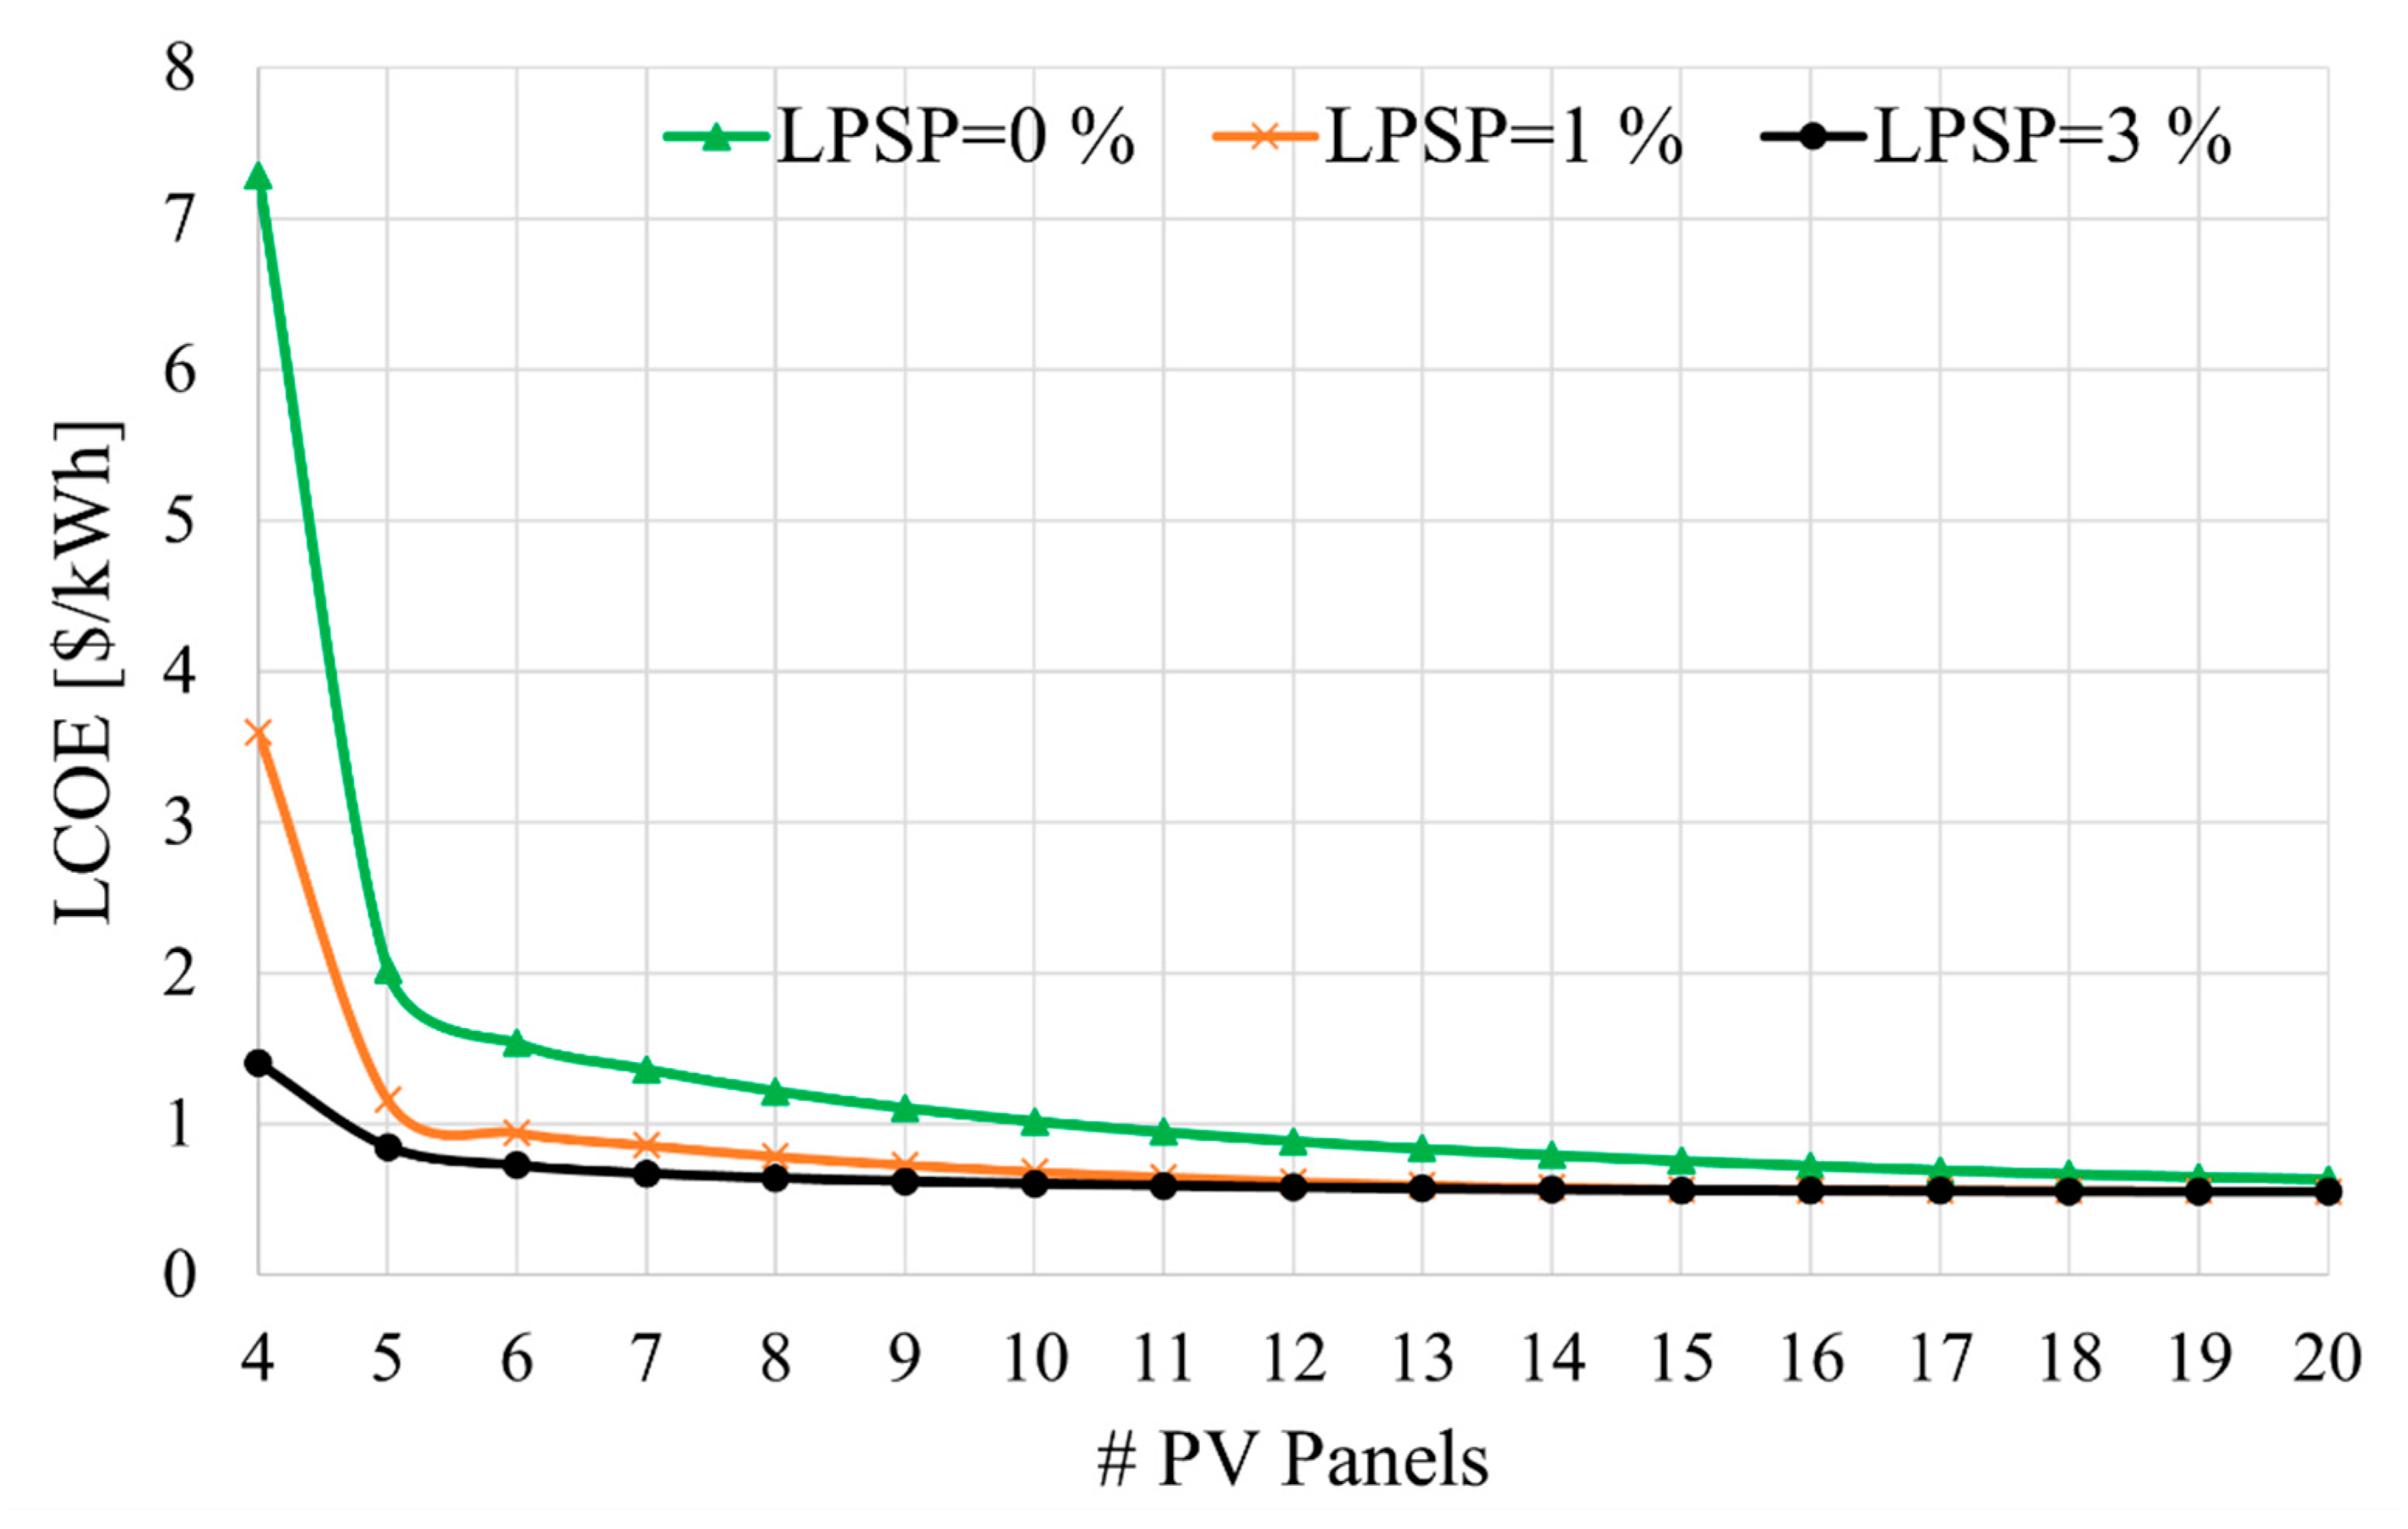
- A comparison of different LPSPs shows that a small increase in tolerance for power loss can considerably lower the size, the CAPEX, and the LCOE of the system with limited change in water shortage probabilities. This suggests that communities and/or dwellings with limited financial capabilities should consider complementary strategies to avoid running out of water for irrigation.
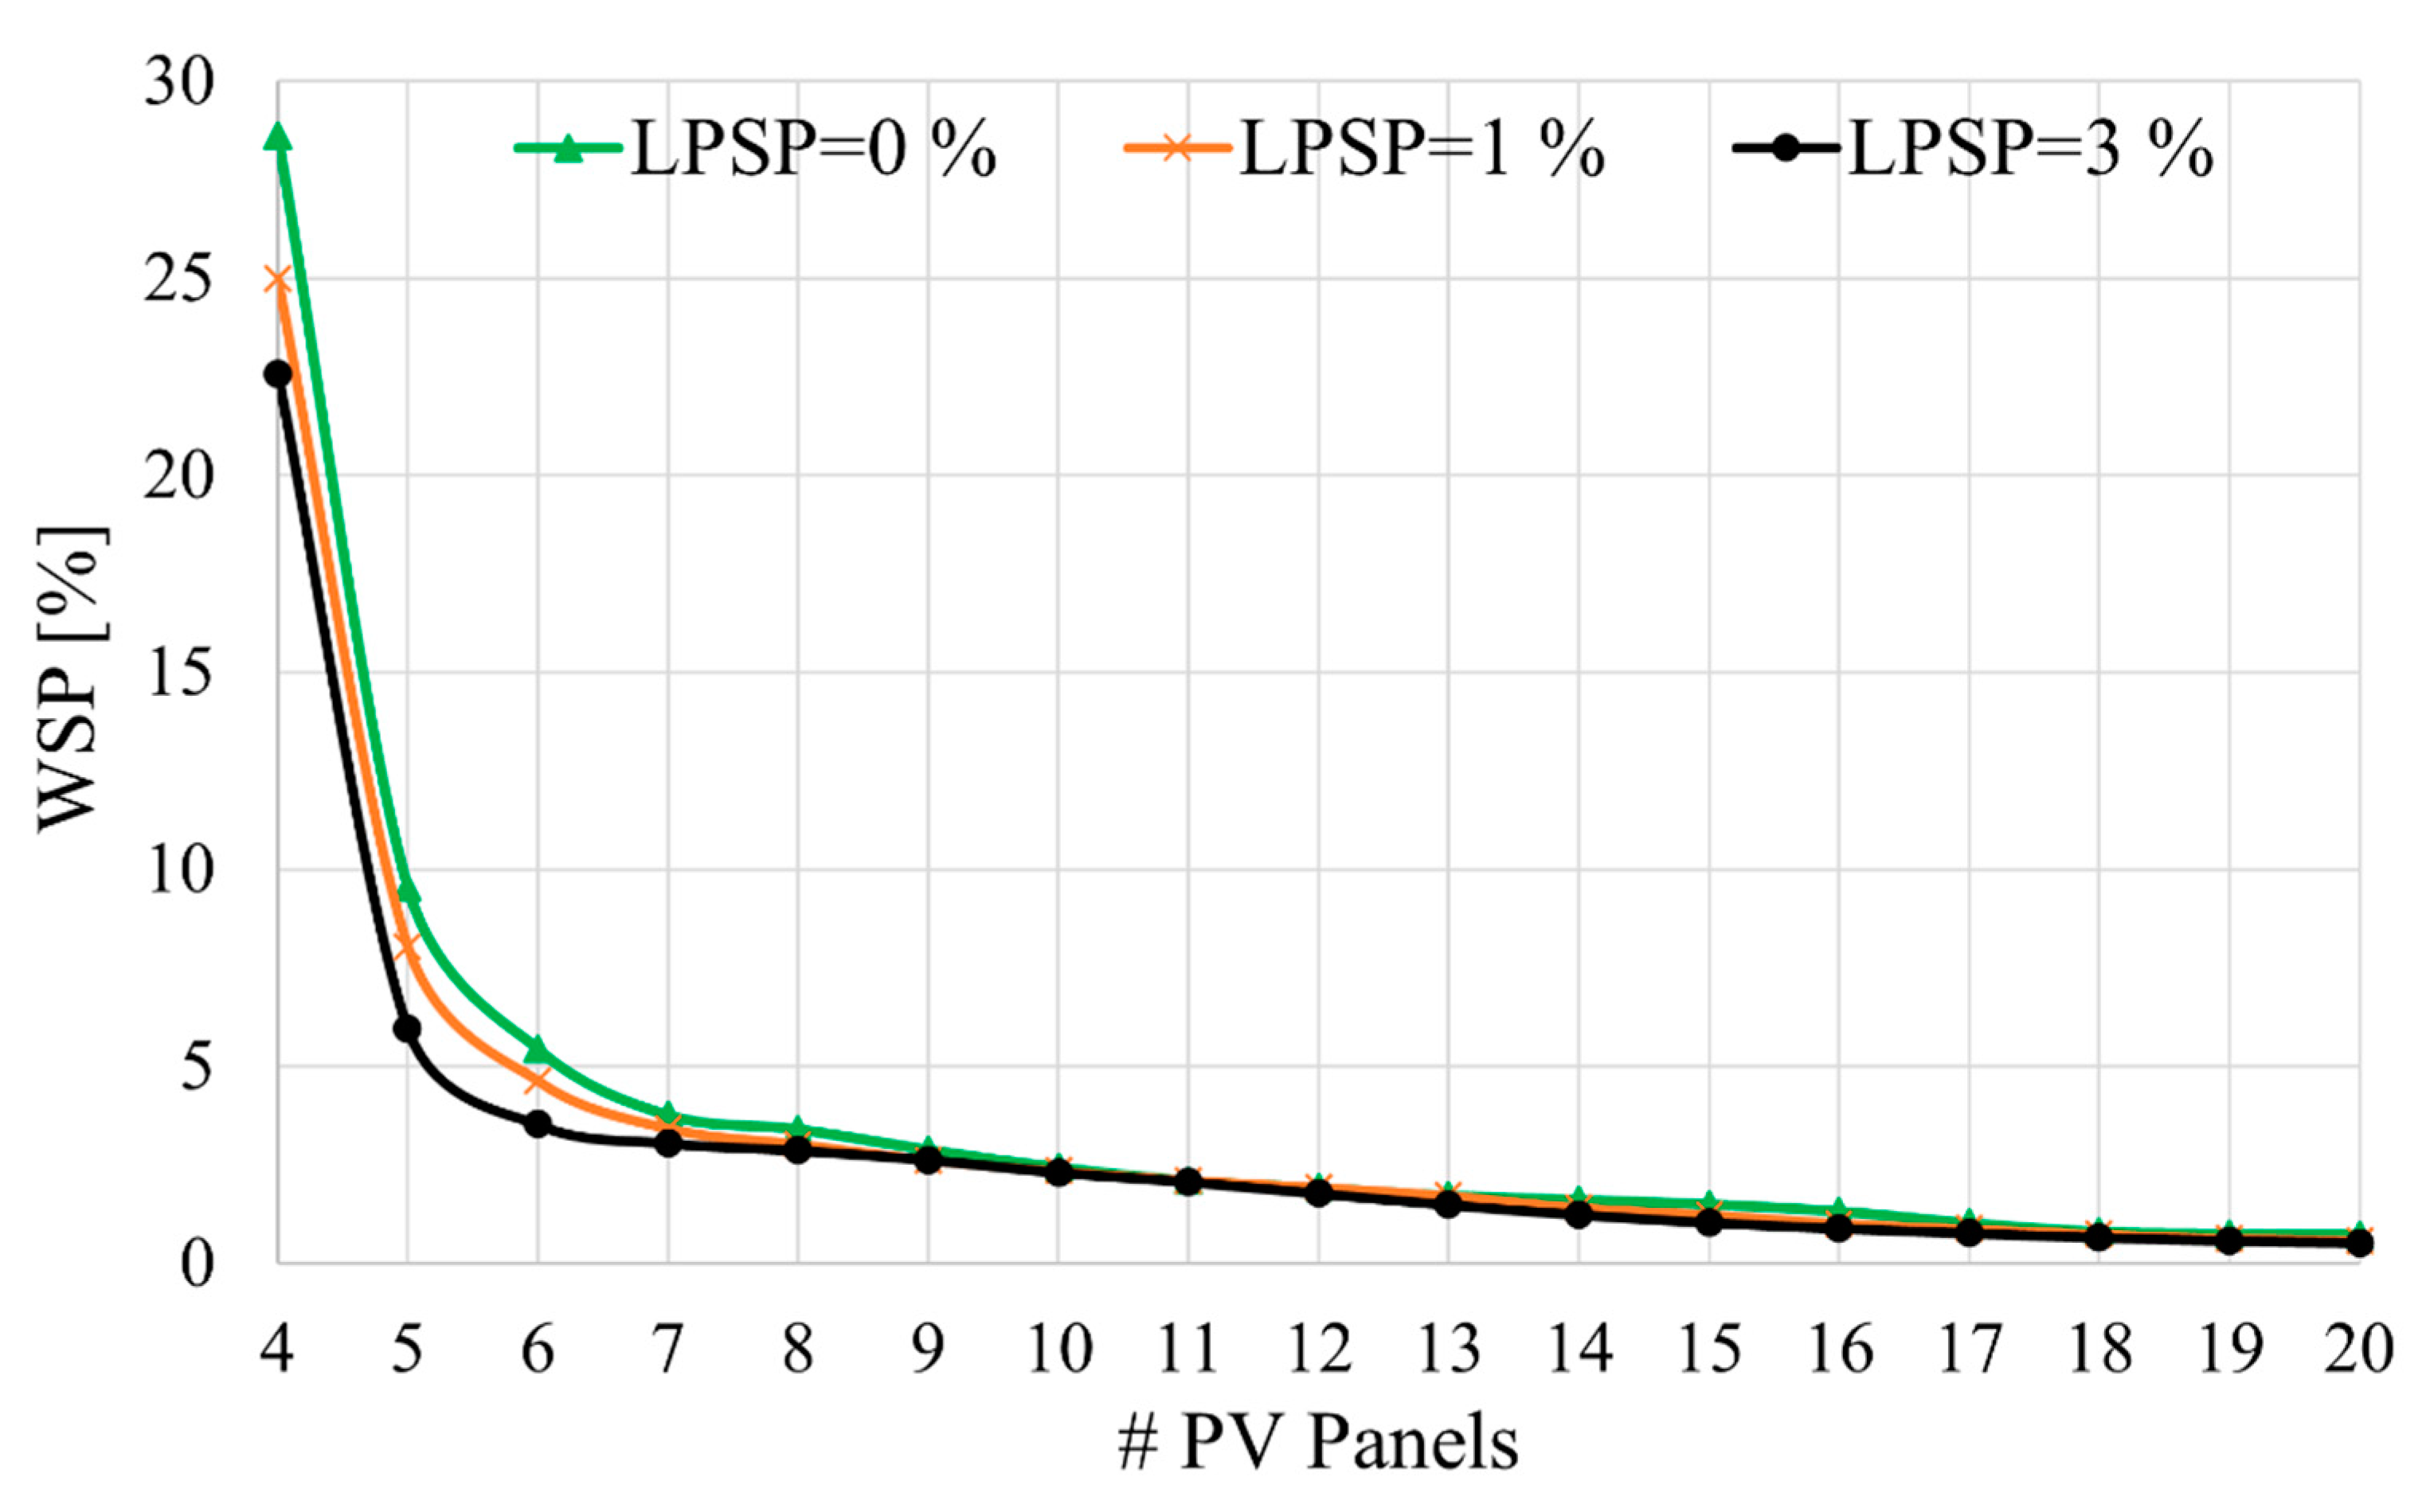
- The WSP could go lower with higher LPSP because more water could be pumped into the tank when people can tolerate power shortages.
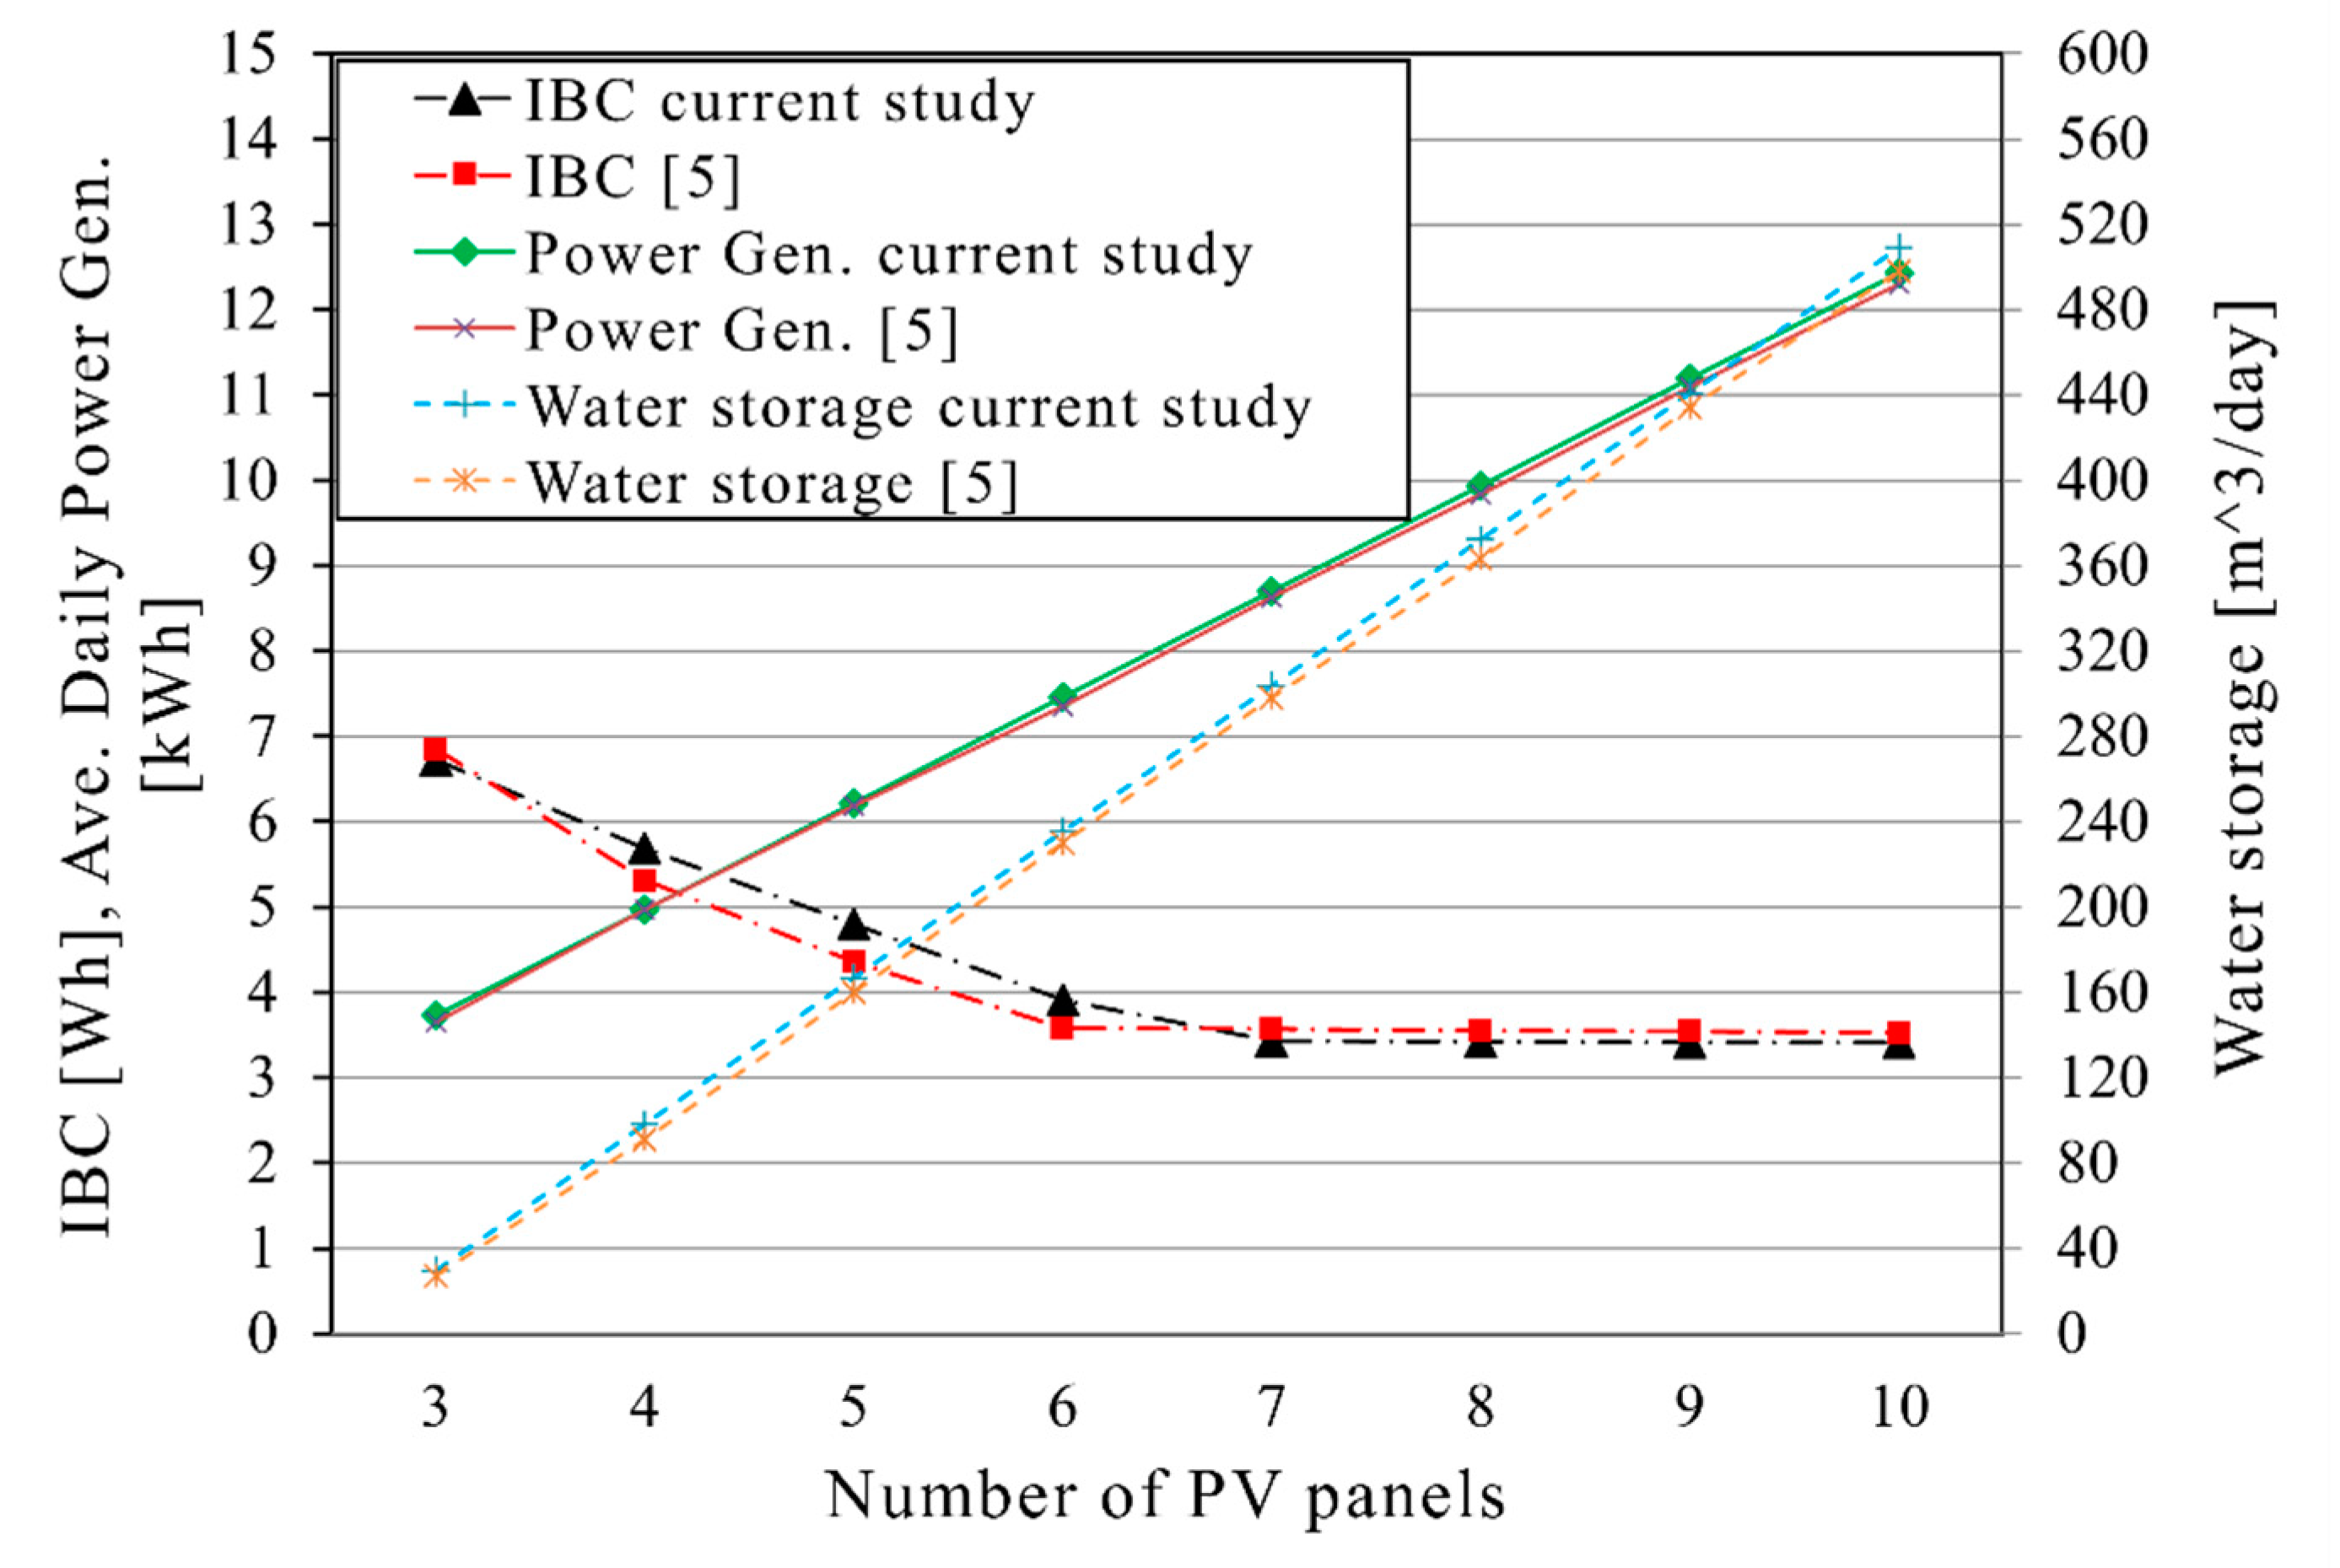
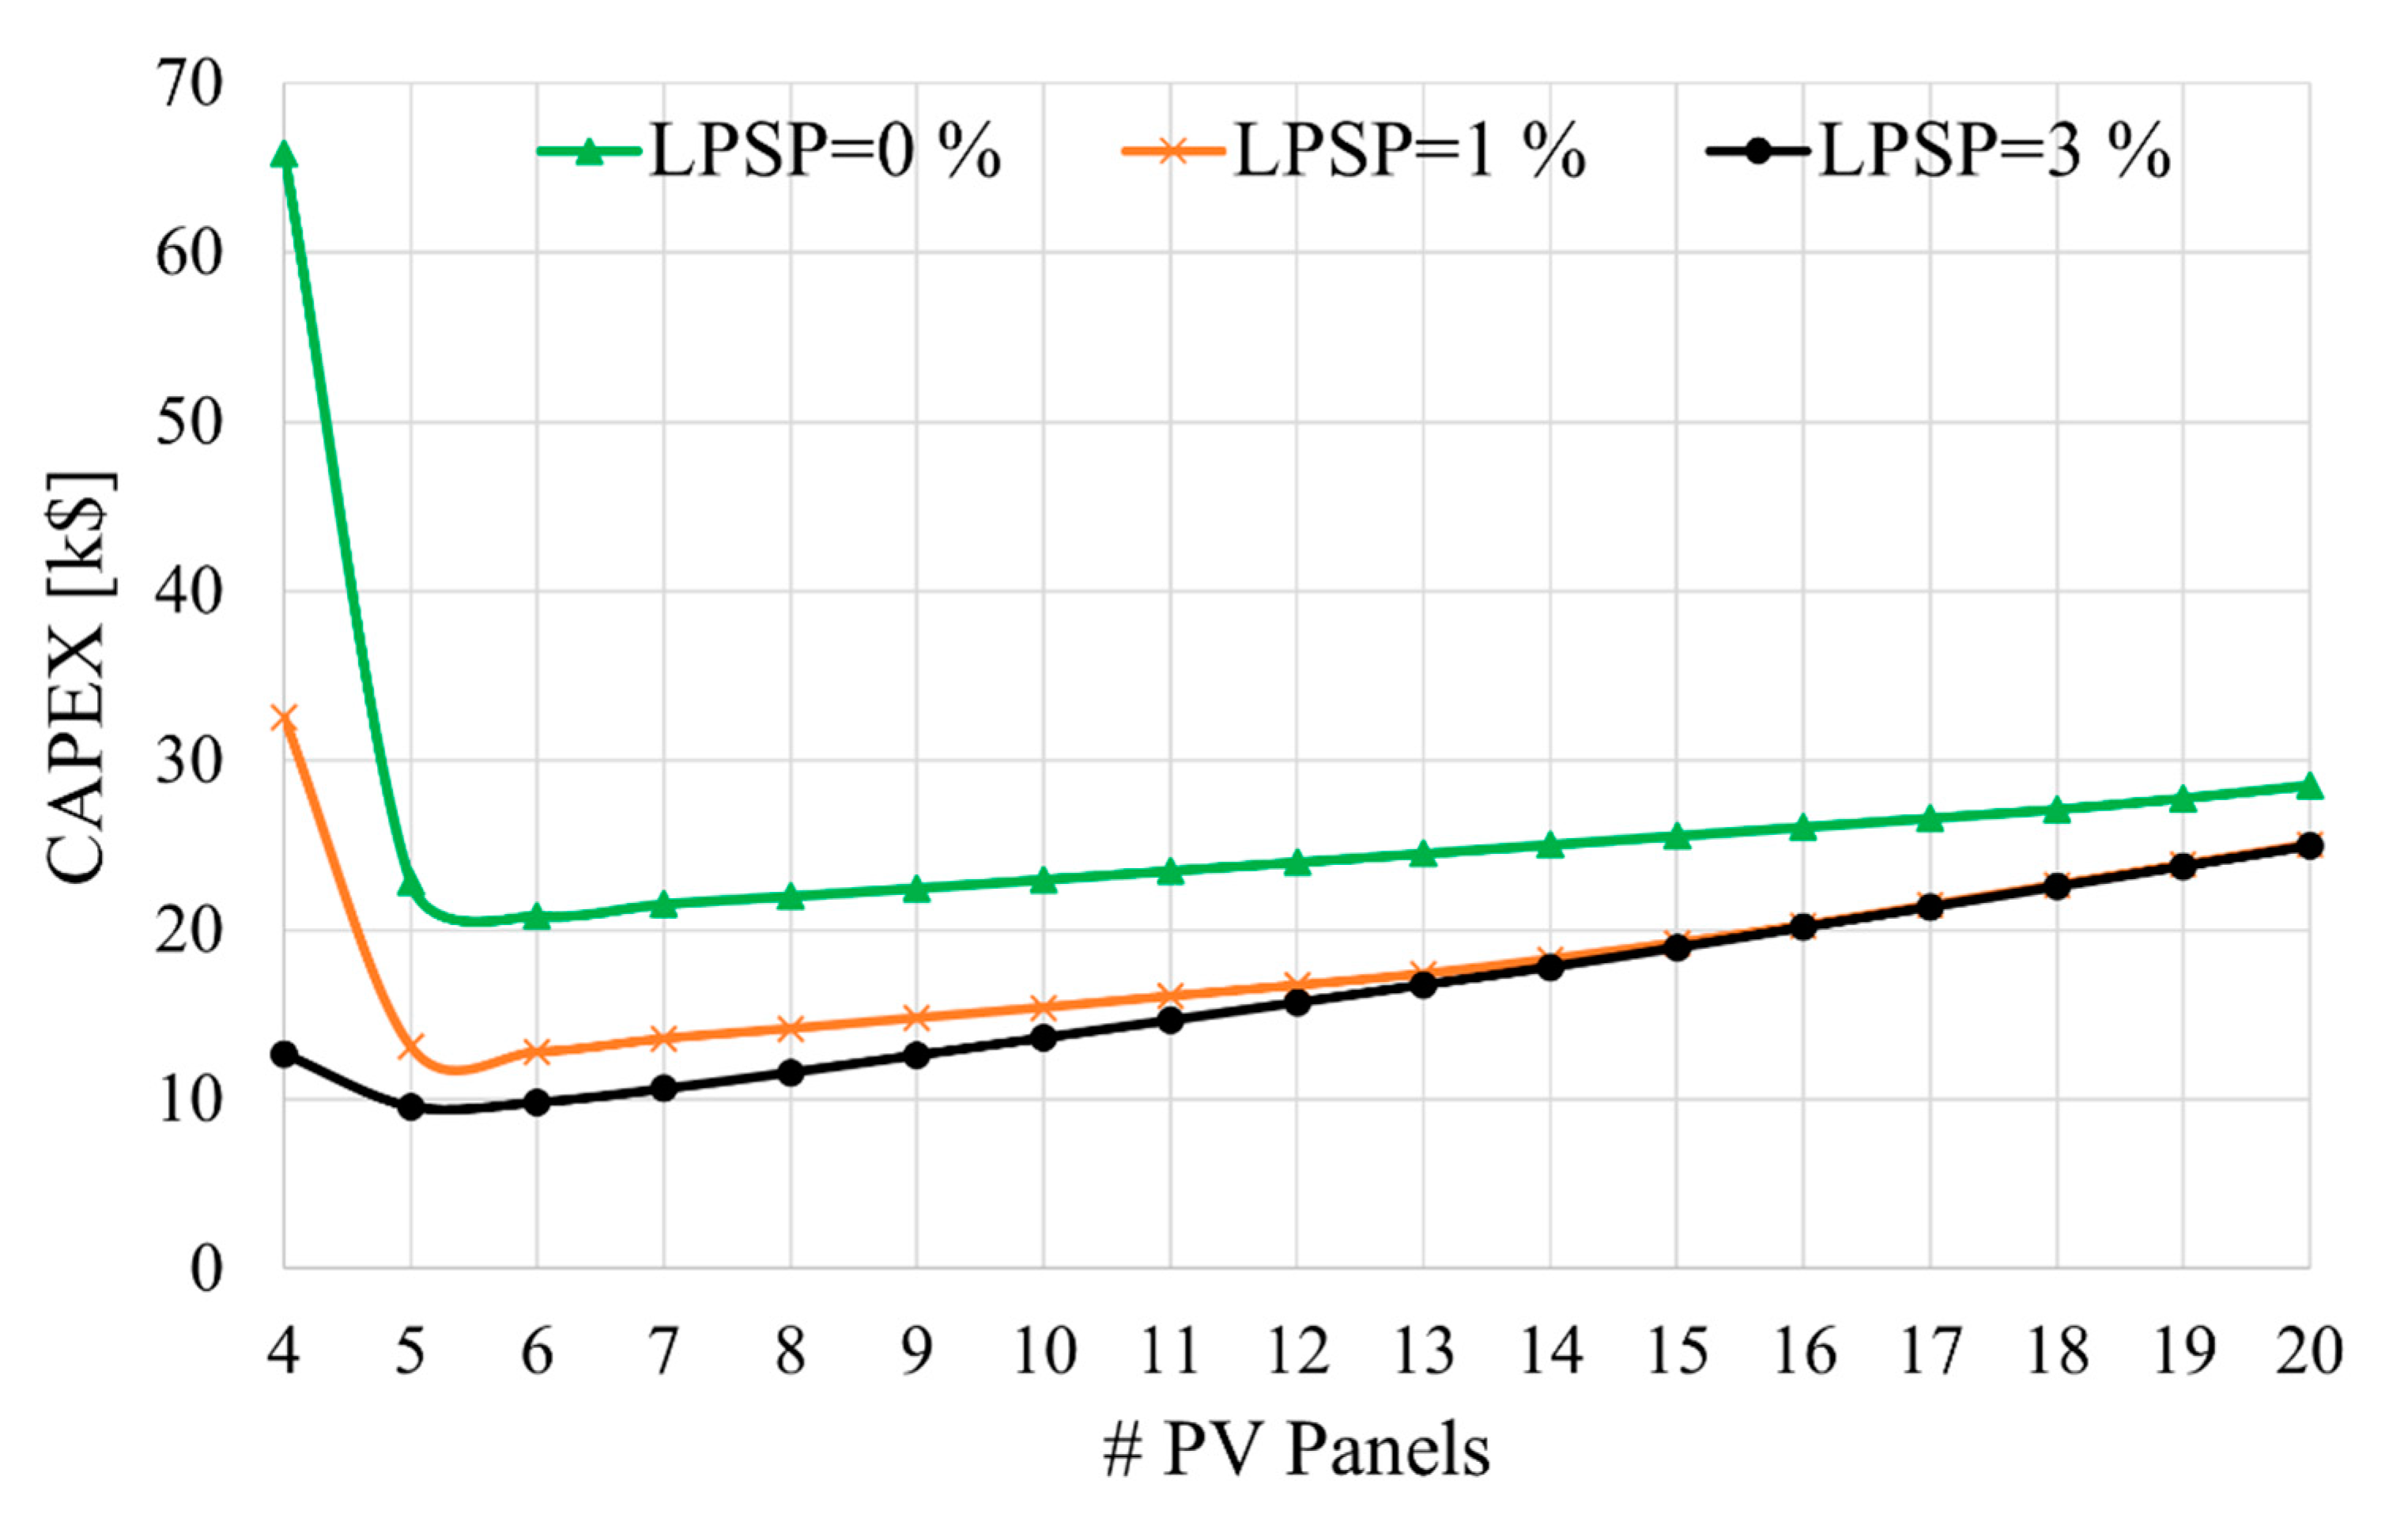
- There is a minimum in the curve that plots the CAPEX with respect to the number of PV panels in the system where limited variations of WSP and LCOE happen with further increases in the number of PV panels and that for any LPSP. This is due to the battery bank requirement rapid increase below the minimal number of panels which are less expensive. For the current study, this is about 5 to 6 panels.
- Overall, the main findings are that the success of a project will depend on the resilience of the population combined with its financial capacity.
2. Methodology
2.1. Mathematical Modeling
2.1.1. Basic Solar Mathematical Model
2.1.2. Electricity Production Model
2.1.3. Water Pumping Model
2.1.4. Reliability Models for Power and Water
2.1.5. Financial Model
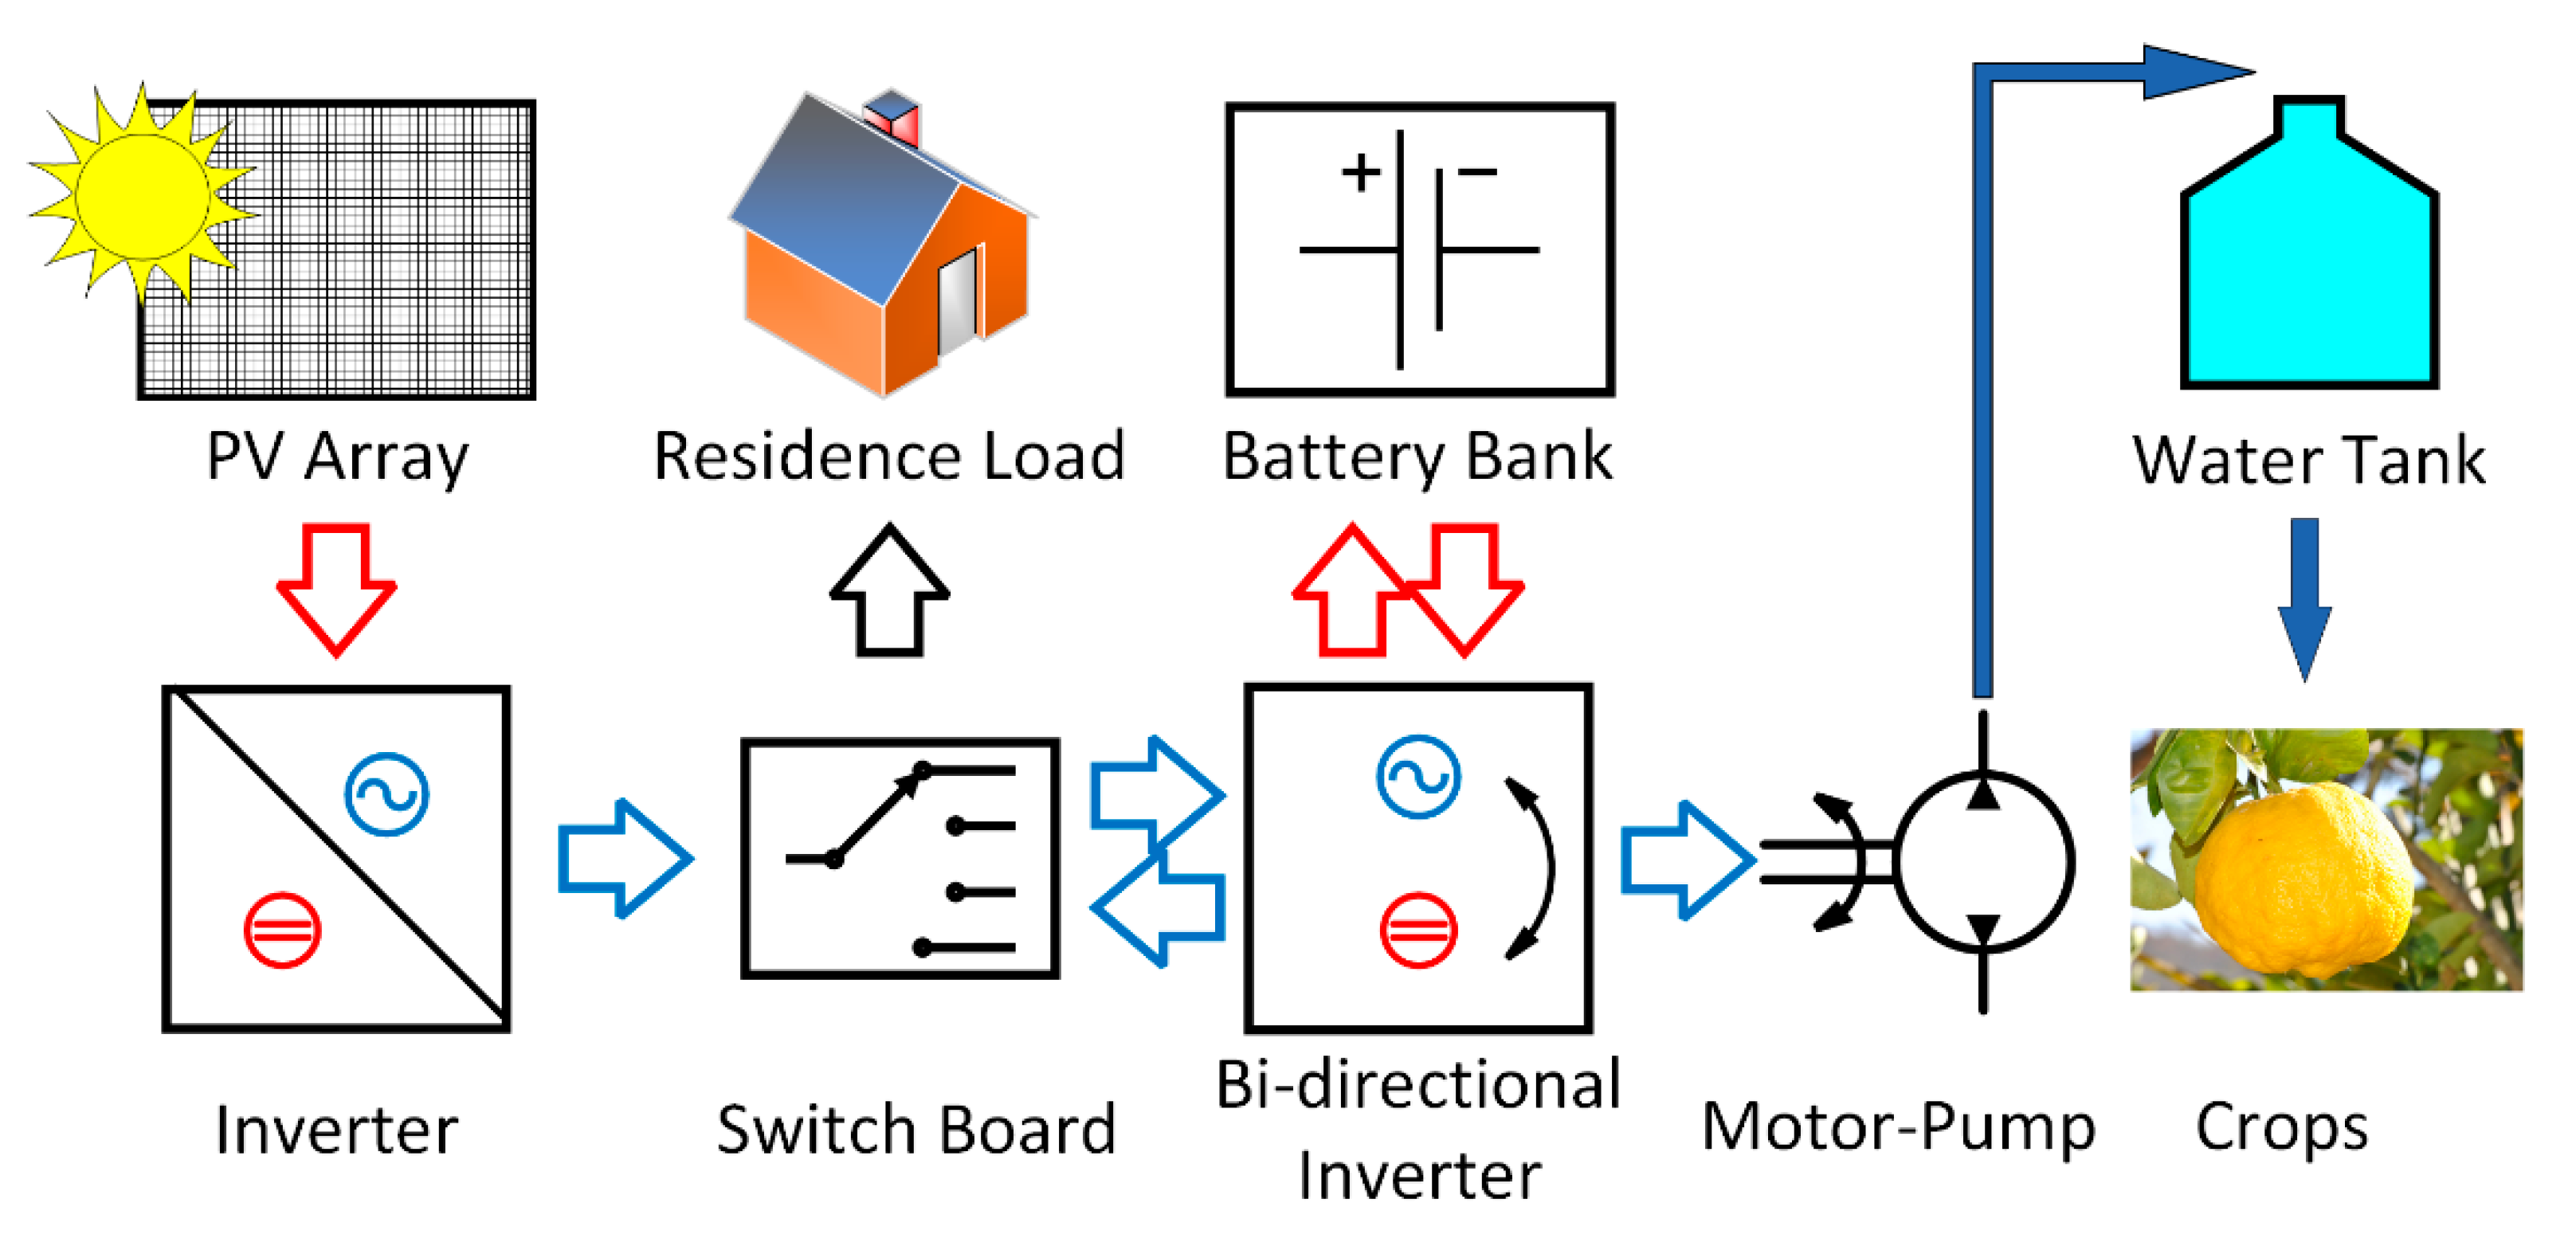
2.2. Schematic of the Solar Irrigation System
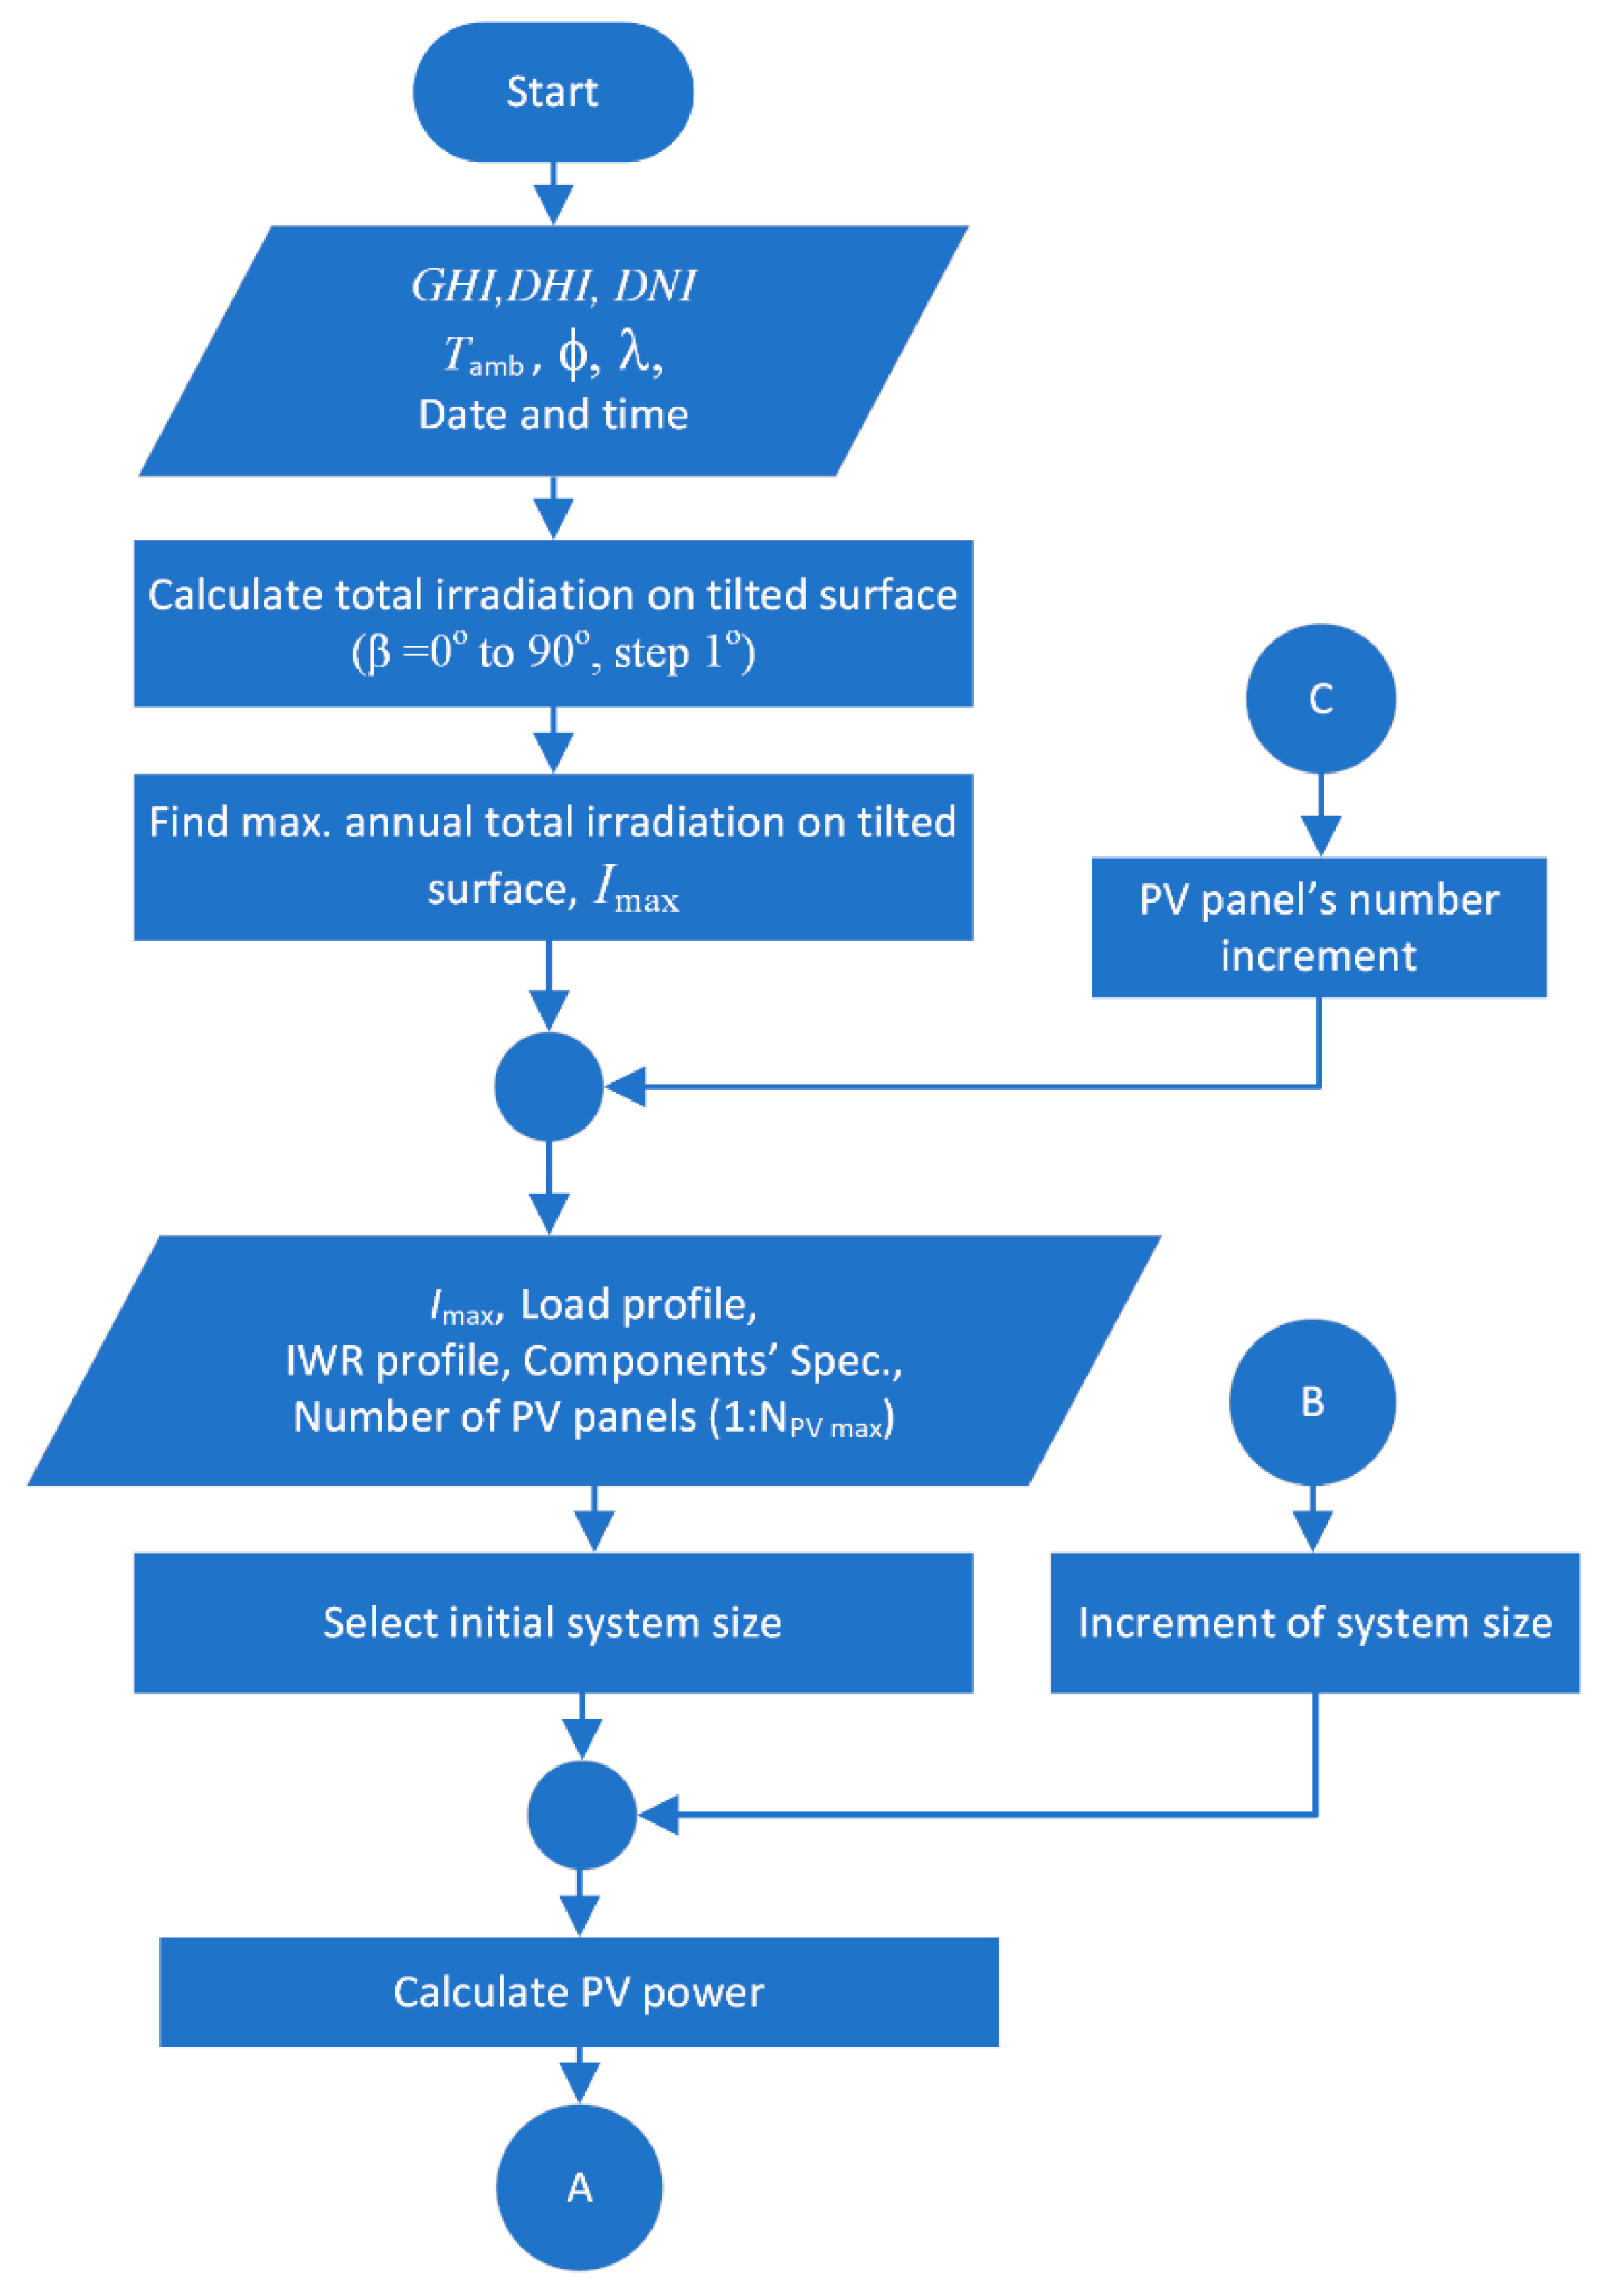
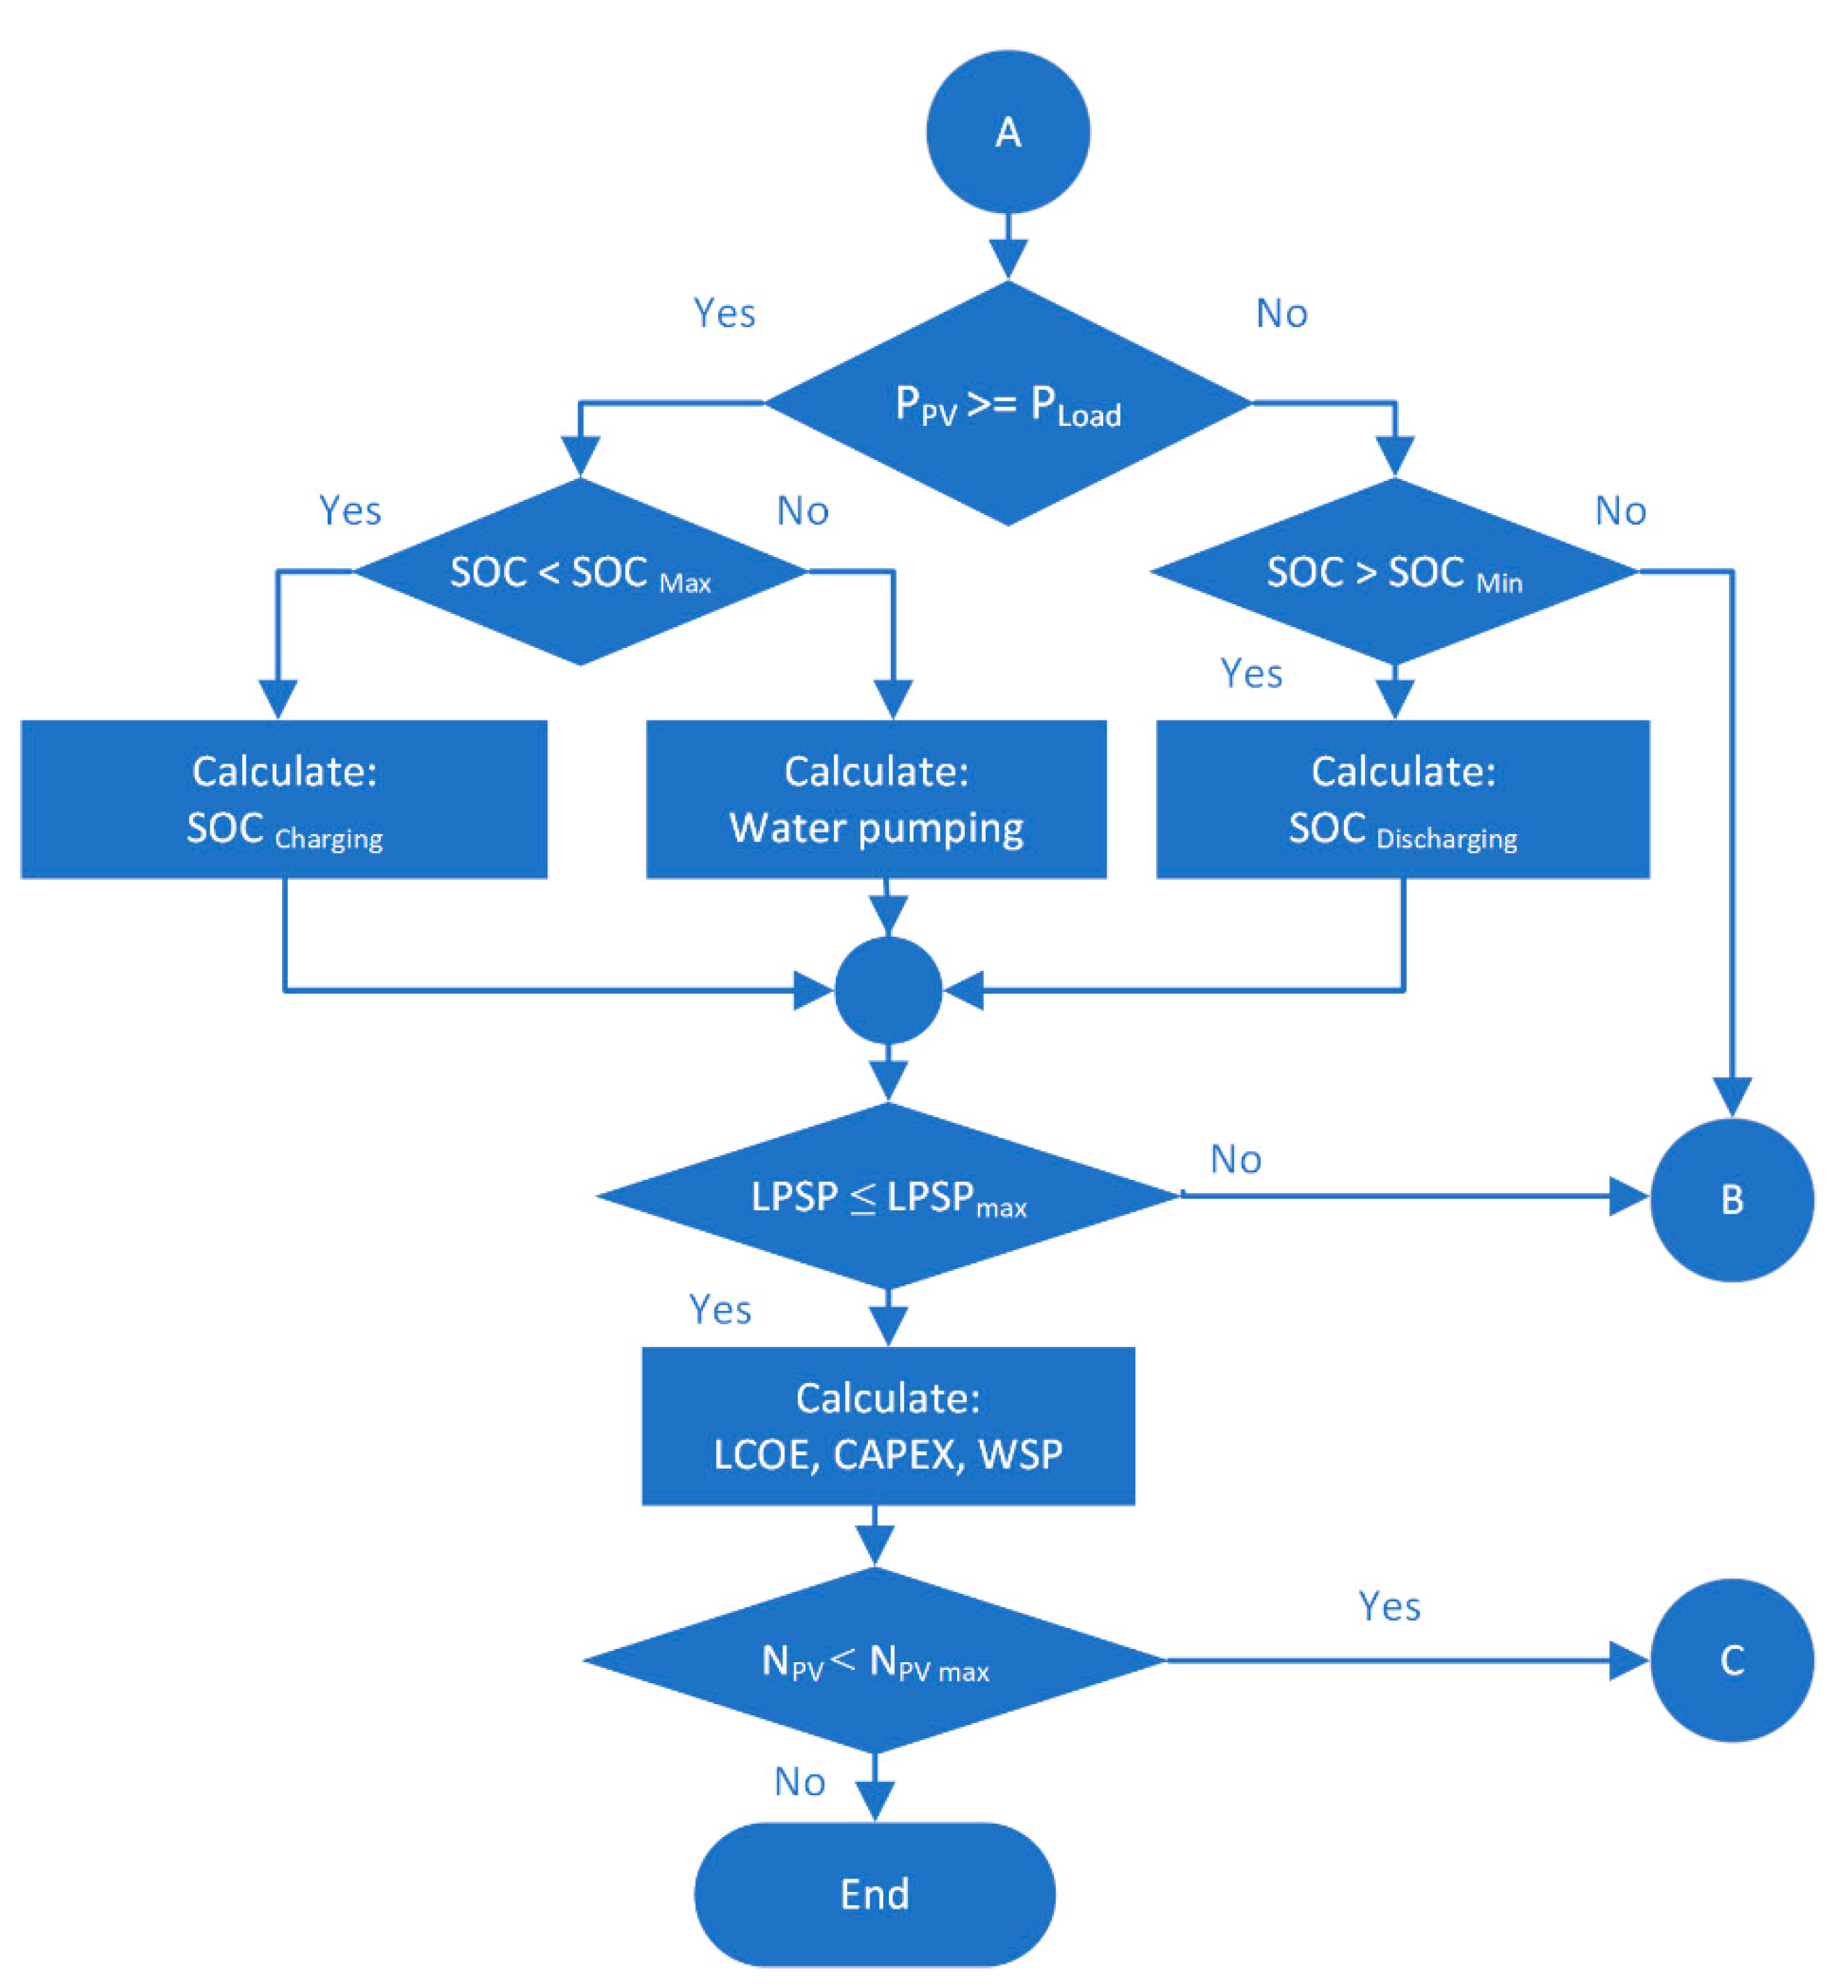
2.3. Algorithm of the Prediction Model
2.4. Specification of Components
2.5. Validation
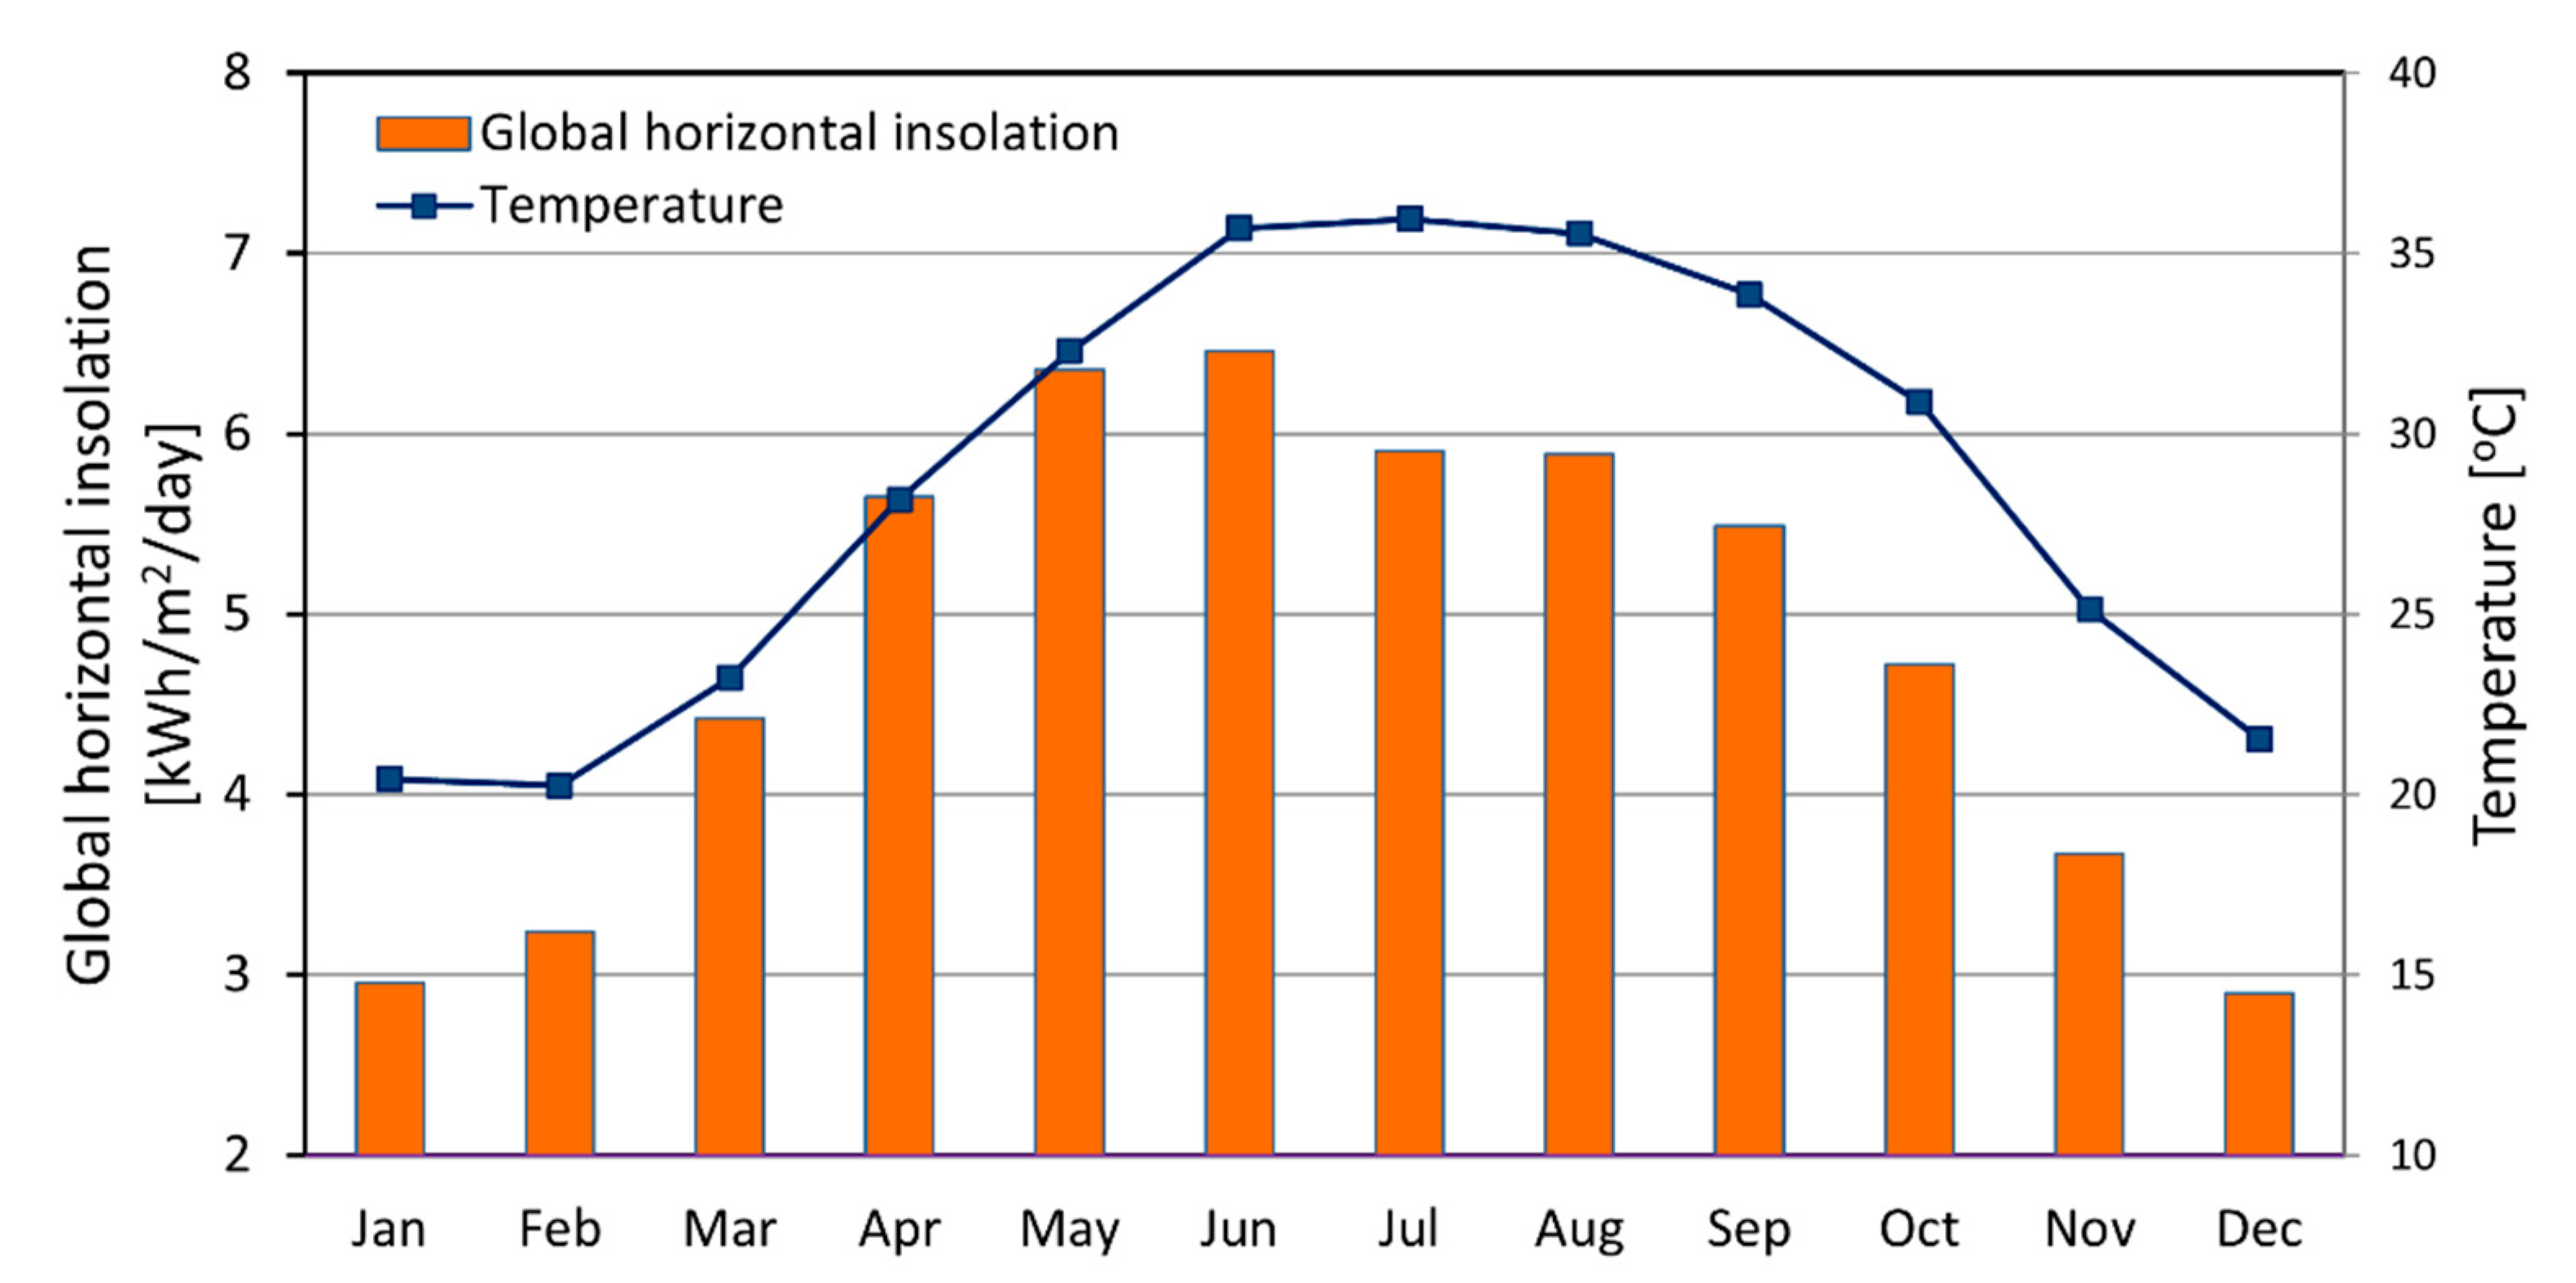
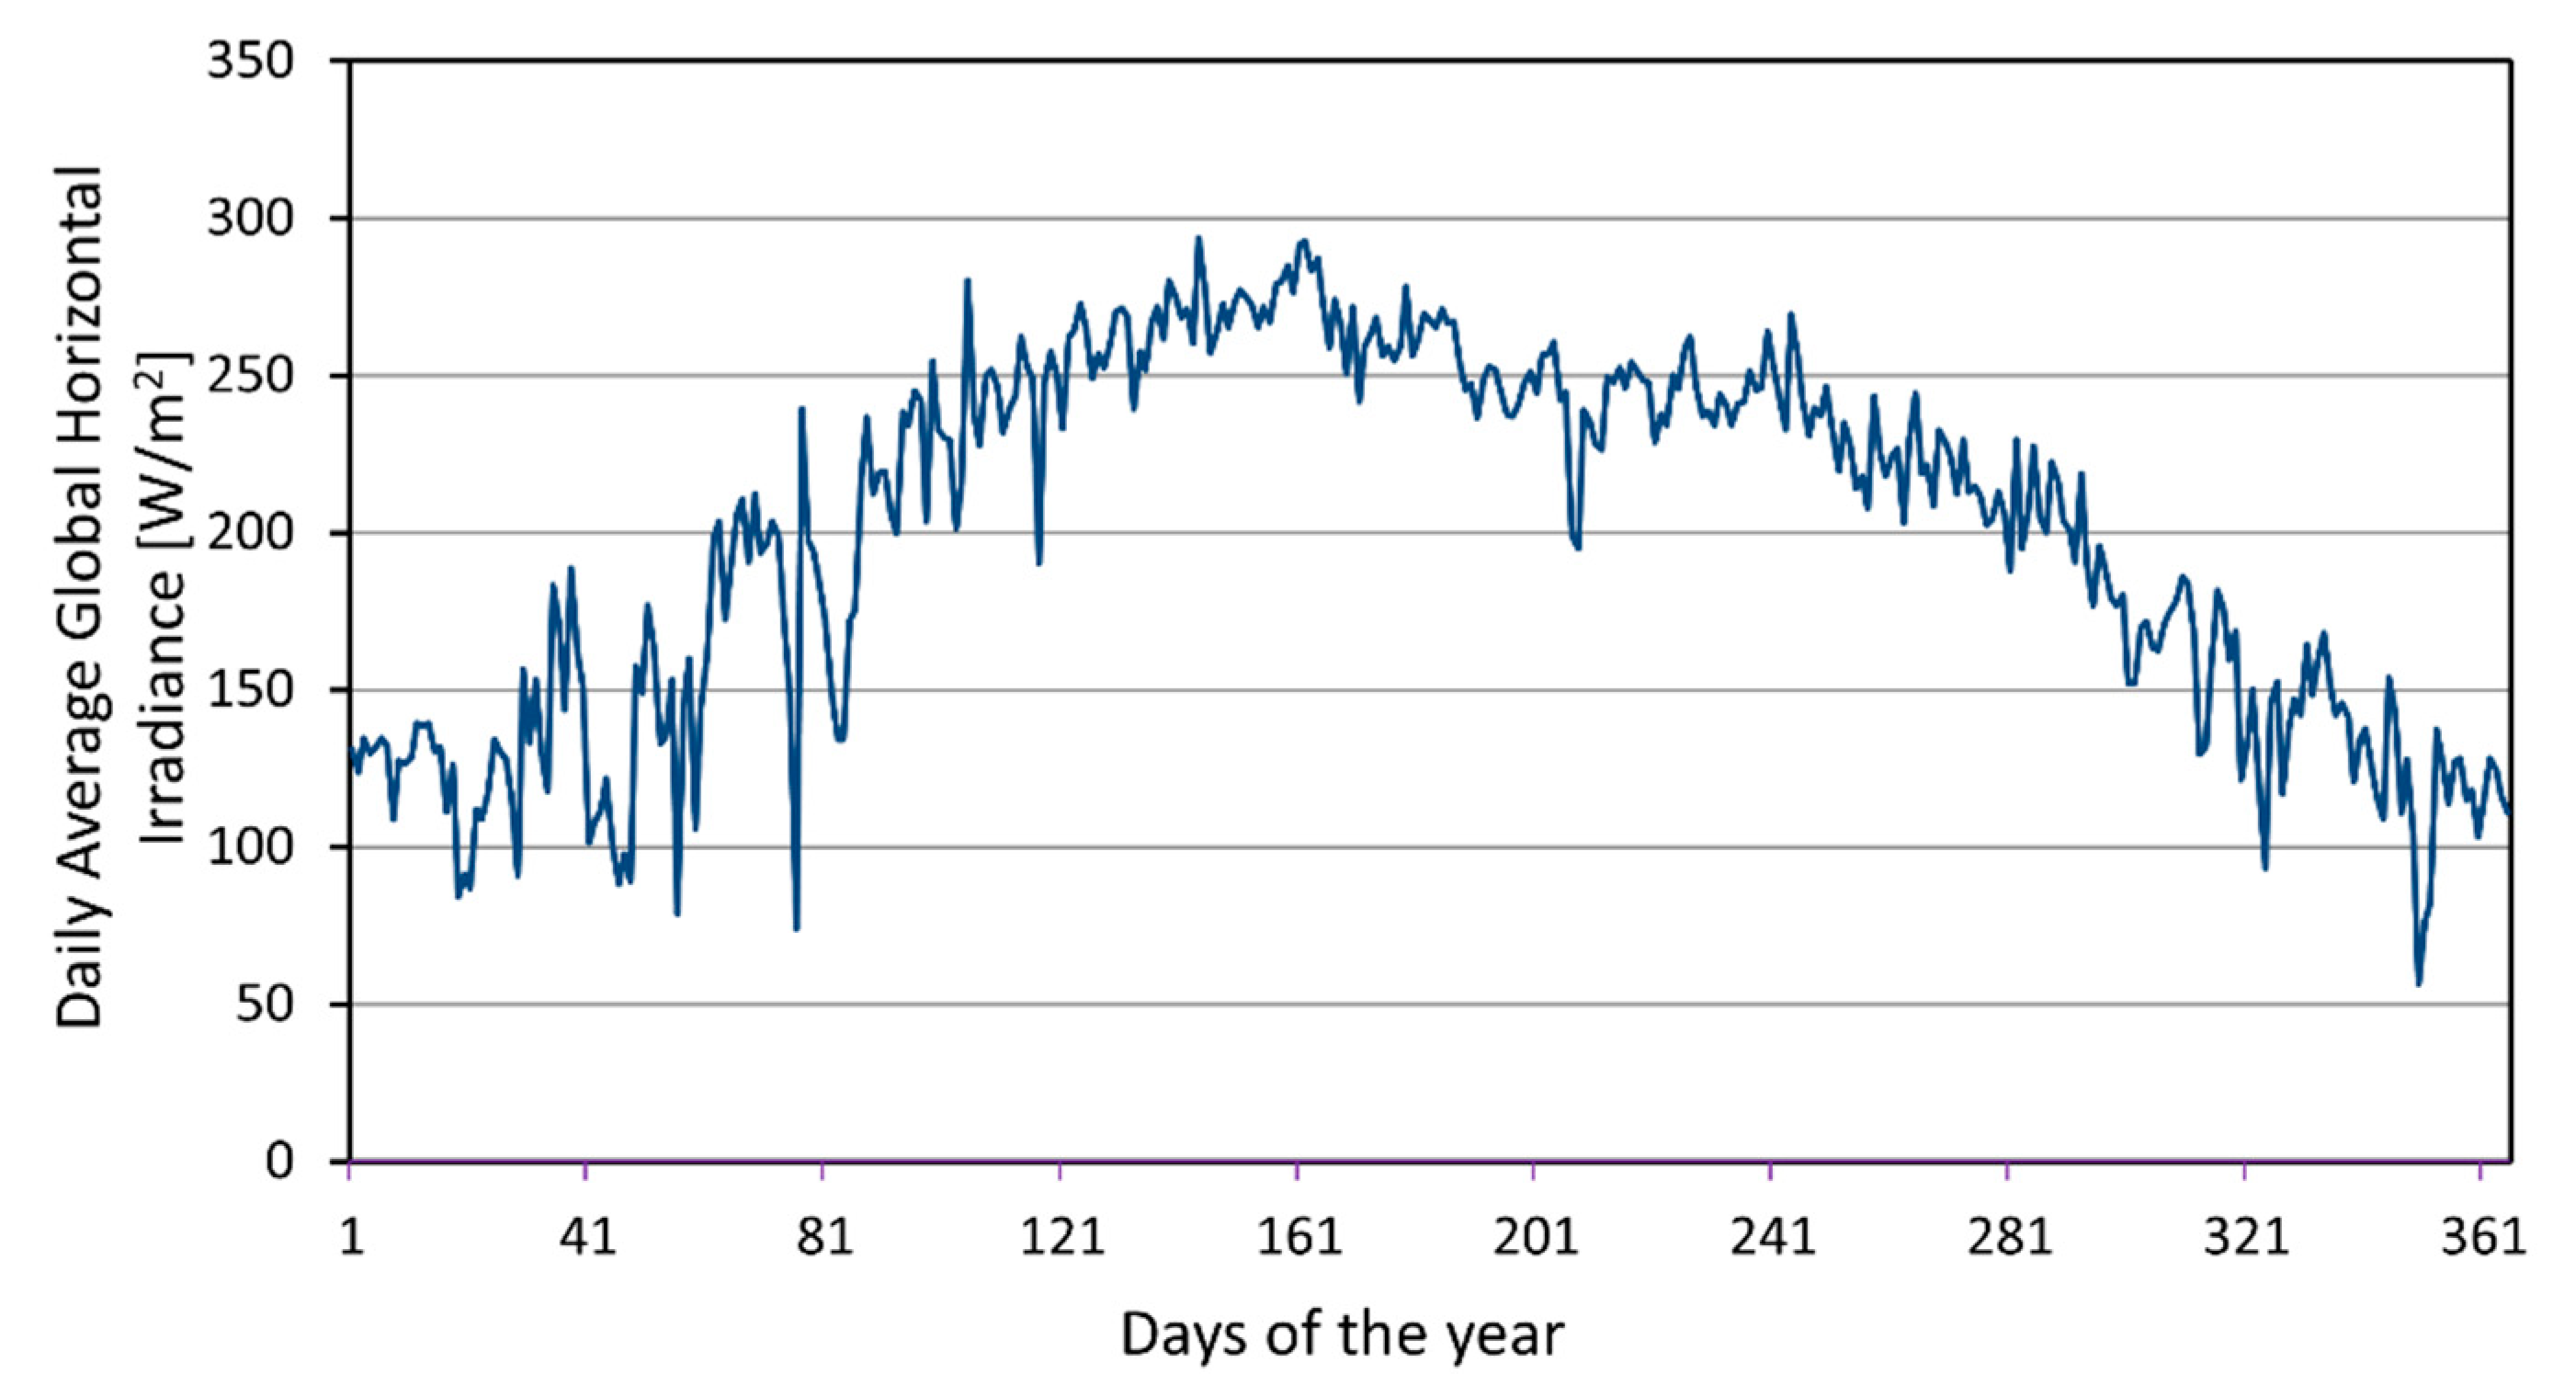
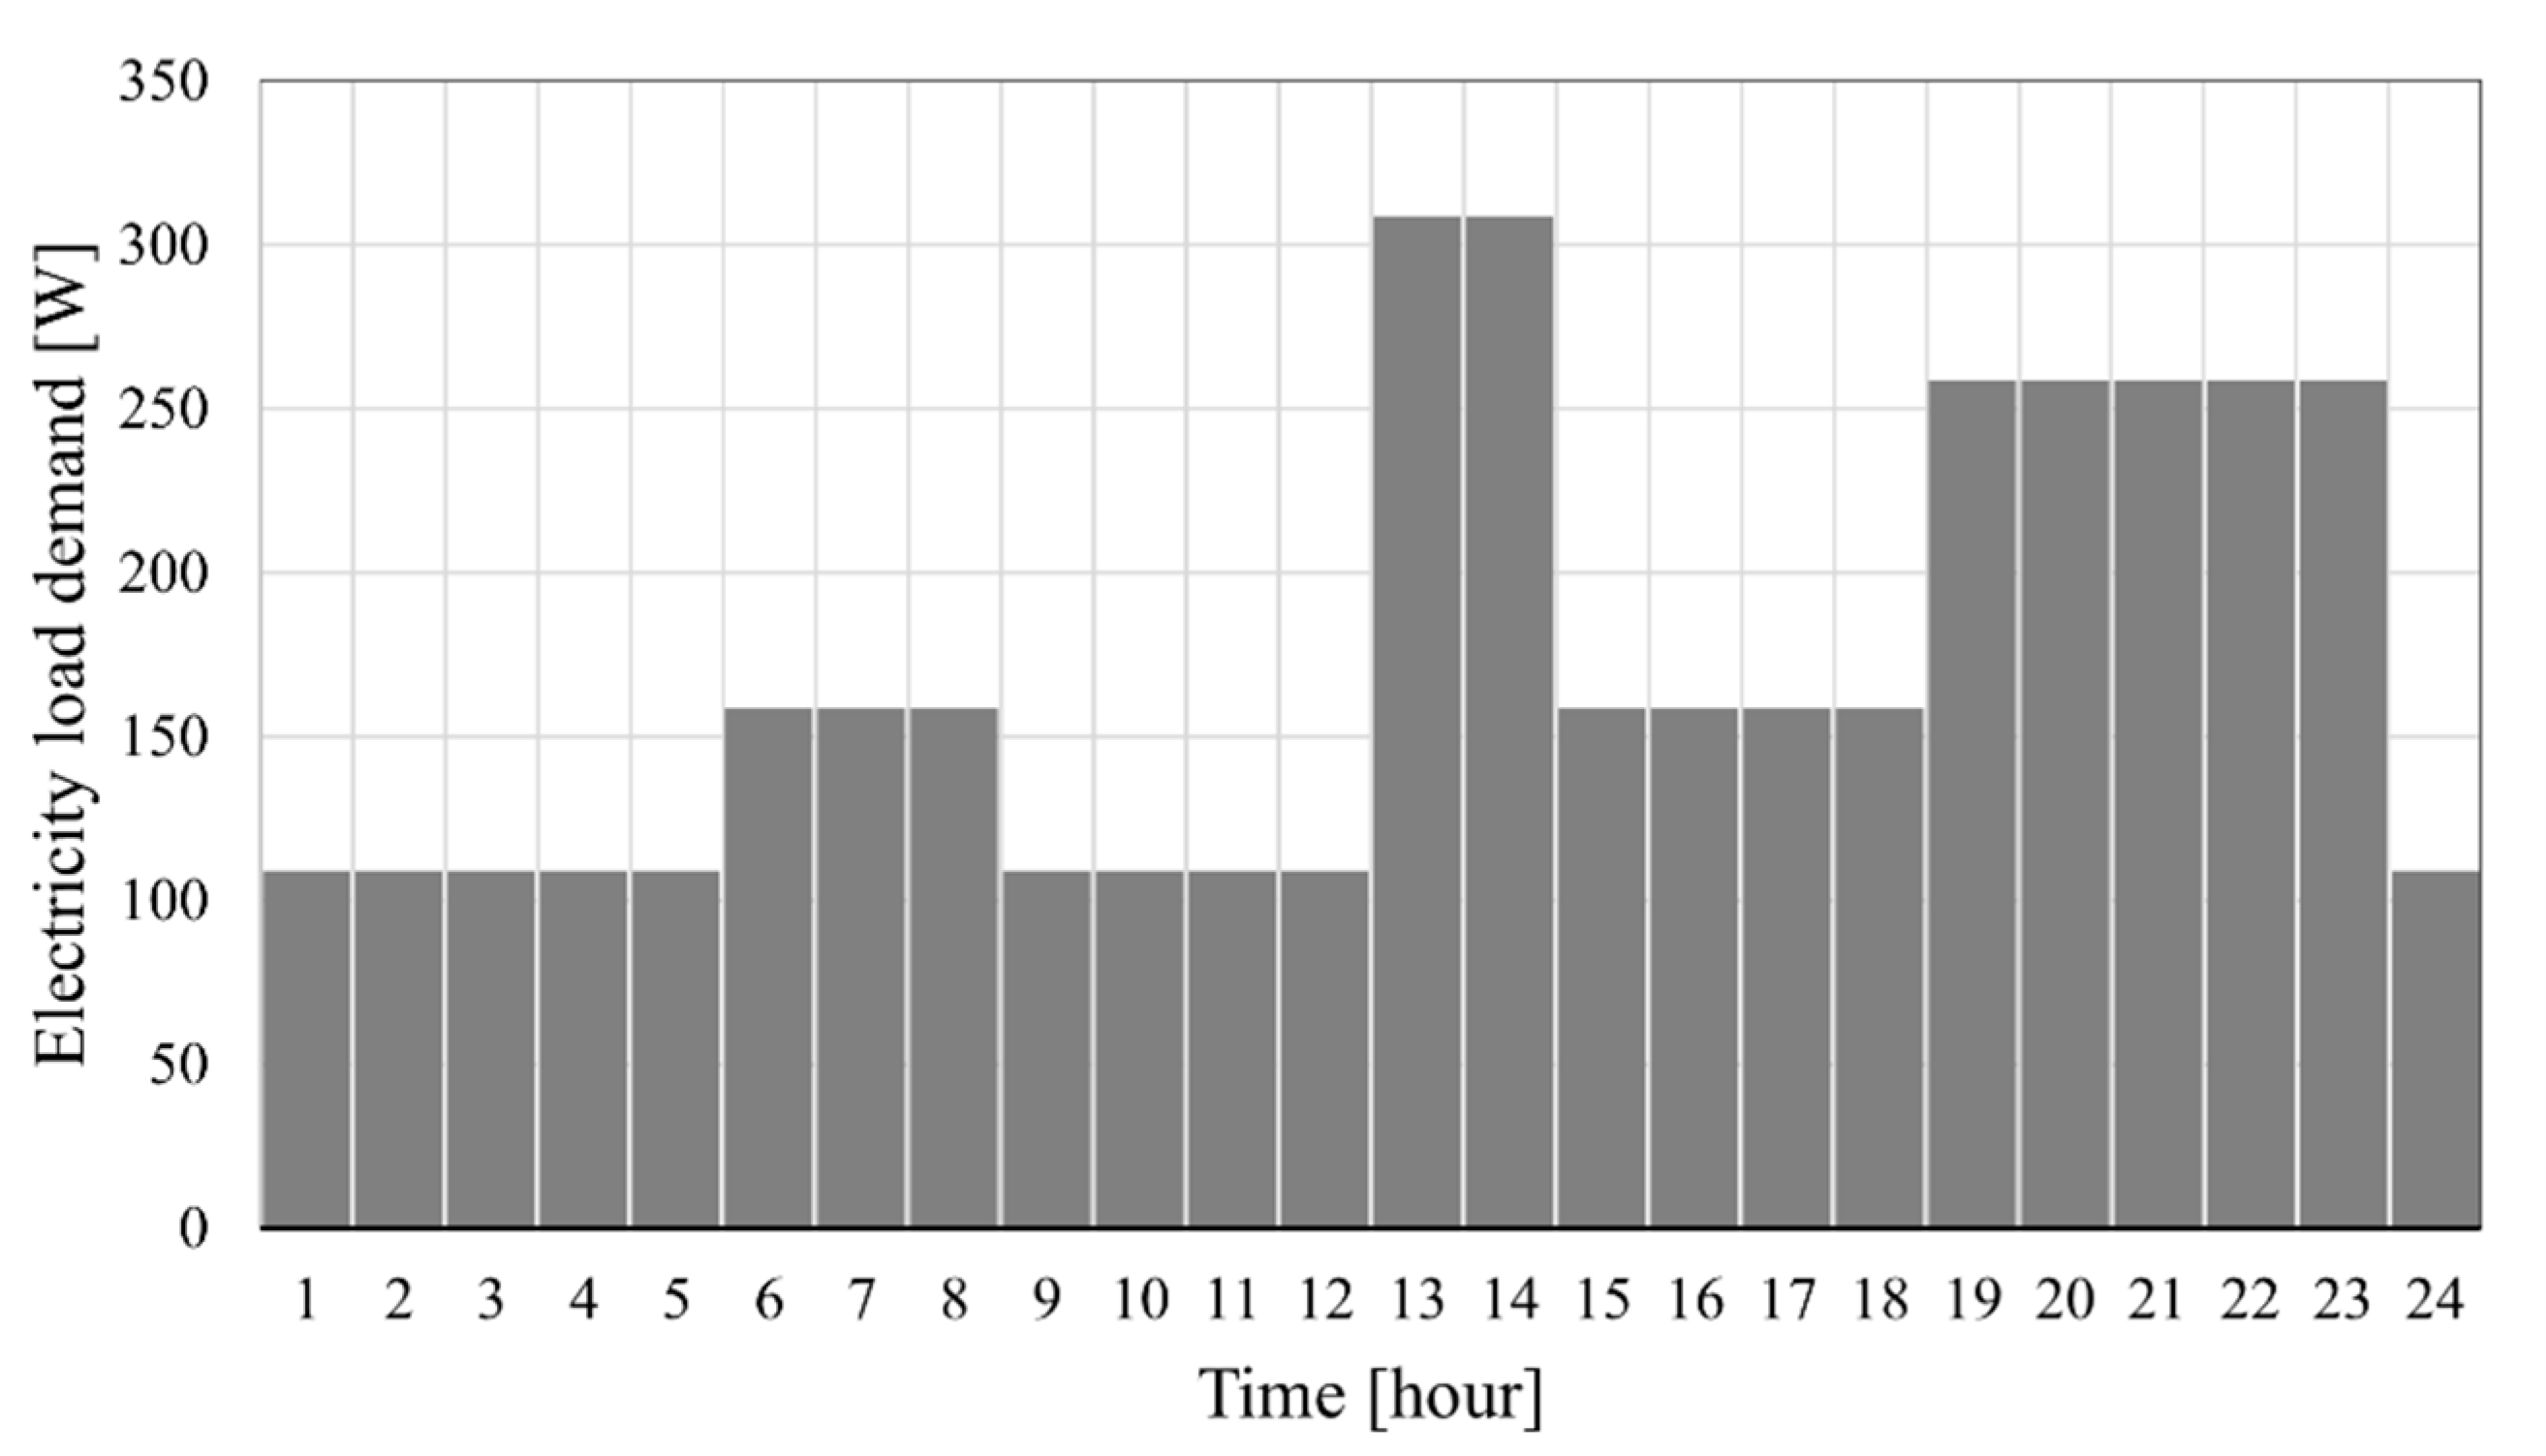
2.6. Case Study
3. Results and Discussions
4. Conclusions
- A comparison of different LPSPs shows that a small increase in tolerance for power loss can considerably lower the size, cost, and the LCOE of the system with limited change in water shortage probabilities. This suggests that communities and/or dwellings with limited financial capabilities should consider complementary strategies to avoid running out of water for irrigation.
- The WSP could go lower with higher LPSP because more water could be pumped into the tank when people can tolerate power shortages.
- There is a minimum in the curve that plots the CAPEX with respect to the number of PV panels in the system where limited variations of WSP and LCOE happen with further increases in the number of PV panels and that for any LPSP. This is due to the battery bank requirement rapid increase below the minimal number of panels which are less expensive. For the current study, this is about 5 to 6 panels.
5. Perspectives
Author Contributions
Funding
Institutional Review Board Statement
Informed Consent Statement
Data Availability Statement
Acknowledgments
Conflicts of Interest
Nomenclature
| Symbols: | |
| A, B, C | Arguments of |
| CAPEX | Capital expenditure [$] |
| d | Number of the day (from 1 to 365) |
| EPt | Electricity production in year t [kWh] |
| Ft | Fuel cost [$] |
| G | Incident solar irradiation [W/m2] |
| GSTC | Incident solar irradiation on STC [W/m2] |
| g | Gravitational acceleration [m/s2] |
| H | Total dynamic head [m] |
| Iβ | Global solar radiation on an inclined surface [W/m2] |
| Ib | Direct beam radiation [W/m2] |
| Id | Diffusive radiation [W/m2] |
| I0-pv | Investment cost of PV panel [$/W] |
| I0-pump | Investment cost of pump [$/W] |
| IPV | Current of the panel [A] |
| I | Global horizontal irradiance [W/m2] |
| IPV,r | Rated current of the panel [A] |
| Mt | Scheduled maintenance cost [$] |
| n | Number of the day |
| NPV | Number of PV panels |
| Maximum number of PV panels | |
| OPEXt | Operational expenditure [$] |
| Ot | Unscheduled operational cost [$] |
| PPV | Output power of the PV panel [W] |
| Pl | Load power [W] |
| r | Real discount rate [%] |
| Rt | Replacement cost [$] |
| Rinverter | Replacement cost of inverter [$] |
| Rbattery | Replacement cost of battery [$] |
| Tamb | Ambient temperature [°C] |
| Rb | Geometric factor |
| TC | Temperature of panel [°C] |
| TC, STC | Temperature of the cell at STC [°C] |
| t | Time [hour] |
| Voltage of the panels [v] | |
| θ | Angle of incidence [°] |
| Volumetric flow rate [m3/s] | |
| Greek characters: | |
| β | Tilt angle [°] |
| Hourly self-discharge rate | |
| Density [kg/m3] | |
| Temperature coefficient [%/°C] | |
| Pumping power [W] | |
| Efficiency of battery at charge mode [%] | |
| Efficiency of battery at discharge mode [%] | |
| Efficiency of inverter [%] | |
| Zenith angle [°] | |
| Albedo coefficient | |
| δ | Declination angle [°] |
| Sunset hour angle [°] | |
| Sunrise hour angle [°] | |
| φ | Latitude [°] |
| ω | Hour angle [°] |
| Γ | Argument of EOT |
| λ | Longitude [°] |
| γ | Azimuth angle [°] |
| Abbreviations | |
| CWR | Crop Water Requirement [mm] |
| DNI | Direct Normal irradiation [W/m2] |
| EOT | Equation of Time |
| IWR | Irigation Water Requirement [mm] |
| IBC | Installed Battery Capacity [kWh] |
| IODC | Indian Ocean Data Coverage |
| LCOE | Levelized Cost of Energy [$/kWh] |
| LL | Local Longitude [°] |
| LT | Local Time |
| LSTM | Local Standard Time Meridian |
| LPSP | Loss of Power Supply Probability [%] |
| LPS | Loss of Power Supply [W] |
| NOCT | Nominal Operating Cell Temperature [°C] |
| NSRDB | National Solar Radiation Database |
| PSM-v3 | Physical Solar Model Version 3 |
| PV | Photovoltaic |
| STC | Standard Test Condition |
| ST | Solar Time |
| WSP | Water Shortage Probability [%] |
| WS | Water shortage [m3] |
References
- Key World Energy Statistics 2021; International Energy Agency: Paris, France, 2021.
- Chapin, D.M.; Fuller, C.S.; Pearson, G.L. A New Silicon p-n Junction Photocell for Converting Solar Radiation into Electrical Power. J. Appl. Phys. 1954, 25, 676. [Google Scholar] [CrossRef]
- Gualteros, S.; Rousse, D.R. Solar water pumping systems: A tool to assist in sizing and optimization. Sol. Energy 2021, 225, 382–398. [Google Scholar] [CrossRef]
- IRENA. Rethinking Energy 2017: Accelerating the Global Energy Transformation; International Renewable Energy Agency: Abu Dhabi, United Arab Emirates, 2017. [Google Scholar]
- Bhayo, B.A.; Al-Kayiem, H.H.; Gilani, S.I. Assessment of standalone solar PV-Battery system for electricity generation and utilization of excess power for water pumping. Sol. Energy 2019, 194, 766–776. [Google Scholar] [CrossRef]
- Vishnupriyan, J.; Partheeban, P.; Dhanasekaran, A.; Shiva, M. Analysis of tilt angle variation in solar photovoltaic water pumping system. Mater. Today Proc. 2022, 58, 416–421. [Google Scholar] [CrossRef]
- Tiwari, A.K.; Kalamkar, V.R.; Pande, R.R.; Sharma, S.K.; Sontake, V.C.; Jha, A. Effect of head and PV array configurations on solar water pumping system. Mater. Today Proc. 2020, 46, 5475–5481. [Google Scholar] [CrossRef]
- Raza, F.; Tamoor, M.; Miran, S.; Arif, W.; Kiren, T.; Amjad, W.; Hussain, M.I.; Lee, G.-H. The Socio-Economic Impact of Using Photovoltaic (PV) Energy for High-Efficiency irrigation Systems: A Case Study. Energies 2022, 15, 1198. [Google Scholar] [CrossRef]
- Khan, M.S.; Tahir, A.; Alam, I.; Razzaq, S.; Usman, M.; Tareen, W.U.K.; Baig, N.A.; Atif, S.; Riaz, M. Assessment of Solar Photovoltaic Water Pumping of WASA Tube Wells for irrigation in Quetta Valley Aquifer. Energies 2021, 14, 6676. [Google Scholar] [CrossRef]
- Lunel, T.R.; Rousse, D.R. pvpumpingsystem: A Python package for modeling and sizing photovoltaic water pumping systems. J. Open Source Softw. 2020, 5, 2637. [Google Scholar] [CrossRef]
- Gorjian, S.; NematZadeh, B.; Eltrop, L.; Shamshiri, R.R.; Amanlou, Y. Solar photovoltaic power generation in Iran: Development, policies, and barriers. Renew. Sustain. Energy Rev. 2019, 106, 110–123. [Google Scholar] [CrossRef]
- Renewable Energy and Energy Efficiency Organization (SATBA). Available online: http://www.satba.gov.ir/en/home (accessed on 1 August 2021).
- Nikzad, A.; Chahartaghi, M.; Ahmadi, M.H. Technical, economic, and environmental modeling of solar water pump for irrigation of rice in Mazandaran province in Iran: A case study. J. Clean. Prod. 2019, 239, 118007. [Google Scholar] [CrossRef]
- Iran’s Ministry of Energy-Tavanir Holding Company of Iran. Detailed Statistics of Iran Electricity Production Industry. August 2021. Available online: https://amar.tavanir.org.ir/en/ (accessed on 1 August 2021).
- Niajalili, M.; Mayeli, P.; Naghashzadegan, M.; Poshtiri, A.H. Techno-economic feasibility of off-grid solar irrigation for a rice paddy in Guilan province in Iran: A case study. Sol. Energy 2017, 150, 546–557. [Google Scholar] [CrossRef]
- Shahverdi, K.; Bellos, E.; Loni, R.; Najafi, G.; Said, Z. Solar-driven water pump with organic Rankine cycle for pressurized irrigation systems: A case study. Therm. Sci. Eng. Prog. 2021, 25, 100960. [Google Scholar] [CrossRef]
- Rizi, A.P.; Ashrafzadeh, A.; Ramezani, A. A financial comparative study of solar and regular irrigation pumps: Case studies in eastern and southern Iran. Renew. Energy 2019, 138, 1096–1103. [Google Scholar] [CrossRef]
- Chahartaghi, M.; Nikzad, A. Exergy, environmental, and performance evaluations of a solar water pump system. Sustain. Energy Technol. Assess. 2020, 43, 100933. [Google Scholar] [CrossRef]
- NSRDB. The National Solar Radiation Database. Available online: https://maps.nrel.gov/nsrdb-viewer/ (accessed on 1 August 2021).
- Duffie, J.A.; Beckman, W.A. Solar Engineering of Thermal Processes; John Wiley & Sons, Inc.: Hoboken, NJ, USA, 2013. [Google Scholar]
- Cooper, P. The absorption of radiation in solar stills. Sol. Energy 1969, 12, 333–346. [Google Scholar] [CrossRef]
- Ibrahim, I.A.; Khatib, T.; Mohamed, A. Optimal sizing of a standalone photovoltaic system for remote housing electrification using numerical algorithm and improved system models. Energy 2017, 126, 392–403. [Google Scholar] [CrossRef]
- ABukar, A.L.; Tan, C.W.; Lau, K.Y. Optimal sizing of an autonomous photovoltaic/wind/battery/diesel generator microgrid using grasshopper optimization algorithm. Sol. Energy 2019, 188, 685–696. [Google Scholar]
- Valve-Regulated Lead-Acid (VRLA): Gelled Electrolyte (gel) and Absorbed Glass Mat (AGM) Batteries; EAST PENN Expertise and American Workmanship: Lyons, PA, USA, 2007.
- Li, H.; Sun, Y. Operational performance study on a photovoltaic loop heat pipe/solar assisted heat pump water heating system. Energy Build. 2018, 158, 861–872. [Google Scholar] [CrossRef]
- Numbi, B.; Malinga, S. Optimal energy cost and economic analysis of a residential grid-interactive solar PV system- case of eThekwini municipality in South Africa. Appl. Energy 2017, 186, 28–45. [Google Scholar] [CrossRef]
- Bhandari, R.; Stadler, I. Grid parity analysis of solar photovoltaic systems in Germany using experience curves. Sol. Energy 2009, 83, 1634–1644. [Google Scholar] [CrossRef]
- Ndwali, K.; Njiri, J.G.; Wanjiru, E.M. Multi-objective optimal sizing of grid connected photovoltaic batteryless system minimizing the total life cycle cost and the grid energy. Renew. Energy 2019, 148, 1256–1265. [Google Scholar] [CrossRef]
- Komiyama, R.; Fujii, Y. Long-term scenario analysis of nuclear energy and variable renewables in Japan’s power generation mix considering flexible power resources. Energy Policy 2015, 83, 169–184. [Google Scholar] [CrossRef]
- Komiyama, R.; Fujii, Y. Assessment of massive integration of photovoltaic system considering rechargeable battery in Japan with high time-resolution optimal power generation mix model. Energy Policy 2014, 66, 73–89. [Google Scholar] [CrossRef]
- Li, Y.; Gao, W.; Ruan, Y.; Ushifusa, Y. The performance investigation of increasing share of photovoltaic generation in the public grid with pump hydro storage dispatch system, a case study in Japan. Energy 2018, 164, 811–821. [Google Scholar] [CrossRef]
- Besarati, S.M.; Padilla, R.V.; Goswami, D.Y.; Stefanakos, E. The potential of harnessing solar radiation in Iran: Generating solar maps and viability study of PV power plants. Renew. Energy 2013, 53, 193–199. [Google Scholar] [CrossRef]
- Chandler, W.; Whitlock, C.; Stackhouse, P. A Renewable Energy Resource Web Site (Release 6.0); NASA Surface Meteorology and Solar Energy (SSE): Washington, DC, USA, 2015. [Google Scholar]
- Pereira, L.; Alves, I. Crop Water Requirements; International Commission on Agricultural Engineering (CIGR): Lisbon, Portugal, 2005. [Google Scholar]
- Bazrafshan, O.; Zamani, H.; Etedali, H.R.; Dehghanpir, S. Assessment of citrus water footprint components and impact of climatic and non-climatic factors on them. Sci. Hortic. 2019, 250, 344–351. [Google Scholar] [CrossRef]
- Memme, S.; Fossa, M. Maximum energy yield of PV surfaces in France and Italy from climate based equations for optimum tilt at different azimuth angles. Renew. Energy 2022, 200, 845–866. [Google Scholar] [CrossRef]

| PV Model | CS3K-305MS |
|---|---|
| Type | Monocrystalline |
| Power at STC, Pmp | 305 W |
| Optimum operating Voltage at STC | 32.7 V |
| Optimum operating Current at STC | 9.33 A |
| Module Efficiency | 18.36% |
| Temperature Coefficient (α) | −0.37% per °C |
| Nominal Module Operating Temperature | 42 °C |
| PV life span | 30 Years |
| Price | 201.31 $ |
| Battery Model | 8A31DT-DEKA |
|---|---|
| Battery Technology | Absorbent Glass Mat. |
| Nominal Voltages | 12 V |
| Battery Capacity | 104.0 Ah |
| Battery life span | 5 years |
| Depth of discharge | 60% |
| Price | 362.25 $ |
| Model | SMA Sunny Boy 2.0 |
|---|---|
| Continuous AC Output Power | 2000 W |
| Min/Max Input DC Voltages | 80/600 V |
| Max Input DC Current per string | 10 A |
| Max. short circuit current per string | 18 A |
| Power consumption while operating | 2 W |
| Efficiency | 97% |
| Life span | 10 years |
| Price | 867 $ |
| Model | Multi-Grid |
|---|---|
| Type | VDE-AR-N 4105 |
| Power Output from 25 °C to 40 °C | 2400 to 2200 W |
| Maximum efficiency | 94% |
| Rated Input Voltage DC/AC | 19–33/187–265 V |
| Rated Output Voltage DC/AC | 24/230 V |
| Rated Output DC | 70 A |
| Life span | 10 years |
| Unit Price | 992 $ |
| Yearly Operation and Maintenance Cost | 2% of Investment Cost |
|---|---|
| Pump Efficiency | 90% |
| Total head | 8 m |
| Life span | 30 years |
| Investment cost | 2.4 $/W |
Disclaimer/Publisher’s Note: The statements, opinions and data contained in all publications are solely those of the individual author(s) and contributor(s) and not of MDPI and/or the editor(s). MDPI and/or the editor(s) disclaim responsibility for any injury to people or property resulting from any ideas, methods, instructions or products referred to in the content. |
© 2022 by the authors. Licensee MDPI, Basel, Switzerland. This article is an open access article distributed under the terms and conditions of the Creative Commons Attribution (CC BY) license (https://creativecommons.org/licenses/by/4.0/).
Share and Cite
Irandoostshahrestani, M.; R. Rousse, D. Photovoltaic Electrification and Water Pumping Using the Concepts of Water Shortage Probability and Loss of Power Supply Probability: A Case Study. Energies 2023, 16, 1. https://doi.org/10.3390/en16010001
Irandoostshahrestani M, R. Rousse D. Photovoltaic Electrification and Water Pumping Using the Concepts of Water Shortage Probability and Loss of Power Supply Probability: A Case Study. Energies. 2023; 16(1):1. https://doi.org/10.3390/en16010001
Chicago/Turabian StyleIrandoostshahrestani, Misagh, and Daniel R. Rousse. 2023. "Photovoltaic Electrification and Water Pumping Using the Concepts of Water Shortage Probability and Loss of Power Supply Probability: A Case Study" Energies 16, no. 1: 1. https://doi.org/10.3390/en16010001
APA StyleIrandoostshahrestani, M., & R. Rousse, D. (2023). Photovoltaic Electrification and Water Pumping Using the Concepts of Water Shortage Probability and Loss of Power Supply Probability: A Case Study. Energies, 16(1), 1. https://doi.org/10.3390/en16010001