
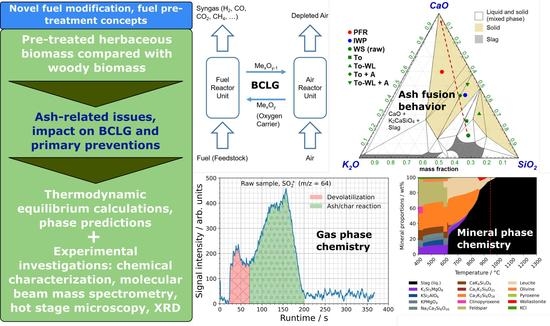
Investigations on the Effect of Pre-Treatment of Wheat Straw on Ash-Related Issues in Chemical Looping Gasification (CLG) in Comparison with Woody Biomass


Abstract
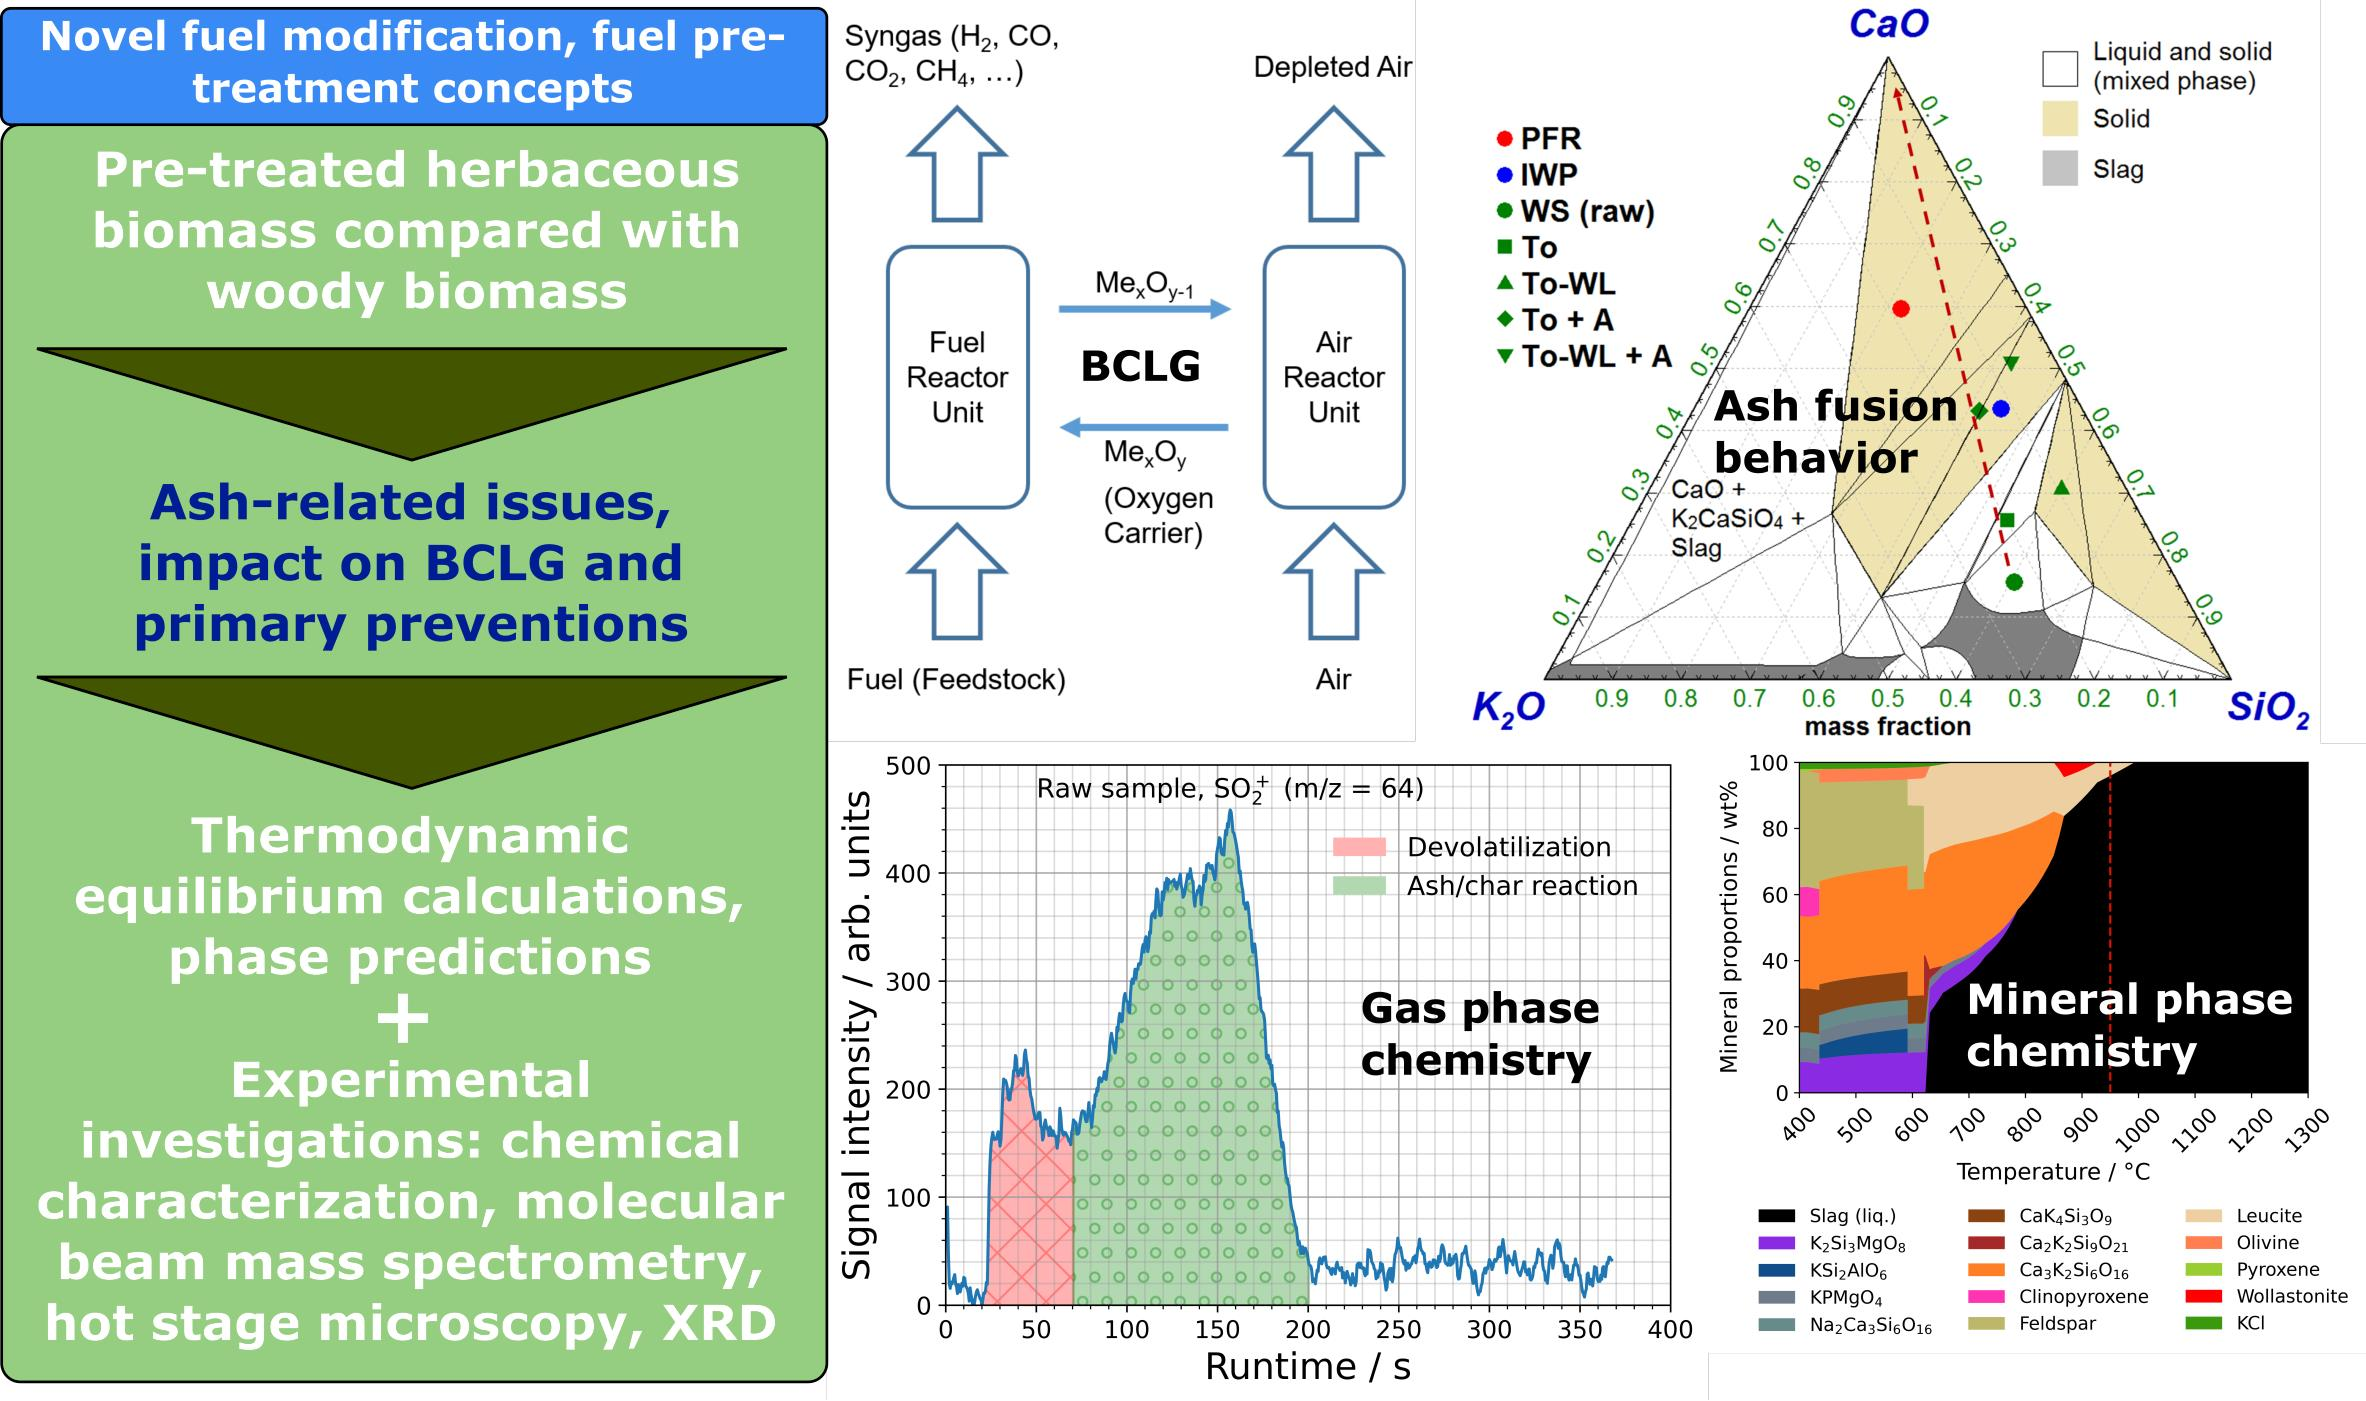
1. Introduction
- (i)
- Biomass pyrolysis:
- (ii)
- Biomass gasification:
2. Materials and Methods
2.1. Materials, Pre-Treatment, and Chemical Characterisation
2.2. Thermodynamic Modelling
2.3. Experimental Hot Gas Analysis by Molecular Beam Mass Spectrometry (MBMS)
2.4. Ash Sample Preparation for Ash Fusion Tests and X-ray Powder Diffractometric Analysis
2.5. Ash Fusion Test by Hot Stage Microscopy (HSM)
3. Results
3.1. Experimnetal Part
3.1.1. Fuel Composition
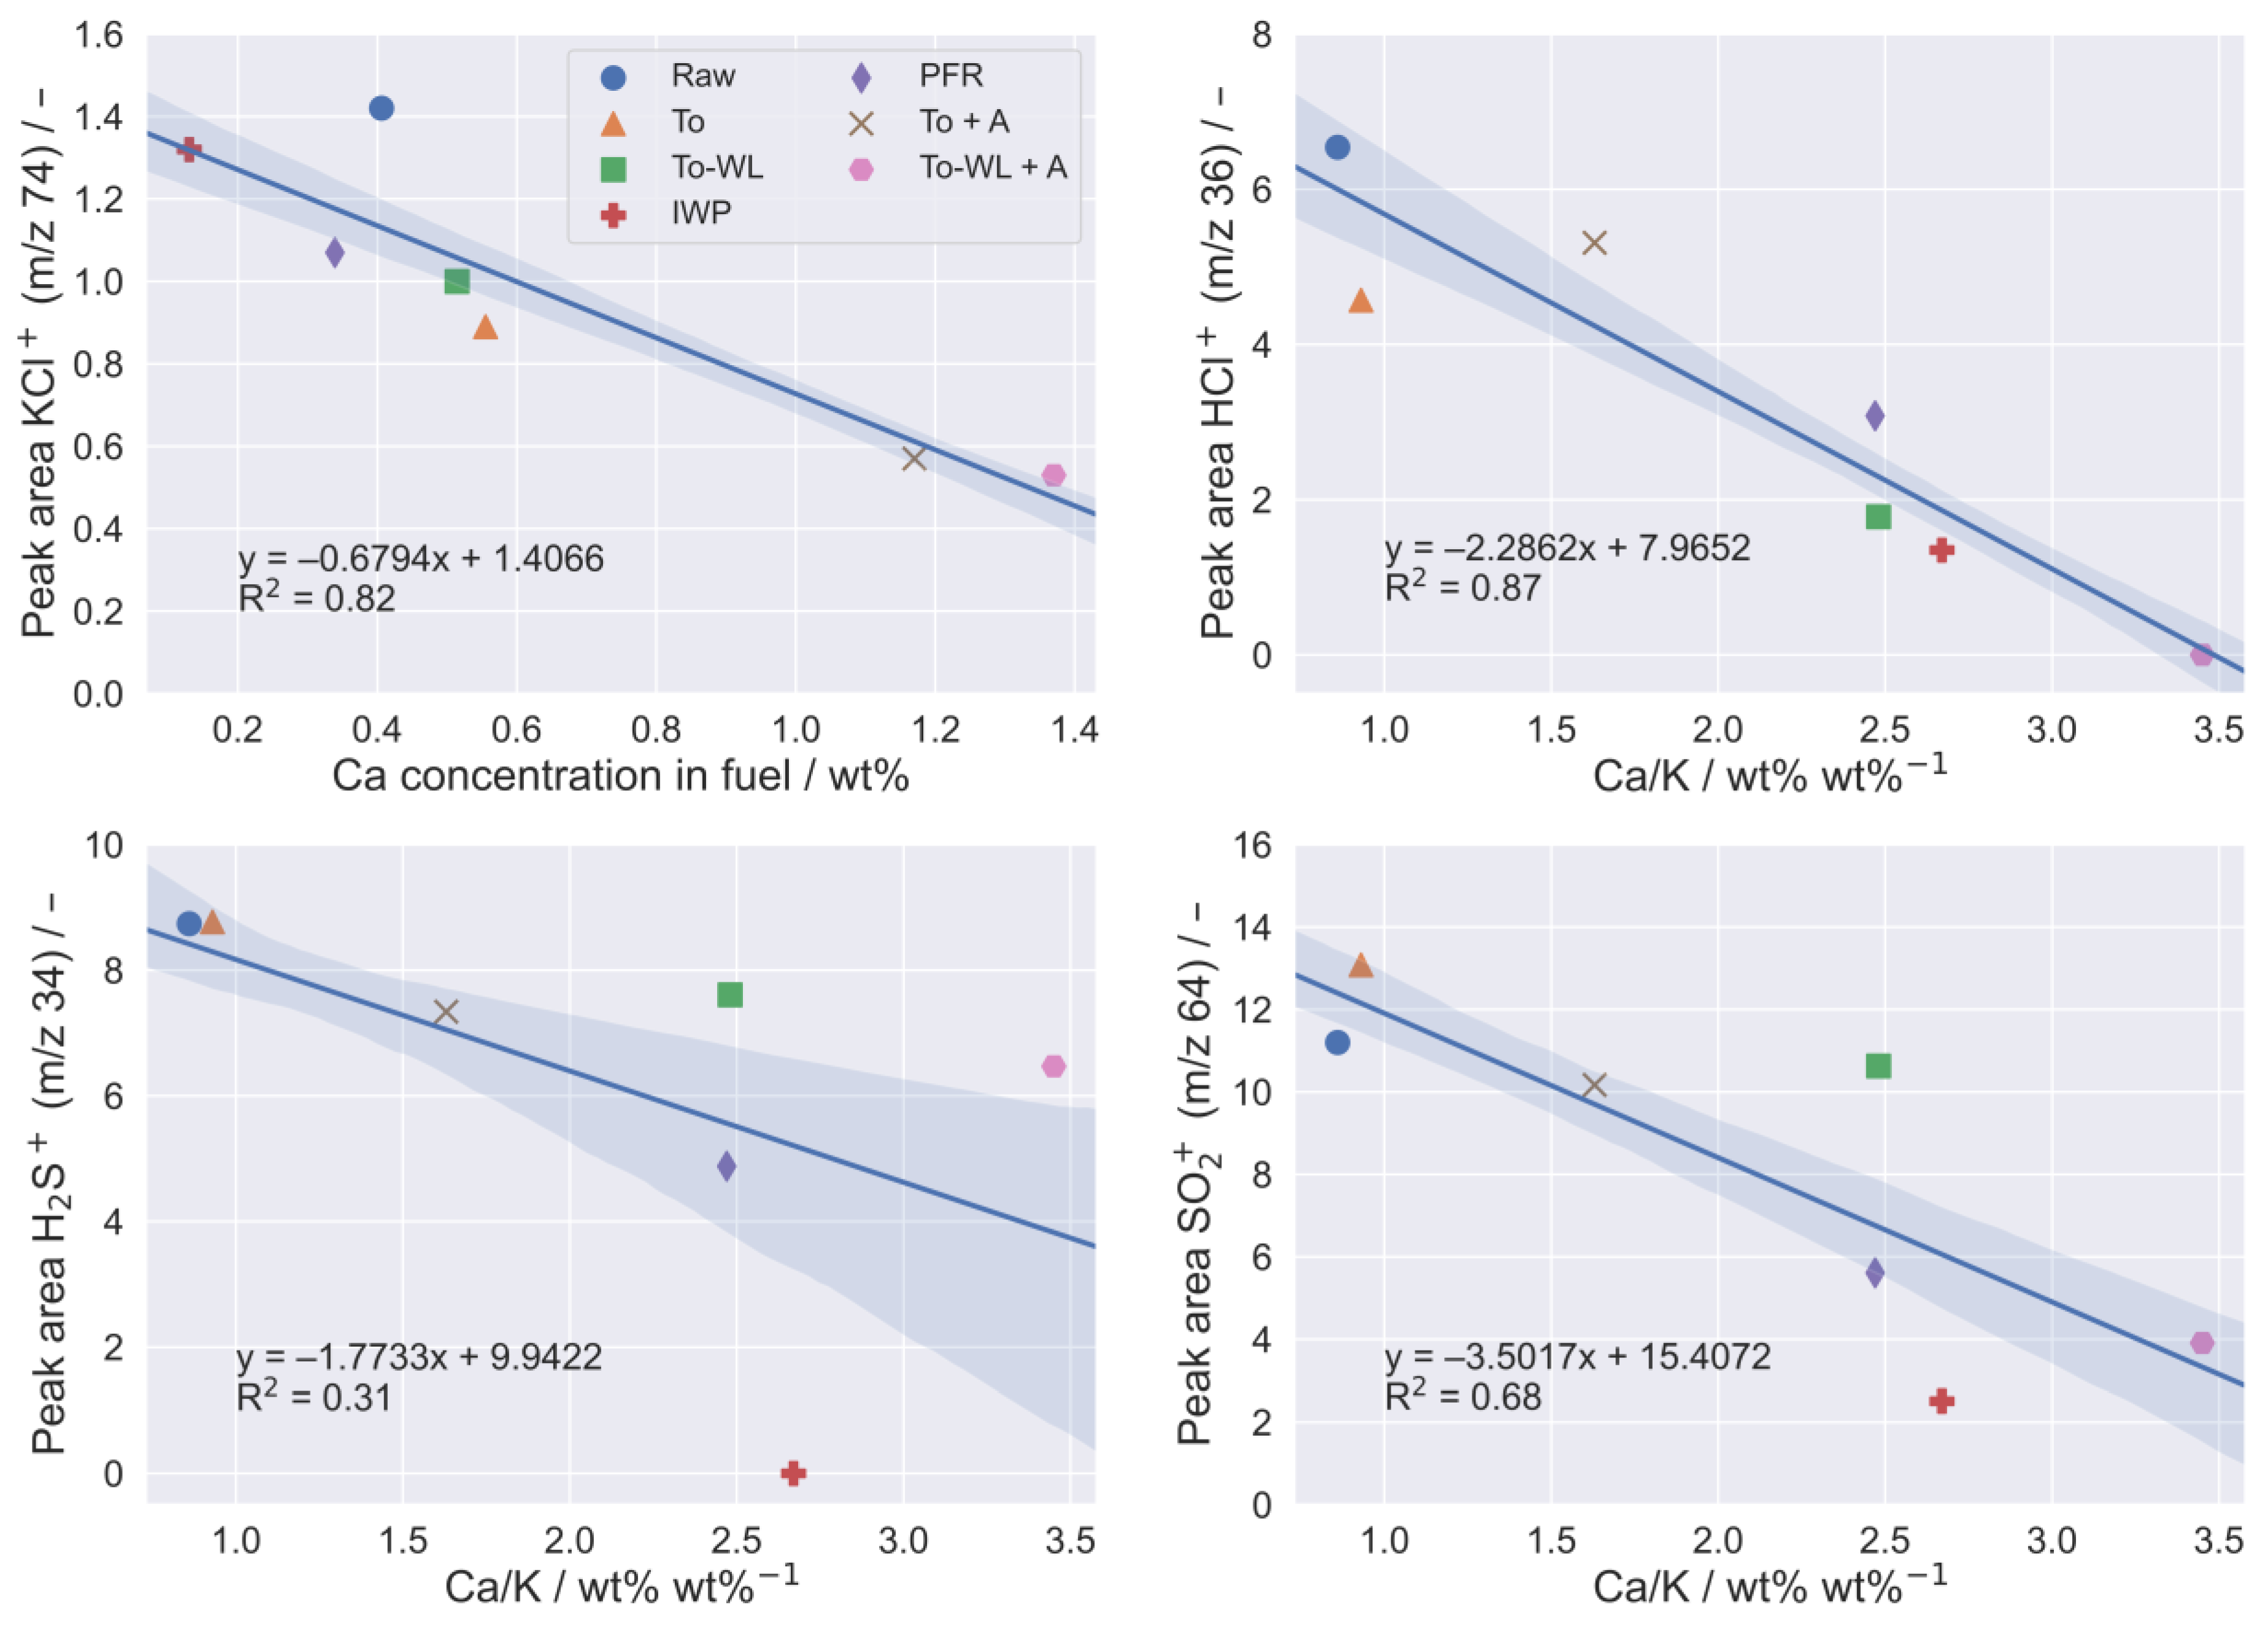
3.1.2. Experimental Hot Gas Analysis
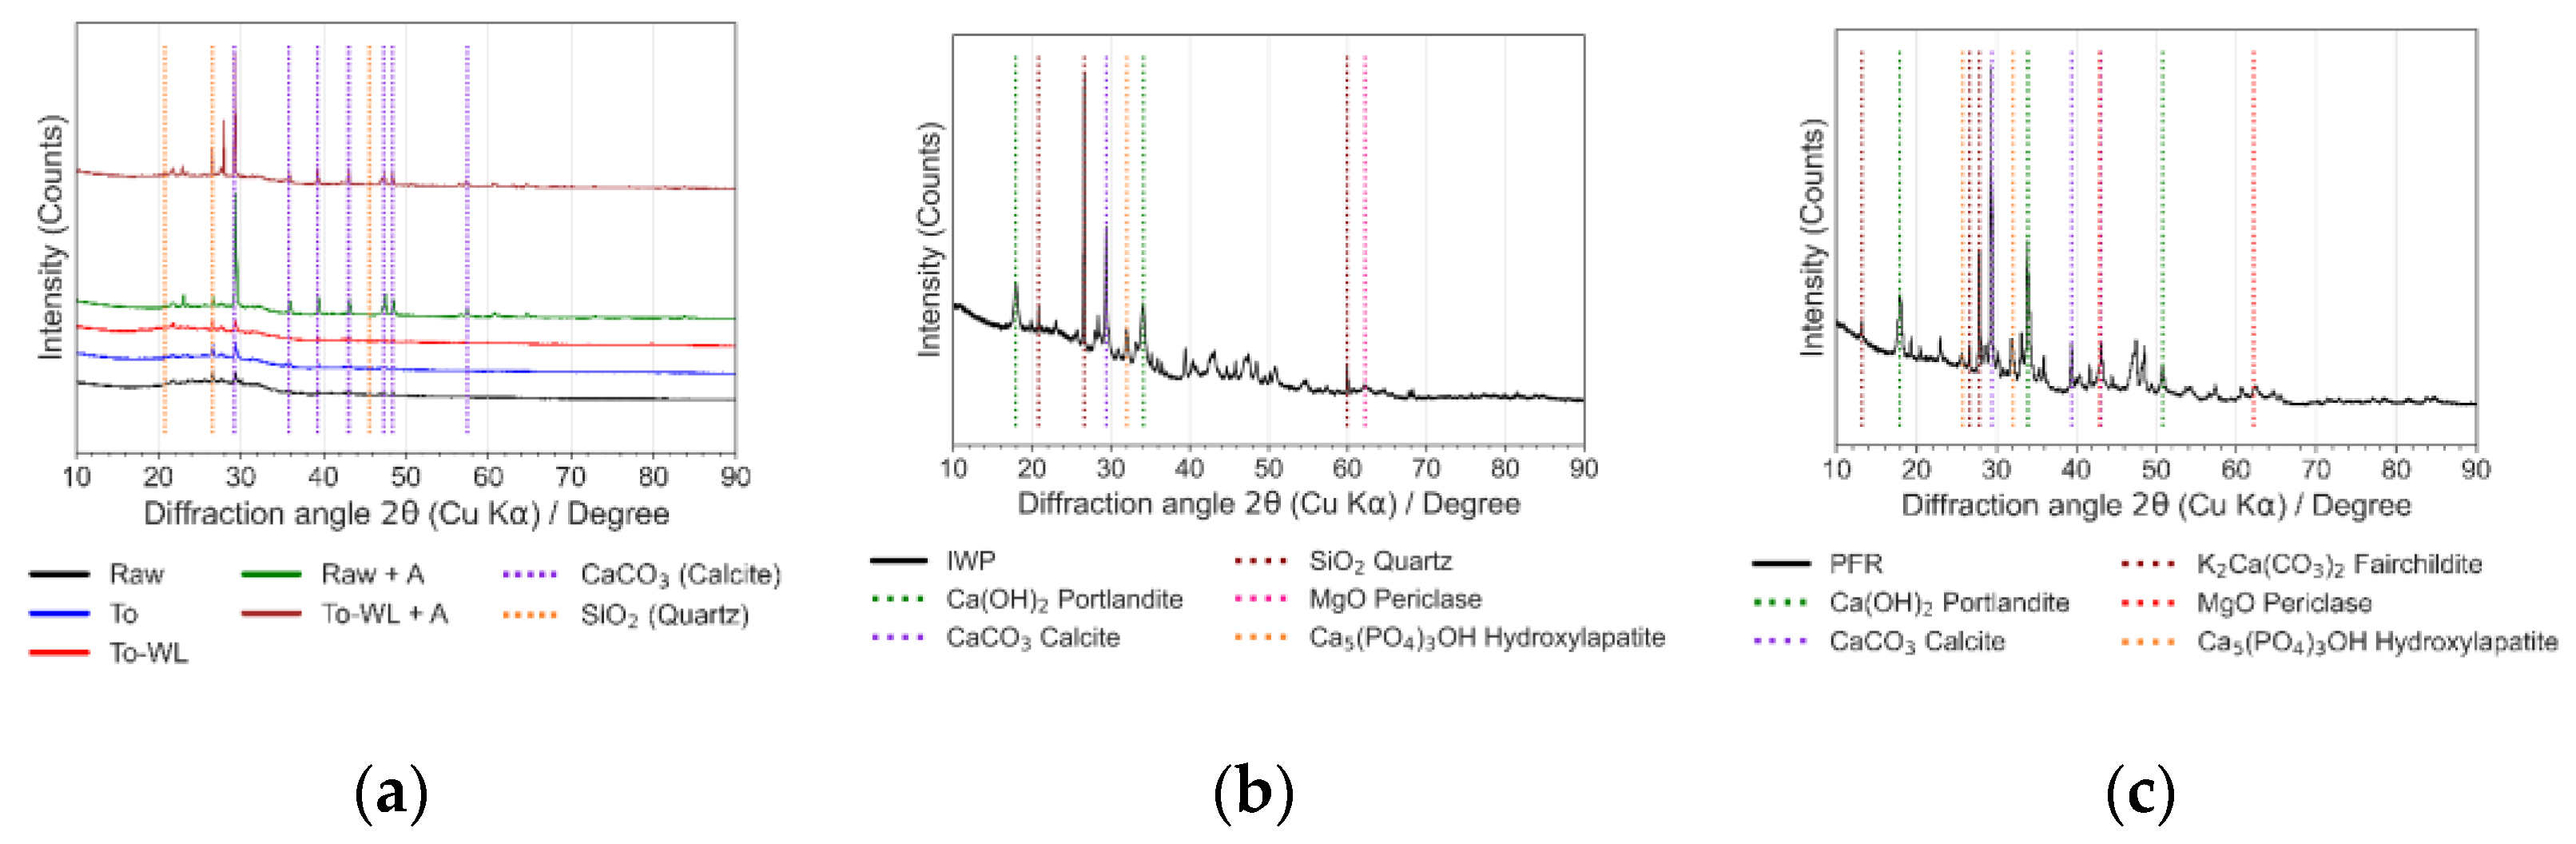
3.1.3. X-ray Powder Diffraction Analysis
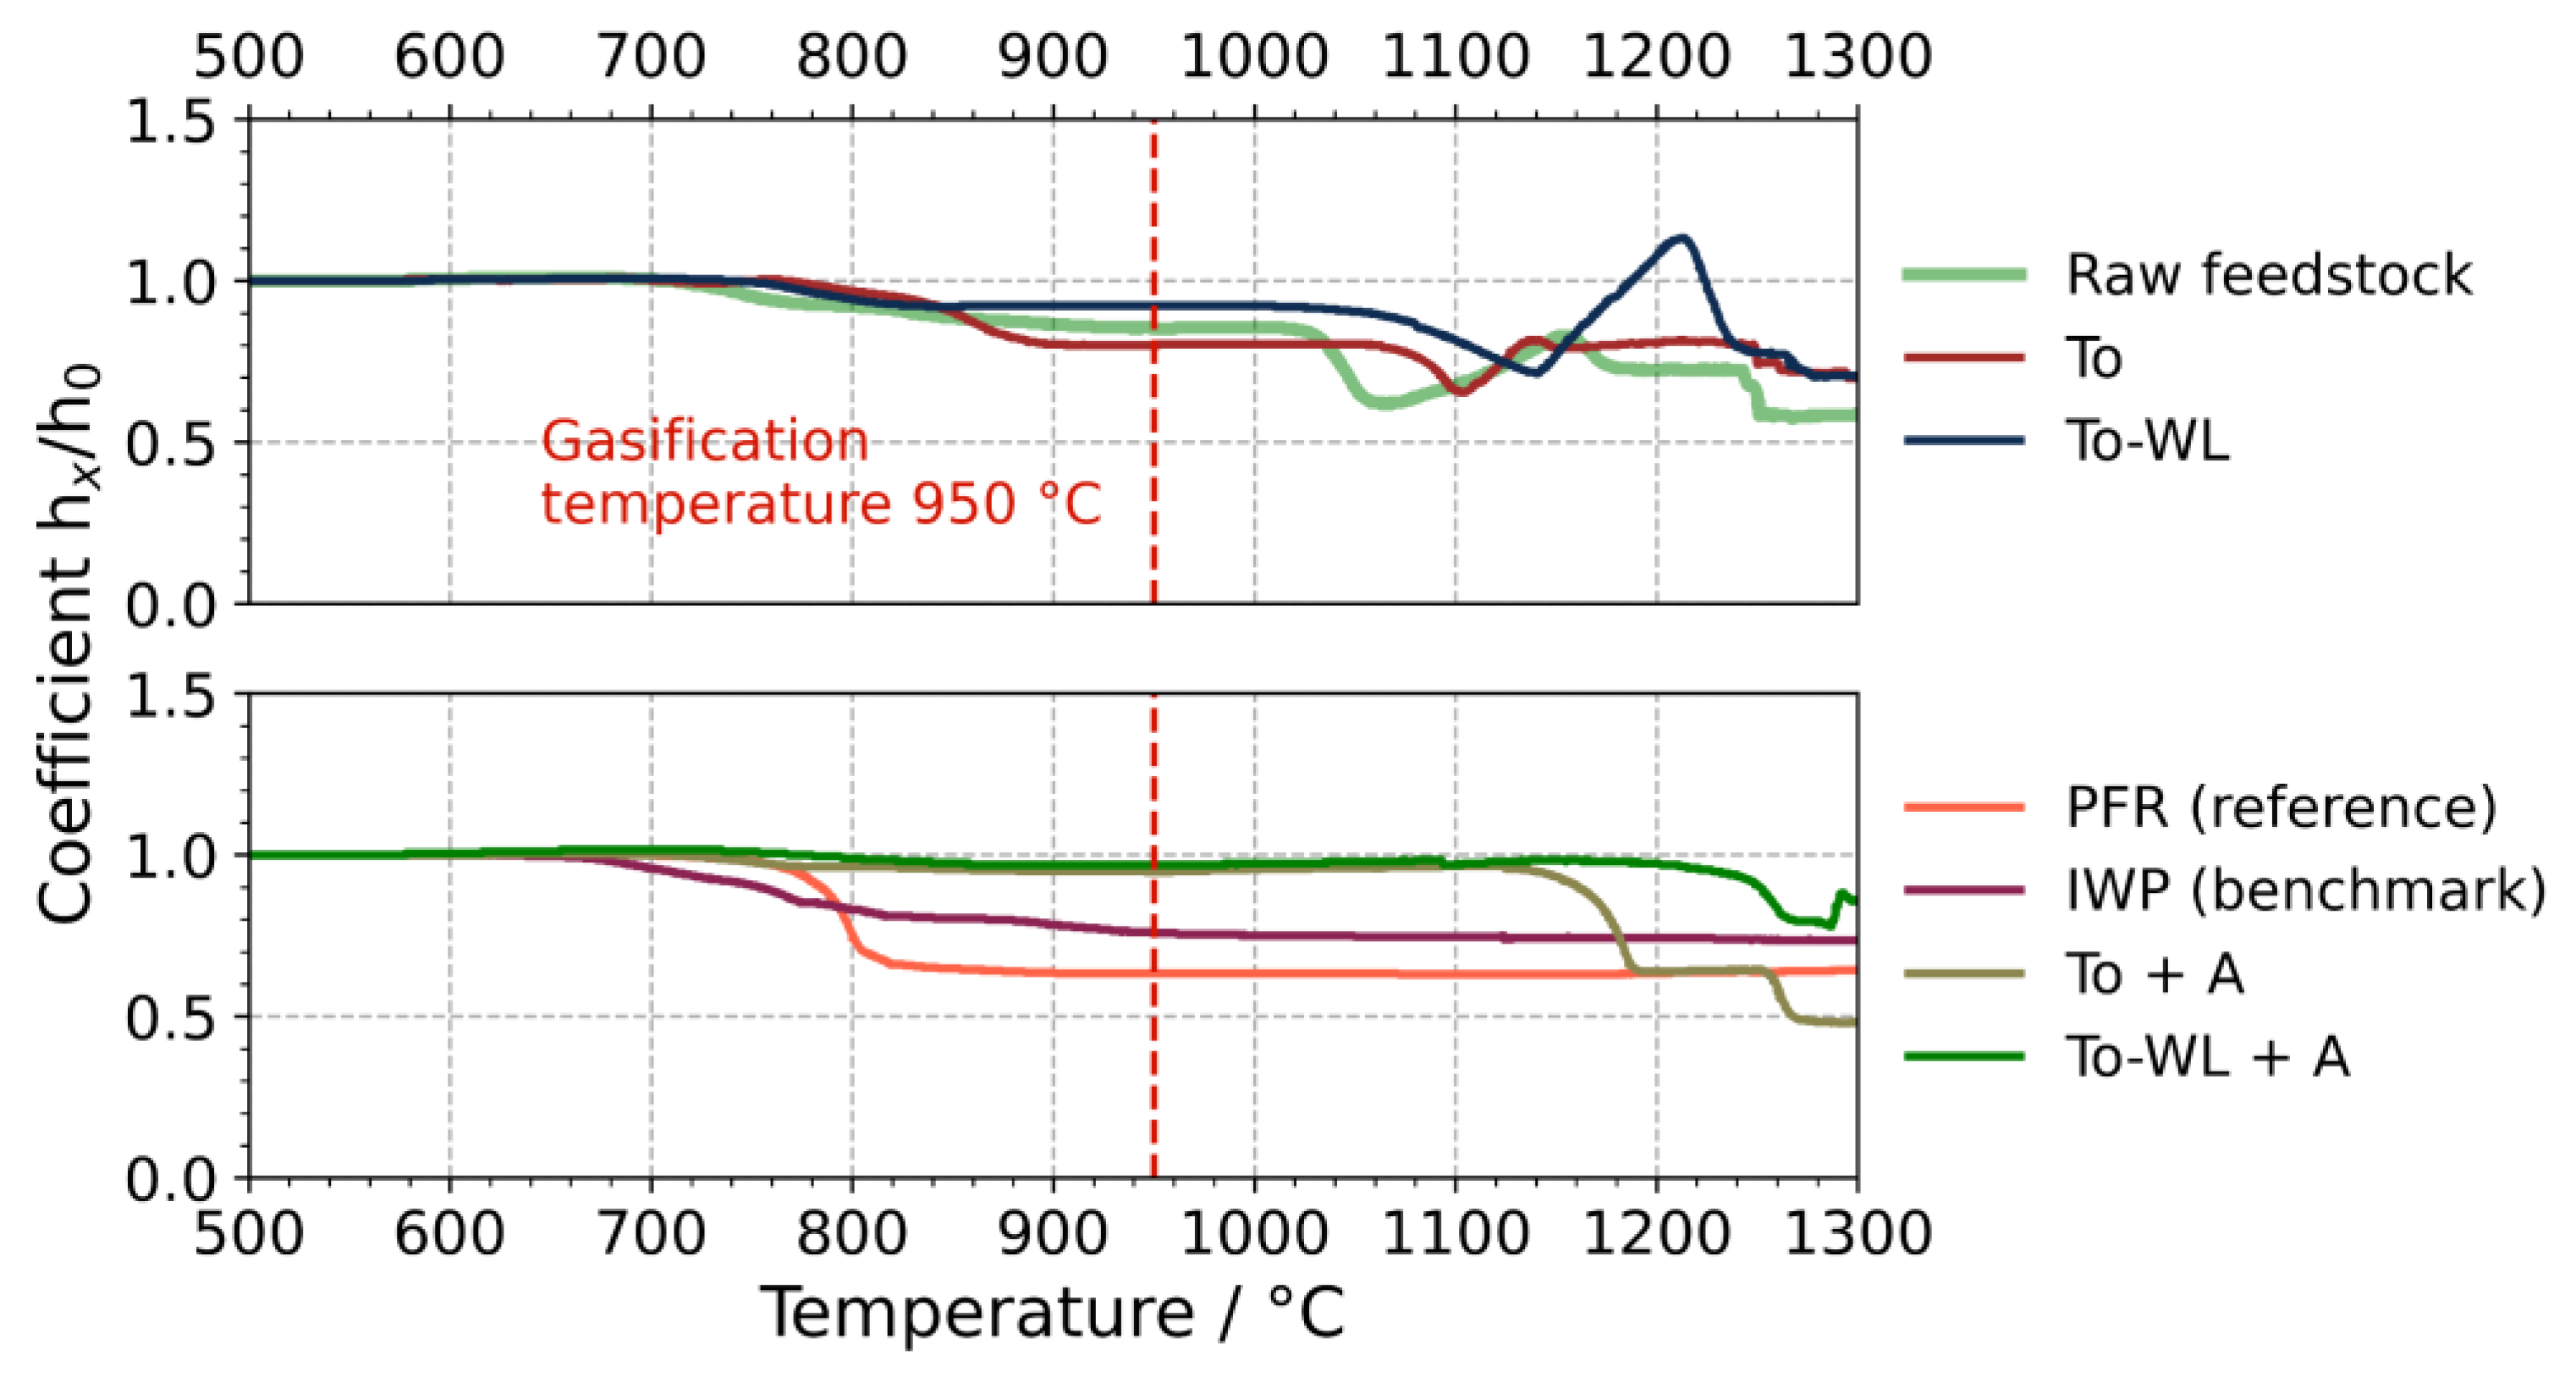
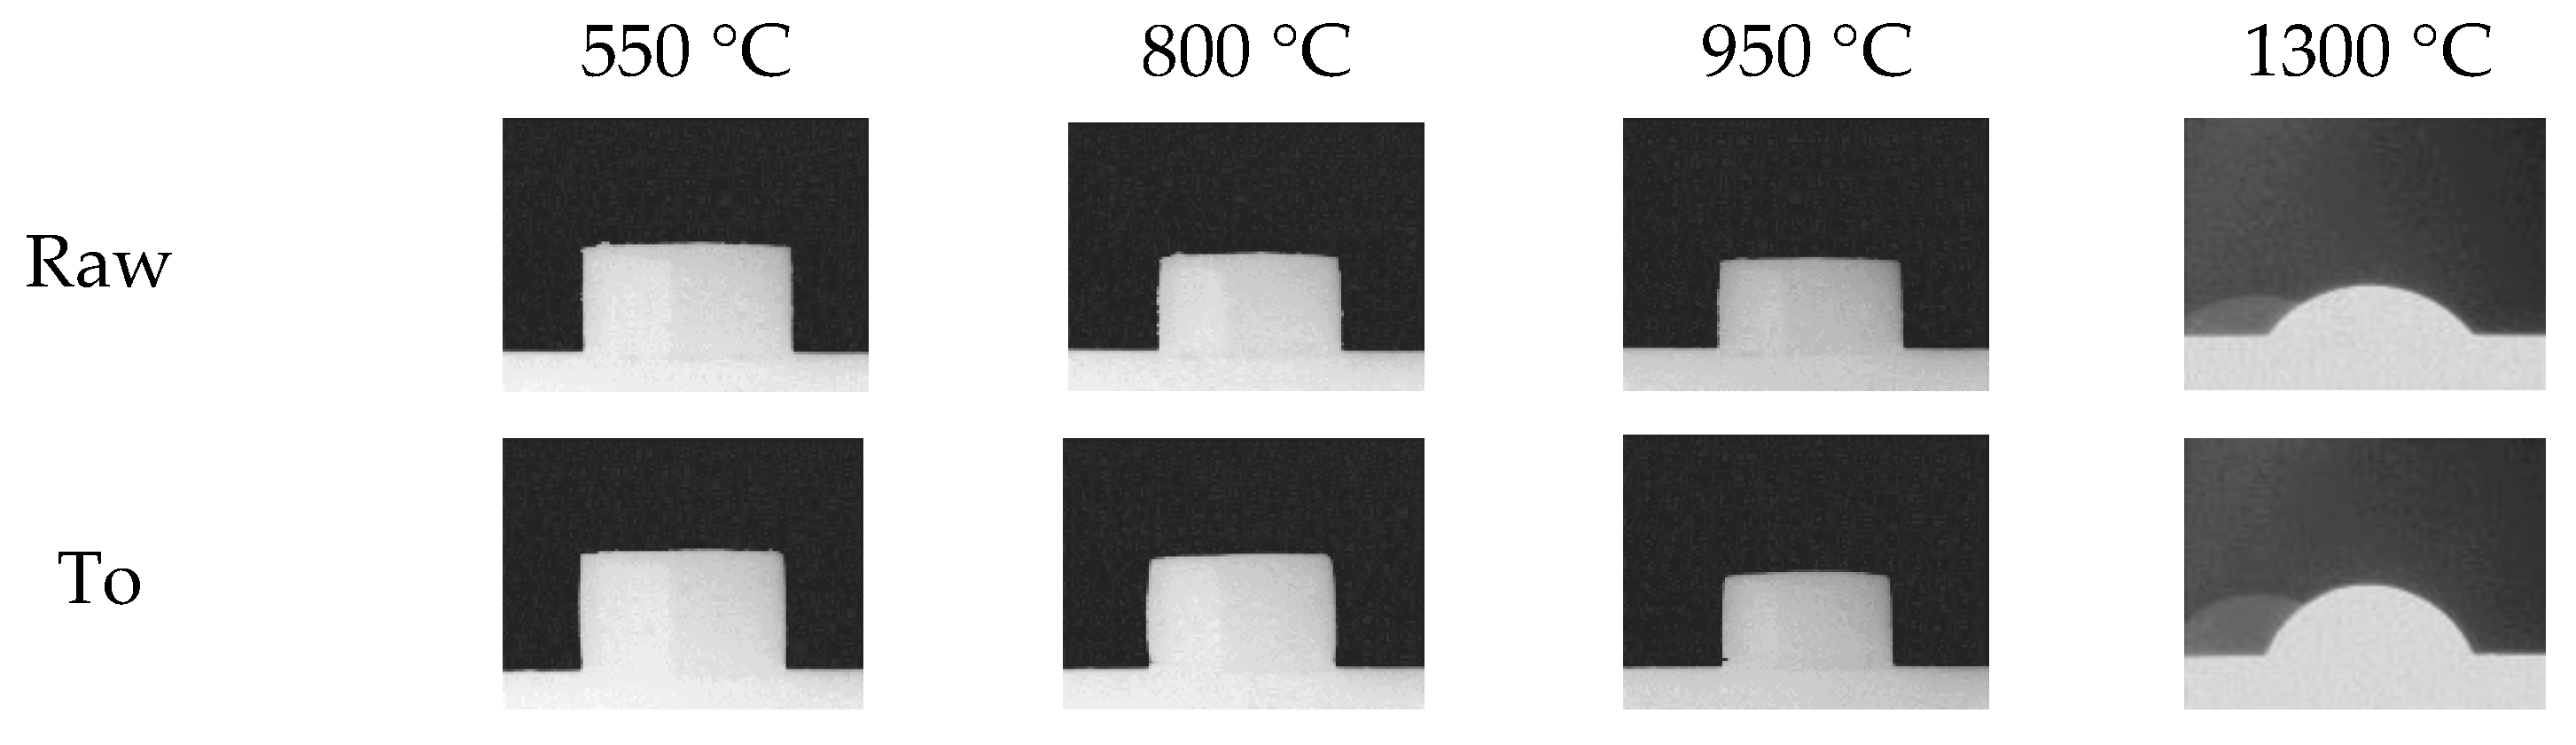
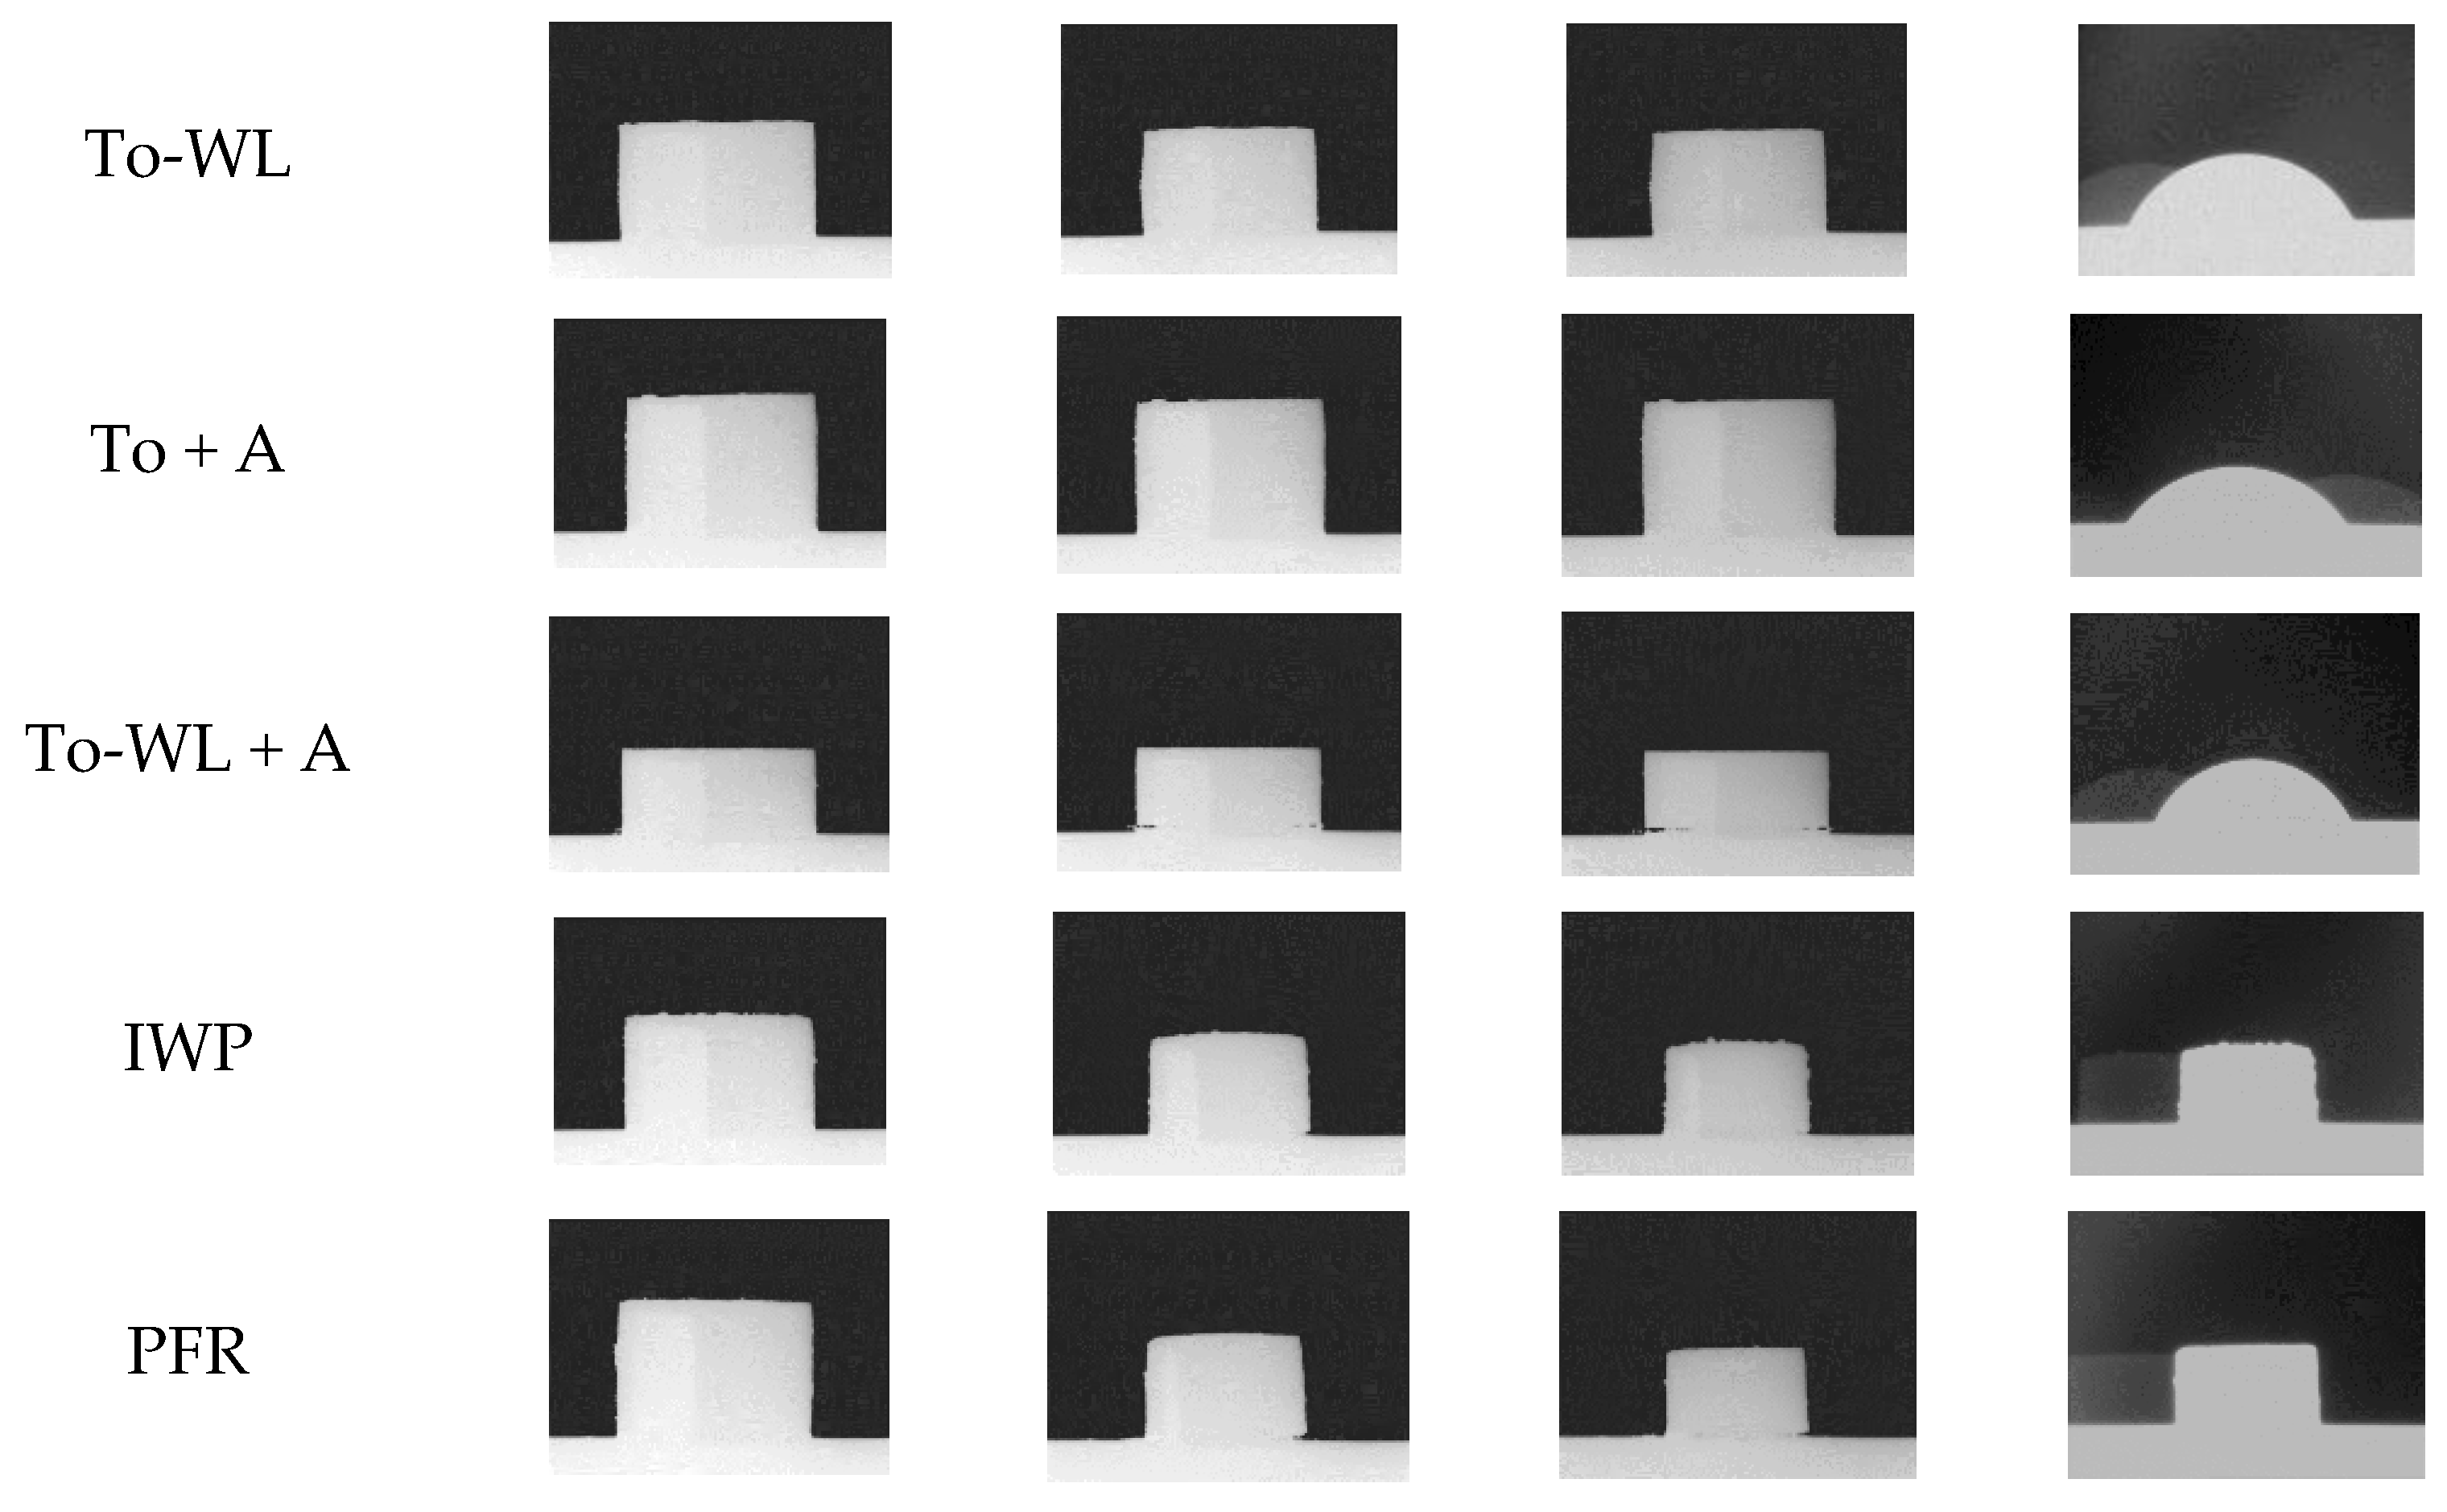
3.1.4. Ash Fusion Testing
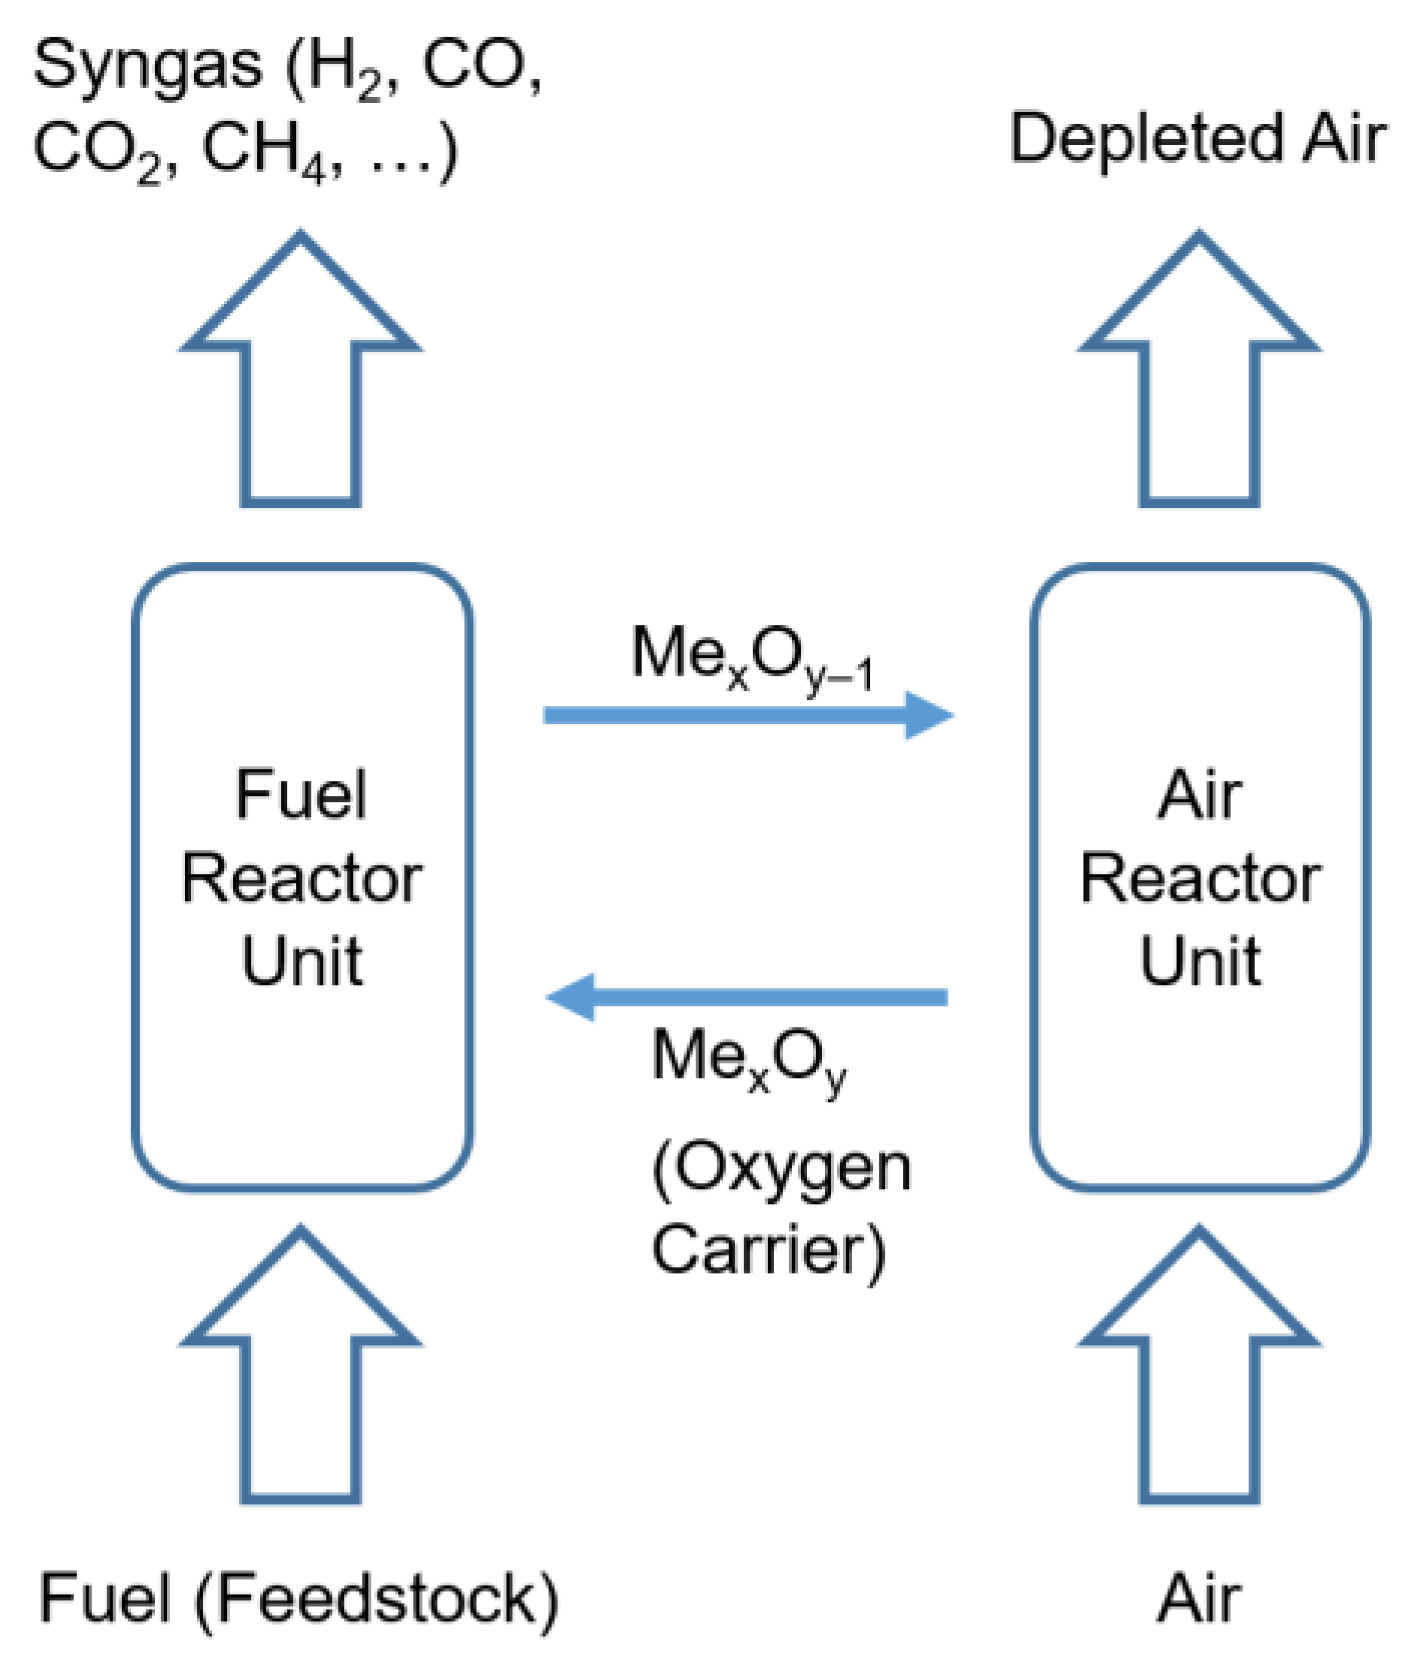
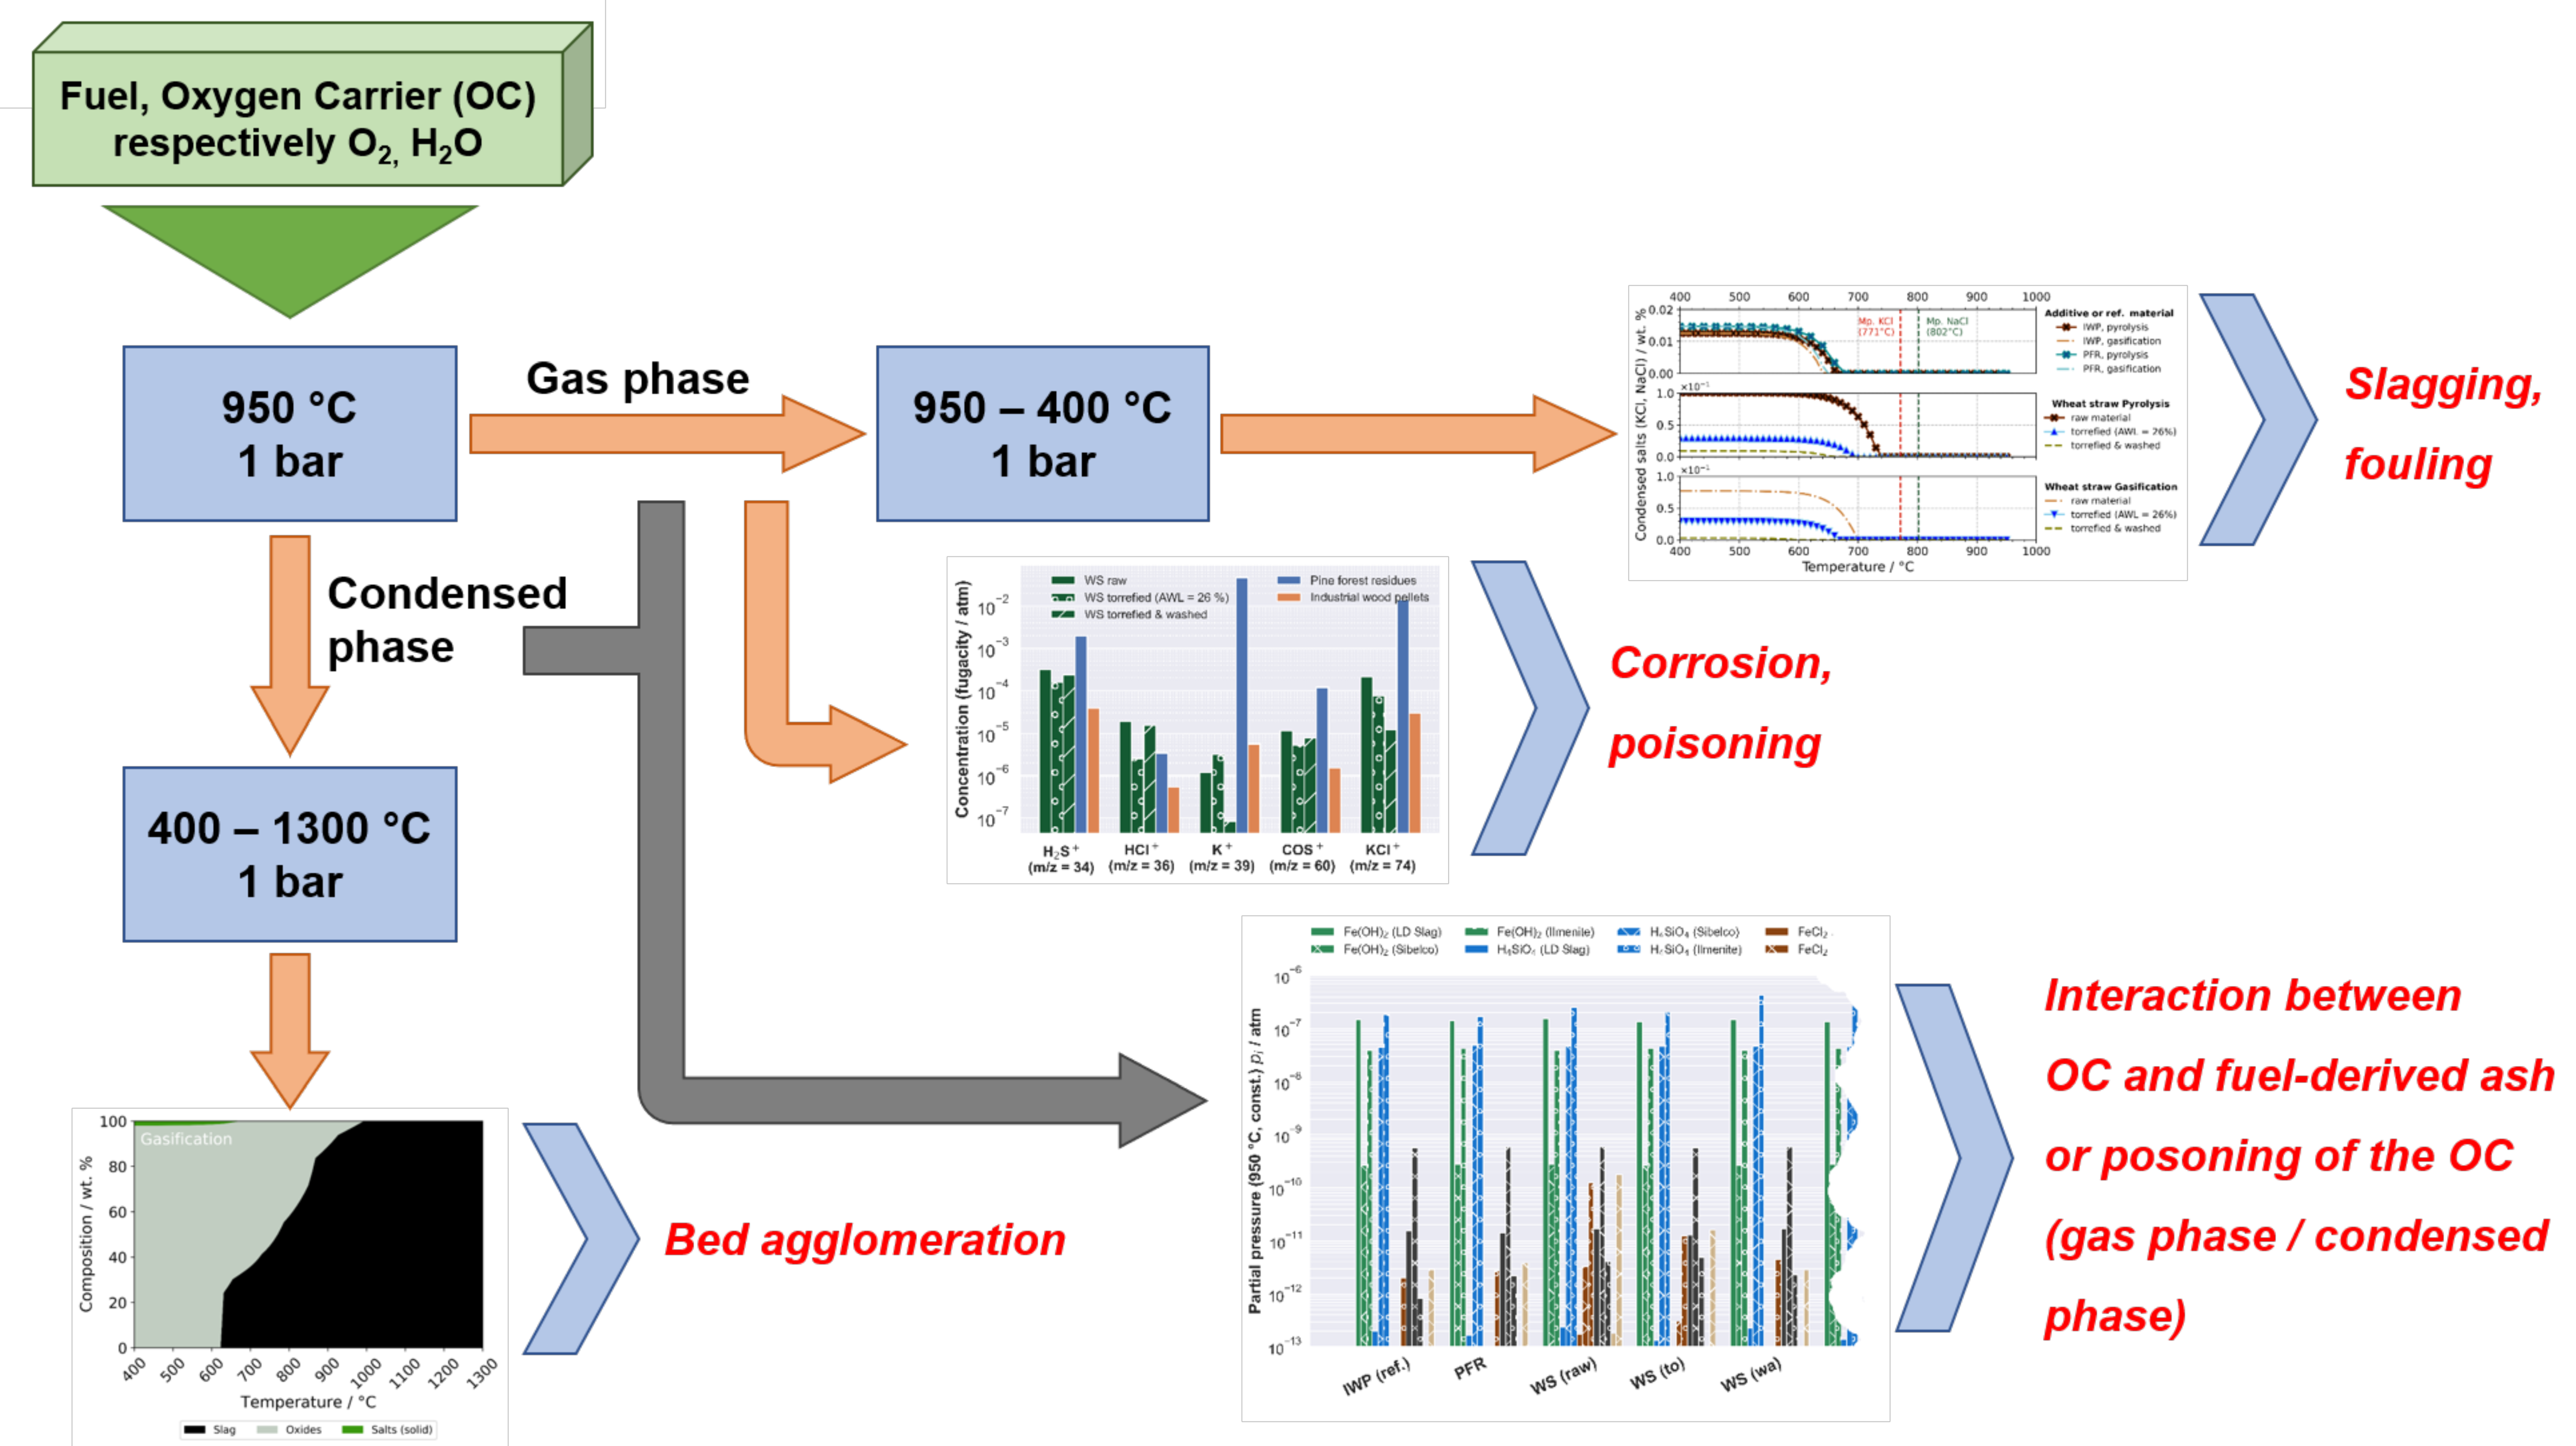
3.2. Thermodynamic Modelling
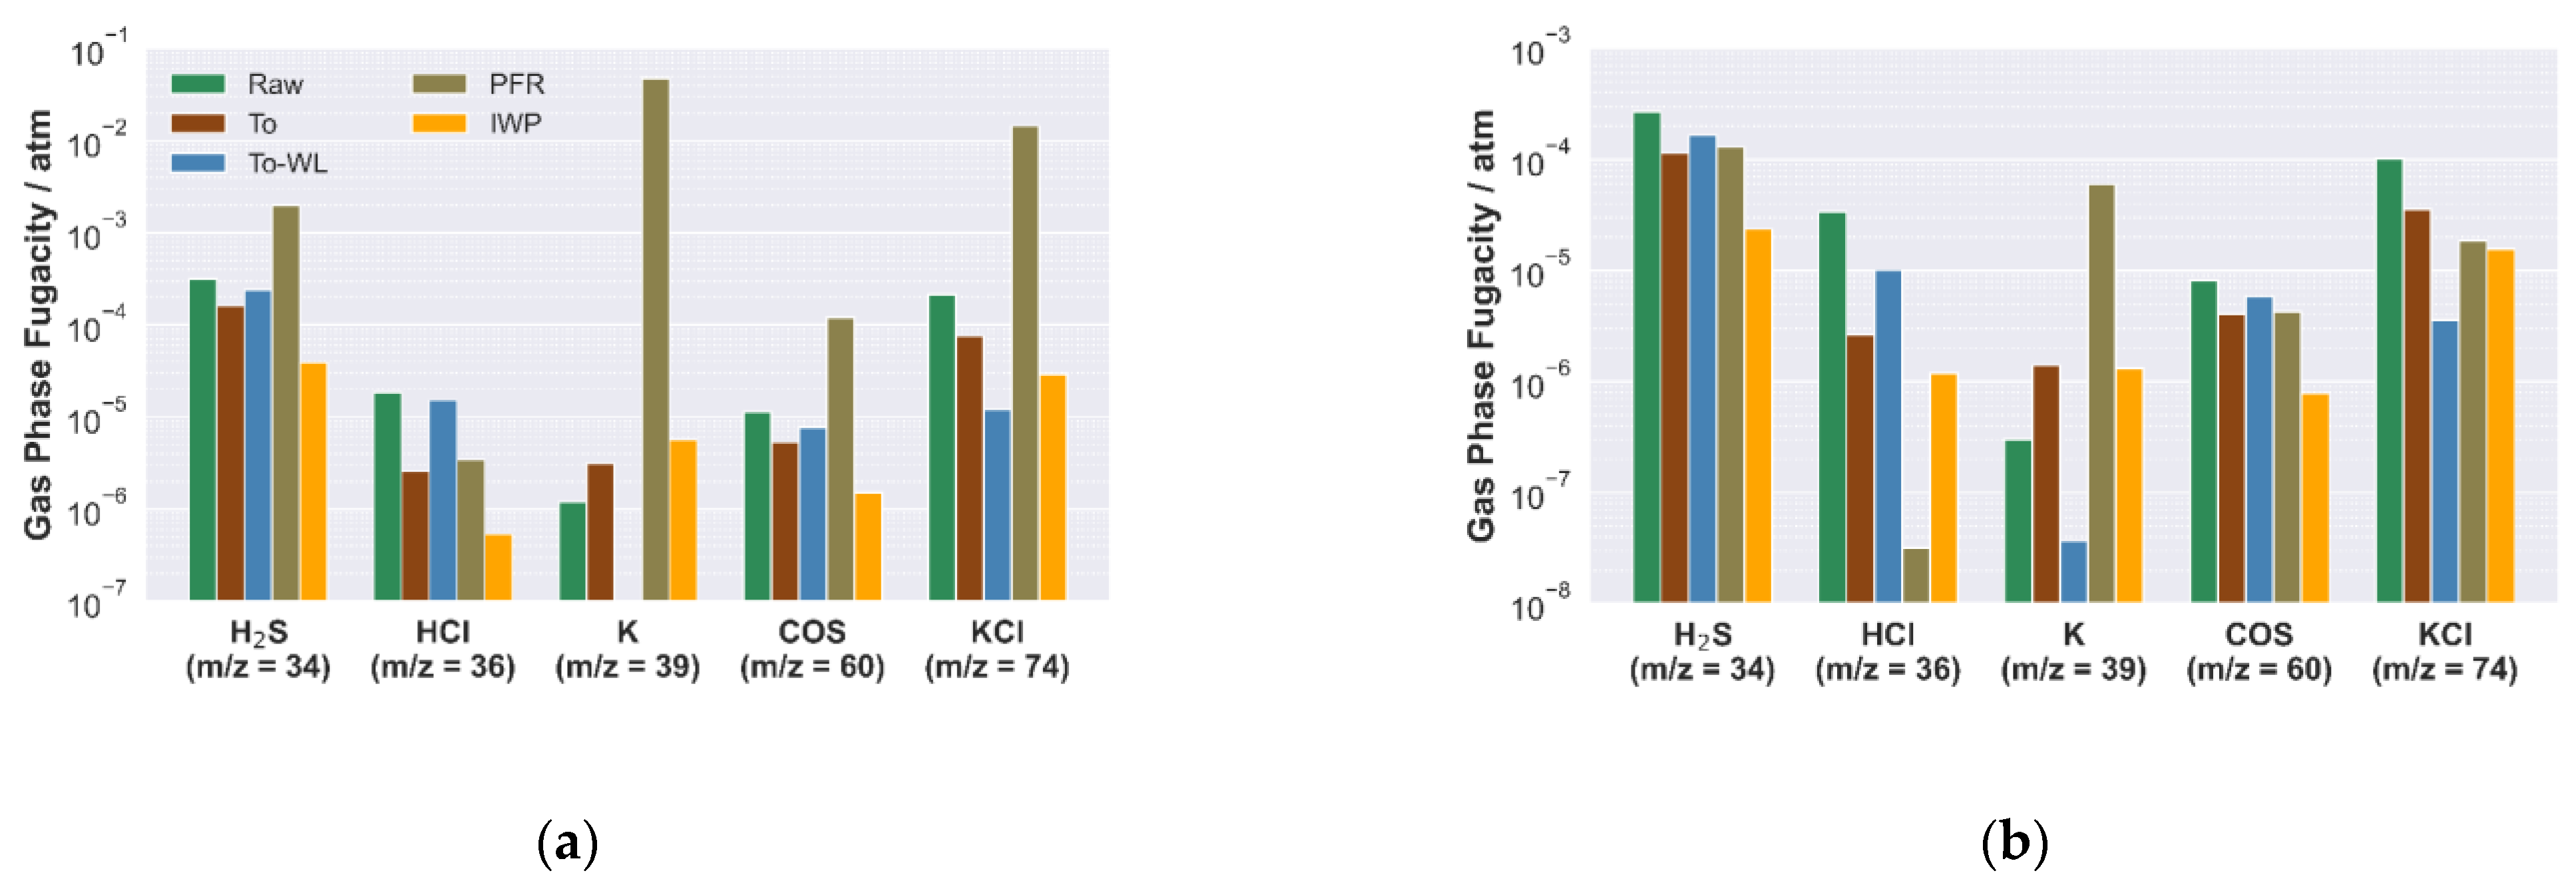
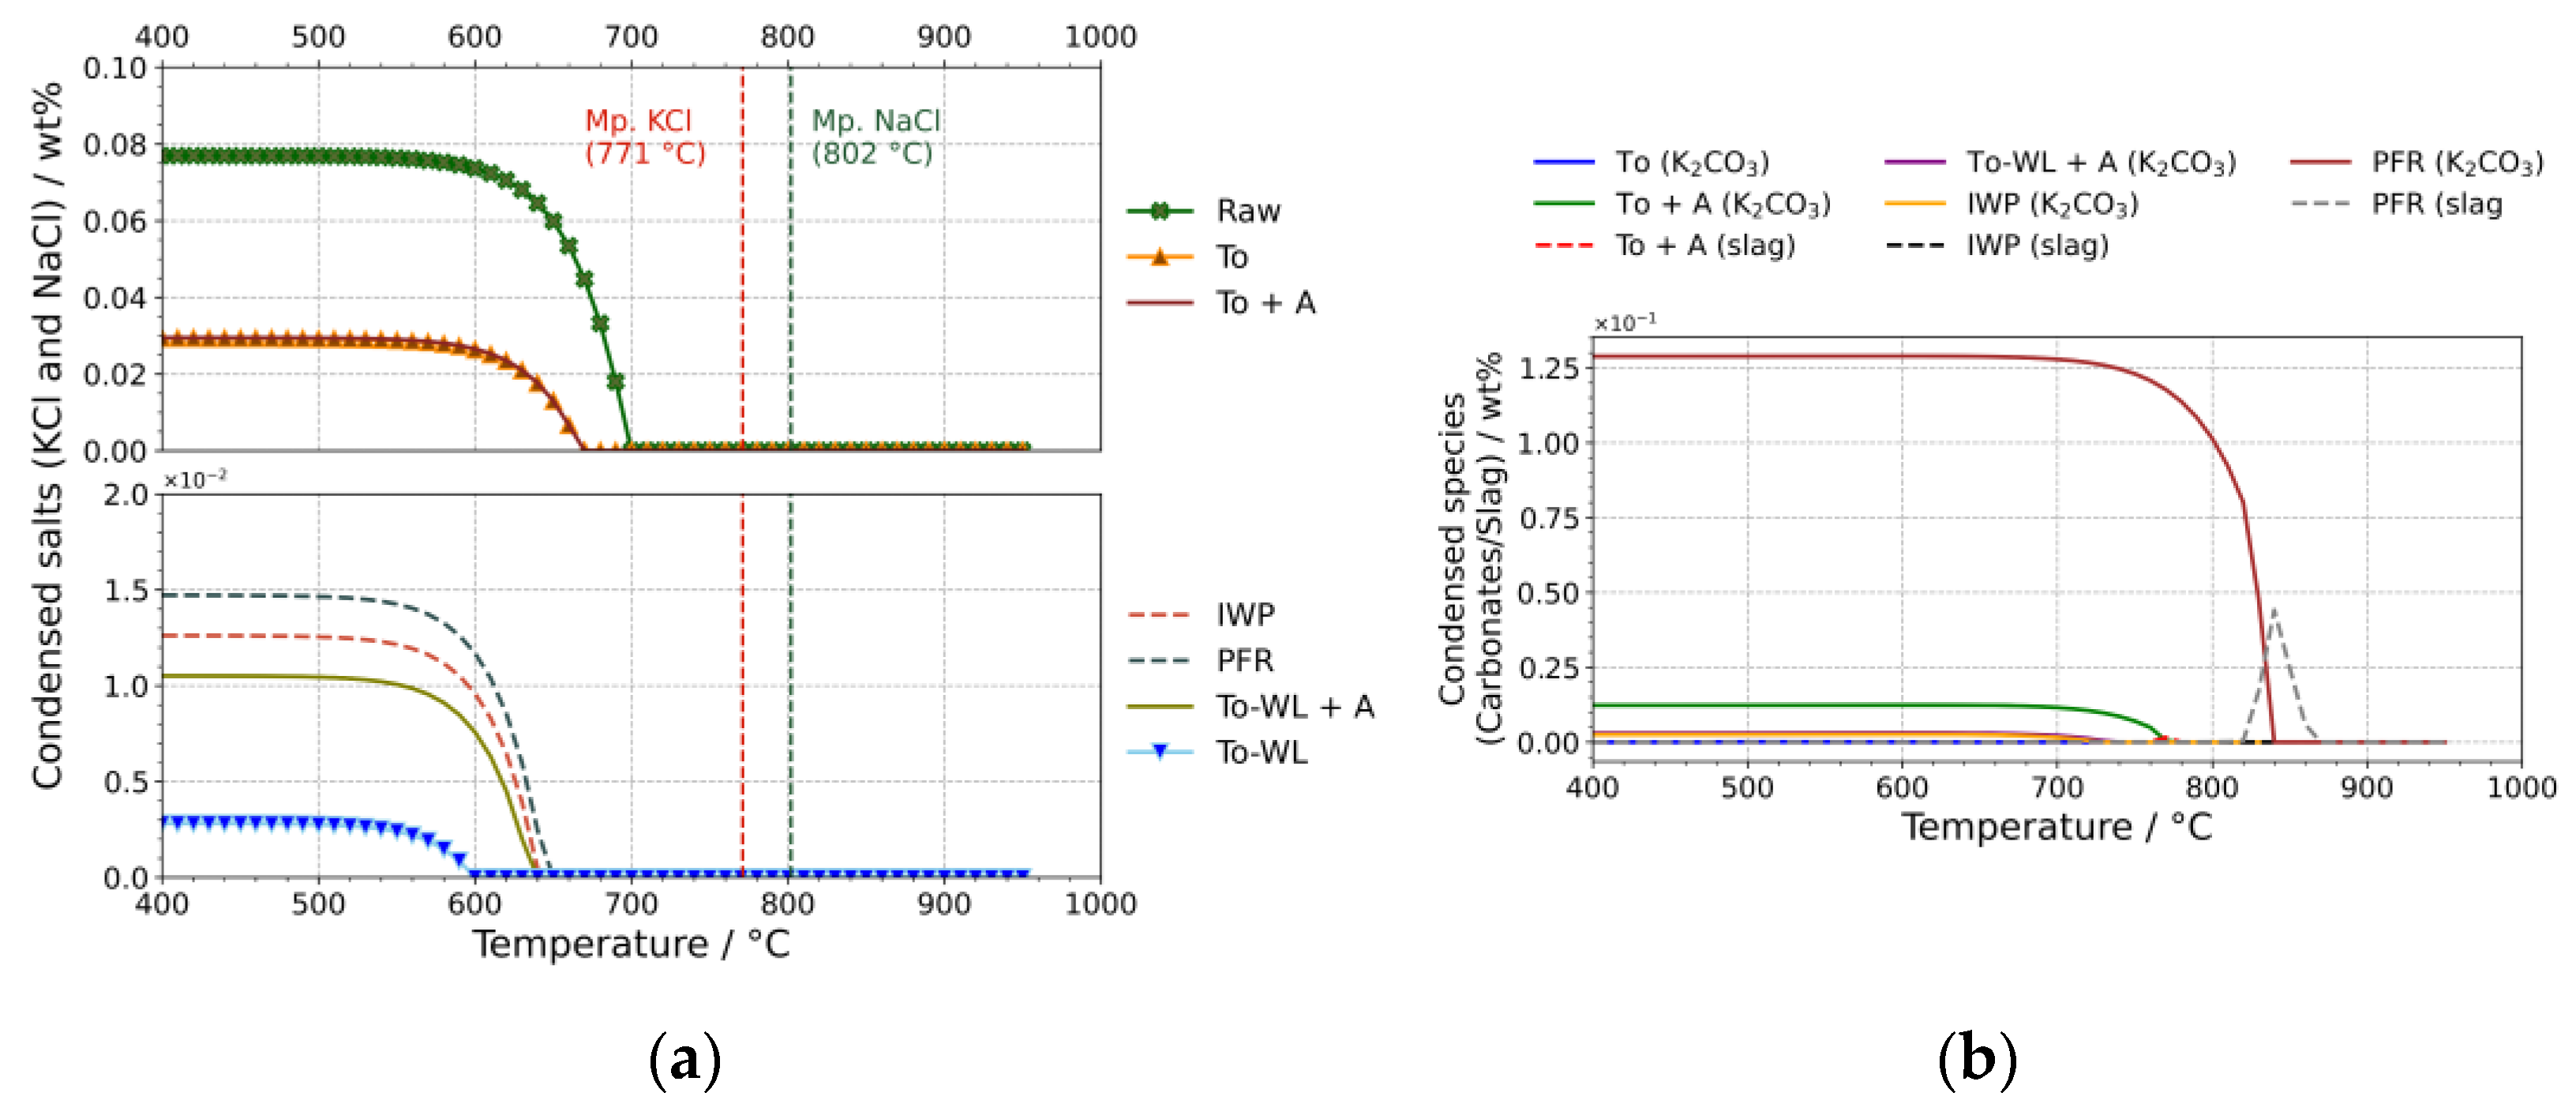
3.2.1. Release and Condensation of Volatile Inorganic Species
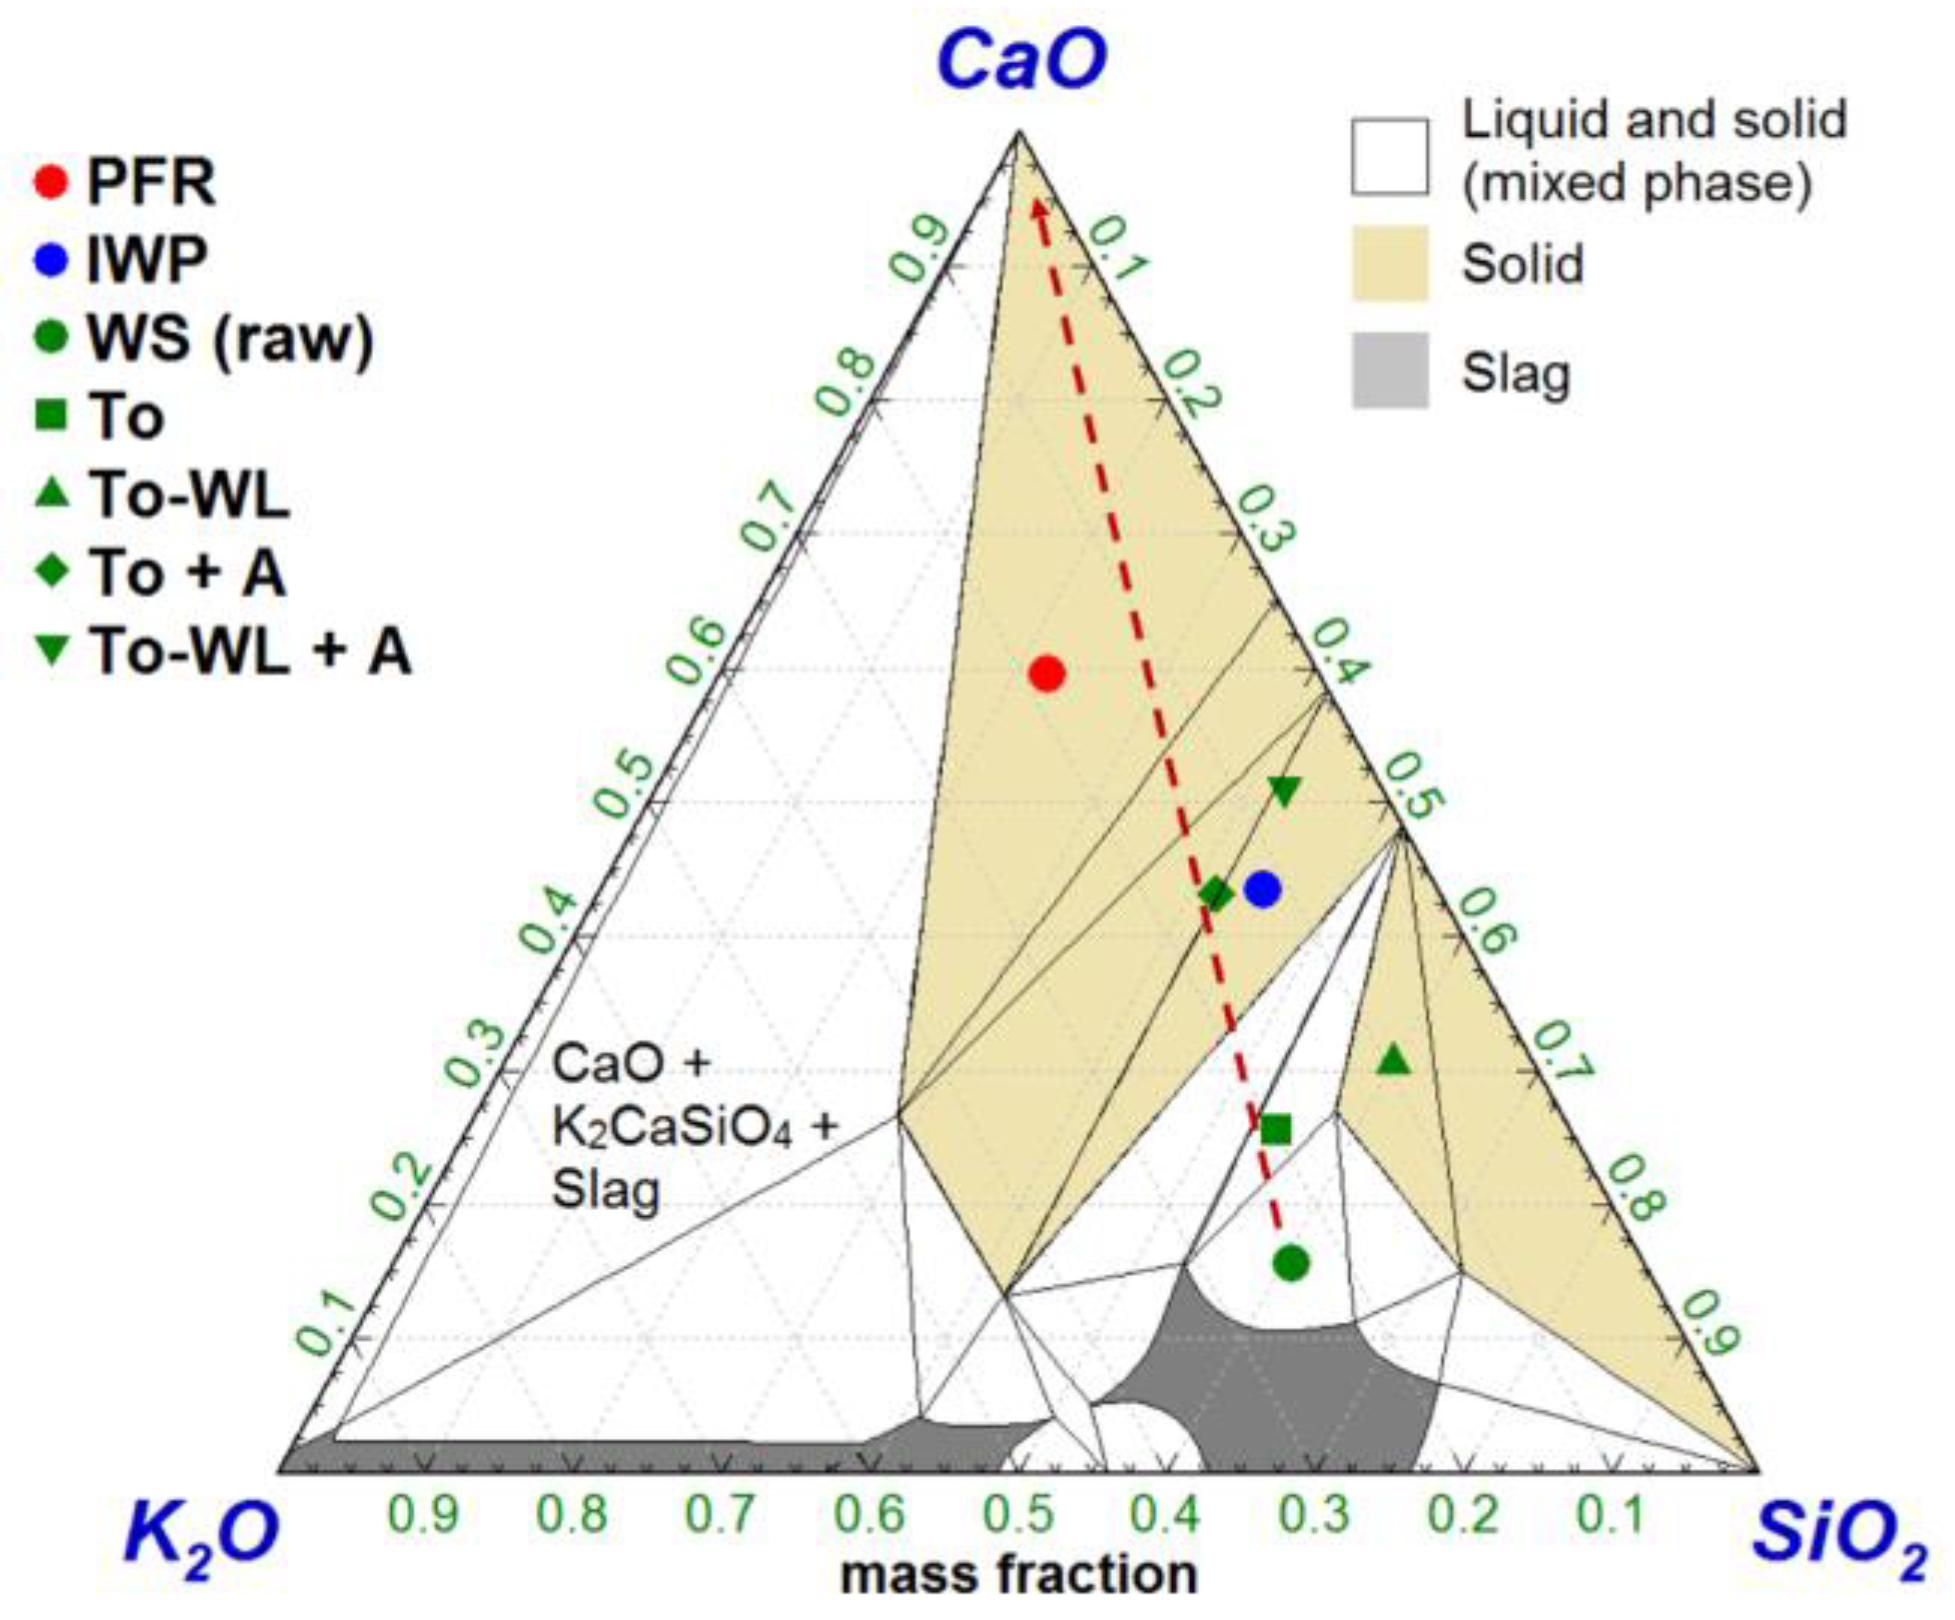
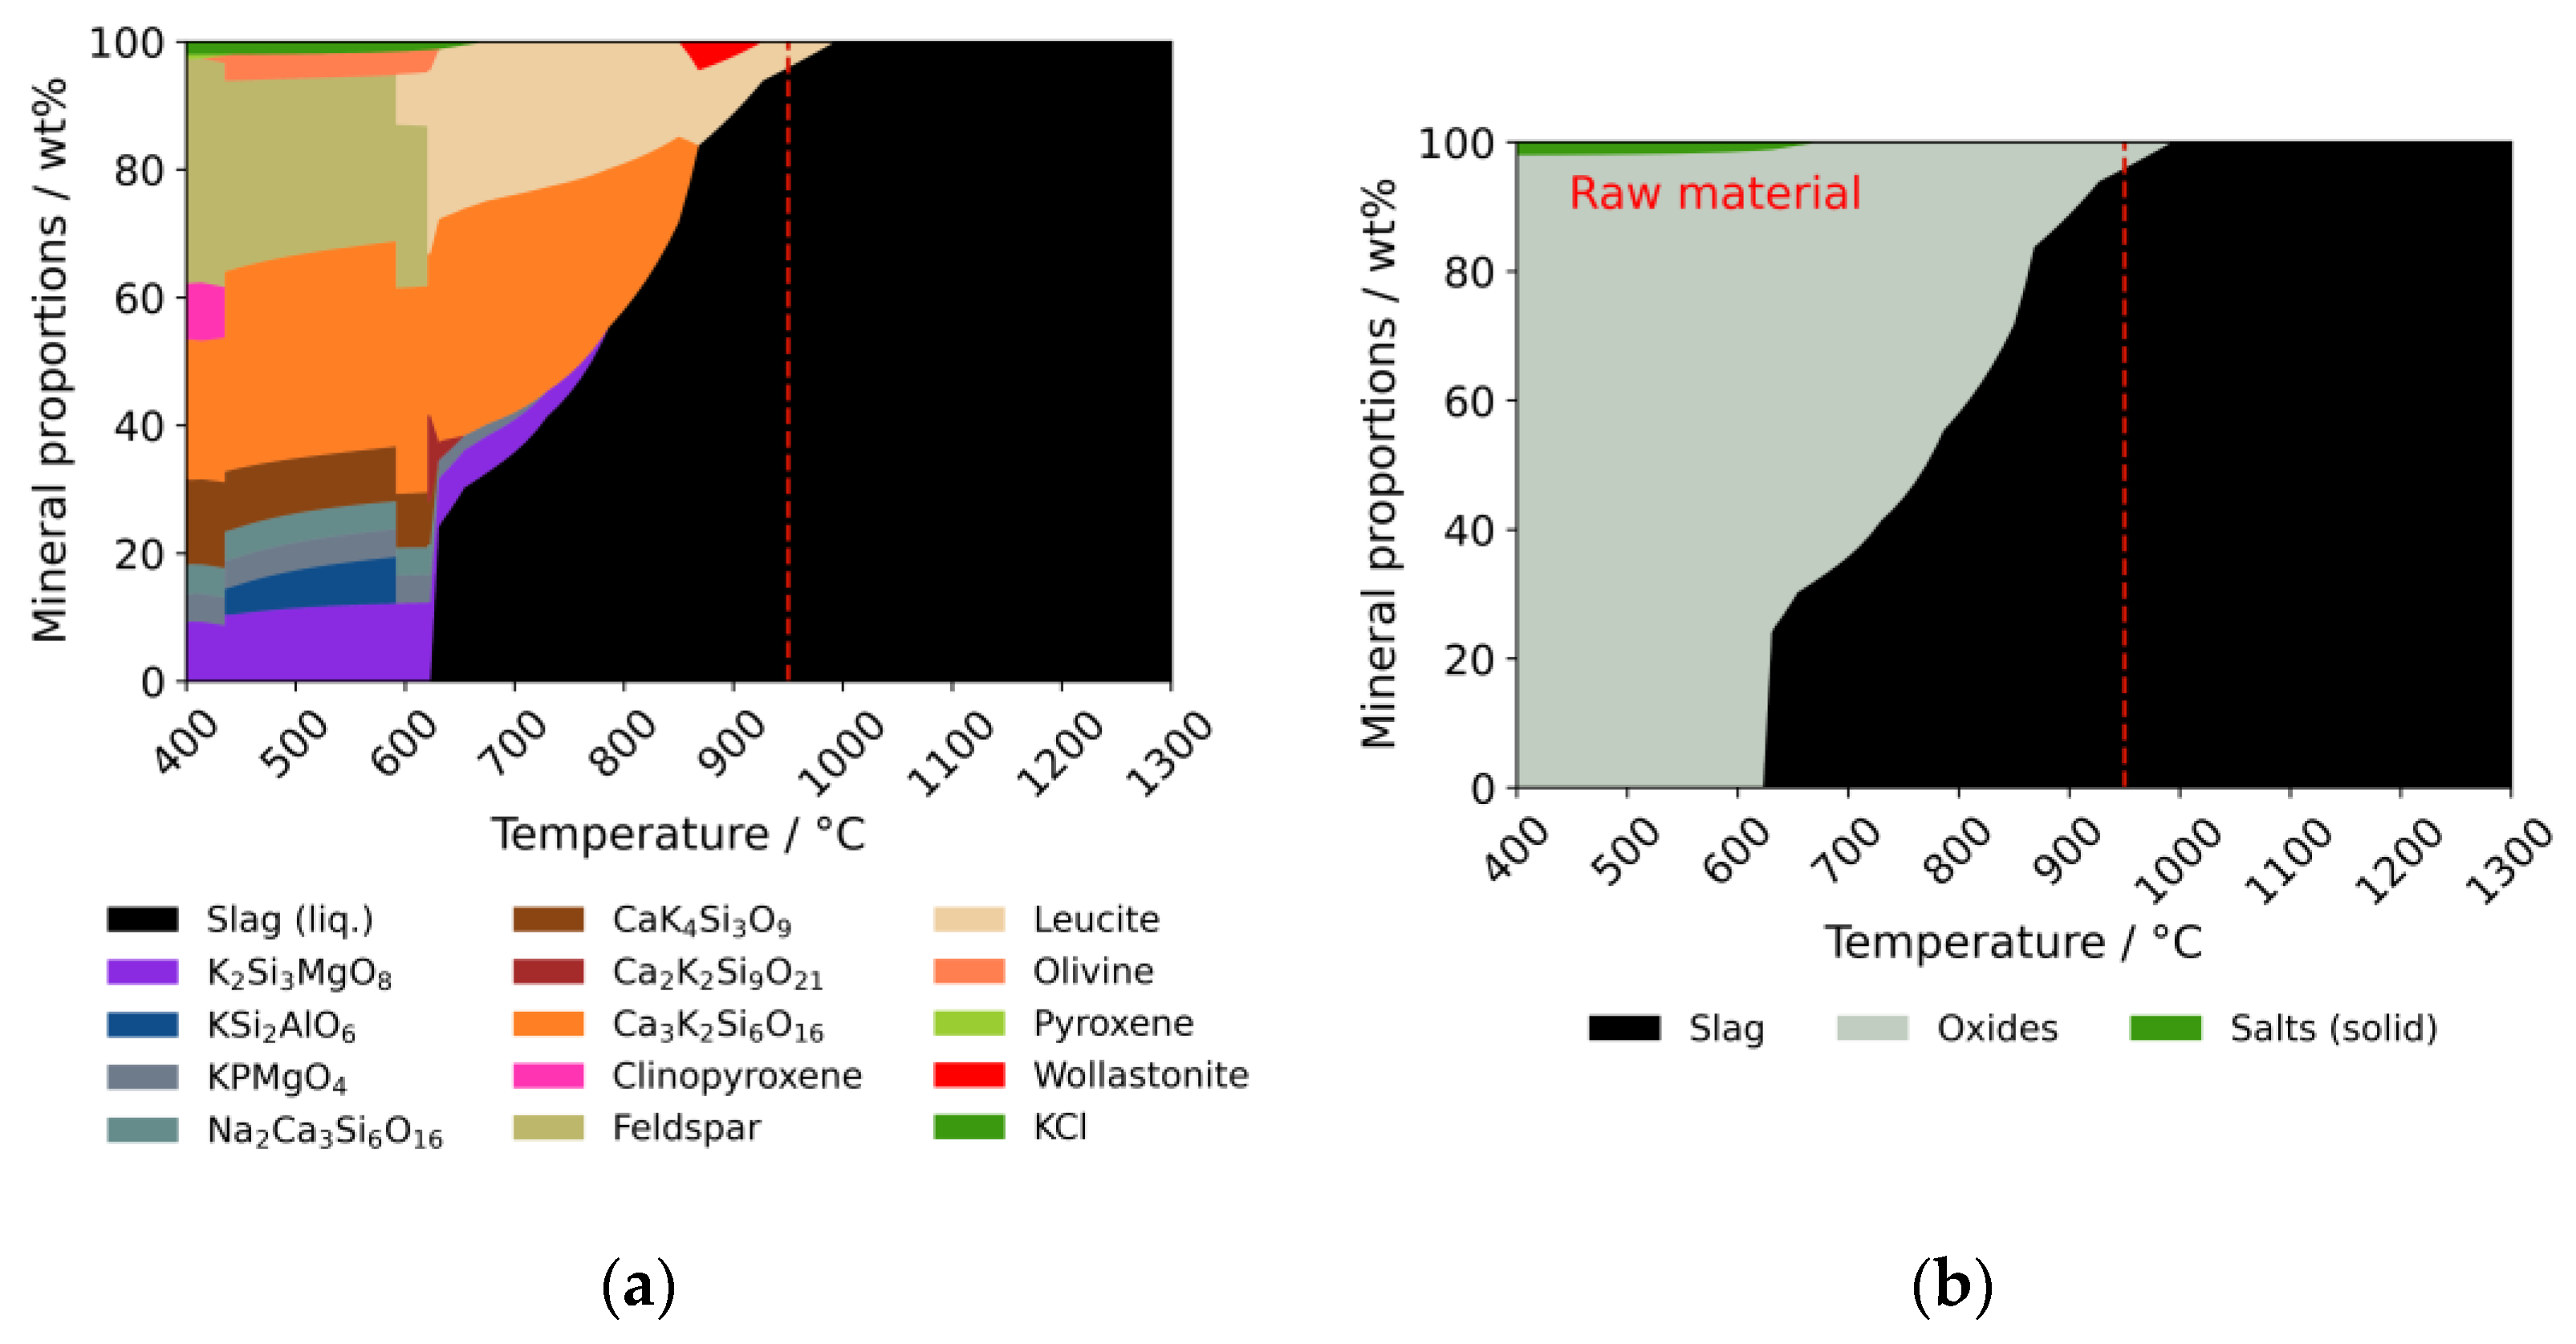
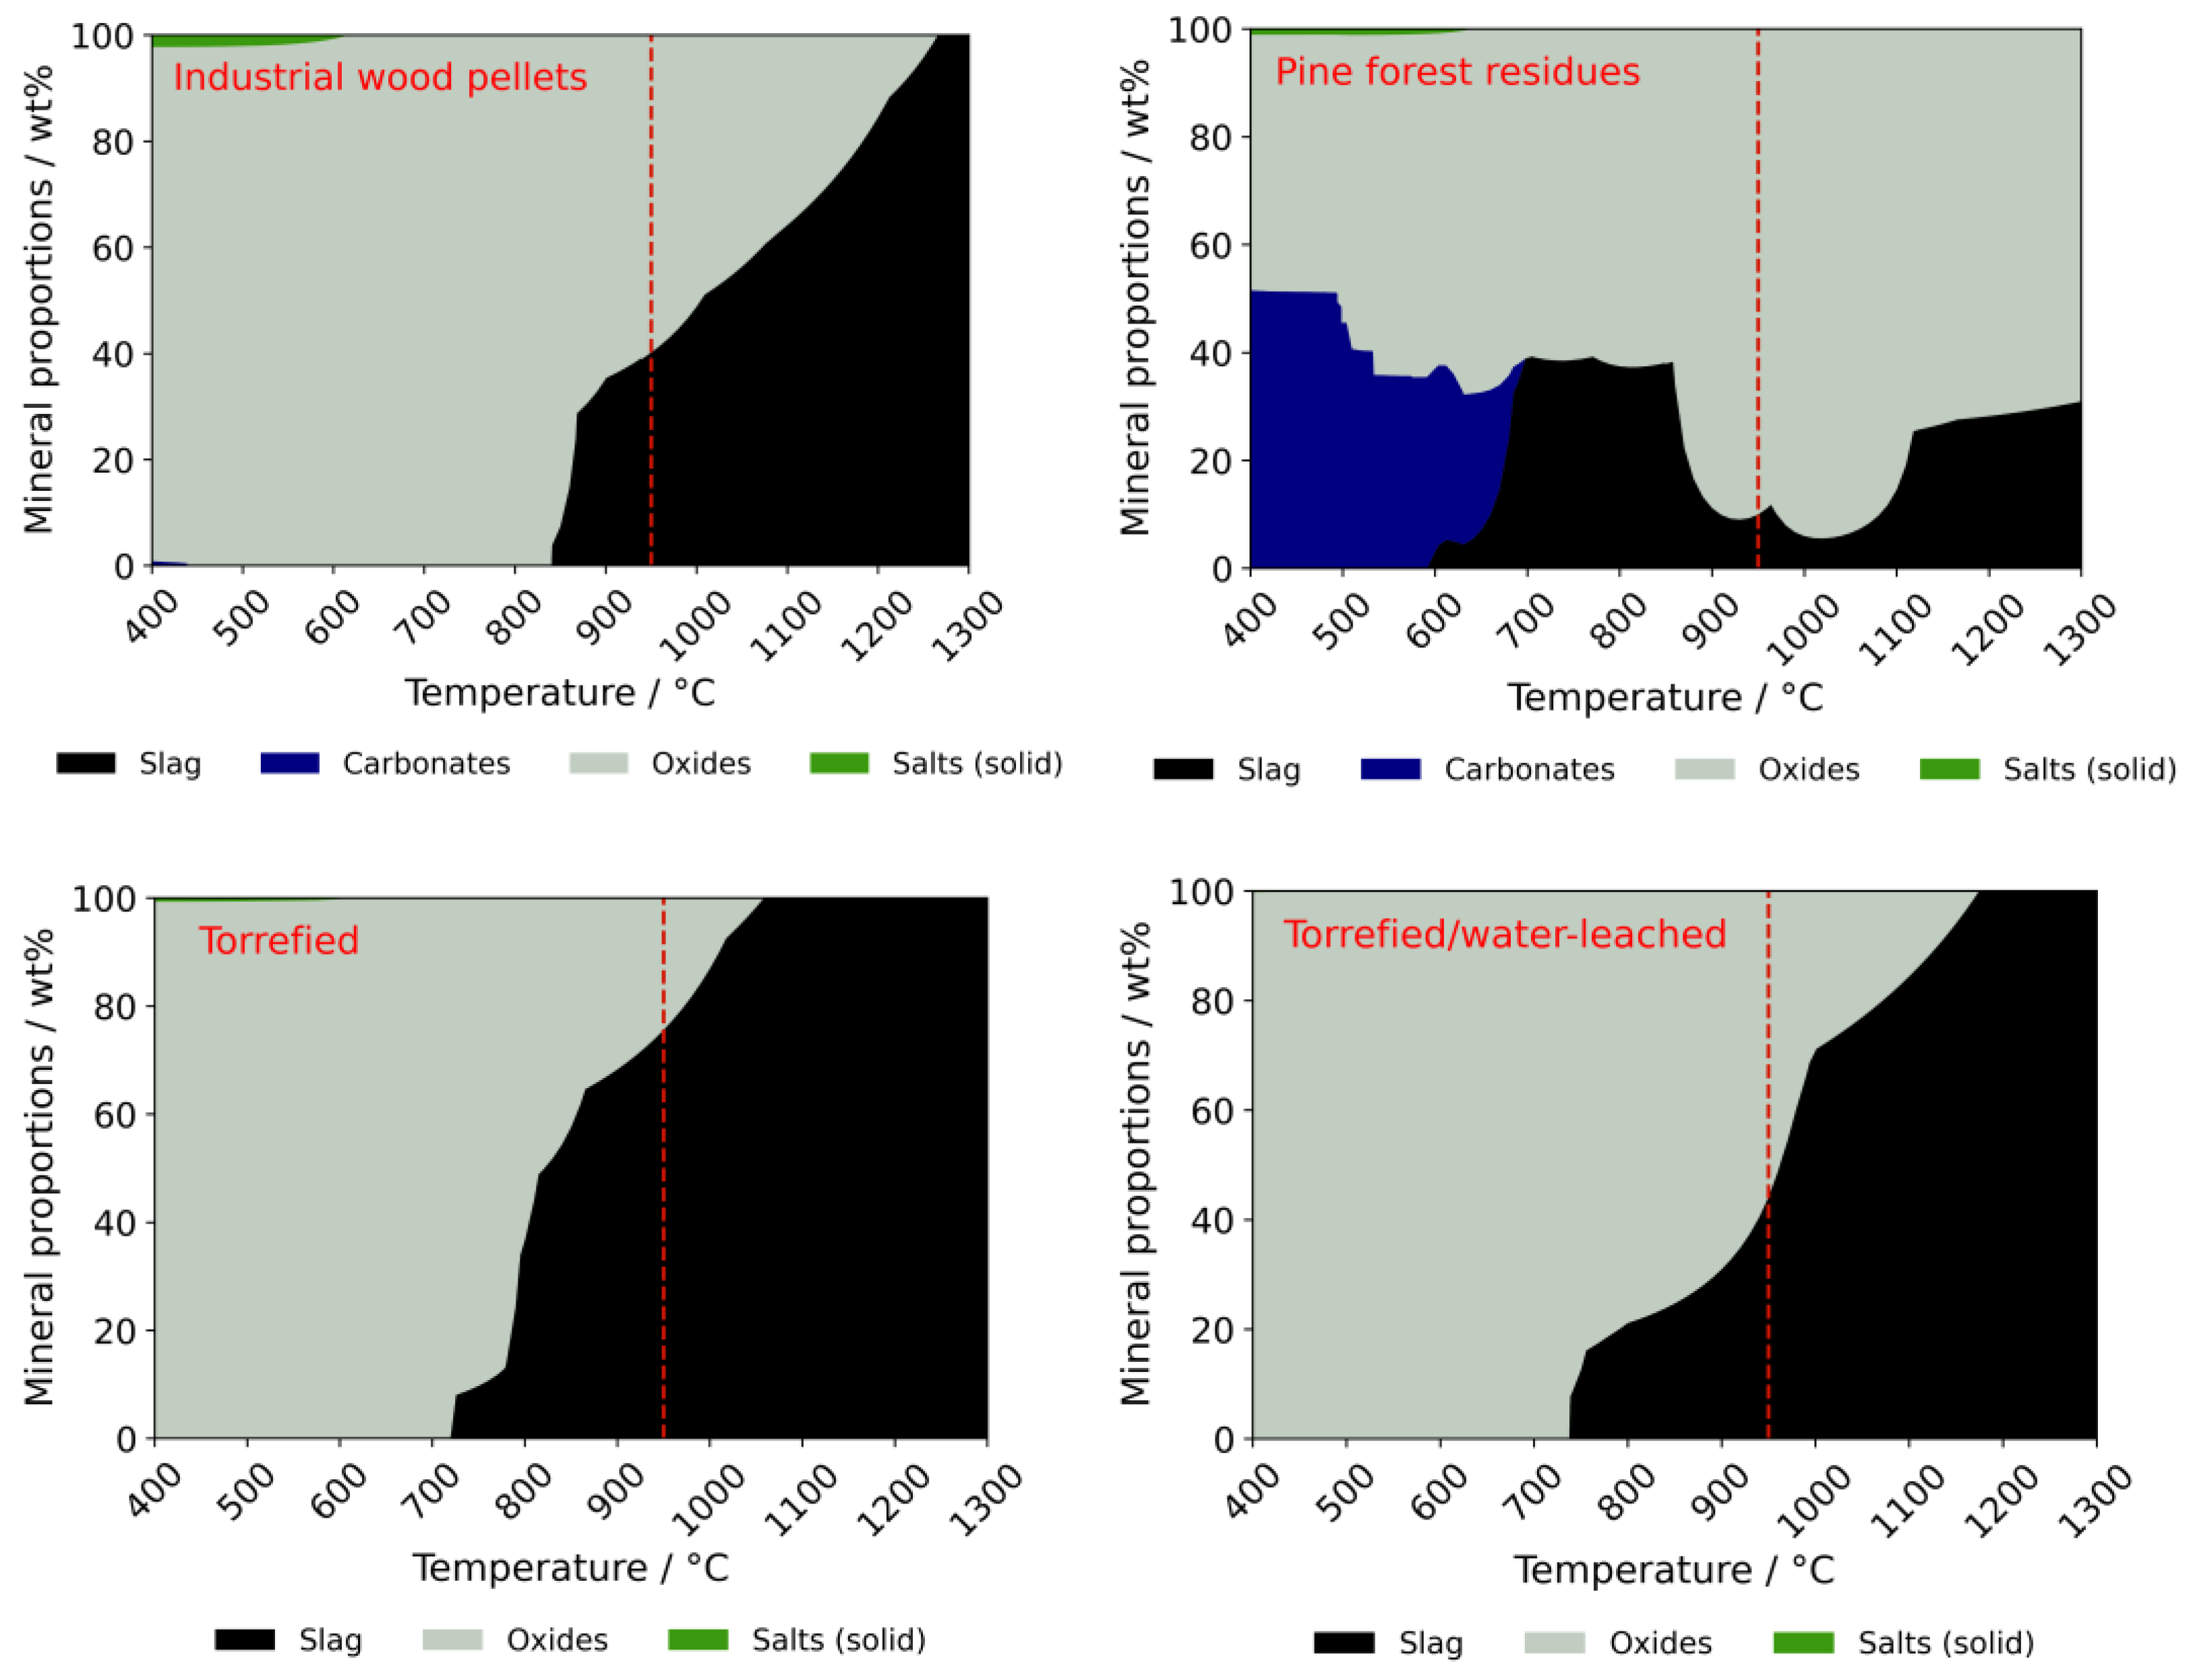
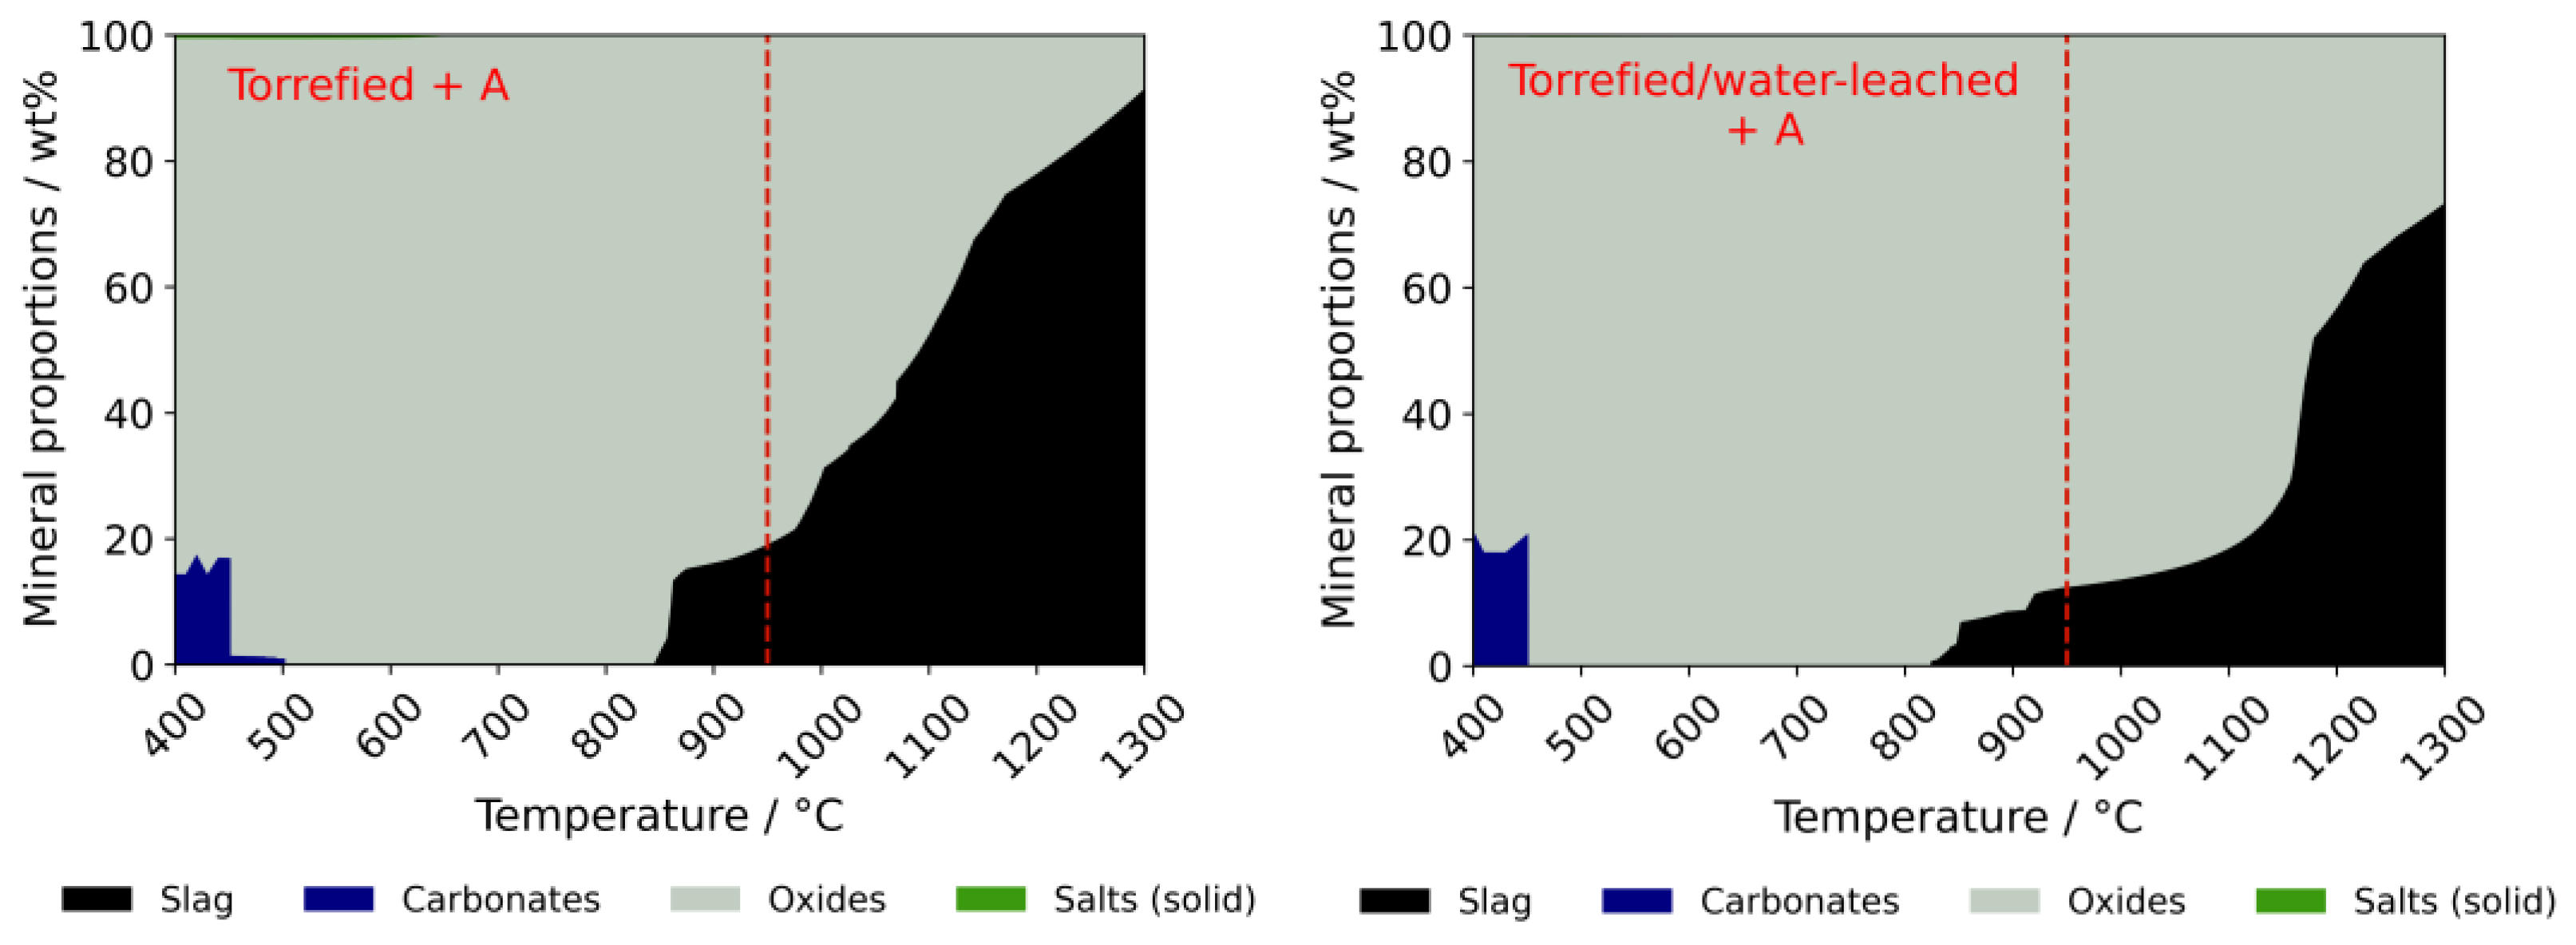
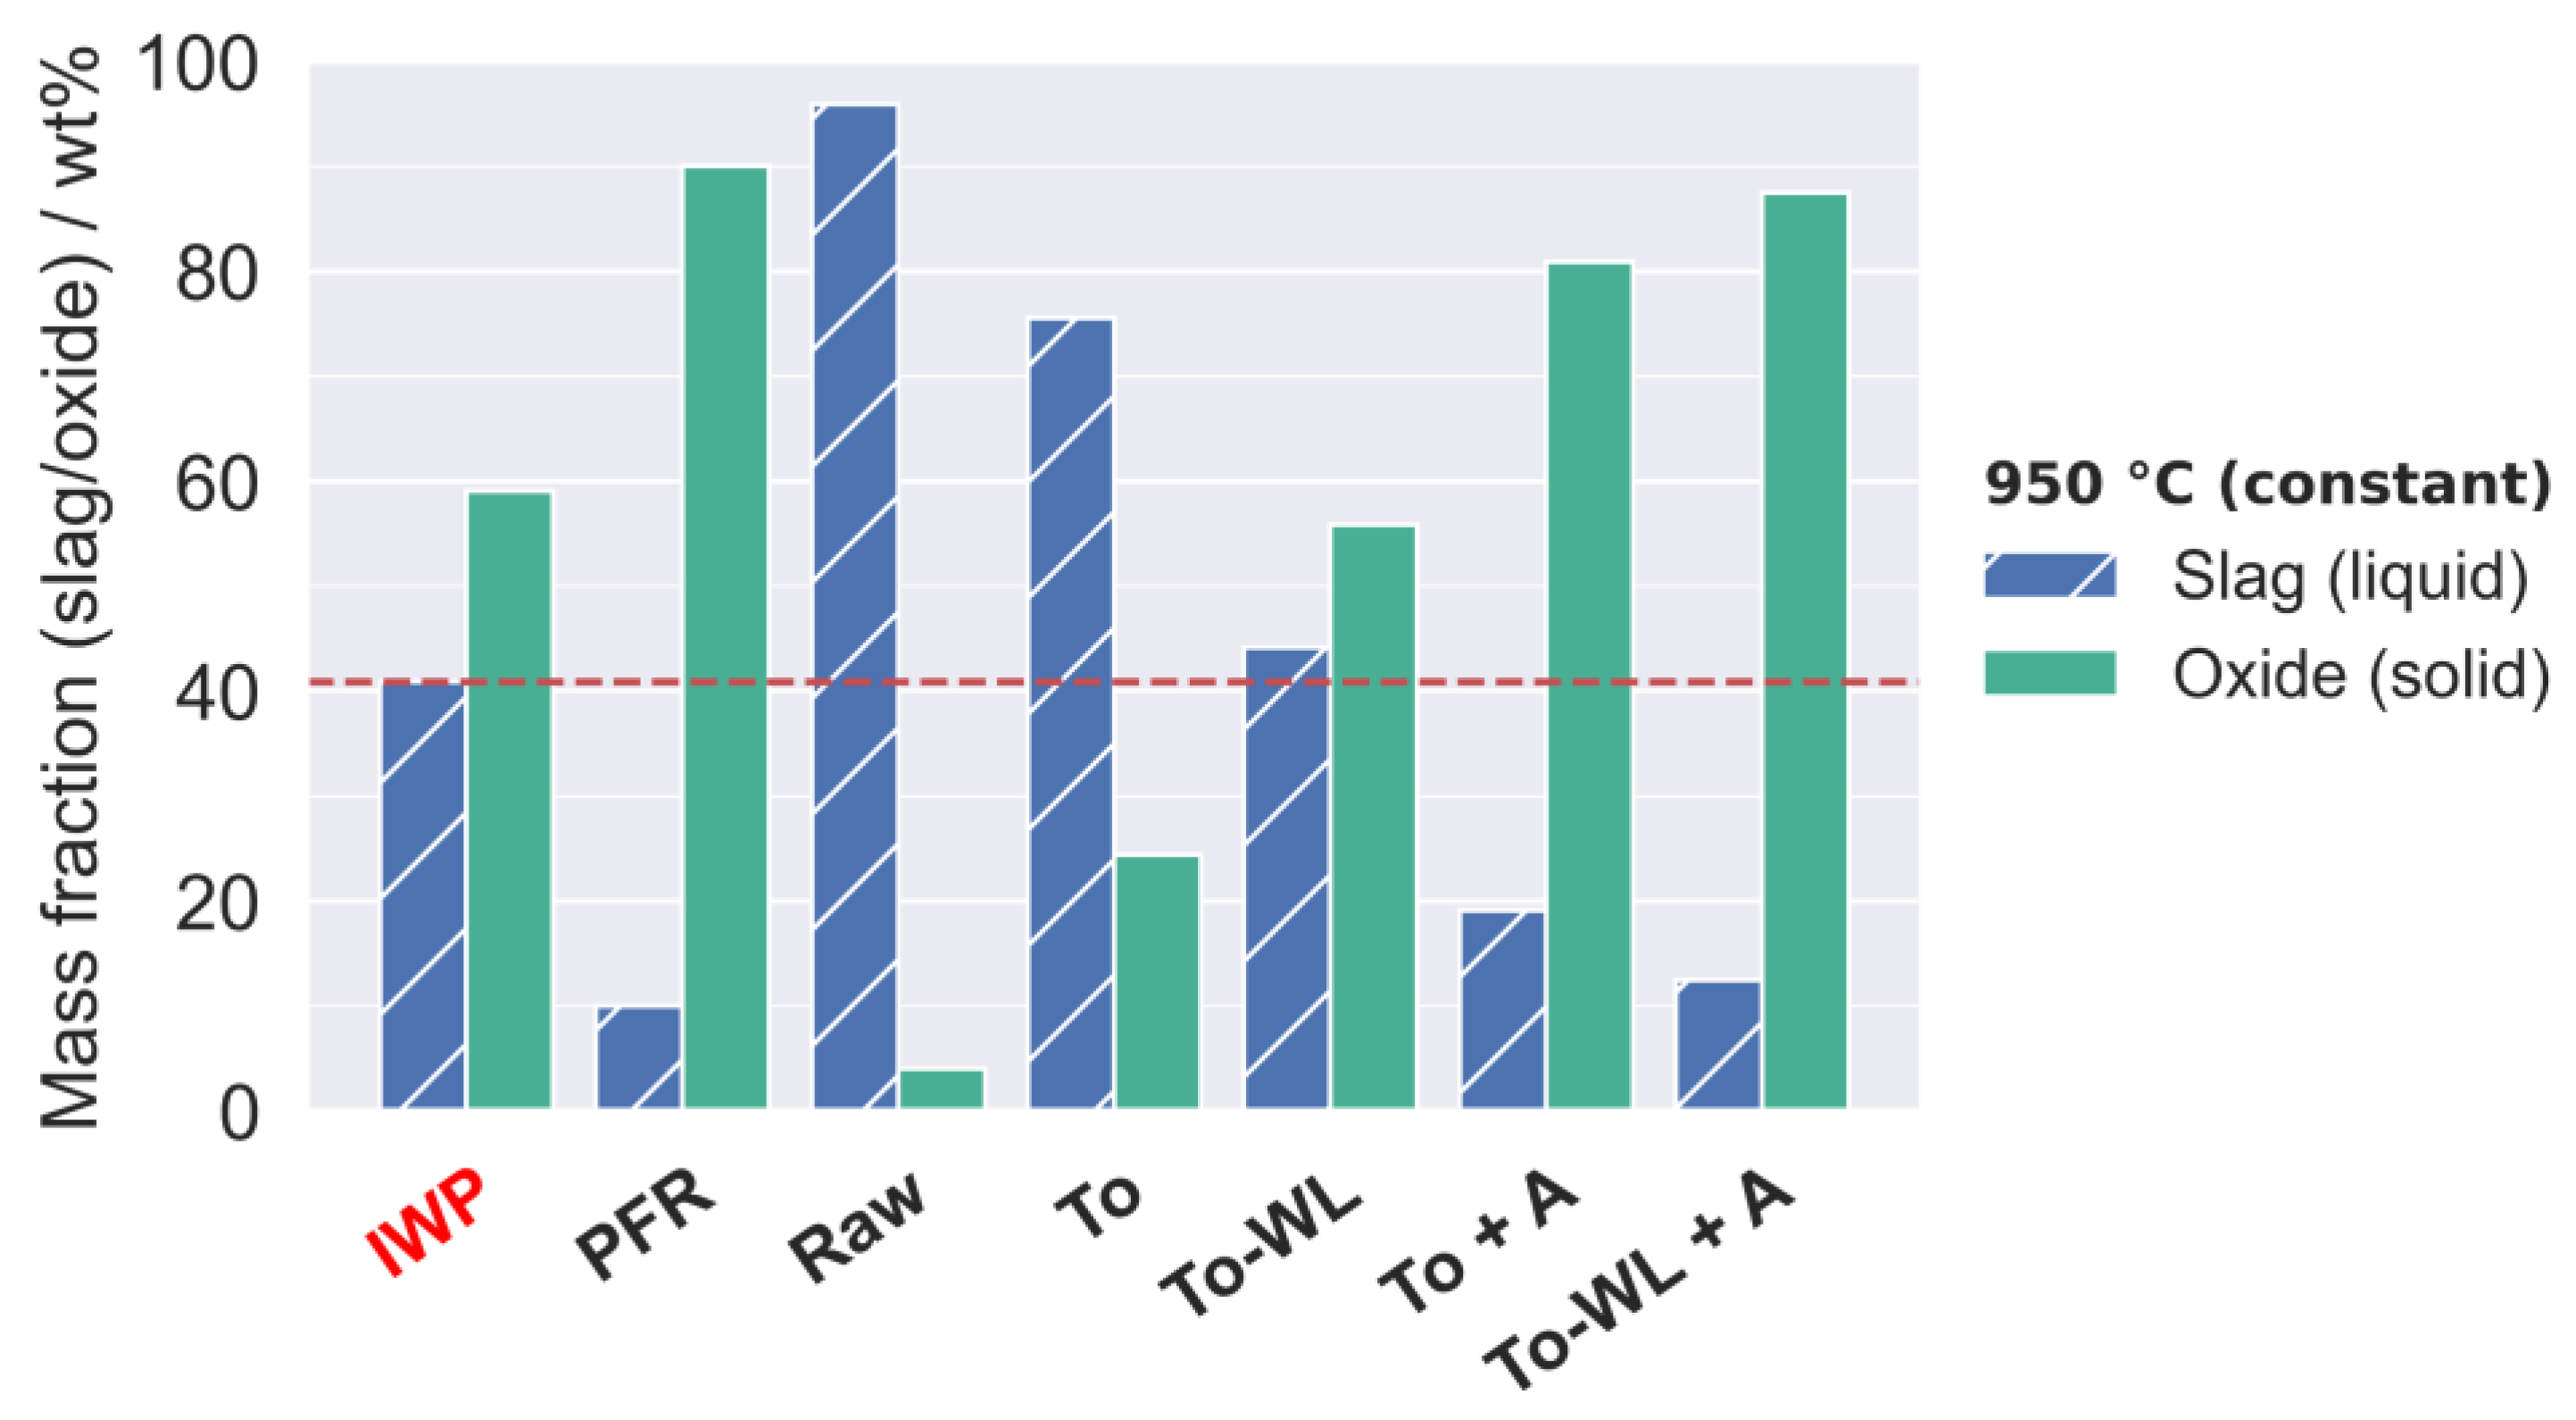
3.2.2. Ash Behavior
3.2.3. Interaction and Poisoning of Oxygen Carrier Materials
4. Discussion
4.1. Fouling and Slagging
4.2. Bed Agglomeration
4.3. High-Temperature Corrosion
4.4. Oxygen Carrier Poisoning
5. Conclusions
Author Contributions
Funding
Institutional Review Board Statement
Informed Consent Statement
Data Availability Statement
Conflicts of Interest
References
- United Nations. Paris Climate Agreement. 2015. Available online: https://unfccc.int/process-and-meetings/the-paris-agreement/the-paris-agreement (accessed on 29 March 2022).
- Cherubini, F.; Peters, G.P.; Berntsen, T.; Strømman, A.H.; Hertwich, E. CO2 emissions from biomass combustion for bioenergy: Atmospheric decay and contribution to global warming. GCB Bioenergy 2011, 3, 413–426. [Google Scholar] [CrossRef]
- Mohamed, U.; Zhao, Y.; Huang, Y.; Cui, Y.; Shi, L.; Li, C.; Pourkashanian, M.; Wei, G.; Yi, Q.; Nimmo, W. Sustainability evaluation of biomass direct gasification using chemical looping technology for power generation with and w/o CO2 capture. Energy 2020, 205, 117904. [Google Scholar] [CrossRef]
- Ishida, M.; Zheng, D.; Akehata, T. Evaluation of a chemical-looping-combustion power-generation system by graphic exergy analysis. Energy 1987, 12, 147–154. [Google Scholar] [CrossRef]
- Huang, Z.; He, F.; Feng, Y.; Zhao, K.; Zheng, A.; Chang, S.; Wei, G.; Zhao, Z.; Li, H. Biomass char direct chemical looping gasification using NiO-modified iron ore as an oxygen carrier. Energy Fuels 2014, 28, 183–191. [Google Scholar] [CrossRef]
- Huang, Z.; He, F.; Zheng, A.; Zhao, K.; Chang, S.; Zhao, Z.; Li, H. Synthesis gas production from biomass gasification using steam coupling with natural hematite as oxygen carrier. Energy 2013, 53, 244–251. [Google Scholar] [CrossRef]
- Ge, H.; Guo, W.; Shen, L.; Song, T.; Xiao, J. Biomass gasification using chemical looping in a 25 kWth reactor with natural hematite as oxygen carrier. Chem. Eng. J. 2016, 286, 174–183. [Google Scholar] [CrossRef]
- Nguyen, N.M.; Alobaid, F.; Dieringer, P.; Epple, B. Biomass-Based Chemical Looping Gasification: Overview and Recent Developments. Appl. Sci. 2021, 11, 7069. [Google Scholar] [CrossRef]
- CLARA. Chemical Looping Gasification for Sustainable Production of Biofuels. Available online: https://clara-h2020.eu/ (accessed on 29 March 2022).
- Zeng, T.; Mlonka-Mędrala, A.; Lenz, V.; Nelles, M. Evaluation of bottom ash slagging risk during combustion of herbaceous and woody biomass fuels in a small-scale boiler by principal component analysis. Biomass Convers. Biorefinery 2021, 11, 1211–1229. [Google Scholar] [CrossRef]
- Demirbaş, A. Demineralization of agricultural residues by water leaching. Energy Sources 2003, 25, 679–687. [Google Scholar] [CrossRef]
- Boström, D.; Grimm, A.; Boman, C.; Björnbom, E.; Ohman, M. Influence of kaolin and calcite additives on ash transformations in small-scale combustion of oat. Energy Fuels 2009, 23, 5184–5190. [Google Scholar] [CrossRef]
- Kassman, H.; Pettersson, J.; Steenari, B.-M.; Åmand, L.-E. Two strategies to reduce gaseous KCl and chlorine in deposits during biomass combustion—Injection of ammonium sulphate and co-combustion with peat. Fuel Process. Technol. 2013, 105, 170–180. [Google Scholar] [CrossRef]
- Baxter, L.L.; Miles, T.R.; Miles, T.R., Jr.; Jenkins, B.M.; Milne, T.; Dayton, D.; Bryers, R.W.; Oden, L.L. The behavior of inorganic material in biomass-fired power boilers: Field and laboratory experiences. Fuel Process. Technol. 1998, 54, 47–78. [Google Scholar] [CrossRef]
- Vassilev, S.V.; Baxter, D.; Vassileva, C.G. An overview of the behaviour of biomass during combustion: Part II. Ash fusion and ash formation mechanisms of biomass types. Fuel 2014, 117, 152–183. [Google Scholar] [CrossRef]
- Wang, Y.; Wu, H.; Sárossy, Z.; Dong, C.; Glarborg, P. Release and transformation of chlorine and potassium during pyrolysis of KCl doped biomass. Fuel 2017, 197, 422–432. [Google Scholar] [CrossRef]
- Zeng, T.; Weller, N.; Pollex, A.; Lenz, V. Blended biomass pellets as fuel for small scale combustion appliances: Influence on gaseous and total particulate matter emissions and applicability of fuel indices. Fuel 2016, 184, 689–700. [Google Scholar] [CrossRef]
- Katsaros, G.; Sommersacher, P.; Retschitzegger, S.; Kienzl, N.; Tassou, S.A.; Pandey, D.S. Combustion of poultry litter and mixture of poultry litter with woodchips in a fixed bed lab-scale batch reactor. Fuel 2021, 286, 119310. [Google Scholar] [CrossRef]
- Sommersacher, P.; Brunner, T.; Obernberger, I. Fuel indexes: A novel method for the evaluation of relevant combustion properties of new biomass fuels. Energy Fuels 2012, 26, 380–390. [Google Scholar] [CrossRef]
- Qian, X.; Xue, J.; Yang, Y.; Lee, S.W. Thermal properties and combustion-related problems prediction of agricultural crop residues. Energies 2021, 14, 4619. [Google Scholar] [CrossRef]
- Anukam, A.; Mamphweli, S.; Reddy, P.; Meyer, E.; Okoh, O. Pre-processing of sugarcane bagasse for gasification in a downdraft biomass gasifier system: A comprehensive review. Renew. Sustain. Energy Rev. 2016, 66, 775–801. [Google Scholar] [CrossRef]
- Chiang, K.-Y.; Chien, K.-L.; Lu, C.-H. Characterization and comparison of biomass produced from various sources: Suggestions for selection of pretreatment technologies in biomass-to-energy. Appl. Energy 2012, 100, 164–171. [Google Scholar] [CrossRef]
- Barskov, S.; Zappi, M.; Buchireddy, P.; Dufreche, S.; Guillory, J.; Gang, D.; Hernandez, R.; Bajpai, R.; Baudier, J.; Cooper, R.; et al. Torrefaction of biomass: A review of production methods for biocoal from cultured and waste lignocellulosic feedstocks. Renew. Energy 2019, 142, 624–642. [Google Scholar] [CrossRef]
- Saleh, S.B.; Flensborg, J.P.; Shoulaifar, T.K.; Sárossy, Z.; Hansen, B.B.; Egsgaard, H.; DeMartini, N.; Jensen, P.A.; Glarborg, P.; Dam-Johansen, K. Release of chlorine and sulfur during biomass torrefaction and pyrolysis. Energy Fuels 2014, 28, 3738–3746. [Google Scholar] [CrossRef]
- Yu, C.; Thy, P.; Wang, L.; Anderson, S.N.; VanderGheynst, J.S.; Upadhyaya, S.K.; Jenkins, B.M. Influence of leaching pretreatment on fuel properties of biomass. Fuel Process. Technol. 2014, 128, 43–53. [Google Scholar] [CrossRef]
- Gong, S.H.; Im, H.S.; Um, M.; Lee, H.W.; Lee, J.W. Enhancement of waste biomass fuel properties by sequential leaching and wet torrefaction. Fuel 2019, 239, 693–700. [Google Scholar] [CrossRef]
- Zhang, S.; Su, Y.; Xu, D.; Zhu, S.; Zhang, H.; Liu, X. Effects of torrefaction and organic-acid leaching pretreatment on the pyrolysis behavior of rice husk. Energy 2018, 149, 804–813. [Google Scholar] [CrossRef]
- Chaloupková, V.; Ivanova, T.; Hutla, P.; Špunarová, M. Ash Melting Behavior of Rice Straw and Calcium Additives. Agriculture 2021, 11, 1282. [Google Scholar] [CrossRef]
- Zheng, A.; Zhao, Z.; Chang, S.; Huang, Z.; Zhao, K.; Wei, G.; He, F.; Li, H. Comparison of the effect of wet and dry torrefaction on chemical structure and pyrolysis behavior of corncobs. Bioresour. Technol. 2015, 176, 15–22. [Google Scholar] [CrossRef]
- Lynam, J.G.; Coronella, C.J.; Yan, W.; Reza, M.T.; Vasquez, V.R. Acetic acid and lithium chloride effects on hydrothermal carbonization of lignocellulosic biomass. Bioresour. Technol. 2011, 102, 6192–6199. [Google Scholar] [CrossRef]
- Tu, R.; Jiang, E.; Yan, S.; Xu, X.; Rao, S. The pelletization and combustion properties of torrefied Camellia shell via dry and hydrothermal torrefaction: A comparative evaluation. Bioresour. Technol. 2018, 264, 78–89. [Google Scholar] [CrossRef]
- Bale, C.W.; Bélisle, E.; Chartrand, P.; Decterov, S.A.; Eriksson, G.; Gheribi, A.E.; Hack, K.; Jung, I.-H.; Kang, Y.-B.; Melançon, J.; et al. Reprint of: FactSage thermochemical software and databases, 2010–2016. Calphad 2016, 55, 1–19. [Google Scholar] [CrossRef]
- Yazhenskikh, E.; Jantzen, T.; Hack, K.; Müller, M. A new multipurpose thermodynamic database for oxide systems. Pacnлaвы 2019, 2, 116–124. [Google Scholar] [CrossRef]
- Bläsing, M.; Müller, M. Mass spectrometric investigations on the release of inorganic species during gasification and combustion of German hard coals. Combust. Flame 2010, 157, 1374–1381. [Google Scholar] [CrossRef]
- Bläsing, M.; Zini, M.; Müller, M. Influence of feedstock on the release of potassium, sodium, chlorine, sulfur, and phosphorus species during gasification of wood and biomass shells. Energy Fuels 2013, 27, 1439–1445. [Google Scholar] [CrossRef]
- Pang, C.H.; Hewakandamby, B.; Wu, T.; Lester, E. An automated ash fusion test for characterisation of the behaviour of ashes from biomass and coal at elevated temperatures. Fuel 2013, 103, 454–466. [Google Scholar] [CrossRef]
- Knudsen, J.N.; Jensen, P.A.; Lin, W.; Frandsen, F.J.; Dam-Johansen, K. Sulfur transformations during thermal conversion of herbaceous biomass. Energy Fuels 2004, 18, 810–819. [Google Scholar] [CrossRef]
- Keipi, T.; Tolvanen, H.; Kokko, L.; Raiko, R. The effect of torrefaction on the chlorine content and heating value of eight woody biomass samples. Biomass Bioenergy 2014, 66, 232–239. [Google Scholar] [CrossRef]
- Shemwell, B.; Levendis, Y.A.; Simons, G.A. Laboratory study on the high-temperature capture of HCl gas by dry-injection of calcium-based sorbents. Chemosphere 2001, 42, 785–796. [Google Scholar] [CrossRef]
- Vassilev, S.V.; Baxter, D.; Andersen, L.K.; Vassileva, C.G.; Morgan, T.J. An overview of the organic and inorganic phase composition of biomass. Fuel 2012, 94, 1–33. [Google Scholar] [CrossRef]
- Tiainen, M.S.; Ryynänen, J.S.; Rantala, J.T.; Patrikainen, H.T.; Laitinen, R.S. Determination of Amorphous Material in Peat Ash by X-ray Diffraction. In Impact of Mineral Impurities in Solid Fuel Combustion, 1st ed.; Gupta, R.P., Wall, T.F., Baxter, L., Eds.; Springer: New York, NY, USA, 2002; pp. 217–224. [Google Scholar]
- Ward, C.R. Mineral Characterization for Combustion. In Impact of Mineral Impurities in Solid Fuel Combustion, 1st ed.; Gupta, R.P., Wall, T.F., Baxter, L., Eds.; Springer: New York, NY, USA, 2002; pp. 23–32. [Google Scholar]
- Steenari, B.-M.; Lundberg, A.; Pettersson, H.; Wilewska-Bien, M.; Andersson, D. Investigation of ash sintering during combustion of agricultural residues and the effect of additives. Energy Fuels 2009, 23, 5655–5662. [Google Scholar] [CrossRef]
- Gilbe, C.; Ohman, M.; Lindström, E.; Boström, D.; Backman, R.; Samuelsson, R.; Burvall, J. Slagging characteristics during residential combustion of biomass pellets. Energy Fuels 2008, 22, 3536–3543. [Google Scholar] [CrossRef]
- Steenari, B.-M.; Lindqvist, O. High-temperature reactions of straw ash and the anti-sintering additives kaolin and dolomite. Biomass Bioenergy 1998, 14, 67–76. [Google Scholar] [CrossRef]
- Mason, P.E.; Darvell, L.I.; Jones, J.M.; Williams, A. Observations on the release of gas-phase potassium during the combustion of single particles of biomass. Fuel 2016, 182, 110–117. [Google Scholar] [CrossRef]
- Bostrom, D.; Skoglund, N.; Grimm, A.; Boman, C.; Ohman, M.; Brostrom, M.; Backman, R. Ash transformation chemistry during combustion of biomass. Energy Fuels 2012, 26, 85–93. [Google Scholar] [CrossRef]
- Hedayati, A.; Lindgren, R.; Skoglund, N.; Boman, C.; Kienzl, N.; Öhman, M. Ash Transformation during Single-Pellet Combustion of Agricultural Biomass with a Focus on Potassium and Phosphorus. Energy Fuels 2021, 35, 1449–1464. [Google Scholar] [CrossRef]
- Mlonka-Mędrala, A.; Magdziarz, A.; Gajek, M.; Nowińska, K.; Nowak, W. Alkali metals association in biomass and their impact on ash melting behaviour. Fuel 2020, 261, 116421. [Google Scholar] [CrossRef]
- Yang, J.; Feng, Z.; Ni, L.; Gao, Q.; He, Y.; Hou, Y.; Liu, Z. Thermal Characteristics of Ash from Bamboo and Masson Pine Blends: Influence of Mixing Ratio and Heating Rate. ACS Omega 2021, 6, 7008–7014. [Google Scholar] [CrossRef]
- Toscano, G.; Corinaldesi, F. Ash fusibility characteristics of some biomass feedstocks and examination of the effects of inorganic additives. J. Agric. Eng. 2010, 41, 13–19. [Google Scholar] [CrossRef]
- Hansson, K.-M.; Samuelsson, J.; Tullin, C.; Åmand, L.-E. Formation of HNCO, HCN, and NH3 from the pyrolysis of bark and nitrogen-containing model compounds. Combust. Flame 2004, 137, 265–277. [Google Scholar] [CrossRef]
- Lindström, E.; Öhman, M.; Backman, R.; Boström, D. Influence of sand contamination on slag formation during combustion of wood derived fuels. Energy Fuels 2008, 22, 2216–2220. [Google Scholar] [CrossRef]
- Risnes, H.; Fjellerup, J.; Henriksen, U.; Moilanen, A.; Norby, P.; Papadakis, K.; Posselt, D.; Sørensen, L.H. Calcium addition in straw gasification. Fuel 2003, 82, 641–651. [Google Scholar] [CrossRef]
- Lachman, J.; Baláš, M.; Lisỳ, M.; Lisá, H.; Milčák, P.; Elbl, P. An overview of slagging and fouling indicators and their applicability to biomass fuels. Fuel Process. Technol. 2021, 217, 106804. [Google Scholar] [CrossRef]
- Elger, R. High Temperature Corrosion in Biomass-Fired Energy Applications: Alloying Effects and Test Environment Comparisons. Ph.D. Thesis, KTH Royal Institute of Technology, Stockholm, Sweden, 2016. [Google Scholar]
- Manovic, V.; Grubor, B.; Repić, B.; Mladenović, M.R.; Jovanović, M.P. Sulfur release during combustion of Serbian coals. Fresenius Environ. Bull. 2003, 12, 1348–1353. [Google Scholar]
- Wieczorek-Ciurowa, K. Physico-chemistry of the limestone sulphation process. J. Therm. Anal. Calorim. 1998, 54, 85–91. [Google Scholar] [CrossRef]
- Atilgan, İ. Investigation of the effect of particle size of limestone added to lignite on emission behavior in a fluidized bed combustion system. Gazi Univ. J. Sci. 2004, 17, 89–101. [Google Scholar]
- Ilten, N.; Sungur, U. Removal of sulphur during combustion of coal by using lime. Fresenius Environ. Bull. 2009, 18, 2296–2301. [Google Scholar]
- Pisupati, S.V.; Bhalla, S. Influence of Calcium Content of Biomass-Based Materials on Simultaneous NOx and SO2 Reduction. Environ. Sci. Technol. 2008, 42, 2509–2514. [Google Scholar] [CrossRef]
- Wang, L.; Skjevrak, G.; Hustad, J.E.; Skreiberg, Ø. Investigation of biomass ash sintering characteristics and the effect of additives. Energy Fuels 2014, 28, 208–218. [Google Scholar] [CrossRef]
- Åmand, L.-E.; Leckner, B.; Eskilsson, D.; Tullin, C. Deposits on heat transfer tubes during co-combustion of biofuels and sewage sludge. Fuel 2006, 85, 1313–1322. [Google Scholar] [CrossRef]
- Pettersson, A.; Zevenhoven, M.; Steenari, B.-M.; Åmand, L.-E. Application of chemical fractionation methods for characterisation of biofuels, waste derived fuels and CFB co-combustion fly ashes. Fuel 2008, 87, 3183–3193. [Google Scholar] [CrossRef]
- Wang, L.; Hustad, J.E.; Skreiberg, Ø.; Skjevrak, G.; Grønli, M. A critical review on additives to reduce ash related operation problems in biomass combustion applications. Energy Procedia 2012, 20, 20–29. [Google Scholar] [CrossRef]
- Shao, Y.; Wang, J.; Preto, F.; Zhu, J.; Xu, C. Ash deposition in biomass combustion or co-firing for power/heat generation. Energies 2012, 5, 5171–5189. [Google Scholar] [CrossRef]
- Fournel, S.; Palacios, J.H.; Godbout, S.; Heitz, M. Effect of additives and fuel blending on emissions and ash-related problems from small-scale combustion of reed canary grass. Agriculture 2015, 5, 561–576. [Google Scholar] [CrossRef]
- Wang, P.; Means, N.; Shekhawat, D.; Berry, D.; Massoudi, M. Chemical-looping combustion and gasification of coals and oxygen carrier development: A brief review. Energies 2015, 8, 10605–10635. [Google Scholar] [CrossRef]


| Analysis | European Reference Standard |
|---|---|
| Ash content | UNE-EN-ISO18122 |
| Ultimate analysis (C, H, and N) | UNE-EN-ISO 16948 |
| Sulfur and Chlorine content | UNE-EN-ISO 16994 |
| Major elements (ash components) | UNE-EN-ISO 16967 |
| wt% | Raw | To | To-WL | To + A | To-WL + A | IWP | PFR |
|---|---|---|---|---|---|---|---|
| C | 48.8 | 56.4 | 56 | 54.5 | 57.5 | 50.8 | 52.7 |
| H | 6.2 | 5.9 | 6.1 | 6.1 | 6.0 | 6.0 | 6.4 |
| N | 0.4 | 0.45 | 0.3 | 0.3 | 0.32 | 0.07 | 0.339 |
| O | 44.6 | 37.3 | 37.4 | 39.1 | 36.2 | 43.2 | 40.5 |
| S | 0.05 | 0.065 | 0.035 | 0.03 | 0.03 | 0.008 | 0.05 |
| Ash components (major elements only)/mg kg−1 | |||||||
| Cl | 230 | 145 | 50 | 50 | 200 | 60 | 70 |
| Al | 846 | 1090 | 943 | 1540 | 1220 | 62 | 174 |
| Ca | 4060 | 5550 | 5140 | 11,700 | 13,700 | 1300 | 3390 |
| Fe | 860 | 7890 | 672 | 1430 | 1690 | 82 | 134 |
| K | 4720 | 5995 | 2070 | 7190 | 3970 | 486 | 1370 |
| Mg | 460 | 1001 | 775 | 944 | 909 | 232 | 453 |
| Na | 129 | 116 | 75 | 328 | 418 | 13 | 34 |
| P | 313 | 417 | 223 | 441 | 383 | 94 | 217 |
| Si | 7205 | 9455 | 7725 | 10,500 | 14,000 | 1050 | 958 |
| Oxygen Carrier | MnO2 | Fe2O3 | SiO2 | Al2O3 | CaO | Fe2TiO5 | TiO2 |
|---|---|---|---|---|---|---|---|
| LD Slag | 5.42 | 26.85 | 14.08 | 1.29 | 52.36 | - | - |
| Sibelco | 72.99 | 9.05 | 7.31 | 7.97 | 2.67 | - | - |
| Ilmenite | - | 11.2 | - | - | - | 54.7 | 28.6 |
Publisher’s Note: MDPI stays neutral with regard to jurisdictional claims in published maps and institutional affiliations. |
© 2022 by the authors. Licensee MDPI, Basel, Switzerland. This article is an open access article distributed under the terms and conditions of the Creative Commons Attribution (CC BY) license (https://creativecommons.org/licenses/by/4.0/).
Share and Cite
Lebendig, F.; Funcia, I.; Pérez-Vega, R.; Müller, M. Investigations on the Effect of Pre-Treatment of Wheat Straw on Ash-Related Issues in Chemical Looping Gasification (CLG) in Comparison with Woody Biomass. Energies 2022, 15, 3422. https://doi.org/10.3390/en15093422
Lebendig F, Funcia I, Pérez-Vega R, Müller M. Investigations on the Effect of Pre-Treatment of Wheat Straw on Ash-Related Issues in Chemical Looping Gasification (CLG) in Comparison with Woody Biomass. Energies. 2022; 15(9):3422. https://doi.org/10.3390/en15093422
Chicago/Turabian StyleLebendig, Florian, Ibai Funcia, Rául Pérez-Vega, and Michael Müller. 2022. "Investigations on the Effect of Pre-Treatment of Wheat Straw on Ash-Related Issues in Chemical Looping Gasification (CLG) in Comparison with Woody Biomass" Energies 15, no. 9: 3422. https://doi.org/10.3390/en15093422
APA StyleLebendig, F., Funcia, I., Pérez-Vega, R., & Müller, M. (2022). Investigations on the Effect of Pre-Treatment of Wheat Straw on Ash-Related Issues in Chemical Looping Gasification (CLG) in Comparison with Woody Biomass. Energies, 15(9), 3422. https://doi.org/10.3390/en15093422