Article

Steel Converter Slag as an Oxygen Carrier—Interaction with Sulfur Dioxide

1
Chemistry and Chemical Engineering, Chalmers University of Technology, 412 93 Göteborg, Sweden
2
Department of Space, Earth and Environment, Chalmers University of Technology, 412 93 Göteborg, Sweden
*
Author to whom correspondence should be addressed.
Energies 2022, 15(16), 5922; https://doi.org/10.3390/en15165922
Submission received: 29 June 2022 / Revised: 10 August 2022 / Accepted: 11 August 2022 / Published: 15 August 2022
(This article belongs to the Special Issue Chemical Looping Combustion of Solid Fuels)

Abstract

:
Steel converter slag, also called Linz-Donawitz (LD) slag, has been considered as an oxygen carrier for biofuel chemical looping applications due to its high availability. In addition to its content of iron which contributes to its oxygen-carrying capacity, LD slag also contains a significant amount of calcium. Calcium, however, is known to interact with sulfur, which may affect the usability of LD slag. To get a better understanding of the interaction between sulfur and LD slag, batch scale experiments have been performed using solid and gaseous fuel with or without sulfur dioxide, together with LD slag as an oxygen carrier. The reactivity and sulfur interaction were compared to the benchmark oxygen carrier ilmenite. Sulfur increases the gasification rate of biofuel char and the conversion of CO for both LD slag and ilmenite. However, no effect of sulfur could be seen on the conversion of the model tar species benzene. The increased gasification rate of char was suspected to originate from both surface-active sulfur and gaseous sulfur, increasing the reactivity and oxygen transfer of the oxygen carrier. Sulfur was partly absorbed into the LD slag particles with calcium, forming CaS and/or CaSO4. This, in turn, blocks the catalytic effect of CaO towards the water gas shift reaction. When the SO2 vapor pressure was decreased, the absorbed sulfur was released as SO2. This indicates that sulfur may be released in loop-seals or in the air reactor in a continuous process.

1. Introduction

Low-cost oxygen carriers, such as ores or waste products, have been evaluated for thermochemical biomass conversion techniques such as chemical-looping combustion (CLC), chemical-looping gasification (CLG), and oxygen carrier aided combustion (OCAC) [1,2,3]. These techniques can be used to decrease emissions, but also, in the case of CLC, can be used to separate CO2 from the flue gases. 
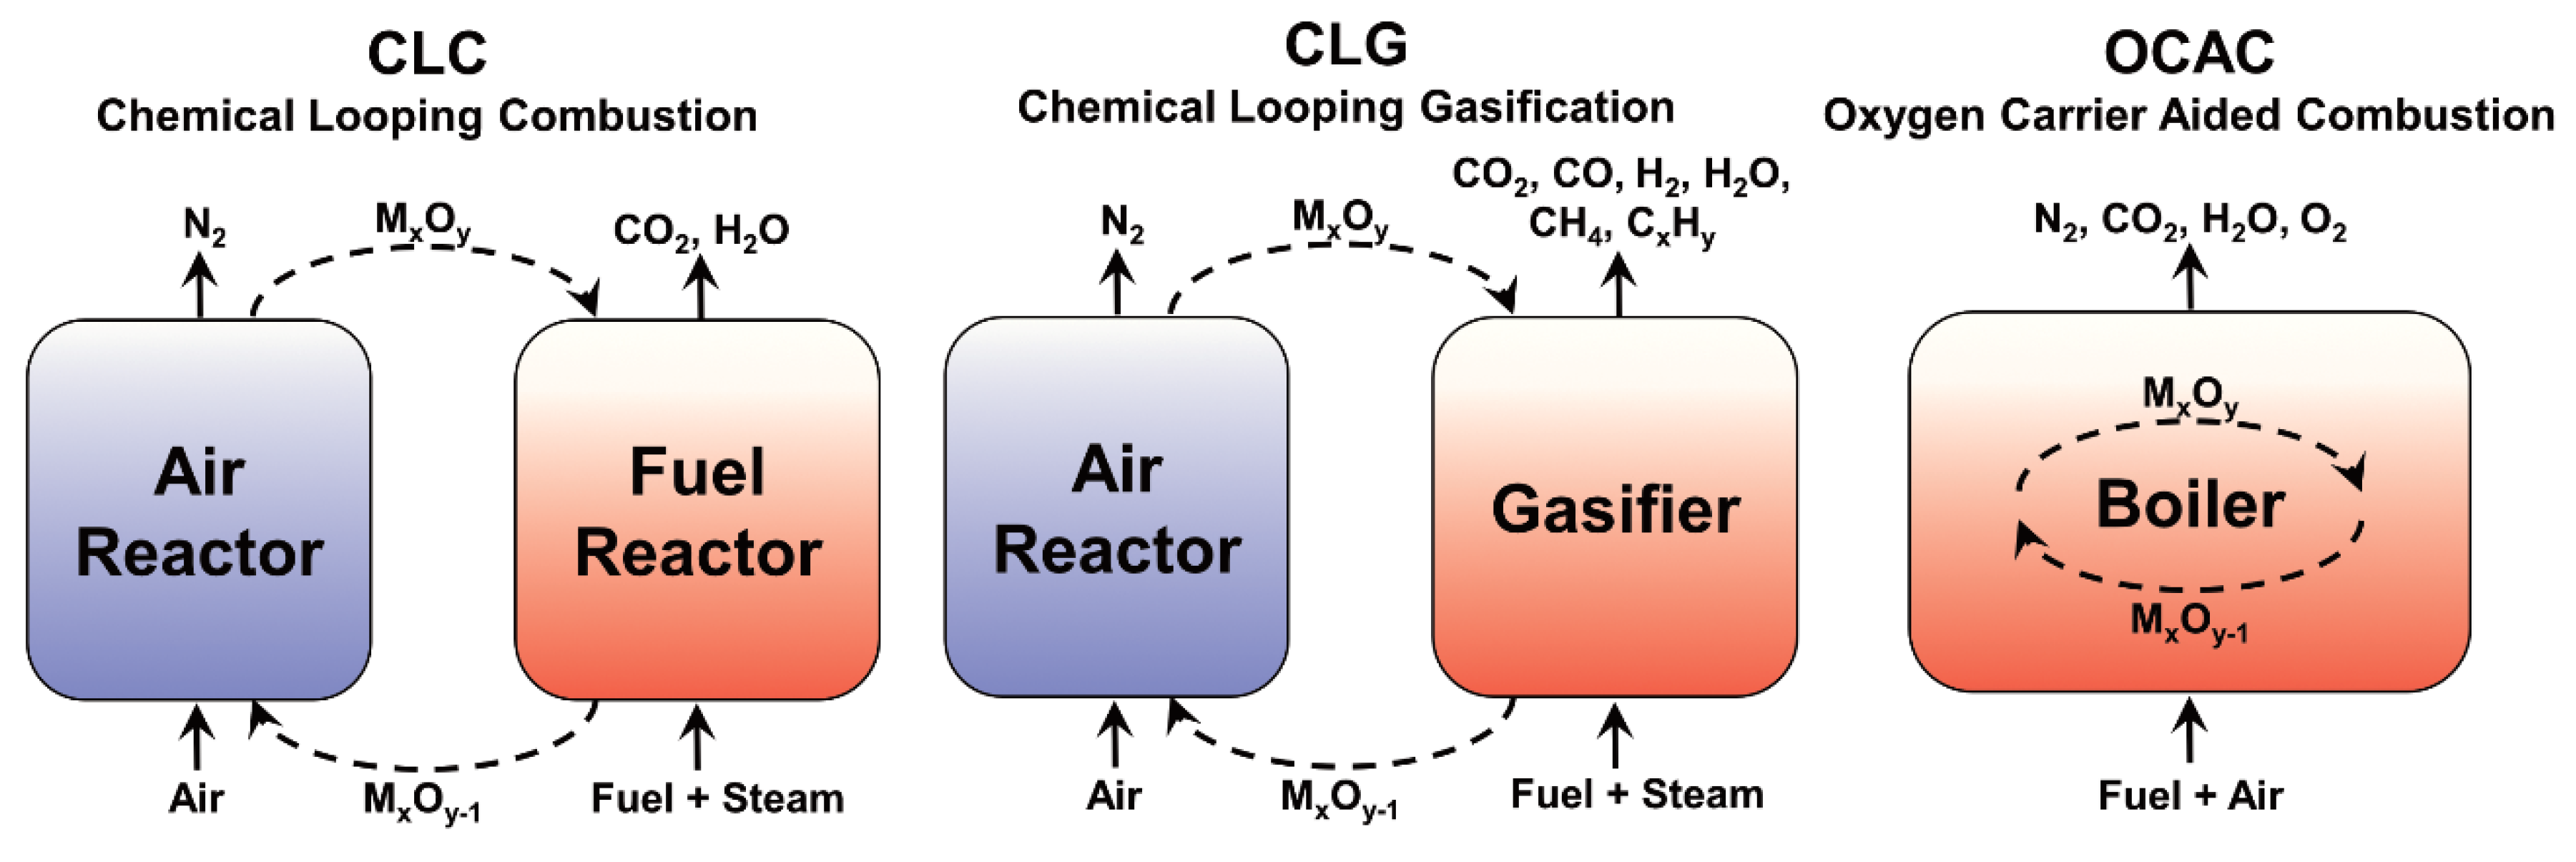
Figure 1 presents the layout of these processes. If biomass is used and the separated CO2 is stored, the overall carbon flow to the atmosphere will be negative, i.e., bio-energy with carbon capture and storage (BECCS) [4,5]. However, for this process to be efficient, the oxygen carrier needs to be both efficient and have the chemical and physical strength to enable a lifetime of hundreds of hours of operation [6,7].
Low-cost oxygen carriers are expected to be needed for biomass conversion in these processes, but biomass contains ash that will be mixed with the oxygen carrier and could be hard to separate. Iron-based oxygen carriers are to be preferred since these are nonhazardous to handle and are more environmentally friendly [8]. Among the most promising iron-based low-cost oxygen carriers are ilmenite, an iron-titanium ore that is available in large quantities. Ilmenite has sufficient fuel conversion, as well as good chemical and physical properties, thus currently making ilmenite the bench-mark oxygen carrier [2,9,10,11,12,13]. However, since ilmenite is about 6–8 times more expensive than sand, which is used today for fluidized bed boilers, other oxygen carriers with lower costs are of interest [3,14].
Steel converter slag, also called Linz-Donawitz (LD) slag, is a byproduct of the steel manufacturing industry that has been investigated as an oxygen carrier [15]. Since the demand is low, the price of this material is also expected to be low and more similar to sand [14]. LD slag has been investigated as an oxygen carrier and has been suggested to have sufficient chemical and physical properties in addition to having similar fuel reactivity as ilmenite [15,16,17].
During OCAC operation with LD slag, relatively high CO emissions were generated. It was suggested that this unconverted CO was a result of the alkali interaction with the slag. It was suspected that higher amounts of alkali, in the form of KOH and KCl in the boiler, resulted in a lower burnout [14,15]. Sulfur is known to influence alkali chemistry and boiler operation during combustion. If sulfur is present, alkali will react and form sulfates resulting in, e.g., decreased superheater corrosion. Therefore, co-combustion with sulfur-rich fuel, or the addition of sulfur, is commonly used to decrease corrosion [18,19,20]. When LD slag was used as bed material in the Chalmers CFB boiler, sulfur was added with two different methods: (I) ammonium sulfate was added to the cyclone resulting in decreased CO emission, as expected; (II) elementary sulfur was added directly to the bed together with the fuel. However, elementary sulfur only had a temporary effect on decreasing CO emissions [14]. Thus, it is expected that co-combustion with sulfur-rich fuels will not be as efficient to decrease CO emission or corrosion for longer periods when using LD slag as an oxygen carrier. Lime in the LD slag supposably reacted with the sulfur and formed CaSO4. From SEM-EDX analysis, it was also indicated that sulfur was accumulated not only on the surface of the particles, but also inside the bed particles [15]. Projecting this observed interaction and the knowledge that CaSO4 has a larger crystal structure than CaO and CaCO3, the formation of CaSO4 might also result in decreased surface area of the particles since pores can be plugged. This could result in decreased reactivity of the oxygen carrier since gas transport through the particle is decreased [21].
Previous studies with oxygen carriers and sulfur interaction have concluded that oxygen access via the oxygen carrier is essential for the forms of sulfur which are generated in a chemical-looping process. From both thermodynamic calculations [22,23] and experiments [23,24,25,26], it has been observed that mostly H2S is formed if the oxygen access is under-stochiometric, as in the fuel reactor of a CLG process. When lower fuel to oxygen carrier ratios are used, the larger oxygen access will result in mostly SO2 being formed. From these studies, it has been concluded that most sulfur is released in the fuel reactor. However, none of these investigated oxygen carriers contained calcium, which is known to react with sulfur at combustion boiler temperatures. In one study, Arjmand et al. investigated calcium manganite with methane and SO2, and here it was found that calcium played a significant role in binding the sulfur to different compounds [27]. Ilmenite that had been used under OCAC conditions has also been evaluated regarding sulfur interaction, finding that the calcium from ash has a significant role in the sulfur chemistry also for other oxygen carriers [28].
This study aims to investigate how sulfur affects the properties of the calcium-rich oxygen carrier LD slag under conditions relevant for CLC and CLG. It is expected that sulfur affects the gasification rate of the char, conversion of gaseous species, and composition of the outgoing gases, hence it is significant for understanding the process.

Theoretical Background

The formation of CaSO4 from limestone in boilers for high-temperature sulfur capturing processes was studied intensely during the 1960s and 1970s. These studies were mostly directed toward the combustion of sulfur-containing coal [29,30]. Additionally, more recently there have been investigations of utilizing lime together with iron ore oxygen carriers to remove sulfur from coal in a laboratory fluidized bed [31]. Thermodynamically, the optimal sulfur capture temperature for limestone is around 880 °C, at which temperature CaCO3 calcines to CaO according to Reaction (R1) [32]. CaO, in turn, reacts with SO2 under oxidizing conditions, forming CaSO4 according to Reaction (R2).
CaCO 3 CO 2 + CaO  
CaO + SO 2 + 1 2 O 2 CaSO 4
However, due to the shifting reducing and oxidizing conditions in fluidized bed boilers, part of the CaSO4 is reduced, forming CaS or CaO, as well as gaseous species such as H2S, COS, and SO2 [21,29,33]. In comparison to conventional boilers, the fuel reactor in CLG and CLC are moderate-to-very reducing, and will most likely generate sulfur in only the more reduced forms, such as H2S [23,34]. When using materials such as ilmenite in CLC operation with sulfur-containing fuel, it has been observed that most of the sulfur exits from the fuel reactor as SO2 and H2S [23]. These are the most thermodynamic stable gaseous compounds of sulfur under reducing conditions. For materials with oxygen uncoupling properties, it is instead expected that sulfur is emitted as mainly SO2 from the fuel reactor [23,24,25].
LD slag contains plenty of calcium in different phases. The slag used in this study contains roughly 30 wt.% of calcium, whereof 2–4 wt.% is in the form of lime (CaO or free calcium). This means that the overwhelming majority of the calcium is bound as calcium silicates or in metal-containing structures [15]. Even though the amount of free calcium is low, the catalytic properties of CaO towards the water gas shift reaction (Reaction (R3)) are important for gasification processes using lime-containing beds, such as LD slag [35,36]. If CaO is sulfated in a gasifier using LD slag as an oxygen carrier, this may affect both the gasification process, as well as the catalytic properties of the bed material.
  CO + H 2 O CO 2 + H 2
If CaSO4 is formed, Reaction (R4) or (R5) can occur to generate CaO or CaS. The CaO can, in turn, react under reducing conditions, forming CaS according to Reaction (R6). In both CLG and CLC with solid fuel, steam will most likely be used in the gasifier/fuel reactor to increase the gasification rate of the solid fuel. CaS can react in these cases with steam according to Reaction (R7), forming H2S [21]. During oxidation, it can form CaSO4 or SO2 according to Reactions (R8) and (R9). CaS might also react with CaSO4 at temperatures relevant for boilers according to Reaction (R10) [37]. In addition, sulfur has been found to deposit as elementary sulfur inside chemical-looping reactors as a result of the equilibrium Reaction (R11), called the Claus reaction [23].
CaSO 4 + CO CaO + SO 2 + CO 2
CaSO 4 + 4 CO / 4 H 2 CaS + 4 CO 2 / 4 H 2 O  
CaO + COS / H 2 S CaS + CO 2 / H 2 O
CaS + H 2 O CaO + H 2 S  
CaS + 2 O 2   CaSO 4
CaS + 3 2 O 2   CaO + SO 2
CaS + 3 CaSO 4   4 CaO + 4 SO 2
2 H 2 S + SO 2     3 S +   H 2 O
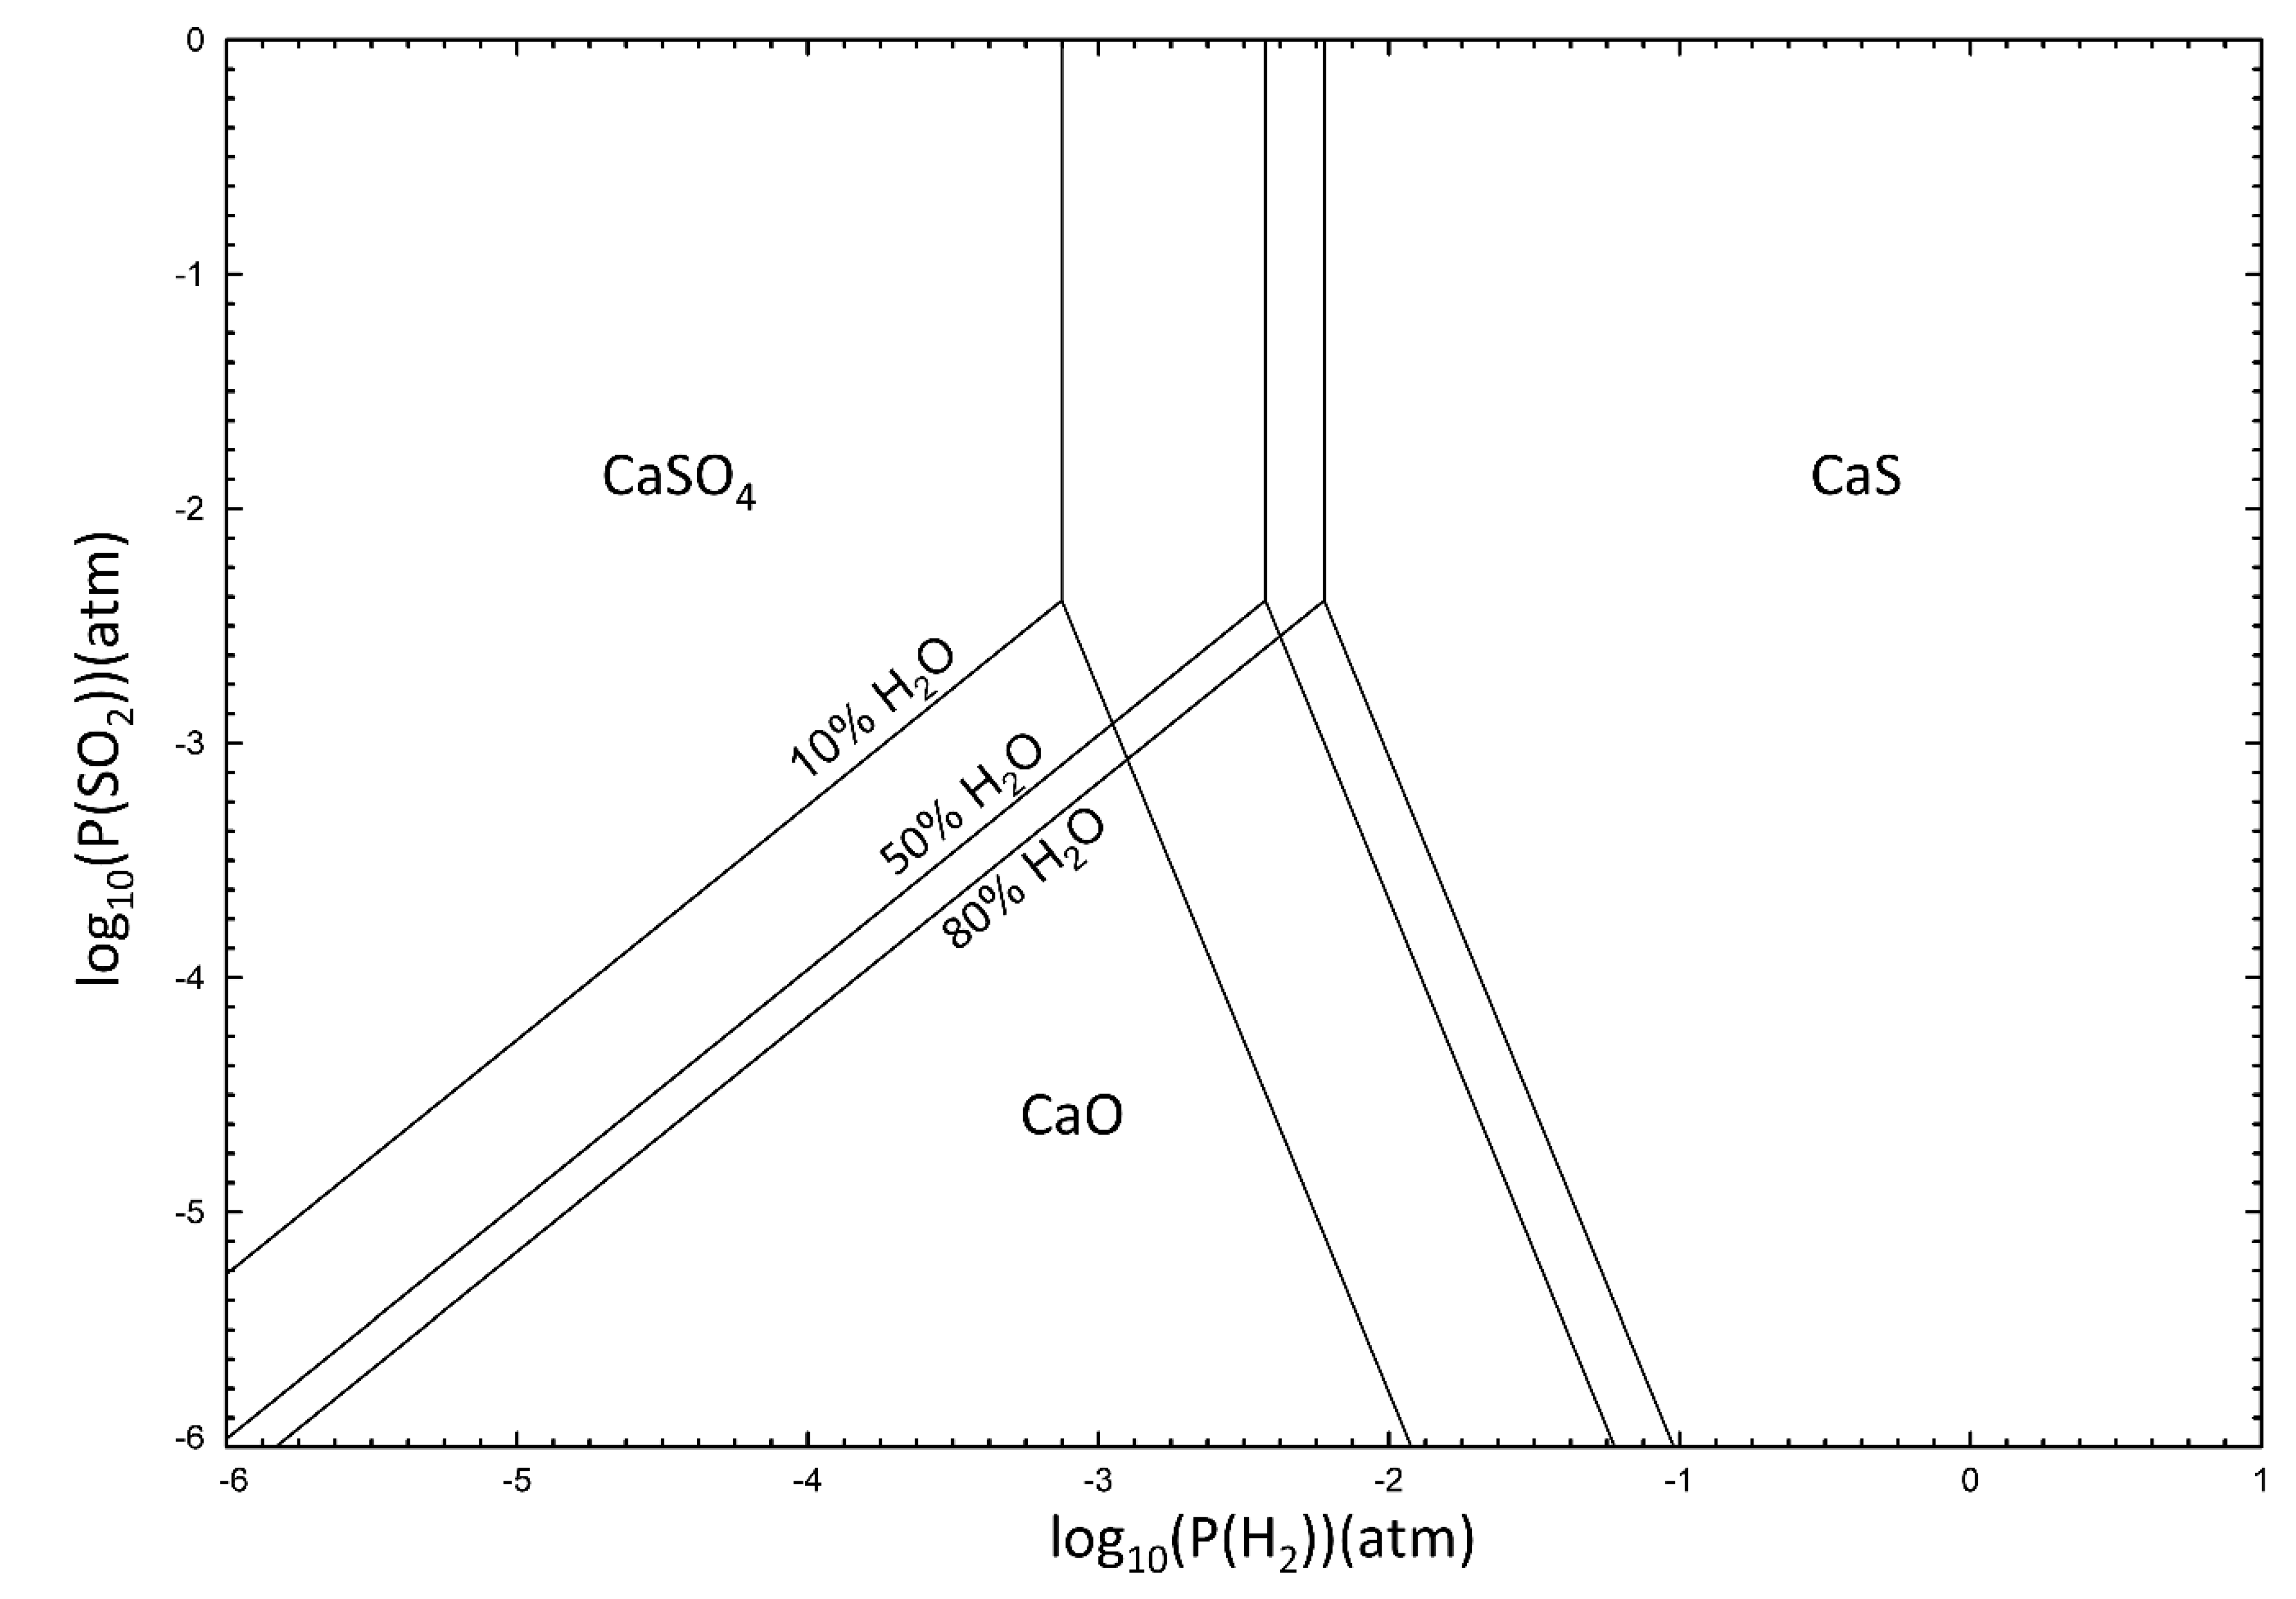
According to thermodynamic calculations, it has been shown in an oxidative environment that CaSO4-CaS-CaO is dependent on temperature, as well as the SO2 and O2 partial pressure [21]. During reducing conditions, as with H2, a similar phase diagram of the stable solid phases at different temperatures can be calculated (see Figure 2).
The partial pressure of steam is important for the oxidizing potential in the gasifier/fuel reactor. This is particularly interesting for LD slag since this material generates high hydrogen concentrations via the water-splitting reaction (Reaction (R12)). “A” in the reaction is Mn and Mg that are present in the oxygen carrying phase of LD slag [36]. How steam partial pressure affects the sulfonation of calcium can be seen in Figure 3.
3 Fe 1 x A x O +   H 2 O Fe 3 x A x O 4 + H 2  
From Figure 2 and Figure 3, it can be concluded that even with a small partial pressure of sulfur and hydrogen, the most stable phase will be CaS. This means that in CLG and CLC, the phase of free calcium in presence of sulfur is most likely CaS, due to the reducing conditions, especially since significant fractions of hydrogen are expected to be present when using LD slag as an oxygen carrier for gasification [36]. It is important to note that these reactions mentioned above are only related to CaO. The CaO content in LD slag is around 1%; the majority of Ca in LD slag is found in phases like (CaO)xSiO2 and CaFe2-xAxO5 [15]. However, CaS and CaSO4 can also be formed from these phases at a low partial pressure of SO2 at 850 °C and reducing conditions (see Supplementary Materials for calculated equilibriums).
Although LD slag was the main focus of this work, the benchmark oxygen carrier ilmenite was also used for comparison. It has been observed for ilmenite that the reaction rate towards methane [23] and coal pyrolysis gas [38] increases in the presence of sulfur dioxide. This was not only during the experiments with sulfur dioxide added in the gas phase, but there also seemed to be a lasting effect on the oxygen carrier. Even afterward, when sulfur was not added with the fuel, continued experiments showed an increased reactivity due to bound sulfur in the particles.
The scope of this study is to investigate how sulfur interacts with LD slag during reducing conditions. The fate of sulfur will be investigated and the potential formation of CaS and CaSO4 explored. The effect of sulfur on the gasification properties and whether sulfur will be released during oxidizing or reducing conditions are other aspects that will be explored. The conversion behavior of benzene, an important tar precursor, together with sulfur, was also investigated in this work.

2. Experiments

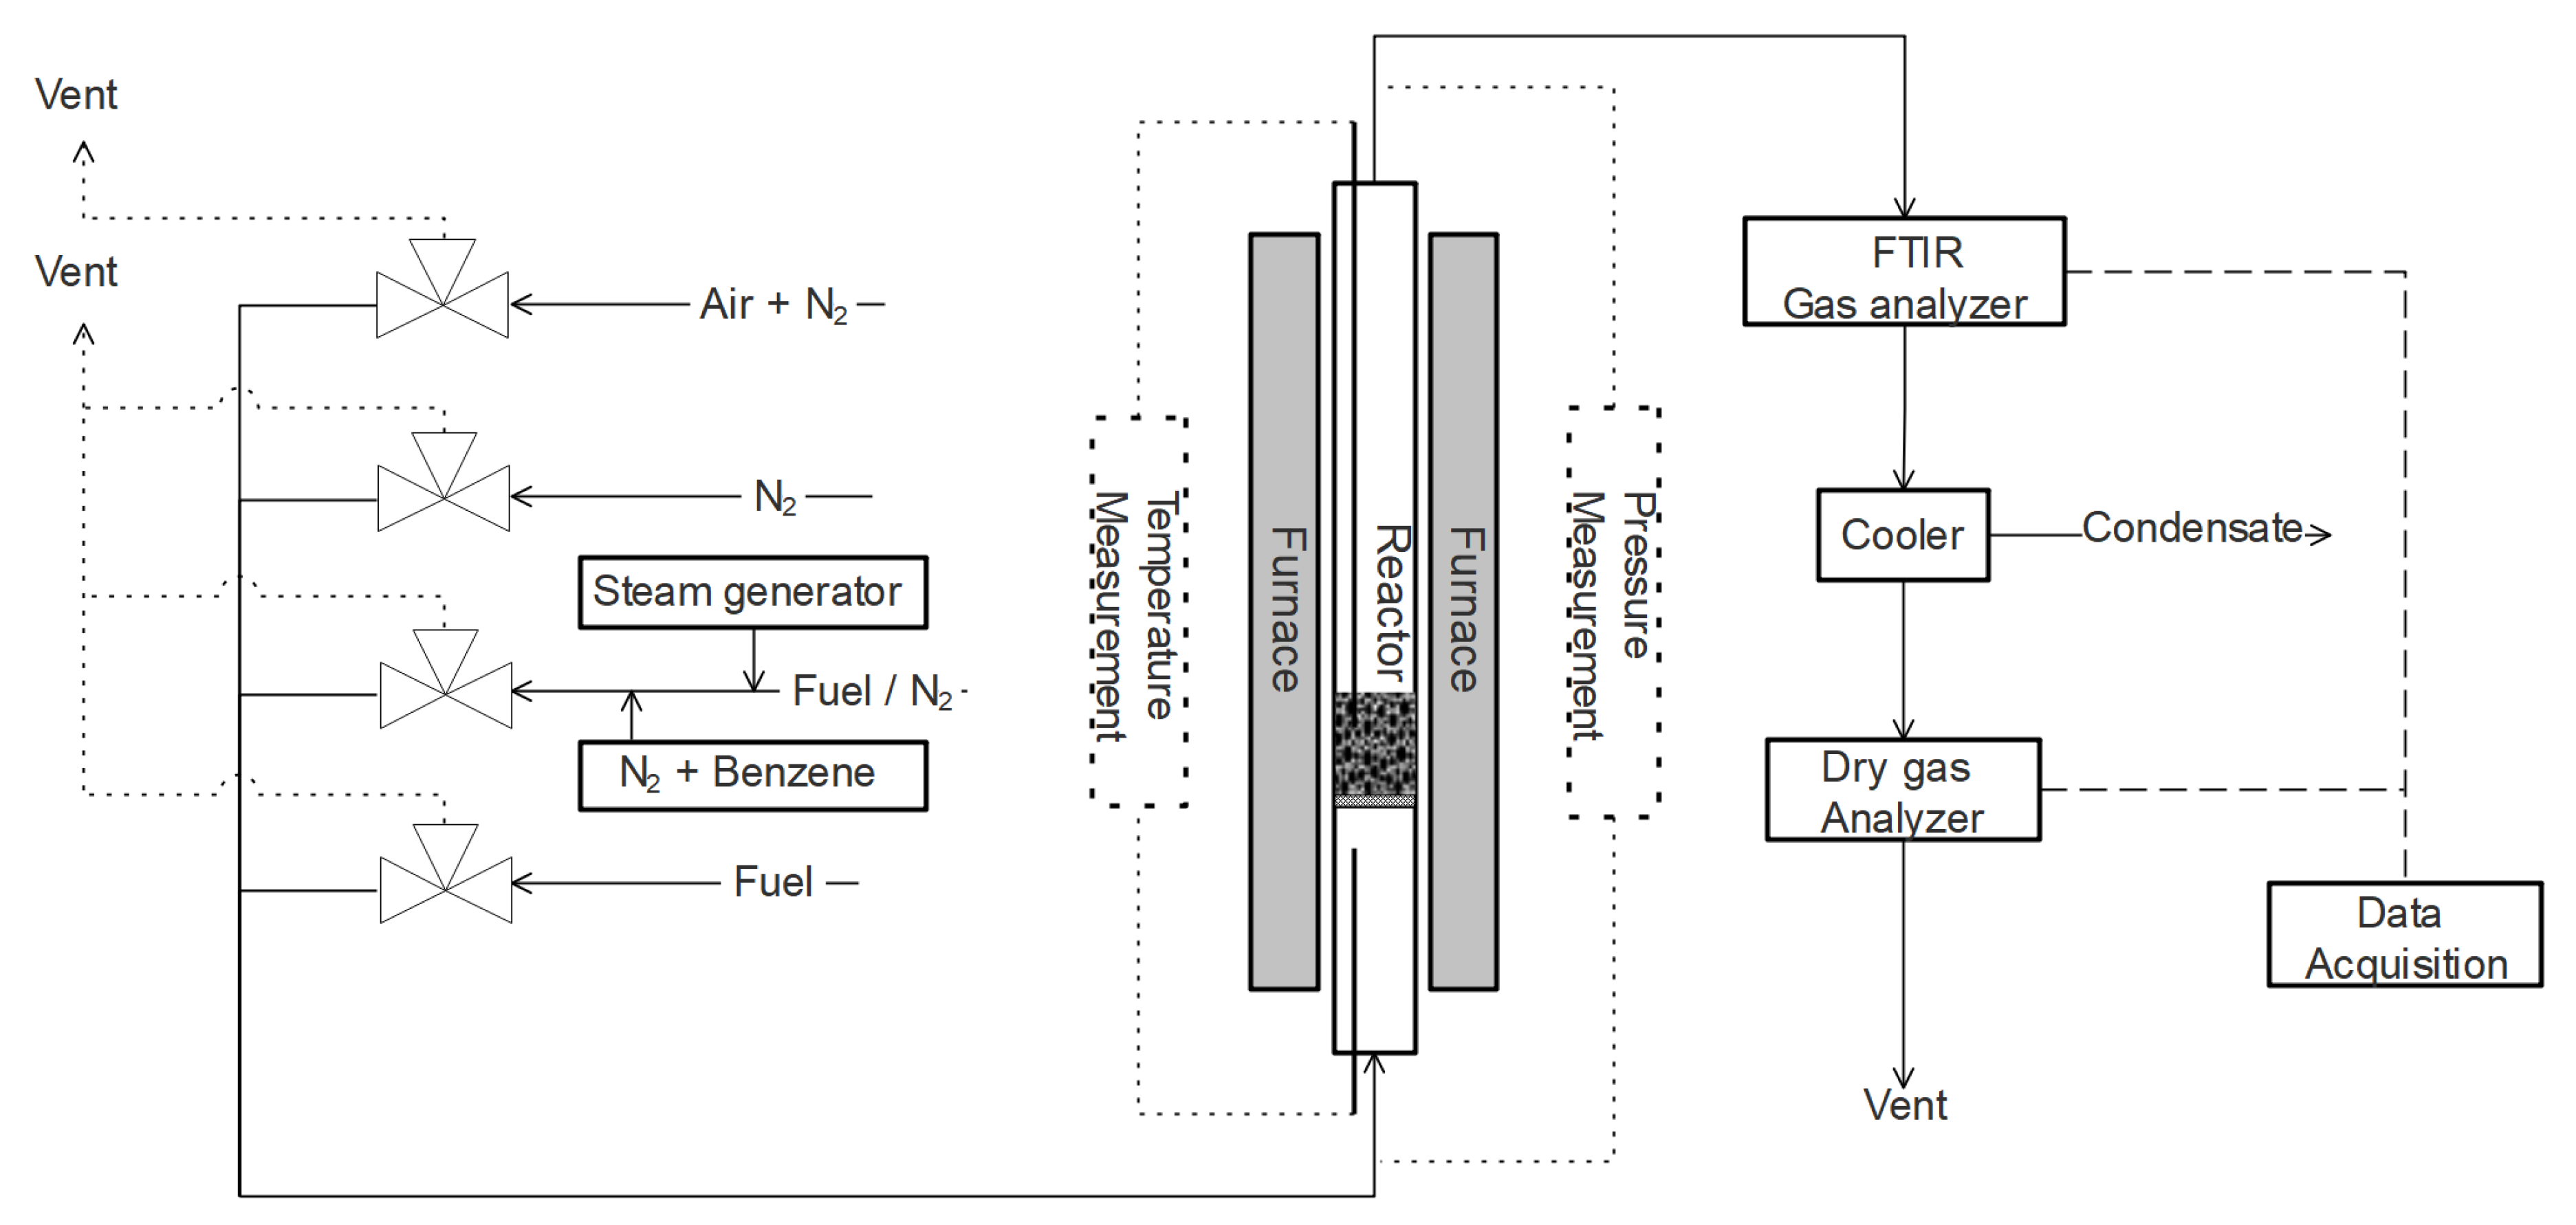
The experiments in this work were performed in a batch laboratory fluidized bed reactor (see Figure 4 for a schematic overview of the unit). Here, gases were selected and inserted from the bottom of the reactor. The reactor, with an inner diameter of 22 mm, was constructed of quartz glass and mounted inside a furnace. In the quartz reactor, a porous plate was fixed where particles were placed for exposure. Temperature was measured both underneath the bed and inside the bed of particles. Pressure fluctuations over the bed were measured using a Honeywell pressure transducer with a frequency of 20 Hz for observation of bed fluidization behavior or interruptions in the fluidization.
The wet outgoing gases were analyzed using an FTIR during gaseous fuel experiments to measure benzene. After a cooler and a condensation trap, one of two five-channel Rosemount NGA 2000 instruments analyzed the gases. The first four channels of both analyzers were equipped with NDIR (nondispersive infrared) sensors for CO2, CO, and CH4, and a paramagnetic sensor for O2 measurement. The two analyzers differed on the fifth channel where either an SO2 NDIR detector or a thermal conductivity detector for H2 was installed. Dräger tubes for H2S detection and SO2 were also used to estimate the H2S/SO2 formation. Gases for Dräger tubes were collected after the dry gas analyzer in air-tight 1 L aluminum bags and measured afterward. It is important to note that SO2 dissolves in water and was partly dissolved in the condensation trap, identified by both the smell and the increased acidity of the water. For experiments with solid fuel, the FTIR was bypassed, in order to protect the FTIR instrument from tars. For these experiments, the components in the outgoing gas were only analyzed with one of the Rosemount analyzers at the time. More details regarding the system can be found elsewhere [39].
The oxygen carrier material used in these experiments was LD slag received from SSAB, sieved to 150–400 µm. The same batch of slag has been used in other studies [14,15,40,41]. The ilmenite used was a Norwegian rock ilmenite received from Titania, sieved between 100–300 µm. This batch has also been used in other studies [2,15,42]. Both oxygen carriers were heat-treated in air at 950 °C for 24 h. The sand was extra pure sea sand received from Merck, sieved between 180–250 µm. The elemental composition of these bed materials can be seen in Table 1. Elemental composition was determined using ICP-SFMS according to SS EN ISO 17294-2: 2016 on LD slag and sand, and XRF according to the SP method 4343 on ilmenite.
The solid fuel used in the laboratory fluidized bed reactor was produced by inert heat treatment of wood pellets. Wood pellets were devolatilized in a fluidized silica bed at 820 °C under an N2 atmosphere for more than 20 min. After devolatilization and cooling down, the sand was sieved. The devolatilized wood pellets were then crushed and sieved to obtain the desired size range of 180–300 µm. The volatile mass fraction of the original pellets was calculated to be 82 wt.%. The elemental composition of the wood pellets and the devolatilized fuel can be seen in Table 2.
In addition to the wood pellets, another reference fuel was used called German wood char. This was delivered already as char and was only crushed and sieved to obtain the desired size range of 180–300 µm.
Prior to experiments in the batch fluidized bed reactor, the bed was activated using syngas (50% CO in H2). These activation cycles were performed with 900 mL/min syngas for 20 s in every cycle, followed by oxidization with 5% O2. The oxidation was performed until the sample was fully oxidized and the outgoing gases reached 5% O2 again. Between these reducing and oxidizing atmospheres, inert N2 with a flow of 1000 mL/min was used to purge the reactor for 180 s. These activation cycles were performed until a constant conversion of syngas could be observed for the sample, normally 7–20 cycles depending on the mass of the oxygen carrier. This activation was performed since there is a known increase in reactivity for these oxygen carriers, and after activation, the conversion of fuels is rather stable [12]. These types of cycles were also used before every experiment as a reference.

2.1. Solid Fuel Experiments

For the solid fuel experiments, a sample of 40 g of oxygen carrier bed material was used. First, the oxygen carriers were activated using syngas. After the activation cycles, the solid fuel experiments were performed. Here, devolatilized and crushed wood char pellets were inserted from the top of the reactor together with a stream of 500 mL/min N2. A sample of 0.2 g of devolatilized char in the size range of 180–300 µm was used. During solid fuel cycles without sulfur addition, the bed material was fluidized using 50% steam in N2 with a total flow of 1000 Nml/min. For experiments with SO2, a total flow of 1000 Nml/min was used with a concentration of 50% steam, and was mixed with SO2 in N2, meaning that the inlet concentration of SO2 was 0.2 or 0.4% of the total inlet flow.
A summary of all the experiments can be seen in Table 3. The experiment matrix was performed with both fuels, the devolatilized wood pellets and German wood char. There were differences in the setup with the analyzers detecting either H2 or SO2. Dräger tubes for SO2 and H2S were mainly used for 0.4% SO2 experiments with German wood char. For experiments with German wood char, complementary reference experiments were performed after all SO2 experiments to detect releases of sulfur from the used material using Dräger tubes.
This oxidation–inert–reducing–inert series, or cycle, was repeated three times at each experimental condition. The results were averaged over these cycles. Experiments were performed at 870 °C and 970 °C. The same sample (LD slag, ilmenite or sand) was used for all experiments, first for all experiments without sulfur, and then for the experiments with sulfur. 
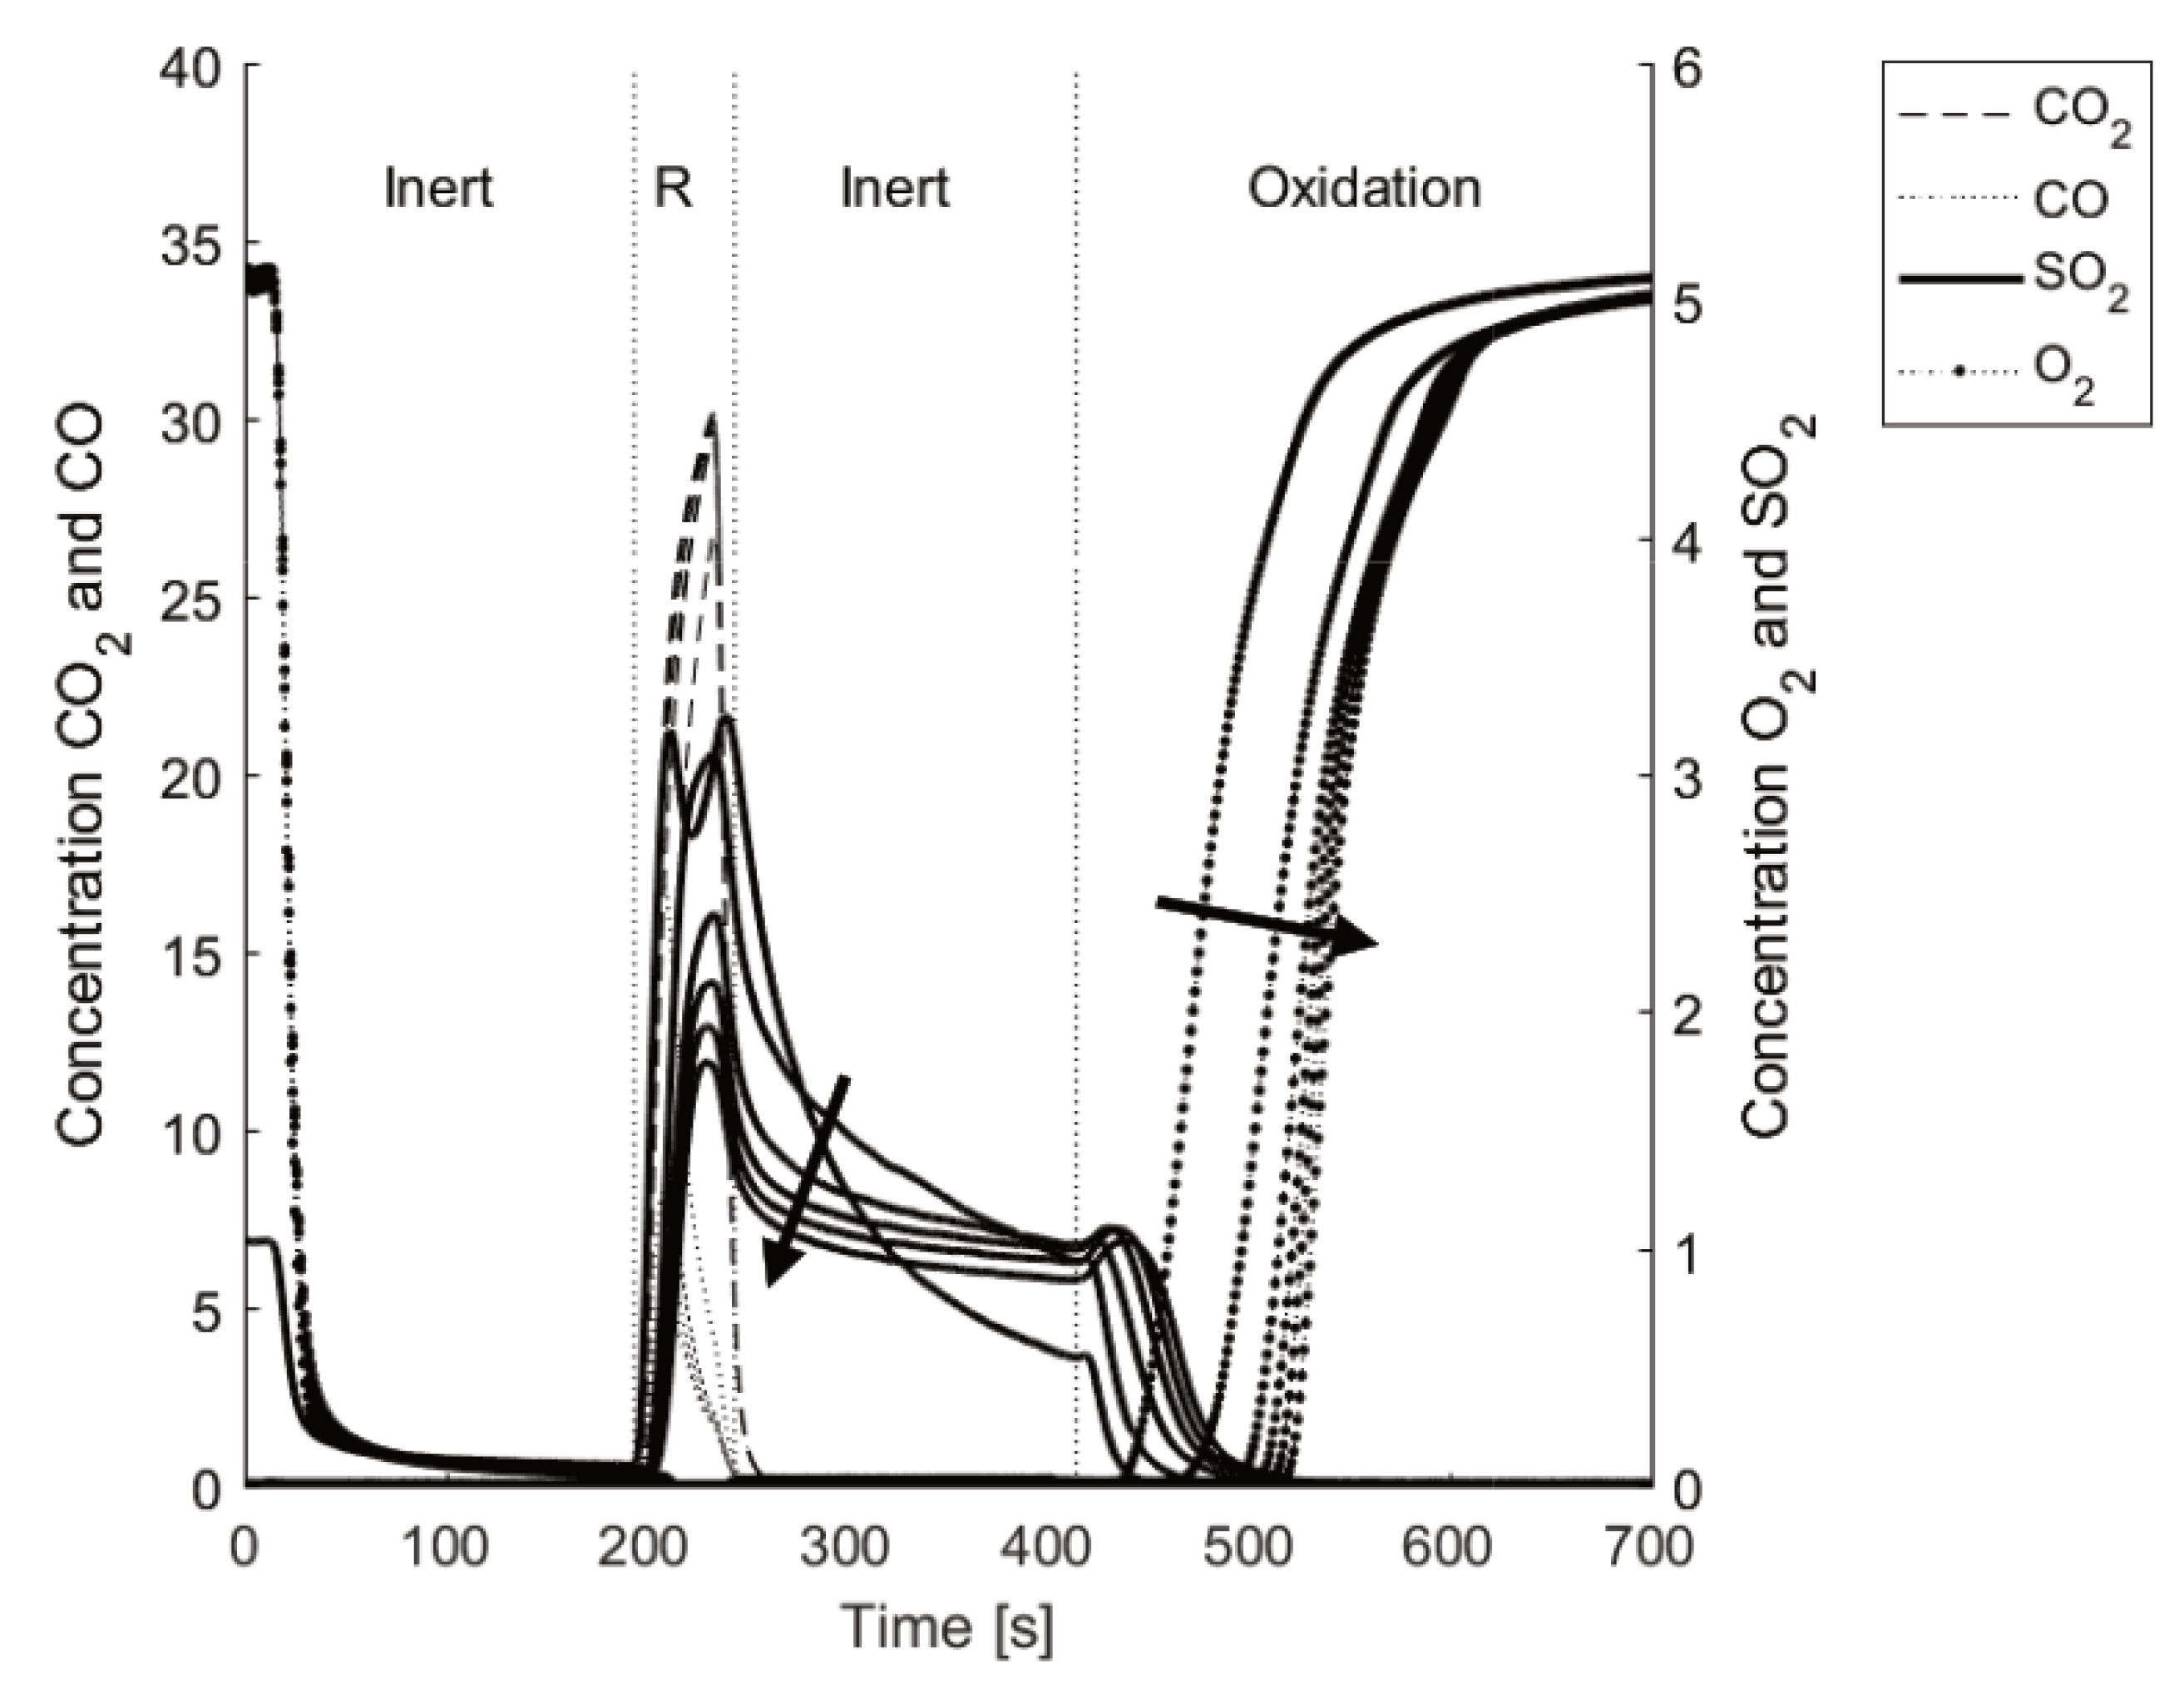
Figure 5 shows one typical cycle of solid fuel gasification with LD slag at 870 °C. When the 5% oxygen in nitrogen is replaced with inert gas at time = 0 s, the oxygen concentration rapidly drops as the oxygen is flushed from the system. The solid fuel, fluidization gas containing steam, N2, and for the specific experiment 0.4% SO2, was introduced at 180 s. The gasification of the fuel proceeds, as indicated by the rising concentrations of CO2, CO, and H2. After 900–3000 s when all carbon in the bed has been converted, another inert period of 180 s was performed before reoxidation of the oxygen carriers. During the oxidation period, 5% oxygen in nitrogen was first fully reacting with the particles, clearly seen as no gas-phase O2 exits from the reactor initially. At about 2500 s in the figure, the oxygen increases as the oxygen carriers become saturated with oxygen. At the same time as gas-phase O2 was observed, a small amount of CO2 was generated. This CO2 originates from the combustion of unconverted char and char that may be trapped on the walls of the upper part of the reactor tube [43]. In the figure, the concentration of SO2 is multiplied by a factor of 10 to improve readability. Two things should be noted regarding the concentration of SO2: (i) SO2 does not decrease to zero when SO2 was removed from the fluidizing gas during the inert period after the fuel cycle; and (ii) SO2 never reaches the ingoing concentration since some sulfur is absorbed in the cooler and bed material.

Data Evaluation

For the solid fuel experiments, the total molar gas yield for each component from the gasification of the char was calculated with Equation (1) between time t1 to time t2. This was done for either a full cycle or for a part of a cycle. The total molar flow was calculated assuming ideal gas using Equation (2), P—pressure (Pa), R—gas constant, T—temperature (K), V—volume (m3) and xA—concentration. This was done with the assumption that the only outgoing gases of significant volume in the non-condensed gas were CO2, CO, H2, and CH4. SO2 was excluded due to the limited concentration and since SO2 could not be measured at the same time as H2.
n i , t = t 1 t 2 x i , o u t * n ˙ o u t d t
n ˙ o u t = P R T * V ˙ N 2 , i n 1 x C O 2 + x C O + x H 2 + x C H 4
The fraction of char converted, Xc, is defined as the cumulative carbon released at a certain time divided by the total carbon emitted from the converted char during the reduction period. These are defined in Equations (3) and (4). The integral in Equation (4) is evaluated from the time of char insertion (t1 = tred, start) to the end of the reduction when the atmosphere in the reactor is changed to inert (t2 = tred, end).
X c t = m c t m c , t o t
m c t = M c t 1 t 2 n ˙ o u t t x C O t + x C O 2 t + x C H 4 t   d t
The gasification rate (rw) was calculated using Equation (5) where m ˙ c was the mass-based rate of conversion of carbon. The gasification rate was then normalized using Equation (6). In this work, a mean value for the gasification rate was normally extracted from the gasification rate between a char conversion of 0.3 < Xc < 0.7. The reason for this conversion span is that the gasification rate is more stable in this region and easier to compare to other experiments [44].
r w = d X c d t = m ˙ c m c , t o t
r = r w 1 X c
In addition to the char conversion, the gas phase conversion is also very important. Two parameters have been used in this work to evaluate the gas conversion: (i) the conversion of carbon species to CO, and (ii) the H2/CO molar ratio. The former is defined as Equation (7). Here the molar yield of each component is calculated using Equation (1), averaged over 0.3 < Xc < 0.7.
C O C t = n C O n C O + n C O 2 + n C H 4
Re-oxidation after the reduction cycle, correlated to the omega value at the end of the cycle, was calculated using Equation (8). A reference O2 curve using inert sand in the same experimental conditions was used to determine the point of transition between inert and oxidizing conditions. The difference between the actual uptake using an oxygen carrier and the reference cycle with inert sand was then judged to be a result of O2 uptake of the oxygen carrier.
O 2 , r e o x i d a t i o n = t o x = 0 t o x = e n d x O 2 , r e f x O 2 , s a m p l e * n ˙ o u t
Since there are both traces of soot and some remaining char, the final O2 consumed by the oxygen carrier is calculated by subtracting the molar CO2 generated during oxidation from the total O2 uptake during the same period.
The equilibrium constant Keq for the WGS Reaction (R6) is defined as in Equation (9) when gases are at equilibrium. The temperature dependence of the equilibrium at atmospheric pressure is shown in the same equation [45,46]. The reaction quotient Qi is defined similarly as the equilibrium, and calculated for the measured outgoing gases from the reactor at the time i (see Equation (10)). Qi is used to estimate how far the concentrations of the gases are from the equilibrium. If Qi = Keq, the gases are at equilibrium with respect to Reaction (R6).
K e q = x C O 2 * x H 2 x C O * x H 2 O = exp 4.33 + 4577.8 T
Q i = x C O 2 , i * x H 2 , i x C O , i * x H 2 O , i

2.2. Gaseous Fuel Experiments

Two different setups for gaseous fuel experiments were conducted for this study: (I) benzene experiments to evaluate how and if sulfur affects the conversion of the tar component benzene, and (II) the effects of SO2 on the conversion of syngas (CO+H2). Here, it is important to study possible interactions with sulfur with the bed material with lasting effects on the conversion of the fuel.

2.2.1. Effect of SO2 on Benzene Conversion

Benzene tests were executed with 5 g oxygen carrier (ilmenite or LD slag) diluted with 10 g silica sand at 850 °C. This dilution was necessary to avoid full conversion of the gaseous fuel species. The samples were activated as described in Section 2.1. After activation, the same cyclic schedule was used, oxidation–inert–reduction–inert, with the same flow during inert and oxidation as described in Section 2.1. For benzene tests, a flow of 500 mL/min steam and 300 mL/min N2/benzene mixture was introduced during the reduction phase in the cycles. The N2/benzene mixture was N2 saturated with benzene at 6 °C, resulting in a benzene concentration of 1.46% in the ingoing flow. The sulfur content was regulated to obtain a total content of 0%, 0.2%, and 0.4% SO2 in the fluidization gas according to Table 4. Reducing gas was inserted for 60 s every cycle. Experiments were performed at 850 °C to be more comparable to previous results [15,47].

2.2.2. Effect of SO2 on CO Conversion and Structure

To investigate if and how SO2 binds into or onto the LD slag, a sequence of separate reduction cycles was performed with subsequent analysis. The experiments were conducted with CO so the SO2 effect on the reactivity towards CO could be observed at the same time. Here, 15 g of oxygen carrier was used, without any sand. After activation at 850 °C (described in Section 2.1), the same cyclic oxidation–inert–reduction–inert was used also for the experiments, but at 870 °C instead. Oxidation using 1000 mL/min 5% O2 in N2 and inert for 180 s using 1000 mL/min N2. First, reference experiments with reduction using 900 mL/min 25% CO and 25% H2 in N2 for 40 s were committed. After this, samples were reduced for 40 s with a flow of 25% CO, 25% H2, and 1% SO2 in N2. This was done for six cycles at 870 °C. After the final reduction, the sample was oxidized using 5% O2 and 1.5% SO2 in N2 instead of only diluted air, and this was done for over 90 min. This was to investigate how SO2 was absorbed in the structure of the particles. After this loading of sulfur, the samples were again reduced, this time as the first reference experiments using a flow of 900 mL/min 25% CO and 25% H2 in N2 for 40 s. This was also done 6 times. A summary of these experiments can be seen in Table 5.

2.2.3. Data Evaluation

Equation (1) was used to determine the cumulative molar flow of the outgoing gas species, and the conversion over the entire cycle was calculated by dividing the amount of outgoing gas species by the amount of ingoing. The molar flow was assumed to be unchanged for benzene and CO experiments. For benzene, the expected gas expansion is small compared to the total flow considering the low concentration of ingoing benzene.

2.3. Material Characterization

SEM-EDX (scanning electron microscopy equipped with energy dispersive X-ray spectroscopy) analysis was done with an FEI Quanta 200 FEG ESEM. Bed material was mounted in epoxy and polished, exposing a cross-section of the particles, thus making it possible to investigate the inside of the particles with SEM-EDX. The crystalline phases in the bed material were determined by powder X-ray diffraction (XRD). The XRD was a Brucker D8 ADVANCE equipped with a Cu Kα radiation source. BET surface area was measured using a TriStar 3000. The 0.5 g samples were degassed for 1 h at 90 °C, followed by 18 h at 250 °C. The surface area was measured using nitrogen and was cooled using liquid nitrogen.

3. Results

3.1. Effect of SO2 on the Gasification of Solid Fuel

As expected, SO2 contributes to an increased gasification rate of solid biomass fuel [43]. This can be seen in Figure 6 for both LD slag and ilmenite. The gasification rate for ilmenite with SO2 is stable and higher than for ilmenite without SO2 more or less over the entire conversion. However, in comparison to ilmenite, LD slag shows both a higher variance and a smaller increase in mean gasification rate. A significant increase of gasification rate formed as a peak at Xc ≈ 0.25 characterizes the char conversion for LD slag in the presence of sulfur at 870 °C. It is of note that this peak of increased gasification rate was not observed for gasification cycles at 970 °C.
The mean gasification rate is defined as the average gasification rate between the fuel conversion degree of 0.3 < Xc < 0.7. The effect on the mean gasification rate of different concentrations of SO2 in the ingoing gas can be observed in Figure 7. With no SO2 present in the fluidization gas, LD slag and ilmenite have a very similar mean gasification rate. However, in the presence of SO2, a clear difference between the oxygen carriers can be observed. The gasification rate for ilmenite increased more with higher SO2 levels compared to LD slag. At 870 °C, the increase in gasification rate is proportional to the amount of SO2 added to the fluidization gas for both oxygen carriers. This is in contrast to 970 °C, where the difference in rate between 0.2% and 0.4% SO2 for LD slag is minimal.
Gasification with sand was used as a reference case. The gasification of fuel should primarily depend on the surrounding gas and not on the oxygen-carrying properties. Hence, one can expect that gasification in a sand bed is enhanced with SO2. However, the addition of SO2 in the sand experiments did not affect the gasification rate. This was somewhat surprising, so these experiments were executed again with a different solid char fuel, but with the same result. It was also observed that no SO2 was present in the outgoing gas during the sand experiments; in bag samples only H2S was detected at low Xc. However, when most of the char was converted, SO2 was detected in the outgoing gas.
A closer investigation of the outlet gas concentrations in relation to the gasification rate for a cycle for LD slag and ilmenite, respectively, in the presence of SO2 as well as without is seen in Figure 8. For the ilmenite, it can be observed that until Xc = 0.7, the general shape is the same with and without SO2 in the inlet gas. The gasification rate with ilmenite increases as the H2 concentration drops, when Xc > 0.7, and more H2 was generated contributing to the decreased gasification rate, likely due to hydrogen inhibition.
For LD slag, there is a significant peak in gasification rate and subsequent CO2 concentration at around Xc ≈ 0.25 (see, e.g., Figure 6). This peak was present in all repetitions at 870 °C, but was gradually smoothed out on the right side of the peak. This can be seen in more detail by comparing the lower 0.4% SO2 curve in Figure 6 with the highest measured gasification rate where the “peak” is a step rather than a peak. At the higher temperature, 970 °C, this peak could not be observed and the general shape of the curves with and without sulfur was closer to each other.
The conversion of the carbon in the fuel to CO can be seen in Figure 9 presented as the CO/Ct ratio. Here, LD slag is compared to ilmenite and sand at both 870 °C and 970 °C. For LD slag, no significant effect of the SO2 concentration on the CO/Ct ratio can be observed. However, for both ilmenite and sand, a minor decrease in CO/Ct ratio can be observed with increased SO2. This means that more CO2 was produced over the cycle when the SO2 concentration increased.
The H2/CO ratio is displayed in Figure 10 for LD slag, ilmenite, and sand at 870 °C and 970 °C. Here, a significant decrease in the H2/CO ratio could be observed for LD slag at 870 °C with increased SO2 concentration in the fluidization gas. Similar behavior can be observed for ilmenite at 870 °C. At the higher temperature, 970 °C, no significant changes can be observed regarding the H2/CO ratio when SO2 is present with the oxygen carriers.

3.2. Water Gas Shift Reaction

From previous studies, it was observed that the CaO content in LD slag catalyzes the WGS reaction [36]. This means that the outgoing gases from a CLG or CLC process using LD slag will most likely be closer to the equilibrium of the WGS reaction compared to other non-catalytic materials. Comparing the gasification experiments performed with or without the presence of SO2 (see Figure 11), LD slag showed a changed and decreased reaction quotient Q compared to the experiment performed without SO2. In comparison, with ilmenite, which is an oxygen carrier that has a limited catalytic influence on the WGS reaction, the effect of SO2 on the reaction quotient was only small. The reference experiment with sand also did not show any significant difference for the reaction quotient Q in the presence of SO2.
For experiments at the higher temperature of 970 °C (see Supplementary Materials), no clear effect of sulfur could be detected for LD slag or sand towards the WGS reaction. This could indicate that the catalyzing CaO is not affected by sulfur at the higher temperature, meaning that no CaS or CaSO4 was formed at this partial pressure of SO2.

3.3. Benzene Conversion

Conversion of benzene in the presence of SO2 was investigated for LD slag and ilmenite. The gas composition for the experiments is displayed in Table 4. Benzene was used in these experiments as a precursor for tars, and it is well known that benzene is one of the most difficult aromatics to convert in thermochemical conversion of biomass. The overall conversion of benzene over the entire cycle can be seen in Figure 12. Here, it should be noticed that the scale of conversion is only zoomed in to 40–60%. The difference with and without SO2 present is within the error margin for ilmenite. As such, for ilmenite, SO2 does not affect benzene conversion. For LD slag, a small decrease in reactivity towards benzene in the presence of more SO2 is observed. However, the experimental results are within the error margins for the experiments. The benzene conversion for LD slag and ilmenite was 50% and 56%, respectively.

3.4. Sulfur Interaction with LD Slag—Influence of Solid Fuel

Gasification experiments were performed again using the analyzer with a SO2 detector and the second solid fuel, German wood char. Figure 13 shows the outgoing gases from the char conversion experiments described in Section 2.1 where gasification rate and concentrations are plotted against the conversion of char. However, in comparison to experiments shown in Figure 8, the wood char fuel used contained more volatiles. In addition to this, the curves indicate similar trends for both LD slag and ilmenite with the different fuels. Further comparison of the two different solid biofuels can be seen in the Supplementary Materials with experiments performed with sand.
In the figure, it is clear that SO2 is interacting differently with LD slag compared to ilmenite. Common to the two materials is that both LD slag and ilmenite have almost no SO2 released at the beginning of the cycle (0 < Xc < 0.1) as the volatiles from the fuel are released. A clear CO peak in Figure 13 indicates the presence and release of volatiles. After the effect of volatiles, ilmenite has a relatively even outgoing concentration of SO2 during the gasification between 0.1 < Xc < 0.8, which at the end of the cycle reaches the ingoing concentration of roughly 0.4%. For LD slag, the outgoing SO2 is much more shifting in relation to char conversion Xc. The SO2 concentration peaks, together with the peak of the increased gasification rate. The same peak could be observed in Figure 8 with 0.4% SO2 and LD slag. After this, the SO2 concentration decreases at Xc ≈ 0.5, as seen in Figure 13. This is directly after the peak with CO2 and the increased gasification rate, and the same time as H2 starts to increase in Figure 8.
When using Dräger tubes for bag samples of the gas to analyze the H2S and SO2 concentration, it was observed that the sulfur balance is not complete when only considering these two sulfur components in the outgoing gases (see Table 6). H2S concentration was increasing as a function of Xc to reach about 2000 ppm in the outgoing gases around Xc = 0.5 for both LD slag and ilmenite. Then, the H2S concentration decreased while SO2 was increased.
It should, however, be noted that the bag sampling method has a very low time resolution. It takes 1 min to fill a bag sample; during this time, Xc increased from 0.08 to 0.29 for the first sampling point of, e.g., LD slag. Then, it took another minute to prepare another bag sample, so the next bag starts at Xc = 0.44. Nevertheless, even with the low resolution, it was clear that the sulfur balance is not covered by only H2S and SO2, neither for the oxygen carriers LD slag or ilmenite, nor for sand. In addition to solid interaction, the highly soluble SO2 is also captured in the condensed water, which has been observed to be slightly acidic and has a sulfurous smell. COS is also known to be a common gasification product [23,48] that could not be measured here. It is also possible and expected from thermodynamic calculations that elementary sulfur is formed via Reaction (R11). Elementary sulfur will condense on the reactor walls that are located at low-temperature areas and in tubes downstream of the main reactor.
For LD slag, sulfur was released as SO2 after the experiments. This was released during the inert purging, after the reducing gasification phase with char and SO2. This can be seen in Figure 5, where SO2 can be observed during the inert phase between reduction and oxidation. This was also similar to the gaseous fuel experiments with syngas where SO2 was released during inert conditions after sulfur was loaded into the structure (see Section 3.5). This sulfur release during the inert phase was only observed for LD slag, not for ilmenite or sand. This suggests that sulfur binds to the Ca in the LD slag, and is then released as SO2 under inert conditions when the partial pressure of SO2 is decreased, e.g., via Reaction (R10) if CaS is formed.
When oxidation starts, the concentration of SO2 is decreased compared to inert conditions. This could indicate that CaS is oxidized partly forming SO2 (via Reaction (R9)) in addition to CaSO4 (via Reaction (R8)). Finally, when oxygen passes through the bed, and the oxygen carrier captures most of the oxygen, there is again a small peak of SO2. This could be from S deposited on the reactor walls above the bed which is oxidized during oxidation. Elemental sulfur is formed via the Claus Reaction (R11) and has been observed as yellow dust on reactor walls in these experiments and previous experiments using other equipment [23].
After gasification experiments with SO2, an additional reference gasification experiment was executed without SO2 in the ingoing gases. Here, it was observed that sulfur in the form of SO2 and H2S, detected with Dräger tubes, was released with similar concentrations as in previous experiments with SO2. This suggests that sulfur is bound into the structure. Adding to this, the gasification rate was as high for this cycle as it was when SO2 was present in the fluidization gas. However, this was not a lasting effect; it only lasted for one cycle. In the next cycle, the rate decreased and returned closer to the experiments without SO2. This is in correlation with the increased conversion of CO observed in gaseous fuel experiments after sulfur is accumulated in the oxygen carrier presented in Figure 14. Similarly, a lasting increased conversion effect of sulfur has been observed in previous studies with ilmenite [23].

3.5. Sulfur Interaction with LD Slag—Gaseous Fuel

In this section, gaseous experiments were performed, as described in Table 5 in Section 2.2. After activation cycles, 1% SO2 and syngas (H2/CO, 50/50) were used to reduce the bed of LD slag at 870 °C. It was observed that the conversion of CO increased in the presence of SO2. In addition, it was observed that the conversion increased as sulfur accumulated in the sample. This can be seen in Figure 14 for 1% SO2 compared to no SO2 mixed with the syngas. It was also observed that a peak of SO2 was formed when oxygen was introduced to the reactor after the reduction. These peaks further suggest that some sulfur was both accumulated into the structure during the reduction, and also that some of it was released during oxidation or depositions of elementary sulfur. The potential reaction could most likely be SO2 forming from CaS, according to Reaction (R9).
After the first cycles with sulfur in the reducing gas, sulfur was instead inserted during the oxidation. The particles were “loaded” with SO2 during 90 min oxidation with an ingoing SO2 concentration of 1.5%. After 90 min, the outgoing sulfur concentration was just above 1% and still increasing. After this, the particles were again reduced with syngas with no SO2 in the ingoing gases. A decreased reactivity was observed compared to before the sulfur loading, especially in the first cycles. The reactivity was then increased with every cycle, as can be observed in Figure 14. This decreased reactivity could be associated with the decreased surface area that was measured with BET. In Table 7, the surface area for the particles is displayed under different conditions. Here, it is clear that sulfation decreases the surface area of the particles, indicating blocked pores. However, already after the first reduction, the surface area is increased to almost the same as after activation. Additional reduction cycles did not increase the surface area to a greater extent, as can be seen after a total of seven cycles where the surface area is almost the same as after the first reduction.
After the loading of sulfur, sulfur was detected as SO2 during the reduction, but also during the inert phase after the reduction (see Figure 15). The amount of outgoing SO2 decreased as a function of cycles, as is clarified with an arrow in the figure. Moreover, when oxygen was introduced, a small extra peak of SO2 was followed by a fast decline in SO2 concentration. This can be seen in the inert oxidation shift at around 400 s in Figure 15. It was noted that O2 was detected after SO2 had declined to zero. This is in alignment with previous studies where CaS has been formed during the reduction and then reacted with CaSO4 during the inert period of the experiments, according to Reaction (R10) [27], and formed SO2 and CaO. Unfortunately, in XRD, only CaSO4 could be identified as a sulfur-containing phase for the reduced sample, which is the same as for the oxidized sample. This could indicate that CaS is under the detection limit for XRD. The reduced sample was quenched directly after the reduction during inert conditions; nevertheless, no CaS could be observed. Moreover, with SEM-EDX, it could be observed that sulfur was located together with calcium (see Figure 16). Sulfur was not present in the areas containing Si and Ca, nor Ca and Fe. This suggests that known structures in LD slag such as calcium silicates ((CaO)xSiO2) and Srebrodolskite (Ca2Fe2-xBxO5—B = Mg, Mn, Si) do not bind sulfur into the structure. Therefore, it is most likely that lime (CaO) present in the structure at a few percentage [15] was interacting with the sulfur. Sulfur, together with Ca, was mainly at the surface of the particles, but also throughout the entire cross-section.

4. Discussion

It is clear from these experiments that the possible reaction paths for sulfur are many and complex. In addition to gaseous species that are not measured, such as COS and SO3, some sulfur species are lost in the condensed water in the gas treatment system, and most likely elemental sulfur is deposited in the colder areas after the reactor. Additionally, the interaction with calcium in LD slag adds more complexity. Therefore, a total sulfur balance over the system is in this work not possible.
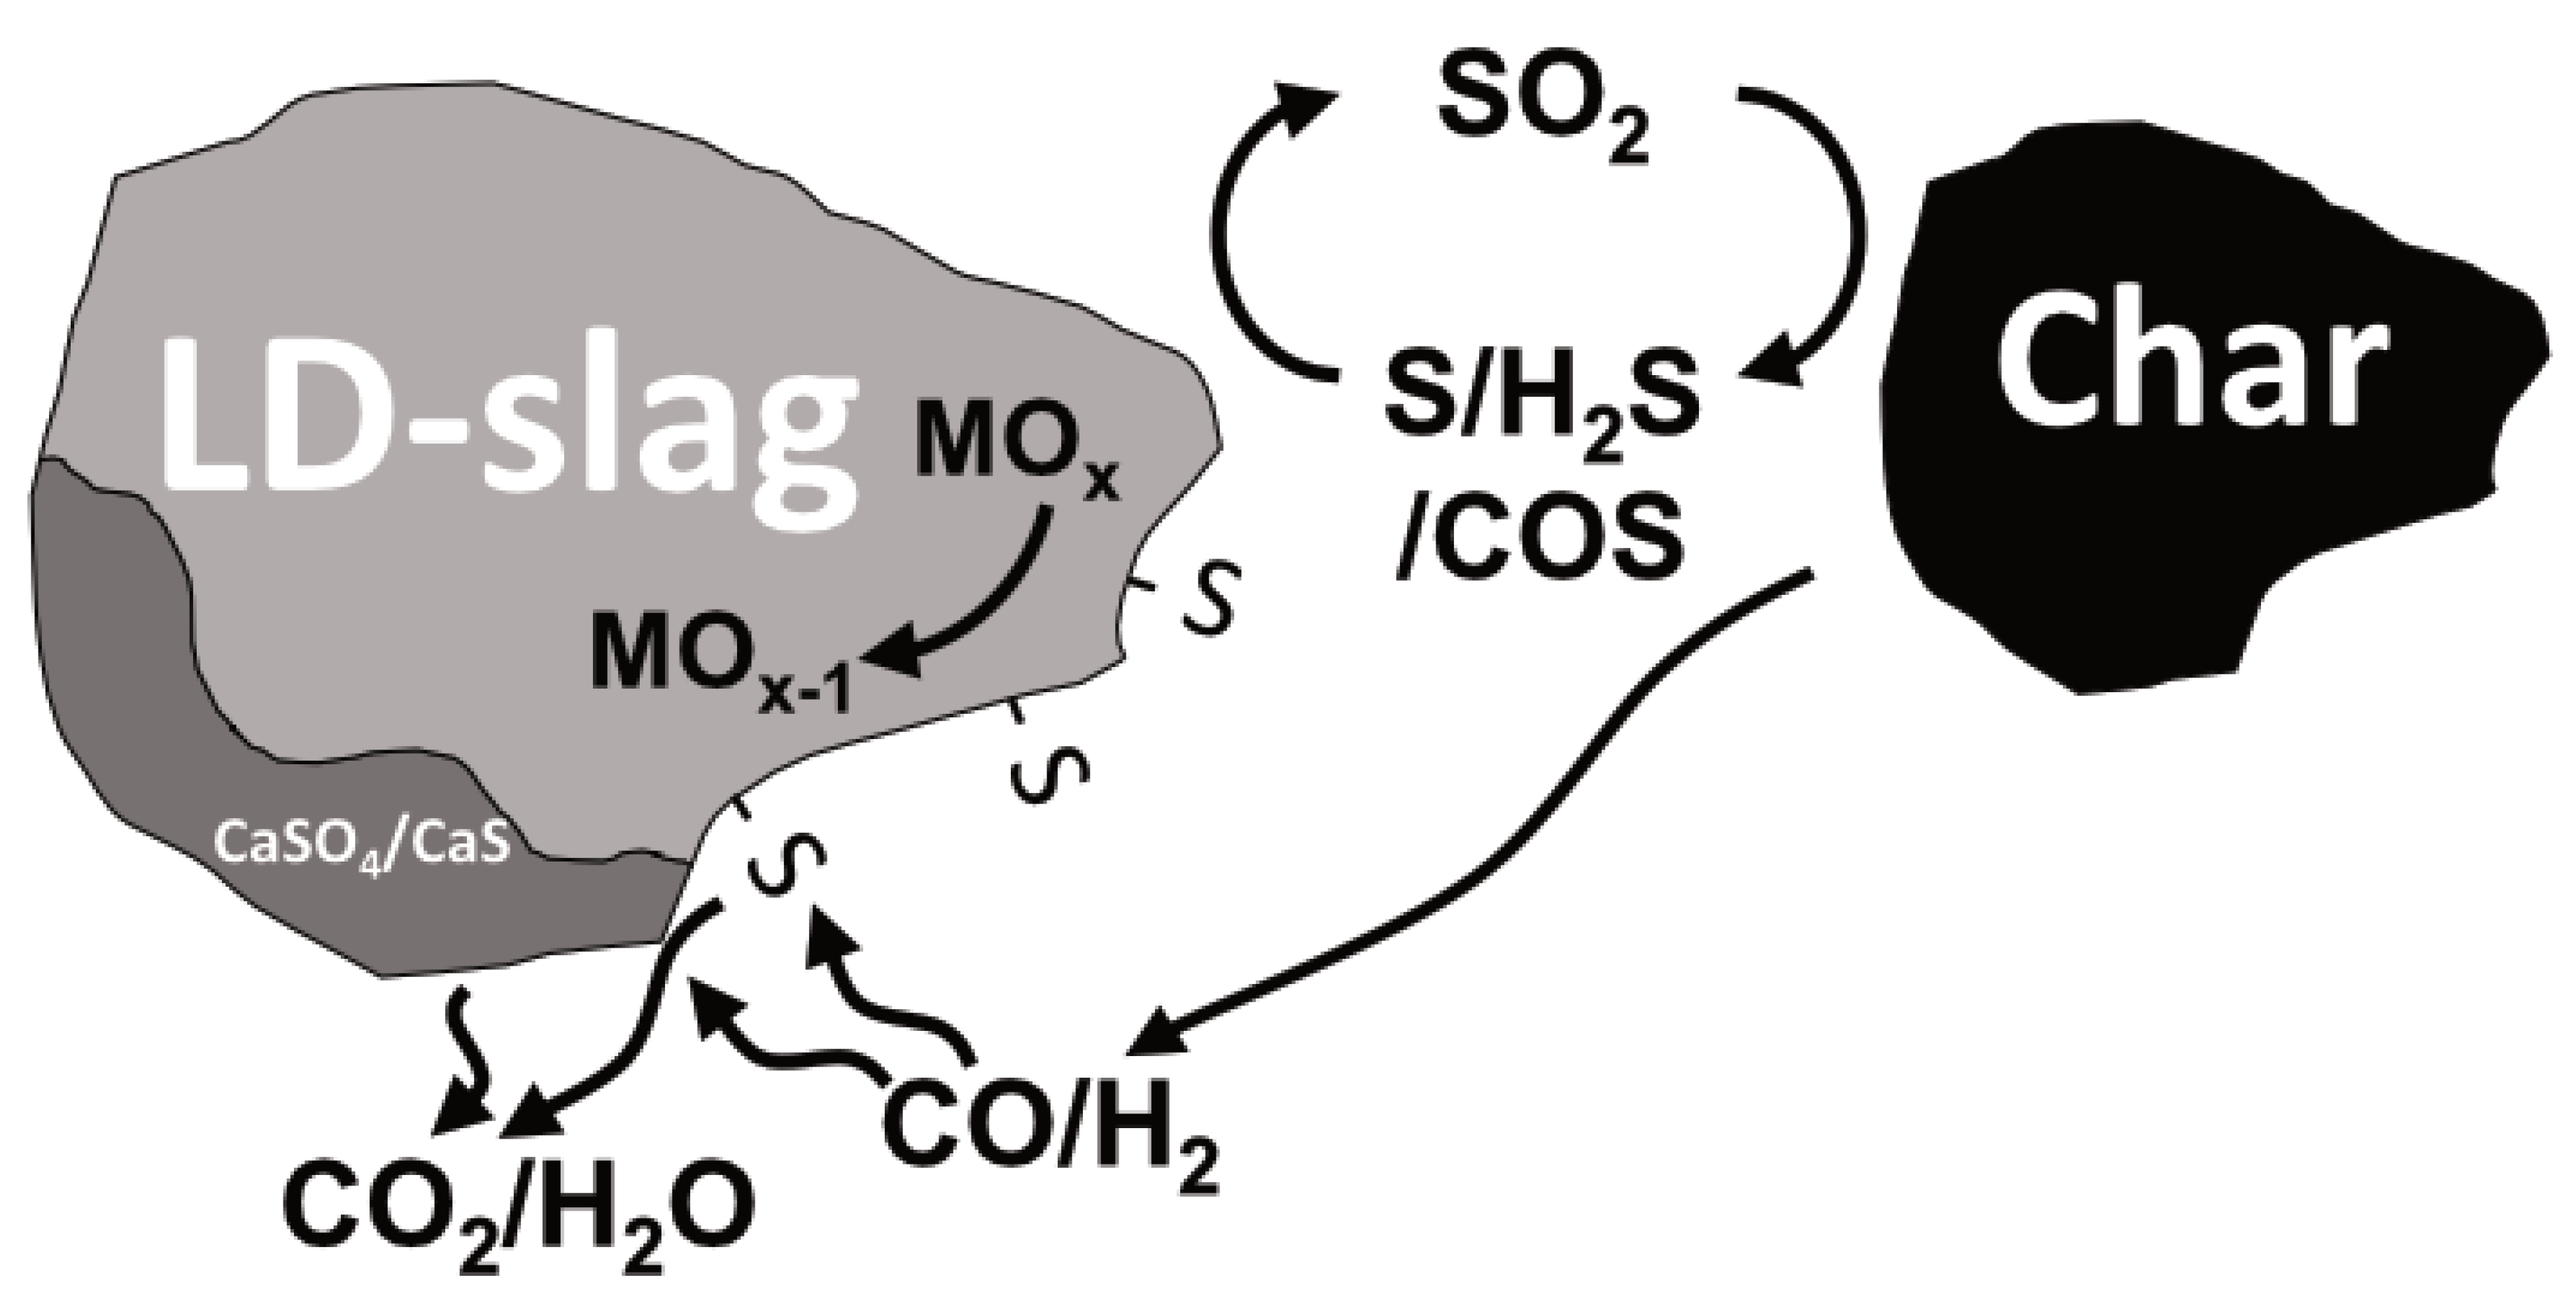
A summary of the reaction paths and effects of sulfur on LD slag can be seen in Figure 17. There are three important reactions path that are emphasized in the figure, from the left: (i) formation of CaSO4/CaS; (ii) surface-active sulfur increasing the reaction rate towards, e.g., CO; and (iii) increased gasification rate of char due to oxygen transfer via SO2 from OC to char.
For LD slag, one of the significant interactions of CaO with SO2 is the formation of CaS and CaSO4. This was expected from the thermodynamic calculations presented in Figure 2 and 
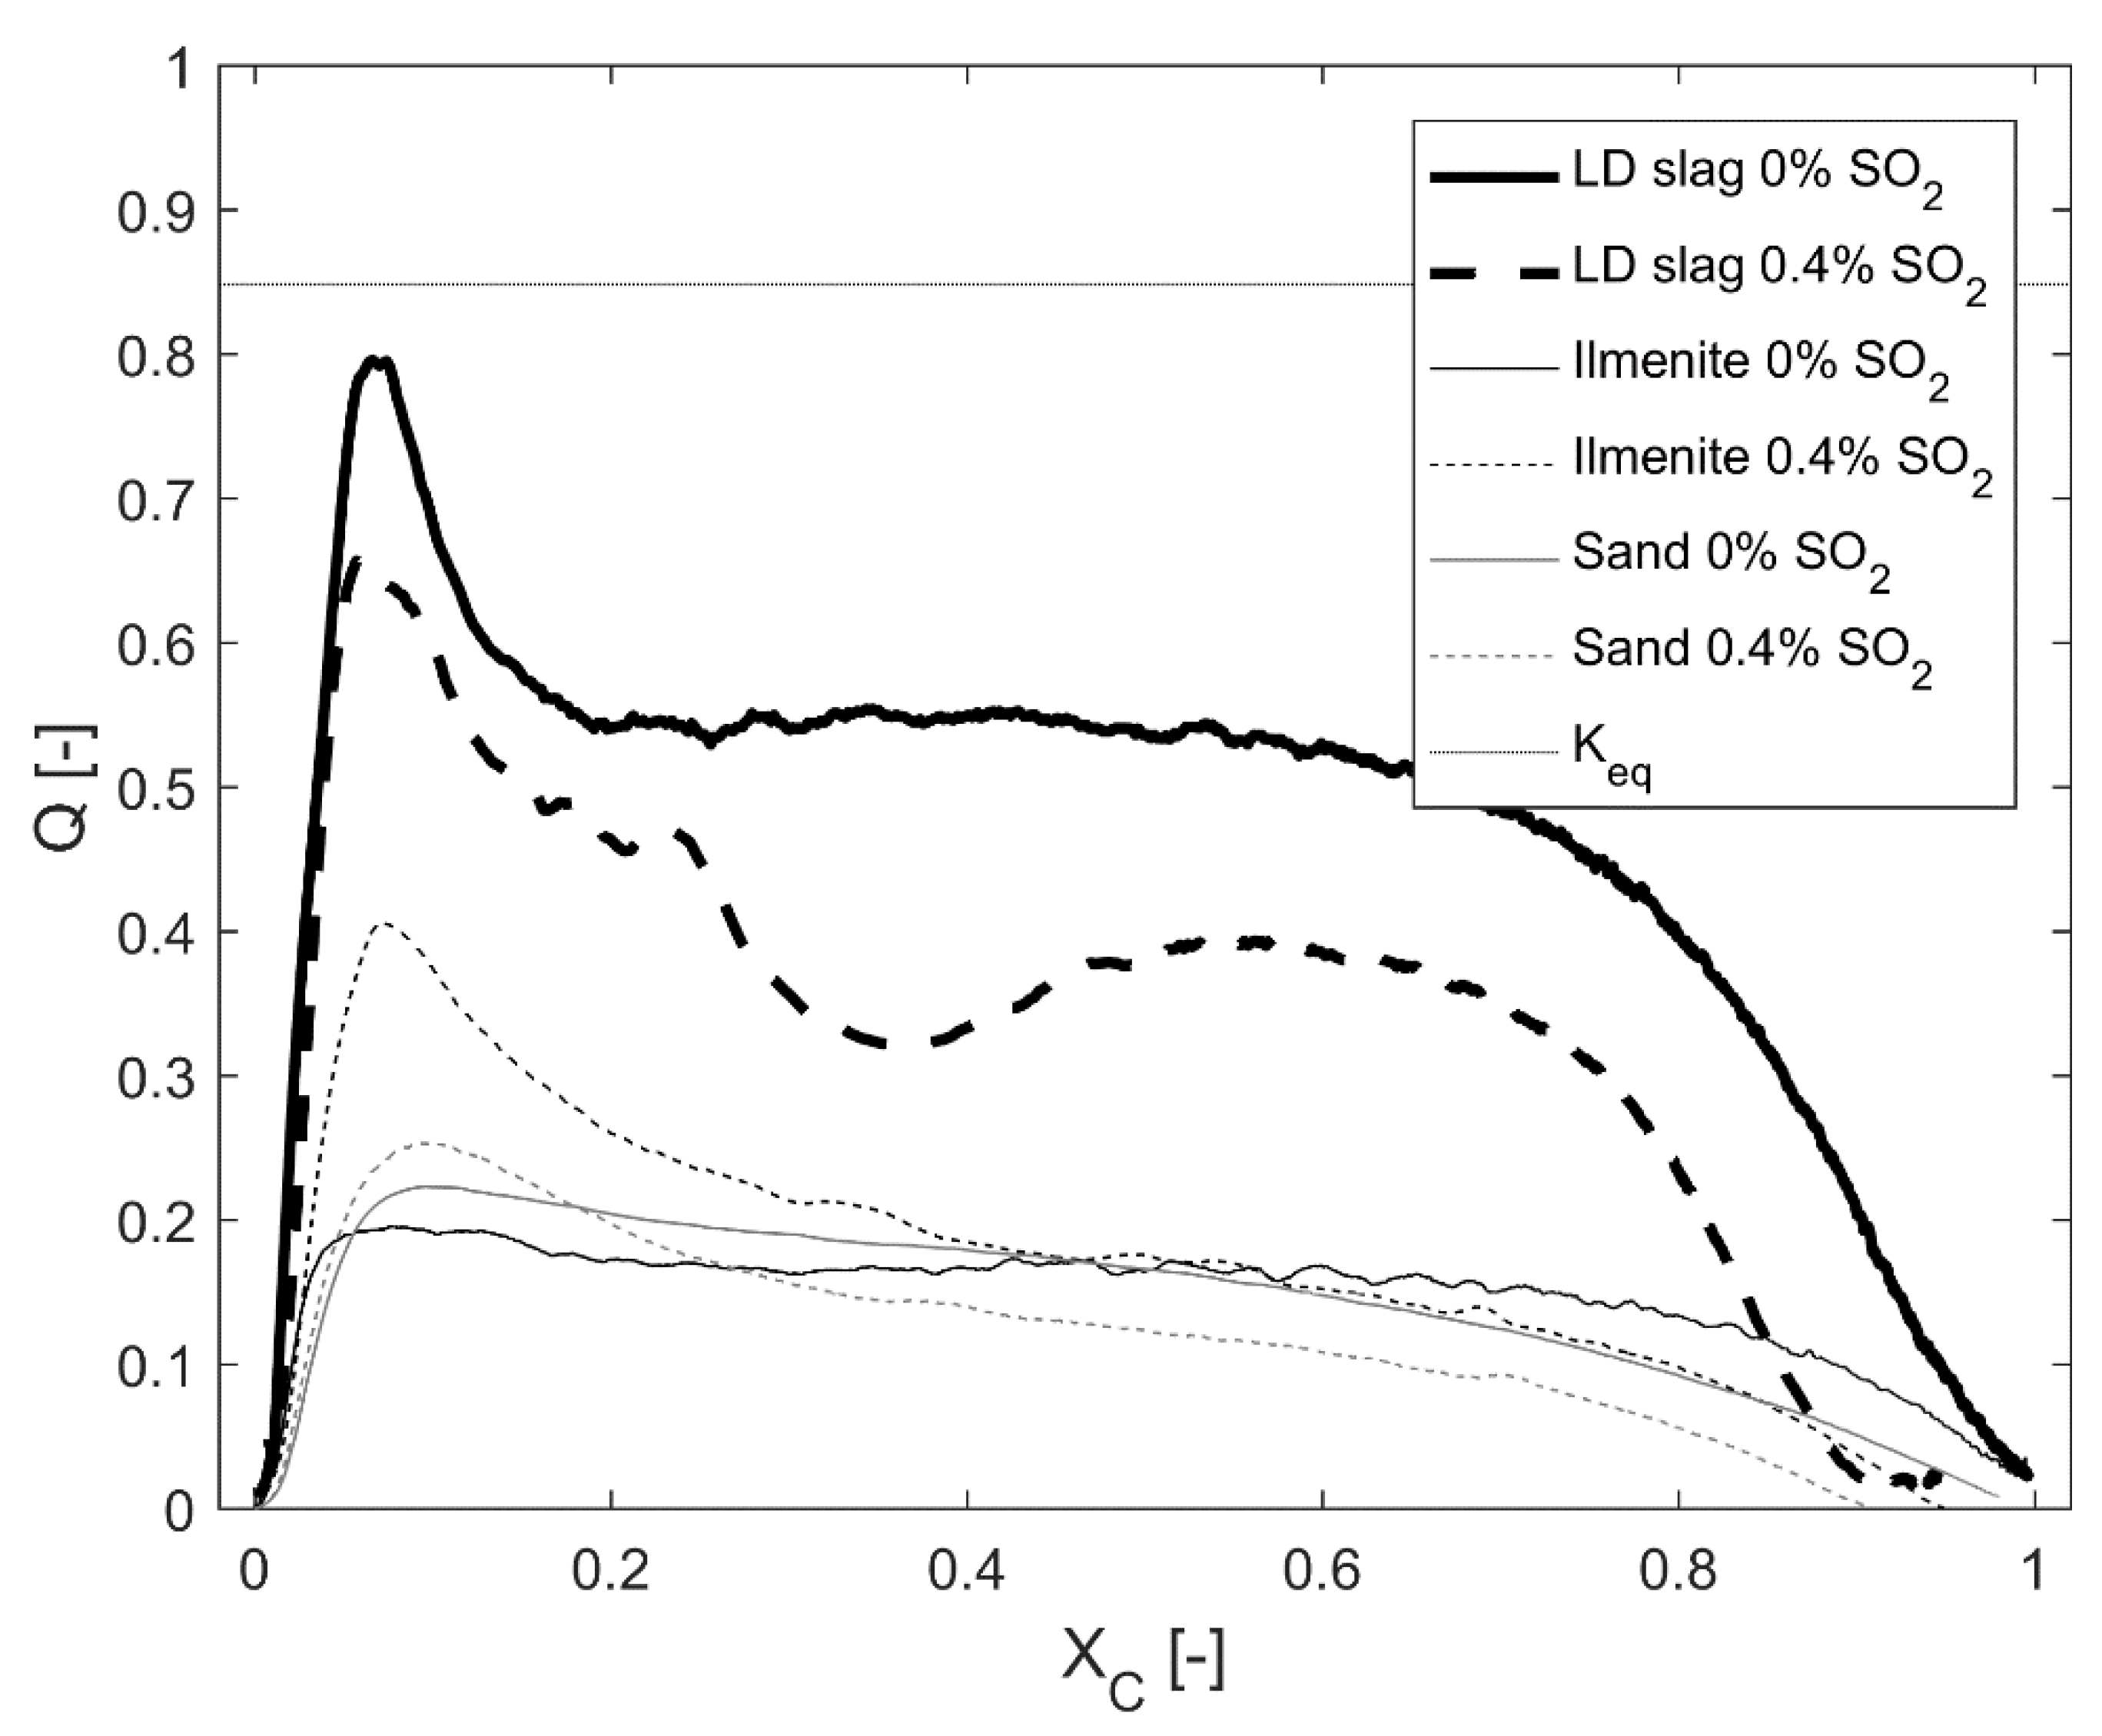
Figure 3. CaO is a known catalyst and can explain why LD slag has a reaction quotient Q closer to the equilibrium compared to the other tested materials in Figure 11 [35,36,49]. Forming CaS or CaSO4, less CaO in the bed can catalyse the WGS reaction. As could be observed in Figure 11, the sulfur content in the ingoing gas decreased the reaction quotient Q for LD slag. The same effect of sulfur could not be observed for the other tested materials. However, this effect could only be detected at 870 °C. At 970 °C, no significant effect of sulfur regarding the reaction quotient Q could be observed. This suggests that neither CaS nor CaSO4 was formed at this partial pressure of SO2, as compared with Figure 2 to see the effect of temperature on equilibrium for the CaS/CaSO4/CaO system.
SO2 and H2S in the outgoing gas are highly affected by the bed material used. This can be observed in Figure 13 and Table 6. For both ilmenite and LD slag, the initial part of the char conversion (0 < Xc < 0.1) was characterized by high amounts of mostly H2S that were detected with Dräger tubes. Almost no SO2 was present in this initial phase. This is most likely due to the high amount of H2 that was released with the volatiles from the char. Likely, H2 reacts with SO2, forming H2S that is more thermodynamic stable with high amounts of H2. It is after this initial char conversion (Xc > 0.1) where LD slag and ilmenite perform differently. For ilmenite, the outgoing concentration of H2 is stable, as well as the SO2, until the solid fuel is fully converted. However, when LD slag is reduced, more H2 is formed due to water splitting [36]. This was observed as a simultaneous increase in H2 concentration in Figure 8, and as a decrease in SO2 in Figure 13. Thermodynamic calculations using the concentrations in these figures also suggest the formation of H2S. The presence of H2S and SO2 in the same gas mixture enables elemental sulfur to be formed according to the Claus reaction (Reaction (R11)). Elemental sulfur can stick to the walls of the reactor cooler areas. When oxidation of the oxygen carrier starts, all oxygen is absorbed into the bed. When oxygen breaks through, it might react with the sulfur that is stuck to the walls. This could be the reason for the SO2 peak that occurs in Figure 14 just before the oxygen breakthrough.
Sulfur was observed to absorb into the LD slag. Loading a large amount of sulfur over a long period of time under oxidative conditions resulted in a clear decrease in surface area and reactivity (see Table 5 and Figure 14). Parts of the sulfur that were loaded into the LD slag particle were then observed to be released during the following reduction cycles without SO2 in the ingoing gas. This could mean that CaS forms during the reduction and then reacts with the CaSO4, according to Reaction (R10). This reaction path is also strengthened from the observation of the SO2 concentration profile over the cycle, seen in Figure 15. SO2 concentration in the outgoing gases peaks during the reduction and starts to decrease when the inert phase starts. However, the SO2 concentration drops first to zero, then oxidation starts and all remaining CaS is oxidized to CaSO4. Even after seven reduction cycles, the SO2 release during reduction was significant, and sulfur-containing phases were detected in the cross-section of the particles using SEM-EDX. Only CaSO4, and no CaS, could be detected in these samples using XRD. If CaS was formed, the amounts were very small and could be expected to react fast with CaSO4 that is likely closely located in the same calcium-containing phases in the LD slag. Further, the SO2 peak that was observed directly when oxygen was introduced indicates that CaS was formed and partly oxidized to SO2, according to Reaction (R9). This occurred in gaseous fuel experiments after and before the loading of sulfur in the sample. Additionally, in gasification experiments, sulfur interacted accordingly with sulfur release during inert phases and a small release when oxygen was introduced (see, e.g., Figure 5). In similar experiments with ilmenite, this behavior was not observed. Interpolating this behavior to an industrial scale indicates that SO2 could be released in loop seals and in the air reactor in a CLC or CLG plant using LD slag as an oxygen carrier. However, when using biofuel as fuel, calcium is known to be deposited on ash layers of ilmenite and inside the structure as well [11,50]. For ilmenite, these ash layers have been observed to be important for the sulfur interaction [28], since calcium is identified as the main component for this interaction path that might transport sulfur to the loop seal or air reactor. Further studies including calcium from the fuel are required to estimate the importance of the ingoing calcium in LD slag compared to ilmenite in a full-scale application.
In comparison to previous studies where LD slag has been used in a boiler [
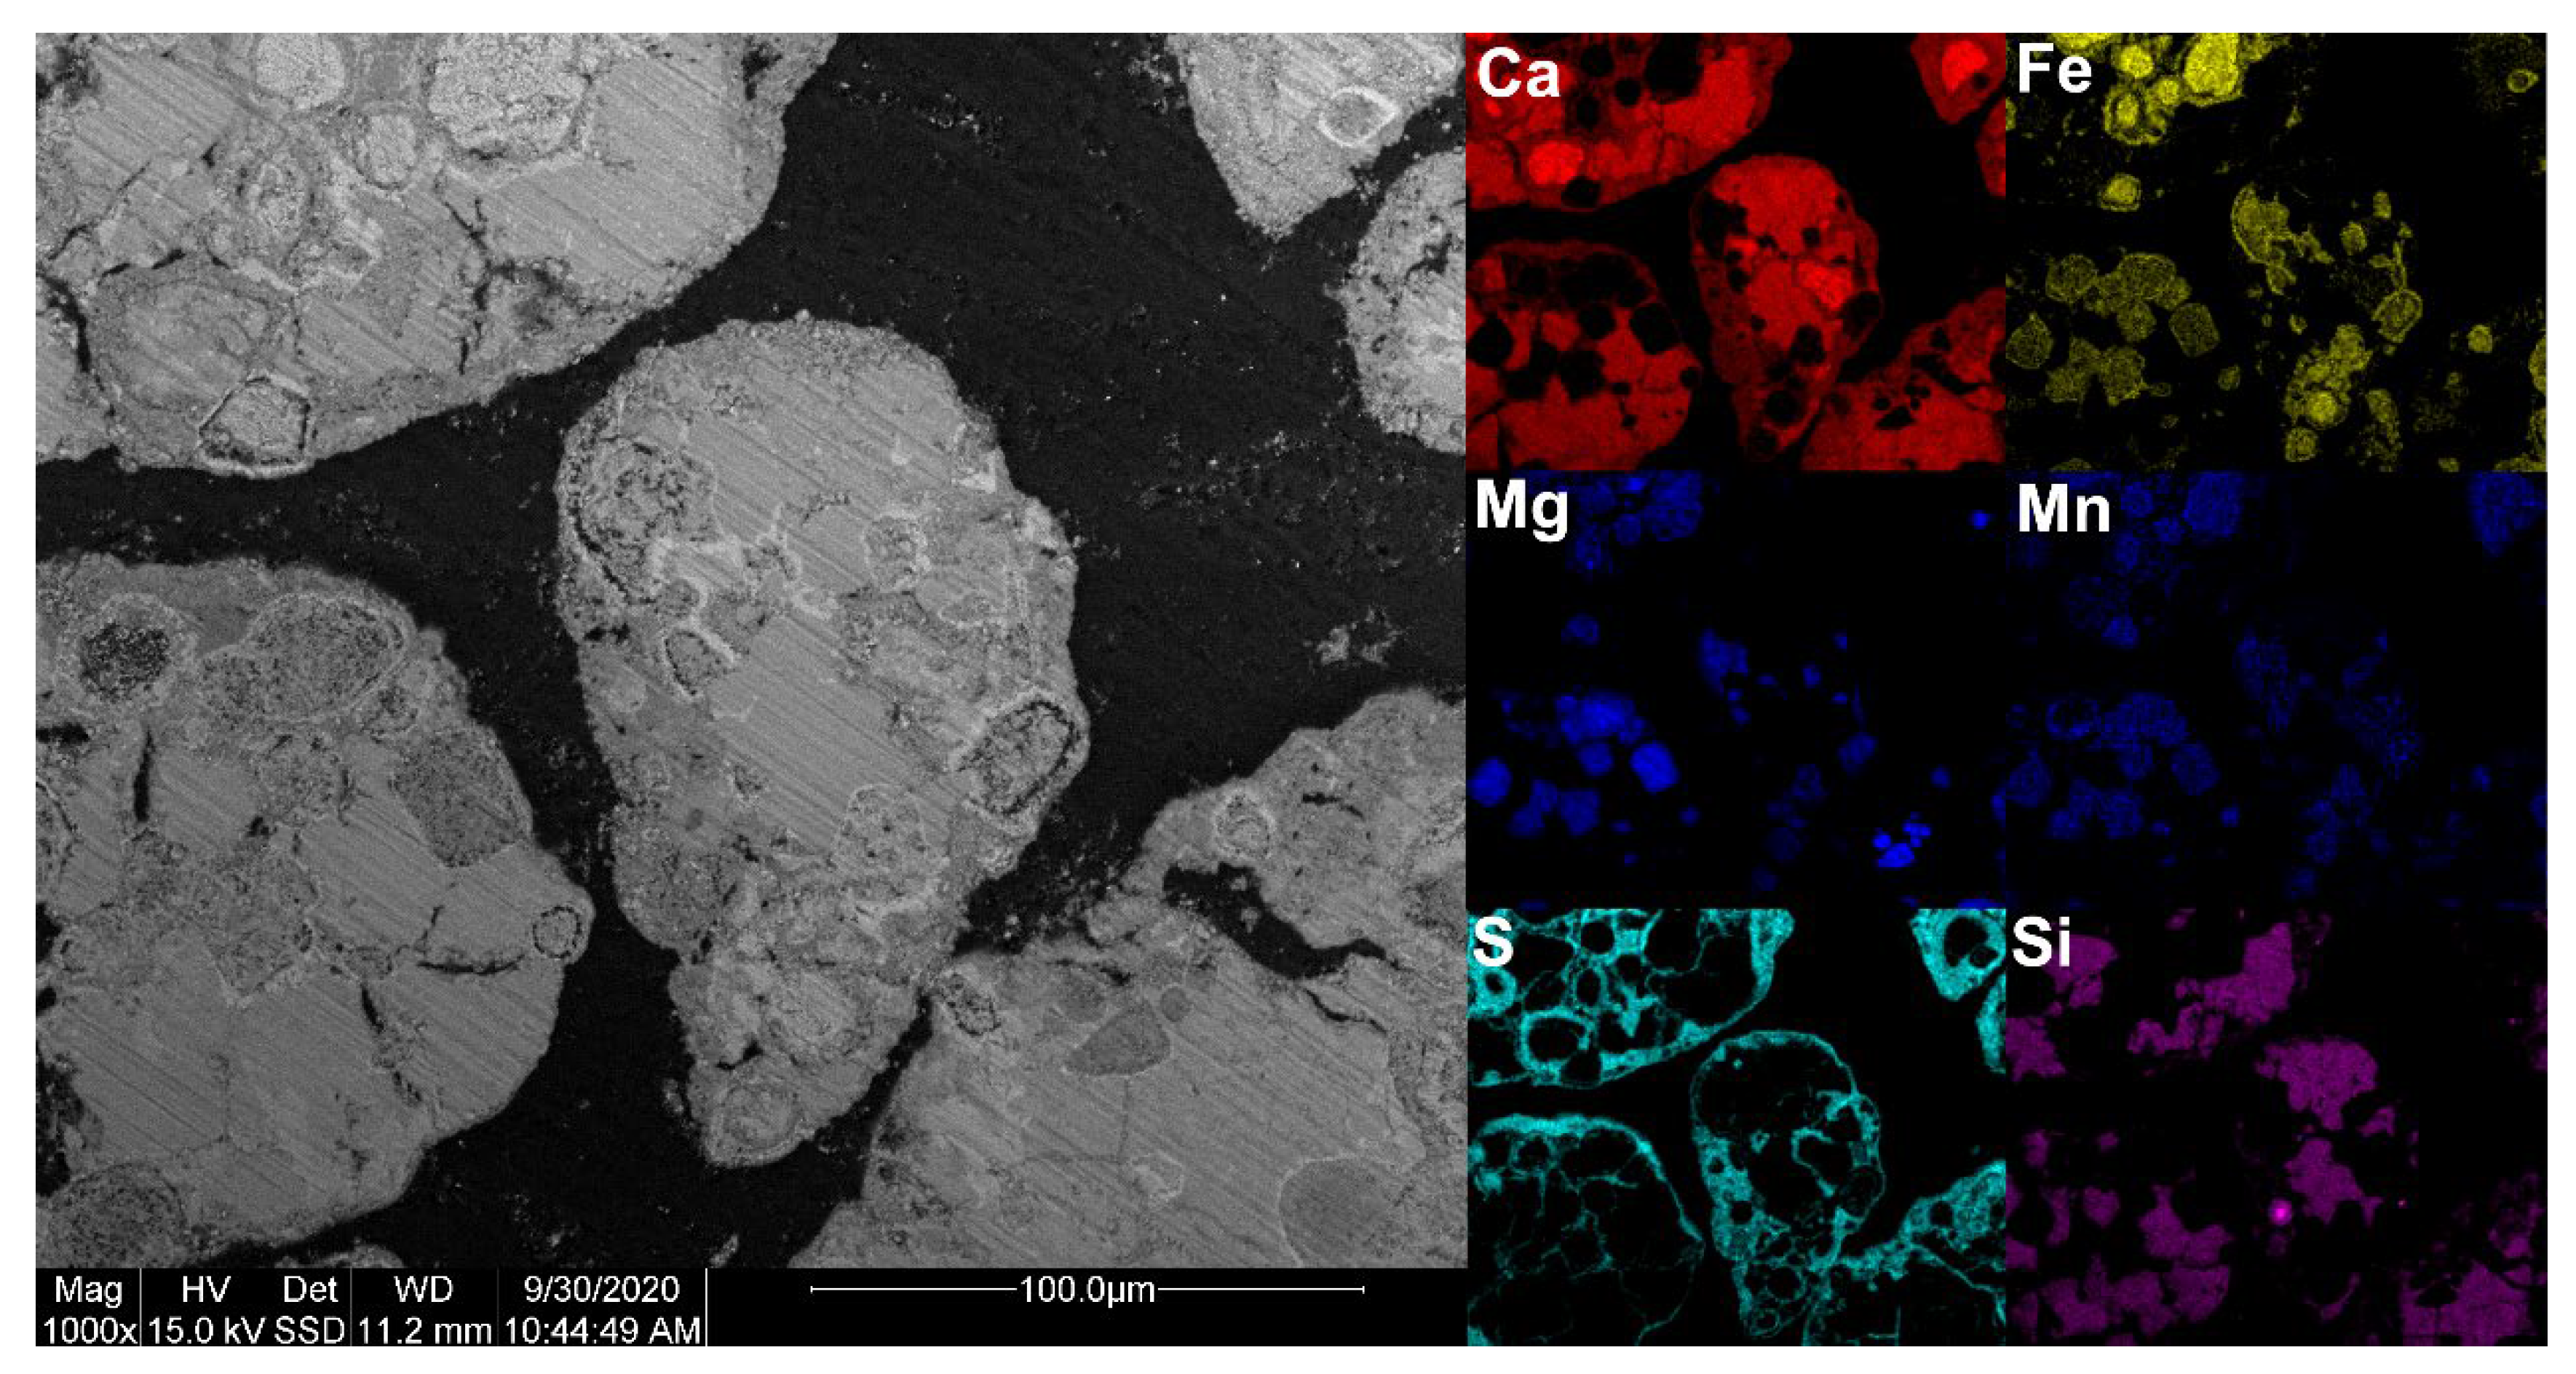
15], it can be observed that the sulfur from the fuel was located on the surface of the particles. In this study, it was observed that sulfur was present throughout the entire sample (see Figure 16). This could be due to the lack of available calcium from the fuel ash that can form on the surface, or because the amount of sulfur introduced to the sample was high, resulting in saturation on the surface. From the SEM-EDX analysis, no migration limitation/border of sulfur could be observed, indicating an inward-going migration of sulfur in the cross-section. However, since LD slag is so heterogeneous, a clear migration trend is hard to detect. From previous studies, it has been found that sulfur penetration can increase significantly under alternating oxidizing and reducing conditions [21].
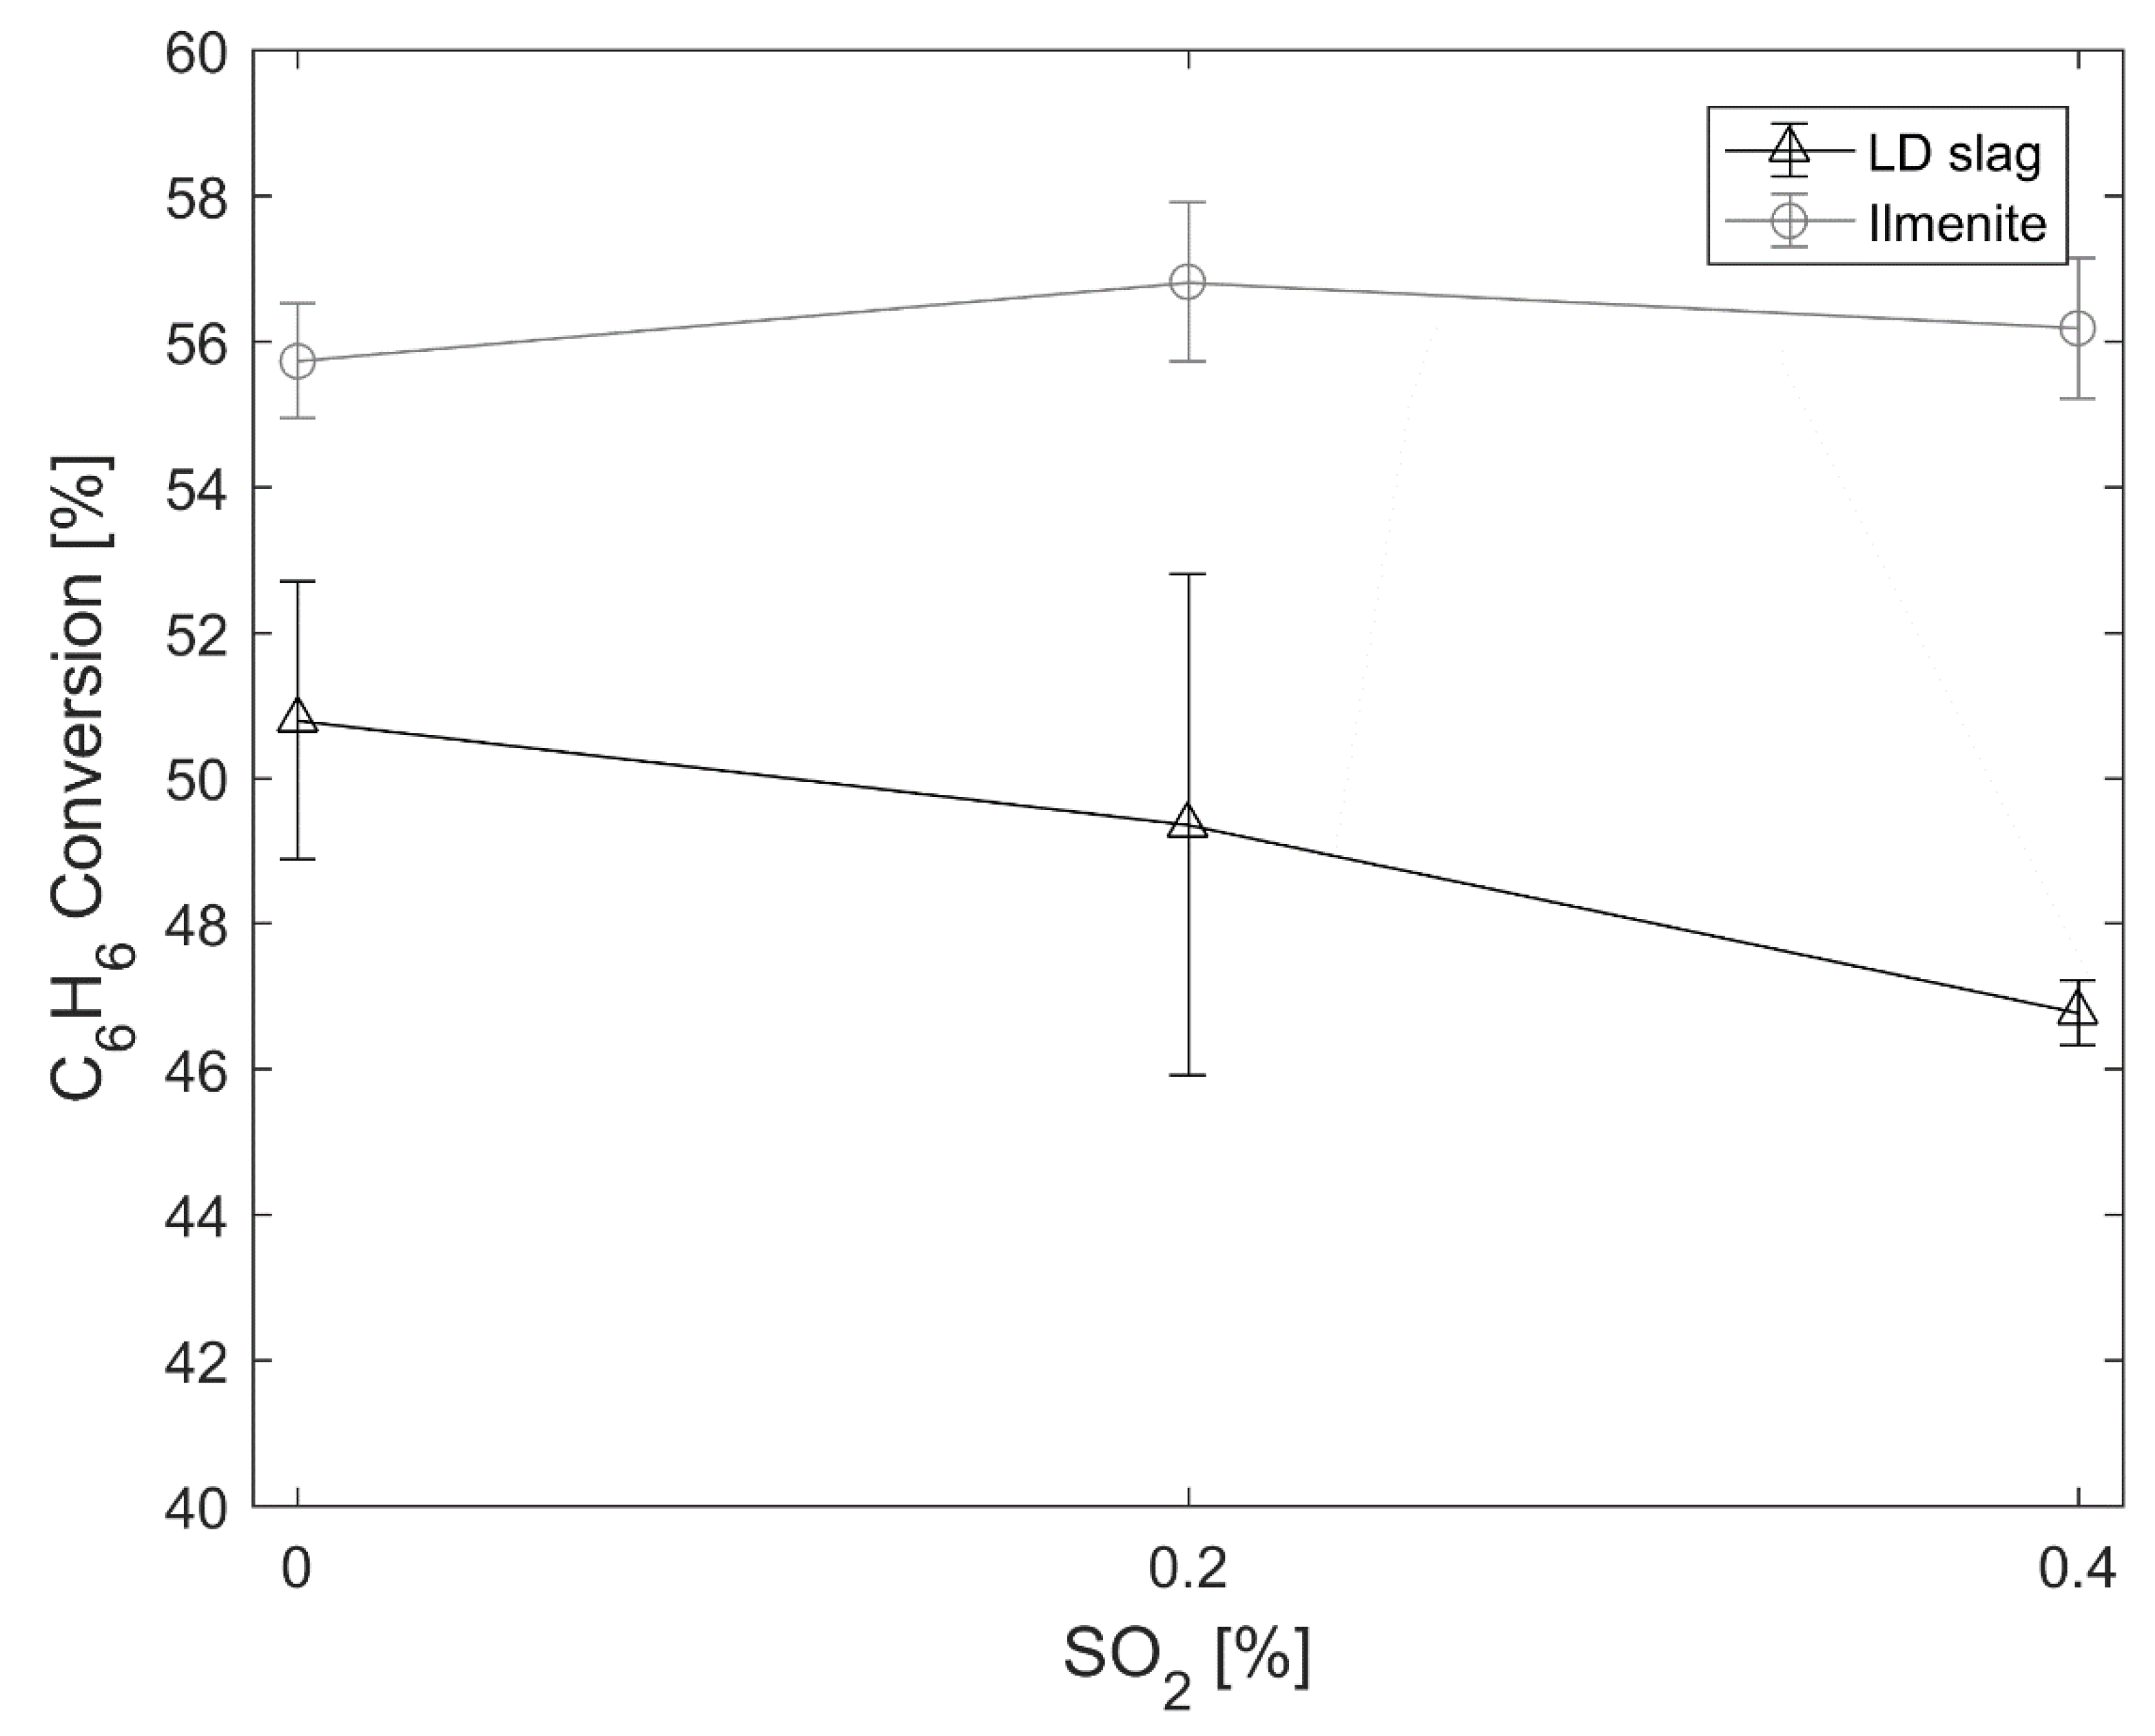
The effect of sulfur towards reactions of larger hydrocarbons was tested using benzene. For the conversion of benzene, the investigated concentrations of SO2 have minimal or no effect on the conversion. It is important to note that the particles were oxidized prior to the benzene experiments. Therefore, the extra oxygen provided by the small amount of SO2 should have minimal effect. This suggests that the oxidation reaction towards benzene is unaffected by sulfur or the reactions with LD slag forming CaS or CaSO4. However, the minor decrease in reactivity that can be seen comparing 0% to 0.4% SO2 could be due to the decreased surface area of the particles. This means that the same mechanism observed to increase the conversion of methane in the presence of sulfur observed in previous studies [23] might not be applicable for benzene. Since no change is observed, SO2 does not seem to affect the rate-limiting step of activating benzene, i.e., destabilizing the benzene ring [51].
The increased reactivity of LD slag with SO2 could be partly be a result of the oxygen transport from CaSO4 forming CaS; i.e., a new oxygen-carrying phase in LD slag is formed [52]. However, since ilmenite does not contain Ca, this is not contributing to the changed reactivity of ilmenite; rather, this occurs by the direct effect of oxygen transfer from SO2 reduced to H2S. However, the direct addition of SO2 as a source of oxygen can only have a limited effect due to the low concentrations. This is obvious from the experiments with sand where only H2S could be detected during the main part of gasification and the oxygen provided by SO2 is consumed during the gasification with limited effect on the overall gasification rate. This indicates that sulfur does not interact with the char directly to increase the reaction rate, in the same manner as sulfur does not interact with the destabilization of the benzene ring. Therefore, another mechanism is expected to be the origin of the observed reaction rate for both the investigated oxygen carriers.
Hydrogen inhibition of char during gasification is a well-known effect that decreases the gasification rate [53,54,55]. This has also been observed to be important for LD slag, since H2 is generated from water-splitting of steam when LD slag is reduced and this affects the gasification rate [36]. One hypothesis of the increased gasification rate observed in this study could be that SO2 reacts with H2, forming H2S, and that this decreases the H
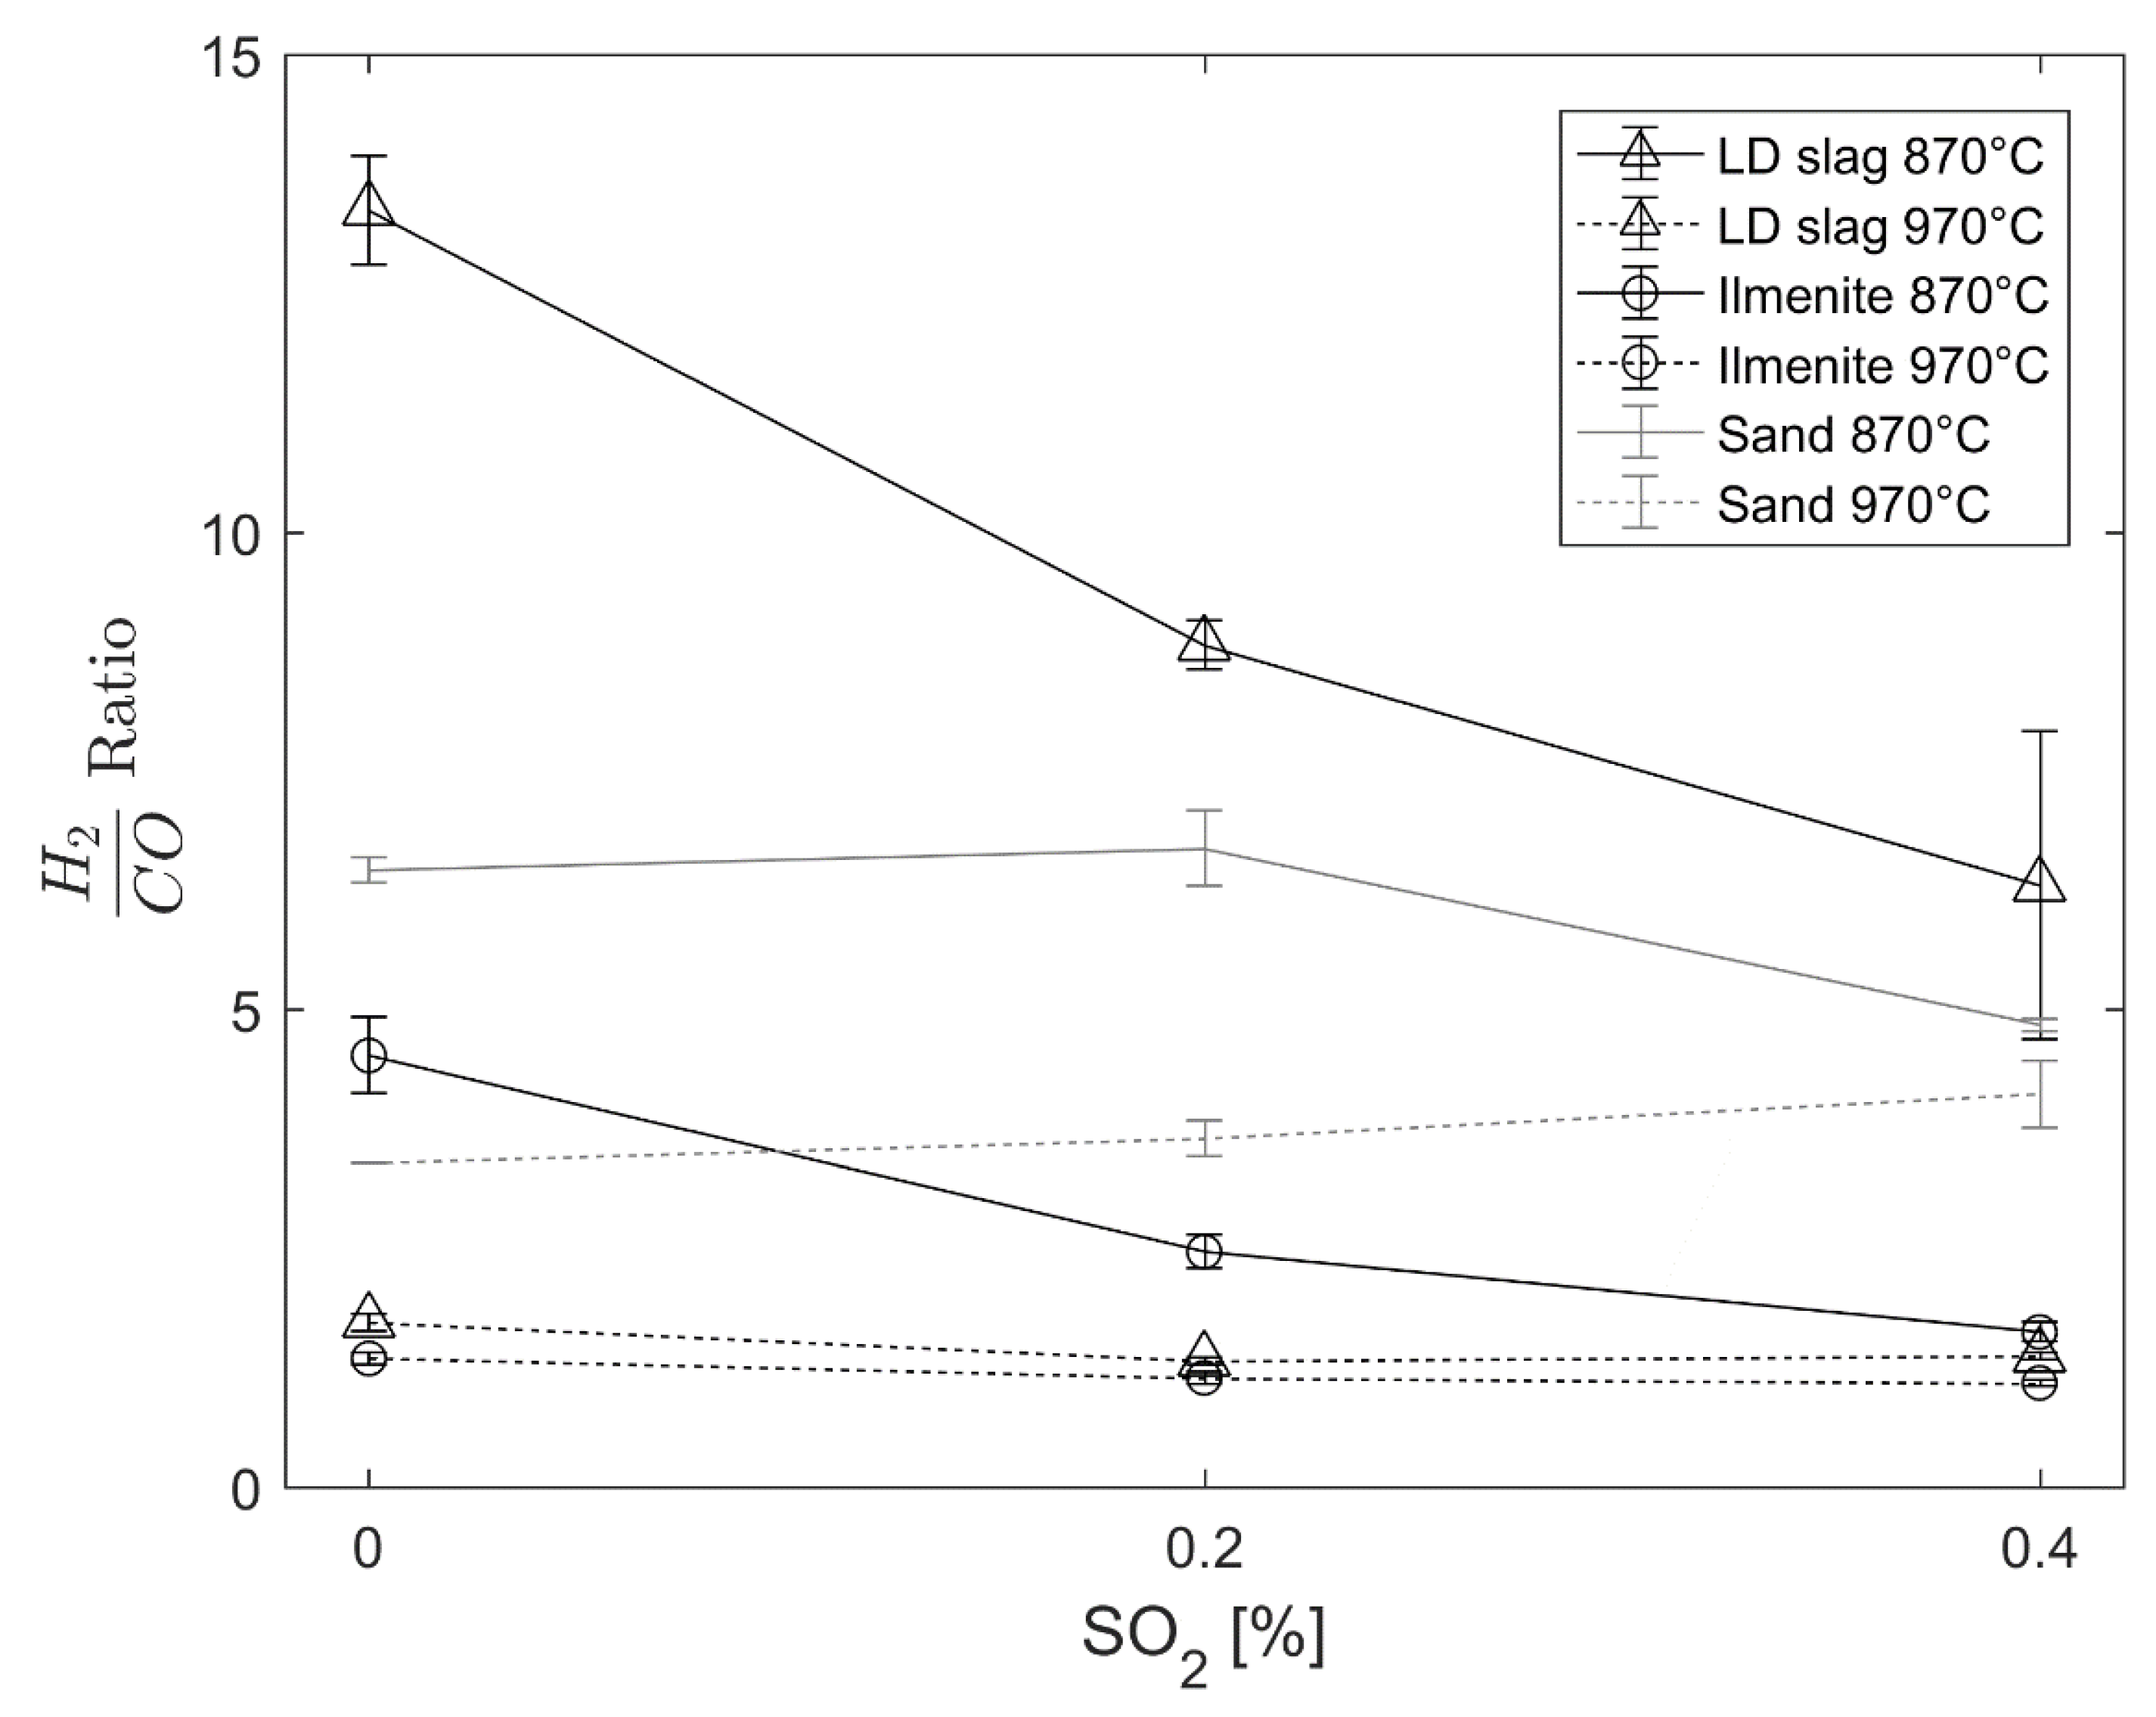
2 concentration, and ultimately, the hydrogen inhibition. It is unlikely, however, that this effect is dominant. In the sand samples, there is a small effect on the H2 concentration and the H2/CO ratio (see Figure 10 and Supplementary Materials figures). However, the effect of the gasification rate is negligible for sand. Moreover, for LD slag and ilmenite, there is an effect on the H2/CO ratio at 870 °C but not at 970 °C; still, the gasification rate is increased in the presence of SO2 at both temperatures. Further, the increased CO conversion observed in this study for LD slag and the increased methane conversion for ilmenite with sulfur [23] could not be related to hydrogen inhibition since no char is present.
More likely is that sulfur interacts as an intermediate to transport oxygen from the oxygen carrier to the char. SO2 reacts with char forming H2S, COS, or S, that then, in turn, is oxidized to SO2 by the oxygen carrier. Thermodynamic calculations regarding the conversion of char from SO2 compared to H2S can be seen in the Supplementary Materials. Similar reaction schemas have been suggested previously for the observed increased reaction rate towards petroleum coke of iron-based oxygen carriers [43]. This could also explain why the experiments with sand did not show any significant gasification rate change. In sand, the oxygen from SO2 can only be transferred once to the char and then is not oxidized again. This would explain the mixture of H2S and SO2 in the outgoing gases during the char conversion for LD slag and ilmenite (Figure 13 and Table 6) compared to sand (see Supplementary Materials). The oxygen transport also increases with the amount of SO
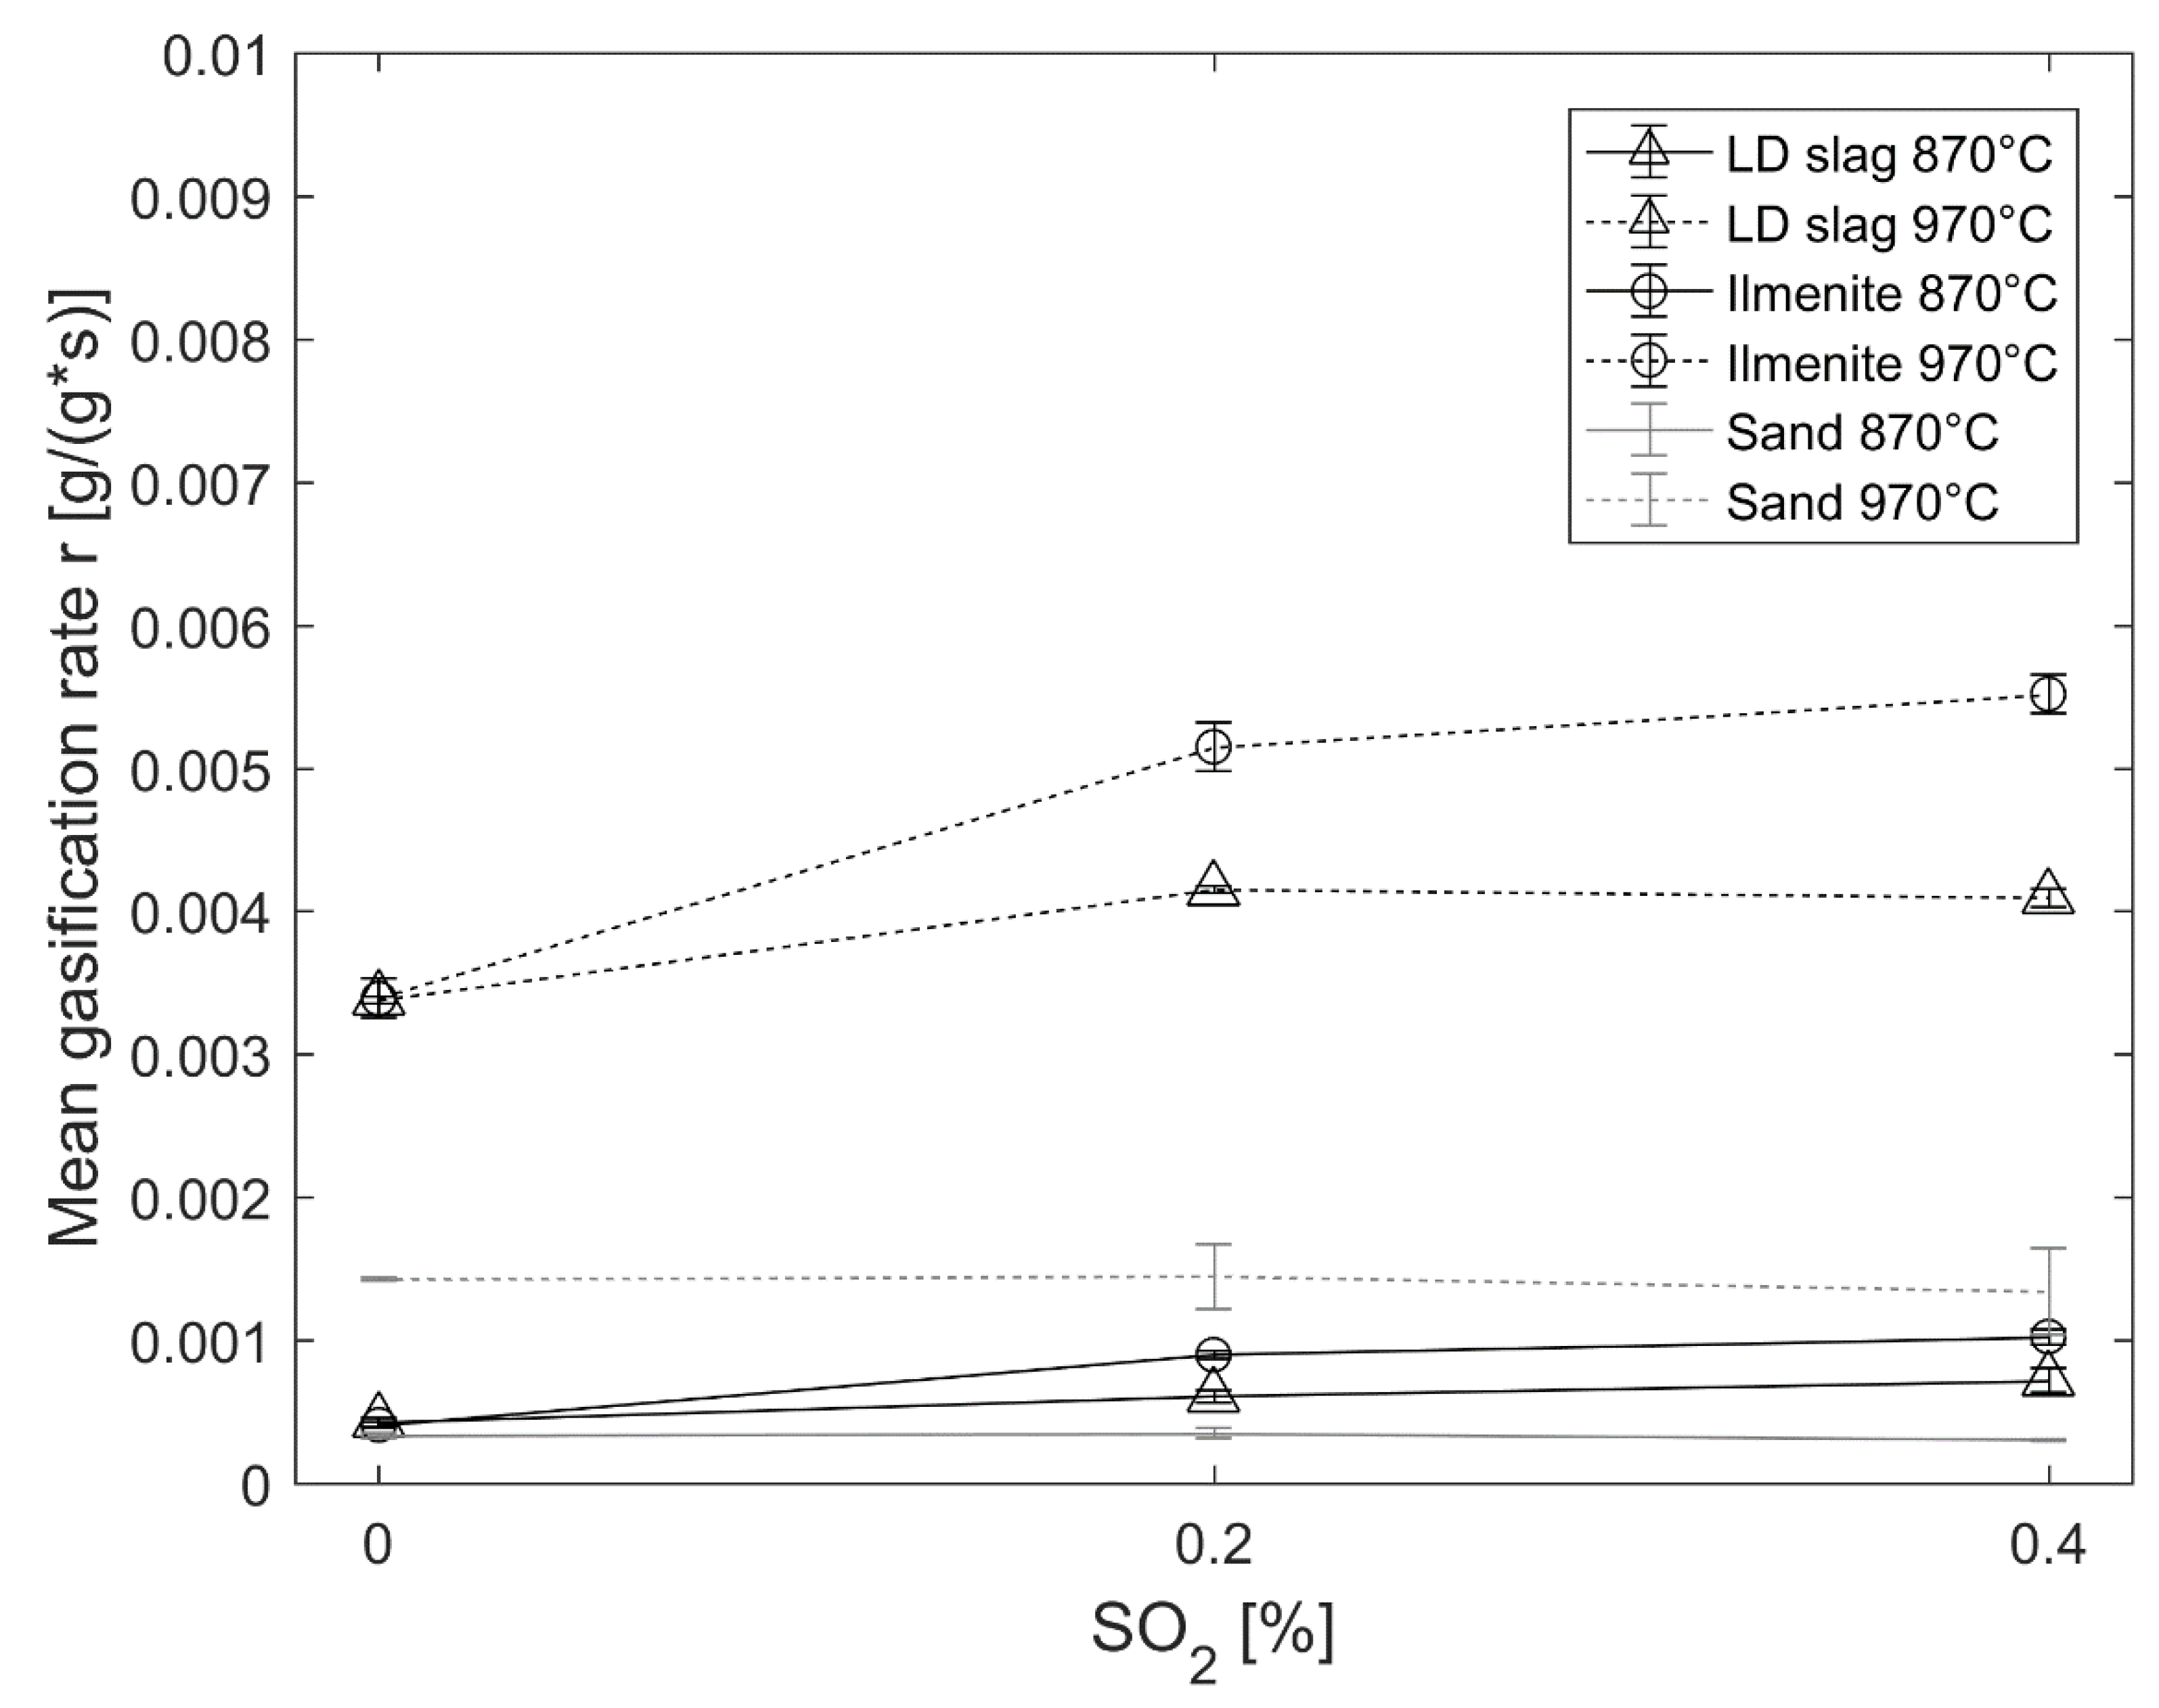
2 added, which the increased gasification rate seen in Figure 7 at both 870 °C and 970 °C indicates. Furthermore, the absorbed sulfur that was released in the following experiments without SO2 addition also increased the gasification rate. This also suggests that it is the gas phase sulfur transporting the oxygen.
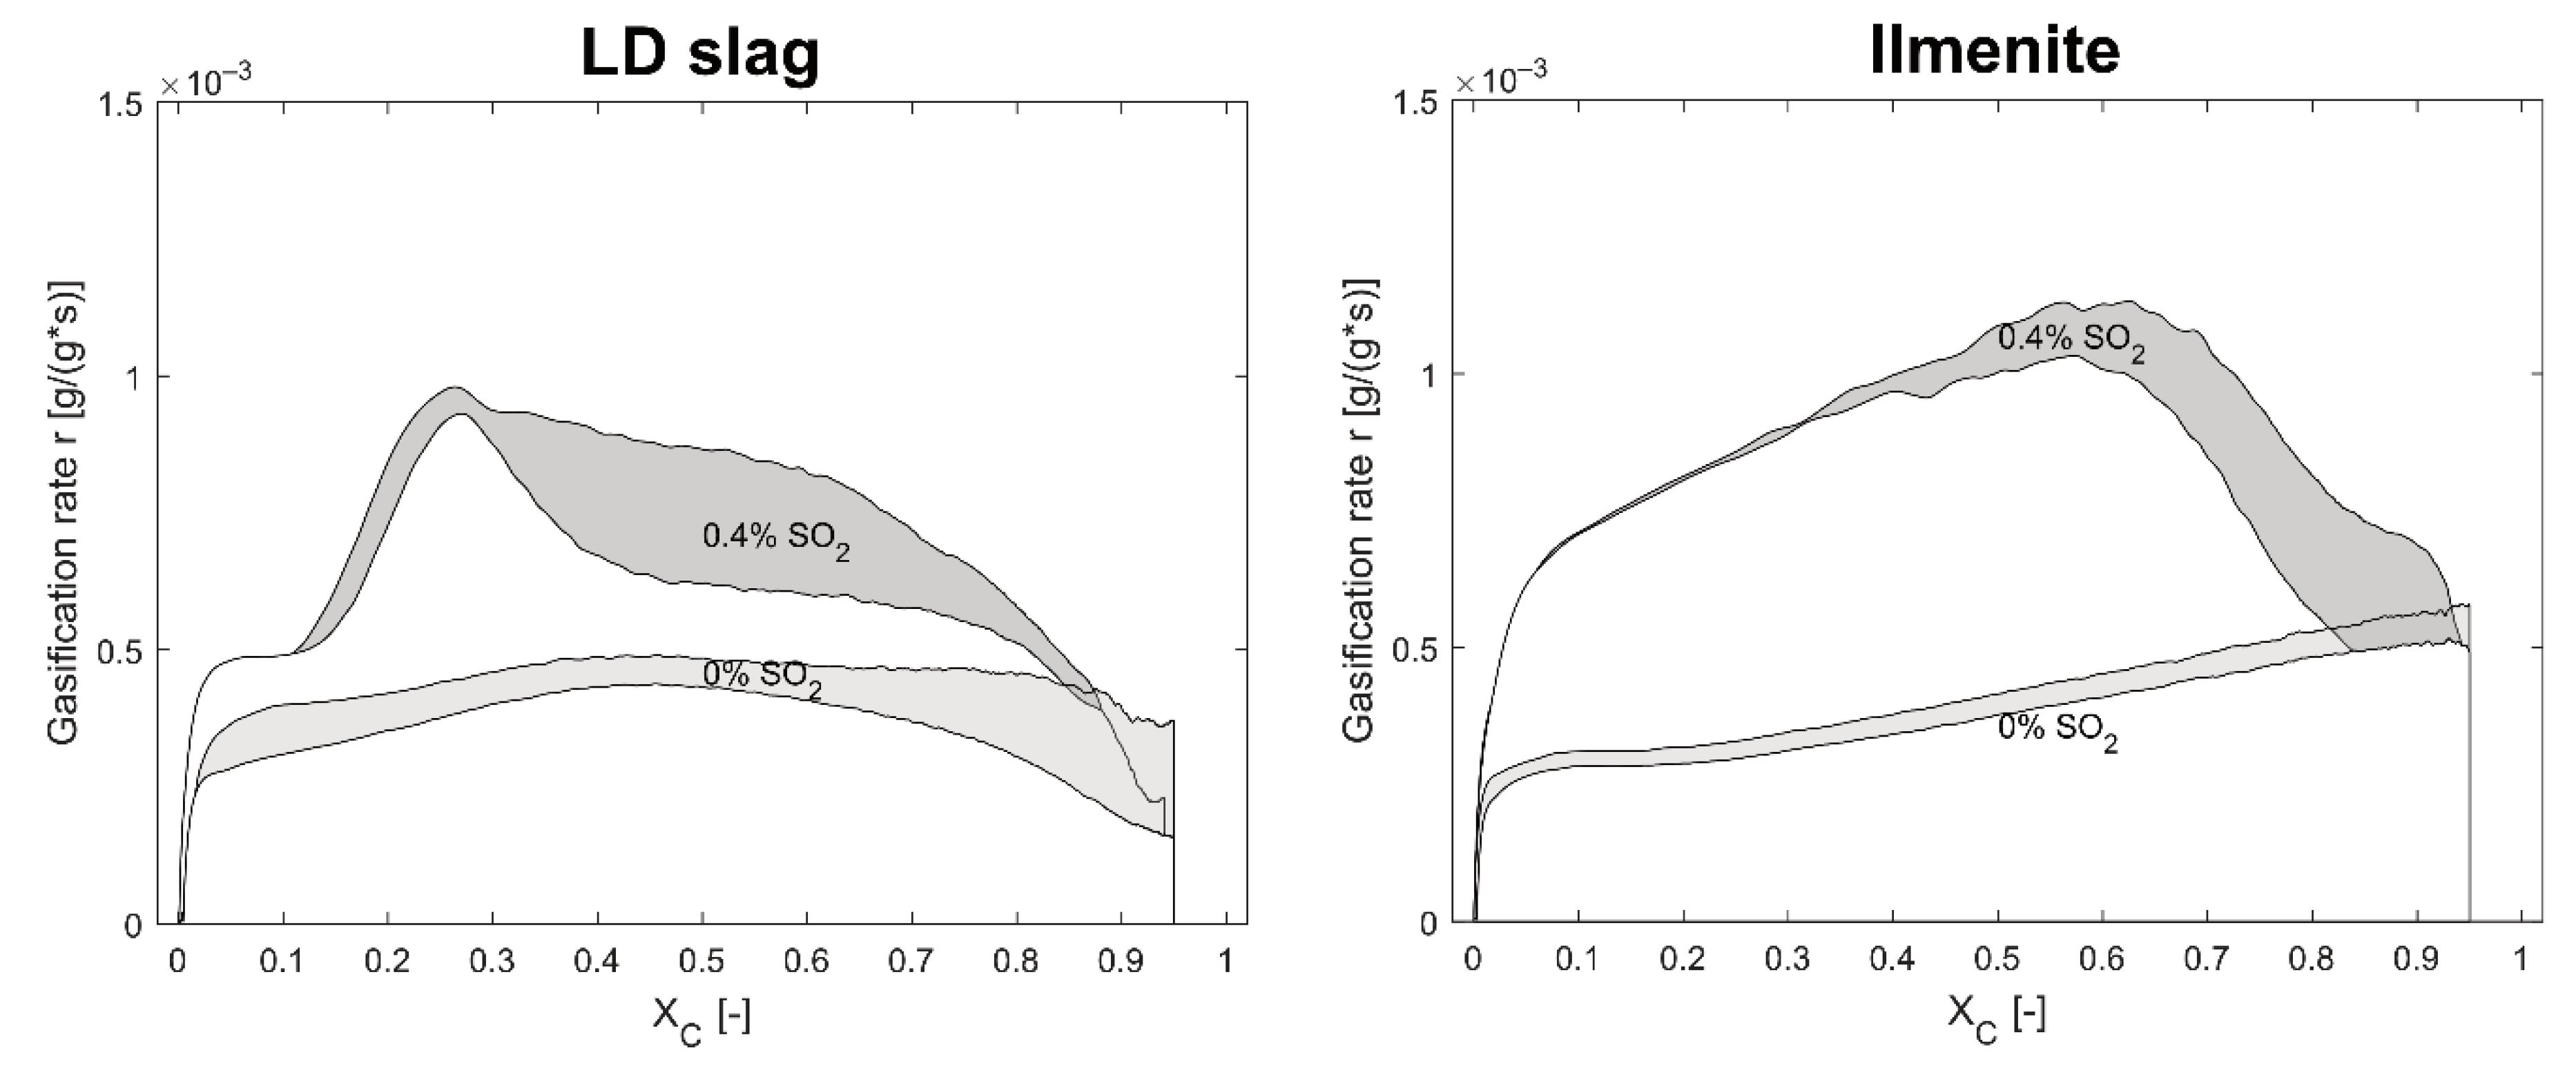
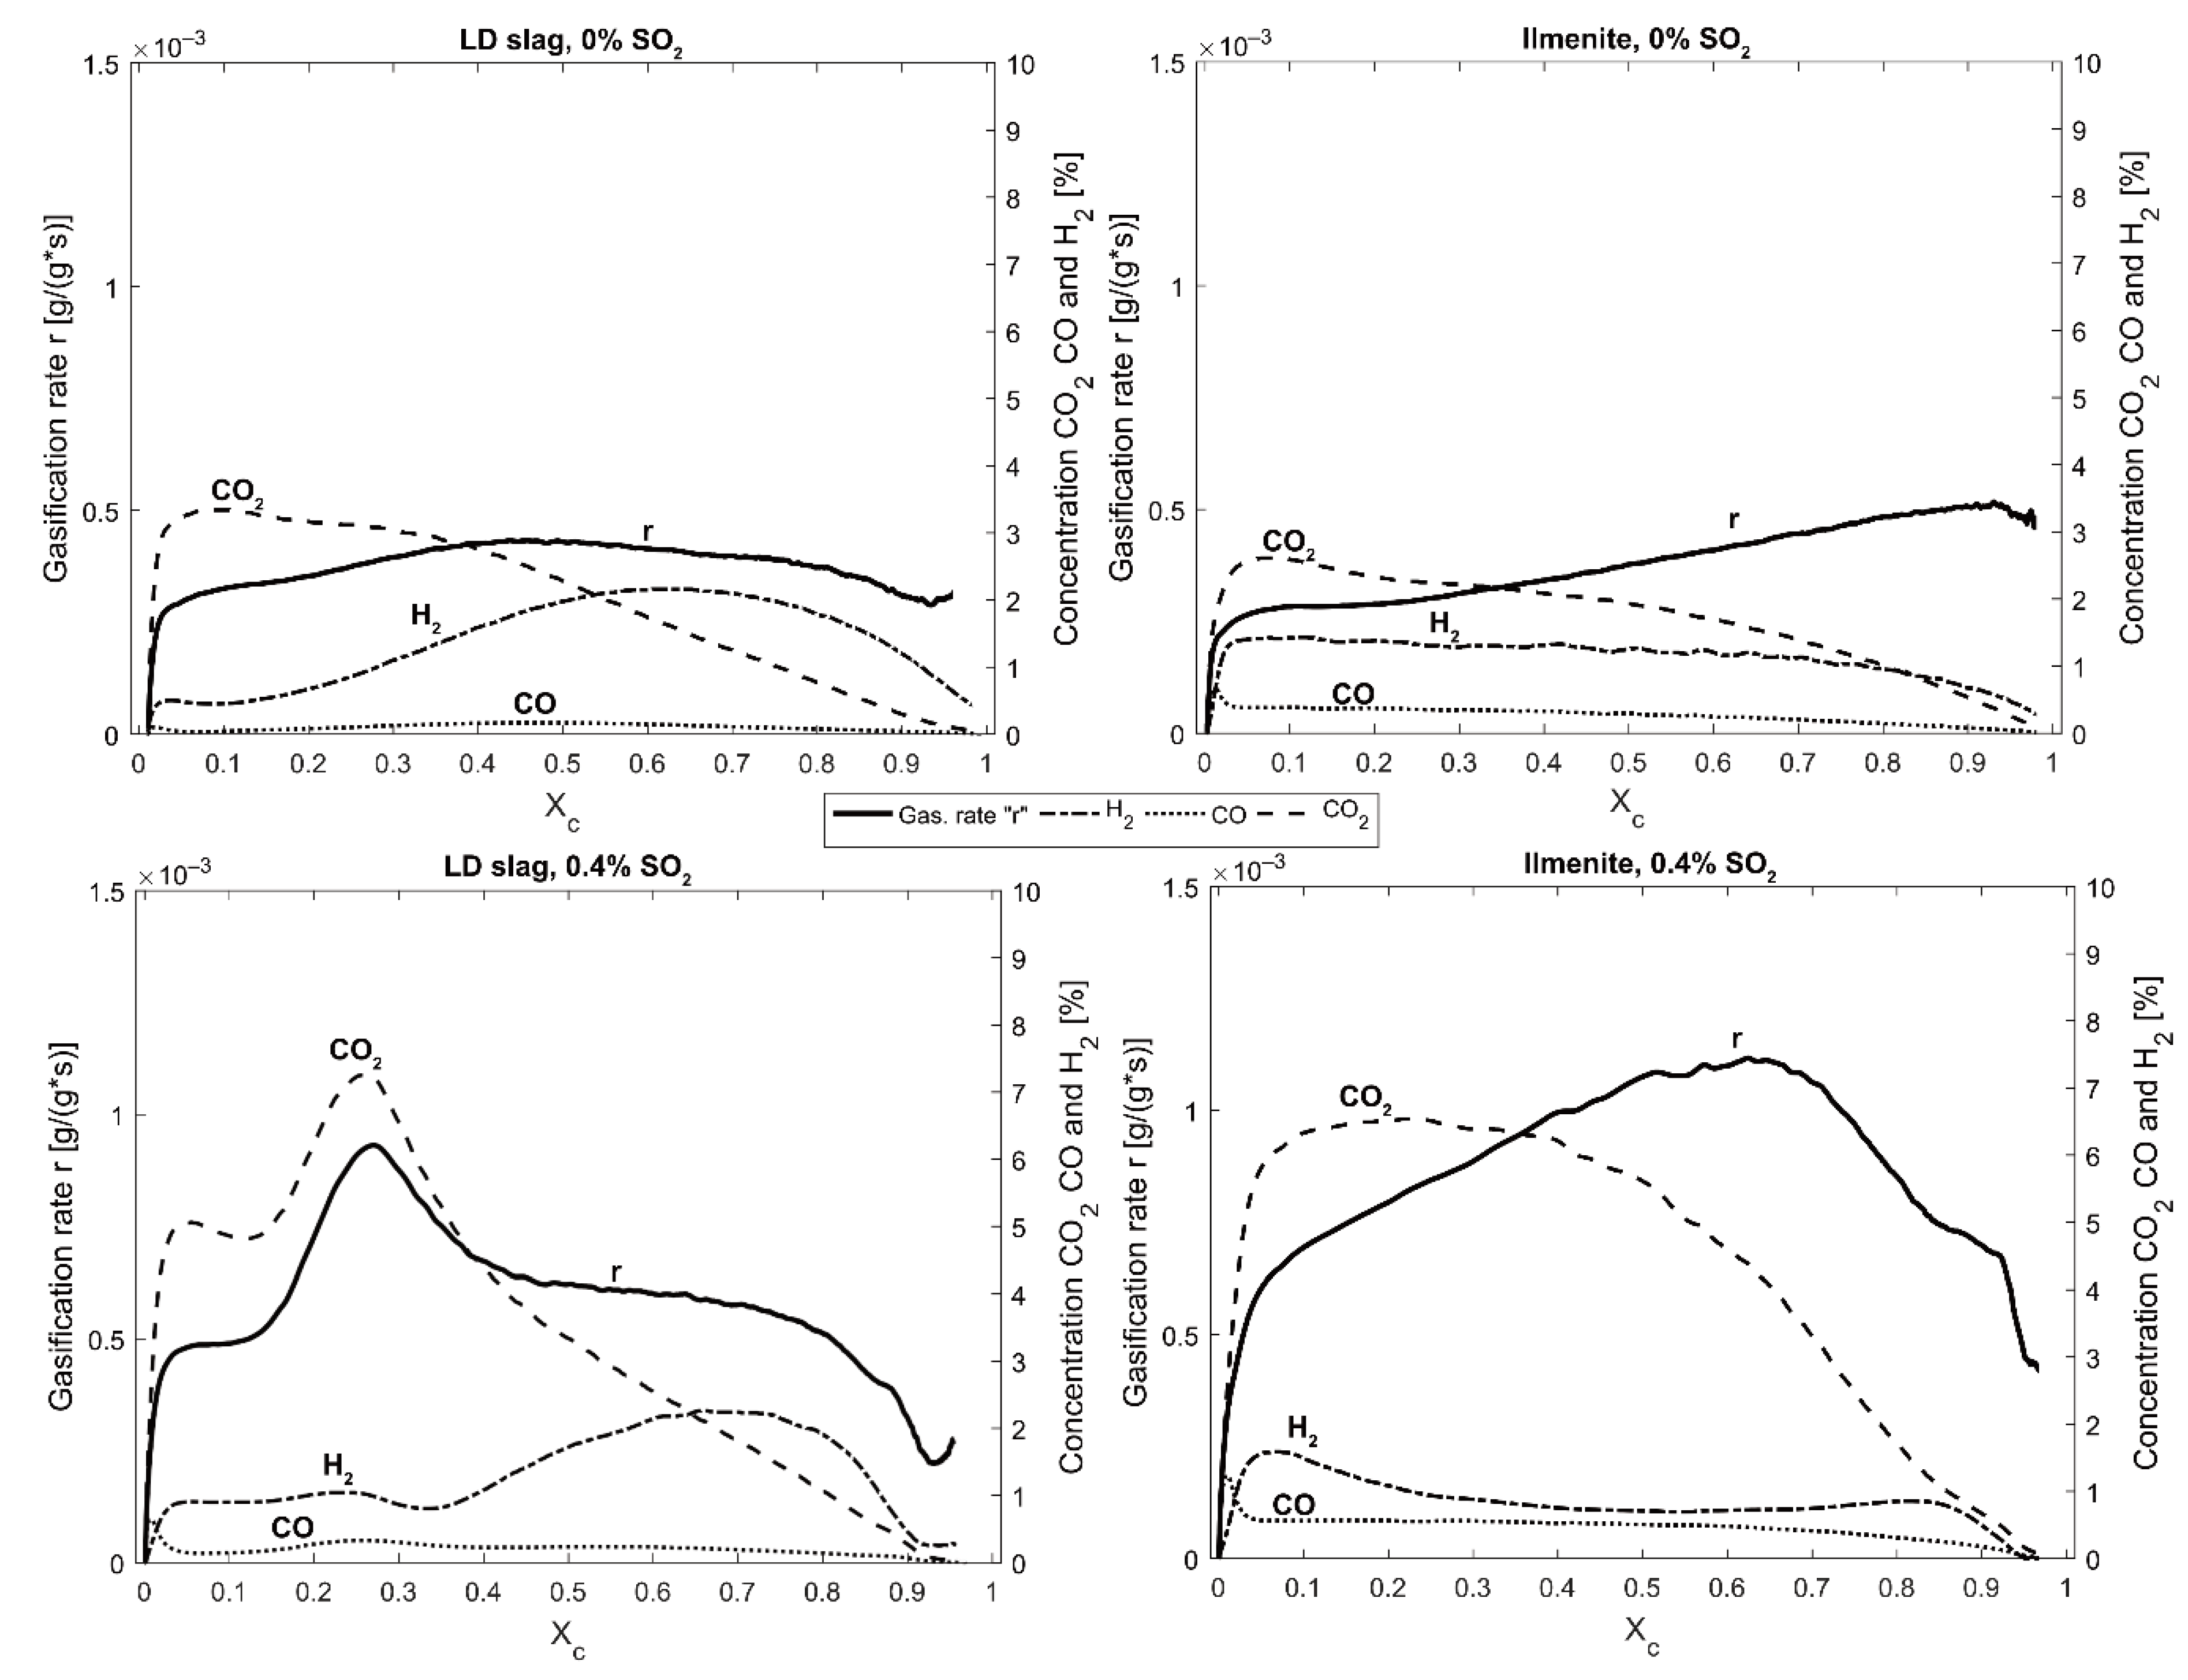
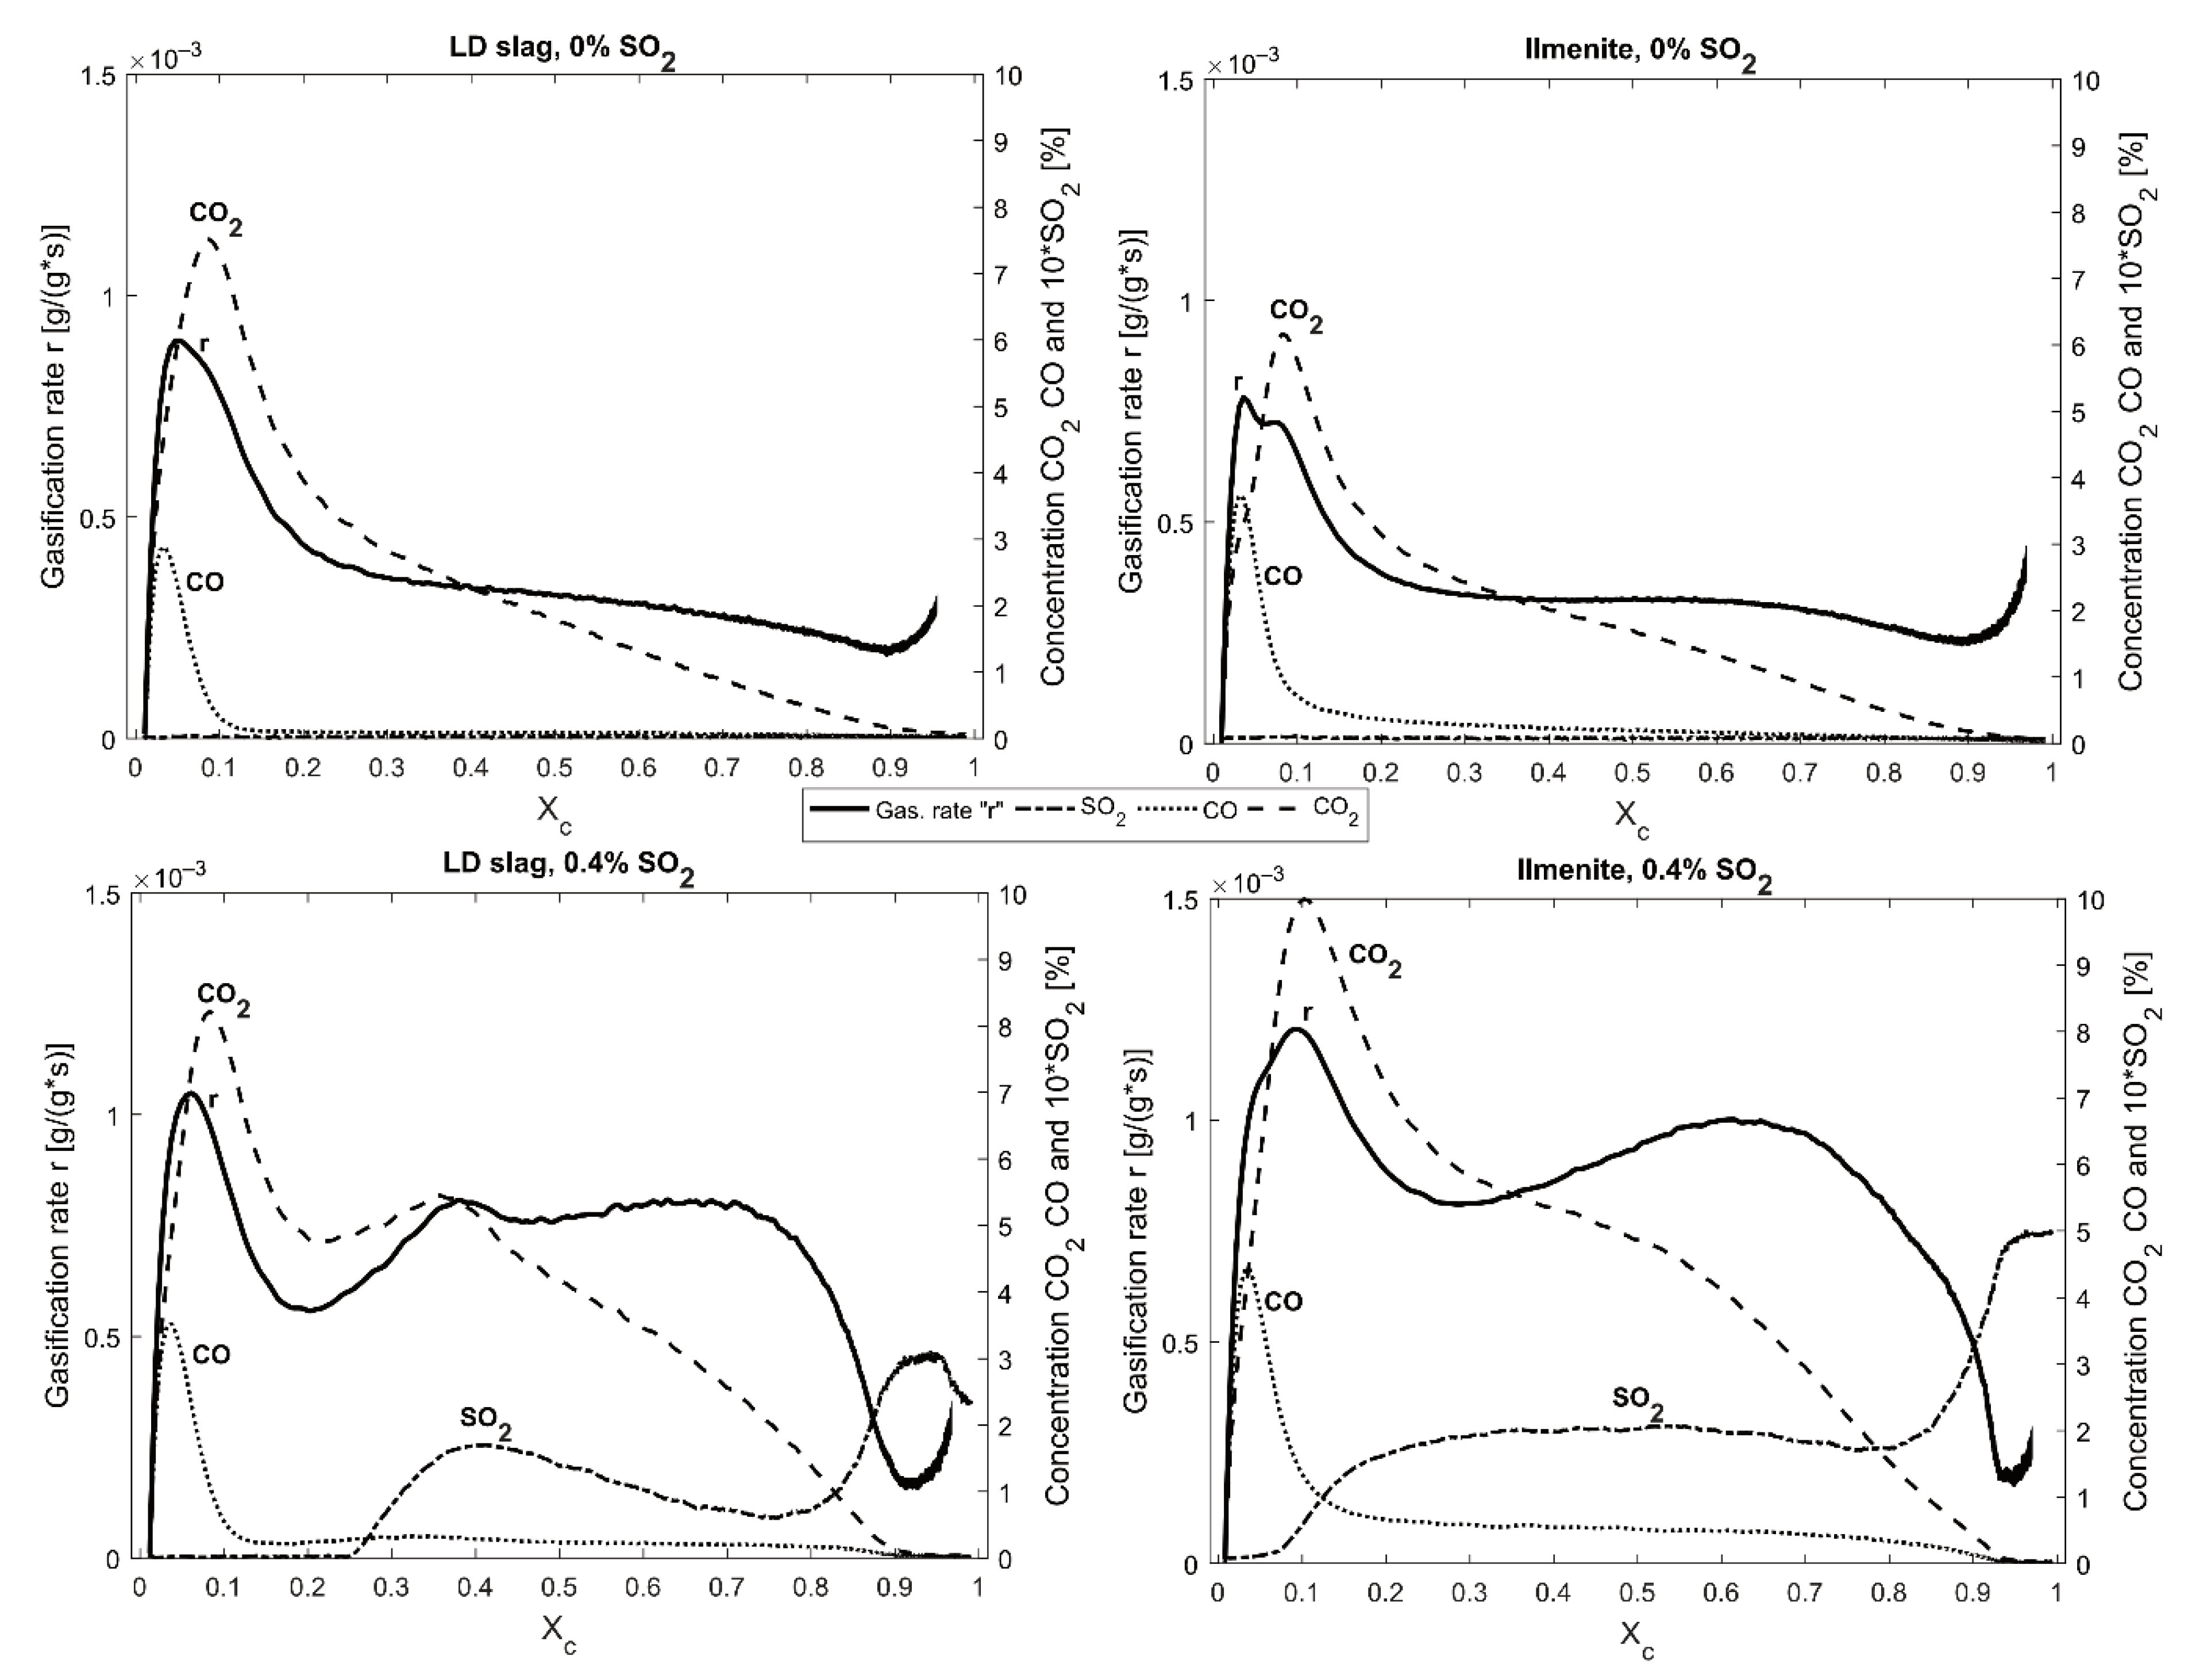
The characteristic peak at Xc ≈ 0.25 with the increased gasification rate during the solid fuel experiments with LD slag is seen in Figure 6, Figure 8 and Figure 13. This type of peak was not observed at 970 °C, suggesting that this correlated to the sulfur interaction with calcium in the LD slag. In Figure 8 and Figure 13, it can be observed that the peak is correlated to low H2 and high SO2. High SO2 could be correlated to a phase change that increases the amount of sulfur in the gas phase. Compared with the phase diagram in Figure 2, at a lower partial pressure of SO2, changing the partial pressure of H2 converts CaS to CaSO4 via the formation of CaO. Before the peak, it can be observed in Table 6 that the first bag sample for LD slag contained much less H2S + SO2 than ilmenite. This could suggest that sulfur is first absorbed into the structure, and then at one point partly released when the LD slag is reduced to a specific degree. This release causes an increased gasification rate and an observed high SO2 concentration.
Another hypothesis for the increased reaction rate towards CO and char could be that sulfur is surface-active. It is known that sulfur affects catalysts both as poison and promotors [56]. In addition, reactions including iron and iron oxide are known to be promoted by low amounts of sulfur [57,58]. Since the effect of sulfur seems to be lasting (at least for a few cycles) both for ilmenite [23] and LD slag, it could be suspected that surface reactions are promoted by low amounts of sulfur. Small amounts of sulfur have also been observed to be absorbed on the surface of iron oxygen carriers [59] and in other studies to increase reactivity towards coal pyrolysis gas [38]. This could explain the increased reactivity towards gaseous species, and also suggest that the catalytic cracking of benzene is not active with the same reaction mechanism affected by sulfur. However, the solid-solid reaction between oxygen carrier and char has been expected to be low in fluidized beds [9,60]. Nevertheless, studies of iron oxygen carriers in non-fluidized beds have indicated that the solid-solid interaction might be of significance due to the low reactivity towards reducing gasses for iron compared to, e.g., Ni [61,62,63]. Sulfur attached to the surface iron of LD slag and ilmenite might therefore increase the gasification rate of the char. This could also explain the lack of effect that sulfur has on sand, since sand cannot transport oxygen via a solid-solid reaction with the char. Moreover, since ilmenite has more iron at the surface after activation [12], more sulfur can interact with the surface iron. This could be contributing to the relatively higher gasification rate increase observed for ilmenite compared to LD slag in the presence of sulfur. In the experiments for this study, the fluidization velocity is relatively low, roughly four times the minimum fluidization velocity at 870 °C. Even so, this low fluidization velocity should make the solid-solid interactions less pronounced.

5. Conclusions

This study is based on the experiments performed in a fluidized batch reactor using LD slag and ilmenite as a bed material compared to sand. Both solid fuel experiments utilizing wood char and gaseous fuels such as CO and benzene were used. Sulfur was inserted as SO2 with concentrations up to 0.4% in the fluidization gas. It was found that even low amounts of SO2 have a significant effect on how these oxygen carriers convert solid fuels. It was concluded that:
  • SO2 is partly interacting with LD slag by reacting with the calcium phases in the particle, forming CaSO4 and most likely CaS;
  • The calcium interaction of SO2 had a negative effect on the catalytic properties of LD slag on the WGS reaction at a lower operating temperature of around 870 °C;
  • The interaction between SO2 and calcium can result in a decreased surface area on the particles. However, this is not a permanent effect. If the sulfur partial pressure is decreased, the surface area is again increased after a few reduction cycles.
  • Even small amounts of sulfur can increase the reactivity towards CO. Even if no SO2 is introduced with the fuel, sulfur that was previously bound in the LD slag results in a higher reaction rate compared to only activated bed material;
  • The formation of CaS can result in sulfur being released as SO2 in loop seals and air reactors in a CLC or CLG boiler;
  • The gasification rate of wood char increased for both LD slag and ilmenite, however less for LD slag, when adding SO2. This increased gasification rate was not related to the extra oxygen provided by the SO2;
  • SO2 could partly affect the inhibiting effects of hydrogen for the oxygen carriers;
  • Sulfur is expected to act as an intermediate transporting oxygen from the oxygen carrier to char, and then back to the oxygen carrier to be oxidized again.

Supplementary Materials

The following supporting information can be downloaded at: https://www.mdpi.com/article/10.3390/en15165922/s1, Figure S1. Gasification experiments with sand and devolatilized wood char at 870 °C. Figure S2. Gasification experiments with sand and german wood char at 870 °C. Here a significant volatiles peak can be seen comparing Figure S1 and Figure S2 besides that the reactivity of the devolatilized wood char is slightly higher. Figure S3. Gasification experiments with sand and german wood char at 870 °C using the gas analyzer measuring SO2 in the outgoing gases. Figure S4. Gasification rate ”r” and concentration of outgoing gases as a function of Xc for LD slag and Ilmenite at 970 °C. The two upper figures are without the presence of SO2 and the two lower figures are for experiments using 0.4% SO2. Curves are selected as the middle curve within the max and minimum gasification rate “r” displayed as gray areas in Figure 6. Devolatilized wood pellets were used as fuel for these experiments. Figure S5. The reaction quotient Q for LD slag, ilmenite and sand with and without the presence of SO2 in the fluidization gas plotted against the conversion of the ingoing carbon, Xc. Experiments were performed at 970 °C using 0.2 g fuel. The dotted horizontal line in the figure is the equilibrium constant Keq for the WGS reaction at 970 °C. Figure S6. Equilibrium of sulphur species as a function of ingoing amount of H2. Equilibrium is based on an 0.05 mole SO2 and 0.5 mole H2O. It is very simplified to just show the effect of H2 on the conversion of SO2 to H2S at 850 °C. If including CO and CO2 WGS will generate H2 and this will form H2S even with no ingoing H2. Figure S7. Equilibrium of 0.5 mole Ca2Fe2O5 with 0.05 mole SO2 + 0.5 mole H2O as a function of mole H2 at 850 °C. This indicates that CaSO4 and CaS can be formed to some extent from Ca2Fe2O5 in presence of sulphur. Figure S8. Equilibrium of 0.5 mole Ca2SiO4 with 0.05 mole SO2 + 0.5 mole H2O as a function of mole H2 at 850 °C. This indicates that CaSO4 and CaS can be formed to some extent from calcium silicates in presence of sulphur. Figure S9. Thermodynamic calculations regarding formation of elementary sulfur that are formed from the Claus reaction when H2S and SO2 are present in a gas. Figure S10. Thermodynamic calculations regarding reactions of SO2 and C as a function of SO2 at 850 °C. SO2 are expected to increase the conversion of carbon to both CO and sulfur containing carbon species like CS2 and COS. Figure S11. Thermodynamic calculations regarding reactions of H2S and C as a function of H2S at 850 °C. No conversion of the carbon is expected to occur.

Author Contributions

Conceptualization, All authors.; methodology, F.H. and H.L.; software, F.H.; validation, All authors.; formal analysis, F.H.; investigation, F.H.; resources, H.L.; data curation, F.H.; writing—original draft preparation, F.H.; writing—review and editing, All authors; visualization, F.H.; supervision, T.M. and H.L.; project administration, H.L.; funding acquisition, H.L. All authors have read and agreed to the published version of the manuscript.

Funding

This research is funded by ÅForsk (20-269).

Institutional Review Board Statement

Not applicable.

Informed Consent Statement

Not applicable.

Acknowledgments

This work was financed by ÅForsk (20-269). The LD slag bed material was provided by SSAB.

Conflicts of Interest

The authors declare no conflict of interest.

References

  1. Adanez, J.; Abad, A.; Garcia-Labiano, F.; Gayan, P.; De Diego, L.F. Progress in Chemical-Looping Combustion and Reforming Technologies. Prog. Energy Combust. Sci. 2012, 38, 215–282. [Google Scholar] [CrossRef]
  2. Thunman, H.; Lind, F.; Breitholtz, C.; Berguerand, N.; Seemann, M. Using an Oxygen-Carrier as Bed Material for Combustion of Biomass in a 12-MWth Circulating Fluidized-Bed Boiler. Fuel 2013, 113, 300–309. [Google Scholar] [CrossRef]
  3. Matzen, M.; Pinkerton, J.; Wang, X.; Demirel, Y. Use of Natural Ores as Oxygen Carriers in Chemical Looping Combustion: A Review. Int. J. Greenh. Gas Control 2017, 65, 1–14. [Google Scholar] [CrossRef]
  4. Mendiara, T.; Gayán, P.; García-Labiano, F.; De Diego, L.F.; Pérez-Astray, A.; Izquierdo, M.T.; Abad, A.; Adánez, J. Chemical Looping Combustion of Biomass: An Approach to BECCS. Energy Procedia 2017, 114, 6021–6029. [Google Scholar] [CrossRef]
  5. Rydén, M.; Lyngfelt, A.; Langørgen, O.; Larring, Y.; Brink, A.; Teir, S.; Havåg, H.; Karmhagen, P. Negative CO2 Emissions with Chemical-Looping Combustion of Biomass—A Nordic Energy Research Flagship Project. Energy Procedia 2017, 114, 6074–6082. [Google Scholar] [CrossRef]
  6. Adánez, J.; De Diego, L.F.; García-Labiano, F.; Gayán, P.; Abad, A.; Palacios, J.M. Selection of Oxygen Carriers for Chemical-Looping Combustion. Energy Fuels 2004, 18, 371–377. [Google Scholar] [CrossRef]
  7. Hossain, M.M.; de Lasa, H.I. Chemical-Looping Combustion (CLC) for Inherent CO2 Separations—A Review. Chem. Eng. Sci. 2008, 63, 4433–4451. [Google Scholar] [CrossRef]
  8. Idziak, K.; Czakiert, T.; Krzywanski, J.; Zylka, A.; Kozlowska, M.; Nowak, W. Safety and Environmental Reasons for the Use of Ni-, Co-, Cu-, Mn- and Fe-Based Oxygen Carriers in CLC/CLOU Applications: An Overview. Fuel 2020, 268, 117245. [Google Scholar] [CrossRef]
  9. Leion, H.; Mattisson, T.; Lyngfelt, A. Solid Fuels in Chemical-Looping Combustion. Int. J. Greenh. Gas Control 2008, 2, 180–193. [Google Scholar] [CrossRef]
  10. Pröll, T.; Mayer, K.; Bolhàr-Nordenkampf, J.; Kolbitsch, P.; Mattisson, T.; Lyngfelt, A.; Hofbauer, H. Natural Minerals as Oxygen Carriers for Chemical Looping Combustion in a Dual Circulating Fluidized Bed System. Energy Procedia 2009, 1, 27–34. [Google Scholar] [CrossRef]
  11. Corcoran, A.; Marinkovic, J.; Lind, F.; Thunman, H.; Knutsson, P.; Seemann, M. Ash Properties of Ilmenite Used as Bed Material for Combustion of Biomass in a Circulating Fluidized Bed Boiler. Energy Fuels 2014, 28, 7672–7679. [Google Scholar] [CrossRef]
  12. Adánez, J.; Cuadrat, A.; Abad, A.; Gayán, P.; Diego, L.F.D.; García-Labiano, F. Ilmenite Activation during Consecutive Redox Cycles in Chemical-Looping Combustion. Energy Fuels 2010, 24, 1402–1413. [Google Scholar] [CrossRef]
  13. Jerndal, E.; Leion, H.; Axelsson, L.; Ekvall, T.; Hedberg, M.; Johansson, K.; Källén, M.; Svensson, R.; Mattisson, T.; Lyngfelt, A. Using Low-Cost Iron-Based Materials as Oxygen Carriers for Chemical Looping Combustion Chemical Looping—An Alternative Concept for Efficient and Clean Use of Fossil Resources La Boucle Chimique-Un Concept Alternatif Pour Un Usage Propre et Efficace Des. Oil Gas Sci. Technol. Rev. IFP Energ. Nouv. 2011, 66, 235–248. [Google Scholar] [CrossRef]
  14. Rydén, M.; Hanning, M.; Lind, F. Oxygen Carrier Aided Combustion (OCAC) of Wood Chips in a 12 MWth Circulating Fluidized Bed Boiler Using Steel Converter Slag as Bed Material. Appl. Sci. 2018, 8, 2657. [Google Scholar] [CrossRef]
  15. Hildor, F.; Mattisson, T.; Leion, H.; Linderholm, C.; Rydén, M. Steel Converter Slag as an Oxygen Carrier in a 12 MWth CFB Boiler—Ash Interaction and Material Evolution. Int. J. Greenh. Gas Control 2019, 88, 321–331. [Google Scholar] [CrossRef]
  16. Mattison, T.; Hildor, F.; Li, Y.; Linderholm, C. Negative Emissions of Carbon Dioxide through Chemical-Looping Combustion (CLC) and Gasification (CLG) Using Oxygen Carriers Based on Manganese and Iron. Mitig. Adapt. Strateg. Glob. Chang. 2019, 25, 497–517. [Google Scholar] [CrossRef]
  17. Moldenhauer, P.; Linderholm, C.; Rydén, M.; Lyngfelt, A. Avoiding CO2 Capture Effort and Cost for Negative CO2 Emissions Using Industrial Waste in Chemical-Looping Combustion/Gasification of Biomass. Mitig. Adapt. Strateg. Glob. Chang. 2019, 25, 1–24. [Google Scholar] [CrossRef]
  18. Zevenhoven, M.; Yrjas, P.; Hupa, M. 14 Ash-forming matter and ash-related problems. In Handbook of Combustion Volume 4: Solid Fuels; Lackner, M., Winter, F., Agarwal, A.K., Eds.; WILEY-VCH Verlag GmbH & Co. KgaA: Weinheim, Germany, 2010; pp. 493–531. ISBN 978-3-527-32449-1. [Google Scholar]
  19. Kassman, H.; Bäfver, L.; Åmand, L.E. The Importance of SO2 and SO3 for Sulphation of Gaseous KCl—An Experimental Investigation in a Biomass Fired CFB Boiler. Combust. Flame 2010, 157, 1649–1657. [Google Scholar] [CrossRef]
  20. Kassman, H.; Normann, F.; Åmand, L.-E. The Effect of Oxygen and Volatile Combustibles on the Sulphation of Gaseous KCl. Combust. Flame 2013, 160, 2231–2241. [Google Scholar] [CrossRef]
  21. Mattisson, T.; Lyngfelt, A. Reaction between Sulfur Dioxide and Limestone under Periodically Changing Oxidizing and Reducing Conditions—Effect of Cycle Time. Energy Fuels 1998, 12, 905–912. [Google Scholar] [CrossRef]
  22. Wang, B.; Yan, R.; Lee, D.H.; Liang, D.T.; Zheng, Y.; Zhao, H.; Zheng, C. Thermodynamic Investigation of Carbon Deposition and Sulfur Evolution in Chemical Looping Combustion with Syngas. Energy Fuels 2008, 22, 1012–1020. [Google Scholar] [CrossRef]
  23. Moldenhauer, P.; Rydén, M.; Mattisson, T.; Younes, M.; Lyngfelt, A. The Use of Ilmenite as Oxygen Carrier with Kerosene in a 300W CLC Laboratory Reactor with Continuous Circulation. Appl. Energy 2013, 113, 1846–1854. [Google Scholar] [CrossRef]
  24. Forero, C.R.; Gayán, P.; García-Labiano, F.; de Diego, L.F.; Abad, A.; Adánez, J. Effect of Gas Composition in Chemical-Looping Combustion with Copper-Based Oxygen Carriers: Fate of Sulphur. Int. J. Greenh. Gas Control 2010, 4, 762–770. [Google Scholar] [CrossRef]
  25. Adánez-Rubio, I.; Abad, A.; Gayán, P.; García-Labiano, F.; De Diego, L.F.; Adánez, J. The Fate of Sulphur in the Cu-Based Chemical Looping with Oxygen Uncoupling (CLOU) Process. Appl. Energy 2013, 113, 1855–1862. [Google Scholar] [CrossRef]
  26. Ma, J.; Mei, D.; Wang, C.; Tian, X.; Liu, Z.; Zhao, H. Sulfur Fate during In-Situ Gasification Chemical Looping Combustion (IG-CLC) of Coal. Chem. Eng. J. 2021, 406, 126773. [Google Scholar] [CrossRef]
  27. Arjmand, M.; Kooiman, R.F.; Rydén, M.; Leion, H.; Mattisson, T.; Lyngfelt, A. Sulfur Tolerance of CaxMn1-YMyO 3-δ (M = Mg, Ti) Perovskite-Type Oxygen Carriers in Chemical-Looping with Oxygen Uncoupling (CLOU). Energy Fuels 2014, 28, 1312–1324. [Google Scholar] [CrossRef]
  28. Vigoureux, M.; Leffler, T.; Knutsson, P.; Lind, F. Sulfur Capture and Release by Ilmenite Used as Oxygen Carrier in Biomass Combustor. Fuel 2022, 309, 121978. [Google Scholar] [CrossRef]
  29. Montagna, J.C.; Lenc, J.F.; Vogel, G.J.; Jonke, A.A. Regeneration of Sulfated Dolomite from a Coal-Fired FBC Process by Reductive Decomposition of Calcium Sulfate in a Fluidized Bed. Ind. Eng. Chem. Process Des. Dev. 1977, 16, 230–236. [Google Scholar] [CrossRef]
  30. Jamil, R.; Ming, L.; Jamil, I.; Rizwan, J. Application and Development Trend of Flue Gas Desulfurization (FGD) Process: A Review. Int. J. Innov. Appl. Stud. 2013, 4, 286–297. [Google Scholar]
  31. Luo, M.; Zhou, L.; Wang, C.; Kuang, C. The evolution and desulfurization of sulfur in chemical looping combustion of coal. In Energy Sources, Part A: Recovery, Utilization, and Environmental Effects; Taylor & Francis: Abingdon, UK, 2021; pp. 1–12. [Google Scholar] [CrossRef]
  32. Westmoreland, P.R.; Harrison, D.P. Evaluation of Candidate Solids for High-Temperature Desulfurization of Low-Btu Gases. Environ. Sci. Technol. 1976, 10, 659–661. [Google Scholar] [CrossRef]
  33. Lyngfelt, A.; Leckner, B. SO2 Capture Fluidised-Bed Boilers: Re-Emission of SO2 Due to Reduction of CaSO4. Chem. Eng. Sci. 1988, 44, 207–213. [Google Scholar] [CrossRef]
  34. Wang, P.; Means, N.; Shekhawat, D.; Berry, D.; Massoudi, M. Chemical-Looping Combustion and Gasification of Coals and Oxygen Carrier Development: A Brief Review. Energies 2015, 8, 10605–10635. [Google Scholar] [CrossRef]
  35. Teyssié, G.; Leion, H.; Schwebel, G.L.; Lyngfelt, A.; Mattisson, T. Influence of Lime Addition to Ilmenite in Chemical-Looping Combustion (CLC) with Solid Fuels. Energy Fuels 2011, 25, 3843–3853. [Google Scholar] [CrossRef]
  36. Hildor, F.; Leion, H.; Linderholm, C.J.; Mattisson, T. Steel Converter Slag as an Oxygen Carrier for Chemical-Looping Gasification. Fuel Process. Technol. 2020, 210, 106576. [Google Scholar] [CrossRef]
  37. Fernández, M.J.; Lyngfelt, A.; Steenari, B.M. Reaction between Limestone and SO2 under Conditions Alternating between Oxidizing and Reducing. The Effect of Short Cycle Times. Energy Fuels 2000, 14, 654–662. [Google Scholar] [CrossRef]
  38. Tsedenbal, B.; Kannari, N.; Sato, K.; Shirai, H.; Takarada, T. Effect of Hydrogen Sulfide on the Combustion Reactivity of Ilmenite Ores with Coal Volatiles under Steam Reforming. Energy Fuels 2020, 34, 9862–9871. [Google Scholar] [CrossRef]
  39. Leion, H.; Frick, V.; Hildor, F. Experimental Method and Setup for Laboratory Fluidized Bed Reactor Testing. Energies 2018, 11, 2505. [Google Scholar] [CrossRef]
  40. Störner, F.; Hildor, F.; Leion, H.; Zevenhoven, M.; Hupa, L.; Rydén, M.; Eliasson Störner, F.; Hildor, F.; Leion, H.; Zevenhoven, M.; et al. Potassium Ash Interactions with Oxygen Carriers Steel Converter Slag and Iron Mill Scale in Chemical-Looping Combustion of Biomass—Experimental Evaluation Using Model Compounds. Energy Fuels 2020, 34, 2304–2314. [Google Scholar] [CrossRef]
  41. Monshi, A.; Asgarani, M.K. Producing Portland Cement from Iron and Steel Slags and Limestone. Cem. Concr. Res. 1999, 29, 1373–1377. [Google Scholar] [CrossRef]
  42. Corcoran, A.; Knutsson, P.; Lind, F.; Thunman, H. Comparing the Structural Development of Sand and Rock Ilmenite during Long-Term Exposure in a Biomass Fired 12 MWth CFB-Boiler. Fuel Process. Technol. 2018, 171, 39–44. [Google Scholar] [CrossRef]
  43. Leion, H.; Mattisson, T.; Lyngfelt, A. The Use of Petroleum Coke as Fuel in Chemical-Looping Combustion. Fuel 2007, 86, 1947–1958. [Google Scholar] [CrossRef]
  44. Azimi, G.; Keller, M.; Mehdipoor, A.; Leion, H. Experimental Evaluation and Modeling of Steam Gasification and Hydrogen Inhibition in Chemical-Looping Combustion with Solid Fuel. Int. J. Greenh. Gas Control 2012, 11, 1–10. [Google Scholar] [CrossRef]
  45. Moe, J.M. Design of Water-Gas Shift Reactors. Chem. Eng. Prog. 1962, 58, 33–36. [Google Scholar]
  46. Bustamante, F.; Enick, R.M.; Cugini, A.V.; Killmeyer, R.P.; Howard, B.H.; Rothenberger, K.S.; Ciocco, M.V.; Morreale, B.D.; Chattopadhyay, S.; Shi, S. High-Temperature Kinetics of the Homogeneous Reverse Water-Gas Shift Reaction. AIChE J. 2004, 50, 1028–1041. [Google Scholar] [CrossRef]
  47. Keller, M.; Leion, H.; Mattisson, T.; Thunman, H. Investigation of Natural and Synthetic Bed Materials for Their Utilization in Chemical Looping Reforming for Tar Elimination in Biomass-Derived Gasification Gas. Energy Fuels 2014, 28, 3833–3840. [Google Scholar] [CrossRef]
  48. Larsson, A.; Gunnarsson, I.; Tengberg, F. The GoBiGas Project—Demonstration of the Production of Biomethane from Biomass via Gasification; Göteborg Energi AB Project Report; Göteborg Energi AB: Gothenburg, Sweden, 2018. [Google Scholar] [CrossRef]
  49. Schwebel, G.L.; Leion, H.; Krumm, W. Comparison of Natural Ilmenites as Oxygen Carriers in Chemical-Looping Combustion and Influence of Water Gas Shift Reaction on Gas Composition. Chem. Eng. Res. Des. 2012, 90, 1351–1360. [Google Scholar] [CrossRef]
  50. Vigoureux, M.; Knutsson, P.; Lind, F. Sulfur Uptake during Oxygen-Carrier-Aided Combustion with Ilmenite. Energy Fuels 2020, 34, 7735–7742. [Google Scholar] [CrossRef]
  51. Tamhankar, S.S.; Tsuchiya, K.; Riggs, J.B. Catalytic Cracking of Benzene on Iron Oxide-Silica: Catalyst Activity and Reaction Mechanism. Appl. Catal. 1985, 16, 103–121. [Google Scholar] [CrossRef]
  52. Shen, L.; Zheng, M.; Xiao, J.; Xiao, R. A Mechanistic Investigation of a Calcium-Based Oxygen Carrier for Chemical Looping Combustion. Combust. Flame 2008, 154, 489–506. [Google Scholar] [CrossRef]
  53. Hüttinger, K.J.; Merdes, W.F. The Carbon-Steam Reaction at Elevated Pressure: Formations of Product Gases and Hydrogen Inhibitions. Carbon 1992, 30, 883–894. [Google Scholar] [CrossRef]
  54. Keller, M.; Leion, H.; Mattisson, T.; Lyngfelt, A. Gasification Inhibition in Chemical-Looping Combustion with Solid Fuels. Combust. Flame 2011, 158, 393–400. [Google Scholar] [CrossRef]
  55. Lussier, M.G.; Zhang, Z.; Miller, D.J. Characterizing Rate Inhibition in H2O/H2 Gasification via Measurement of Adsorbed Hydrogen Concentration. ACS Div. Fuel Chem. Prepr. 1996, 41, 206–208. [Google Scholar] [CrossRef]
  56. Kiskinova, M.P. Poisoning and Promotion in Catalysis Based on Surface Science Concepts and Experiments; Elsevier: Amsterdam, The Netherlands, 1991; ISBN 0080887406. [Google Scholar]
  57. Torres Galvis, H.M.; Koeken, A.C.J.; Bitter, J.H.; Davidian, T.; Ruitenbeek, M.; Dugulan, A.I.; De Jong, K.P. Effects of Sodium and Sulfur on Catalytic Performance of Supported Iron Catalysts for the Fischer-Tropsch Synthesis of Lower Olefins. J. Catal. 2013, 303, 22–30. [Google Scholar] [CrossRef]
  58. Yamaguchi, T.; Jin, T.; Tanabe, K. Structure of Acid Sites on Sulfur-Promoted Iron Oxide. J. Phys. Chem. 1986, 90, 3148–3152. [Google Scholar] [CrossRef]
  59. Luo, M.; Zhou, L.; Kuang, C.; Wang, C.; Zhang, H. Release and Fate of Pyritic Sulfur in Chemical Looping Combustion. Fuel 2021, 285, 119213. [Google Scholar] [CrossRef]
  60. Berguerand, N.; Lyngfelt, A. The Use of Petroleum Coke as Fuel in a 10 KWth Chemical-Looping Combustor. Int. J. Greenh. Gas Control 2008, 2, 169–179. [Google Scholar] [CrossRef]
  61. Siriwardane, R.V.; Ksepko, E.; Tian, H.; Poston, J.; Simonyi, T.; Sciazko, M. Interaction of Iron-Copper Mixed Metal Oxide Oxygen Carriers with Simulated Synthesis Gas Derived from Steam Gasification of Coal. Appl. Energy 2013, 107, 111–123. [Google Scholar] [CrossRef]
  62. Riley, J.; Siriwardane, R.; Tian, H.; Benincosa, W.; Poston, J. Kinetic Analysis of the Interactions between Calcium Ferrite and Coal Char for Chemical Looping Gasification Applications: Identifying Reduction Routes and Modes of Oxygen Transfer. Appl. Energy 2017, 201, 94–110. [Google Scholar] [CrossRef]
  63. Kun, Z.; He, D.; Guan, J.; Wang, Q.; Li, X.; Shang, J.; Zhang, Q. Interaction between Bimetallic Composite Oxygen Carriers and Coal and Its Contribution to Coal Direct Chemical Looping Gasification. Int. J. Hydrogen Energy 2020, 45, 19052–19066. [Google Scholar] [CrossRef]
Figure 1. Simplified sketches of three different technologies utilizing metal oxide oxygen carriers (MO in the figure) to produce either separated CO2 simultaneous with power generation (CLC), raw gasification gas with CO2 separated into the raw gas (CLG), or oxygen carriers in a conventional boiler for oxygen buffering (OCAC).
Energies 15 05922 g001
Figure 2. Ca-S-O-H diagram of stable solid phases at different H2 and SO2 partial pressure at different temperatures with a constant partial pressure of steam of 50%.
Energies 15 05922 g002
Figure 3. Ca-S-O-H diagram of stable solid phases at different H2 and SO2 partial pressure at 850 °C with three different partial pressures of steam.
Energies 15 05922 g003
Figure 4. Schematic overview of the batch fluidized bed reactor system.
Energies 15 05922 g004
Figure 5. One cycle at 870 °C of char gasification using LD slag as bed material in the laboratory scale fluidized bed with 0.4% SO2 present in the fluidization gas.
Energies 15 05922 g005
Figure 6. Gasification rate “r” as a function of the char conversion Xc for LD slag and ilmenite with SO2 and without SO2 in the ingoing gas at 870 °C using devolatilized wood pellets. The gray area indicates the reproducibility and is bordered by the highest and lowest gasification rate for the repeated experiments.
Energies 15 05922 g006
Figure 7. Mean gasification rate “r” between 0.3 < Xc < 0.7 for LD slag, ilmenite, and sand at different temperatures and concentrations of SO2.
Energies 15 05922 g007
Figure 8. Gasification rate ”r” and concentration of outgoing gases as a function of Xc for LD slag and ilmenite at 870 °C. The two upper figures are without the presence of SO2, and the two lower figures are for experiments using 0.4% SO2. Curves are selected as the middle curve within the max and minimum gasification rate “r” displayed as gray areas in Figure 6. Devolatilized wood pellets were used as fuel for these experiments.
Energies 15 05922 g008
Figure 9. Molar CO ratio over total outgoing carbon for the gasification experiments, taken between 0.3 < Xc < 0.7 for LD slag, ilmenite, and sand at 870 °C and 970 °C using devolatilized wood pellets as fuel.
Energies 15 05922 g009
Figure 10. Molar H2/CO ratio for the gasification experiments was evaluated between 0.3 < Xc < 0.7 for LD slag, ilmenite, and sand at 870 °C and 970 °C using devolatilized wood pellets as fuel.
Energies 15 05922 g010
Figure 11. The reaction quotient Q for LD slag, ilmenite, and sand with and without the presence of SO2 in the fluidization gas plotted against the conversion of the ingoing carbon, Xc. Experiments were performed at 870 °C using 0.2 g fuel. The dotted horizontal line in the figure is the equilibrium constant Keq for the WGS reaction at 870 °C.
Energies 15 05922 g011
Figure 12. Benzene conversion at 850 °C using LD slag and ilmenite in the presence of SO2. Note that the scale of conversion is only between 40% and 60%. See Table 4 for experimental conditions during the reducing phase.
Energies 15 05922 g012
Figure 13. Gasification rate ”r” and concentration of outgoing gases and SO2 in relation to char conversion Xc for LD slag and ilmenite. The two upper figures are without the presence of SO2, and the two lower figures are in the presence of 0.4% SO2. Note that these experiments are performed with another wood char, German wood char, instead of devolatilized wood pellets, with more volatiles compared to the experiments evaluated in Section 3.1.
Energies 15 05922 g013
Figure 14. CO conversion for cycles using LD slag as bed material at 870 °C. The horizontal dotted line is the reference with the mean and variance of cycles reduced with 50% syngas (50% CO in H2) diluted with N2. Firstly, -○- shows the CO conversion for six cycles reduced with1% SO2 and 50% syngas with N2 as a balance. Here, a slight increase in CO conversion can be observed for every cycle. The sample was then loaded with a high amount of sulfur using 1.5% SO2 during the oxidation for 90 min. Thereafter, -■- shows the CO conversion rate for the sample reduced using 50% syngas diluted with N2 for six cycles, the same as the reference experiments. Here, it was observed that the conversion of the first reduction was much lower than in the following cycles where the conversion was similar to the reference or slightly higher.
Energies 15 05922 g014
Figure 15. The concentration of outgoing gases for reduction cycles after LD slag has been loaded with SO2 during oxidation. Arrows show development after every cycle; decreased SO2 out from every cycle and increased time for oxygen breakthrough. Dotted vertical lines indicate the atmospheric conditions in every cycle; “R” is reduction using syngas.
Energies 15 05922 g015
Figure 16. SEM-EDX image of LD slag that has been loaded with SO2 and reduced once at 870 °C.
Energies 15 05922 g016
Figure 17. A graphical summary of reaction paths involving sulfur suggested in the discussion section.
Energies 15 05922 g017
Table 1. Elemental composition is given in wt.% of the studied bed materials excluding oxygen.
ElementFeTiCaSiMgMnVAlCrNi
LD slag170.78325.65.92.61.50.760.330.002
Ilmenite36280.220.6720.210.120.170.060.03
Sand0.360.040.05450.240.0100.2200
Table 2. Fuel analysis of the pellets and devolatilized pellets used in the experiments. Samples were converted into ash at 550 °C according to SS-EN-ISO 18122. Values are given in wt.%.
Dry Basison Ash Samples
AshSCHOFeCaMgMnAlKPSi
Wood Pellets
Sample
0.4< 0.0250.36.2430.89223.62.71.19.61.44.0
Devolatilized
Wood Pellets
Sample
3.50.0293.5< 0.533.9214.82.91.55.81.36.6
German woodchar7.20.0285.32.64.41120.970.3714.40.3512
Table 3. Summary of experiments with solid fuel.
Gas Composition during
Reduction
Reduction Length [s]Temp [°C]Number of CyclesMeasurements
Activation cycles900 mL/min
50% CO
50% H2
208503–15CO, CO2, CH4, O2, and H2
Reference experiment1000 mL/min
50% H2O
N2 Balance
0.2 g Fuel
900–3000870, 920, and 9703CO, CO2, CH4, O2, and H2/SO2
+ Dräger tubes SO2, H2S for German wood char final
0.2% SO21000 mL/min
50% H2O
0.2% SO2
N2 Balance
0.2 g Fuel
900–3000870, 920, and 9703CO, CO2, CH4, O2, and H2/SO2
0.4% SO21000 mL/min
50% H2O
0.4% SO2
N2 Balance
0.2 g Fuel
900–3000870, 920, and 9703CO, CO2, CH4, O2, and H2/SO2
+ Dräger tubes SO2, H2S for German wood char
Table 4. Summary of gaseous fuel experiments containing benzene.
Gas Composition during ReductionReduction Length [s]
0% SO21000 mL/min
50% Steam
1.46% Benzene
N2 Balance
60
0.2% SO21000 mL/min
50% Steam
1.46% Benzene
0.2% SO2
N2 Balance
0.4% SO21000 mL/min
50% Steam
1.46% Benzene
0.4% SO2
N2 Balance
Table 5. Summary of gaseous fuel experiments with syngas for CO conversion evaluation in the same order as execution.
Gas Composition during the ExperimentReduction Length [s]Number of Cycles
Reference experiment900 mL/min
25% CO
25% H2
N2 Balance
403
SO2 Reduction900 mL/min
25% CO
25% H2
1% SO2
N2 Balance
406
SO2 Load (OX)1000 mL/min
5% O2
1.5% SO2
N2 Balance
90 min1
CO Reduction900 mL/min
25% CO
25% H2
N2 Balance
406
Table 6. Result of H2S and SO2 concentrations from bag samples extracted during one cycle of gasification of German wood char in the presence of 0.4% SO2 at 870 °C. Roughly one liter of gas was extracted over 50–60 s, and the average Xc was taken as the mean of the calculated Xc for every bag sample during the extraction period.
LD Slag, 0.4% SO2Ilmenite, 0.4% SO2
Avg. XcH2S [ppm]SO2 [ppm]Avg. XcH2S [ppm]SO2 [ppm]
0.1535000.20750500
0.4720004000.502100400
0.89180012000.8617001200
0.92100022000.917502800
Table 7. BET surface area of LD slag particles before and after sulfur loading. It is clear that there is a drop in surface area after SO2 loading and that the surface area is increased again after reduction cycles.
SampleBET Surface Area [m2/g]
LD slag heat treated1.00 ± 0.004
LD slag after activation0.83 ± 0.007
LD slag after SO2 loading0.41 ± 0.005
LD slag after SO2 loading and reduced once0.70 ± 0.002
LD slag after SO2 loading and 7 reduction cycles0.72 ± 0.007
Publisher’s Note: MDPI stays neutral with regard to jurisdictional claims in published maps and institutional affiliations.

