Article

An Improved Technique of Hybridization of PSO for the Optimal Coordination of Directional Overcurrent Protection Relays of IEEE Bus System

1
Department of Electronic Computer-Aided Design, Xidian University, Xi’an 710071, China
2
Department of Electrical Engineering, Air University Islamabad, Aerospace and Aviation Campus, Kamra 43570, Pakistan
*
Authors to whom correspondence should be addressed.
Energies 2022, 15(9), 3076; https://doi.org/10.3390/en15093076
Submission received: 7 March 2022 / Revised: 16 April 2022 / Accepted: 21 April 2022 / Published: 22 April 2022
(This article belongs to the Special Issue Power System Simulation and Modeling)

Abstract

:
The use of a directional overcurrent protection relay (DOPR) to protect an electrical power system is a crucial instrument for keeping the system dynamic and avoiding undue interruption. The coordination of a DOPR’s primary and backup relays is modelled as a highly constrained optimization problem. The goal is to determine an ideal value that will reduce the overall working time of all primary relays. The coordination is accomplished by the use of particle swarm optimization hybridization (HPSO). Comprehensive simulation experiments are carried out to evaluate the efficacy of the proposed HPSO by employing the time multiplier setting (TMS) and plug setting (PS) as an optimization variable and constant, respectively. The HPSO has been examined satisfactorily utilizing certain IEEE benchmark test systems (9-bus and 14-bus). The outcomes are contrasted with earlier heuristics and evolutionary approaches. Based on the acquired findings, it is clear that the obtained results exceed the other conventional and state of the art procedures in terms of total DOPR operation and the computing time necessary to achieve the global optimal solution.

Graphical Abstract

1. Introduction

Over the decades, numerous improvements have been made to solve the problem of the coordination of relays for power system protection. The purpose of relay coordination for power system protection is to quickly find the faulty section and resume the services throughout the remaining sections. A directional overcurrent protection relay (DOPR) is an economical method for the primary and secondary/backup protection of power systems [1]. In general, a DOPR is dependent upon many factors such as the plug setting (PS), time multiplier setting (TMS), coordination time interval (CTI), current transformer ratio (CTR) primary fault current, and secondary fault current, etc. To improve reliability in electrical systems, other relays are integrated, which serve as a second line of protection in the event of a failure of the first protection, and to ensure the stability of the power system, an alternate protection circuit must be placed in case the first one does not work properly [2,3]. The reliability of the operating time of a DOPR depends on two parameters that are the plug setting (PS) and time multiplier setting (TMS). In this manuscript, linear programming is formulated because the plug setting is constant and the time multiplier setting is variable for the DOPR problem.
Some evolutionary techniques have been used for the coordination of DOPR either in multiple networks or in ring networks. Metaheuristics evolutionary techniques include the genetic algorithm (GA) [4], particle swarm optimization (PSO) algorithm [5], firefly algorithm (FA) [6,7], whale optimization [8], Jaya algorithm (JA) [9], electromagnetic field optimization (EFO) [10], teaching learning based optimization (TLBO) algorithm [11], root tree algorithm [12], differential evolution (DE) algorithm [13,14], gray wolf optimization [15], and seeker algorithm [16]. Some computer-generated MATLAB simulated techniques include IDE (integrated development environment) [17], and NLP (Nonlinear Programming) [18], IPOPT (Interior Point Optimization) [19,20], SNOPT (Sparse Nonlinear Optimizer) [21], OPTI Tool [21], and IPM (Interior Point Method) [21], etc. The particle swarm optimization (PSO) algorithm was presented with different IEEE benchmark test systems for the optimal coordination of DOPRs [22]. For simulations of the grounding grids and to achieve optimal DOPR coordination, the genetic algorithm was used [23]. For the improvement in the coordination of DOPR, some hybrid techniques have also been used, such as a combination of the firefly algorithm with the artificial neural network (ANN), proposed for the IEEE 9-bus system; in this work, more DGs are used in the IEEE-9 bus system [24]. An algorithm, OJAYA (oppositional Jaya), is proposed for the DOPR’s coordination problem by using the distance adaptive coefficient (DAC) method. The Oppositional Learning (OL) firstly formulates in the Jaya algorithm to stretch the searching space and to fortify the population, and secondly, DAC is used to escape from the worst position and to gain the best position [25]. A Mathematical Programming Language (AMPL)-based Interior Point Optimization (IPOPT) solver is deployed on an IEEE 14-bus system by using DGs and without DGs. In [26], a hybrid BBO–LP (BBO with LP) is proposed for the coordination of DOPRs. In [27], a hybrid GA with nonlinear programming (NLP) method is deployed to solve the DOPR problem and find the TMS. In [28], a hybrid PSO with LP method is proposed; in this case, both the PS and TMS are optimization variables. In summary, all these optimization techniques perform well for simple problems; however, for complex problems, they take more computational time and converge with a greater number of iterations. The main advantage of this research with the other mentioned metaheuristics techniques is that hybridization is performed by introducing simulated annealing (SA) in the original PSO to avoid being trapped in local optima and to successfully search for a global optimum solution. The suggested HPSO has extraordinary exploration competency and speed as compared to other metaheuristic techniques; this characteristic makes the population members of the HPSO more discriminative when searching for the optimal solution compared to other metaheuristic algorithms. Therefore, this shows the clear novelty and contribution of this method, while most other studies just utilized or applied the existing or emerging optimization methodologies from the literature rather than developing a new methodology themselves. In this context, this paper also aims to explore ways of improving and finding the optimal coordination of the overcurrent relay through a newly developed hybrid swarm-based optimization approach named as “HPSO”.
In this case, linear programming is deployed, in which only TMS is variable, while other settings are constant such as pickup current and PS, etc. Normally in these cases, there is a risk of catching in the local optima and found nonlinearity in the coordination problem. For the solutions of these issues, a hybrid PSO–SA (particle swarm optimization algorithm–simulated annealing) technique and adaptive protection setting has been proposed [29] to avoid being trapped in local optima. By using this technique, premature convergence and the nonlinearity problem of DOPR is solved efficiently and the optimal global solution is achieved. The idea of using PSO with SA occurred because PSO has the ability to converge earlier and SA has the capability to remove from the local optima [30].
Two standard benchmarks of IEEE case studies (i.e., IEEE 9- and 14-bus systems) are formulated by using the PSO and HPSO techniques. The objective is to find the minimum total operating time taken by primary relays to trace the fault. Organization of this paper is as follows: In Section 2, the coordination of a DOPR is described. In Section 3, a detailed explanation of PSO and SA is presented. Simulation results and the comparison of this technique with other techniques are evaluated in Section 4, and, lastly, the conclusion is presented in Section 5.

2. Problem Formulation

The optimization coordination problem of the DOPR is to minimize the total operating time of all the relays [31]. To minimize the total operating time, coordination between the DOPRs should be synchronized. The plug setting (PS) and time multiplier setting (TMS), should be maintained for the coordination of the DOPR. This research is about the linear programming function; therefore, the value of the PS is kept constant, while the TMS is a variable [32,33].
The objective function (F) is to find the sum of the total operating time of the relays given in Equation (1). The problem of coordinating optimal DOPR protection is to minimize the sum of the operating times of all relays corresponding to the maximum fault current. The number of relays are denoted by N , and T i is the total operating time of the i -th relay [5].
Objective   Function   ( F ) = | i = 1 N T i |
This objective function is subjected to the LCT (least coordination time), PS, TMS, and minimum time of the relays, and in this proposed technique, absolute value is used.
| j = 1 N T j | | i = 1 N T i | | LCT |
i = 1 N TMS i , min i = 1 N TMS i i = 1 N TMS i , max
i = 1 N T i , min i = 1 N T i i = 1 N T i , max
In Equation (2), T i is the operating time of the primary relay, T j is the operating time of the backup relay, and LCT is the least coordination time required for the proper coordination. LCT is the absolute value of the primary and backup. In Equation (3), TMS i , min is the minimum limit on TMS and TMS i , max is the maximum limit on the TMS. The PS in this case is constant, which is why it does not have boundaries of a maximum and minimum limit. In Equation (4), T i , min and T i , max are the minimum and maximum time required for the operation of the relays, respectively. Here, the point to note is that the objective function given in Equation (1) is to minimize the total operating time of the primary relays without the requirement of the operating time of the backup relays while satisfying LCT requirements. Equations (3) and (4) are about the boundary limits of the required time to trace the fault.
Equation (5) defines the operating time of the relay according to the IEC (International Electrotechnical Commission) standard, in which α and   σ are constant parameters and their values are α = 0.02 and σ   = 0.14 respectively [19]. The pickup current and fault current flowing through the relays are   I p   ,   I f respectively. In this proposed technique, the absolute value of the operating time is used, which is either the primary time or the backup time.
T i = | TMS i × σ ( I fi I pi ) α 1 |
Generally, I p is a product of the plug setting (PS) and current transformer ratio (CTR), which is given in Equation (6).
I pi = PS i × CTR i
The coordination time interval (CTI) between the operating time of the primary T i and backup T j relay and their relationship is given in Equation (7). The most important coordination constraint is the operating delay between a primary relay and its backup relay. This delay is known as the coordination time interval (CTI) and it depends on many factors, such as the operating time of the CBs and the other safety factors. Their relation is given in Equation (7). The value of the primary and backup time is taken as absolute in this proposed technique; also, the achieved results of the CTI are taken as absolute to avoid any operating time error.
j = 1 N T j i = 1 N T i = | CTI |
The relationship between the primary and backup relay is said to integrate well when the CTI between the operating time of the primary and backup relay is more than the defined LCT. In this case, the LCT value is set to 0.2 s [25].
T i = | TMS p × σ ( I fp ( PS p × CTR p ) ) α 1 |
T j = | TMS b × σ ( I fb ( PS b × CTR b ) ) α 1 |
Equations (8) and (9) are derived from Equations (5) and (6). These equations are for the operating times of the primary and backup relays. Where, p and b denote the primary and backup relay, respectively. Equation (8) is used to calculate the operating time of the primary relay, whereas Equation (9) is used to calculate the backup relay. In general, from these equations, the relationship between the DOPR operating time of T and the TMS relay is found. Thus, this problem is considered as a linear problem because all the parameters of the objective function are known except for the TMS. Therefore, the optimal value of this parameter will be determined simultaneously by solving this linear optimization problem.

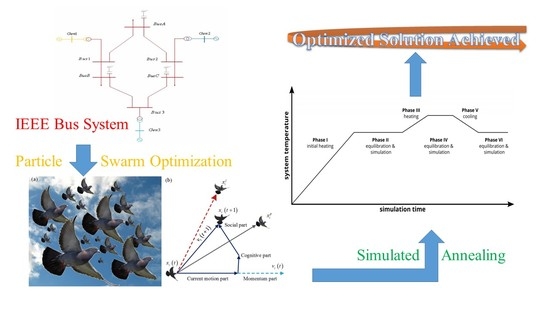
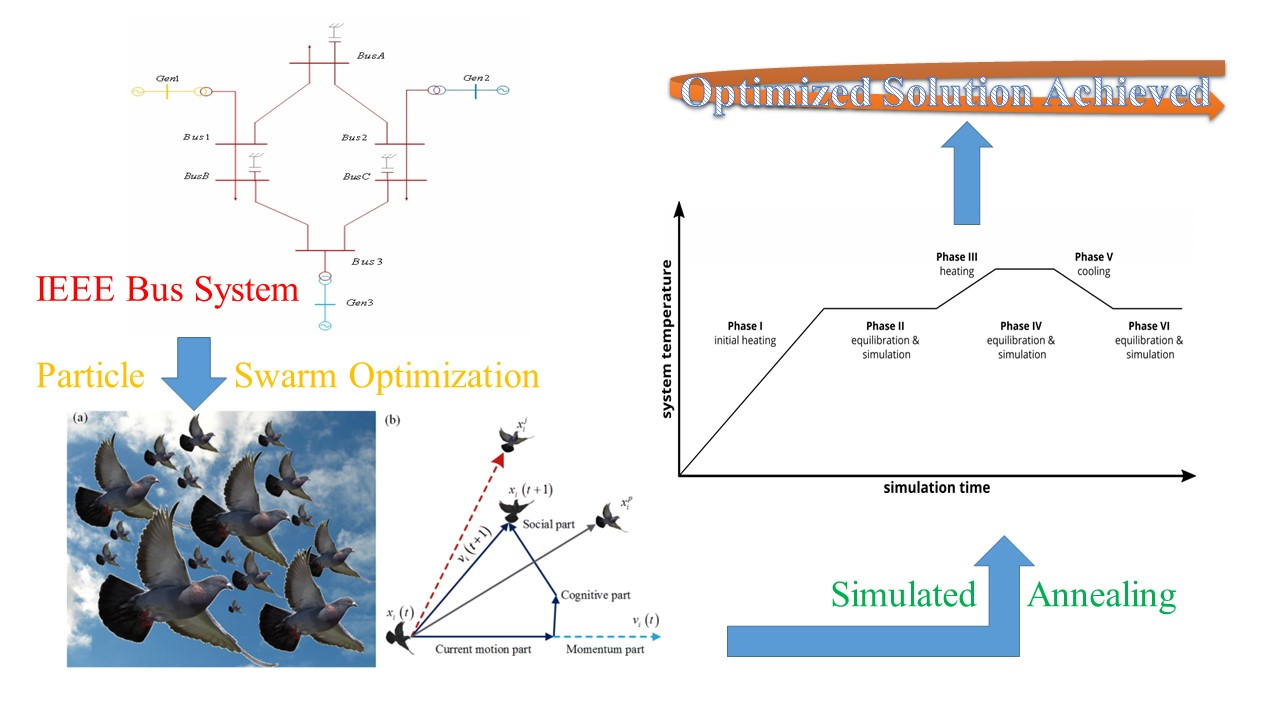
3. Optimization Algorithm for the Protection of Coordination Problems

PSO and SA are robust, productive, and dependable optimization techniques. These optimization techniques can be applied easily to the DOPR problems. In this research, the implementation and the mathematical modelling of the PSO and SA will be explained.
The PSO algorithm belongs to the navigation of flocks of birds or schools of fishes. In the problem of the coordination of a DOPR, PSO is used to find the fault in the DOPR in the minimum total operating time. As one of the abilities of PSO is to converge as earlier stated, that is why it is very helpful in the case of the coordination of a DOPR [34,35]. After the convergence, PSO gives two solutions, one is the personal best and the other is the global best. The personal best is the overall solution achieved after the simulation of the desired function and is denoted by “ p b e s t ”. The global best is the minimum value or objective function that is achieved from the personal best solution and is denoted by “ g b e s t ”. The stepwise process of PSO is as follows
x i k = x i , m i n + ( x i , m a x x i , m i n ) r i
F i k = f ( x i k )
p b e s t = F i k
g b e s t = m i n i m u m   ( p b e s t )
                          v i , j k + 1 = ω . v i , j k + c 1 . r 1 . ( p b e s t i , j k x i , j k ) + c 2 . r 2 . ( g b e s t i , j k x i , j k )
x i , j k + 1 = x i , j k + v i , j k + 1
Pseudocode of HPSO
The pseudocode of the proposed HPSO algorithm is reported in Algorithm 1.
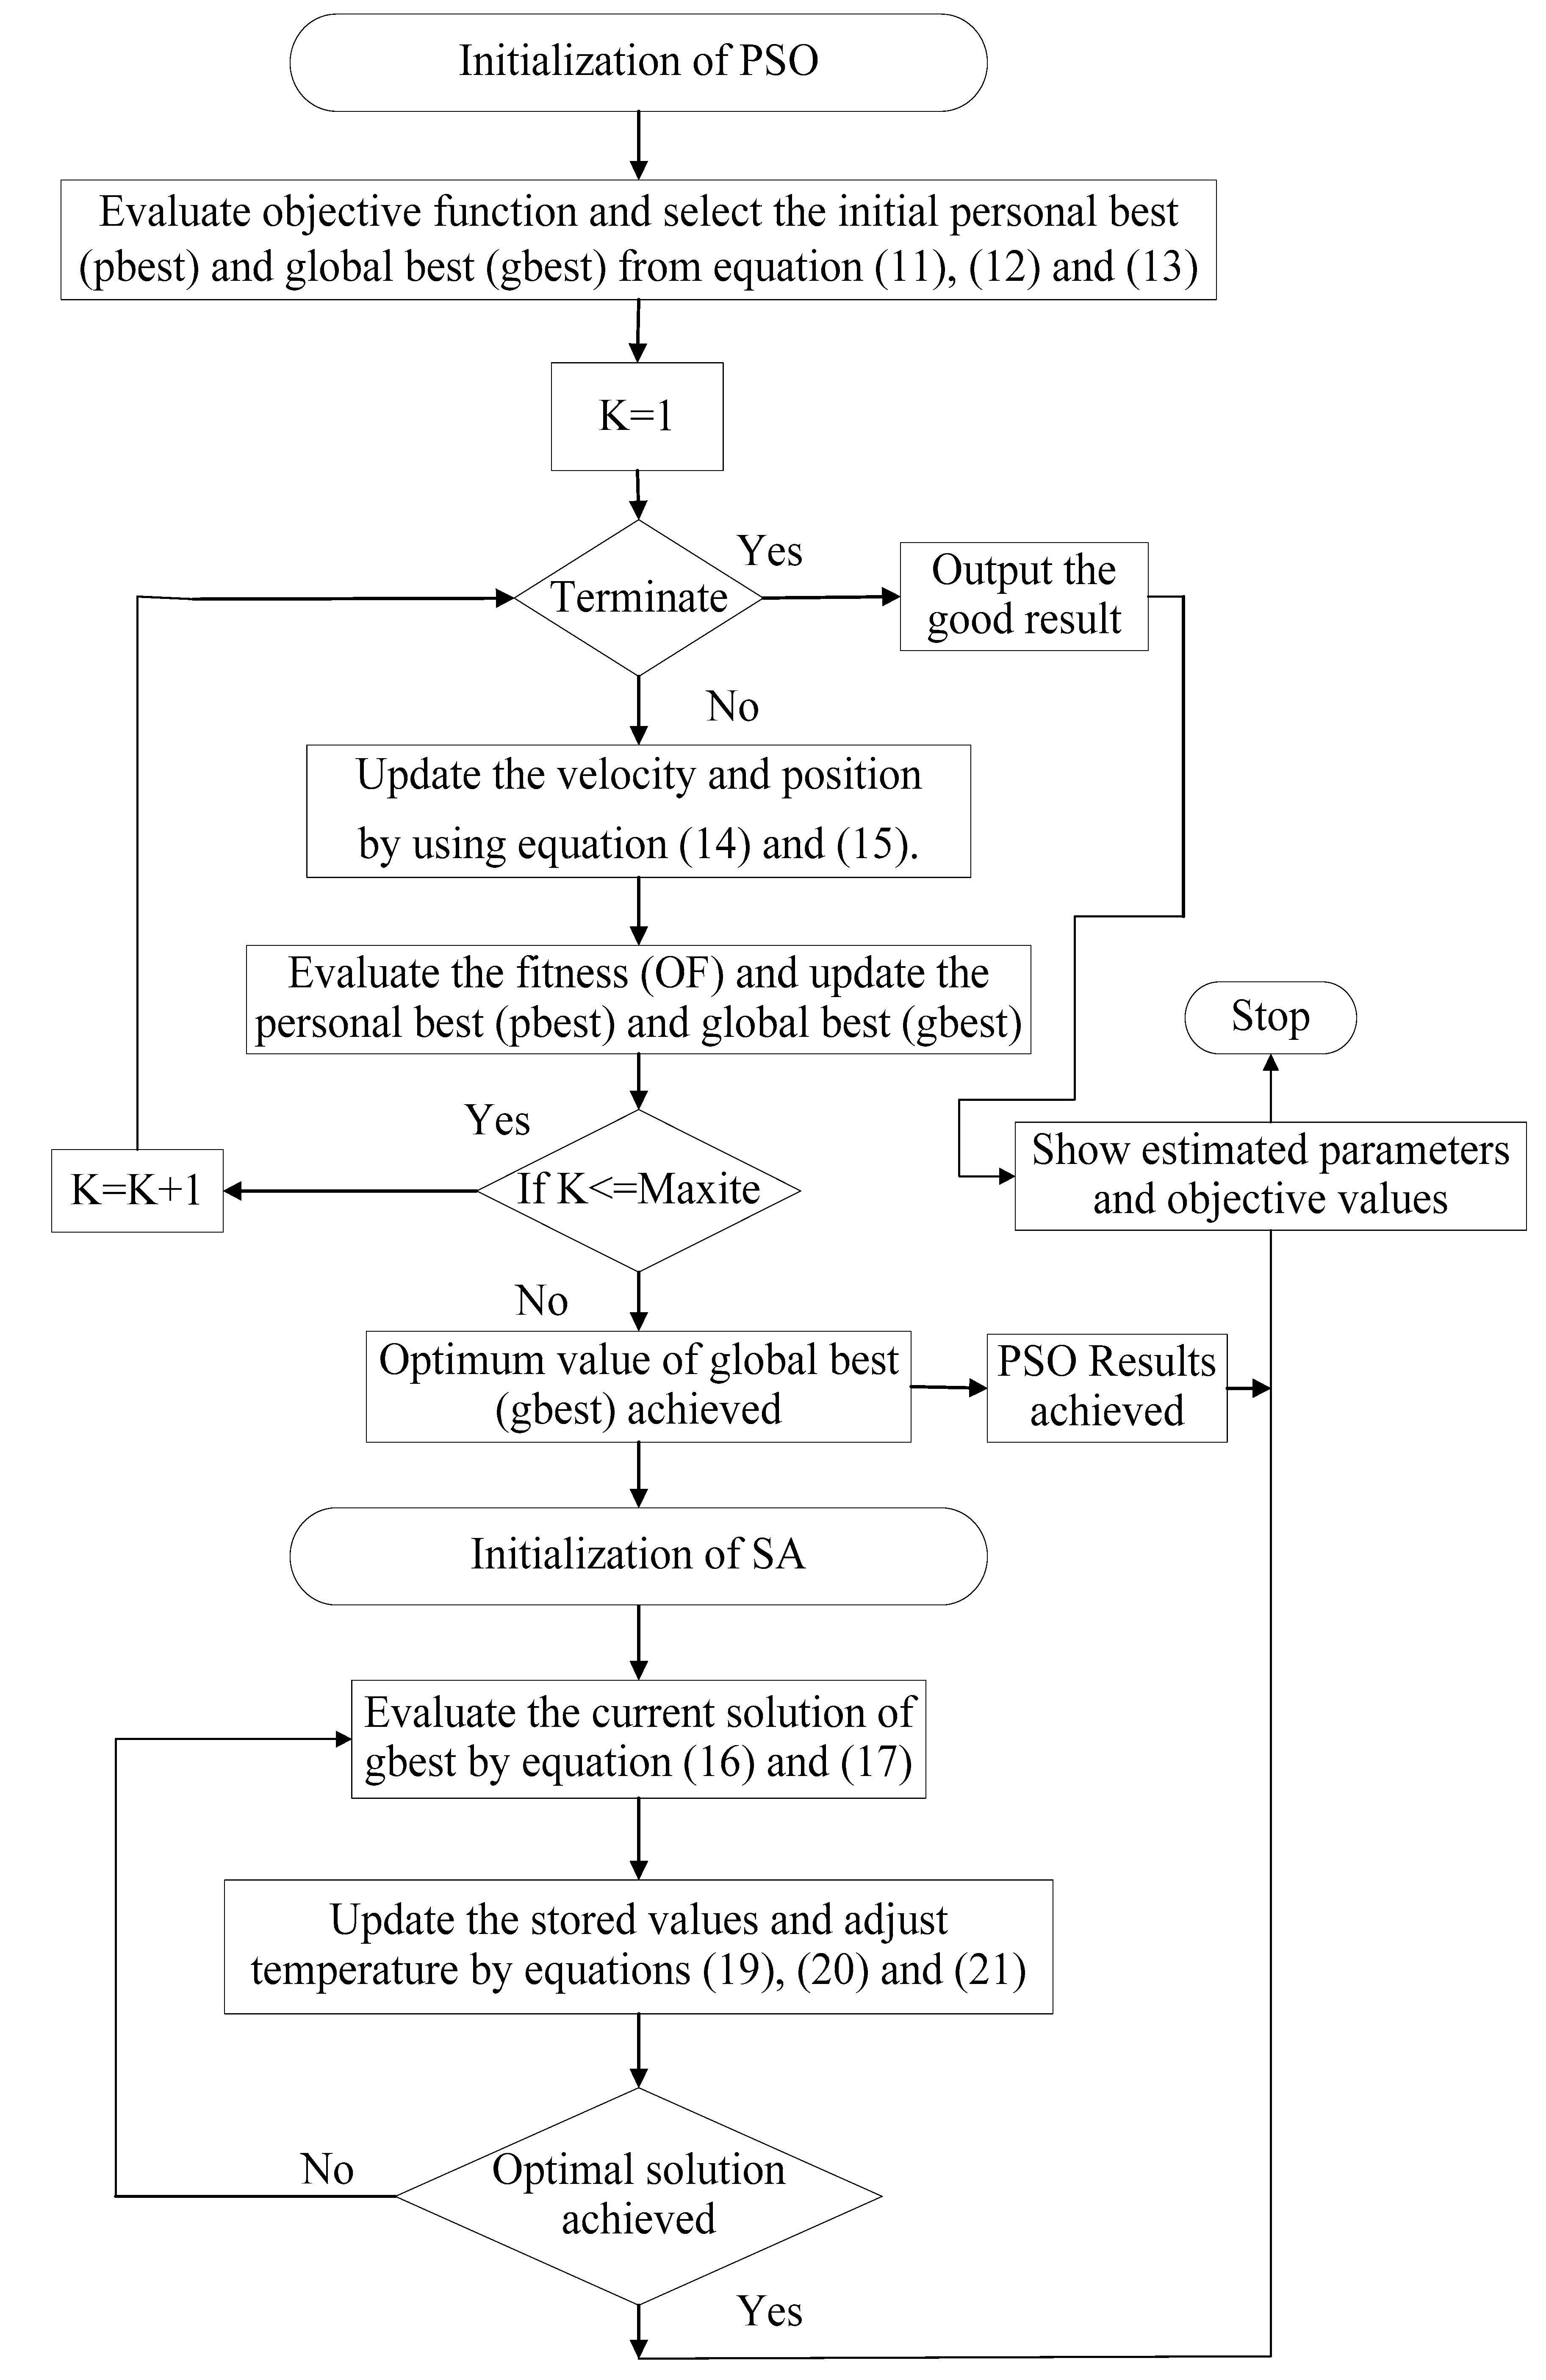
    Algorithm 1 Pseudocode of Hybrid Particle Swarm Optimization (HPSO)
    Step 1: Initialize wmin,wmax (Inertia), c1,c2 (Acceleration Factor), r1,r2 (Random value), T0 (Initial Temperature) and α (Cooling Factor) for the Hybrid PSO (PSO–SA).
        Step 1.1: Initialize the generation system within the parameter’s boundary conditions.
        Step 1.2: The initial results are obtained after evaluating the objective function by using Equation (12). From the function, pbest is achieved; the minimum value of this function is gbest.
    Step 2: This step belongs to the cycle of iteration until the desired results are achieved.
        Step 2.1: Particle velocity and position is updated within a certain boundary limit by using the Equations (14) and (15).
        Step 2.2: Result of pbest and gbest are achieved according to Equations (12) and (13).
        Step 2.3: SA is started here after obtaining the gbest as the initial solution.
        Step 2.4: Function for the new solution defined with respect to the old solution.
        Step 2.5: The new solution is generated after evaluating the old solution.
        Step 2.6: If the difference between the old and new solution is less than 0, the solution is accepted as a good solution by using Equation (18).
        Step 2.7: Otherwise use Equation (19) until it satisfies step 2.6
        Step 2.8: From the objective function, the new solution is achieved.
        Step 2.9: Update temperature according to Equation (21).
        Step 2.10: Repeat Step 2 until the stopping criterion is met.
    Step 3: Show estimated parameters, objective values, and gbest solution.
Equation (10) is a modified position of the particle also called the initial position. From this initial position, initial velocity is generated. The initial position that is achieved goes through the objective function given in Equation (11). Equation (12) shows the objective value achieved is called the personal best of the solution. The minimum of this personal best is called the global best given in Equation (13). At this point, if the results are acceptable then the best minimum total operating time is achieved. If not, then it will move forward to Equation (14), where the velocity and the position of the particle are updated as given in Equations (14) and (15). After updating the velocity and position of the particle, the solution will go through Equations (11)–(13) until the best solution is achieved. The abbreviations x i , m a x and x i , m i n from Equations (10)–(15) are the maximum and minimum boundary limits of the variables, respectively, and r i denotes the random number of the i -th variable whose value varies from 0 to 1. The objective function at a certain position is denoted by   F i k . The inertia, ω, value varies from 0.1 to 0.9, ( c 1 ,   c 2 ) are the acceleration factors and their values vary around 2, and   ( r 1 , r 2 ) are the random values from 0 to 1.
To hybridize the PSO, SA is used as a partner to further improve the total operating time of the DOPR in the minimum convergence time. Simulated annealing (SA) works on the principle of annealing in metallurgy [36]. Annealing is the process of the slow cooling of the metal after heating. Slow cooling is carried out because metal deforms to the desired shape at a low energy state where it cannot be broken easily. In the case of optimization, it works on the principle of a good move and a bad move, where a good move is acknowledged, and the bad move will go through certain functions to make it a good move. The stepwise process of the HPSO is as follows
O . s o l u t i o n = g b e s t
N . s o l u t i o n = c r e a t e n e i g h b o u r   ( O . s o l u t i o n )
D   ( D e l t a ) = N . s o l u t i o n O . s o l u t i o n
P = e x p ( D / T )
r e x p ( D / T )
T k = α * T k 1
The PSO results are further improved by using the SA algorithm, such as the global best from PSO being taken as the old solution given in Equation (16). The new solution is achieved by putting the old result in the new function given in Equation (17). Equation (18) tells us about the difference between the new and the old solution; when the delta is less than 0, the new solution becomes equal to the old solution and it is called a good move. The good solution is passed through the cooling function given in Equation (21) and the required results are achieved. If the delta is greater than 0, then the solution will pass through the probability equation given in Equation (19) and it will continually move through that equation until it satisfies Equation (20). By following these steps, the local optima is removed and the global best solution is achieved. The abbreviations (P, D, and T) used in the Equations (16)–(21) are the probability, the difference between the two variables and the temperature, respectively, whereas r is a random number from 0 to 1. The initial temperature is T0 and α is the cooling factor. T k is the new temperature, α is the cooling factor, and T k 1 is the previous temperature. The value of the initial temperature ( T 0 ) is 1 and the cooling factor (α) is 0.99.
The flow chart and the pseudocode of the desired algorithm are shown in Figure 1 and Algorithm 1, respectively. Firstly, all the parameters of the PSO are defined according to the objective function of the DOPR. By using the Equations (11)–(13), the total operating time and the minimum value from that operating time are calculated, also known as the initial personal best and the global best. Equations (14) and (15) are used to update the velocity and position of the DOPR to enhance the speed to trace the fault as quickly as possible. If the results are acceptable, then the iteration stops and the desired results are achieved; if not, then it keeps on iterating until the desired results are achieved. After obtaining the PSO results, then the SA is initialized and uses the global best value as the old solution given in Equation (16). The new solution is achieved from the neighborhood of the old solution given in Equation (17). The desired value is updated by using the Equations (19)–(21) until a more improved minimum operating time of the DOPR is achieved. It is worth noticing that the results can be achieved at any section when desired, needing either the PSO or HPSO. The two IEEE test cases, undertaken through this proposed algorithm, and their results are given in Section 4.
In summary, after using the HPSO for the coordination of the DOPR problem, improved results are obtained compared to other metaheuristic techniques. This is because PSO has the ability to update the speed after every iteration and yields a lower operating time, and SA has a high search capability and removes the local optima. Therefore, using these two algorithms together gives a competitive operating time compared to other state of the art techniques.

4. Simulation Results and Discussion of IEEE Bus Systems

The PSO and HPSO algorithms described in the previous section have been applied to solve the two IEEE bus systems for the protection of coordination problem. As the objective function is a linear programming function, therefore, for these two cases, the limit of the TMS varies from a 0.1 minimum limit to a 1.2 maximum limit, respectively, whereas the PS and CTI are kept constant at 0.5 and 0.2 s, respectively. The obtained results and the comparison with other algorithms are discussed in the following subsection.

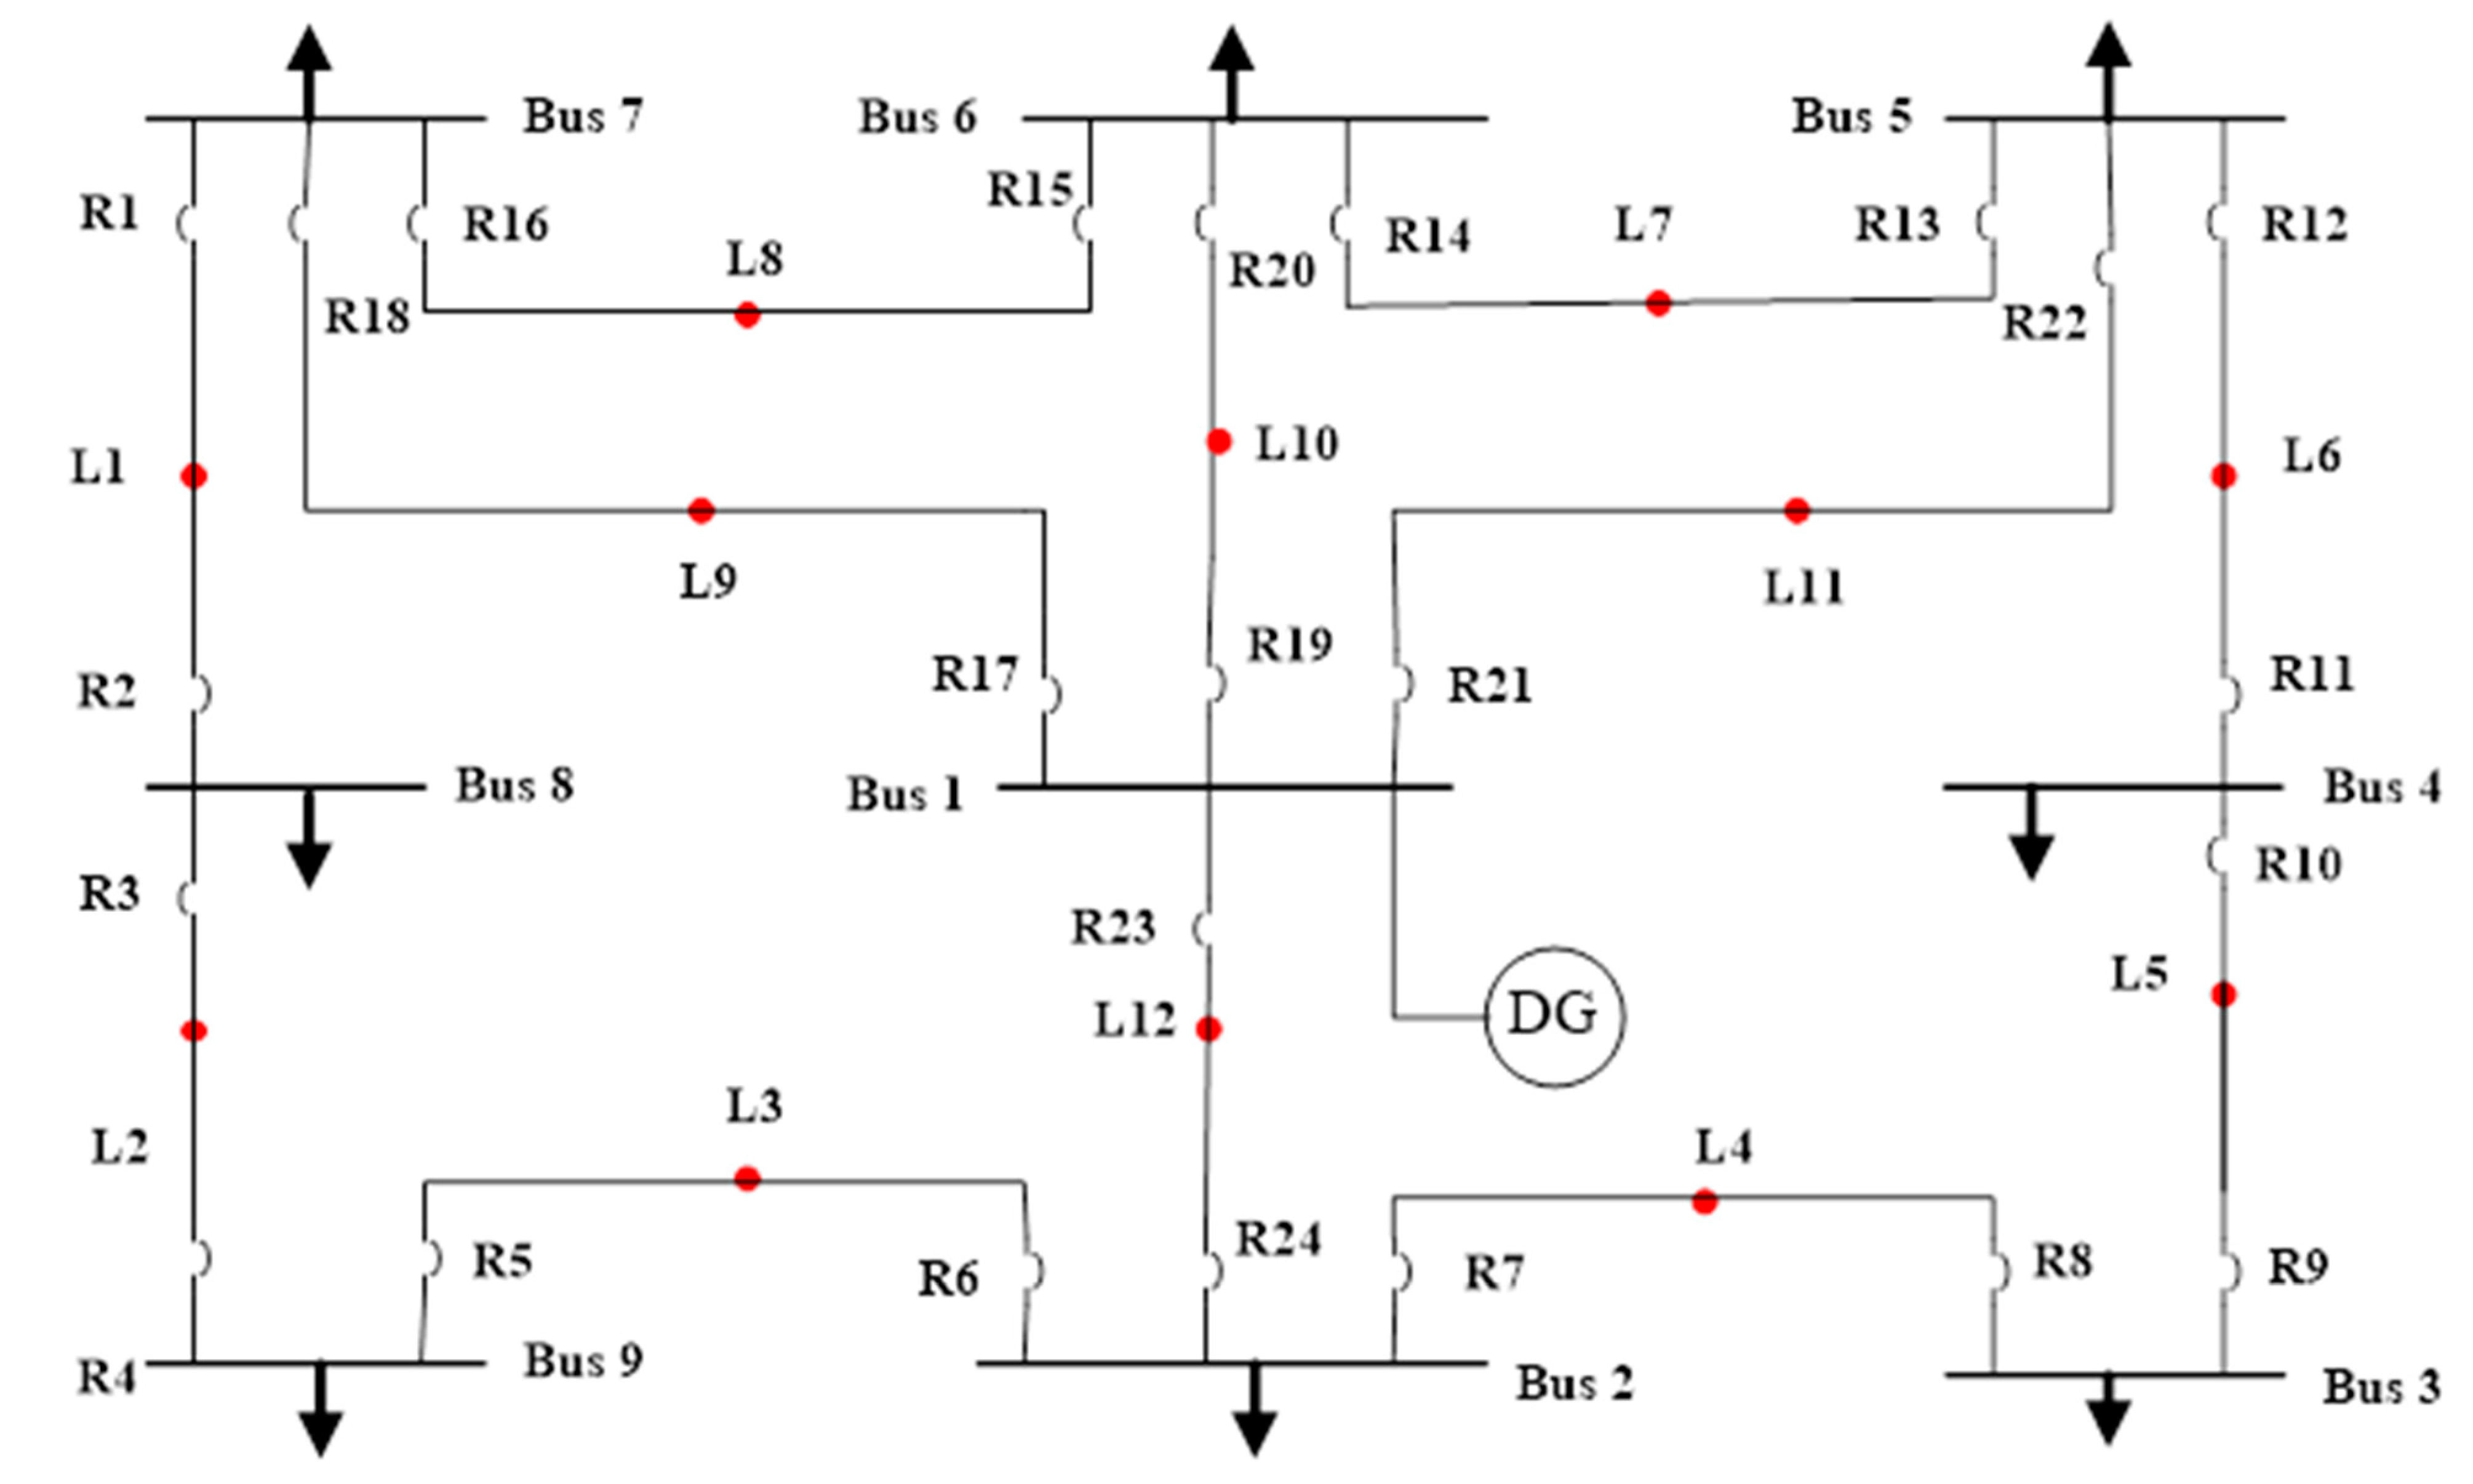
4.1. Case 1: IEEE 9-Bus System

A single line diagram with single source of power distribution system is shown in Figure 2. This 9-bus system has a single source that is supplied at Bus 1. In this system, there are 12 fault points (L1, L2, L3, …, L12), nine buses (Bus 1, Bus 2, …, Bus 9), 24 relays (R1, R2, R3, …, R24), and the number of combinations between the primary and backup of these 24 relays is 32. The current transformer ratio (CTR) for this bus system is set to 500:1 for all the relays. The relationship between the primary and backup relays at different fault points for all 32 combinations are executed in Table 1. The fault current passing through the primary relay and the backup relay are shown in Table 2. As this DOPR problem is solved by a linear programming function, the PS is kept constant at 0.5 and the optimized TMS of the proposed results of the PSO and HPSO are achieved in Table 3, by taking the CTI value at 0.2 s. The analysis of other techniques with the proposed technique are shown in Table 4.
It is noted that the proposed PSO and HPSO algorithm performs better than the GA, MEFO, BBO, NLP, MATLBO, TLBO, and IDE algorithms. This is because PSO has an exceptional quickness and exploration capability to trace the fault, and the addition of SA in the algorithm helps to improve the optimal solution. The operating times of individual relays by using the optimized values of the TMS are given in Table 5. The analysis of the net gain of the HPSO with the other defined techniques is displayed in Figure 3, which justifies that this technique is better than the other optimization techniques. The convergence graph of the PSO and HPSO are given in Figure 4 after the simulation with the help of MATLAB.

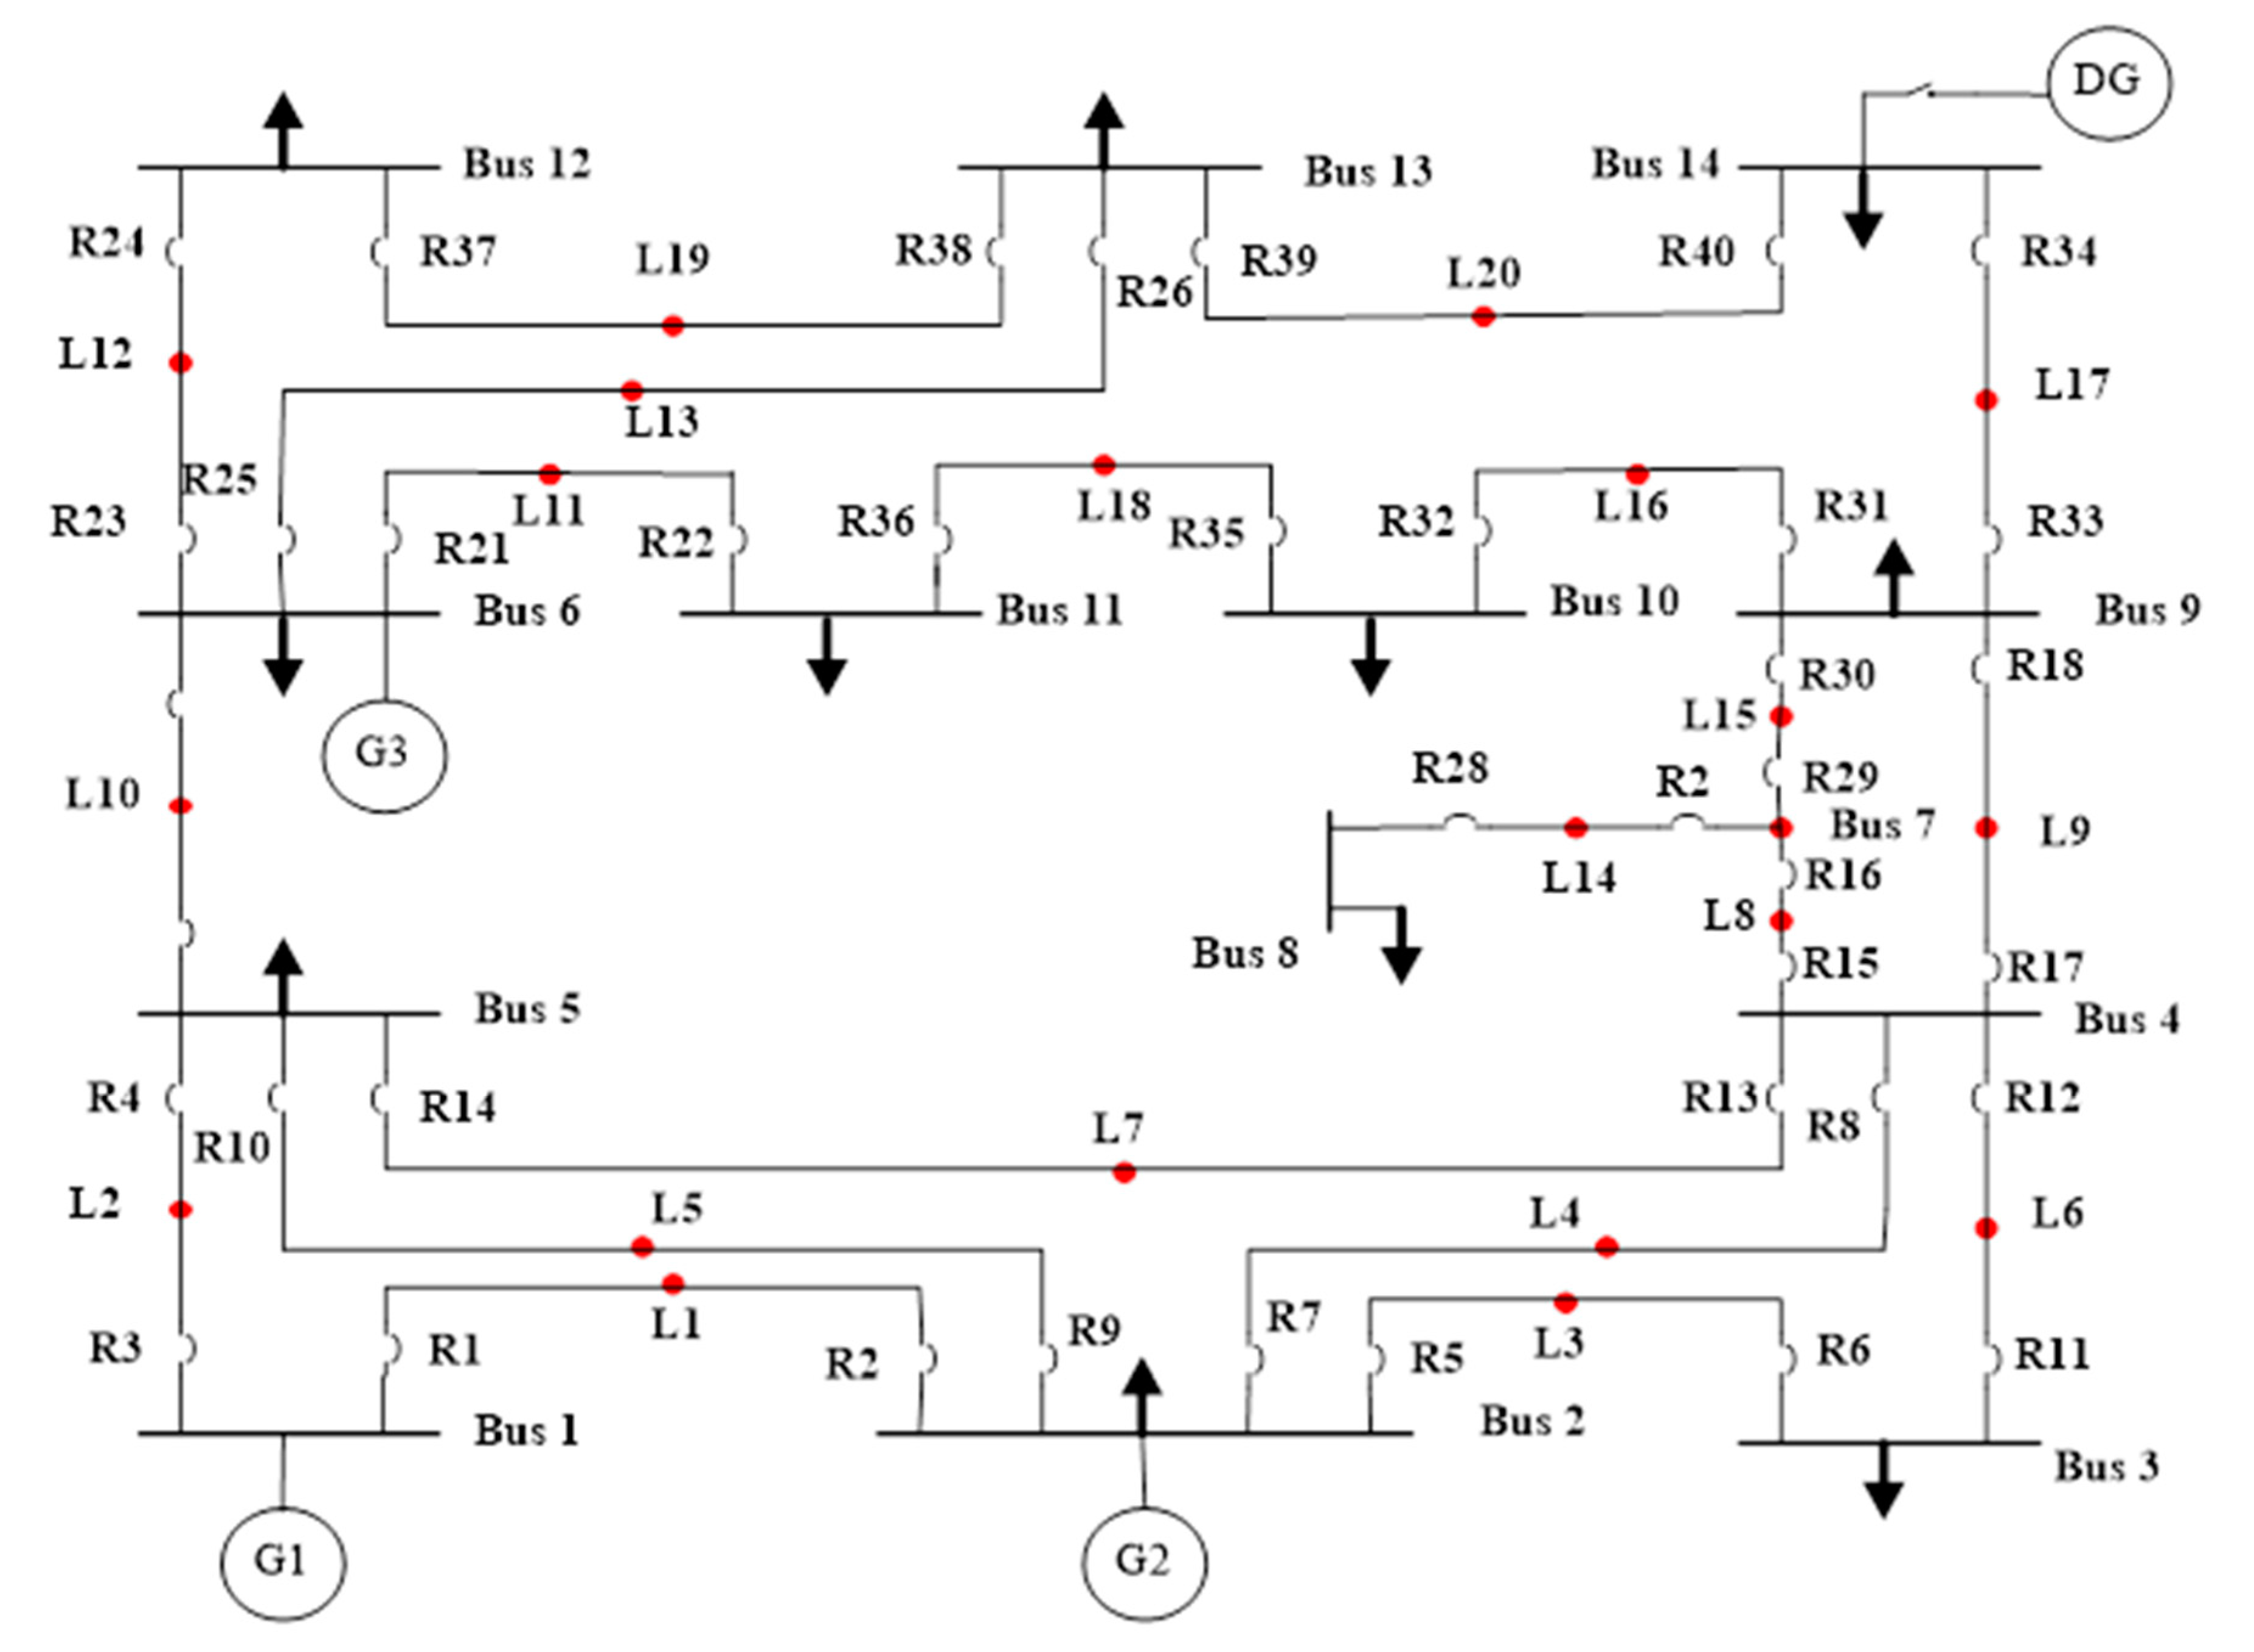
4.2. Case 2: IEEE 14-Bus System

The IEEE 14-bus system is shown in Figure 5, which consists of one DG, 3 generators, 20 fault points (L1, L2, L3, …, L20), 14 buses (Bus 1, Bus 2, …, Bus 14), and 40 relays (R1, R2, R3, …, R24). There are 92 combinations among these 40 primary–backup relays. One DG is connected at bus 14 and three generators are connected at buses 1, 2, and 6, respectively. The current transformer ratios (CTR) for all the relays for this bus system are given in Table 6. The relationships between the primary and backup relays at different fault points for all the 92 combinations of relays are given in Table 7. The fault currents for all the 40 relays either passing through the primary relay or from the backup relay are given in Table 8.
The optimized TMS results of the proposed PSO and HPSO are shown in Table 9 when the CTI value is 0.2 s and the PS is kept constant at 0.5. The operating times of individual relays by using the optimized values of the TMS are given in Table 10. The optimized results are then compared with the other state of the art techniques. Table 11 shows the proposed PSO and HPSO algorithm is better than the metaheuristic techniques such as GA and DE. Furthermore, the proposed technique is better than the MATLAB-implemented techniques such as IPOPT, SNOPT (Sparse Nonlinear Optimizer), OPTI Tool, and IPM (Interior Point Method). Net gain analysis also justifies the superiority of the proposed technique given in Figure 6. In summary, the proposed HPSO and PSO perform better because of their faster convergence speed and finding capability. After the MATLAB simulation, the convergence graph between the PSO and HPSO is given in Figure 7.

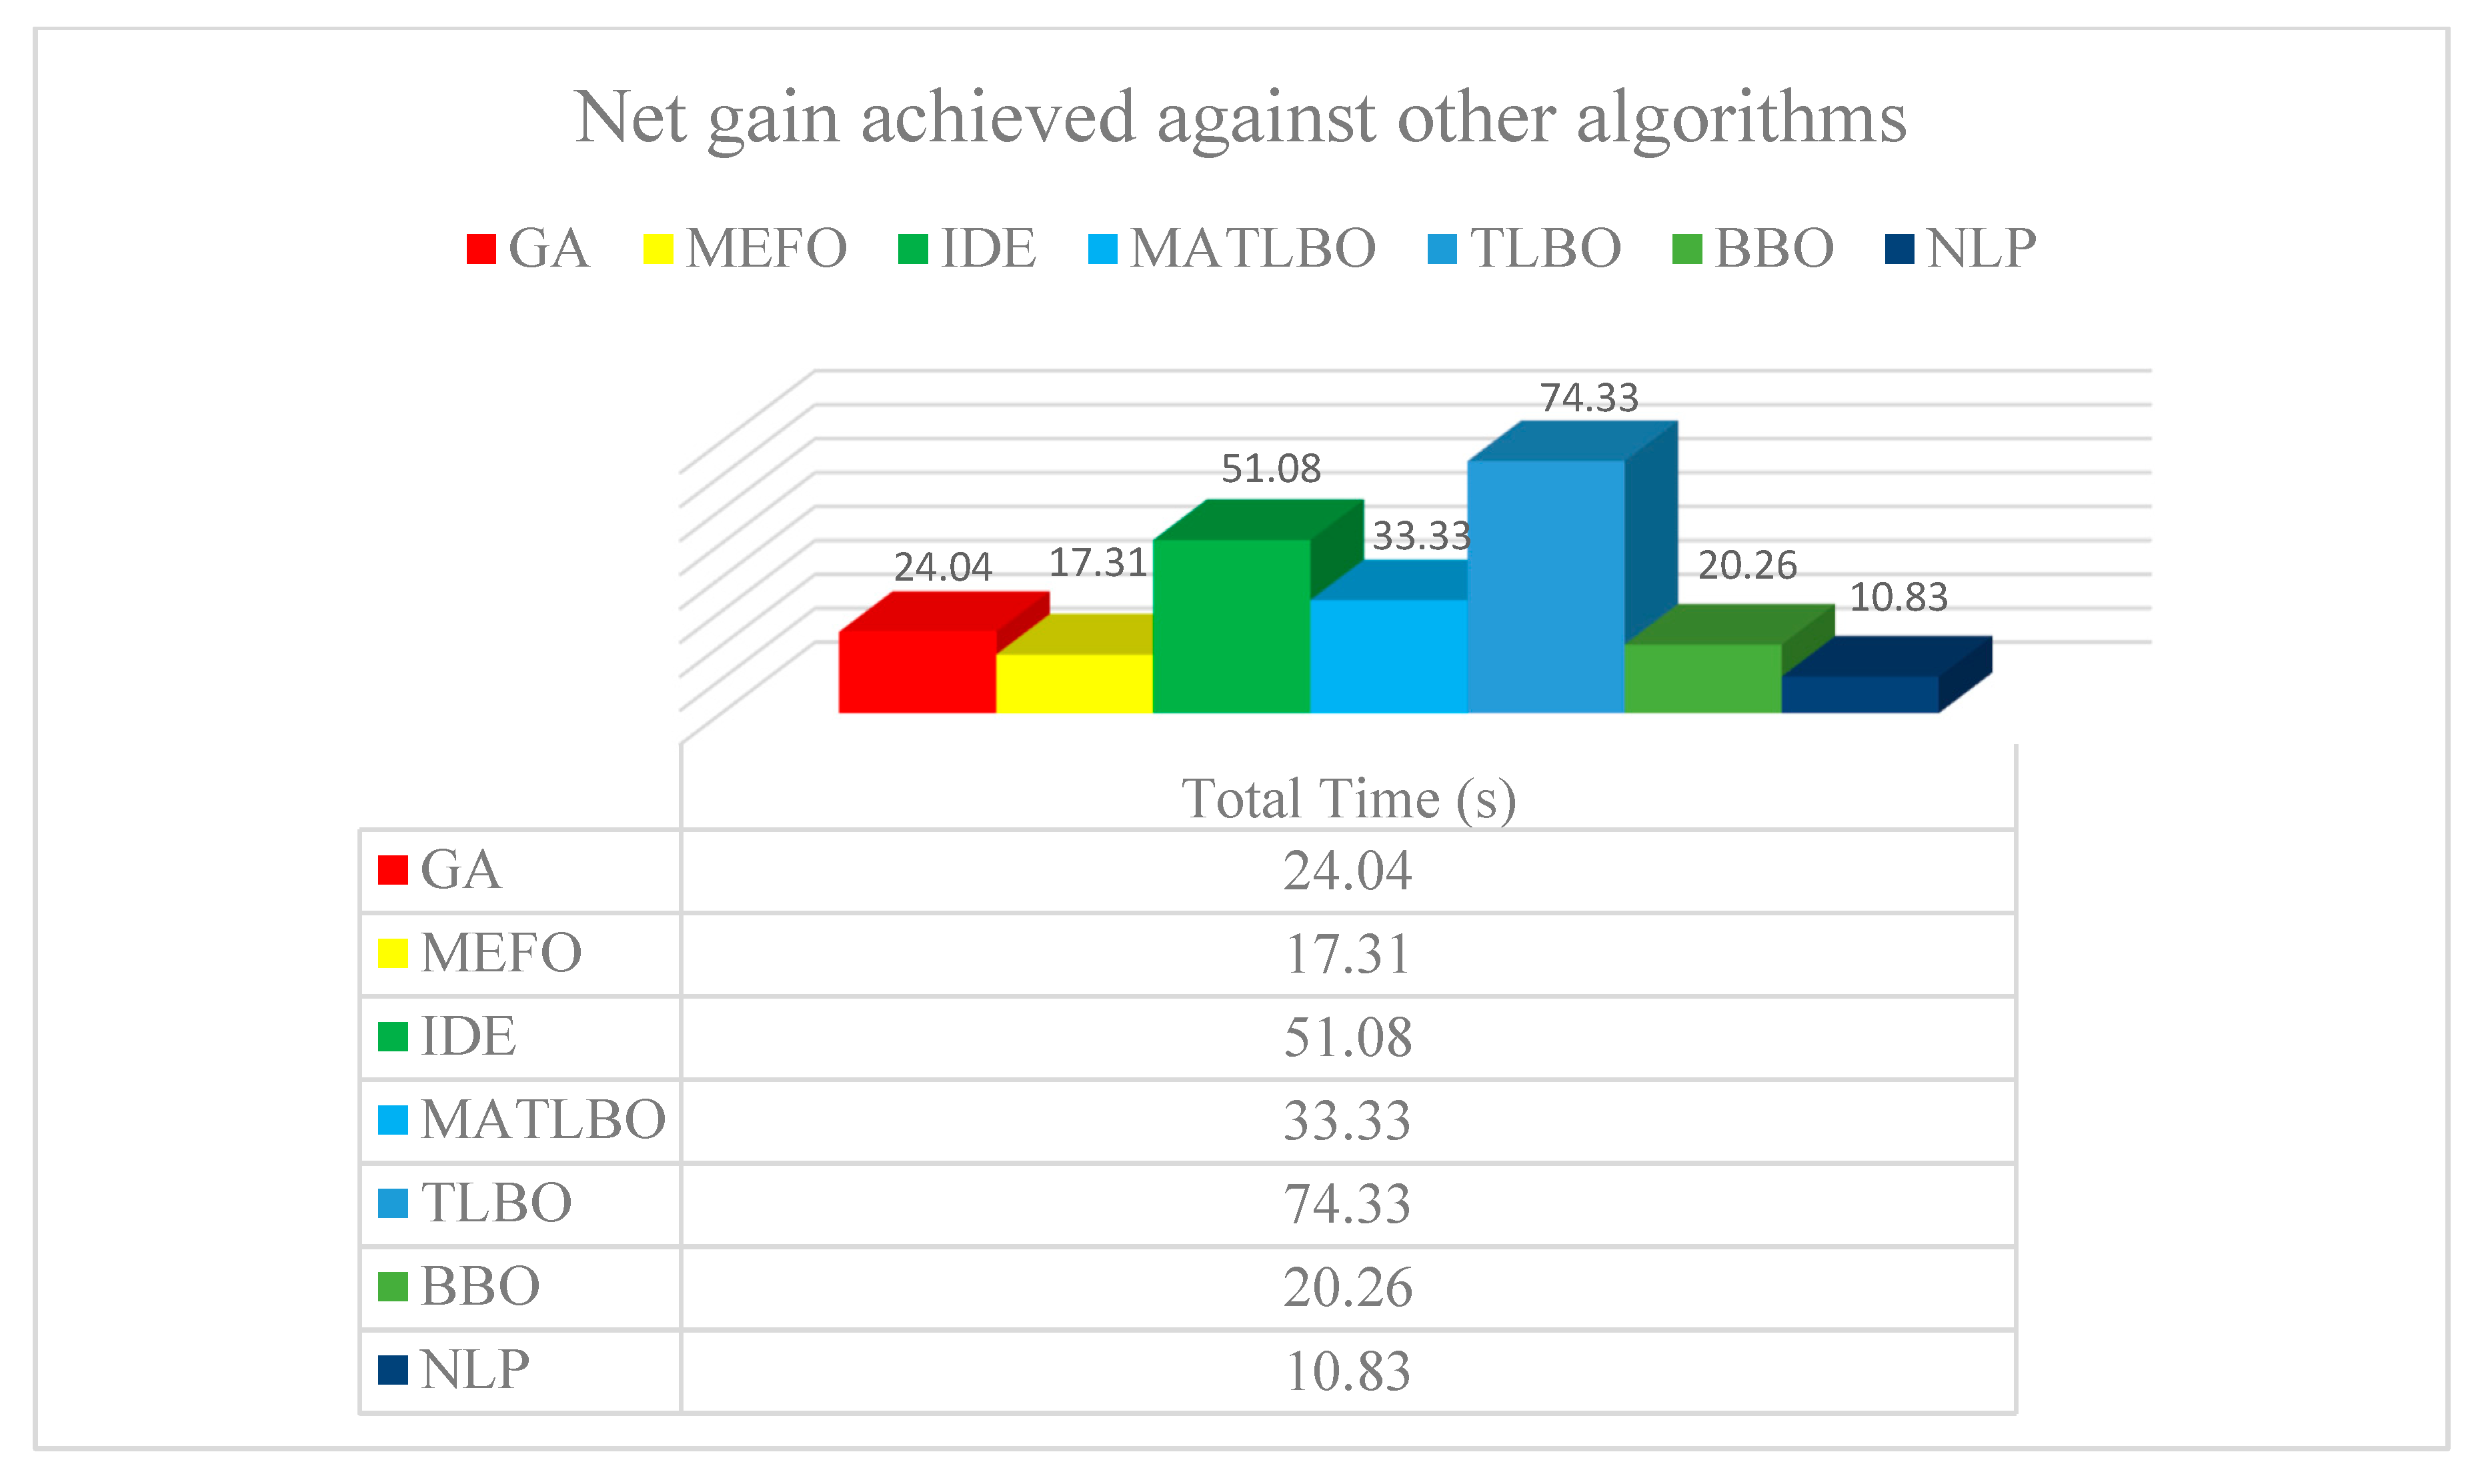
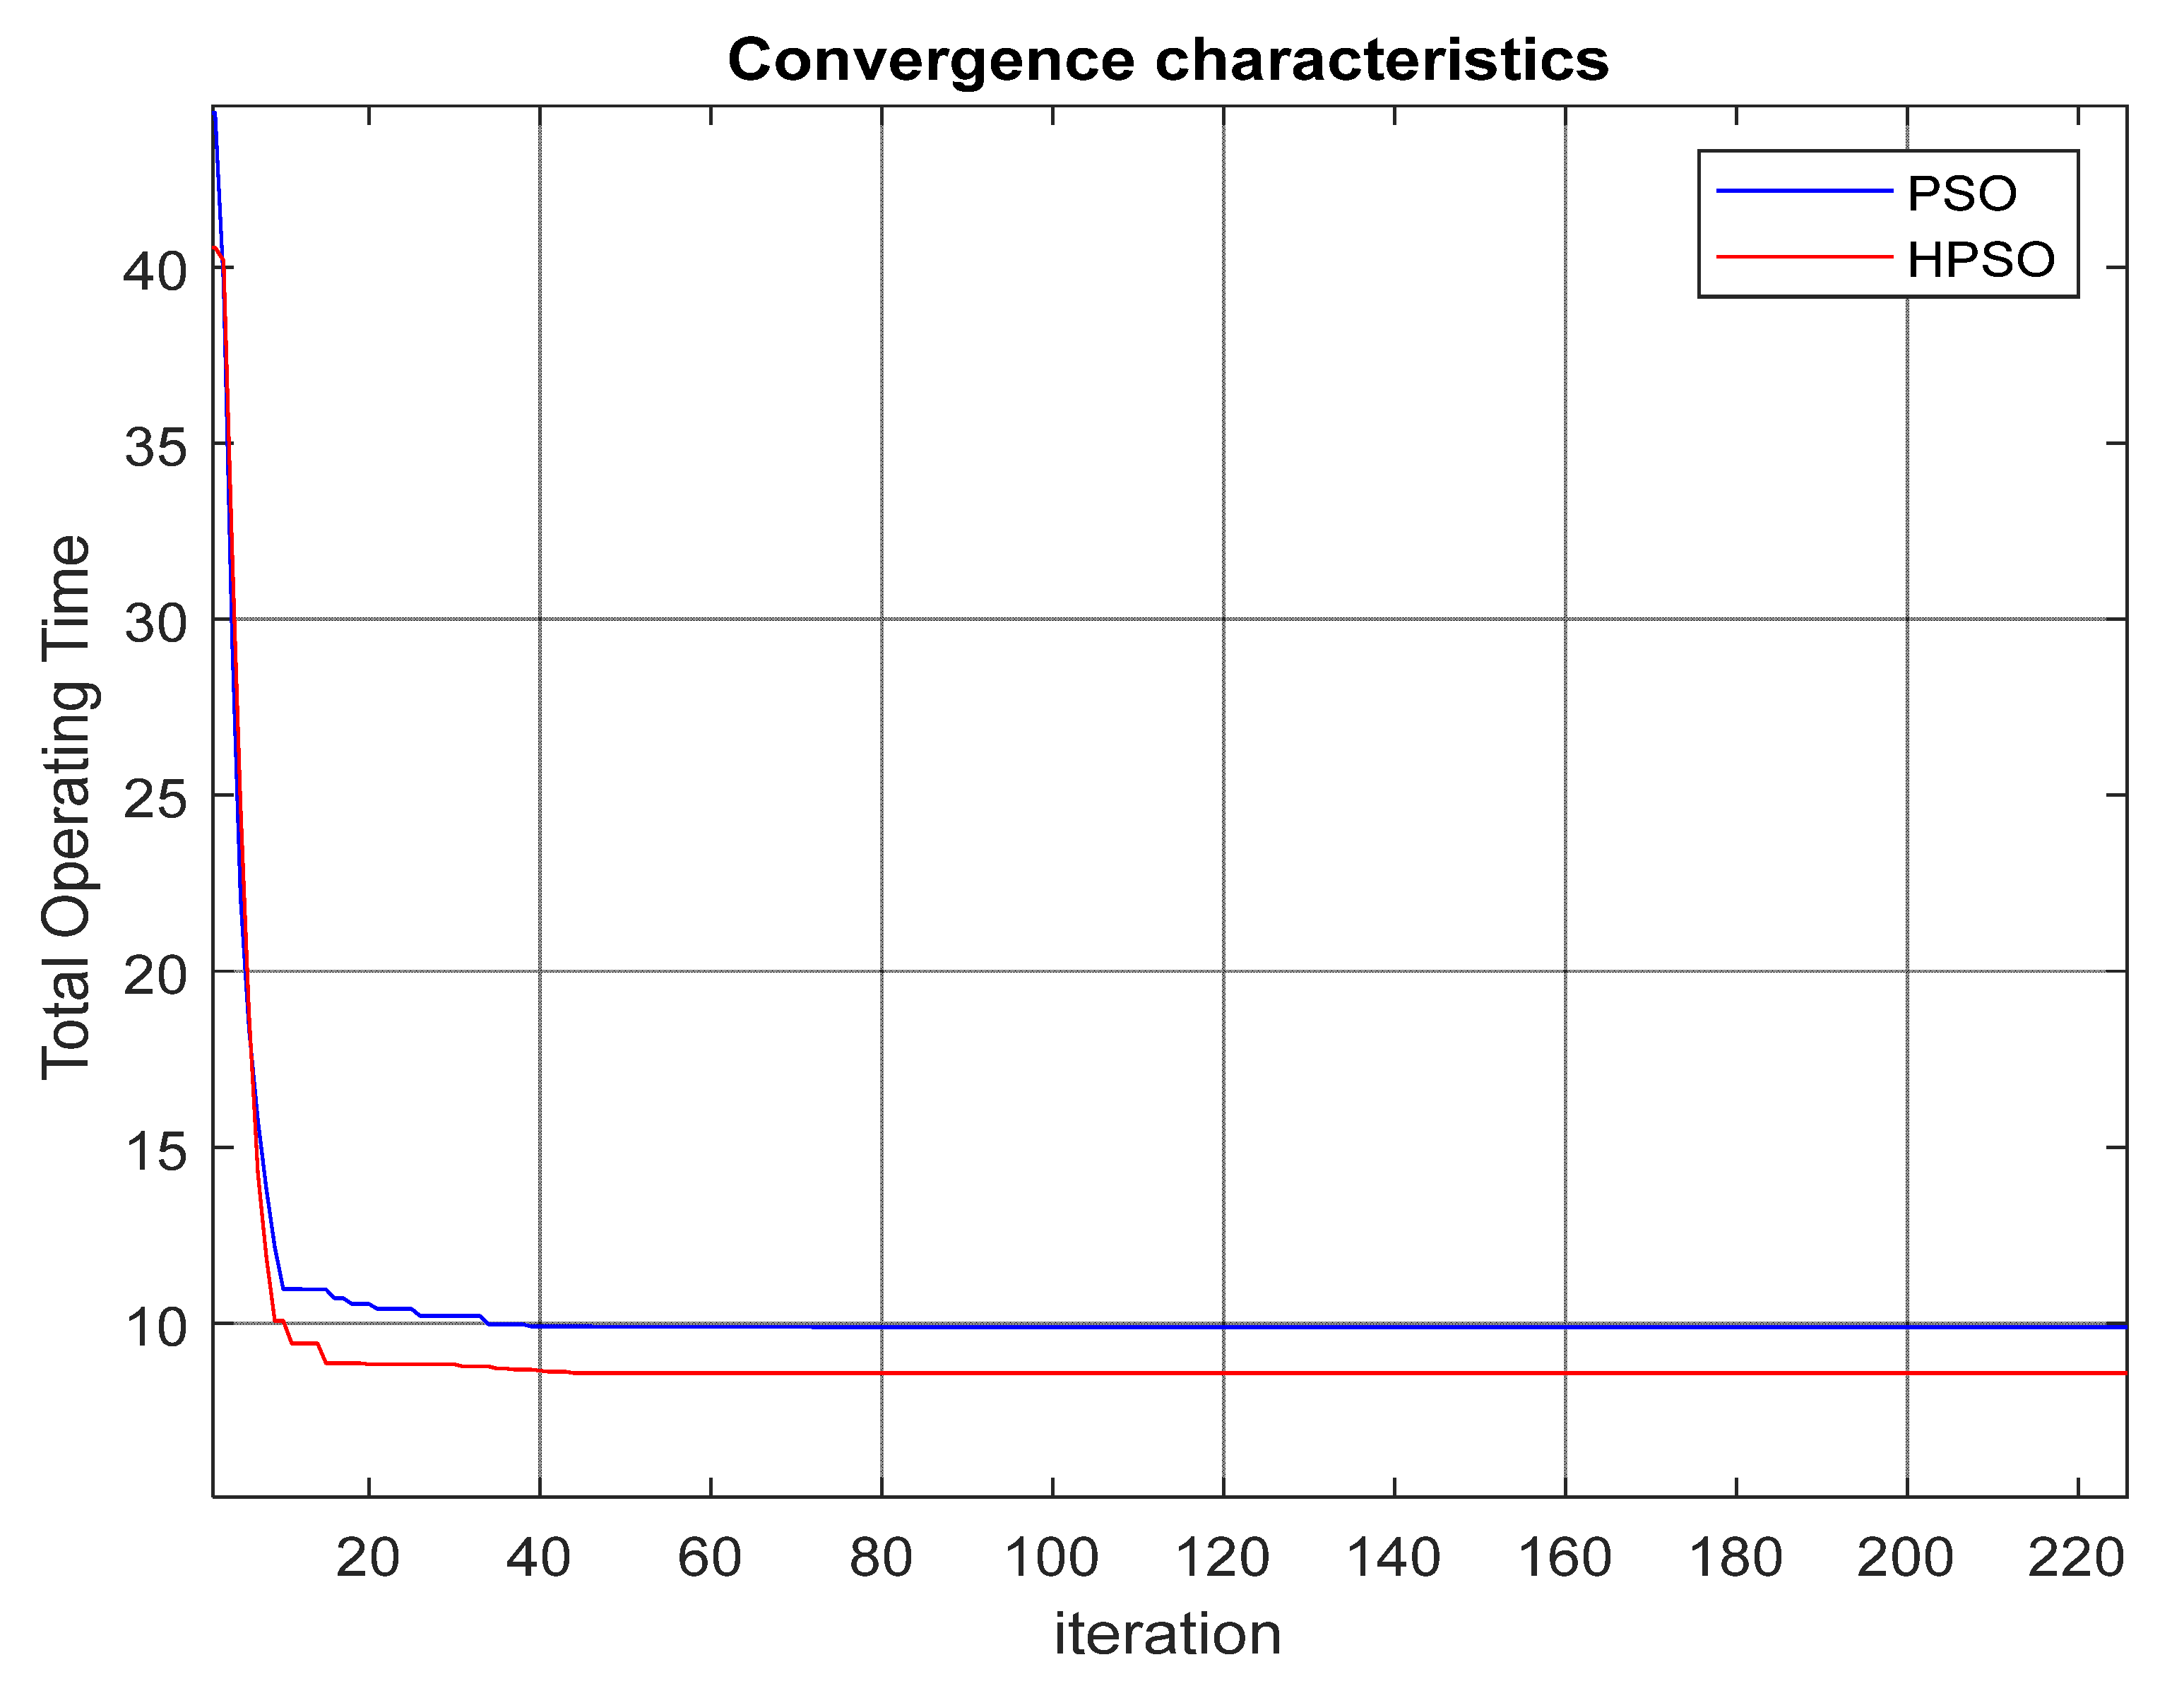
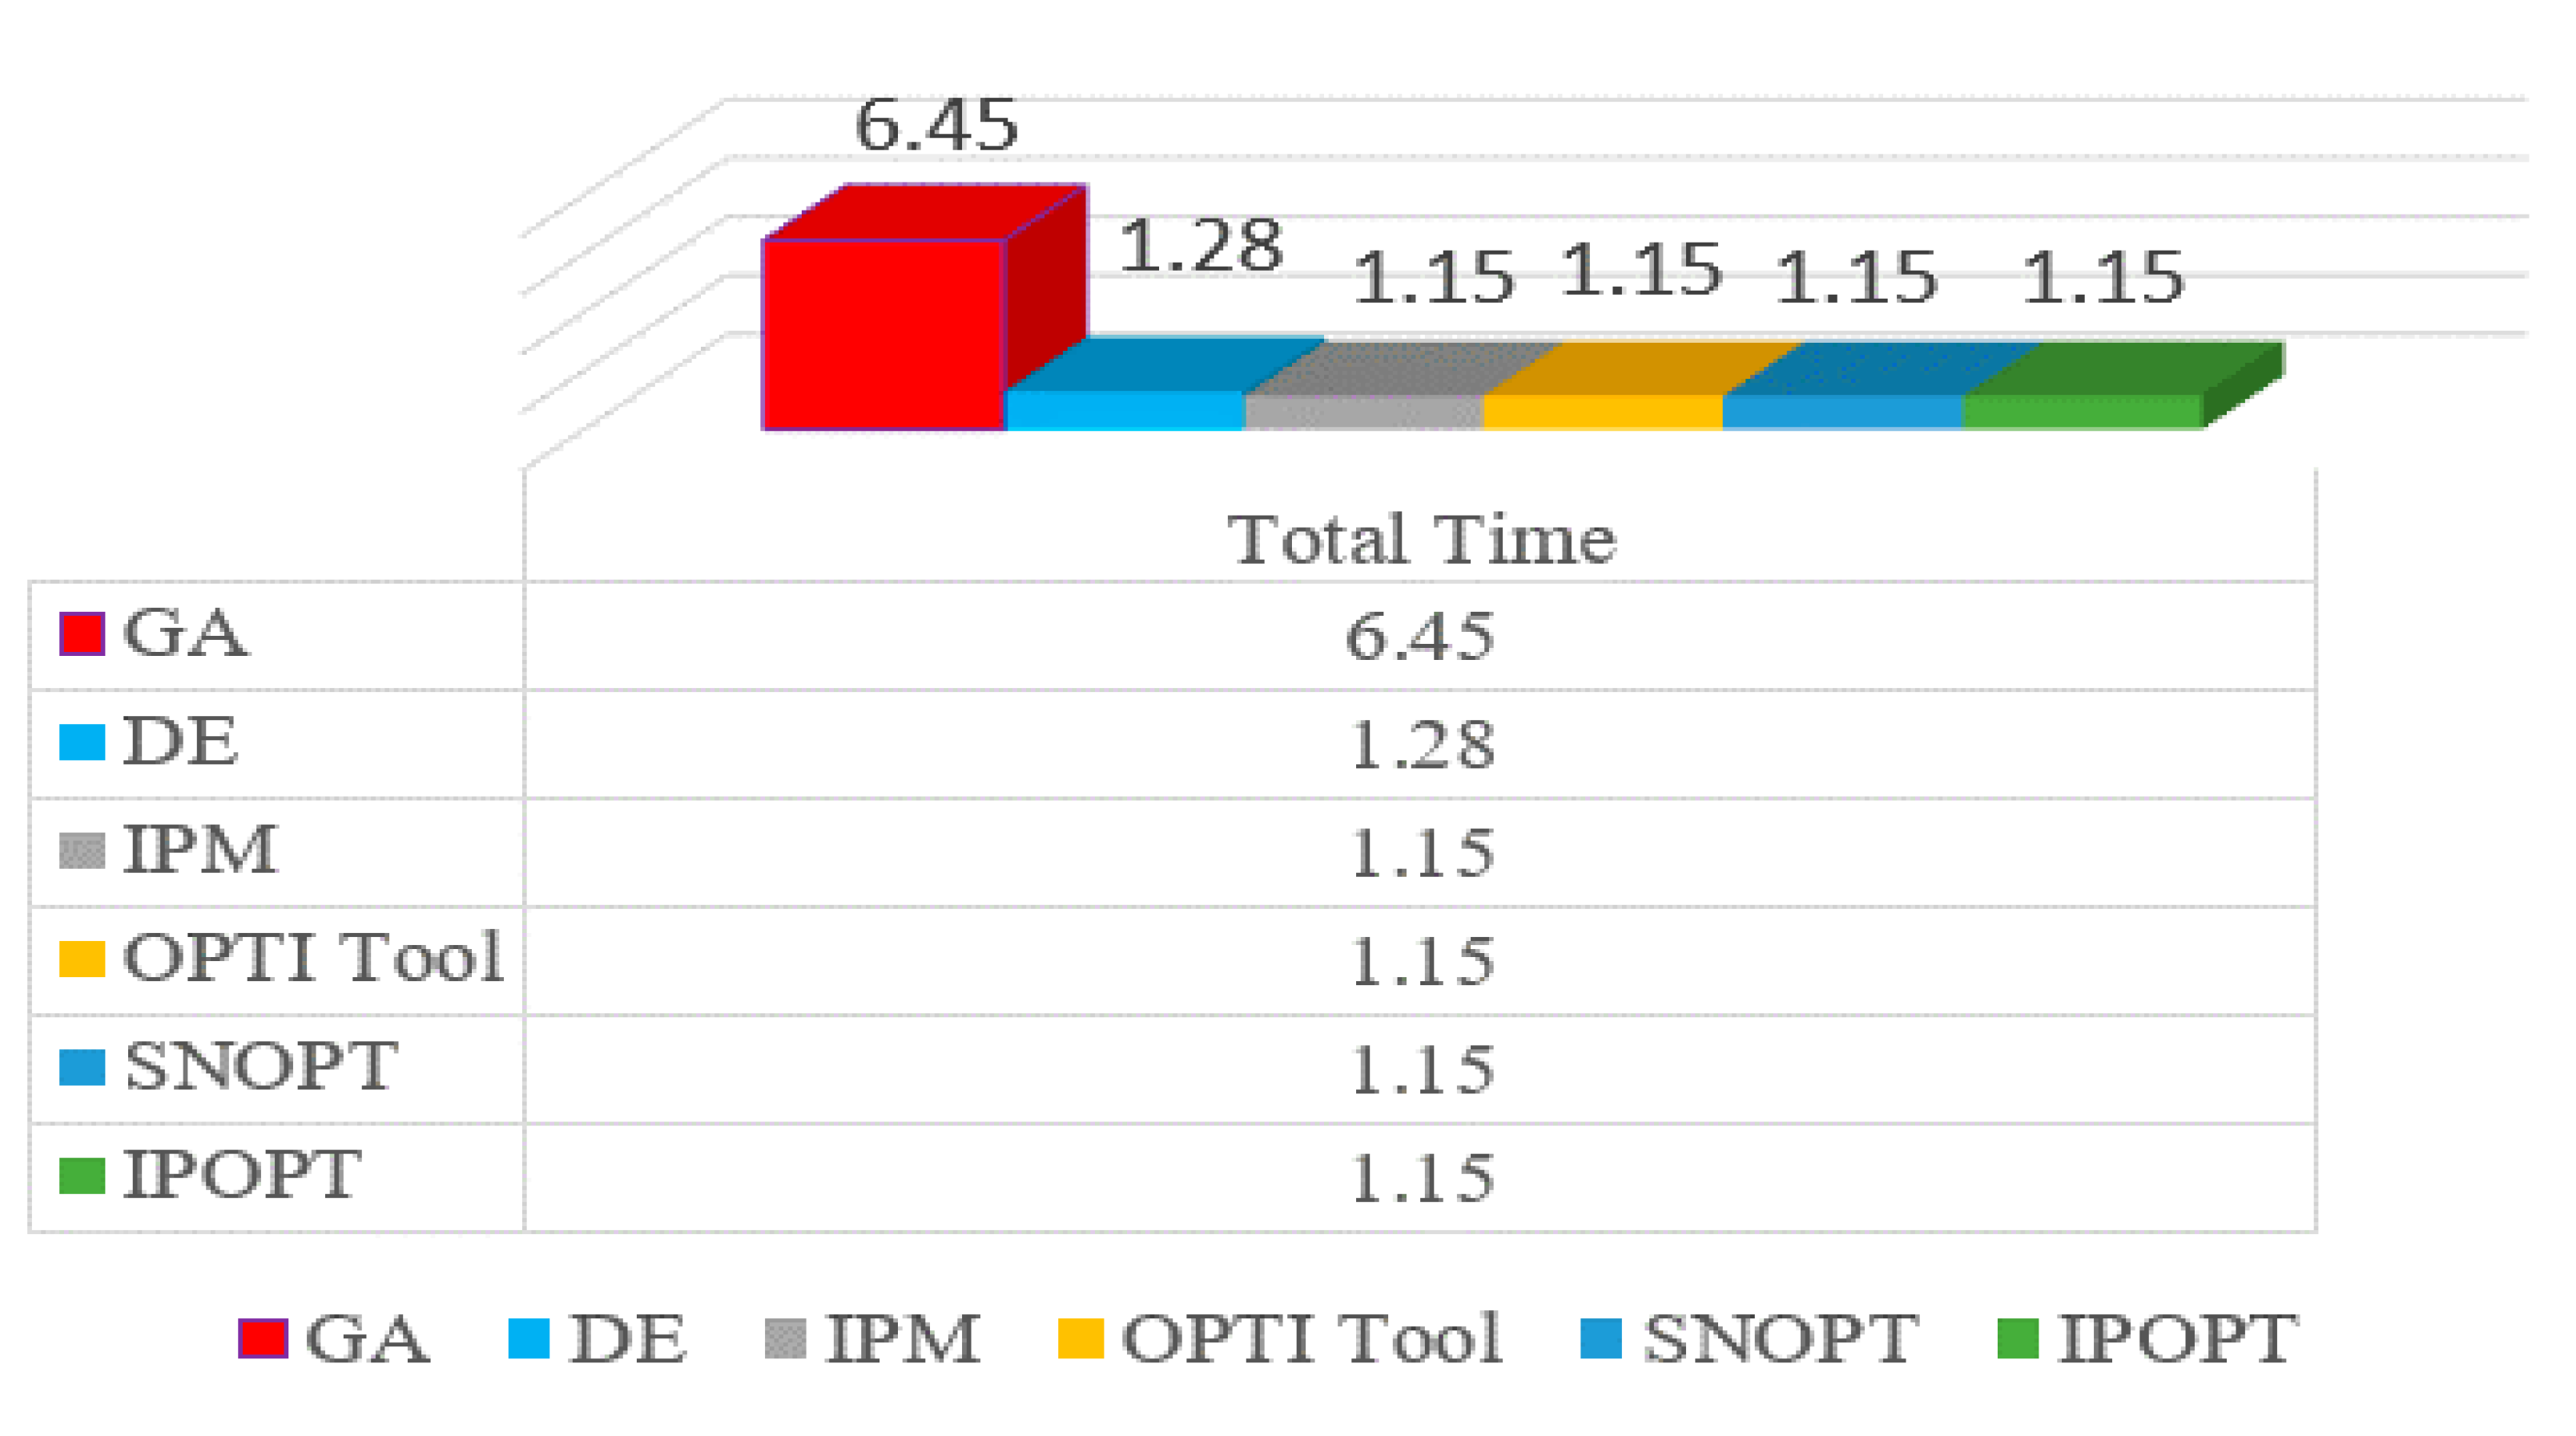
4.3. Results Discussion

The DOPR problem is solved on the IEEE 9-bus and 14-bus test system by using the PSO and HPSO algorithms. The proposed technique’s results are then compared with the evolutionary optimization techniques such as GA [27], MEFO [10], IDE [17], MTALBO [17], TLBO [17], BBO [16], NLP [18], DE [37], IPM [21], OPTI Tool [21], SNOPT [21], and IPOPT [19]. The IEEE 9-bus test system is compared with the metaheuristic techniques such as GA, TLBO, BBO, MATLBO (modified adaptive teaching learning based optimization), MEFO (modified electromagnetic field optimization), and some computer-generated MATLAB simulated techniques such as IDE (integrated development environment), and NLP (Nonlinear Programming). The obtained results confirm that the HPSO has a high detection rate and a degree of convergence when compared to other solutions. The defined algorithm was the best solution for eliminating the problem in the leading overcurrent protection relay in a short operating time. The obtained compared results are shown in Table 4 and the net gain analysis is given in Figure 3. The analysis in terms of the net gain shows that values of 24.04 s, 17.31 s, 51.08 s, 33.33 s, 74.33 s, 20.26 s, and 10.83 s are seen against GA, MEFO, IDE, MATLBO, TLBO, BBO, and NLP, respectively. In terms of percentage, there was a 60.94% improvement against the GA, 50.8% against the MEFO, 78.65% against IDE, 72.12% against MATLBO, 86.14% against TLBO, 57.93% against BBO, and 36.34% against NLP observed. For case 2, the IEEE-14 bus system shows less computational time in Figure 6 and Table 9 tells the comparison results of the objective functions of the different techniques. It is observed that the optimum setting obtained by IPM, OPTI Tool, SNOPT, and IPOPT in MATLAB shows the same result, whereas the metaheuristics GA and DE shows different results. IPM, OPTI Tool, SNOPT, and IPOPT are much faster than GA and DE in solving the protection coordination problem of DOPR but are not faster than the HPSO. The HPSO yields a high net gain over GA, DE, IPM, OPTI Tool, SNOPT, and IPOPT which is 6.45 s, 1.4 s, 1.15 s, 1.15 s, 1.15 s, and 1.15 s, respectively. In this case, a good improvement in performance of 39.80% against GA, 9.89% against DE, 8.98% against IPM, OPTI Tool, SNOPT, and IPOPT was achieved. The IEEE convergence characteristics graphs for the PSO and HPSO for the 9-bus and 14-bus systems are shown in Figure 4 and Figure 7. These characteristics graphs show that convergence is quick and, in a few repetitions, a good solution is achieved.

5. Conclusions

Metaheuristic algorithms such as PSO and the hybridization of PSO algorithms are proposed in this article. To identify the global solution, PSO hybridization is used in conjunction with simulated annealing (SA). After each PSO iteration, SA was employed as a local search operator around selected search agents in the proposed algorithm to discover the best solution in the neighborhood. The optimal coordination issue for a DOPR has been stated as a linear programming problem. For various test systems, DOPR issues are handled using the PSO and HPSO algorithms. The HPSO algorithm’s performance has been determined and tested in a range of IEEE single line power distribution systems, with an analysis of its superiority over published approaches such as GA, TLBO, BBO, MATLBO, IDE, and NLP, whereas the IEEE 14-bus system is compared with the GA, DE, IPM, OPTI Tool, SNOPT, and IPOPT algorithms. The obtained results justify that the proposed technique is better than the other optimization techniques.

Author Contributions

K.H., X.L., A.W., S.K., Y.W. and S.X. contributed equally to the literature review of the directional overcurrent protection relay, then developed the first discussions about the different parameters of the proposed methodology and conducted the simulations and analysis of results together with A.W., A.W. and X.L. guided the investigation and supervised this work. S.K., Y.W. and S.X. gave suggestions and guidance for the research. All authors have read and agreed to the published version of the manuscript.

Funding

National Natural Science Foundation of China (NSFC), under Grant 61771363, funded this research.

Data Availability Statement

The data used to support the finding of this study are included within the article.

Conflicts of Interest

The authors declare no conflict of interest.

References

  1. Blackburn, J. Protective Relaying, Principles and Applications; Marcel Dekker Inc.: New York, NY, USA, 1987. [Google Scholar]
  2. Irfan, M.; Oh, S.; Rhee, S. An Effective Coordination Setting for Directional Overcurrent Relays Using Modified Harris Hawk Optimization. Electronics 2021, 10, 3007. [Google Scholar] [CrossRef]
  3. AbdelHamid, M.; Kamel, S.; MAhmed Korashy, A.; Veliz, M.; Fahd, A.; Mosaad, M. An Adaptive Protection Scheme for Coordination of Distance and Directional Overcurrent Relays in Distribution Systems Based on a Modified School-Based Optimizer. Electronics 2021, 10, 2628. [Google Scholar] [CrossRef]
  4. Bedekar, P.P.; Bhide, S.R. Optimum coordination of overcurrent relay timing using continuous genetic algorithm. Expert Syst. Appl. 2011, 38, 11286–11292. [Google Scholar] [CrossRef]
  5. Habib, K.; Lai, X.; Wadood, A.; Khan, S.; Wang, Y.; Xu, S. Hybridization of PSO for the Optimal Coordination of Directional Overcurrent Protection Relays. Electronics 2022, 11, 180. [Google Scholar] [CrossRef]
  6. Sulaiman, M.; Muhammad, S.; Khan, A. Improved solutions for the optimal coordination of DOCRs using firefly algorithm. Complexity 2018, 2018, 7039790. [Google Scholar] [CrossRef] [Green Version]
  7. Khurshaid, T.; Wadood, A.; Farkoush, S.G.; Kim, C.H.; Yu, J.; Rhee, S.B. Improved firefly algorithm for the optimal coordination of directional overcurrent relays. IEEE Access 2019, 7, 78503–78514. [Google Scholar] [CrossRef]
  8. Wadood, A.; Khurshaid, T.; Farkoush, S.G.; Yu, J.; Kim, C.H.; Rhee, S.B. Nature-inspired whale optimization algorithm for optimal coordination of directional overcurrent relays in power systems. Energies 2019, 12, 2297. [Google Scholar] [CrossRef] [Green Version]
  9. Wadood, A.; Farkoush, S.G.; Khurshaid, T.; Yu, J.T.; Kim, C.H.; Rhee, S.B. Application of the jaya algorithm in solving the problem of the optimal coordination of overcurrent relays in single-and multi-loop distribution systems. Complexity 2019, 2019, 5876318. [Google Scholar] [CrossRef]
  10. Bouchekara, H.R.E.H.; Zellagui, M.; Abido, M.A. Optimal coordination of directional overcurrent relays using a modified electromagnetic field optimization algorithm. Appl. Soft Comput. 2017, 54, 267–283. [Google Scholar] [CrossRef]
  11. Singh, M.; Panigrahi, B.; Abhyankar, A. Optimal coordination of directional over-current relays using teaching learning-based optimization (TLBO) algorithm. Int. J. Electr. Power Energy Syst. 2013, 50, 33–41. [Google Scholar] [CrossRef]
  12. Wadood, A.; Farkoush, S.G.; Khurshaid, T.; Kim, C.H.; Yu, J.; Geem, Z.W. An optimized protection coordination scheme for the optimal coordination of overcurrent relays using a nature-inspired root tree algorithm. Appl. Sci. 2018, 8, 1664. [Google Scholar] [CrossRef] [Green Version]
  13. Yang, H.; Wen, F.; Ledwich, G. Optimal coordination of overcurrent relays in distribution systems with distributed generators based on differential evolution algorithm. Int. Trans. Electr. Energy Syst. 2013, 23, 1–12. [Google Scholar] [CrossRef]
  14. Chelliah, T.R.; Thangaraj, R.; Allamsetty, S.; Pant, M. Coordination of directional overcurrent relays using opposition based chaotic differential evolution algorithm. Int. J. Electr. Power Energy Syst. 2014, 55, 341–350. [Google Scholar] [CrossRef]
  15. Jamal, N.; Sulaiman, M.; Aliman, O.; Mustaffa, Z.; Mustafa, M. Improved Grey Wolf Optimization Algorithm for Overcurrent Relays Coordination. In Proceedings of the 2018 9th IEEE Control and System Graduate Research Colloquium (ICSGRC), Shah Alam, Malaysia, 3–4 August 2018. [Google Scholar]
  16. Amraee, T. Coordination of directional overcurrent relays using seeker algorithm. IEEE Trans. Power Deliv. 2012, 27, 1415–1422. [Google Scholar] [CrossRef]
  17. Kalage, A.A.; Ghawghawe, N.D. Optimum coordination of directional overcurrent relays using modified adaptive teaching learning based optimization algorithm. Intell. Ind. Syst. 2016, 2, 55–71. [Google Scholar] [CrossRef] [Green Version]
  18. Noghabi, A.S.; Sadeh, J.; Mashhadi, H.R. Considering different network topologies in optimal overcurrent relay coordination using a hybrid GA. IEEE Trans. Power Deliv. 2009, 24, 1857–1863. [Google Scholar] [CrossRef]
  19. Nabab, M. Adaptive Protection Coordination Scheme Using Numerical Directional Overcurrent Relays. IEEE Trans. Ind. Inform. 2019, 15, 64–73. [Google Scholar]
  20. AMPL (A Modeling Language for Mathematical Programming). 2014. Available online: www.ampl.com (accessed on 1 February 2022).
  21. GAMS (General Algebraic Modelling System). 2017. Available online: www.gams.com (accessed on 1 March 2022).
  22. Park, J.B.; Lee, K.S.; Shin, J.R.; Lee, K.Y. A Particle swarm optimization for economic dispatch with non-smooth cost functions. IEEE Trans. Power Syst. 2005, 20, 34–42. [Google Scholar] [CrossRef]
  23. Razavi, F.; Abyaneh, H.A.; Al-Dabbagh, M.; Mohammadi, R.; Torkaman, H. A new comprehensive genetic algorithm method for optimal overcurrent relays coordination. Electr. Power Syst. Res. 2008, 78, 713–720. [Google Scholar] [CrossRef]
  24. Destina, S.; Margo, P.; Purnomo, M.; Daeng, R. Adaptive DOCR coordination in the loop distribution system with distributed generation using firefly algorithm-artificial neural network. In Proceedings of the International Conference on Information and Communication Technology, Kuala Lumpur, Malaysia, 23–25 July 2018; pp. 579–584. [Google Scholar]
  25. Yu, J.; Kim, C.H.; Rhee, S.B. Oppositional Jaya Algorithm With Distance-Adaptive Coefficient in Solving Directional Over Current Relays Coordination Problem. IEEE Access 2019, 7, 150742. [Google Scholar] [CrossRef]
  26. Albasri, F.A.; Alroomi, A.R.; Talaq, J.H. Optimal coordination of directional overcurrent relays using biogeography-based optimization algorithms. IEEE Trans. Power Deliv. 2015, 30, 1810–1820. [Google Scholar] [CrossRef]
  27. Bedekar, P.P.; Bhide, S.R. Optimum coordination of directional overcurrent relays using the hybrid GA-NLP approach. IEEE Trans. Power Deliv. 2011, 26, 109–119. [Google Scholar] [CrossRef]
  28. Yang, M.T.; Liu, A. Applying hybrid PSO to optimize directional over current relay coordination in different network topologies. J. Appl. Math. 2013, 2013, 20131–20139. [Google Scholar] [CrossRef]
  29. Idoumghar, L.; Melkemi, M.; Schott, R.; Aouad, M.I. Hybrid PSO-SA type algorithms for multimodal function optimization and reducing energy consumption in embedded systems. Appl. Comput. Intell. Soft Comput. 2011, 2011, 138078. [Google Scholar] [CrossRef] [Green Version]
  30. Sadati, N.; Zamani, M.; Mahdavian, H.R.F. Hybrid particle swarm-based-simulated annealing optimization techniques. In Proceedings of the IECON 2006—32nd Annual Conference on IEEE Industrial Electronics, Paris, France, 6–10 November 2006. [Google Scholar]
  31. Abhyaneh, H.A.; Al-Dabbagh, M.; Karegar, H.K.; Sadeghi, S.H.H.; Khan, R.A.J. A new optimal approach for coordination of directional overcurrent relays in interconnected power system. IEEE Trans. Power Deliv. 2003, 18, 430–435. [Google Scholar] [CrossRef]
  32. Abdelaziz, A.Y.; Talaat, H.E.A.; Nosseir, A.I.; Hajjar, A.A. An adaptive protection scheme for optimal coordination of overcurrent relays. Electr. Power Syst. Res. 2002, 61, 1–9. [Google Scholar] [CrossRef]
  33. Urdaneta, A.J.; Perez, L.G.; Restrepo, H. Optimal coordination of directional overcurrent relays considering dynamic changes in the network topology. IEEE Trans. Power Deliv. 1997, 12, 1458–1464. [Google Scholar] [CrossRef]
  34. Mansour, M.M.; Mekhamer, S.F.; El-Kharbawe, N.E.-S. A modified particle swarm optimizer for the coordination of directional overcurrent relays. IEEE Trans. Power Deliv. 2007, 22, 1400–1410. [Google Scholar] [CrossRef]
  35. Sevkli, M.; Guner, A.R. A continuous particle swarm optimization algorithm for uncapacitated facility location problem. In Ant Colony Optimization and Swarm Intelligence; Springer: Berlin/Heidelberg, Germany, 2006. [Google Scholar]
  36. Kirkpatrick, S.; Gellat, C.D.; Vecchi, M.P. Optimization by Simulated Annealing. Science 1983, 220, 671–680. [Google Scholar] [CrossRef] [PubMed]
  37. Christie, R. Power System Test Cases. 1993. Available online: www.ee.washington.edu/research/pstca (accessed on 1 March 2022).
Figure 1. Flow chart of the Proposed Technique.
Energies 15 03076 g001
Figure 2. Single line diagram of IEEE 9-bus system.
Energies 15 03076 g002
Figure 3. Analysis of net gain for the IEEE 9-Bus system.
Energies 15 03076 g003
Figure 4. PSO and HPSO convergence characteristics of IEEE 9-Bus system.
Energies 15 03076 g004
Figure 5. Single line diagram of IEEE 14-bus system.
Energies 15 03076 g005
Figure 6. Analysis of net gain for the IEEE 14-Bus system.
Energies 15 03076 g006
Figure 7. PSO and HPSO convergence characteristics of IEEE 14-Bus system.
Energies 15 03076 g007
Table 1. Relationships between primary and backup relays at different fault points.
Faulty PointPrimary RelayBackup RelayFaulty PointPrimary RelayBackup Relay
L1115, 17L71311, 21
241416, 19
L231L81513, 19
46162, 17
L353L917NB
68, 23182, 15
L475, 23L1019NB
8102013, 16
L597L1121NB
10122211, 14
L6119L1223NB
1214, 21245, 8
NB means no backup relay.
Table 2. Primary and backup relays fault currents of IEEE 9-bus system.
Relays Primary   Relay   ( I f p ) Backup   Relay   ( I f b ) Relays Primary   Relay   ( I f p ) Backup   Relay   ( I f b )
R14863.61361.6R133684.51031.7
R21634.4653.6R144172.51168.3
R32811.41124.4R154172.51168.3
R42610.51044.2R163684.51031.7
R51778.0711.2R177611.21293.9
R64378.51226.0R182271.71953.7
R74378.51226.0R197435.81264.1
R81778.0711.2R202624.22256.8
R92610.51044.2R217611.21293.9
R102811.41124.4R222271.71953.7
R111634.4653.6R237914.71345.5
R122811.4787.2R241665.51432.3
Table 3. Optimized TMS of PSO and HPSO of IEEE 9-Bus system.
TMSPSOHPSOTMSPSOHPSO
Relay 10.31420.1000Relay 130.10000.1000
Relay 20.10000.1000Relay 140.10000.1000
Relay 30.10000.2168Relay 150.10000.1000
Relay 40.10000.1000Relay 160.10000.1000
Relay 50.10660.1000Relay 170.36480.1000
Relay 60.43620.1081Relay 180.10000.1000
Relay 70.24230.3137Relay 190.10000.1041
Relay 80.29000.1000Relay 200.10000.1000
Relay 90.10000.1000Relay 210.16160.1526
Relay 100.10000.1000Relay 220.10000.2499
Relay 110.10000.2419Relay 230.10000.1000
Relay 120.10000.1000Relay 240.20540.1000
Objective Function (F)9.88948.5732
Table 4. Comparison of PSO and HPSO with other techniques.
Optimization TechniquesObjective Function (F)
GA [27]32.6058
MEFO [10]25.884
IDE [17]59.6471
MATLBO [17]41.9041
TLBO [17]82.9012
BBO [16]28.8348
NLP [18]19.4041
PSO9.8894
HPSO8.5732
Table 5. Operating time of individual relays for the optimized values of the TMS.
No. of RelaysOperating Time of Each Relay (s)No. of RelaysOperating Time of Each Relay (s)
PSOHPSOPSOHPSO
Relay 10.71920.2289Relay 130.25320.2532
Relay 20.36590.3659Relay 140.24180.2418
Relay 30.28230.6121Relay 150.24180.2418
Relay 40.29150.2915Relay 160.25320.2532
Relay 50.37300.3499Relay 170.72230.1980
Relay 61.03630.2568Relay 180.31020.3102
Relay 70.57560.7452Relay 190.19940.2076
Relay 80.94110.3499Relay 200.29080.2908
Relay 90.29150.2915Relay 210.32000.3022
Relay 100.28230.2823Relay 220.31020.7753
Relay 110.36590.8850Relay 230.19570.1957
Relay 120.28230.2823Relay 240.74390.3622
Table 6. CT ratio between the relays for the IEEE 14-bus system.
RelayCT RatioRelayCT Ratio
18000:572500:5
2, 4, 8, 10, 13, 24400:512, 36, 392000:5
3, 143500:520, 35, 381000:5
5, 254000:516, 18800:5
9, 19, 23, 27, 311600:517, 26, 34500:5
15, 30, 331200:522, 32, 37, 40600:5
6200:511250:5
213000:52850:5
295000:5
Table 7. Relationships between primary and backup relays at different fault points of IEEE 14-bus system.
Faulty PointPrimary RelayBackup RelayFaulty PointPrimary RelayBackup Relay
L114L112119, 24, 26
26, 8, 102235
L232L122319, 22, 26
49, 13, 202438
L351, 8, 10L132519, 22, 24
6122637, 40
L471, 6, 10L142715, 30
811, 14, 16, 1828-
L591, 6, 8L152915, 28
103, 13, 203017, 32, 34
L6115L163117, 29, 34
127, 14, 16, 183236
L7137, 11, 16, 18L173317, 29, 32
143, 9, 203439
L8157, 11, 14, 18L183531
1628, 303621
L9177, 11, 14, 16L193723
1829, 32, 343825, 40
L10193, 9, 13L203925, 37
2022, 24, 264033
Table 8. Primary and backup relays fault currents of IEEE 14-bus system.
Relays Primary   Relay   ( I f p ) Backup   Relay   ( I f b ) Relays Primary   Relay   ( I f p ) Backup   Relay   ( I f b )
R111,6503920R21564434
R242601980R2219301310
R373101280R231200806
R43920750R2418701130
R512,4001370R251430449
R63830654R2646401230
R773301270R272030638
R83880723R28633634
R932602080R294720499
R1031101990R301810179
R1171801380R312060783
R123130845R32547280
R1332801120R33783368
R1440301250R341390547
R1546101110R351480572
R161490560R36781284
R172210955R3757251
R18725388R382530781
R19955564R3924001110
R201310725R40654191
Table 9. Optimized TMS of PSO and HPSO of IEEE 14-Bus system.
TMSPSOHPSOTMSPSOHPSO
Relay 10.24920.1000Relay 210.10000.1000
Relay 20.10000.1000Relay 220.10000.1578
Relay 30.52500.1000Relay 230.10000.1000
Relay 40.10000.1000Relay 240.29580.1000
Relay 50.10000.1000Relay 250.10000.2603
Relay 60.22040.1000Relay 260.98510.1000
Relay 70.30040.1000Relay 270.10000.1530
Relay 80.38940.1000Relay 280.10000.1000
Relay 90.10000.1000Relay 290.56770.1000
Relay 100.25610.1000Relay 300.10000.2420
Relay 110.44370.1000Relay 310.10000.1500
Relay 120.26350.1000Relay 320.10000.1000
Relay 130.10000.1000Relay 330.10000.1591
Relay 140.30720.1002Relay 340.10000.1000
Relay 150.10000.1000Relay 350.10000.1000
Relay 160.10000.1000Relay 360.10000.1000
Relay 170.10000.1000Relay 370.10000.2000
Relay 180.10000.1000Relay 380.10000.1000
Relay 190.10000.1000Relay 390.10000.1000
Relay 200.10000.1000Relay 400.10000.2868
Objective Function (F)17.275713.2817
Table 10. Operating time of individual relays for the optimized values of the TMS.
No. of RelaysOperating Time of Each Relay (s)No. of RelaysOperating Time of Each Relay (s)
PSOHPSOPSOHPSO
Relay 10.63400.2544Relay 211.10191.1019
Relay 20.14310.1431Relay 220.19480.3073
Relay 31.17290.2234Relay 230.34050.3405
Relay 40.14580.1458Relay 240.17520.1752
Relay 50.19690.1969Relay 250.54251.4121
Relay 60.27840.1263Relay 261.45420.1476
Relay 70.60170.2003Relay 270.26860.4109
Relay 80.56900.1461Relay 280.13770.1377
Relay 90.22530.2253Relay 291.73070.3049
Relay 100.39410.1539Relay 300.25100.6075
Relay 110.51830.1168Relay 310.26700.4005
Relay 120.65230.2476Relay 320.30980.3098
Relay 130.15200.1520Relay 330.36620.5827
Relay 140.85870.2801Relay 340.20360.2036
Relay 150.18490.1849Relay 350.25280.2528
Relay 160.23240.2324Relay 360.50690.5069
Relay 170.17780.1778Relay 370.30350.6070
Relay 180.31060.3106Relay 380.20970.2097
Relay 190.38490.3849Relay 390.27480.2748
Relay 200.26520.2652Relay 400.28610.8205
Table 11. Comparison of PSO and HPSO with other techniques.
TechniqueObjective Function (F)
GA [37]19.7349
DE [37]14.5620
IPM [21]14.4341
OPTI Tool [21]14.4341
SNOPT [21]14.4341
IPOPT [19]14.4341
PSO17.2757
HPSO13.2817
Publisher’s Note: MDPI stays neutral with regard to jurisdictional claims in published maps and institutional affiliations.

