Article

Optimal Allocation of Directional Relay for Efficient Energy Optimization in a Radial Distribution System

1
Department of Electrical Engineering, Yeungnam University, 280 Daehak-ro, Gyeongsan 38541, Korea
2
Department of Electrical Engineering, Air University Islamabad Kamra Campus, Kamra 43570, Pakistan
*
Author to whom correspondence should be addressed.
Energies 2022, 15(13), 4709; https://doi.org/10.3390/en15134709
Submission received: 12 May 2022 / Revised: 15 June 2022 / Accepted: 23 June 2022 / Published: 27 June 2022
(This article belongs to the Special Issue Power System Simulation and Modeling)

Abstract

:
The optimal allocation of protective devices is a serious issue in an electrical power system; in order to reduce the possibility of faults, the protection devices should be optimally placed. The paper presents a continuous genetic algorithm (CGA) for the optimal allocation of directional relays for the efficient energy minimization in a radial distribution system (DG). The algorithm is flexible to use for the changes and improvements in the optimal location for a DG unit and can optimize the energy consumption in the radial distribution system. The proposed algorithm has been implemented on IEEE 33 and 69-bus system using MATLAB (R2014b, MathWorks). Low energy consumption is a common design objective in an energy-constrained distribution system. Engineers, power utilities, and network operators can profit from the proposed methodology to enhance the use of DG in distribution networks.

1. Introduction

In electrical power distribution planning, the key goal of operation and planning is to fulfil the power requirement and system load as carefully as possible with a sensible declaration of quality and continuity. The highlights of sensibly low-rate electrical vitality at a high rate of consistency are repeatedly in direct clash as a result of giving a more elevated amount of reliability will cost utilities more in capital and operational uses. This has developed a validation to optimize the cost and reliability [1]. In an electrical distribution network, the ideal arrangement of protective devices and switches permits better activity and enhances the reliability of the system [2,3,4,5]. In [2], GA was used to find the placement and type of the protective devices on a distribution system. In [3], a novel algorithm was used to minimize the customer interruption costs by the optimal placements of automated feeder and tie switches. In [4,5], different optimization techniques were used to conclude the optimal placement and number of protective devices and switches, taking into account the maintenance number, outages, and reserves cost. In [6], the modified discrete particle swarm algorithm was used for optimum amount and placement of different switches, taking into consideration the rate of automation devices and elongated tenure disruptions. In [7], combinatory heuristic optimization was used to find the decay of the total mechanization issue with numerous kinds of computerization gadgets into various basic sub-issues with one sort of device, which creates a set of heuristic rules to find the placement of specific equipment alongside the feeders considering the rate and cost of automation devices as well as interruption cost. In [8,9,10], different multi objective optimization was solved for the designed problem of electrical distribution system planning and operation without routing the primary feeder. In [11], a different set of rules was defined to split the radial distribution system into smaller parts to avoid complicating the system for automation scheduling issues. A mixed integer linear programming is seen in [12], determining the optimal system automation consequence while taking into consideration of various kinds of protection devices. In [13], mixed integer linear programming was suggested for an islanding operation of DGs in a radial distribution system with temporary and long-term disruptions. In [14], a mixed integer nonlinear programming method was called for the optimum amount and location of sectionalizing devices (fuses and switches) with an islanding operation of DGs in a radial distribution system. In [15], an ant colony optimization algorithm was used to find the optimal location of protective devices. In [16], different improved solutions were proposed for finding the optimum number, placement, and type of automation devices. The majority of the presented techniques rely on heuristic and metaheuristic calculations that do not guarantee the global optimality of the acquired outcomes, such as the quality of the obtained solutions [17]. To solve this problem, a CGA is examined in this study to find the optimal allocation of relays in IEEE-33 and 69-bus system. The optimal placement of directional relays considered both the distance of relay node placement and energy for performing optimization [18]. Based on the distance of relay node placement, the energy has been estimated when passed through the relays. For this purpose, chromosomes are assigned based on the number of lines and generate next generation based on the optimal value [19,20,21,22]. Finally, the optimal value of the location has been updated and the optimized energy path analyzed. The optimal placement of relay achieved minimum energy consumption and reduced the fault levels which result in reducing the damages and increase the lifetime of the electrical distribution system.
GA has its precision limited by the binary representation of variables. CGA, where the variables are represented by floating point numbers, allows representation of the machine precision. Furthermore, the CGA requires less storage than the binary GA because a single floating point number represents the variable. The CGA is inherently faster than binary GA, because the chromosomes do not have to be decoded [23]. It was discovered that a genetic algorithm and a continuous genetic algorithm can be used to estimate parameters from a dynamical model by selecting an appropriate mutation rate. The suitable range for mutation rate in a continuous genetic algorithm is larger than in a genetic algorithm.
This research contributes to this effort by presenting a decision-making technique for determining the optimal allocation of Directional overcurrent Relay for Efficient Energy Optimization in a Radial Distribution System size. The suggested method is simple, adaptable to adjustments and alterations, and capable of supporting any DG unit. It was implemented in MATLAB (R2014b, MathWorks, Gyeongsan, South Korea). The simulation technique has been tested on the IEEE 33 and 69-bus. The suggested algorithm can benefit engineers, power utilities, and network operators to increase the use of DG in distribution networks.

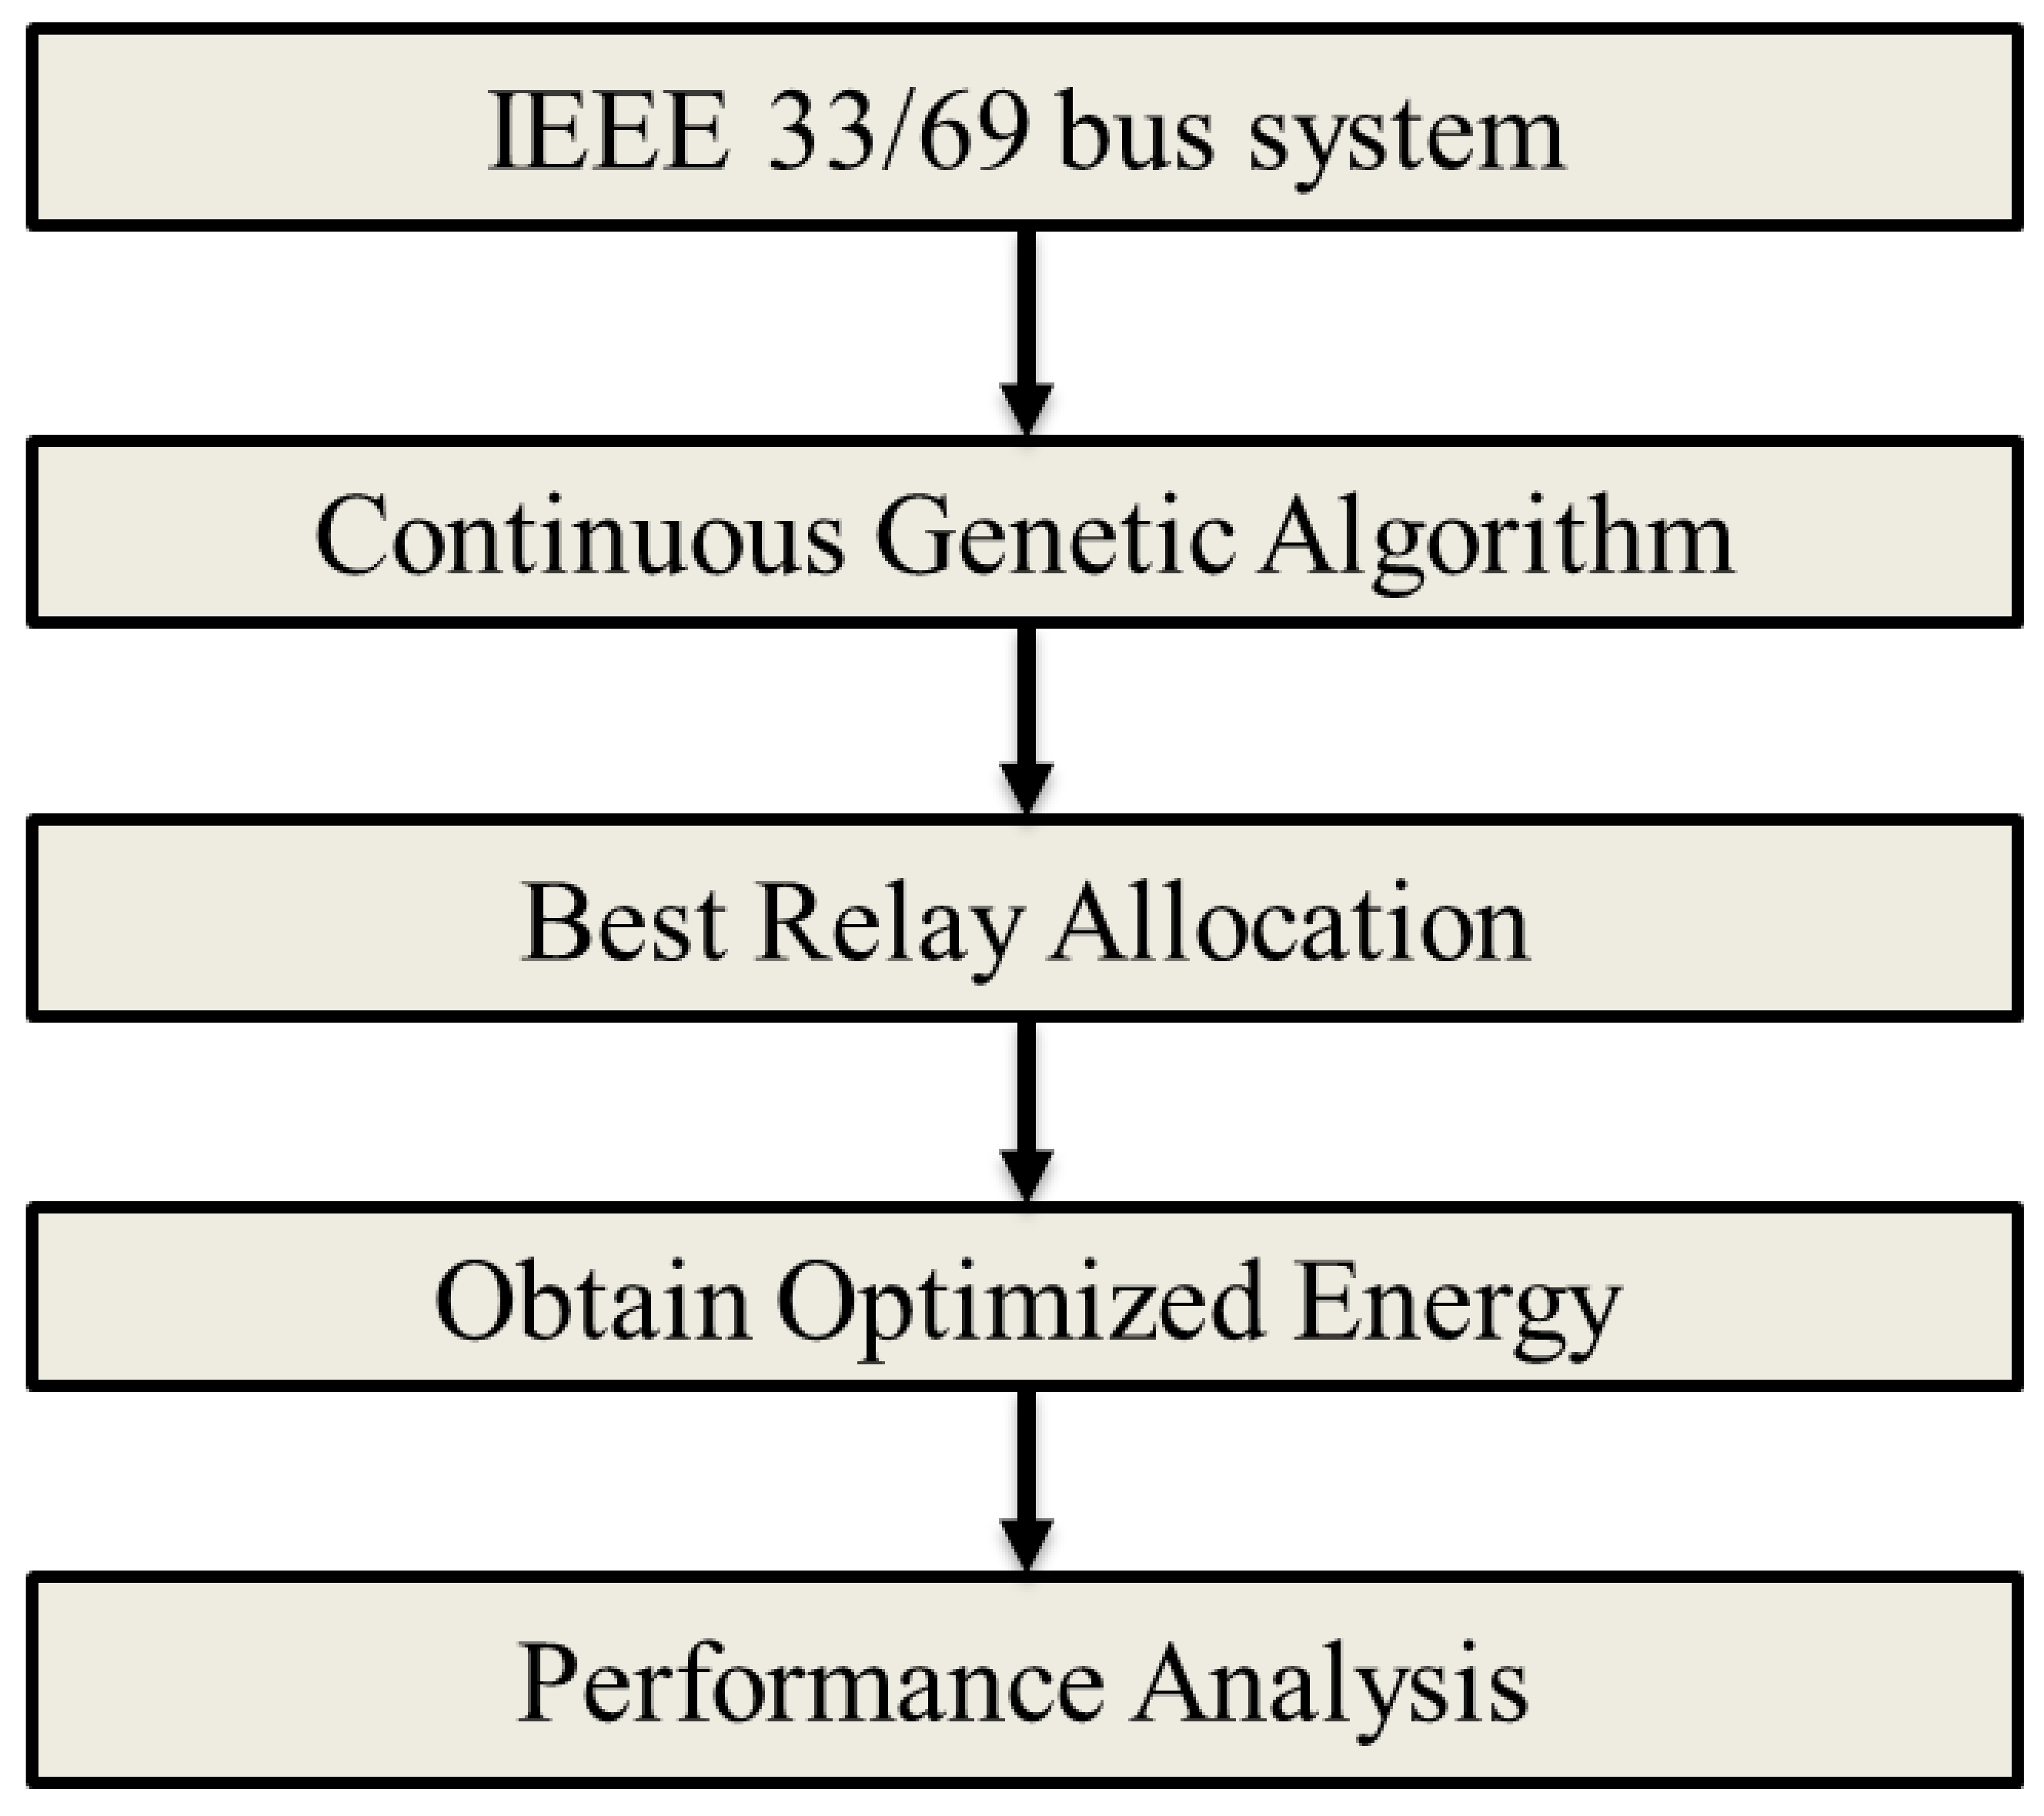
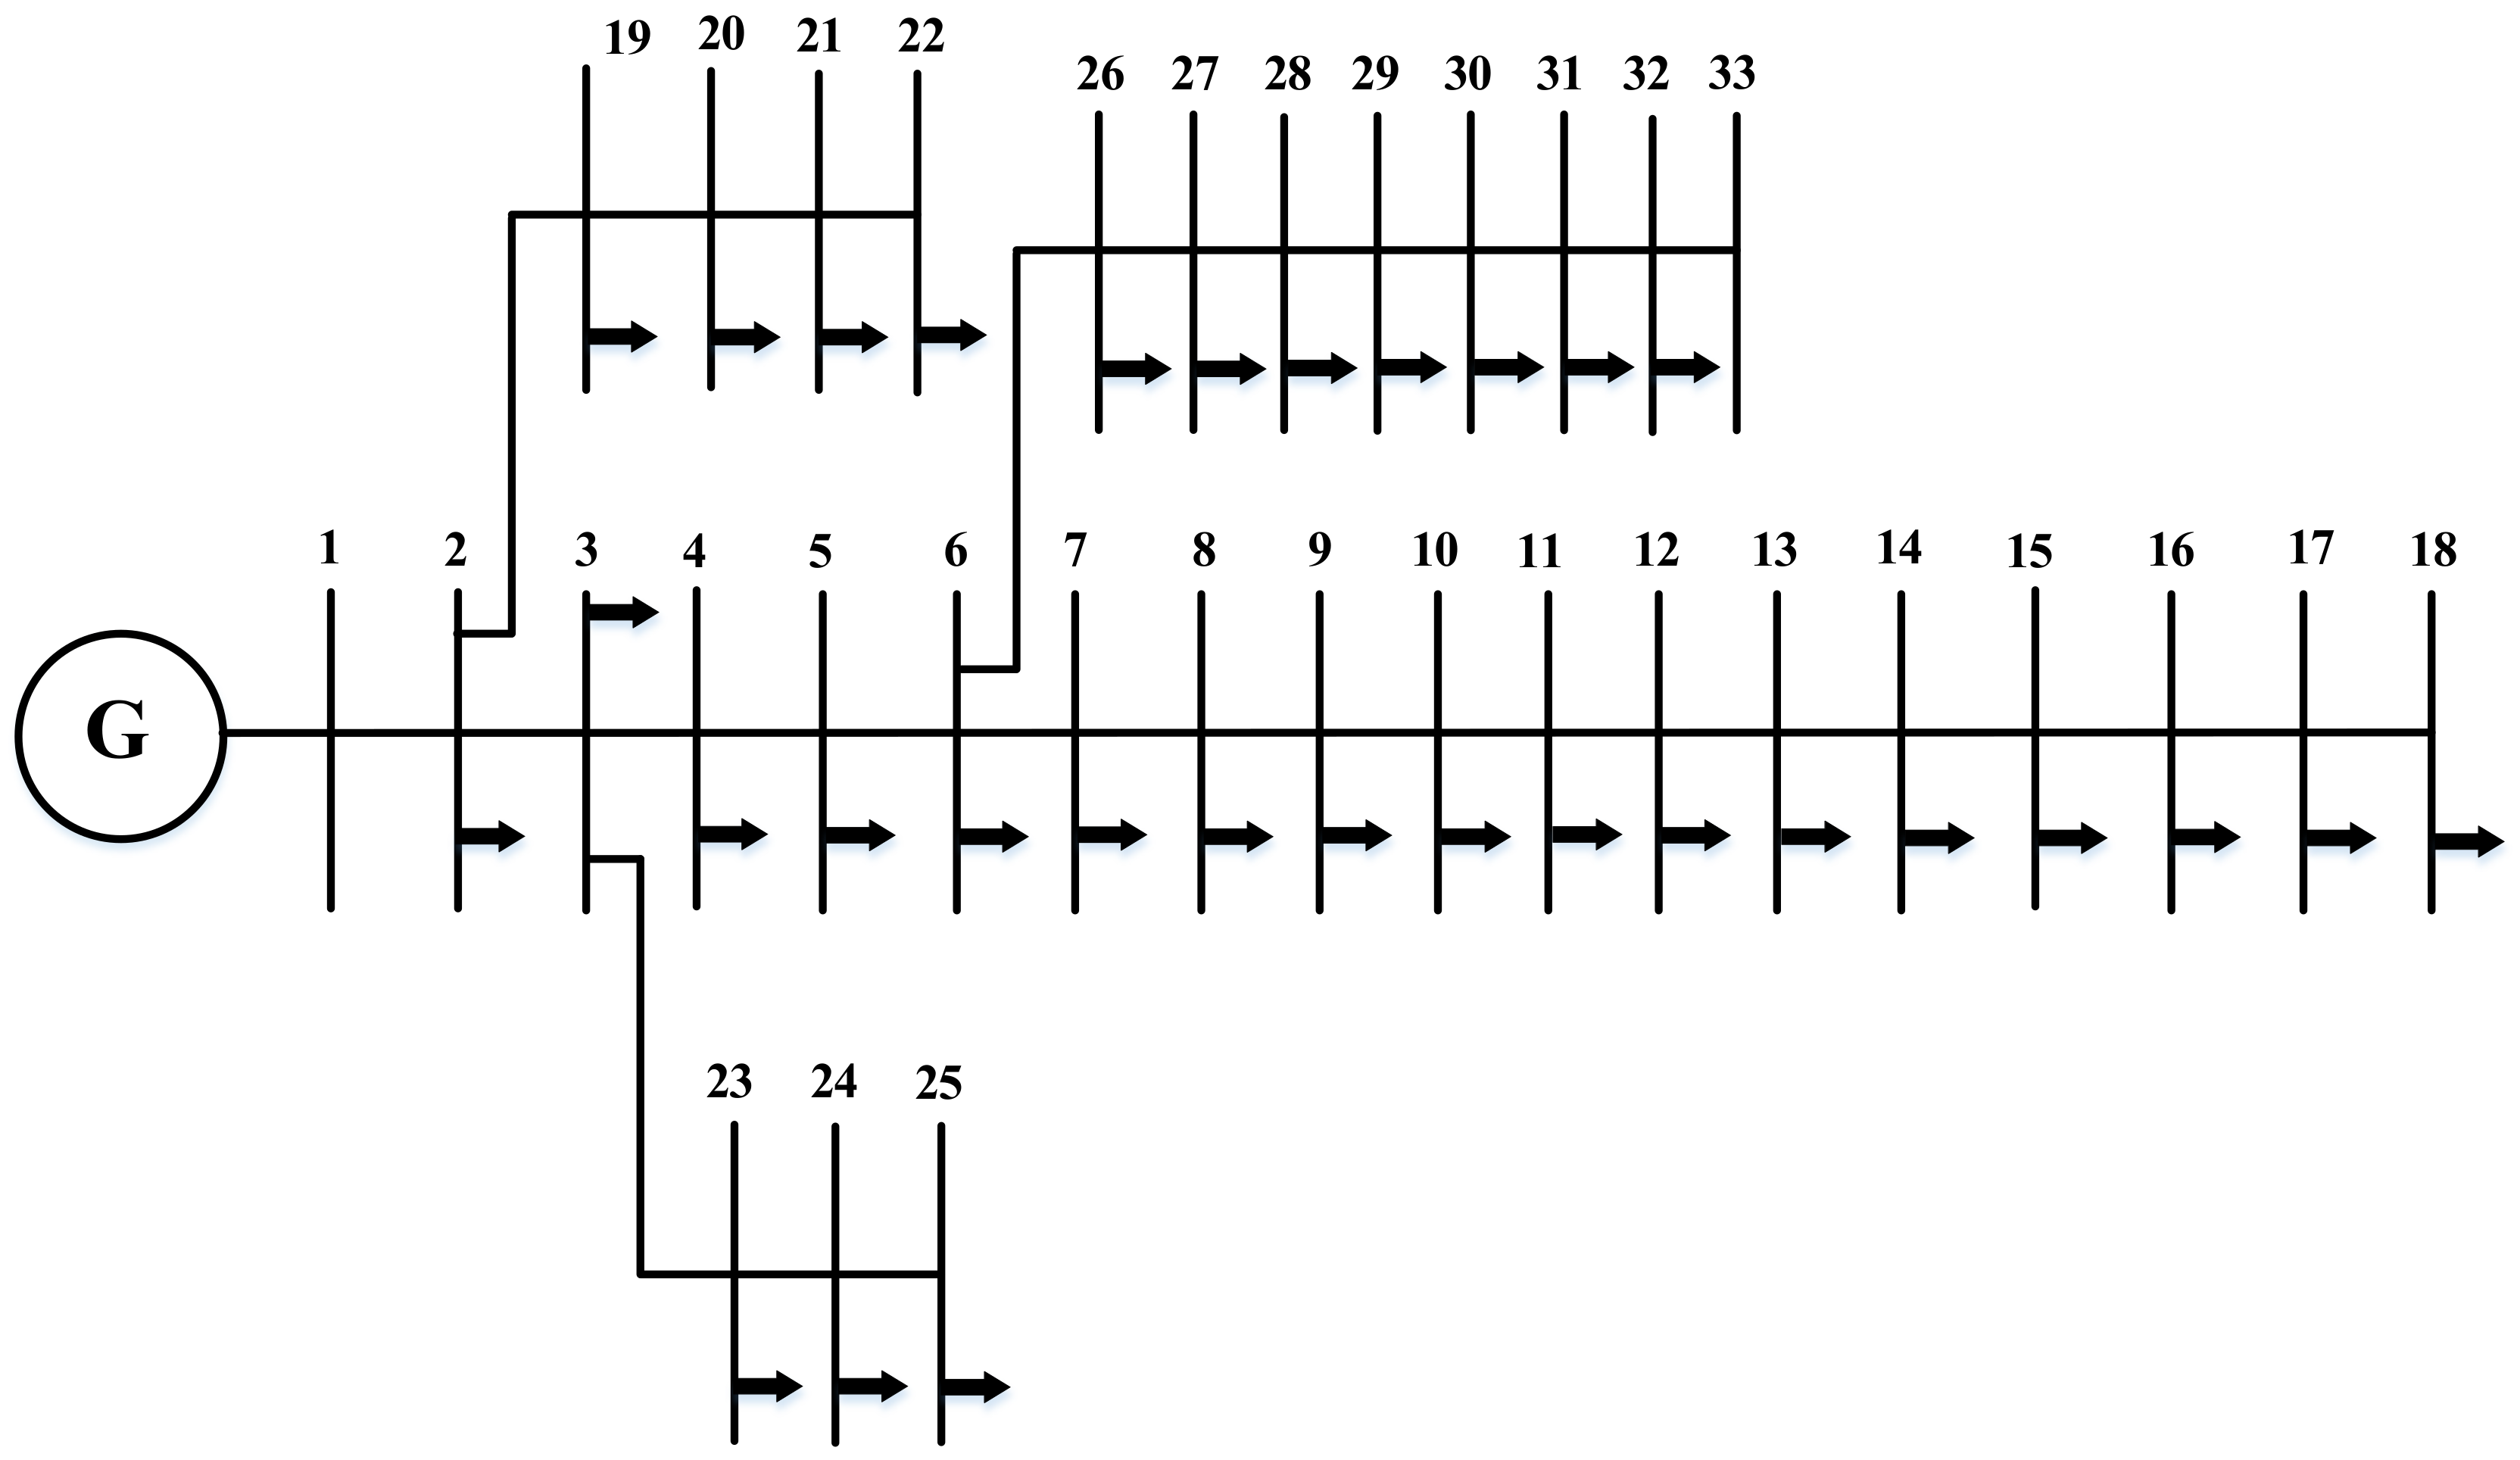
2. Materials and Methods

This section will provide mathematical problem formulation and a brief introduction to the continuous genetic algorithm.

2.1. Mathematical Problem Formulation

The mathematical problem formulation comprises an objective function and some optimization constraints.

2.1.1. Optimization Constraints

In this section, two optimization constraints are taken into consideration, i.e., the relay coordination and islanding operation constraints. At the point, once a fault happens, it ought to be cleared as quickly as conceivable with minimal influenced regions in the rest of the system. Furthermore, coordination of time between the protective equipment is necessary. Primary protection, near the faulted area, should make a move before reinforcement or secondary protection devices, which are more distant. Therefore, the characteristic of inverse definite minimum time overcurrent relay could be defined by some of the IEC rules as follows:
T = T M S α I / I s β 1 + c
where the parameter T is the total operational time for constant current, and I and I s represent energizing current and overcurrent setting, respectively. α  , β , and c are the constants for defining curve, while TMS represents the time multiplier [24,25,26]. Every primary protection needs a reinforcement or secondary protection to ensure a reliable protection system. The two-protection system ought to be facilitated together; for example, a predefined coordination time interval (CTI) ought to crumple before the secondary protection comes into action. Ordinarily, CTI utilized for electromechanical relays is 0.3 to 0.4 s; however, CTI of 0.1 to 0.2 s is utilized for microprocessor-based relays [27,28,29]. The protection coordination among primary and secondary relays is:
N s r i k i = 1 , 2 , , n
where the parameter N s r i and n represent the number of series relays in each branch of graph and number of branches in the graph, respectively, while k denotes the concentrated number of relays that can be coordinated together.
Demand side management (DSM) is an entrenched method to govern the dimensions of power utilization, both in island and grid associated systems [30]. DSM has been utilized for monitoring system administrators to keep up power system frequency and voltage and constancy in the islanded zone. For each islanded zone, this imperative is described as:
i = 1 n P i L P G
where the parameter P i L is load in each zone, P G denotes the distributed generator capacity in each zone, and n denotes the number of loads in each zone. These constraints have been checked including main source and DGs.

2.1.2. Objective Function

The objective function for minimum energy consumption (MEC) can be stated as follows:
M E C = E T X l , d = E T x e l e c l + E T x a m p l , d
where the parameter E T X l , d is the transmitting energy dissipation, l represents the number of data, d is the transmission distance, E T x e l e c l denotes energy transmit by each node, and E T x a m p l , d denotes energy consumed by each node.

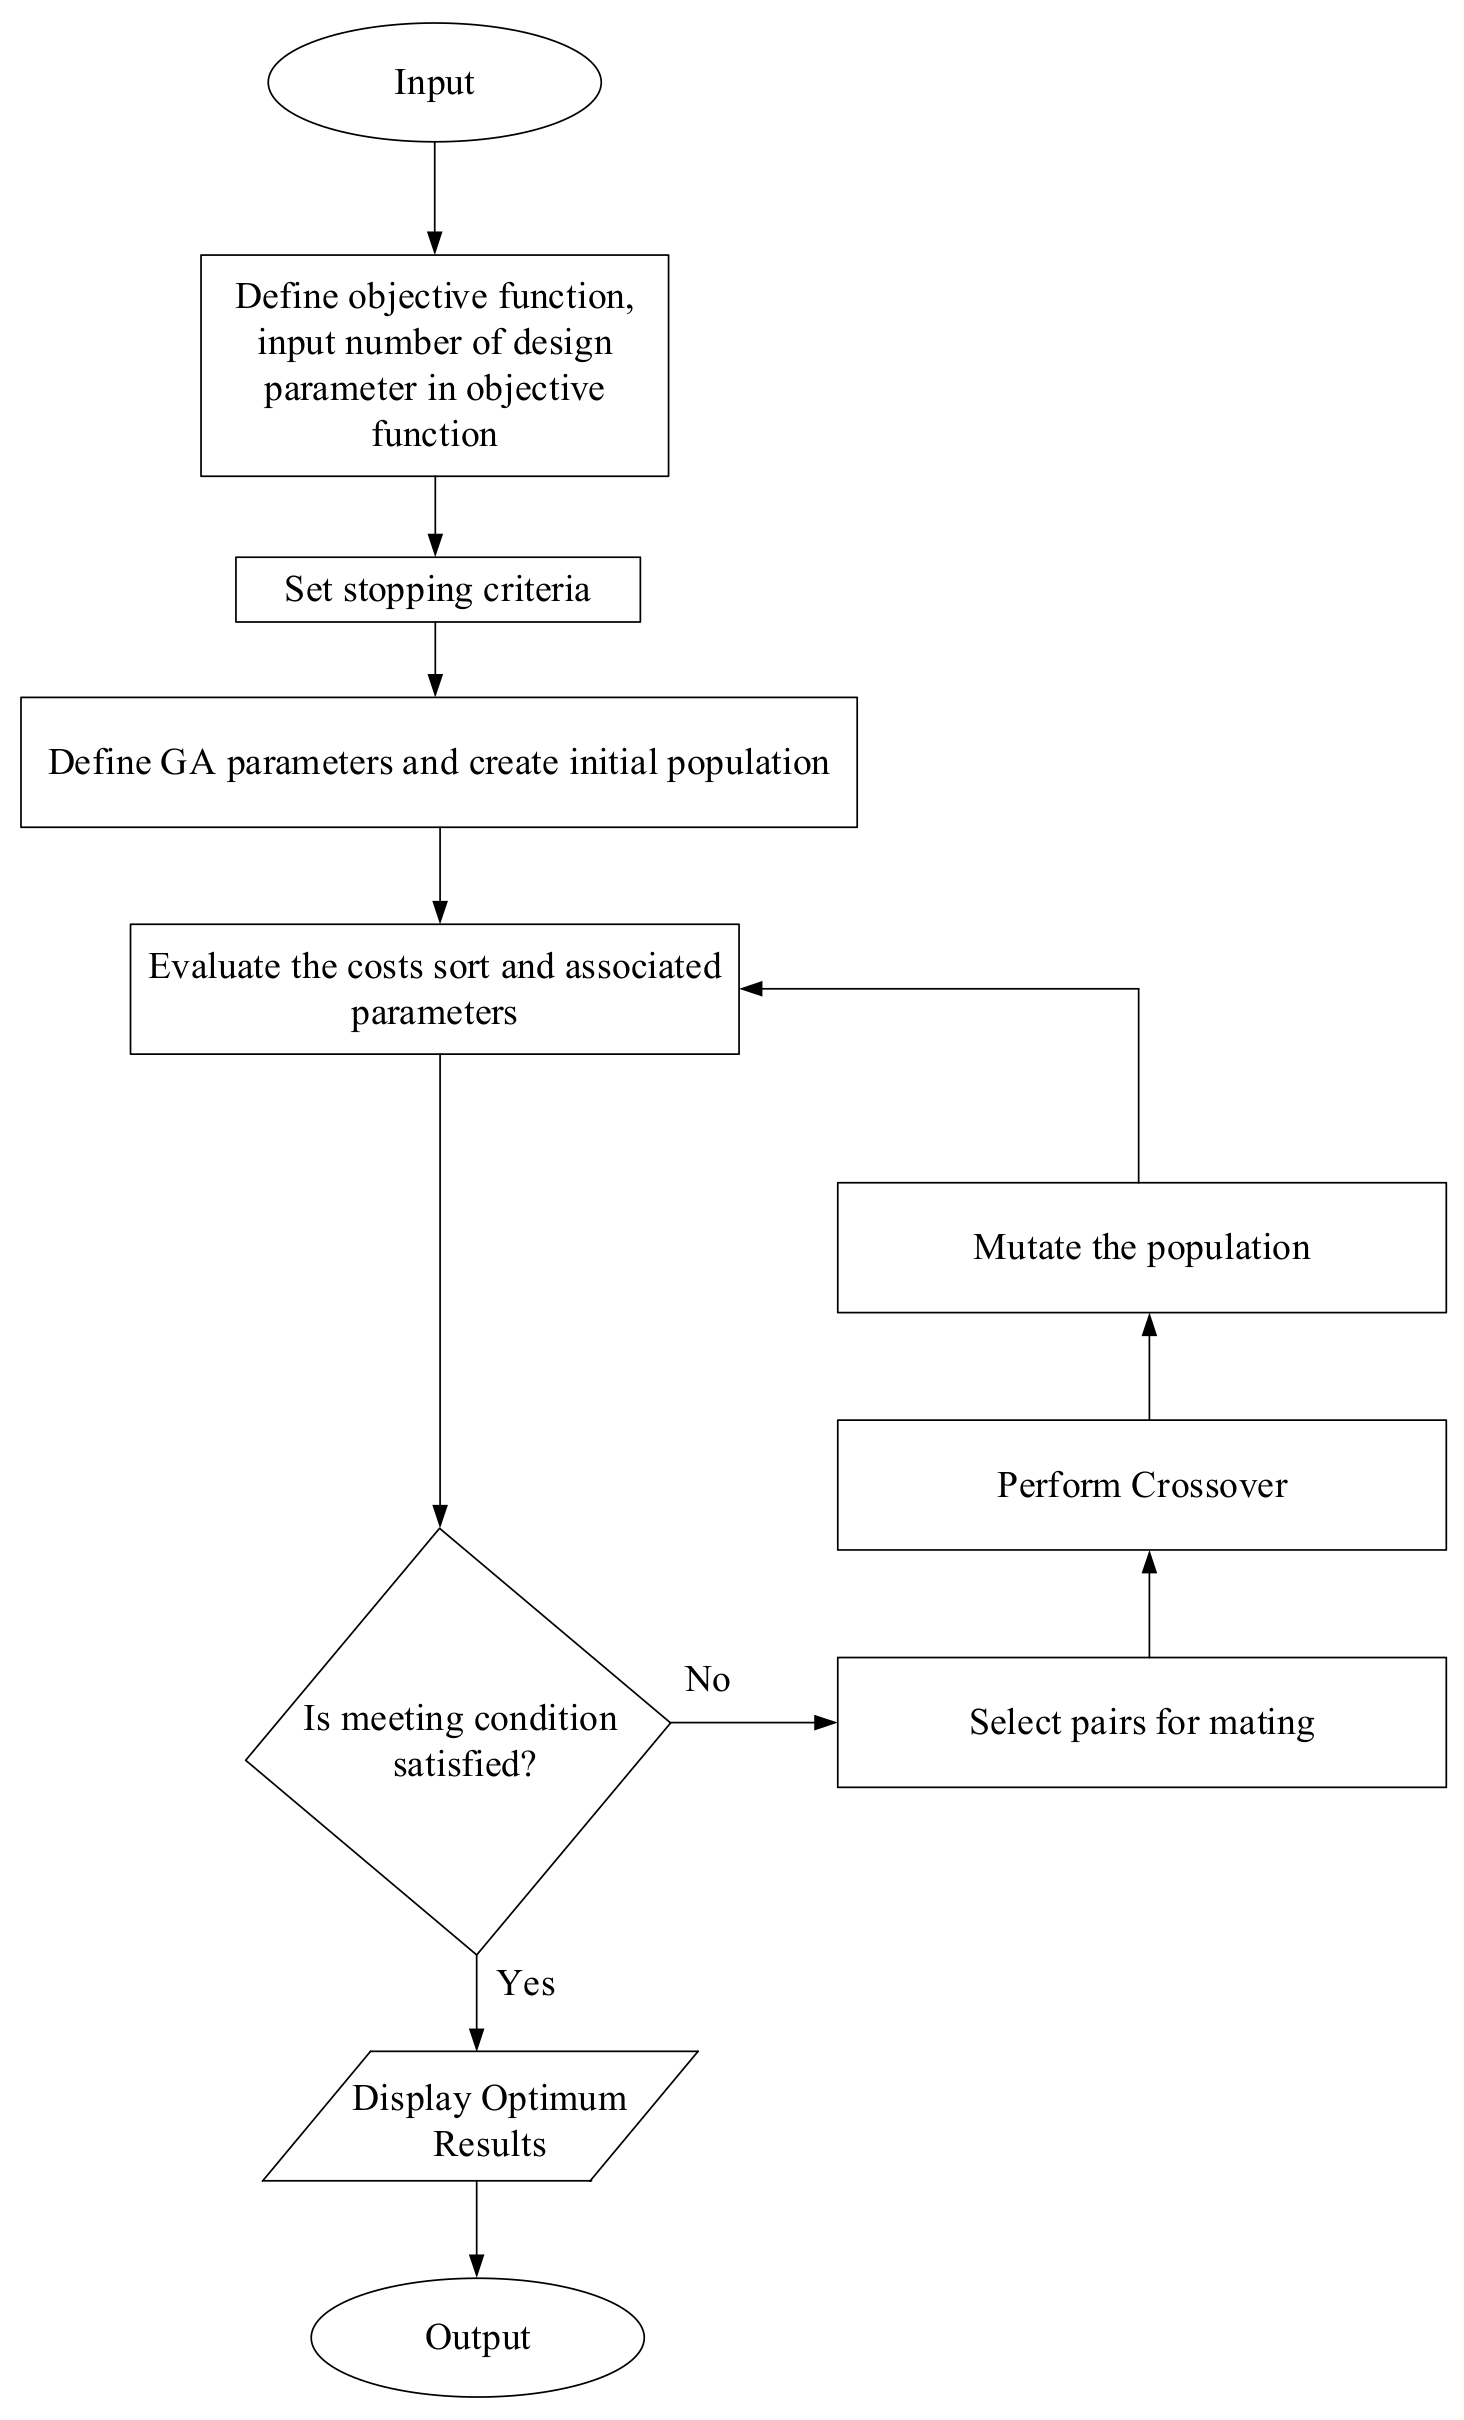
2.2. Continuous Genetic Algorithm

Genetic algorithm (GA) is a natural- and bio-inspired algorithm that impresses the biological procedure of natural development and the idea of the possibility of the “survival to fittest”. Beginning with a populace of arbitrarily made results, the results with improved wellness are bound to be picked as a parent to create fresh results (offspring) for the next generation [31]. The conventional techniques have restrictions in searching for ideal and global points and are sometimes caught in nearby local optimum points. Recently, heuristic algorithm methods have excited serious enthusiasm due to their adaptability, flexibility, and strength in looking for an ideal and global optimum solution [32]. Due to the way that GA is a multipoint seeking technique, as opposed to the conventional single point search methods, GA guarantees reaching the ideal and global optimum point [33]. In CGA, the factors and variables are denoted by floating point numbers. The positive aspect of CGA over conventional GA are [34]:
  • In CGA optimization, the variables are denoted by floating point numbers that allow demonstration of the machine accuracy, while binary GA has its accuracy restricted by the binary illustration of variables.
  • The other positive aspect of CGA is that it requires less storage than binary GA in light of the fact that a single floating point number illustrate the variable.
  • The CGA is fundamentally faster than binary GA, in light of the fact that the chromosomes are not decoded.
Figure 1 presents the flowchart for CGA. Each plan variable is pronounced by a floating point number, and in the event that there are n design factors or variables, a design vector is pronounced by a string of whole n floating point numbers. This string is known as a ‘chromosome’. GA begins with a gathering of chromosome known as ‘populace’. The primary populace is produced arbitrarily by keeping the estimation of every factor or variable in the range determined by its lower and upper limits. The basic operations of natural genetic reproduction, crossover, and mutation essential tasks are executed amid numerical enhancement. ‘Reproduction’ is a procedure in which the candidates are chosen dependent on their wellness or fitness value in respect to that of the populace. In this manner, the candidates (chromosomes) with higher wellness or fitness value have a higher chance of being chosen for mating and ensuring genetic activity. Subsequently, an individual with high fitness value will live and reproduce, and less fit chromosomes die. After reproduction, the ‘crossover’ activity is executed. Crossover is an operator that frames new chromosomes, called ‘offspring’, from two ‘parent’ chromosomes by consolidating some portion of the share from each. Different strategies are accessible for crossover in continuous GA [34]. Combination of blending method with extrapolation procedure has been utilized in this paper. The offspring acquired from crossover are set in the new populace. The ‘mutation’ is functional after crossover. A mutation, in CGA, is the infrequent substitution of a variable (chosen arbitrarily from the chromosome) by a consistent arbitrary variable in the range indicated by the limits of the factors.

3. Implementation of CGA

The projected algorithm progresses over three operatives after a preliminary populace is generated randomly.
  • Selection;
  • Crossover;
  • Mutation.
1.
Selection
Selection is the key elementary process in a genetic algorithm that provides predilection to the best candidates to pass their genes to the next generation, depending on their higher fitness values.
2.
Crossover
Crossover the key aspect of GA that differentiates it from other algorithms. In this phase, two parent chromosomes are selected and swap part of the base of their genetic information to produce the next generation. If S1 = 000000 and S2 = 111111, and the crossover point is 2, then S1’ = 110000 and S2’ = 001111.
3.
Mutation
This operator is applied after crossover. Its main role is to keep diversity within the populace and impede premature convergence. It alone persuades a random pace over the search space.
A block diagram for performing the whole optimization process is shown in Figure 2; it shows how the optimization and analysis is performed for IEEE 33 and 69-bus system.

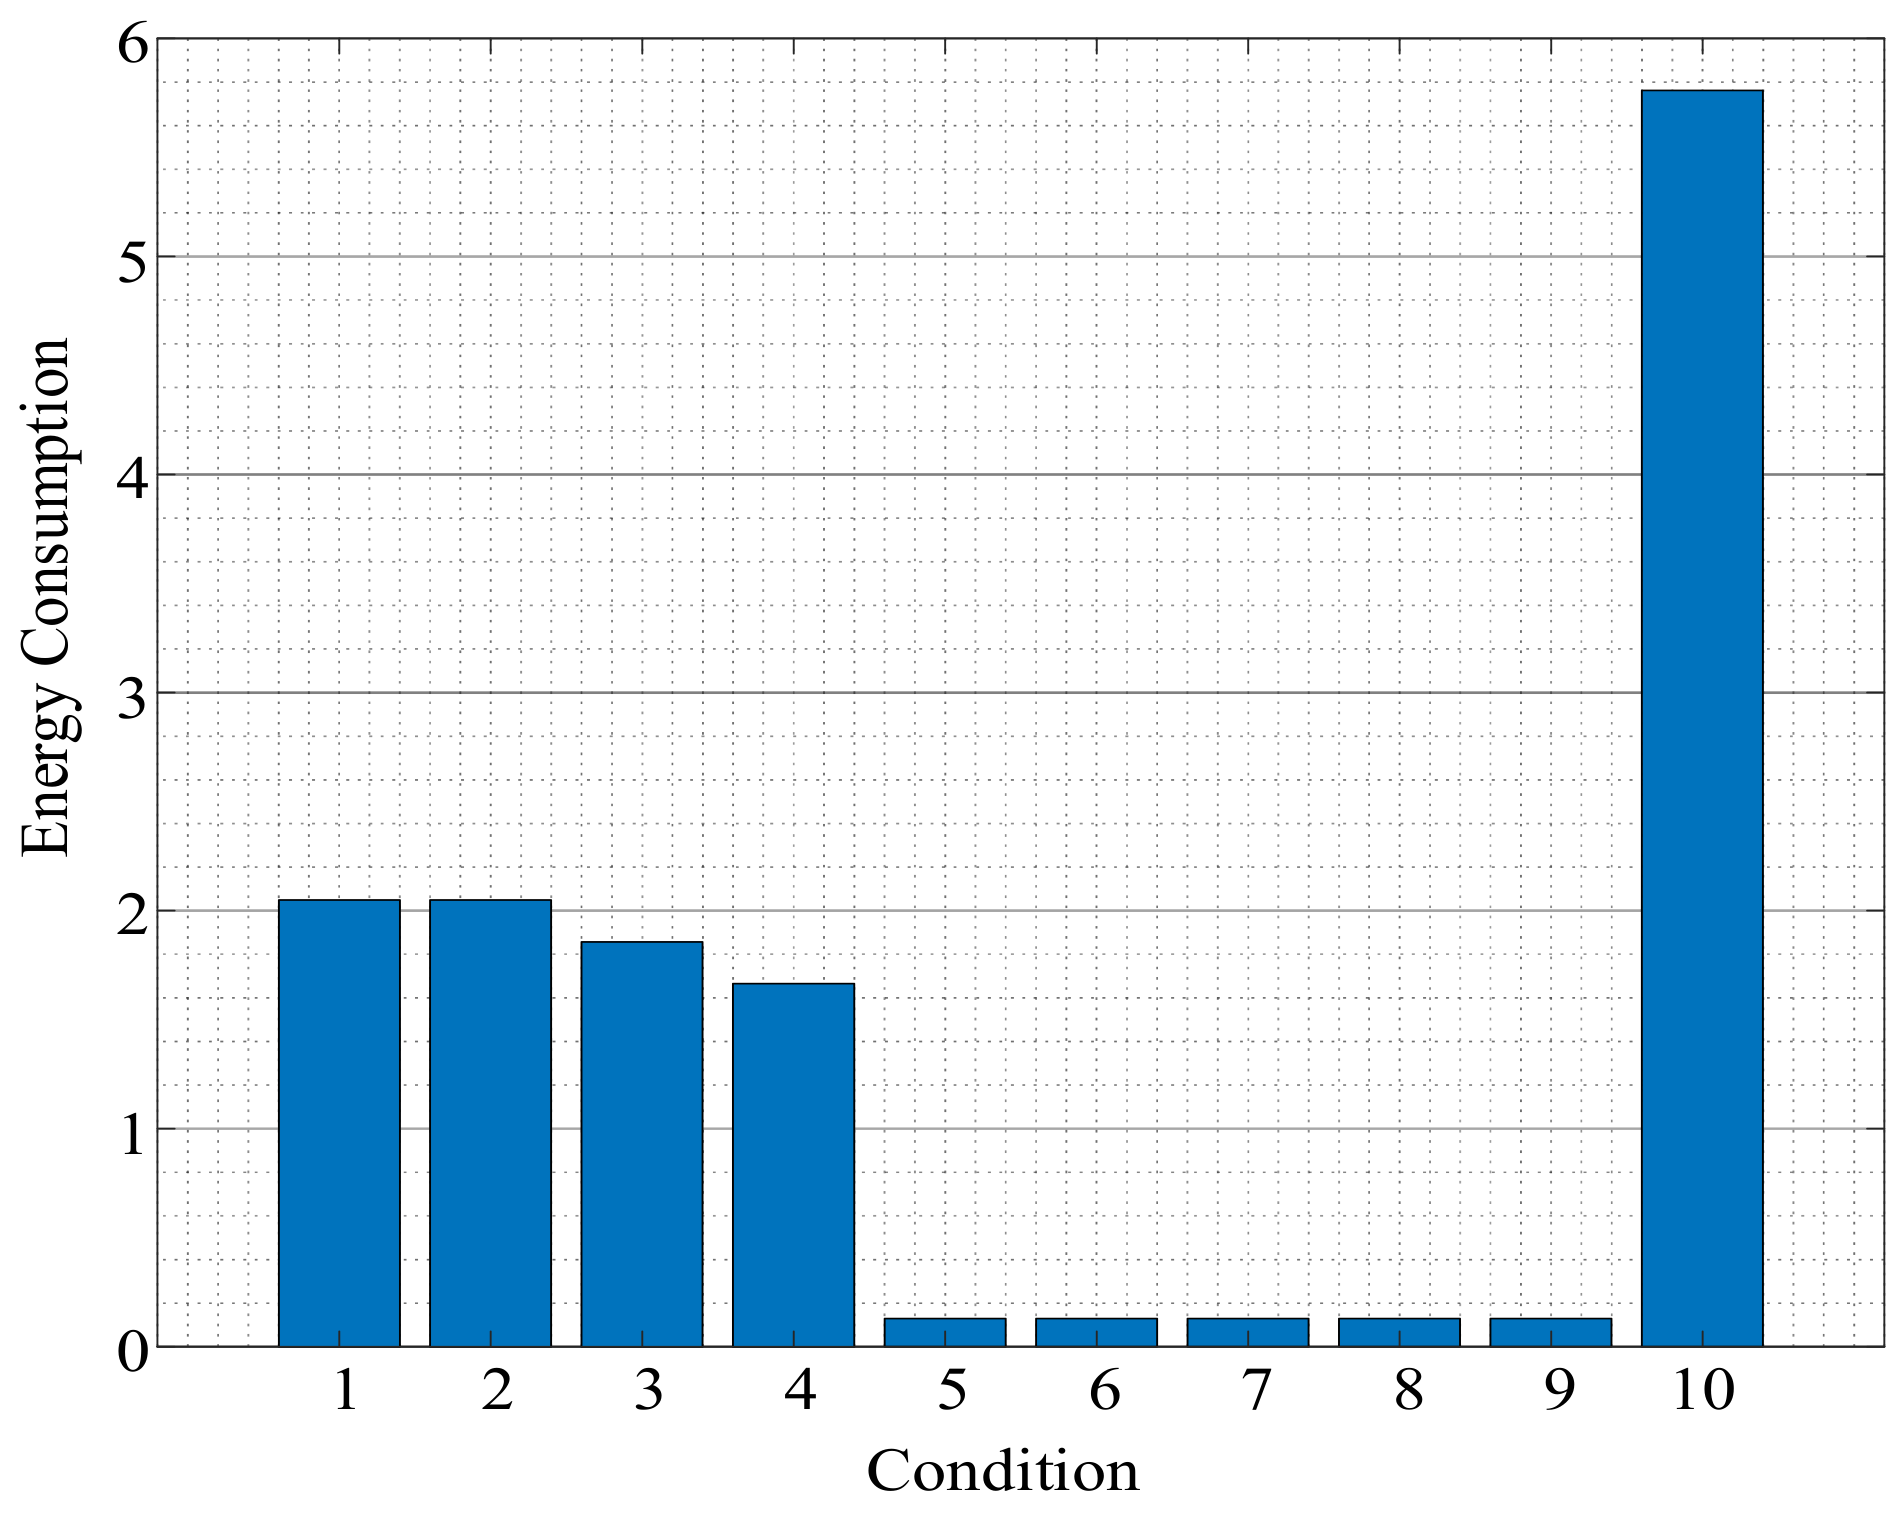
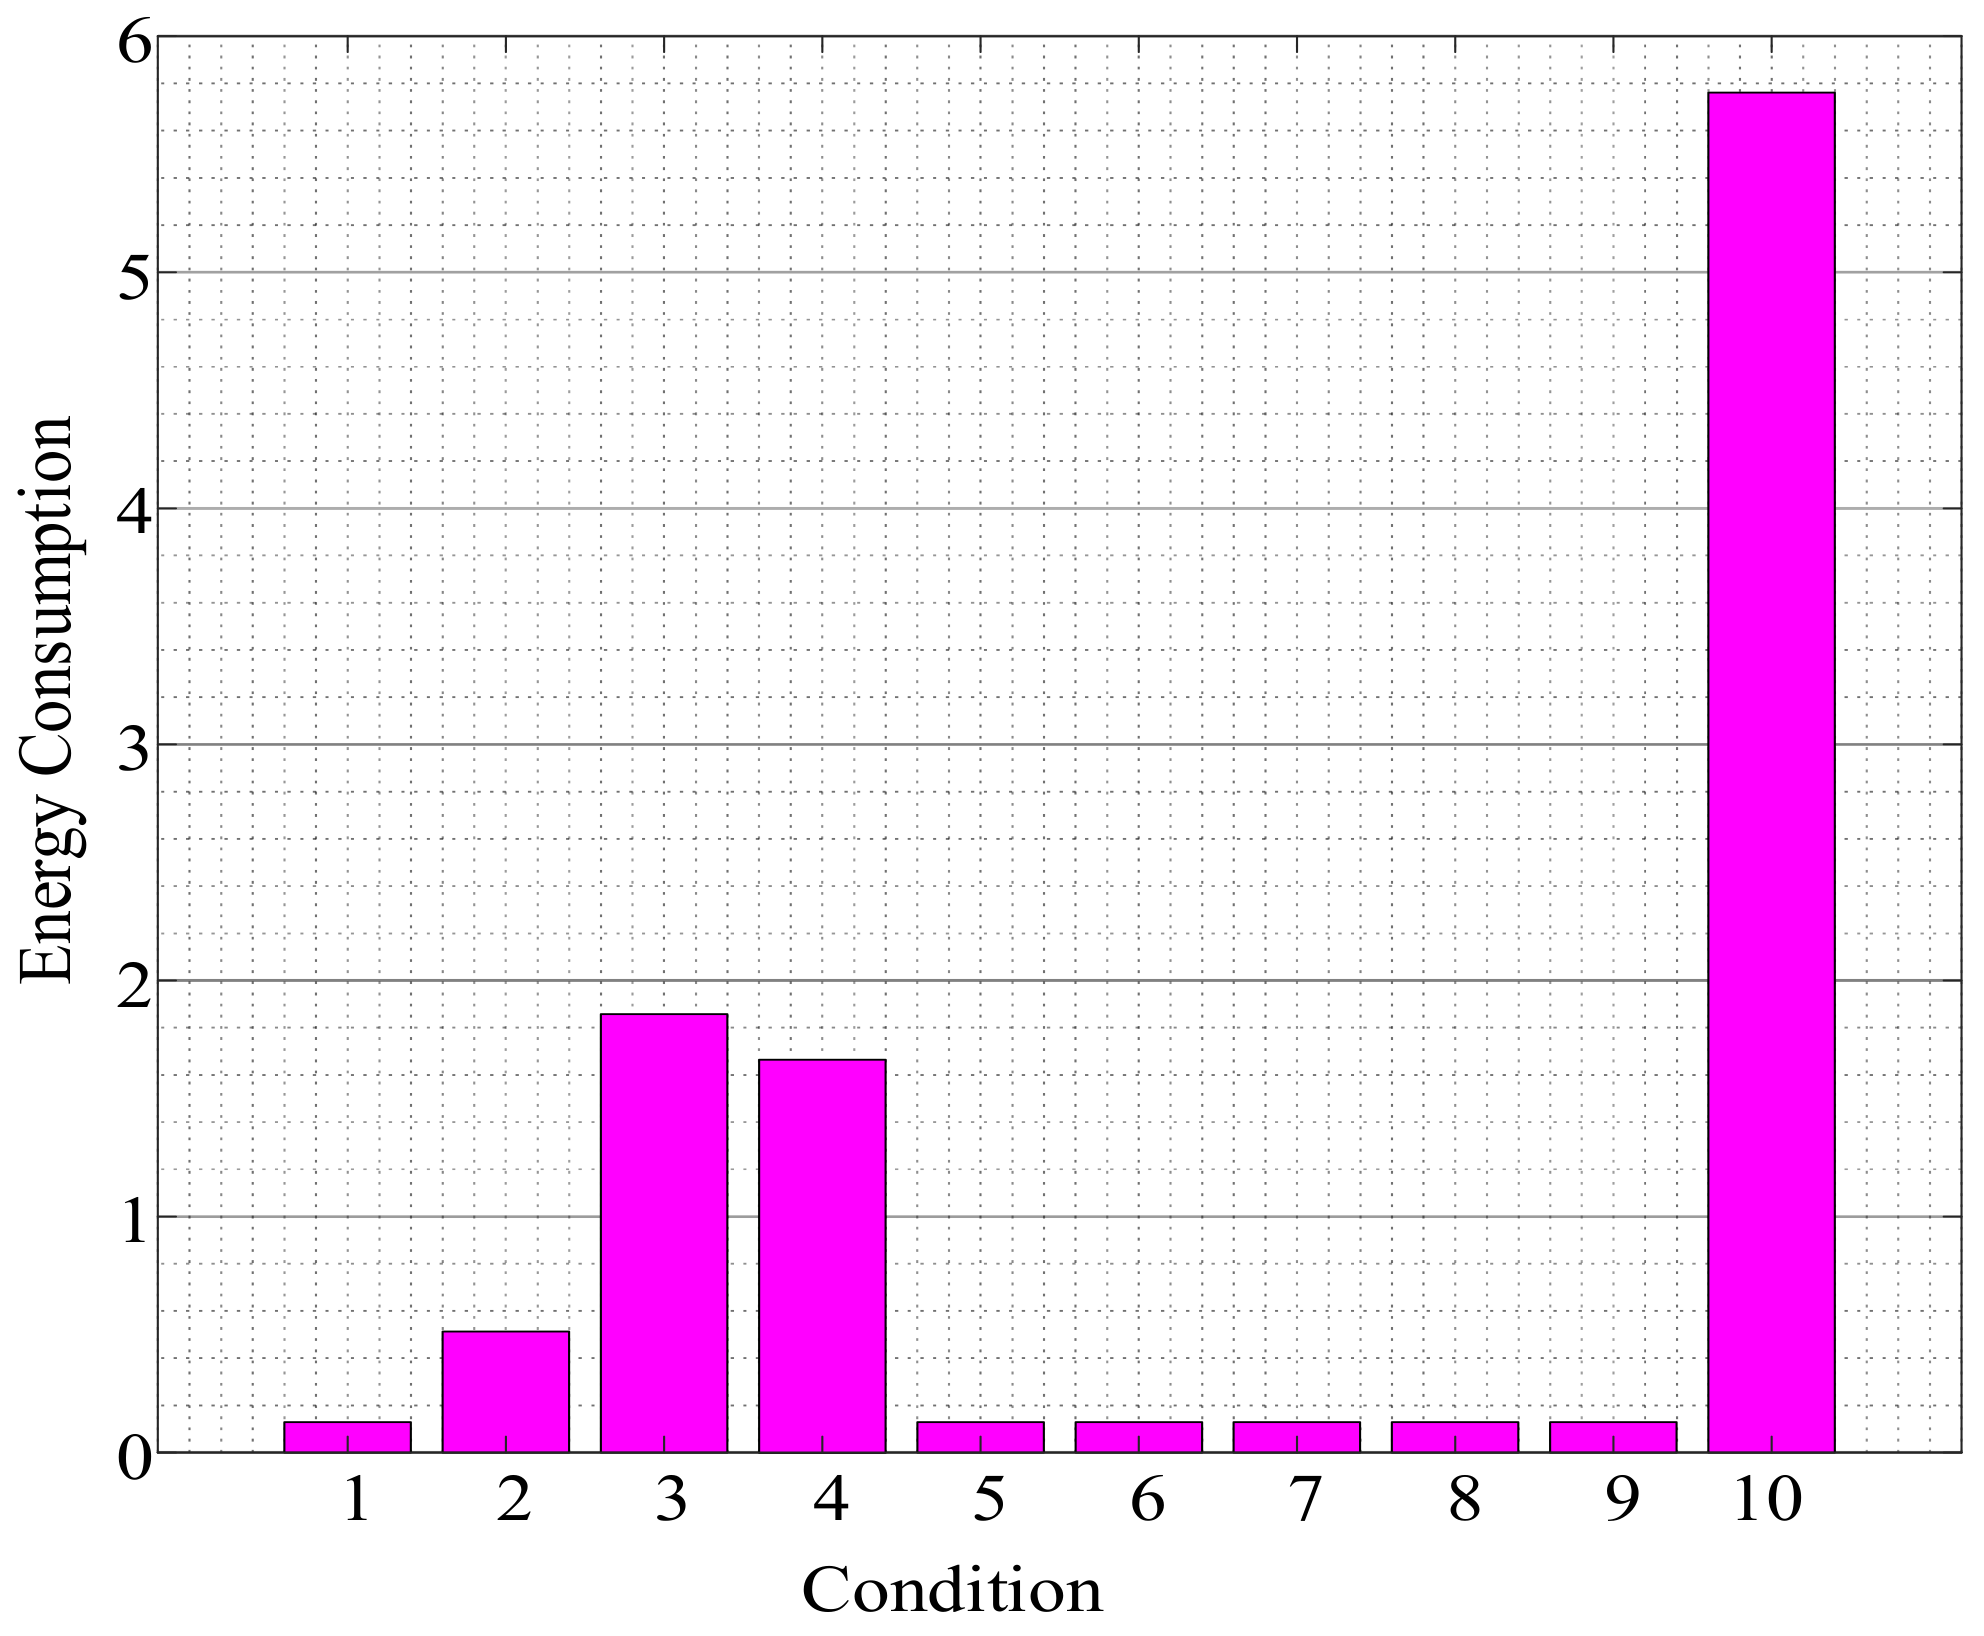
4. Result and Discussion

A program has been developed in Matlab for the optimal placement of relay considering both distance of relay nodes and energy consumption for performing optimization in the IEEE-33 and 69 test bus radial distribution system using CGA. The efficiency and performance of CGA were identified for the radial distribution systems, and it was revealed that the CGA gives the most sophisticated and preeminent result in both case studies. Two case studies have been investigated and examined in this paper; the system details of the case studies can be found in reference [35]. In the case studies, the following parameters were used for the initialization of CGA.
Population size = 32
Mutation rate = 20%
Cross over = 50%
Maximum iterations = 200.
Case Study 1
The suggested technique has been applied effectively on the IEE standard radial distribution 33 bus system as shown in Figure 3. It comprises 33 buses and 32 lines (branches). The analyzed system’s line and load data for the proposed work is mentioned in [36].
In order to confirm the accuracy and efficiency of the suggested method, the algorithm is tested for five different line conditions on which relays are installed. The five different conditions are shown in Table 1. The details about the relay installation are given in [36]. In this studied condition, we have to analyze which condition is suitable and best for the relay location. Based on the line conditions, we have to analyze which conditions are best based on the energy. So, the low energy estimation consumption is the common design objective in energy consumption distribution system and, based on the distance of relay node placement, the energy has been estimated and passed through the relay. The consumption of energy is estimated for each relay node and the total reduction in optimized energy is estimated at the end of algorithm.
Over two parameters, the CGA increases lifespan. The first is the total transmission distance within in the system. By multiplying the distance between each member node by the DG, the overall transmission is computed. The total number of relay nodes in the system is the second factor to consider. The algorithm is tested on five different states. The five different states vary by number of lines on which relays are installed. The transmission energy and reception energy equation are same as stated as in Equation (5).
T r a n s m i s s i o n   energy   E T X = l × E e l e c + ε f s × d 2   , i f   d d 0 l × E e l e c + ε m p × d 4   , i f   d > d 0
Reception Energy ERX = l × Eelec
where ETX and ERX indicate the transmission and reception energy, respectively, ε f s denotes energy dissipation in free space, ε m p is energy dissipation in multipath models, and d is the transmission distance between two nodes. If the distance d is less than or equal to threshold distance d0, then free space model ( d 2   p o w e r   l o s s ) is used; otherwise, multi path model ( d 4   p o w e r   l o s s ) is used. In the simulation, the minimum and overall energy consumption (MW) for all the line conditions has been calculated based on the distance while transmitting the data on a node on which relays are installed. In Figure 4, Figure 5, Figure 6, Figure 7 and Figure 8, we can find that which line conditions consume minimum energy consumption and which line conditions are suitable for the best relay location through which energy has been transmitted.
As shown in Figure 4, Figure 5, Figure 6, Figure 7 and Figure 8, the first line and fourth line conditions consume minimum energy as compared to the second, third, and fifth line conditions, which cost more energy. As the relay nodes choose the neighbor whose direction to the sender is the most similar to the sender’s orientation to the distinction, more steps are required to reach the destination node, as well as an increase in energy usage for transmission. Additionally, the fourth line condition on which the relays are installed consumes minimum energy as compared to the first line condition. The fourth line condition is the optimum condition because it consumes minimum energy as compared to other lines. The overall minimum energy consumption variation depends on the relay location, shown in Figure 9 and Figure 10, which shows that if we change the relay location, various energies of different magnitude can be transmitted through relay nodes. The ideal and optimum position of relays in each state is tested on different conditions, and minimum energy consumption has been determined as the relays are optimally placed on this line.
If we consider the influence of DG for upstream and downstream faults in the system, the placement of the relay amongst central source and DG will intellect dissimilar short current in the path so, as a result, the directional relay is placed in this locality in these candidate locations. The influence of DG can be perceived by contrasting the result of the first and fourth line conditions. Expanding the measure of DG prompts minimal uprooting in relay positions for extending the islanded mode of DG. The possibility of fault in the extended region will be expanded, which leads to a reduction in the positive influence of DG in the system. If the significance of loads is deliberated in the ideal and optimum assurance protective device position, the ideal and optimum position will be altered to reduce the risk of blackouts in the area served by the key client by distributing power to nearby relays. Figure 4, Figure 5, Figure 6, Figure 7 and Figure 8 also illustrate the normalized load points corresponding to energy consumption (NLPEC) for various load points. The normalization is achieved grounded on these results; it may be perceived that essential branches are not influenced by DG’s locality, in light of the fact that relays on these branches are not uprooted and these branches are not islanded in each blackout. Additionally, we find that the NLPEC of the critical client is diminished by streamlining the relay position, frequently relaying among DG, and the source of substantial influence minimum energy consumption as they create islanded zones if a blackout happens on the upstream. Coordination limitations will be seen by setting these relays working on reverse fault currents. As can be seen, if this relay creates a wrong islanded zone for DG, then the total energy consumption rises. In the third condition, the best area of directional relay amongst the main source and DG is branch 5. Towards the start of branch 5, when a fault happens on the upstream of this point, this relay will work, and an islanded zone will be made round the DG and total energy consumption rises. However, when this relay on branch 5 is set between branch 1 and branch 4, the total energy consumption increases, due to the fact that the proficiency of this relay relies upon on LPEC of upstream load focuses and location of other directional relays amongst the main source and DG. The best optimum relay location found at the end of generation is tabulated in Table 2, which shows the optimal placement of relays in the radial distribution system.
Case Study 2
This section will examine the performance of the proposed method on the IEEE 69-bus radial system as shown in Figure 11. It consists of 69 nodes and 68 lines (branches). The system details can be found in references [35,36].
In order to confirm the accuracy and efficiency of the suggested method, the algorithm is tested for eight different line conditions on which relays are installed. The eight different conditions are shown in Table 3. The details of the relay installation have been given in [36].
In this case, we study the same phenomenon as discussed in case study 1. Based on the line conditions and the energy, we have to analyze which conditions are best. Based on the distance of relay node placement, the energy has been estimated and passed through the relay nodes. The consumption of energy is estimated for each relay node and the total reduction in optimized energy is estimated at the end of algorithm. In the simulation process, we calculate the minimum and overall energy consumption for all the line conditions based on the distance while transmitting the data on a node on which relays are installed. The line conditions which obtain minimum energy consumption will be considered the best line, and the relay place on this line condition will be the optimal placement of relay because using the optimal location of relay can efficiently optimize the energy based on the distance while transmitting the data in the IEEE 69-bus system. As shown in Figure 12, Figure 13, Figure 14, Figure 15, Figure 16, Figure 17, Figure 18 and Figure 19, we can find which line conditions consume minimum energy consumption and which conditions are suitable for the best relay location through which energy can be transmitted through relay nodes. As shown in Figure 12, Figure 13, Figure 14, Figure 15, Figure 16, Figure 17, Figure 18 and Figure 19, the first and third line conditions consume minimum energy consumption as compared to the second, fourth, fifth, sixth, seventh, and eighth line conditions, which cost more energy. By contrasting the result of the first and third line conditions, the first line is the optimum condition because it consumes minimum energy as compared to other lines.
The overall minimum energy consumption variation depends on the relay location in different line conditions, shown in Figure 20 and Figure 21, which show the total minimum consumption of energy transmitted through the eight different line conditions through relay nodes. As shown in Figure 20, the first line condition consumes minimum energy and so is the optimum condition on which relays can be installed. If we change the relay position, various energies of different magnitude can be transmitted through the relay nodes. The ideal and optimum location of relays in each condition is tried in other conditions; minimum energy consumption has been determined, as on this line the relays are optimally placed. The optimum relay location found at the end of generation is tabulated in Table 3, which shows the optimal placement of relays in the radial distribution system. If we consider the influence of DG for upstream and downstream faults in the system, the placement of a relay between the DG and central source will cause different short currents in the circuit. Therefore, in these candidate locations, the directional relay is placed in this locality. The influence of DG can be perceived by contrasting the result of line conditions B–F and D–E. Expanding the measure of DG prompts some uprooting in relay positions for extending the islanded mode of DG. The possibility of a fault in the extended region will be expanded, which leads to a reduction in the positive influence of DG in the system. This is because it can be realized that if the significance of loads is deliberated in the ideal and optimum assurance protective device position, the ideal and optimum position will be altered to lessen the blackouts in the critical client’s region by conveying relays close to these clients in the upstream and downstream of the feeder. Figure 15, Figure 16, Figure 17, Figure 18, Figure 19 and Figure 20 also illustrate the normalized load points corresponding to energy consumption (NLPEC) for various load points. The normalization is achieved grounded on these results; it may be perceived that essential branches are not influenced by DG’s locality, in light of the fact that relays on these branches are not uprooted and these branches are not islanded in each blackout. Additionally, we find that the NLPEC of the critical client is diminished by streamlining the relay position, frequently relaying among DG, and the source of substantial influence minimum energy consumption as they create islanded zones if a blackout happens on the upstream.

5. Conclusions

This paper proposes a CGA algorithm based on the biological process of natural development and the concept of “survival of the fittest.” The proposed CGA approach had a few adjustment settings and was thus simple to implement for the IEEE 33 and 69-bus systems. We searched for the optimal placement and coordination of protective devices in a distribution system with distributed generation being endeavored, utilizing the proposed CGA algorithm for different test systems to assess its execution. The proposed CGA algorithm’s competence has been proven and tested by applying it to a variety of radial distribution systems. The continuous genetic algorithm with dynamic mutation is used to find the best place for a relay.
In the future, the proposed CGA will be implemented to solve the system average interruption frequency index (SAIFI) and system average interruption duration index (SAIDI) for power system reliability. Moreover, the current implementation is limited to the optimal placement of relays considering both the distance of relay nodes and energy consumption for performing optimization.

Author Contributions

Conceptualization, T.K. and A.W.; methodology, T.K., S.-B.R. and K.-C.K.; software, A.W., S.G.F. and T.-H.K.; validation, T.K. and S.-B.R.; formal analysis, T.K., A.W. and S.G.F.; investigation, T.K. and K.-C.K.; resources, K.-C.K. and S.-B.R.; data curation, T.K. and A.W.; writing—original draft preparation, T.K., A.W. and S.G.F.; writing—review and editing, T.-H.K. and T.K.; visualization, T.K. and A.W.; supervision, S.-B.R. and K.-C.K.; and project administration, S.-B.R. and K.-C.K. All authors have read and agreed to the published version of the manuscript.

Funding

This work was supported by the 2021 Yeungnam University Research Grant.

Institutional Review Board Statement

Not applicable.

Informed Consent Statement

Not applicable.

Data Availability Statement

Not applicable.

Conflicts of Interest

The authors declare no conflict of interest.

References

  1. Billinton, R.; Allan, R.N. Reliability Evaluation of Power Systems; Pitman Books: New York, NY, USA; Pitman Books: London, UK, 1994. [Google Scholar]
  2. Da Silva, L.G.; Pereira, R.A.; Mantovani, J.R.S. Allocation of protective devices in distribution circuits using nonlinear programming models and genetic algorithms. Electr. Power Syst. Res. 2004, 69, 77–84. [Google Scholar] [CrossRef]
  3. Teng, J.-H.; Lu, C.-N. Value-based distribution feeder automation planning. Electr. Power Syst. Res. 2006, 28, 186–194. [Google Scholar] [CrossRef]
  4. Sohn, J.-M.; Nam, S.-R.; Park, J.-K. Value-Based Radial Distribution System Reliability Optimization. IEEE Trans. Power Syst. 2006, 21, 941–947. [Google Scholar] [CrossRef]
  5. Da Silva, L.G.W.; Pereira, R.A.F.; Abbad, J.R.; Mantovani, J.R.S. Optimised placement of control and protective devices in electric distribution systems through reactive tabu search algorithm. Electr. Power Syst. Res. 2007, 78, 372–381. [Google Scholar] [CrossRef]
  6. Teng, J.-H.; Lu, C.-N. Feeder-switch relocation for customer interruption cost minimization. IEEE Trans. Power Deliv. 2002, 17, 254–259. [Google Scholar] [CrossRef]
  7. Moradi, A.; Firuzabad, M.F. Optimal switch placement in distribution systems using trinary particle swarm optimization algorithm. IEEE Trans. Power Deliv. 2008, 23, 271–279. [Google Scholar] [CrossRef]
  8. Popovic, D.S.; Glamocic, L.R.; Nimrihter, M.D. The optimal automation level of medium voltage distribution networks. Int. J. Electr. Power Energy Syst. 2011, 33, 430–4385. [Google Scholar] [CrossRef]
  9. Rosado, I.J.R.; Agustín, J.L.B. Reliability and costs optimization for distribution networks expansion using an evolutionary algorithm. IEEE Trans. Power Syst. 2001, 16, 111–118. [Google Scholar] [CrossRef]
  10. Rosado, I.J.R.; Navarro, J.A.D. New multiobjective tabu search algorithm for fuzzy optimal planning of power distribution systems. IEEE Trans. Power Syst. 2006, 21, 224–233. [Google Scholar] [CrossRef]
  11. Ramirez-Rosado, I.; Dominguez-Navarro, J. Possibilistic Model Based on Fuzzy Sets for the Multiobjective Optimal Planning of Electric Power Distribution Networks. IEEE Trans. Power Syst. 2004, 19, 1801–1810. [Google Scholar] [CrossRef]
  12. Stojanović, M.S.; Tasić, D.S.; Ristić, A.T. Optimal Allocation of Distribution Automation Devices in Medium Voltage Network. Electron. Electr. Eng. 2013, 19, 9–14. [Google Scholar] [CrossRef] [Green Version]
  13. Popovic, Z.; Knezevic, S.; Brbaklic, B.; Zeljko, P. Optimal number, type and location of remotely controlled and supervised devices in distribution networks. In Proceedings of the 2015 IEEE Eindhoven PowerTech, Eindhoven, The Netherlands, 29 June–2 July 2015; pp. 1–6. [Google Scholar]
  14. Popovic, Z.; Knezevic, S.; Brbaklic, B. Optimal number, type and location of automation devices in distribution networks with distributed generation. In Proceedings of the CIRED Workshop 2016, Helsinki, Finland, 14–15 June 2016. [Google Scholar]
  15. Heidari, A.; Agelidis, V.G.; Kia, M.; Pou, J.; Aghaei, J.; Shafie-Khah, M.; Catalão, J.P.S. Reliability Optimization of Automated Distribution Networks with Probability Customer Interruption Cost Model in the Presence of DG Units. IEEE Trans. Smart Grid 2017, 8, 305–315. [Google Scholar] [CrossRef]
  16. Falaghi, H.; Haghifam, M.-R.; Singh, C. Ant Colony Optimization-Based Method for Placement of Sectionalizing Switches in Distribution Networks Using a Fuzzy Multiobjective Approach. IEEE Trans. Power Deliv. 2009, 24, 268–276. [Google Scholar] [CrossRef]
  17. Pregelj, A.; Begovic, M.; Rohatgi, A. Recloser allocation for improved reliability of DG-enhanced distribution networks. IEEE Trans. Power Syst. 2006, 21, 1442–1449. [Google Scholar] [CrossRef]
  18. Wang, L.; Singh, C. Reliability-Constrained Optimum Placement of Reclosers and Distributed Generators in Distribution Networks Using an Ant Colony System Algorithm. IEEE Trans. Syst. Man Cybern. Part C Appl. Rev. 2008, 38, 757–764. [Google Scholar] [CrossRef]
  19. Abiri-Jahromi, A.; Fotuhi-Firuzabad, M.; Parvania, M.; Mosleh, M. Optimized Sectionalizing Switch Placement Strategy in Distribution Systems. IEEE Trans. Power Syst. 2011, 27, 362–370. [Google Scholar] [CrossRef]
  20. Lim, I.; Sidhu, T.S.; Choi, M.S.; Lee, S.J.; Ha, B.N. An Optimal Composition and Placement of Automatic Switches in DAS. IEEE Trans. Power Deliv. 2013, 28, 1474–1482. [Google Scholar] [CrossRef]
  21. Shahsavari, A.; Mazhari, S.M.; Fereidunian, A.; Lesani, H. Fault Indicator Deployment in Distribution Systems Considering Available Control and Protection Devices: A Multi-Objective Formulation Approach. IEEE Trans. Power Syst. 2014, 29, 2359–2369. [Google Scholar] [CrossRef]
  22. Swarnkar, A.; Gupta, N.; Niazi, K.R. Efficient reconfiguration of distribution systems using ant colony optimization adapted by graph theory. In Proceedings of the 2011 IEEE Power and Energy Society General Meeting, Detroit, MI, USA, 24–28 July 2011; pp. 1–8. [Google Scholar] [CrossRef]
  23. Bedekar, P.P.; Bhide, S.R. Optimum coordination of overcurrent relay timing using continuous genetic algorithm. Expert Syst. Appl. 2011, 38, 11286–11292. [Google Scholar] [CrossRef]
  24. Hairi, M.H.; Alias, K.; Aras, M.M.; Basar, M.M.; Fah, S.P. Inverse definite minimum time overcurrent relay coordination using Computer Aided Protection Engineering. In Proceedings of the 2010 4th International Power Engineering and Optimization Conference (PEOCO), Shah Alam, Malaysia, 23–24 June 2010; pp. 304–307. [Google Scholar] [CrossRef]
  25. Wadood, A.; Kim, C.-H.; Khurshiad, T.; Farkoush, S.G.; Rhee, S.-B. Application of a Continuous Particle Swarm Optimization (CPSO) for the Optimal Coordination of Overcurrent Relays Considering a Penalty Method. Energies 2018, 11, 869. [Google Scholar] [CrossRef] [Green Version]
  26. Singh, D.K.; Gupta, S. Optimal coordination of directional overcurrent relays: A genetic algorithm approach. In Proceedings of the 2012 IEEE Students’ Conference on Electrical, Electronics and Computer Science, Bhopal, India, 1–2 March 2012; pp. 1–4. [Google Scholar]
  27. Khurshaid, T.; Wadood, A.; Farkoush, S.G.; Kim, C.-H.; Cho, N.; Rhee, S.-B. Modified Particle Swarm Optimizer as Optimization of Time Dial Settings for Coordination of Directional Overcurrent Relay. J. Electr. Eng. Technol. 2019, 14, 55–68. [Google Scholar] [CrossRef]
  28. Thillainathan, L.; Srinivasan, D.; Shun, T.Z. Demand side management in smart grid using heuristic optimization. IEEE Trans. Smart Grid 2012, 3, 1244–1252. [Google Scholar]
  29. Huang, H.-T.; Chen, C.-L. Emerging organizational structure for knowledge-oriented teamwork using genetic algorithm. Expert Syst. Appl. 2009, 36, 12137–12142. [Google Scholar] [CrossRef]
  30. Sasikala, J.; Ramaswamy, M. Optimal gamma based fixed head hydrothermal scheduling using genetic algorithm. Expert Syst. Appl. 2010, 37, 3352–3357. [Google Scholar] [CrossRef]
  31. Goldberg, D.E.; Holland, J.H. Genetic Algorithms and Machine Learning. Mach. Learn. 1988, 3, 95–99. [Google Scholar] [CrossRef]
  32. Haupt, R.L.; Haupt, S.E. Practical Genetic Algorithms, 2nd ed.; John Wiley and Sons, Inc.: Hoboken, NJ, USA, 2004. [Google Scholar]
  33. Irfan, M.; Wadood, A.; Khurshaid, T.; Khan, B.M.; Kim, K.C.; Oh, S.R.; Rhee, S.B. An optimized adaptive protection scheme for numerical and directional overcurrent relay coordination using Harris hawk optimization. Energies 2021, 14, 5603. [Google Scholar] [CrossRef]
  34. Chiang, H.-D.; Jean-Jumeau, R. Optimal network reconfigurations in distribution systems. II. Solution algorithms and numerical results. IEEE Trans. Power Deliv. 1990, 5, 1568–1574. [Google Scholar] [CrossRef]
  35. University of Washington. Power Systems Test Case Archive. Available online: https://www.ee.washington.edu/research/pstca (accessed on 25 June 2019).
  36. Vita, V. Development of a Decision-Making Algorithm for the Optimum Size and Placement of Distributed Generation Units in Distribution Networks. Energies 2017, 10, 1433. [Google Scholar] [CrossRef] [Green Version]
Figure 1. Flow chart of CGA.
Energies 15 04709 g001
Figure 2. Block diagram.
Energies 15 04709 g002
Figure 3. Single line diagram of the IEEE 33-bus radial distribution system.
Energies 15 04709 g003
Figure 4. Energy for first line condition.
Energies 15 04709 g004
Figure 5. Energy for second line condition.
Energies 15 04709 g005
Figure 6. Energy for third line condition.
Energies 15 04709 g006
Figure 7. Energy for fourth line condition.
Energies 15 04709 g007
Figure 8. Energy for fifth line condition.
Energies 15 04709 g008
Figure 9. Overall energy variation depending on relay location in different nodes.
Energies 15 04709 g009
Figure 10. Overall energy variation depending on relay location in different nodes.
Energies 15 04709 g010
Figure 11. Single line diagram of IEEE 69-bus system.
Energies 15 04709 g011
Figure 12. Energy for first line condition.
Energies 15 04709 g012
Figure 13. Energy for second line condition.
Energies 15 04709 g013
Figure 14. Energy for third line condition.
Energies 15 04709 g014
Figure 15. Energy for fourth line condition.
Energies 15 04709 g015
Figure 16. Energy for fifth line condition.
Energies 15 04709 g016
Figure 17. Energy for sixth line condition.
Energies 15 04709 g017
Figure 18. Energy for seventh line condition.
Energies 15 04709 g018
Figure 19. Energy for eighth line condition.
Energies 15 04709 g019
Figure 20. Overall energy depending on relay location in different nodes.
Energies 15 04709 g020
Figure 21. Overall energy variation depending on relay location in different nodes.
Energies 15 04709 g021
Table 1. Studied condition and number of lines on which relays are installed.
Number of Arrangement Number of Lines on Which Relays Are Installed
Line Condition 13681820212223242530
Line Condition 237111820212223242530
Line Condition 336111820212223242731
Line Condition 45681820212223242530
Line Condition 571114182021222324252831
Table 2. Best relay location.
56182021222324252830
Table 3. Studied condition and number of lines on which relay are installed.
Condition
Number of lines on which relays are installedABCDEFGH
5101055555
1014131010101010
1322221715131317
2828282828282828
3030303030302930
3534343535353036
3636363636363641
3838383838383847
4141414141414150
4747474747474751
4949494949494952
5050505050505059
5151515151515163
5252525252525266
5353535353535368
62565662626262
66626266666666
68666668686868
6767
6868
6969
Publisher’s Note: MDPI stays neutral with regard to jurisdictional claims in published maps and institutional affiliations.

