Abstract
This research addressed a need for technical evaluation of the oceanic scenario of Panama for the use of Ocean Thermal Energy Conversion (OTEC). Its bathymetry and location can potentially lead to the exploitation of OTEC, diversifying the energy matrix and helping achieve sustainability. Nevertheless, site selection for OTEC can be a complex task since it involves various alternatives, with different quantitative and qualitative criteria, which may conflict in some cases. Optimization and multiple criteria (MCD) methods have been used lately to address these issues; however, their use is still limited. Here, Analytic Hierarchical Analysis (AHP) is proposed as a MCD method for site selection. Six sites of interest were considered as the alternatives for a plant installment. These sites were chosen, excluding the environmentally and aboriginal protected areas. The quantitative criteria considered were surface and deep-water temperatures, coastline distance, gross and net efficiency. Those variables related to the efficiency, such as the water temperatures, can be considered the most influential, leading to Punta Burica, located on Panama’s Pacific coast, as the best option (96.17%).
1. Introduction
The sun serves as the main source of energy on the planet. The incident radiation is absorbed by the ozone in the stratosphere and much by the clouds. About 35% of it is reflected into space, and then 66% of the remaining energy is absorbed by the Earth’s surface. Considering that more than two-thirds of the Earth’s surface is hosted by water, the oceans represent the most prominent solar energy collectors and, thus, the largest global energy reservoir [1,2].
The most considerable ocean thermal energy is hosted near the Equator [3,4,5]. Geographically, Panama is located in Central America, bordering the Caribbean Sea and the Pacific Ocean, between 7° and 10° North latitude and 77° and 83° West longitude. Therefore, Panama’s ocean scenario displays thermal energy resource potential [6,7,8]. However, since Panama has a broad oceanic scenario, knowing its location is not enough to guarantee the sustainability of implementing marine energy exploitation, such as OTEC (ocean thermal energy conversion).
OTEC technology uses the temperature difference between warm ocean surface waters and deeper cold waters. The zones that achieve adequate thermal differences to take advantage of the oceanic thermal resource are generally close to tropical areas, near the Equator, as shown in Figure 1. However, because temperature jumps are around 20 °C, a low efficiency can be reached. Despite this, the global theoretical potential for OTEC has been estimated at 44,000 TWh/year, making OTEC an attractive alternative to cater to particular needs of society [9,10,11].
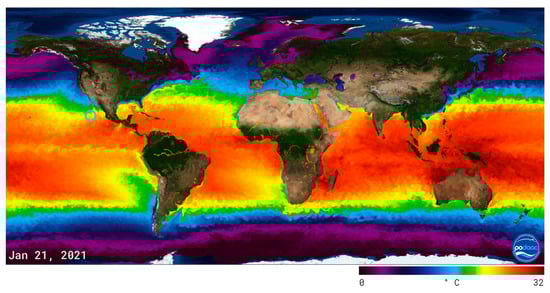
Figure 1.
Global oceanic thermal resource and location of Panama (enclosed in the light blue circle) [12].
A good site selection is a key factor in implementing a sustainable and successful project that aims to exploit ocean thermal energy, regardless of the targeted objective or benefit [13]. Therefore, the proper site selection for the implementation and viable installation involves the analysis of various variables, qualitative and quantitative.
Many criteria can help assess the potential of the thermal resource for a site that can later be used by OTEC technology addressing sustainability. For instance, this technology’s efficiency depends on variables such as depth, the temperature of deep cold seawater, warm sea surface temperatures, and anomalies of warm sea surface temperatures [13,14]. Thus, site selection can quickly become a multi-criteria decision-making (MCD) problem, and it generates a conflictive scenario that houses technical, social, economic, environmental, and legislative criteria [13]. Moreover, studies on this topic implementing the classic methods of MCD are limited because many of the decisions for selecting OTEC sites are subjective concerning the criteria of each decision-maker (DM). The accurate decision regarding the site selection for OTEC systems represents the fundamental basis in the planning process for the use of ocean thermal energy and sustainability of this technology [15].
The difficulty for a site selection process lies in the number of indicators or the amount of data available and comparing each set of indicators corresponding to each alternative of interest, besides granting an assessment that justifies a degree of importance among the criteria considered. Then, it is paramount first to identify the aim to use the local oceanic thermal resource. OTEC allows obtaining various benefits from the use of the oceanic thermal resource [14,16], including different classifications for OTEC plant (On-Shore or Off-Shore). OTEC technology is used for: electric power generation [17], air conditioning [11], industrial refrigeration [6], aquaculture [18], liquid hydrogen production [19] and desalinated water [19]. Then, the alternatives with the most significant potential within the oceanography can be selected considering the environmental legislative regulations, for instance, whether the planned lands belong to the group of areas or regions environmentally protected. After this, appropriate criteria set can be drawn by means that match the project’s goals of interest.
This problem addresses various variables, some of which are not directly related to the nature of the oceanic scenario. For instance, some qualitative aspects generate added value to the implementation of this technology, such as environmental, political, and social impact [14]. Most studies that have been conducted are related to the analysis of one or more of the criteria influencing decision-making for the selection of OTEC sites. These criteria include temperature gradient, bathymetric characteristics, environmental, social, and economic impact [16].
Addressing sustainability according to environmental, social, and economic impacts can be a rather difficult task since the lack of absolute instruments for evaluations or available data can endanger the precision and reliability of the results. Even though some of them have been assessed previously in the literature, such as environmental impact assessment and sustainability [14,16], sustainability of society [13,14], energy sustainability [3,20], economic sustainability [14], sustainability of construction and maintenance [13,21], and sustainability of the auxiliary condition [14].
These considerations and several variables that categorize the site selection for OTEC render the site selection a complex study scenario. Furthermore, one must consider the dependence between the relevance given to each of these aspects by specialists or researchers during the decision-making process and the discrepancy that this can project due to the degree of knowledge and experience each possesses.
In Panama’s scenario, the lack of legislation and regulations and the lack of information and specialists can render a complex task for implementing OTEC technology. This research only includes variables or quantitative indicators justified and validated with software that use oceanographic data in real-time, such as the World Ocean Atlas and the NOAA database, compared with the corresponding literature.
The qualitative variables depend on the evaluator’s degree of knowledge, experience, and specialty. Therefore, it carries the uncertainty corresponding to the sensitivity of human perception, which generates a more complex scenario in the validation and justification of the weighting for assessing the importance of these indicators.
2. Materials and Methods
This study aimed to analyze and select potential sites for OTEC exploitation within the Republic of Panama. A Hierarchical Analysis Method (AHP) was used as a MCD to analyze the criteria to identify the advantages, disadvantages, applicability, and reliability of a site within the oceanic territory of Panama. Subsequently, the analysis of this problem was approached as a particular case of MCD, using the initial process proposed by Thomas L. Saaty (The Analytic Hierarchy Process, 1980); for the formulation of any case of AHP-MCD [22,23].
All the possible criteria and sub-criteria and the indicators that address the subject under study were identified. An exclusion–inclusion criteria model was performed to address the qualitative criteria. Then, a model was proposed for this case, presenting a hierarchical structure where all aspects (indicators) relevant to the justification of the problem under study were considered. Each selected indicator was evaluated and quantified by considering their direct effects on the net production of the system, besides on guaranteeing the potential of the oceanic thermal resource housed in each alternative; for this valorization, the Saaty fundamental scale was used.
A comparison of the matrices was performed to justify the assessment or priority of each indicator at the time of being compared with itself and with the others. These comparisons represent the importance of the criteria, establishing the most significant importance to the criterion with the greatest relevance to the subject under study.
Next, the prioritization and synthesis were carried out. In this stage of the AHP, the different priorities considered for resolving the problem are provided. The priority represents an abstract unit valid for any scale in which the decision-maker’s preferences consider appropriate when integrating tangible, intangible, quantitative, and qualitative aspects.
Subsequently, the consistency of the randomly generated matrix of paired comparisons was justified by using the method provided by the AHP to estimate the degree of consistency between the paired opinions provided by decision-makers. Therefore, the consistency radius, consistency index, and random index are calculated to justify whether the judgments are inconsistent or have a reasonable level of consistency.
The radius of consistency is a ratio or quotient in which if its values exceeds 0.10, it indicates that the judgments are inconsistent; therefore, the original values of the matrix of paired comparisons should be reconsidered and edited. For the case where CR is less than 0.10, this represents a good and reasonable indication in paired comparisons.
Finally, the prioritization matrix of alternatives is presented. In this, it is possible to justify and identify the best alternative within the oceanic territory where the OTEC plant must be installed. In Figure 2, we can see a flowchart corresponding to the methodology addressed in this research.
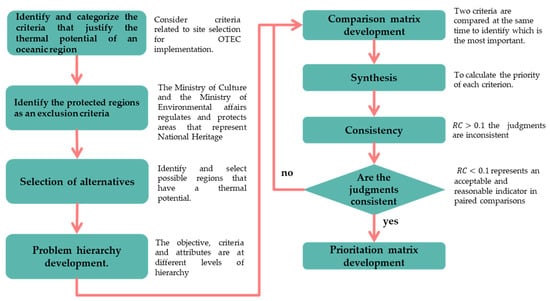
Figure 2.
The methodology proposed for developing and implementing the AHP-MCD method in site selection for OTEC.
2.1. The Analytic Hierarchy Process Method (AHP)
The AHP method analyzes and develops complex decision-making problems of multiple MCD criteria [22]. The AHP is based on identifying all the variables involved in a problem, linking them according to all possible solutions, and concluding [23]. The AHP method efficiently and graphically organizes the respective information for any problem under study [24]. The AHP is a hierarchy with priorities, where these show the overall preference corresponding to one of the decision alternatives [23].
The AHP method uses direct quantitative allocation scales to prioritize the criteria and make comparisons between criteria pairs [25]. This step aims to build a vector of priorities or weights that evaluates the relative importance of the decision-making unit given to each criterion. Table 1 shows the fundamental scale proposed by Saaty for this process [26].

Table 1.
Saaty’s scale for the absolute numbers corresponding to the priority and importance of these considering their respective definitions and degree of contribution [22,23,27].
2.2. Application of the AHP Method
2.2.1. Prioritization
The AHP requires a preference or priority to each alternative decision, considering the extent to which each criterion contributes. A mathematical procedure called synthesis summarizes the information and provides a hierarchy of criteria for alternatives in terms of global preference [23].
2.2.2. Paired Comparisons and Paired Comparison Matrix
The fundamental bases of the AHP are the paired comparisons [23]. The AHP uses the Saaty table to assess relative preferences when comparing two elements. The matrix of paired comparisons contains alternative comparisons or criteria. Therefore, if one considers a matrix A of dimensions , with the relative judgments about the criteria, and is the element of A, for
Then, one can state that A is a matrix of paired comparisons of criteria if is the measure of the preference of the criterion in the row when compared to the criterion in the column . When , the value of will be equal to 1 since the criterion is being compared with itself.
In addition, it is fulfilled that: that is:
The complexity of these decisions becomes more significant the greater the scope of the problem is. This can be addressed by using methodologies that allow structuring the problem, modeling it, efficiently weighing the criteria relevant to that decision, and then defining the alternative that best suits them.
2.2.3. Synthesis
The synthesis consists of calculating the priority corresponding to each criterion being compared. The following is the procedure corresponding to three steps, which provide an approximation of the synthesized priorities [23]:
- -
- Add the values in each column of the matrix of paired comparisons.
- -
- Divide each element of such a matrix by the total of its column; the resulting matrix is called the normalized paired comparison matrix.
- -
- Calculate the average of the elements of each row of the relative priorities of the elements being compared.
2.2.4. Priority Matrix
It summarizes the priorities for each alternative to each criterion. For criteria and alternatives [23]:
where is the priority of alternative over criterion for .
The column vector results from the product of the priority matrix with the priority vector of the criteria.
where is the overall priority (over the overall goal) of the alternative .
2.2.5. Consistency
It refers to the consistency of the judgments expressed by each DM during the stage of paired comparisons. It is necessary to remember that perfect consistency is tough to achieve. Therefore, some inconsistency is estimated for any set of paired comparisons after these judgments. The AHP provides a method for estimating the degree of consistency between the paired opinions provided by those responsible. If the degree of consistency is acceptable, the decision process is continued; although, if this is unacceptable, the DM must reconsider its judgments corresponding to the paired comparisons and then continue with the analysis.
To determine whether a level of consistency is “reasonable,” it is necessary to establish a quantifiable measure for the comparison matrix A where represents the number of alternatives to compare. If the matrix A is perfectly consistent, it generates a normalized matrix A of elements (for ). Such, all columns are identical, that is [23]:
From the given definition of A, we have:
More compactly, we say that A is consistent if and only if:
where is a column vector of relative weights approximated with the average of the elements of the line in the normalized matrix N. The AHP quantifies the consistency ratio (CR) employing Equation (8), being this the quotient between the consistency index (CI) of A and the random consistency index.
where CI is the consistency index of A and is calculated using Equation (9).
IA represents the random consistency index of A; it is the consistency index of a matrix of paired comparisons generated randomly. This depends on the number of elements that are compared. However, there are other alternatives to estimate the random consistency index; some specialists suggest the Equation (10).
The Consistency Ratio (CR): represents an indicator of the acceptability of the consistency of the analysis. If indicates that judgments are inconsistent; therefore, it recommends reconsidering and modifying the original values of the matrix of paired comparisons. However, for the case where it represents a reasonable level of consistency in paired comparisons. The consistency ratio can be calculated using Equation (11).
2.3. Location of the Study Area
Panama is in the intertropical region near the terrestrial Equator, with coastal limits in the Caribbean Sea and Pacific oceans (Figure 1). Therefore, Panama’s oceanic territory reflects significant ocean thermal potential; since its geographical location could allow benefiting from the use of this resource [5].
The corresponding process to justify the selection of a suitable site objectively and reliably for the installation of OTEC technology represents a process and analysis of the ocean scenario of each region. This process is linked to the norms or legislations of each nation. Even within the same nation, this analysis procedure could show certain discrepancies between the variables corresponding to the potential of each site and the viability of the technology [16,28]. To assess these matters, a set of inclusion-exclusion criteria was defined based on subjects such as environmentally protected areas, defined by the Environmental Affairs Ministry of Panama [29], aboriginal protected areas, distance to a potential population that can make a profit from these technologies, available data, among others. This process led to the selection of six potential sites. Table 2 below mentions the six sites of interest within Panama’s ocean scene.
Table 2.
Sites of interest to evaluate the ocean thermal energy potential in the Republic of Panama.
2.4. Criteria for Estimating the Potential and Sustainability of the Oceanic Thermal Resource
Currently, criteria have been identified that justify the potential of the thermal resource hosted in any site of interest. However, in this research, problems were addressed considering certain criteria or indicators that justify the ocean thermal potential identified as the variables that govern decision-making in selecting sites for OTEC from the perspective of sustainability and environmental impact.
From the literature, it was possible to identify specific global criteria that address the problem from the literature. This study’s criteria to be considered are warm water temperatures (), depth, thermal efficiency, and absolute efficiency. The data was taken from the monthly statistical mean (2016–2018) using the Ocean Data View (ODV) software version 5.5.1. In addition, the variables were evaluated regarding anomalies in surface water temperatures during annual periods; for each case, their respective temperature jumps, or thermoclines are presented.
Next, Figure 3 shows the diagram corresponding to the problem under study. The main objective is to guarantee the operationality of OTEC in the oceanic territory of Panama, sustainably responsible for the environment, and that complies with Panama’s legislation. In addition, the alternatives of interest and the criteria used in the analysis and development for the selection were identified.
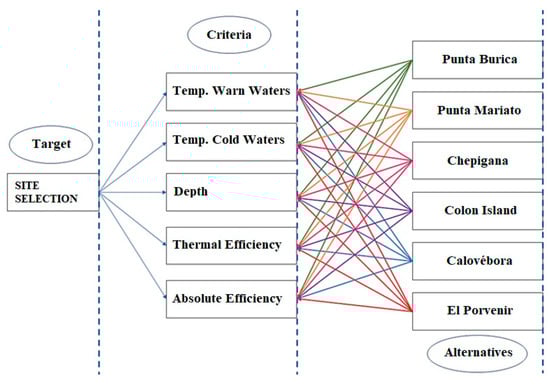
Figure 3.
Hierarchical site selection analysis tree for OTEC technology.
2.5. Sea Surface Temperatures (SST)
The SST is closely related to the operationality of OTEC systems. Within the Rankine cycle, the evaporating agent of this technology will be the warm seawater in which a temperature of about 26 °C is necessary to reach the expected efficiency [3,30]. Therefore, it is necessary to evaluate whether the alternatives of interest record these readings.
These data were considered from the World Ocean Atlas 2018 (WOA18) database. This is a set of climatological fields of SST, salinity, density, cold water temperatures, distances to coasts, and in situ bathymetry. For this investigation, the scale of 0.25 × 0.25 degrees of pressure was used. The coordinates corresponding to the meteorological stations have been identified for each site. Later, these data were synchronized with the ODV software, and the respective quantitative values were obtained for each criterion to be considered.
In Figure 4, the annual behavior of the surface temperatures corresponding to the three selected sites in the Panamanian Pacific can be observed, SST ≈ 26 °C was considered, this being a reference as the adequate SST for OTEC systems to show an efficiency actual acceptable [18,31].
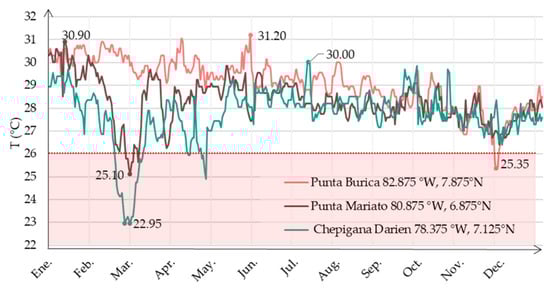
Figure 4.
Panama’s Pacific SST for 2018 obtained from World Ocean Atlas in 2018.
The most negligible temperature anomalies for shorter periods were recorded in Punta Burica. During this period the SST reached values approximately 31 °C being higher al recommended in his research [3,32]. The SST of Punta Mariato did not reach the maximum temperatures observed in Punta Burica (31 °C), but they were very close 30.90 ± 0.01. This site shows disturbances that are manifested during March, as shown in Figure 5, corresponding to the annual anomalies of the SST of Panama’s Pacific coast. The Gulf of Panama experienced changes in its SST of approximately 3.0 °C, corresponding to the purple color and the PODAAC scale.
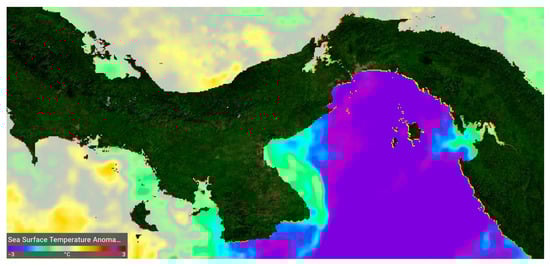
Figure 5.
Surface temperature anomalies of the oceanic territory in the Pacific of Panama in March 2019.
The Sea Surface Temperature Anomalies (SSTA) represent the changes experienced by the SST greater than the temperature unit in a period. These oscillations experienced by warm surface waters are directly proportional to the operationality of the OTEC technology in terms of efficiency and net production [33,34].
In the case of Chepigana, greater differences can be observed; this behavior can be related to the warm current that emerges from the Gulf of Panama through the process called EKMAN transport [8,35,36], in which due to the displacement of the water masses product of the winds and the Coriolis effect, the cold deep waters rise and emerge on the surface. These phenomena manifest themselves during the March reflecting SST ≈ 23 ± 0.001 °C.
Since this value was lower than the recommended in the literature [3,15,29], this site was considered less attractive. Figure 6 shows the anomalies corresponding to the SST of the Panamanian Caribbean. This scenario shows better stability in STT anomalies than those observed in the Pacific.
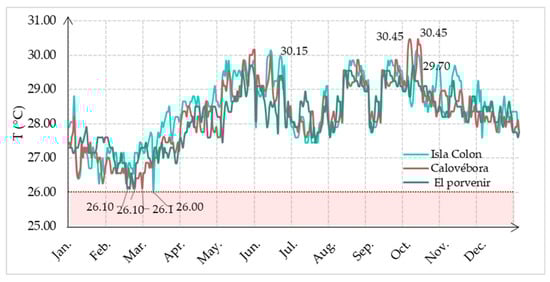
Figure 6.
Anomalies of the surface temperature of the Oceanic territory in the Caribbean of Panama in the year 2018. Obtained from World Ocean Atlas in 2018.
For this case, other indicators or variables should be considered that allow justifying which of the three sites hold the most significant thermal potential considering the operationality of the OTEC system since this Panamanian Caribbean scenario projects insignificant discrepancies. Figure 7 shows the SST of the sites with the greatest potential in the Caribbean and Pacific region of Panama and their respective disturbances and shows the minimum 25.35 ± 1.07 °C and maximum 31.20 ± 1.07 °C annual SST values.
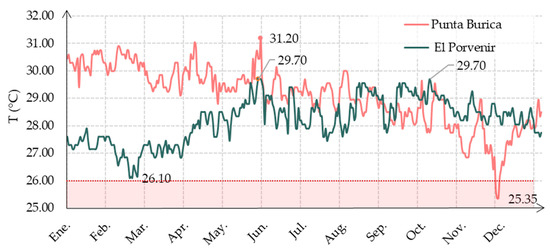
Figure 7.
Surface temperature anomalies of the territory of Panama in 2018.
As shown in Figure 4, Punta Burica reaches less than 26 °C during a short period during December; however, the temperature remained above this reading from that month. The difference in these variables between these two sites is not considered from a quantitative point of view. Therefore, it would be necessary to consider other variables to select a site with the best conditions to implement OTEC technology.
Figure 8 presents the disturbances corresponding to the SST of Punta Burica in the Pacific of Panama during the years 2016–2018. When comparing the anomalies shown by the SST between these years, during the period between November 2016 and the beginning of December 2016, a cooling below 26 °C was identified. When evaluating the remaining disturbances, these reflected temperatures seemed suitable for implementing OTEC technology.
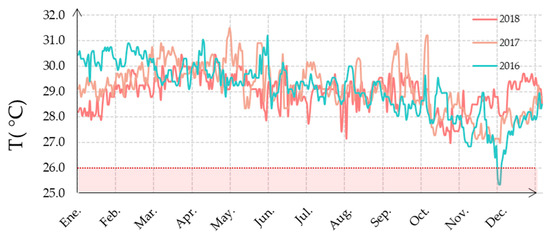
Figure 8.
Disturbances of surface water temperatures (SST) in Punta Burica during the years 2016–2018.
2.6. Temperatures of Cold Sea Waters (SST) and Depth
The variable temperatures of cold waters of the deep sea are directly linked to depth. For the operationality of OTEC systems, waters with temperatures of approximately 4–5 °C needed and these are housed at depths on average between 700–1000 m [1,11,37,38]. In previous research such as OTEC Alternative for the Electric Power Generation in Panama, we can observe the bathymetric map of Panama and identify where these waters are housed [5].
In the particular case of implementing this technology in order to generate electricity, pumping systems consume approximately three-quarters of the production of the design [15,30,39]. Therefore, if the site of interest hosts cold waters at depths greater than those recommended [1,31], the system will have to overcome a greater hydrostatic force in the suction line; thus, the consumption by the pumping system will increase, and the net production of the system will be reduced, which could reduce the sustainability of the system [1,15,40,41]. Figure 9 and Figure 10 show that the thermoclines for Punta Burica in the Pacific and El Porvenir in the Caribbean Sea, respectively, can be observed for five annual periods.
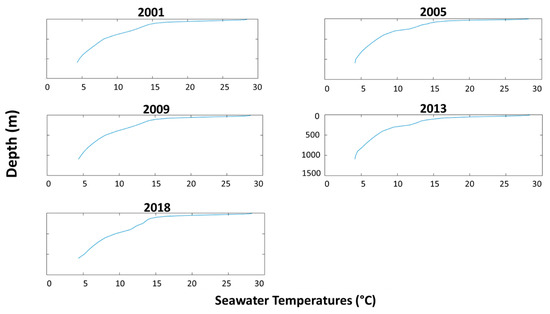
Figure 9.
Punta Burica Thermocline 82.875° W, 7.875° N.
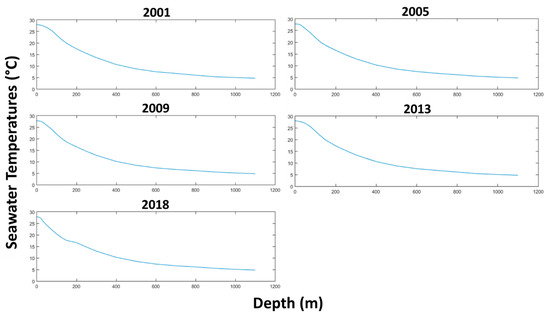
Figure 10.
El Porvenir Thermocline 79.125° W, 9.875° N.
After considering the respective measurements in Figure 9 and Figure 10, it is possible to justify if there is a directly proportional relationship between the criterion cold water temperatures and depth. In addition, this relationship is linked to the net production of the system [15,42].
Figure 10 shows how in the oceanic scenario in Punta Burica, cold waters can be found at 1200 m. However, these temperatures are housed at a depth greater than 1500 m for the case corresponding to El Porvenir. For both scenarios, the results projected during the five annual periods are observed, depicting similar values, which indicates the stability of the resource during each period that could guarantee the continuous and stable operationality of OTEC.
In addition, it can be observed that after reaching 4 °C in deep-sea waters achieving a unit of increase of this criterion per unit length of depth becomes linear; therefore, it is more complex and less attractive from a production point of view.
These criteria are related to technical, environmental, structural, operational, and economic aspects, raising the complexity of ensuring the proper selection of a site for OTEC. Figure 11 reflects the relationship between temperature differential and depth, where the cold waters of the deep sea are housed. These are used by OTEC technology in its condensation system.
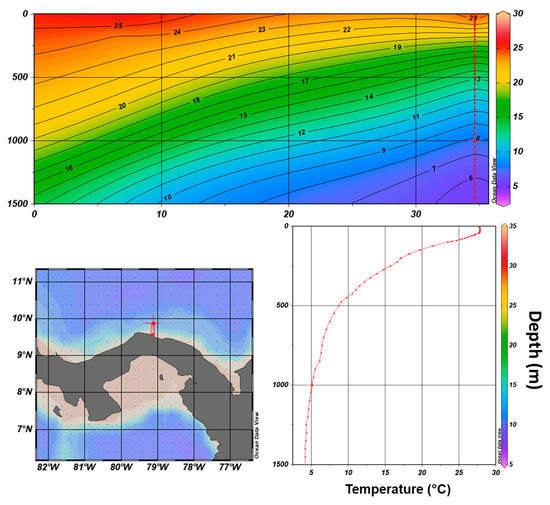
Figure 11.
Bathymetric variables corresponding to El Porvenir 79.125° W, 9.875° N.
El Porvenir hosts cold waters at 1000 m, where these waters have measurements of 5.1 °C, considering that the lowest sea surface water temperature recorded in the 2018 period was 20.97 °C; this site showed a temperature difference of 21.77 °C. If the variables corresponding to Punta Burica are considered and then compared with El Porvenir, it is observed that proper cold waters that ensure OTEC’s functionality are reached at greater depths in this site. However, this site shows greater potential in its surface scenario.
Identifying which site is the most suitable for OTEC involves considering other variables such as the depth of cold water. In El Porvenir it is greater than in Punta Burica, which affects the amount of energy that the cold-water pump must be supplied to the condensation system. Both sites comply with the recommendations [3,32].
In Figure 12, the bathymetric variables corresponding to Punta Burica are depicted. The figures also depict the location of the data collection point, and the corresponding thermocline can also be observed. The temperature profiles under study are projected and their variation along with the distance to the coast. A stable scenario is projected for this site with favorable temperatures for OTEC technology.
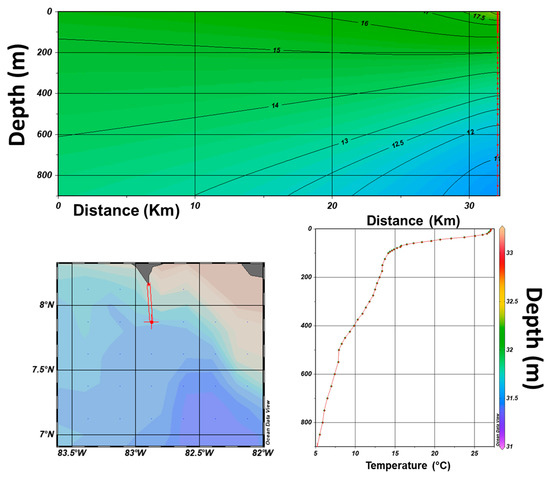
Figure 12.
Bathymetric variables corresponding to Punta Burica.
2.7. Thermal and Absolute Efficiency
For thermal performance, two criteria are considered in this study: thermal efficiency and absolute efficiency. In the case of OTEC efficiency, whether the energy resource can be used or not depends largely on the efficiency of OTEC, which can be estimated by the ideal Rankine cycle, by the Equation (12) [30,43]:
where : ORC efficiency. : Absolute warm water temperatures at a depth of 20 m. : Absolute coldwater temperature at a depth of 700–1000 m. It is considered that certain losses induce the reduction of the production of electrical energy. This a gross OTEC efficiency (, in%) [14,44] can be described as:
where : gross efficiency of the OTEC system. : efficiency of the turbogenerator or turbine.
3. Application of the AHP Method
3.1. Thermal and Absolute Efficiency
Implementing OTEC technology currently faces various challenges in its low efficiencies and absence of legislation that regulates its implementation. However, there is another issue of interest for the sustainable implementation of OTEC. The appropriate selection for the installation of an OTEC plant aims to guarantee its sustainable operationality. This theme addresses environmental aspects, operational sustainability, legislation, and the Sustainable Development Goals (SDGs), which represent quantitative and qualitative aspects that directly affect the justification for selecting the OTEC site.
After evaluating the oceanic scenario of Panama, considering three sites of the Panamanian Caribbean and the Panamanian Pacific, the following research question arises:
What is the most appropriate site for the installation of the OTEC plant?
This topic was categorized as a particular case study MCD-AHP. Therefore, the considerations involving the problem under study were identified:
- -
- Technical analysis of the thermal potential that is hosted in each site of interest was proposed; these sites are the alternatives in our AHP.
- -
- Only quantitative variables were considered.
- -
- The quantitative variables were evaluated in three annual periods corresponding by using ODV software.
- -
- Different depths shall be considered for the above measurements.
- -
- Decision-making was carried out considering state of the art.
- -
- The SAATY table was used to establish the quantitative importance of each indicator and alternative.
- -
- Qualitative variables for this case were not considered.
- -
- Only the criteria were considered; the sub-criterion for this case is not considered due to the lack of information in our panorama.
In Table 3, the alternatives for OTEC installation were considered with their respective criteria. These were identified, accounting for the previous review where specific global criteria that address the problem were identified; in addition, the values were justified using ODV.
Table 3.
Corresponding criteria for each site are considered as an alternative for the installation of OTEC in Panama.
3.2. Prioritization
Table 4 shows the priorities corresponding to each criterion identified and considered in the MCD-AHP for the appropriate selection of the site. The quantitative value assigned to each criterion was justified using the Saaty table, and the priority of each of these is based on its relevance in the operationality of the system addressed in state-of-the-art [45].
Table 4.
Hierarchy of the criteria is considered an alternative for installing OTEC in Panama for each site.
The first criterion considered represents the TSS. This criterion evaluates the consistency of energy generation taking advantage of the oceanic thermal resource since it allows measuring the temperature difference between warm surface waters and cold waters of the deep sea. In Table 4, this criterion was assigned the value of 1 because during the process of developing the matrix of comparison of criteria, regardless of the value assigned for it at the time of being compared, it will be compared with itself, therefore, it represents equality [13,46].
Coldwater temperatures represent the second criterion; this allows us to assess the temperature differentials between sea waters. It was therefore considered moderately preferable (3). When analyzing ec.1, it is evident that the value of the OTEC efficiency is proportional to the increase in the temperature difference between surface and deep waters [47]. In addition, there is a sub-criterion linked to this, representing the distance or depth where the cold waters of the deep sea are housed. This criterion depends on the increase in the hydrostatic load in the suction line and, therefore, the power needed for the condensation circuit pump, consequently the OTEC plant’s net production.
The third indicator or criterion is the distances to coastlines, the magnitude of this criterion is directly proportional to the thermal energy housed per unit area. Therefore, it was considered between moderate and strongly preferable (4). This indicator allows estimating the operational consistency of OTEC [14,16]. In addition, this criterion represents a cost in the design of an Offshore flat, since it demands cables to transport the energy resource produced to the supply network located on land, it is important to mention that for this type of installation, it is necessary to contemplate the energy losses per unit length in the energy transport cable and the costs generated by the transport of personnel.
Thermal efficiency represents the fourth indicator. It is related to the thermal potential housed in the area of interest, as OTEC shows low efficiencies for this indicator, it was assigned a value of (2) that represents between equal and moderately preferable. In addition, this indicator allows to evaluate the consistency of the operationality of the OTEC plant [16,21].
Gross efficiency represents the fifth indicator. This allows us to consider the losses in OTEC production since it contemplates for this analysis the efficiency of the turbine [31,44]. For this case, it was assigned a weighting of 3, which is moderately preferable with respect to the other criteria.
Note that this process arises from quantitative values of each variable of interest in each alternative. After this, we proceed to carry out a priority establishment analysis, where this process is clearly subjective to the knowledge and experience of decision-makers and finally identify the importance of each criterion.
3.3. Paired Comparisons and Paired Comparison Matrix
In Table 5 the matrix of the results of the paired comparison can be observed.
Table 5.
Paired criteria comparison matrix.
3.4. Synthesis
In Table 6 are the results corresponding to the synthesis or normalized matrix. These data represent the result corresponding to the procedure for establishing the approximation of the priorities of each alternative.
Table 6.
Synthesis matrix used to calculate the weighting vector from the criteria comparison matrix.
3.5. Priority Matrix and Consistency
Table 7 presents the overall priority corresponding to each decision alternative that is summarized in the column vector.
Table 7.
Random consistency indices corresponding to the sample size.
4. Results
4.1. Prioritization Warm Water Temperatures (°C)
Considering the TSS criterion, Figure 13 shows the prioritization of this indicator with respect to each alternative under study. From the results obtained, we can say that the best alternative identified under this consideration is site number one (Punta Burica).
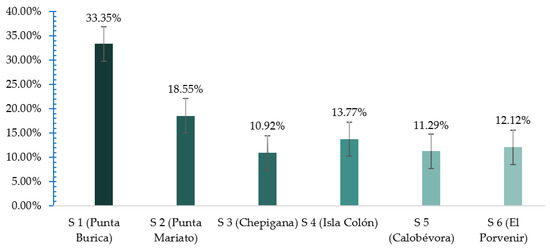
Figure 13.
Prioritization percentages for the criterion: Temperatures of warm sea waters corresponding to each alternative.
The TSS is directly linked to the thermal efficiency of the OTEC system since the efficiency of the OTEC system is dependent on the temperature of warm waters, as shown in Equation (1). Therefore, the sustainability in operation of an OTEC Plant is intimately linked to the disturbances experienced by TSS.
Punta Burica showed the highest percentage of prioritization, 33.35% with respect to the other sites or alternatives, whereas site three (Chepigana) achieved the minimum value of 10.92% for this comparison. These data attained an error rate of approximately 8%, which provided reliability in the results for the prioritization of SST.
4.2. Prioritization Distance to the Coastline (km)
The distance to coast criterion denotes a determining variable in site selection since considerable lengths of power lines are needed to transport the energy produced by OTEC to the grid on land.
This criterion can also be categorized as one of the techno-economic aspects of OTEC since it considers maintenance costs, energy transport lines, and continuous transport of labor personnel, the higher this variable, the greater these preserves will be directly linked.
Figure 14 depicts the results corresponding to the distance to coast criterion priority, site one (Punta Burica). This shows the minimum percentage of 10.19% concerning the other five study sites because it is more distant from the site where the cold waters of the deep sea are housed. For this case, site six (El Porvenir) shows the highest hierarchy with a 32.88% prioritization, which tells us that only considering this criterion, our best alternative to implement OTEC would be site six.
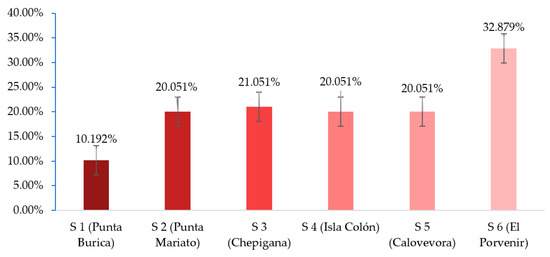
Figure 14.
Prioritization percentages for the criterion: Distance to the coastline (km), corresponding for each alternative.
4.3. Thermal Efficiency Prioritization (%)
OTEC efficiency represents an indicator closely linked to the potential of the oceanic thermal resource as an energy resource. This can be estimated using the ideal Rankine cycle using Equation (12).
When considering the criterion or thermal efficiency indicator, site one (Punta Burica) shows the highest hierarchy with 23.91% regarding the other remaining sites under study. Although, the difference of this indicator is minimally considered to the rest of the alternatives. Figure 15 shows that site six (El Porvenir) is the one that presents the minimum percentage of 11.17% of hierarchy for this criterion.
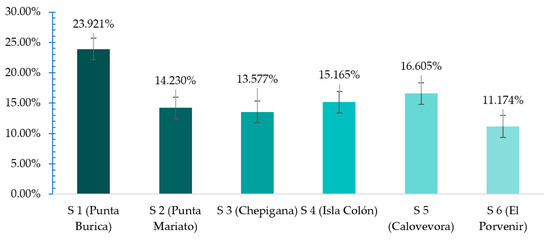
Figure 15.
Prioritization percentages for the criterion: Thermal Efficiency (%), corresponding for each alternative.
When considering only this criterion, our less favorable alternative to installing an efficient OTEC system would be El Porvenir, and the most propitious site would be Punta Burica, with a prioritization percentage of 23.92%, note that for this case, the error percentage is approximately 4%, which projects us a greater reliability in the results obtained.
4.4. Prioritization Gross Efficiency (%)
This indicator considers the turbine’s efficiency, which induces certain losses due to the continuous use of this element, reducing the production of electrical energy. The analysis corresponding to this can be seen in Figure 16. As for the evaluation corresponding to the gross efficiency criterion, considering all the alternatives, the picture is similar for the case of thermal efficiency, where site one (Punta Burica) presents the highest hierarchy with a percentage of 25.083% and site three with the minimum registered of 7.067%. These results reflect an error rate of approximately 4%, giving us reliability of 96% when considering this criterion individually.
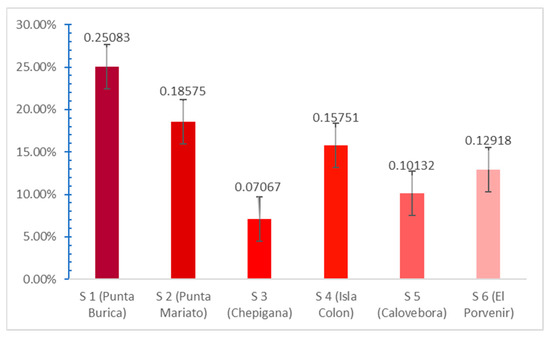
Figure 16.
Prioritization percentages for the criterion: Gross efficiency (%), corresponding for each alternative.
4.5. Prioritization Deep Sea Cold Water Temperatures (°C)
Finally, considering the temperature criterion of cold water of deep-sea being these primordial for the condensation system of the OTEC plant. The temperatures of these waters are intimately linked to thermal efficiency, gross system efficiency and OTEC net power.
Achieving cold water masses from the deep sea directly affects the condensation system. If these are housed at greater depths, the greater the losses to be overcome in the suction line. Therefore, the power and consumption corresponding to this pumping system will increase proportionally.
Figure 17 shows this panorama corresponding to the prioritization of this indicator, where Punta Burica and site two (Punta Mariato) present the highest percentages of hierarchy, 24.55%, and 22.76%, respectively, both located in the Pacific Oceanic scenario. Site three (Chepigana), which is located in the Gulf of Panama, registers a minimum of 6.38%. For this case, the results show the reliability of approximately 95%.
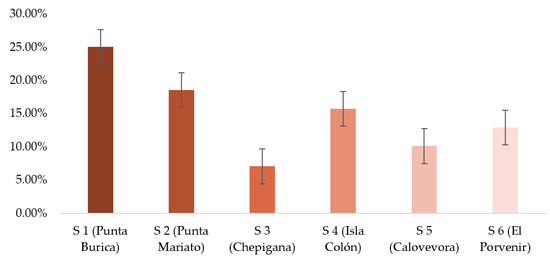
Figure 17.
Prioritization percentages for the criterion: Coldwater temperatures (°C) corresponding for each alternative.
The Caribbean sites: Isla Colón, Calovébora, and El Provenir, have hierarchies of 15.751%, 10.285%, and 12.018%, respectively. The Caribbean scenario has warm and cold-water temperatures more stable during annual periods; however, the necessary cold waters are more distant from the coasts or mainland.
4.6. Hierarchical Prioritization
Figure 18 presents a summary of the prioritization percentages for each of the criteria studied in decision-making regarding the selection of the most favorable site for the use of the oceanic thermal resource in Panama. Here, it can be identified the prioritization of each corresponding criterion for each alternative; for some of these, the distance to the coastline criterion has greater prioritization. However, in other alternatives, warm water temperatures adopt the prioritization to the others.
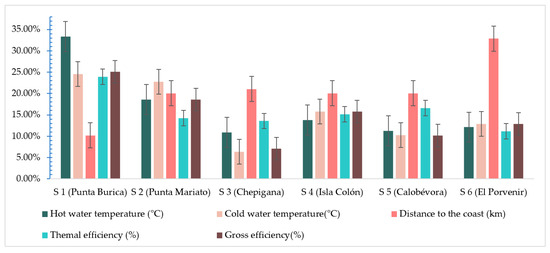
Figure 18.
Prioritization percentages corresponding to each respective criterion of each alternative for the use of Panama’s oceanic thermal resource.
Then, when using the MCD-AHP method to evaluate this issue, Punta Burica performs as the best alternative for using the oceanic thermal resource through the sustainable implementation of OTEC technologies.
It is important to mention that this alternative turns out to be the most appropriate of the six without considering the added value induced by the qualitative variables. That is because there are currently no legislations that allow us to estimate this value in terms of social and environmental impact.
4.7. Prioritization of Alternatives (Standardized Matrix)
Figure 19 shows the percentages corresponding to the prioritization of our alternatives with a Critical Radius of 0.054, which is satisfactory, considering the AHP model, which also justifies the consistency in the paired comparisons made during our analysis. Punta Burica represents the best technical alternative for installing and executing an OTEC plant in the open sea.
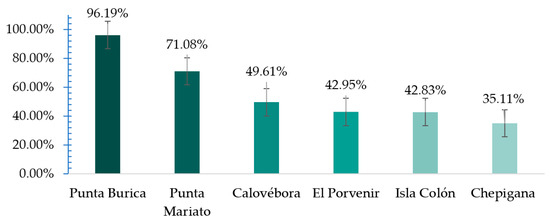
Figure 19.
Alternatives according to the prioritization or importance of each of the categories with respect to the others.
5. Discussion
After addressing the AHP and identifying the multiple criteria for decision making (MCD), Punta Burica in the Gulf of Chiriquí in the Pacific of Panama is justified as the best alternative (96.19%) for the sustainable installation of an OTEC plant. According to the criteria selected as indicators, this site performs the best in four of the five, apart from the distance to the coastline.
Each criterion selected was justified under considerations of standards, legislation, and research corresponding to other countries where this technology is currently implemented to use the oceanic thermal resource. Therefore, the use of this resource will urgently demand the development of legislation that regulate the implementation of these technologies in Panamanian territory; in addition, these would allow the development of a new MCD analysis for site selection where the subjective variables corresponding to the environmental and social impact that was not included for this analysis will be included since this information in Panama does not exist. When considering the techno-economic, social, scientific, commercial, and environmental panorama corresponding to this theme, the analysis should be carried out considering the variables of a qualitative nature. These represent an added cost; thus, the site selected in this study as the most appropriate for the installation and execution of this technology could be affected.
Analyzing TSS in this study proved that the Panamanian oceanic territory presents a stable annual resource, in which the minimum temperature stated in the literature (26 °C), was achieved for most of the period analyzed. The latter is of great importance because it provides a notion of sustainability and continuity in energy production. Furthermore, one can note that the criteria selected are well linked to the actual efficiency and production; thus, their effects on each site are pretty similar.
Panama has an oceanic territory with great thermal potential. Its location in the intertropical zone near the terrestrial Equator, with coastal limits in the Caribbean Sea and the Pacific Ocean, categorizes it as part of the 98 nations with the greatest potential for thermal energy in its oceanography. Its location in the intertropical zone near the terrestrial Equator, with coastal limits in the Caribbean Sea and the Pacific Ocean, categorizes it as part of the 98 nations with the greatest potential for thermal energy in its oceanography. However, the lack of data, research and specialists in this scientific area limits the implementation of this technology within its territory. In addition, there is currently no legislation that promotes and regulate the implementation of this technology.
As future work, it is proposed to use census data to measure the impact on the nearest population to each potential site as an indicator of performance and the effect it could have on marine life. In addition, with the site selection made, it is intended to carry out a model and development of a 100 MW system in Punta Burica based on its meteorological data. Although for this case, some issues such as turbine efficiency, pipes roughness, heat losses, pressure drops, and other phenomena must be considered. This analysis could give us an estimate of the performance of an OTEC plant under these conditions, considering the inherent restrictions.
Author Contributions
Conceptualization, A.J., M.d.l.A.O.D.R. and G.L.; methodology, G.L., M.d.l.A.O.D.R. and H.A.; software, G.L.; validation, H.A.; formal analysis, G.L. and H.A.; writing—original draft preparation, G.L.; writing—review and editing, M.d.l.A.O.D.R.; visualization, G.L. and M.d.l.A.O.D.R.; supervision, A.J. and M.d.l.A.O.D.R.; funding acquisition, G.L., A.J. and M.d.l.A.O.D.R. All authors have read and agreed to the published version of the manuscript.
Funding
This research was funded by the Secretaría Nacional de Ciencia, Tecnología e Innovación (SENACYT) (Convenio de Colaboración Educativa 62-2017), as well by Sistema Nacional de Investigación (SNI).
Institutional Review Board Statement
Not applicable.
Informed Consent Statement
Not applicable.
Data Availability Statement
Not applicable.
Acknowledgments
We thank the Secretaría Nacional de Ciencia, Tecnología e Innovación (SENACYT) of the Republic of Panama for its commitment and financial support to the the Master of Science in Mechanical Engineering of the Faculty of Mechanical Engineering of the Universidad Tecnológica de Panamá. Additionally, we want to acknowledge the Sistema Nacional de Investigación (SNI) for its partial financial support of this work.
Conflicts of Interest
The authors declare no conflict of interest.
References
- Avery, W.H.; Wu, C. Renewable energy from the ocean. Mar. Policy 2002, 26, 471–479. [Google Scholar] [CrossRef]
- Ruiz, G.; Paola, E.; Huante, A.G.; Cueto, Y.R.; Graniel, J.F.B.; Mendieta, M.Á.A.; Acevedo, E.C.; Cupul, J.G.T.; Medina, V.M.R.; Casarín, y.R.S. Conversión de Energía Térmica Oceánica (otec) Estado del Arte; CEMIE-Oceano. Energías Renovables del Océano; Universidad de Campeche Mexico: Universidad Autónoma de Campeche 2017 Instituto de Ecología, Pesquerías y Oceanografía del Golfo de México (EPOMEX): Campeche, Mexico, 2017. [Google Scholar]
- Vega, L.A. Ocean Thermal Energy Conversion. Struct. Eng. Int. 2007, 4, 85–88. [Google Scholar] [CrossRef]
- Syamsuddin, M.L.; Attamimi, A.; Nugraha, A.P.; Gibran, S.; Afifah, A.Q.; Oriana, N. OTEC Potential in the Indonesian Seas. Energy Procedia 2015, 65, 215–222. [Google Scholar] [CrossRef] [Green Version]
- López, G.; James, A.; Ortega, M.; Jurado, F. OTEC Alternative for the Electric Power Generation in Panama. In Proceedings of the 2019 7th International Engineering, Sciences and Technology Conference (IESTEC), Panama, Panama, 9–11 October 2019. [Google Scholar]
- Devis-Morales, A.; Montoya-Sánchez, R.A.; Osorio, A.F.; Otero-Díaz, L.J. Ocean thermal energy resources in Colombia. Renew. Energy 2014, 66, 759–769. [Google Scholar] [CrossRef]
- Matthew, C. Development of a Marine Energy Roadmap for Panama; The University of Edinburgh: Edinburgh, UK, 2016. [Google Scholar]
- Palka, E.J. A geographic overview of panama: Pathway to the Continents and Link between the Seas. Río Chagres Panama 2005, 52, 3–18. [Google Scholar]
- Rajagopalan, K.; Nihous, G.C. Estimates of global Ocean Thermal Energy Conversion (OTEC) resources using an ocean general circulation model. Renew. Energy 2013, 50, 532–540. [Google Scholar] [CrossRef]
- NASA. State of the Ocean. 2021. Available online: https://podaac-tools.jpl.nasa.gov/soto/#b=BlueMarble_ShadedRelief_Bathymetry&l=GHRSST_L4_MUR_Sea_Surface_Temperature(la=true),MODIS_Aqua_CorrectedReflectance_TrueColor&ve=-96.12456736007292,2.1504913711860656,-72.36761727890408,12.873147621186066&pl=false&pb=false&d=2019-04-25&ao=false&as=2019-04-18&ae=2019-04-25&asz=1/day&afr=500&tlr=days (accessed on 5 April 2021).
- International Renewable Energy Agency. Ocean Thermal Energy Conversion Technology Brief. United Arab Emirated: IRENA. 2014. Available online: https://www.irena.org/-/media/Files/IRENA/Agency/Publication/2014/Ocean_Thermal_Energy_V4_web.pdf (accessed on 5 April 2021).
- The Physical Oceanography Distributed Active Archive Center. State of the Ocean. 2019. Available online: https://podaac-tools.jpl.nasa.gov/soto/#b=BlueMarble_ShadedRelief_Bathymetry&l=GHRSST_L4_MUR_Sea_Surface_Temperature(la=true),MODIS_Aqua_CorrectedReflectance_TrueColor&ve=-95.4960923194885,2.0186554336860656,-72.9960923194885,13.004983558686066&pl=false&pb=false&d=2019-04-25&ao=false&as=2019-04-18&ae=2019-04-25&asz=1/day&afr=500&tlr=days (accessed on 5 September 2021).
- Garduño-Ruiz, E.P.; Silva, R.; Rodríguez-Cueto, Y.; García-Huante, A.; Olmedo-González, J.; Martínez, M.L.; Wojtarowski, A.; Martell-Dubois, R.; Cerdeira-Estrada, S. Criteria for optimal site selection for ocean thermal energy conversion (Otec) plants in Mexico. Energies 2021, 14, 2121. [Google Scholar] [CrossRef]
- Zhang, J.; Xu, C.; Song, Z.; Huang, Y.; Wu, Y. Decision framework for ocean thermal energy plant site selection from a sustainability perspective: The case of China. J. Clean. Prod. 2019, 225, 771–784. [Google Scholar] [CrossRef]
- Chen, F.; Liu, L.; Peng, J.; Ge, Y.; Wu, H.; Liu, W. Theoretical and Experimental Research on the Thermal Performance of Ocean Thermal Energy conversion System Using the Rankine Cycle Mode. Energy 2019, 183, 497–503. [Google Scholar] [CrossRef]
- García, A.; Rodríguez, Y.; Garduño, E.; Hernández, R. General Criteria for Optimal Site Selection for the Installation of Ocean Thermal Energy Conversion (OTEC) Plants in the Mexican Pacific. In Ocean Thermal Energy Conversion (OTEC)—Past, Present, and Progress; IntechOpen: London, UK, 2016; p. 13. [Google Scholar]
- Negara, R.; Koto, J. Potential of 100 KW of Ocean Thermal Energy Conversion in Karangkelong, Sulawesi Utara, Indonesia. Int. J. Environ. Res. Clean Energy 2017, 305, 10. [Google Scholar]
- Garduño Ruiz, E.P.; Huante, G.; Cueto, A.R.Y.; Bárcenas Graniel, J.F.; Mendieta Alatorre, M.Á.; Cerezo Acevedo, E.; Tobal Cupul, J.G.; Romero Medina, V.M.; Silva Casarín, R. Conversión de Energía Térmica Oceánica (OTEC); Cemie-Océano, Universidad Autónoma de Campeche: Campeche, México, 2017. [Google Scholar]
- Garduño, E.; Garcia, A. De Energía Térmica Oceánica. 2017. Available online: https://cemieoceano.mx/downloads/libros/CEMIEOceano_Gradiente_Termico.pdf (accessed on 5 April 2021).
- Lockheed Martin Mission Systems & Sensors (MS2). Ocean Thermal Extractable Energy Visualization: Final Technical Report; Ocean Thermal Energy Resource Assessment; Department of Energy: Washington, DC, USA, 2012; 88p. [Google Scholar]
- Doorga, J.R.S.; Gooroochurn, O.; Motah, B.A.; Ramchandur, V.; Sunassee, S. A novel modelling approach to the identification of optimum sites for the placement of ocean thermal energy conversion (OTEC) power plant: Application to the tropical island climate of Mauritius. Int. J. Energy Environ. Eng. 2018, 9, 363–382. [Google Scholar] [CrossRef] [Green Version]
- Saaty, T.L. Proceso de Análisis Jerárquico (AHP); J. Wiley: New York, NY, USA, 1980. [Google Scholar]
- White, G.P. Decision making with the analytic hierarchy process. Omega 1987, 15, 283–290. [Google Scholar] [CrossRef]
- Sergio, A.; Redondo, L. Utilidad de metodos como AHP. Cuad. Adm. 2007, 20, 65–84. [Google Scholar]
- Mendez, M.; Álamo, A.L.; Frutos, M.; Ascua, R. Fundamentos de Ayuda Multicriterio a la Decisión. 2014. Available online: https://www.researchgate.net/publication/317882380_FUNDAMENTOS_DE_AYUDA_MULTI-CRITERIO_A_LA_DECISION (accessed on 5 April 2021).
- Mellinas Fernandez, M. Análisis Comparativo de Técnicas de Generación Eléctrica; AHP y TOPSIS Fuzzificado. 2012. Available online: https://repositorio.upct.es/bitstream/handle/10317/2963/pfc4430.pdf?sequence=1 (accessed on 5 April 2021).
- José María, M.J. El Proceso Analítico Jerárquico (ahp). Fundamentos, Metodología y Aplicaciones. 2010. Available online: https://users.dcc.uchile.cl/~nbaloian/DSS-DCC/ExplicacionMetodoAHP(ve%20rpaginas11-16).pdf (accessed on 5 April 2021).
- Chen, T.Y. Multiple criteria decision analysis using a likelihood-based outranking method based on interval-valued intuitionistic fuzzy sets. Inf. Sci. 2014, 286, 188–208. [Google Scholar] [CrossRef]
- López, G.; James, A.; Ortega, M.D.L.A. Evaluation of the Oceanic Thermal Potential on the Coasts of Panama. Available online: https://tethys.pnnl.gov/sites/default/files/publications/PAMEC-2020-E-BOOK.pdf (accessed on 5 April 2021).
- Vera, D.; Baccioli, A.; Jurado, F.; Desideri, U. Modeling and optimization of an ocean thermal energy conversion system for remote islands electrification. Renew. Energy 2020, 162, 1399–1414. [Google Scholar] [CrossRef]
- Vega, L.A.; Michaelis, D. First Generation 50 MW OTEC Plantship for the Production of Electricity and Desalinated Water. In Proceedings of the Offshore Technology Conference, Houston, TX, USA, 3–6 May 2010. [Google Scholar] [CrossRef]
- Wu, C.-x.; Wu, B.-j.; Yin, Y. A Review of Ocean Thermal Energy Utilization. Adv. N&R Energy 2014, 2, 275–280. [Google Scholar]
- Langer, J.; Quist, J.; Blok, K. Recent progress in the economics of ocean thermal energy conversion: Critical review and research agenda. Renew. Sustain. Energy Rev. 2020, 130, 109960. [Google Scholar] [CrossRef]
- Yang, M.H.; Yeh, R.H. Analysis of optimization in an OTEC plant using organic Rankine cycle. Renew. Energy 2014, 68, 25–34. [Google Scholar] [CrossRef]
- International Renewable Energy Agency. Renewables Readiness Assessment: Panama; IRENA: Abu Dhabi, United Arab Emirates, 2018. [Google Scholar]
- British Embassy. An Examiniation of Ocean Energy Potential in Panama: Identifying the Next Steps; British Embassy: Hong Kong, China, 2016. [Google Scholar]
- Masutani, S.M.; Takahashi, P.K. Ocean Thermal Energy Conversion (OTEC). Encycl. Ocean Sci. 2010, 167–173. [Google Scholar] [CrossRef]
- Díez, P.F. Energía Maremotérmica, 12th ed.; Universidad De Cantabria: Cantabria, Spain, 2003; Available online: http://www.ingenieroambiental.com/3008/ENERG%CDA%20mareotermica.pdf (accessed on 5 April 2021).
- Sang, Y.; Karayaka, H.B.; Yan, Y.; Yilmaz, N.; Souders, D. Ocean (Marine) Energy. In Comprehensive Energy Systems; Elsevier: Amsterdam, The Netherlands, 2018; Volume 1. [Google Scholar] [CrossRef]
- Vega, L.A. Economics of Ocean Thermal Energy Conversion (OTEC). In Ocean Energy Recovery: The State of the Art; ASCE: Reston, VA, USA, 1992; Chapter 7; pp. 152–181. [Google Scholar]
- Deethayat, T.; Kiatsiriroat, T.; Thawonngamyingsakul, C. Performance analysis of an organic Rankine cycle with internal heat exchanger having zeotropic working fluid. Case Stud. Therm. Eng. 2015, 6, 155–161. [Google Scholar] [CrossRef] [Green Version]
- Jung, J.Y.; Lee, H.S.; Kim, H.J.; Yoo, Y.; Choi, W.Y.; Kwak, H.Y. Thermoeconomic analysis of an ocean thermal energy conversion plant. Renew. Energy 2016, 86, 1086–1094. [Google Scholar] [CrossRef]
- Mohd Idrus, N.H.; Musa, M.N.; Yahya, W.J.; Ithnin, A.M. Geo-Ocean Thermal Energy Conversion (GeOTEC) power cycle/plant. Renew. Energy 2017, 111, 372–380. [Google Scholar] [CrossRef]
- Wang, M.; Jing, R.; Zhang, H.; Meng, C.; Li, N.; Zhao, Y. An Innovative Organic Rankine Cycle (ORC) based Ocean Thermal Energy Conversion (OTEC) System with Performance Simulation and Multi-Objective Optimization. Appl. Therm. Eng. 2018, 145, 743–754. [Google Scholar] [CrossRef]
- Fetanat, A.; Khorasaninejad, E. A novel hybrid MCDM approach for offshore wind farm site selection: A case study of Iran. Ocean Coast. Manag. 2015, 109, 17–28. [Google Scholar] [CrossRef]
- Avery, W.H. OTEC—Ocean Thermal Energy Conversion. 1993. Available online: https://www.worldcat.org/title/ocean-thermal-energy-conversion/oclc/232665992&referer=brief_results (accessed on 5 April 2021).
- Meegahapola, L.; Udawatta, L.; Witharana, S. The Ocean thermal energy conversion strategies and analysis of current challenges. In Proceedings of the 2007 International Conference on Industrial and Information Systems, Peradeniya, Sri Lanka, 9–11 August 2007; pp. 123–128. [Google Scholar]
Publisher’s Note: MDPI stays neutral with regard to jurisdictional claims in published maps and institutional affiliations. |
© 2022 by the authors. Licensee MDPI, Basel, Switzerland. This article is an open access article distributed under the terms and conditions of the Creative Commons Attribution (CC BY) license (https://creativecommons.org/licenses/by/4.0/).