Abstract
Entropy generation is always a matter of concern in a heat transfer system. It denotes the amount of energy lost as a result of irreversibility. As a result, it must be reduced. The present work considers an investigation on the turbulent forced convective heat transfer and entropy generation of Al2O3-Ethylene glycol (EG) nanofluid inside a circular tube subjected to constant wall temperature. The study is focused on the development of an analytical framework by using mathematical models to simulate the characteristics of nanofluids in the as-mentioned thermal system. The simulated result is validated using published data. Further, Genetic algorithm (GA) and DIRECT algorithm are implemented to determine the optimal condition which yields minimum entropy generation. According to the findings, heat transfer increases at a direct proportion to the mass flow, Reynolds number (Re), and volume concentration of nanoparticles. Furthermore, as Re increases, particle concentration should be decreased in order to reduce total entropy generation (TEG) and to improve heat transfer rate of any given particle size. A minimal concentration of nanoparticles is required to reduce TEG when Re is maintained constant. The highest increase in TEG with nanofluids was 2.93 times that of basefluid. The optimum condition for minimum entropy generation is Re = 4000, nanoparticle size = 65 nm, volume concentration = 0.2% and mass flow rate = 0.54 kg/s.
1. Introduction
Methods for heat transfer augmentation are actively utilized in a wide range of industrial and home applications. This can be quite advantageous in many applications for several reasons. For instance, improving the rate of heat transfer would result in a reduction in the size of heat exchangers, as well as lowering material, operating costs, and environmental impacts. One method to enhance heat transfer is to use nanoparticles dispersed in the basefluid (nanofluid) [1,2,3]. It has been proven by many researchers that the use of highly conductive nano-sized particles will augment the heat transfer properties and improve the thermal performance of heat transfer systems [4]. Heat transfer improvements have been reported in several cases to increase proportionally with the concentration of the nanoparticles [5,6]. However, it has been shown by many studies that considerable pressure drops and formation of entropy are common side effects of using nanofluids [7,8,9,10,11]. As a result, it is critical to take into consideration the other characteristics of a thermal system along with the heat transfer parameters to provide a more complete picture of thermal performance. Entropy generation analysis is a highly effective technique for characterizing the performance of thermal systems and system irreversibility [12,13]. There have been numerous studies on entropy generation in thermal systems to establish optimal operating parameters.
Sahin [14] outlined entropy generation and pumping power analysis of turbulent flow through a smooth circular duct with constant wall temperature boundary conditions. The author included the influence of the dependency of viscosity on temperature during heating and found that the entropy generation decreased initially and then increased along the length of the duct. Moreover, it was found that entropy generation increased, and pumping power decreased with the increase in the dimensionless temperature difference between the wall surface and fluid inlet.
Bianco et al. [15] proposed an entropy generation analysis of a turbulent Al2O3-water nanofluid flow with a varying particle diameter of 20–60 nm and concentration of 0–6% inside a circular tube having 1 m length and 0.01 m diameter exposed to 50 kW/m2 of constant wall heat flux. The authors imposed three different inlet conditions, an Re value in the range of 20,000–100,000, a constant mass flow in a range of 0.3–0.5 kg/s and a fixed in-flow velocity in a range of 4–8.5 m/s. The authors found a decrement in thermal entropy generation and an increment in frictional entropy generation with an increase in the Re, mass flow and velocity. Finally, the authors indicated to the conditions for reduced energy loss due to entropy generation.
In another study, Bianco et al. [16] applied constant wall temperature boundary condition to an internal convective in-tube flow of Al2O3-water nanofluid with 19 and 38 nm particle diameter and 0–6% volume percentage under turbulence condition. They numerically analysed heat transfer, entropy generation and pumping power loss in the aforementioned thermodynamic domain. The statement of the authors reveals that enhancement in nanofluid concentration basically promotes entropy generation and pumping power loss, which basically penalizes the benefit of Nu number enhancement by particle addition in the basefluid.
Bianco et al. [17] executed a numerical analysis of heat transfer and entropy generation in a uniformly heated square tube having a convective flow of Al2O3 (38 nm)-water nanofluid under turbulent condition. The main focus of their study was to find out the optimum Re value for minimum entropy generation. The investigators reported that the inclusion of nanoparticles aided in convective heat transfer enhancement. In addition, the optimum Re values required to achieve minimum entropy generation decreased with increasing concentration. For Al2O3 concentrations of 1%, 4% and 6% the optimum Re values were found to be approximately of 90,000, 70,000 and 60,000, respectively.
Leong t al. [18] studied entropy generation phenomena for water-based Al2O3 (30 nm) and TiO2 (40 nm) flow through a circular tube with constant wall temperature both in laminar and turbulent zone. The investigators analysed the problem imparting variations in working conditions, such as tube geometry, bulk flow temperature, nanoparticle volume fraction, mass flow and dimensionless wall-fluid temperature profile, to the selected system. It was reported that addition of 4% TiO2 nanoparticles reduces total dimensionless entropy generation by 9.7% as compared to 6.4% reduction observed when using Al2O3.
Pati et al. [19] minimized the entropy generation and peak temperature for laminar-forced convective flow with a high Prandtl number by using a circular pipe with uniform, non-uniform and linearly changing heat flux conditions at the wall. It was suggested that periodic heat flux condition with 100 cycles or more of sinusoidal waves is the best strategy to minimize entropy generation and peak temperature.
Kadivar et al. [20] analytically studied heat transfer performance, flow characteristics, and entropy generation of turbulent water-based TiO2 (21 nm) nanofluid flow through a spiral coil tube considering various input parameters with various ranges, such as nanoparticle concentration (0.01–0.05%), flow rate (1.33–3.33 L/m), fluid inlet temperature (15–27 °C) and curvature ratio (0.03–0.06). The researchers concluded that an augmentation in nanoparticle volume fraction reduces entropy generation, whereas a low Re and a reduction in curvature ratio decrease the total entropy generation. Finally, an optimum Reynolds number range of 9000–12,000 was proposed.
Li et al. [21] numerically optimized the configuration of a rectangular microchannel heat sink with porous medium for entropy generation minimization. An aspect ratio of a heat sink (HS) cell and the length–width ratio of a heat sink were optimized using a numerical simulation method for entropy generation minimization (EGM). The research group stated a decline of 33.10% in the dimensionless entropy generation rate at an optimized aspect ratio.
Manay et al. [22] presented an experimental investigation on the effect of applying TiO2 (25 nm)-water nanofluid with different volume percentages from 0.25–2% in micro channel cooling using laminar steady and constant heat flux boundary conditions. The Re value varied from 200–800. The Nu, friction factor and entropy generation were measured by varying the micro channel height from 200–500 µm. The authors observed that an increase in particle volume concentration leads to an increase in the Nu. The frictional and total entropy generation increased by 3.3–21.6% and 2–20%, respectively. However, nanoparticle addition resulted in a 1.8–32.4% decrease in thermal entropy generation. The authors also added that thermal entropy generation in microchannel flows can be neglected due to inconsiderable contribution in total entropy generation. Higher channel heights resulted in a 30–52% increase in thermal entropy generation, while shorter channel heights resulted in a 66–98% increase in frictional entropy formation. Different algorithms and computer-based intelligent optimization techniques have been implemented to minimize entropy generation in various thermal systems.
Han et al. [23] utilized the multi-objective genetic algorithm (MOGA) optimization technique to optimize the design of a helically coiled tube and found that the minimum entropy generation rate method alone cannot provide satisfactory results. However, if it combines with flow resistance and heat transfer coefficient as the objective functions, the best thermal performance can be obtained.
Moghadam et al. [24] analysed the entropy generation minimization in a turbulent flow of Al2O3-water + EG (60:40) nanofluid at various bulk temperatures in the range of 290–360 K with varying particle sizes of 20–90 nm and increasing particle concentration from 0–0.1% applied in a parabolic trough solar collector using the quadratic optimization algorithm and an artificial neural network (ANN). The researchers observed that the rate of entropy generation decreases by increasing the flow temperature, nanoparticle diameter and by decreasing the volume fraction of nanoparticles. Finally, the authors suggested an optimum condition at Re, bulk flow temperature and nanoparticle diameter of 4000, 360 K, and 90 nm, respectively.
Gharyehsafa et al. [25] optimized flow parameters in a turbulent flow of metallic Al2O3, CuO and non-metallic SiO2 in EG-water (60:40) nanofluids through a circular tube at different heat flux conditions on the top and bottom walls of the tube by means of the entropy generation method. The minimization of the rate of the entropy generation is carried out by optimizing nanofluid volume fraction, the diameter of nanoparticles, Re and average flow temperature by applying the quadratic optimization method. The authors confirmed that total entropy generation is reduced by decreasing Re and increasing flow temperature, nanoparticle diameter, and volume fraction of nanoparticles. The dispersing metallic nanoparticles produced less entropy than the non-metallic particles in basefluids. Finally, it was concluded that the optimal values of Re, average flow temperature, and particle diameter were 4000, 363 K, and 100 nm, respectively.
Safarzadeh et al. [26] experimentally studied entropy generation of Fe3O4-DI (de-ionized) water nanofluid flow through a helically coiled pipe under a constant magnetic field. They predicted entropy generation using an adaptive neuro-fuzzy inference system (ANFIS) model. The investigators concluded that to maximize the efficiency of the system, the entropy generation number must be minimized. They also reported that from an exergy viewpoint, the coils with diameters of 90 and 135 mm are the best among the other coils for distilled water and nanofluid, respectively, at a fixed pitch.
Mohamadi et al. [27] used a CFD analysis of heat transfer and entropy generation in internal flows of Al2O3 and SiO2 in HFE7000 nanorefrigerants subjected to slip condition at the wall. They selected four volumetric concentrations of 0%, 1%, 4% and 6% and four Re values of 400, 800, 1200 and 1600. They revealed that the total entropy generation decreased by both slip lengths and volume concentration. The slip boundary condition at the wall reduced the mean pressure drop by around 25%. Furthermore, they added that compared to pure HFE7000 flowing in a no-slip pipe with a slip length of 100 m and a 6% volume concentration of Al2O3 dispersed in HFE7000, total entropy generation was reduced by about 20% when using a slipping wall pipe with a slip length of 100 m and a 6% volume concentration of Al2O3. Other important studies on entropy generation can be found in the literature [28,29,30,31,32,33,34].
As per the above discussions, the entropy generation minimization (EGM) approach has been used by several researchers in a variety of heat transfer applications. Convection in pipe flow is the most common example of heat transfer in the thermal engineering sector. However, the EGM approach for flow inside tubes is less addressed by the research community as per the authors’ knowledge. Few examples are present in references [15,16,17]. However, EGM studies in pipe flow under constant wall temperature condition remain neglected. Moreover, EGM studies in convective nanofluid flow inside tubes with pure EG-nanofluids have not been addressed properly in recent years as per the authors’ knowledge. Hence, this an existence or research gap in this particular domain. As a result, the authors hope their work will fill the research gap.
This paper presents a methodology to minimize the entropy generation in a tube flow subjected to constant temperature boundary conditions in order to develop optimal conditions when the working medium is an EG-based Al2O3 nanofluid with varying concentrations (0.02–0.1 vol.%) and varying particle sizes (25–65 nm) under turbulent conditions having a variation in Re from 4000–20,000. The GA and DIRECT algorithms have been employed to find the minimum values of entropy generation in the flow, and the corresponding values of Re, particle volume fraction and particle size are presented. Overall, the optimized conditions can be implemented in nanofluid-aided heat transfer applications.
2. Methodology
2.1. Problem Statement
The problem described here consists of entropy generation analysis of a flowing nanofluid inside a tube. The system geometry is presented Figure 1. The length (L) of the tube is 1 m, and it has a 0.01 m diameter (D). Isothermal condition is imposed to the tube wall. The fluid inlet temperature is maintained (Ti) at 298 K.
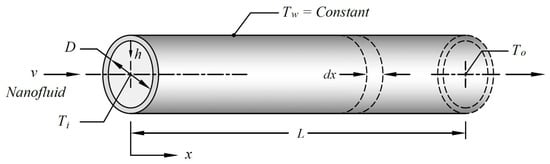
Figure 1.
Schematic of the tube under present investigation.
An incompressible viscous flow of Al2O3-EG nanofluid is considered here under turbulent condition. The particle size is varied in the range of 25–65 nm at 10 nm difference. The particle volume fraction is increased from 0–1% at a 0.2% increment. The Re is varied from 4000–20,000. The analysis is performed by changing two parameters at a time while the other parameter is kept constant. The length and diameter of the pipe remain constant throughout the study.
The thermo-physical properties of nanofluids are evaluated on the basis of the bulk flow temperature of the nanofluid and are presented in Table 1. The thermophysical properties of nanofluids are measured at different particle sizes (25–65 nm) and particle concentrations (0–1 vol.%).

Table 1.
Thermo-physical properties of Al2O3 and ethylene glycol.
2.2. Nanofluid Thermophysical Properties
The nanofluid thermophysical properties are measured using the prevailing mathematical models. The nanofluid thermal conductivity is measured as a function of Brownian motion, size, thermal conductivity of nanoparticle and basefluid and particle volume concentration using the following correlation proposed by Corcione [35].
where , , , , and stand for thermal conductivity, volume concentration, temperature, Reynolds number, and Prandlt number, respectively. The Re of a nanoparticle is defined in the following way:
where , , and are density of basefluid, Brownian velocity of nanoparticle, nanoparticle diameter and dynamic viscosity of basefluid. The Brownian velocity is defined as:
where is the Boltzmann Constant whose value is = .
The dynamic viscosity of the nanofluid measured as a function of particle size and volume concentration [36]:
where MW is the molecular weight of the basefluid, and NA is the Avogadro number = 6.023 × 10²³.
The density and specific heat of the nanofluid is measured by applying the mixture rule as presented below [37]:
2.3. Formulation for Heat Transfer
The heat transfer rate to the nanofluid flow inside the control volume is
where is the mass flow rate. Cp is the specific heat of the working fluid, and Tw and Tavg are the wall temperature and average temperature of the flow, respectively. h and D denote the heat transfer coefficient and tube diameter, respectively.
Re is the Reynolds number, which is defined as:
where Dh denotes the hydraulic diameter. In case of tube flow, the hydraulic diameter is equal to the pipe diameter.
Comparing Equations (9) and (10), can be rewritten as:
Integrating Equation (8), the average bulk temperature of the flow along the length can be presented as [14]:
Now, Equation (12) can be rewritten as below:
Ar is the aspect ratio of the tube.
St is the Stanton number, which is defined as:
where Nu and Pr are the Nusselt number and Prandlt number, respectively, defined as:
The Nu for nanofluid flow under turbulent condition for different volume concentrations can be presented as a function of particle size, thermal dispersion, micro-convection and micro-diffusion of nanoparticles [38].
Penf is the Peclet number, defined as:
is the thermal diffusivity, which is defined as below:
The friction factor in nanofluid flow is evaluated based on the following equation [39]:
2.4. Formulation for Entropy Generation
As previously stated, entropy generation inside a tube is investigated. Hence, the necessary equations are introduced in this study.
The total entropy generation (Sgen,Total) in a flow system is considered as the collective result of entropy generation by heat transfer (Sgen,T) and fluid friction (Sgen,F) [40]:
The total entropy generation per length of the circular test section is given by [15]:
Equation (23) represents total local entropy generation in the test section. The first part represents the local entropy generation due to heat transfer, and the second represents the local entropy generation due to fluid friction. is the heat transfer rate per unit length.
Integrating both sides of Equation (23):
Now, comparing Equations (22) with (25), Sgen,T and Sgen,F have the following forms:
where is the heat transfer per unit area or heat flux to the flow.
All the mathematical equations are modelled and simulated in engineering equation solver software (EES), and the result is optimized by genetic algorithm (GA) and quadratic approximation methods. The optimized values from these two are then compared. Details on GA and DIRECT algorithm are discussed briefly in the next section.
2.5. Genetic and DIRECT Algorithm
Genetic algorithm (GA) is widely used and is the most popular stochastic optimization technique that is often used to settle many large-scale complex optimization problems in different fields. GA begins with a set of random solutions termed as the population. Each individual solution is known as a chromosome which evolved due to successive iterations. These iterations are also known as generations, and during each iteration, the chromosomes are measured with some fitness value. The next generation of chromosomes, known as offspring, can be formed by merging two current generations with a crossover operator or by modifying it with a mutation operator. A new generation is created by either selecting certain parents and offspring based on their fitness values or by rejecting some of them in order to keep the population number constant. The method eventually converges on the best chromosome, which reflects the optimized value, after a few generations. The process of GA optimization is described by a flow chart as presented in Figure 2.
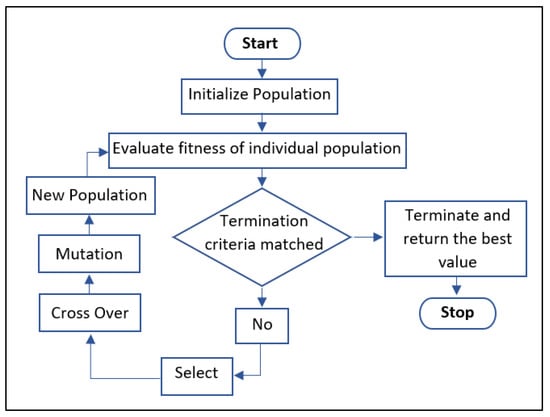
Figure 2.
Typical flow chart presenting the GA optimization process.
The genetic method used in EES is based on the Pikaia [41] optimization tool, which is freely available in the public domain. In EES, the number of individuals varies from 16–128. The number of generations ranges from 16–2048 with a maximum mutation rate from 0.0875 to 0.7 with linear variations. The GA has other parameters (e.g., the minimum mutation rate, the number of significant figures to encode) which have been set to the Pikaia program’s default values and cannot be changed within EES. In the present analysis, all the parameters are set to their default values during optimization.
A tweak to Lipschitzian optimization inspired the DIRECT [42] optimization technique. It was designed to explain complex global optimization problems with bound constraints and a real-valued objective function. The DIRECT algorithm is a sampling algorithm which does not necessitate any prior knowledge about the gradient of the objective function. Instead, the algorithm samples locations in the domain and then decides where to search next based on the information it has gathered. When the objective function is a “black box” function or simulation, a global search algorithm such as DIRECT can be useful. The DIRECT algorithm will converge globally to the minimum objective function. The name “DIRECT” originates from the shortening of the phrase “Dividing Rectangles”, which describes how the algorithm moves to the optimum.
The DIRECT approach has proven to be quite competitive in comparison to other algorithms in its class. DIRECT’s merits include the balanced effort it devotes to local and global searches, as well as the minimal parameters it requires to run.
The EES includes the original DIRECT algorithm developed by Jones et al. [42,43] Similar to GA, the DIRECT algorithm is intended to find a global optimum when local optima occur in the search region. The DIRECT algorithm has the advantage of finding a global optimum with significantly fewer function evaluations than the genetic method. The number of times EES will solve the equations while searching for the optimum is limited by the maximum number of function calls. Gablonsky’s relative conv. tolerance is a stopping criterion known as volper. The smaller this value is, the more precise the optimum will be, and the more function evaluations will be required to obtain it. If a better estimate of the optimum is not found in (Max. function calls/5) function evaluations, EES will stop looking for it. Figure 3 presents a flow chart of DIRECT algorithm processes. In the present analysis, the conv. tolerance is fixed at 10−5. The cell function is kept at 200.
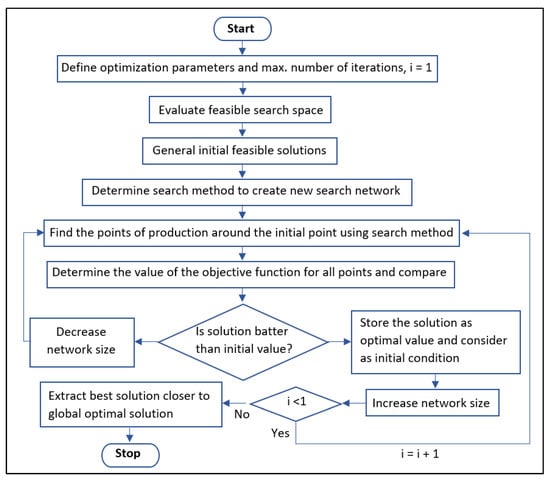
Figure 3.
Typical flow chart representing DIRECT algorithm.
2.6. Validation
The EES coding was validated by comparing the present result with available data in [15,44].
Al2O3 nanofluid with concentrations of 0.9, 1.8, and 3.6 was used to compare findings at a fixed flow velocity of 2 m/s. The distributed nanoparticles have an average diameter of 46 nm. The simulated EG result is compared to the one shown in Figure 4. A deviation of around 12% is produced as a result of the study’s differences in thermophysical properties and specification, flow parameters, and boundary conditions. Furthermore, the correlations used to determine the thermophysical parameters of nanofluids are highly variable in comparison to experimental data. However, the pattern of rising entropy generation is consistent with the validation literature.
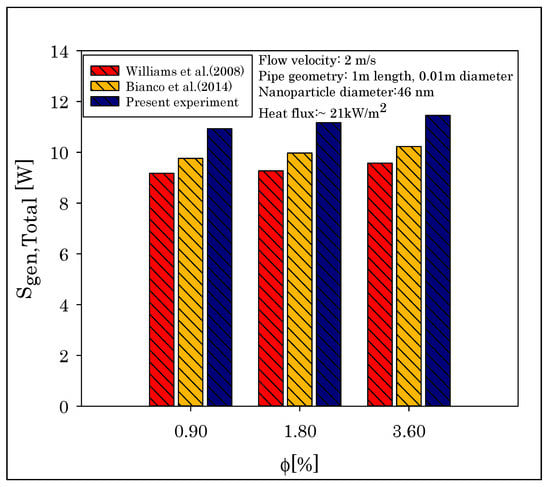
Figure 4.
Comparison of present analysis with previous papers.
3. Results and Analysis
3.1. Temperature Profile of Flow
The dimensionless outlet temperature profile () and dimensionless average temperature profile () of nanofluids are presented in Figure 5a–c at different Re, concentration and particle sizes. The temperature profiles are defined as:
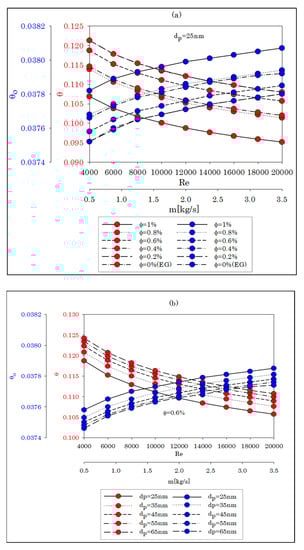

Figure 5.
(a–c) Non-dimensional temperature profile of the nanofluid with change in Re, flowrate, concentration and particle size.
The temperature profiles show opposite behaviours, and the profile in Figure 5a shows incensement with increasing Re, mass flow rate and concentration of nanofluids, while the particle size remains constant. As the Re value increases, the working fluid has less time to absorb heat. As a result, the outlet temperature of the flow decreases production of a net incensement in when Tw remains constant. Conversely, average bulk temperature profile or decreases with an increase in Re and mass flowrate. The inclusion of nanoparticles reduces the average temperature as the increasing concentration of nanofluids generates higher dynamic viscosity and lower heat capacity compared to pure EG.
Figure 5b shows that similar trends in the changes occur in and at different nanoparticle sizes when the Re and mass flowrate increase, keeping the volume concentration constant at 0.6%. The heat transfer in nanofluids is inversely proportional to particle size. The smaller the particle size, the higher the heat absorption rate of the nanofluids. The outlet temperature of the nanofluid flow rises due to high absorption capacity at smaller particle size, resulting in decrement.
θ decreases with an increase in Re, mass flowrate and decrease in particle size at a constant volume fraction of 6%. The decrease in heat absorbance due to Re and mass flow rate increment results in a drop in average fluid temperature. Hence, decreases. At a constant volume concentration, when the particle size decreases, the frictional resistance to the flow increases, which in turn reduces the heat convection in the nanofluids. Consequently, the average temperature decreases.
In Figure 5c, the temperature profiles are highly non-linear in nature with various particle sizes when the concentration of the nanofluid increased at a constant Re = 16,000 and m = 2.596 kg/s. decreases up to = 0.4% and then starts increasing up to = 1%. Such a change in is interesting. When the mass flow rate is fixed, the density of the nanofluid increases with the increase in particle inclusion. Now, to make the flowrate fixed, the velocity of the flow needs to be decreased due to inertia. The increase in density of the nanofluid is low up to ( = 0.4%); however, it increases significantly with particle loading beyond 0.4%. Therefore, the flow velocity first slightly changes up to ϕ = 0.4%), and then an abrupt reduction in the flow velocity happens at a higher concentration. When the change in flow velocity is limited, the flow volume enhances due to inclusion of nanoparticles, and it obtains insufficient heating to raise the temperature of the flow. As a result, the outlet temperature drops. However, at higher concentration (ϕ > 0.4%), when the flow velocity is low, the flow has ample time to be heated, leading to a net increase in outlet temperature. Hence, again increases.
θ shows an opposite trend to , i.e., θ first increased to 0.4% and then decreased to 1%. The average flow temperature depends on the inlet and outlet temperatures of the flow. In the analysis, the inlet temperature is fixed at 298 K. The outlet temperature shows changes throughout the present concentration range. Therefore, in order to allow such changes in the flow field, the average temperature of the working fluid initially increased to ( = 0.4%) and then decreased to ( = 1%).
3.2. Convective Heat Transfer Rate
The heat transfer with nanofluids at different flow rates, sizes and concentrations is presented in Figure 6a–c. In Figure 6a, the rate of heat transfer is plotted against the different Re and mass flow with a 25 nm nanoparticle size. The heat transfer increased linearly with the increase in Re values (mass flow rate) at an average of 4.45 times its initial magnitudes for all fluids. The heat transfer rate also increased with the increase in particle volume concentration from 0–1%. Maximum enhancement was 2.558 times as compared to water when Re = 20,000 and ϕ = 1%. The increase in thermal conductivity due to nanoparticle inclusion plays an important role in heat transfer enhancement in nanofluids [2]. The nanoparticle migration due to Brownian motion and thermo-diffusion also influences the convective heat transfer in nanofluids [4].
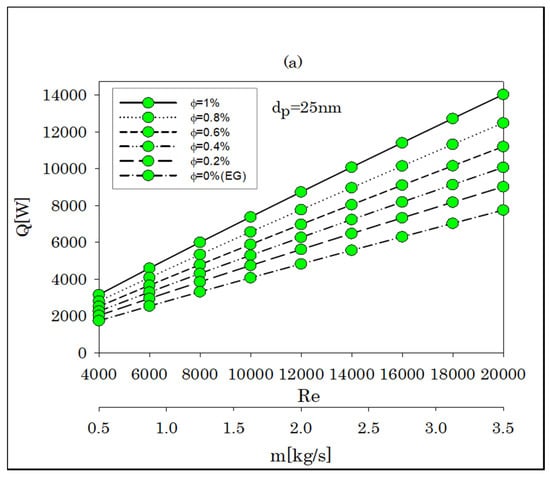
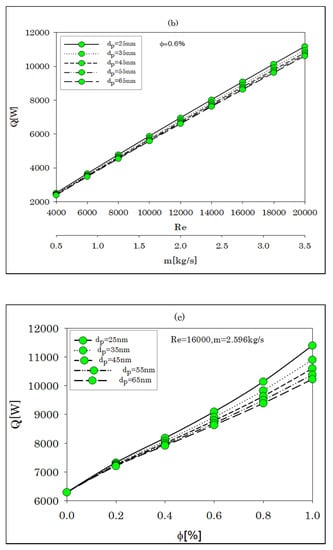
Figure 6.
(a–c) Variation of convective heat transfer rate with change in Re, flowrate, concentration and particle size.
The heat transfer rate is plotted in Figure 6b against the increasing Re and mass flowrate at different nanoparticle sizes by keeping volume concentration constant at ϕ = 0.6%. This figure evidently describes that a decrease in particle size is beneficial for heat transfer in nanofluids by keeping the particle concentration constant. The decreased size of the nanoparticles has enhanced mobility due to low inertia. Hence, smaller particles move faster and enhance the heat transfer rate better than the same with bigger particles under the same temperature difference.
The effect of particle size and concentration on the convective heat transfer rate at a fixed Re = 16,000 (m = 2.596 kg/s) is presented in Figure 6c. The result describes that the heat transfer rate increased with the increasing concentration and decreasing particle size. Unlike in Figure 6a,b, the curves in Figure 6c show non-linearity. This is due to the improvement in micro-scale phenomena with concentration rise and faster particle movement with reduction in particle size.
3.3. Thermal and Frictional Entropy Generation Rate
The variations of entropy generation rate due to heat transfer and fluid friction are presented in Figure 7a–c. In Figure 7a, the entropy generations are presented as a function of mass flow rate and Re at a constant dp = 25 nm. With the increase in mass flow rate and Re, the thermal entropy generation rate (Sgen,T) increased linearly, but the frictional entropy generation rate (Sgen,F) showed an exponential trend. It is evident from Figure 7a that Sgen,T dominates Sgen,F but at a higher concentration, i.e., at ϕ = 0.8 and 1%, Sgen,F dominates. This phenomenon can be explained by the fact that with the increase in particle concentration, the enhancement in viscous dissipation tries to surpass the thermal entropy generation. An Re value around = 12,000 is suitable since Sgen,F increases abruptly after that value.
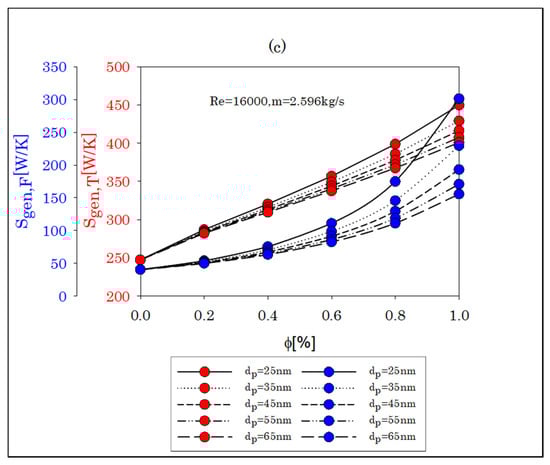
Figure 7.
(a–c) Variation of entropy generations with change in Re, flowrate, concentration and particle size.
In Figure 7b, at a constant ϕ = 0.6%, SgenT and Sgen,F have been presented with increasing Re and mass flow rate. Sgen,T decreased with a decrease in particle size since the heat transfer enhancement is more with reduced particle size. Sgen,F manifests an opposite trend. The viscosity is inversely proportional to the nanoparticle diameter [45]. Hence, viscous dissipation is more in the nanofluids with smaller particle size. Since the concentration remains constant, Sgen,T remains dominant over Sgen,F.
The variation of Sgen,T and Sgen,F with nanoparticle volume concentration at a fixed Re =16,000 and m = 2.596 kg/m is presented in Figure 7c. The entropy generation augments with increasing the concentration of nanofluid. Unlike in previous operating conditions, Sgen,T is to some extent nonlinear in nature. This can be regarded as the effect of microscale phenomena which become more prominent at a higher concentration. Sgen,T dominates Sgen,F. However, the trend is opposite at a higher concentration (ϕ = 1%). To maintain Re constant, the velocity of the flow needs to be increased, causing an increase in frictional loss [15]. Sgen,F maintains a nonlinear trend with increasing concentration.
3.4. Total Entropy Generation Rate
The entropy generation rate (Sgen,Total) at varied Re, mass flow rate, concentration and particle size are described in Figure 8a–c. Sgen,Total increased with the increase in Re and mass flow rate at different concentrations at fixed dp = 25 nm, as shown in Figure 8a. However, as per Figure 8b, the effect of nanoparticle size is not effective in Sgen,Total. Furthermore, decreasing the particle size increases Sgen,Total with a constant volume fraction. As previously shown in Figure 7b, the contribution of Sgen,T dominates that of Sgen,F, resulting in an increase in Sgen,Total in the order of decreasing particle size. Figure 8c presents the development of Sgen,Total with increasing concentration and varying particle diameter when the flow is kept constant at Re = 16,000 and m = 2.596 kg/s. The TEG enhancement becomes more prominent with increasing concentration. The internal shear stress increases due to enhanced particle-to-particle interaction with nanoparticle inclusion in the basefluid. Moreover, when the flow rate is fixed, the micro-nanoscale heat transfer enhancement contributes to Sgen,Total of the nanofluid. As a result, Sgen,Total shows an upward trend with nanoparticle inclusion in the basefluid. Sgen,Total of the nanofluid shows a maximum of 2.93 times enhancement versus EG when the particle size remains fixed and the Re and mass flowrate are varied.
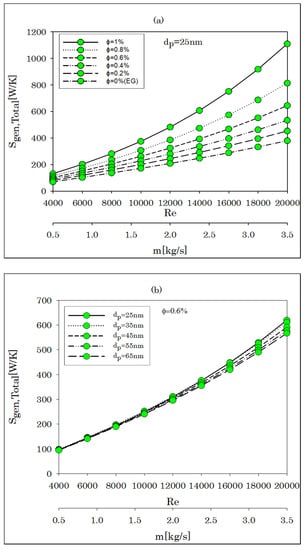
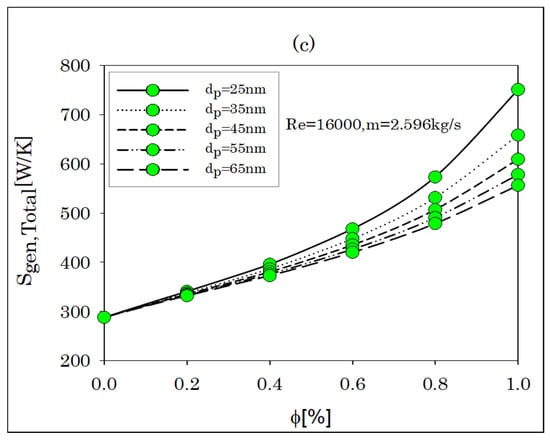
Figure 8.
(a–c) Variation of total entropy generation with change in Re, flowrate, concentration and particle size.
3.5. Irreversibility Distribution Ratio
The irreversibility distribution ratio is defined as the ration between Sgen,F and Sgen,T:
The variation of is presented in Figure 9a–c. The figures display that increases with increasing Re and mass flow rate and decreasing particle size. By comparing the graphs, the increase in frictional resistance, with increasing concentration and Re and decreasing particle size, enhances Sgen,F. Consequently, increases. The values are all <1 which indicates that Sgen,T preponderates over Sgen,F in all circumstances.
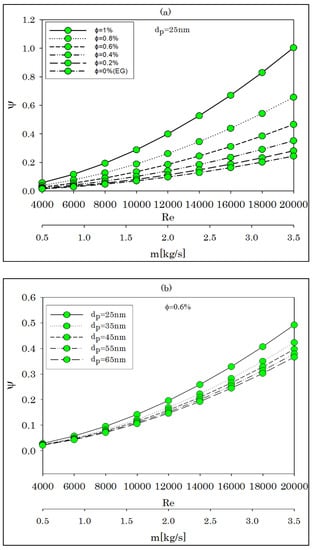
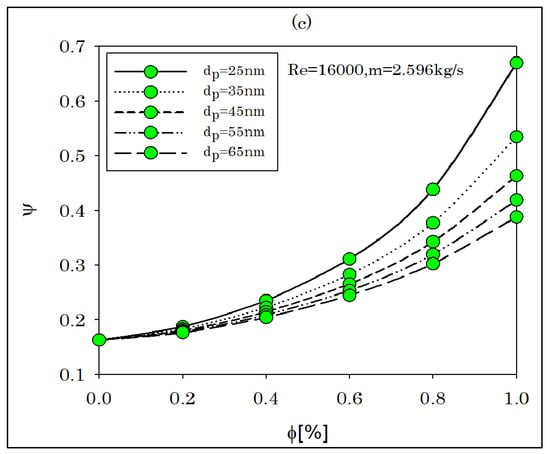
Figure 9.
(a–c) Variation of irreversibility distribution ratio with change in Re, flowrate, concentration and particle size.
3.6. Optimization Results
GA and DIRECT algorithms are applied to find out the optimized condition for the present analysis. The minimization of entropy generation is performed by optimizing the values of Re, m, ϕ, and dp. The operating conditions of the input parameters are considered within the ranges 4000 ≤ Re ≤ 16,000, 0.5 kg/s ≤ m ≤ 3.5 kg/s, 0% ≤ ϕ ≤ 1% and 25 nm ≤ dp ≤ 65 nm. The optimized values for input parameters such as Re, m, ϕ and dp are presented in Table 2a, and the corresponding optimum values for Q, Sgen,T, Sgen,F, Sgen,Total and are presented in Table 2b.
Table 2.
(a). Optimized results for input parameters. (b). Optimized results using genetic and DIRECT algorithms.
4. Conclusions
In the present investigation, an effort has been made to optimize a flow of Al2O3-EG nanofluid inside a circular tube exposed to constant wall temperature. The EGM approach was applied to optimize the three effective parameters such as Re, volume fraction and nanoparticle diameter using GA and DIRECT algorithms. The key findings are presented below:
- (a)
- The heat transfer enhancement is achieved by increasing nanoparticle concentration, Re and mass flow rate. Moreover, a decrease in particle size aides in heat transfer enhancement.
- (b)
- By increasing Re, entropy generation increased. The optimal condition for minimum entropy generation is 4000. The corresponding m values are 0.54464 and 0.54453 kg/s with GA and DIRECT algorithms. As a result, Re should be kept as low as feasible in order to reduce entropy generation.
- (c)
- The increase in nanoparticle addition increases entropy generation. Therefore, a better thermodynamic system can be obtained by reducing particle volume fraction. The minimum value for entropy generation is obtained at ϕ = 0.2003% and 0.200% using the GA and DIRECT algorithms.
- (d)
- Entropy generation can be minimized by using bigger particles. Minimum entropy generation is possible with dp~65 nm according to the GA and DIRECT algorithms.
- (e)
- Sgen,T plays a dominating role over Sgen,F. However, at higher concentrations, i.e., at 0.8 and 1 vol.%, Sgen,F competes with Sgen,T.
- (f)
- The TEG values show a sharp increment from 0.8–1 vol.%. The enhancement indicates that the addition of nanoparticles increases the entropy generation in the flow.
- (g)
- increases with increasing Re or mass flowrate, dp and vol. concentration. This indicates enhancements in friction entropy generation with these parameters. remains < 1 as Sgen,T dominates Sgen,F throughout the analysis.
- (h)
- The nanofluid developed a maximum of 2.93-fold enhancement in TEG as compared to basefluid. Therefore, nanoparticles should be added to the basefluid carefully.
Author Contributions
S.M.: Conceptualization, methodology, formal analysis, writing—original draft preparation; N.F.A.: Conceptualization, software, validation, writing—original draft preparation; S.B.: Resources, data curation, writing; P.C.M.: writing—review and editing, supervision, formal analysis; N.A.: resources, data curation, writing—review and editing. All authors have read and agreed to the published version of the manuscript.
Funding
This research work did not receive any funds.
Institutional Review Board Statement
Not applicable.
Informed Consent Statement
Not applicable.
Data Availability Statement
All data are available upon request from any of the authors.
Acknowledgments
The authors warmly acknowledge the help and support from the members of Thermal Research Lab (TRL) and School of Mechanical Engineering, KIIT University. The authors are also thankful to Kuwait University (KU) and Kuwait Institute for Scientific Research (KISR) for their support towards this research work.
Conflicts of Interest
The authors do not have any conflict of interest.
Nomenclature
| EG | Ethylene glycol (-) |
| GA | Genetic algorithm (-) |
| Re | Reynold number (-) |
| TEG | Total entropy generation |
| Al2O3 | Aluminium oxide |
| TiO2 | Titanium oxide |
| EGM | Entropy generation minimization |
| D | Diameter (m) |
| DI | Deionized |
| d | Diameter of nanoparticle (nm) |
| f | Friction factor (-) |
| L | Length (m) |
| T | Average temperature (K) |
| v | Average velocity (m/s) |
| Prandlt number | |
| Boltzmann constant (J/K) | |
| MW | Molecular weight (g/mol) |
| NA | Avogadro number (particles/mol) |
| Cp | Specific heat capacity (J/KgK) |
| Mass flow rate (kg/s) | |
| h | Heat transfer coefficient(W/m2K) |
| Heat transfer rate (Watt) | |
| Heat transfer rate per unit length (Watt/m) | |
| Heat flux (W/m2) | |
| Ar | Aspect ratio of the tube |
| St | Stanton number (-) |
| Pr | Prandlt number (-) |
| Pe | Peclet number (-) |
| Entropy generation (W/K) | |
| Greek Symbols | |
| Thermal conductivity (W/mK) | |
| Volume concentration (%) | |
| Dynamic viscosity (Pa.s) | |
| α | Thermal diffusivity(m2/s) |
| Density (kg/m3) | |
| Ψ | Irreversibility distribution ratio (-) |
| Subscripts | |
| i | Inlet |
| o | outlet |
| np | Nanoparticles |
| bf | Basefluid |
| b | Brownian |
| w | Wall |
| avg | Average |
| T | Thermal |
| F | Frictional |
| Total | Gross |
References
- Haque, M.E.; Hossain, M.S.; Ali, H.M. Laminar forced convection heat transfer of nanofluids inside non-circular ducts: A review. Powder Technol. 2021, 378, 808–830. [Google Scholar] [CrossRef]
- Hafeez, M.B.; Amin, R.; Nisar, K.S.; Jamshed, W.; Abdel-Aty, A.-H.; Khashan, M.M. Heat transfer enhancement through nanofluids with applications in automobile radiator. Case Stud. Therm. Eng. 2021, 27, 101192. [Google Scholar] [CrossRef]
- Chabani, I.; Mebarek-Oudina, F.; Ismail, A.A.I. MHD Flow of a Hybrid Nano-Fluid in a Triangular Enclosure with Zigzags and an Elliptic Obstacle. Micromachines 2022, 13, 224. [Google Scholar] [CrossRef] [PubMed]
- Choi, T.J.; Park, M.S.; Kim, S.H.; Jang, S.P. Experimental Study on the Effect of Nanoparticle Migration on the Convective Heat Transfer Coefficient of EG/Water-based Al2O3 Nanofluids. Int. J. Heat Mass Transf. 2021, 169, 120903. [Google Scholar] [CrossRef]
- Mukherjee, S.; Panda, S.R.; Mishra, P.C.; Chaudhuri, P. Heat transfer enhancement with Tio2/water nanofluid in a horizontal circular tube subjected to varying heat flux: An experimental study. J. Enhanc. Heat Transf. 2021, 28, 21–48. [Google Scholar] [CrossRef]
- Ali, N.; Bahman, A.M.; Aljuwayhel, N.F.; Ebrahim, S.A.; Mukherjee, S.; Alsayegh, A. Carbon-Based Nanofluids and Their Advances towards Heat Transfer Applications—A Review. Nanomaterials 2021, 11, 1628. [Google Scholar] [CrossRef]
- Mukherjee, S.; Panda, S.R.; Mishra, P.C.; Chaudhuri, P. Convective Flow Boiling Heat Transfer Enhancement with Aqueous Al 2 O 3 and TiO 2 Nanofluids: Experimental Investigation. Int. J. Thermophys. 2021, 42, 1–26. [Google Scholar] [CrossRef]
- Saedodin, S.; Rostamian, S.H.; Zaboli, M. Hydrothermal analysis and optimization of heat transfer and pressure drop characteristics of different nanofluids in a circular tube with turbulator. Eur. Phys. J. Plus 2021, 136, 708. [Google Scholar] [CrossRef]
- Saleh, B.; Sundar, L.S. Entropy generation and exergy efficiency analysis of ethylene glycol-water based nanodiamond+ Fe3O4 hybrid nanofluids in a circular tube. Powder Technol. 2021, 380, 430–442. [Google Scholar] [CrossRef]
- Mukherjee, S.; Mishra, P.C.; Chaudhuri, P. Energy and Exergy Viability Analysis of Nanofluids As A Coolant for Microchannel Heat Sink. Int. J. Automot. Mech. Eng. 2019, 16, 6090–6107. [Google Scholar] [CrossRef]
- Awais, M.; Ullah, N.; Ahmad, J.; Sikandar, F.; Ehsan, M.M.; Salehin, S.; Bhuiyan, A.A. Heat transfer and pressure drop performance of Nanofluid: A state-of-the-art review. Int. J. Thermofluids 2021, 9, 100065. [Google Scholar] [CrossRef]
- Bejan, A. Entropy Generation Minimization: The Method of Thermodynamic Optimization of Finite-Size Systems and Finite-Time Processes; CRC Press: Boca Raton, FL, USA, 2013. [Google Scholar]
- Marzougui, S.; Bouabid, M.; Mebarek-Oudina, F.; Abu-Hamdeh, N.; Magherbi, M.; Ramesh, K. A Computational Analysis of Heat Transport Irreversibility Phenomenon in a Magnetized Porous Channel. Int. J. Numer. Methods Heat Fluid Flow 2020, 31, 2197–2222. [Google Scholar] [CrossRef]
- Şahin, A.Z. Entropy generation in turbulent liquid flow through a smooth duct subjected to constant wall temperature. Int. J. Heat Mass Transf. 2000, 43, 1469–1478. [Google Scholar] [CrossRef]
- Bianco, V.; Manca, O.; Nardini, S. Entropy generation analysis of turbulent convection flow of Al2O3–water nanofluid in a circular tube subjected to constant wall heat flux. Energy Convers. Manag. 2014, 77, 306–314. [Google Scholar] [CrossRef]
- Bianco, V.; Manca, O.; Nardini, S. Performance analysis of turbulent convection heat transfer of Al2O3 water-nanofluid in circular tubes at constant wall temperature. Energy 2014, 77, 403–413. [Google Scholar] [CrossRef]
- Bianco, V.; Nardini, S.; Manca, O. Enhancement of heat transfer and entropy generation analysis of nanofluids turbulent convection flow in square section tubes. Nanoscale Res. Lett. 2011, 6, 1–12. [Google Scholar] [CrossRef] [Green Version]
- Leong, K.Y.; Saidur, R.; Mahlia, T.M.I.; Yau, Y.H. Entropy generation analysis of nanofluid flow in a circular tube subjected to constant wall temperature. Int. Commun. Heat Mass Transf. 2012, 39, 1169–1175. [Google Scholar] [CrossRef]
- Pati, S.; Roy, R.; Deka, N.; Boruah, M.P.; Nath, M.; Bhargav, R.; Randive, P.R.; Mukherjee, P.P. Optimal heating strategy for minimization of peak temperature and entropy generation for forced convective flow through a circular pipe. Int. J. Heat Mass Transf. 2020, 150, 119318. [Google Scholar] [CrossRef]
- Kadivar, M.; Sharifpur, M.; Meyer, J.P. Convection heat transfer, entropy generation analysis and thermodynamic optimization of nanofluid flow in spiral coil tube. Heat Transf. Eng. 2021, 42, 1573–1589. [Google Scholar] [CrossRef]
- Li, W.; Xie, Z.; Xi, K.; Xia, S.; Ge, Y. Constructal Optimization of Rectangular Microchannel Heat Sink with Porous Medium for Entropy Generation Minimization. Entropy 2021, 23, 1528. [Google Scholar] [CrossRef]
- Manay, E.; Akyürek, E.F.; Sahin, B. Entropy generation of nanofluid flow in a microchannel heat sink. Results Phys. 2018, 9, 615–624. [Google Scholar] [CrossRef]
- Han, Y.; Wang, X.-s.; Zhang, H.-n.; Chen, Q.-z.; Zhang, Z. Multi-objective optimization of helically coiled tube heat exchanger based on entropy generation theory. Int. J. Therm. Sci. 2020, 147, 106150. [Google Scholar] [CrossRef]
- Ebrahimi-Moghadam, A.; Mohseni-Gharyehsafa, B.; Farzaneh-Gord, M. Using artificial neural network and quadratic algorithm for minimizing entropy generation of Al2O3-EG/W nanofluid flow inside parabolic trough solar collector. Renew. Energy 2018, 129, 473–485. [Google Scholar] [CrossRef]
- Mohseni-Gharyehsafa, B.; Ebrahimi-Moghadam, A.; Okati, V.; Farzaneh-Gord, M.; Ahmadi, M.H.; Lorenzini, G. Optimizing flow properties of the different nanofluids inside a circular tube by using entropy generation minimization approach. J. Therm. Anal. Calorim. 2019, 135, 801–811. [Google Scholar] [CrossRef]
- Safarzadeh, S.; Niknam-Azodi, M.; Aldaghi, A.; Taheri, A.; Passandideh-Fard, M.; Mohammadi, M. Energy and entropy generation analyses of a nanofluid-based helically coiled pipe under a constant magnetic field using smooth and micro-fin pipes: Experimental study and prediction via ANFIS model. Int. Commun. Heat Mass Transf. 2021, 126, 105405. [Google Scholar] [CrossRef]
- Mohamadi, S.; Yazdi, M.H.; Solomin, E.; Fudholi, A.; Sopian, K.; Chong, P.L. Heat transfer and entropy generation analysis of internal flow of nanorefrigerant with slip condition at wall. Therm. Sci. Eng. Prog. 2021, 22, 100829. [Google Scholar] [CrossRef]
- Moghadasi, H.; Malekian, N.; Aminian, E.; Saffari, H. Thermodynamic analysis of entropy generation due to energy transfer through circular surfaces under pool boiling condition. J. Therm. Anal. Calorim. 2021, 147, 2495–2508. [Google Scholar] [CrossRef]
- Dong, Z.; Du, Q. The Local Distribution of Temperatures and Entropy Generation Rate in an Ideal Counterflow Heat Exchanger. Coatings 2021, 11, 970. [Google Scholar] [CrossRef]
- Liu, L.; Liu, D.; Huang, N. Entropy Generation for Negative Frictional Pressure Drop in Vertical Slug and Churn Flows. Entropy 2021, 23, 156. [Google Scholar] [CrossRef]
- Cao, Y.; Abdous, M.A.; Holagh, S.G.; Shafiee, M.; Hashemian, M. Entropy generation and sensitivity analysis of R134a flow condensation inside a helically coiled tube-in-tube heat exchanger. Int. J. Refrig. 2021, 130, 104–116. [Google Scholar] [CrossRef]
- Obidowski, D.; Stajuda, M.; Sobczak, K. Efficient Multi-Objective CFD-Based Optimization Method for a Scroll Distributor. Energies 2021, 14, 377. [Google Scholar] [CrossRef]
- Deymi-Dashtebayaz, M.; Akhoundi, M.; Ebrahimi-Moghadam, A.; Arabkoohsar, A.; Moghadam, A.J.; Farzaneh-Gord, M. Thermo-hydraulic analysis and optimization of CuO/water nanofluid inside helically dimpled heat exchangers. J. Therm. Anal. Calorim. 2021, 143, 4009–4024. [Google Scholar] [CrossRef]
- Han, B.; Chakraborty, A. Evaluation of energy flow, dissipation and performances for advanced adsorption assisted heat transformation systems: Temperature-entropy frameworks. Energy Convers. Manag. 2021, 240, 114264. [Google Scholar] [CrossRef]
- Corcione, M. Empirical correlating equations for predicting the effective thermal conductivity and dynamic viscosity of nanofluids. Energy Convers. Manag. 2011, 52, 789–793. [Google Scholar] [CrossRef]
- Corcione, M. A Semi-Empirical Model for Predicting the Effective Dynamic Viscosity of Nanoparticle Suspensions. Heat Transf. Eng. 2012, 33, 575–583. [Google Scholar] [CrossRef]
- Pak, B.C.; Cho, Y.I. Hydrodynamic and heat transfer study of dispersed fluids with submicron metallic oxide particles. Exp. Heat Transf. 1998, 11, 151–170. [Google Scholar] [CrossRef]
- Xuan, Y.; Li, Q. Investigation on Convective Heat Transfer and Flow Features of Nanofluids. J. Heat Transf. 2003, 125, 151–155. [Google Scholar] [CrossRef] [Green Version]
- Bergman, T.L.; Lavine, A.S.; Incropera, F.P.; DeWitt, D.P. Introduction to Heat Transfer; John Wiley & Sons: Hoboken, NJ, USA, 2011. [Google Scholar]
- Ratts, E.B.; Raut, A.G. Entropy generation minimization of fully developed internal flow with constant heat flux. J. Heat Transf. 2004, 126, 656–659. [Google Scholar] [CrossRef]
- Wei, R.; Shi, K.; Guo, X.; Wang, T.; Lv, X.; Li, Q.; Zhang, Y.; Zhao, J.; Yang, L. Evolving thermal conductivity upon formation and decomposition of hydrate in natural marine sediments. Fuel 2021, 302, 121141. [Google Scholar] [CrossRef]
- Jones, D.R.; Martins, J.R.R.A. The DIRECT algorithm: 25 years Later. J. Glob. Optim. 2021, 79, 521–566. [Google Scholar] [CrossRef]
- Jones, D.R. Direct global optimization algorithmDirect Global Optimization Algorithm. In Encyclopedia of Optimization; Floudas, C.A., Pardalos, P.M., Eds.; Springer: Boston, MA, USA, 2001; pp. 431–440. [Google Scholar]
- Williams, W.; Buongiorno, J.; Hu, L.-W. Experimental investigation of turbulent convective heat transfer and pressure loss of alumina/water and zirconia/water nanoparticle colloids (nanofluids) in horizontal tubes. J. Heat Transf. 2008, 130, 042412. [Google Scholar] [CrossRef]
- Rudyak, V.Y.; Krasnolutskii, S. Dependence of the viscosity of nanofluids on nanoparticle size and material. Phys. Lett. A 2014, 378, 1845–1849. [Google Scholar] [CrossRef]
Publisher’s Note: MDPI stays neutral with regard to jurisdictional claims in published maps and institutional affiliations. |
© 2022 by the authors. Licensee MDPI, Basel, Switzerland. This article is an open access article distributed under the terms and conditions of the Creative Commons Attribution (CC BY) license (https://creativecommons.org/licenses/by/4.0/).