Article

Comprehensive and Integrated Impact Assessment Framework for Development Policies Evaluation: Definition and Application to Kenyan Coffee Sector

by
Nicolò Golinucci
1,2,
Nicolò Stevanato
1,2,
Negar Namazifard
2,
Mohammad Amin Tahavori
2,
Lamya Adil Sulliman Hussain
3,
Benedetta Camilli
3,
Federica Inzoli
4,
Matteo Vincenzo Rocco
2,* and
Emanuela Colombo
2
1
Fondazione Eni Enrico Mattei (FEEM), Corso Magenta, 63, 20123 Milan, Italy
2
Department of Energy, Politecnico di Milano, Via Lambruschini, 4, 20156 Milan, Italy
3
Independent Researcher, 20100 Milan, Italy
4
Falck Renewables, Via Alberto Falck, 4, 20099 Milan, Italy
*
Author to whom correspondence should be addressed.
Energies 2022, 15(9), 3071; https://doi.org/10.3390/en15093071
Submission received: 15 March 2022 / Revised: 18 April 2022 / Accepted: 20 April 2022 / Published: 22 April 2022

Abstract

:
The coexistence of the need to improve economic conditions and the conscious use of environmental resources plays a central role in today’s sustainable development challenge. In this study, a novel integrated framework to evaluate the impact of new technological interventions is presented and an application to smallholder coffee farms and their supply chains in Kenya is proposed. This methodology is able to combine multiple information through the joint use of three approaches: supply chain analysis, input-output analysis, and energy system modeling. Application to the context of the Kenyan coffee sector enables framework validation: shading management measures, the introduction of eco-pulpers, and the exploitation of coffee waste biomass for power generation were compared within a holistic high-level perspective. The implementation of shading practices, carried out with fruit trees, shows the most relevant effects from the economic point of view, providing farmers with an additional source of income and generating $903 of work for every million of local currency (about $9k) invested in this solution. The same investment would save up to 1.46 M m3 of water per year with the eco-pulpers technology. Investing the same amount in coffee-biomass power plants would displace a small portion of production from heavy-duty oil and avoid importing a portion of fertilizer, saving up to 11 tons of CO2 and around $4k per year. The results suggest the optimal allocation of a $100m budget, which can be affected by adding additional constraints on minimum environmental or social targets in line with sustainable development goals.

1. Introduction

Over the last decades, the interest in and evidence for the numerous interconnections between energy, the environment, and society have gained increasing importance for the international community. Processes and relationships among countries are becoming global and evolving in a complex framework. In this context, it is no longer possible to consider development strategies without adopting a systemic approach where social and technological aspects are jointly taken into account. In the last decade, the recognized relevance of cross-sectoral linkages among economic sectors has driven research efforts towards the expansion of energy-economic modeling. Moreover, the 2030 Development Agenda identifies energy access as a necessary precondition for human and social promotion, as well as instrumental in fighting poverty [1].
The coexistence of the need to improve economic conditions, particularly in developing countries, and the conscious use of environmental resources play a central role in the global sustainable development challenge. To address this issue, an informed decision-making process is essential and the support of the scientific community for policymakers may be pivotal to foster innovative national development policies.
The adoption of a multidisciplinary framework would allow a comprehensive comparison and evaluation of different policy-making decisions, that can affect the environment and various energy, social, and economic sectors of the country.
Concerning agriculture, a key role is played by smallholder farmers, who produce about 80% of the food consumed in Africa and Asia [2]. Usually, these producers are characterized by a low level of productivity in the agricultural sector, which is today globally responsible for over a quarter of greenhouse gas emissions, the use of half of habitable land, and 70% of freshwater withdrawals [3].
The complexity of this problem has been recently tackled in the literature either by combining multiple models in one unique framework or by adopting a macro-economic perspective. In particular, the integrated framework of CLEWS has been presented and adopted to demonstrate the added value brought by adopting an integrated approach, able to capture multiple dimensions of sustainable development by describing the interaction between energy, water, and climate models [4,5,6,7]. Some studies take advantage of the multiple opportunities offered by integrating physical life cycle assessment and input-output models to analyze the economic, social, and environmental impacts of replacing conventional liquid fuels with alternative energy sources on the countries’ economic systems [8,9]. Moreover, statistical regression analyses have been used in some studies to investigate the effect of social and environmental factors and climate adoption strategies on African farmers’ revenue [10]. However, not all the complexities of sustainable development can be grasped by models: financial barriers could hamper climate-resilient investments, in particular in Sub-Saharan Africa. A proper regulatory framework is required to narrow the climate finance gap necessary for sustainable development but is difficult to be explicitly represented in models [11].
There are rare attempts that follow a comprehensive cross-sectoral analysis by deeply investigating the effects of technological innovation and new renewable energy resource introduction not only on the economy and nature but also on the energy system in detail. Therefore, to fully realize the sustainability of development opportunities in a specific sector, impact assessments should not be limited to socioeconomic and environmental indicators but incorporate explicit analysis within the energy sector of the country. The need for a framework for addressing the multi-dimensional evaluation of not only climate adoption strategies but also technological innovation on a specific supply chain emerges from the literature.
The objective of this research is the formalization and application of a ComprehensIVe and Integrated Country Study (CIVICS) framework able to assess the impact of policies considering their multidimensionality, which may be used for supporting decision-making in developing countries. The tools adopted are (i) supply chain analysis (SCA), (ii) the input–output analysis model (IOA), and (iii) energy system modeling (ESM). The SCA allows us to acquire insights into the supply chain of a specific local product considered strategic for national economic development. It permits us to focus on bottlenecks and hotspots undermining the supply chain’s overall performance. This analysis allows us to identify strategies and improvement solutions that can be implemented to overcome the main issues. With the aim of determining the environmental and economic impact of the changes occurring with the adoption of the analyzed interventions, an IOA model is adopted, and to increase the level of technological detail in characterizing the energy response to changes, a dedicated ESM is needed. In particular, the capability of evaluating energy planning strategies in synergy with the analyzed economic policy, enabled by the integration among the models, represents an important added value.
The peculiarity of this research approach relies on the integration process mentioned. The adopted tools are combined in an ad-hoc developed system allowing the decision-makers to assess the multiple impacts of their national strategies and to identify them in the sustainable development framework.
This unique framework is applied in the context of developing African economies with a focus on the coffee sector in Kenya, which is one of its major economic pillars. Despite the decrease in coffee production and exports, local policymakers are concerned about supporting the coffee industry. The reason behind the decrease in the productivity of this sector are various but, in this study, the focus is on endogenous reasons that can be associated with the poor management and governance of the cooperative system and poor technological innovation. Therefore, first, a supply chain analysis is carried out to identify the potential interventions for improving productivity. Then, these interventions are applied by modeling the whole Kenyan economy, adopting a social accounting matrix developed by JRC [12] to represent all the transactions among the relevant economic agents. Finally, the role of the produced biomass from the wet processing of coffee as an energy resource is analyzed by accurately modeling the Kenyan electricity system.
The remainder of this work is structured as follows: in Section 2, the methodological approach is presented; in Section 3, the first case study is introduced and the methodology is calibrated on its peculiarities, contextually providing the lesson learned from the SCA and suggested interventions; in Section 4, results are analyzed and conclusions derived.

2. Materials and Methods

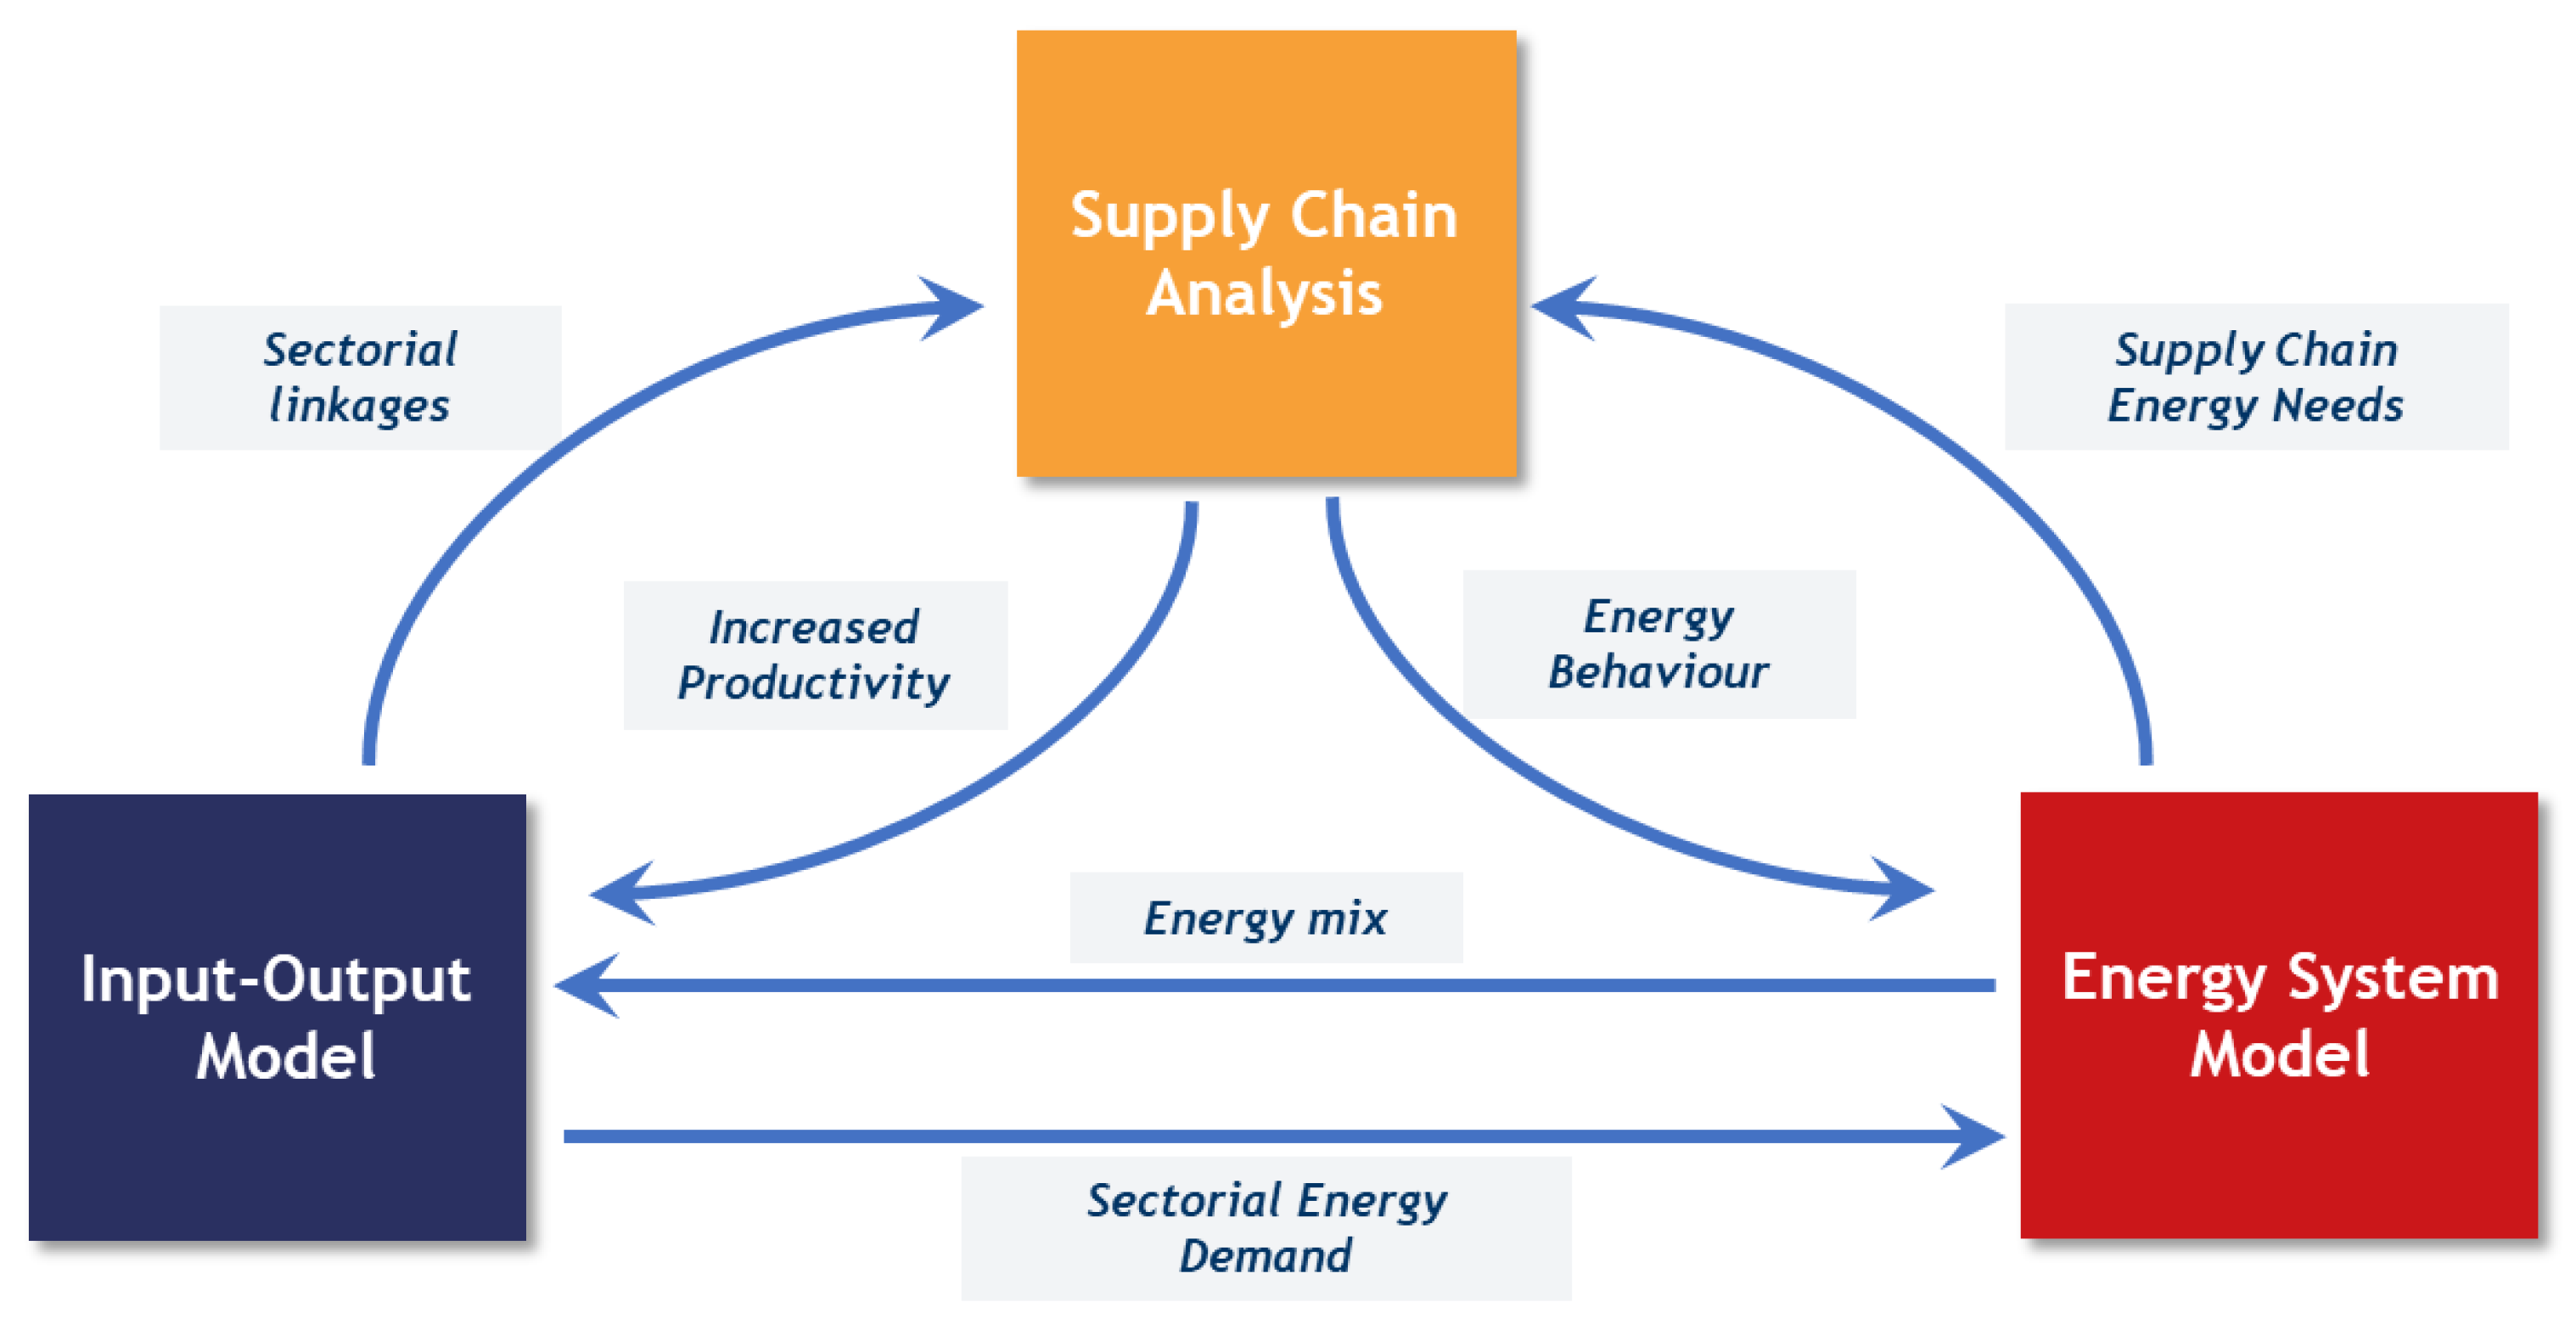
2.1. Interaction among the Tools within CIVICS Framework

Supply chain analysis (SCA) can be considered the first step of this framework. It consists of the process of investigating and studying the role and contribution of each economic agent (actors such as producers, traders, and consumers, as well as legal entities such as businesses, authorities, and development organizations) along a supply chain, that contribute directly to the generation of a final product or service. This activity involves the evaluation of every stage of the supply chain, starting from the raw materials or intermediate product acquisition and finishing downstream, after all the stages of transformation and increase in value, at the final delivery of the product to the consumer [13]. The need for such analysis can be easily understood when considering the rise of globalization and global trading. In the global supply chain, the developing countries usually play the role of supplying the raw materials to the more industrialized countries, due to a lack of know-how and expertise regarding the processing steps of a product. These countries mostly face problems affecting the performance of the supply chain which include the instability of governments and policies, corruption, labor-intensive industries, deteriorated infrastructures, the limited use of new technologies, underemployment, child labor, and the low education level of the population [14]. The fragmented market on which many supply chains of developing countries are based, alongside the low access to quality services and information for all the stakeholders of the supply chain (particularly small producers) and the informal economy somehow regulating many steps of the chain make it difficult to collect precise and accurate information to carry out a rigorous study of the supply chain of a specific product. Therefore, in this research, a customized methodological approach to SCA in developing countries, which has been developed by the authors [13] based on the steps shown in Figure 1, is adopted.
After investigating the bottlenecks in the supply chain of the determined local products, the identified strategies are implemented through IOA. This approach represents a suitable and comprehensive industrial ecology methodology for evaluating a structural change in a determined supply chain while considering the implications on the complex network of interlinkages among different economic sectors [15]. IOA refers to a macroeconomic analysis approach based on the study of the sectoral interrelations of an economy [16] and requires the use of input–output tables, economy-wide databases able to capture the flows of monetary value between different sectors.
The model adopted in this research is a demand-driven input-output model based on Supply and Use Tables (SUT). As it has been shown by Lenzen, the framework offered by SUT can be adopted to directly perform impact analysis [17,18]. The authors invite the reader to the A3 section of the Supplementary Material S1 for more technical details.
In this framework, it is possible to assume a change in a specific interrelation between two economic activities of a supply chain by intervening in a specific coefficient. Since the objective of this work is to evaluate the impact of a technological change related to both implementation and use, it is required to distinguish every intervention in those two steps. In both cases, there will be an impact on socio-economic factors (linked with production through the matrix of monetary exogenous coefficients f) and environmental extensions (linked with production through the matrix of physical exogenous coefficients e), respectively, F and E.
  • Investment assessment: in this step, it is required to characterize all the commodities needed to have the technology produced and installed (e.g., the cost of machinery and the required training course). From a modeling point of view, this will be translated by simply adding the required commodities to the final demand vector. The investment will be handled, as shown in (1), with the current technology assessment (no subscript identifies baseline data, while subscript i identifies investment data);
  • Operation assessment: in this step, it is required to describe all the cross-sectoral changes that are occurring due to the installed technology. The structural change in operation will influence, as shown in (2), how the baseline final demand is delivered (subscript o identifies data after the implementation of the intervention). These changes may be translated to the model in the following ways:
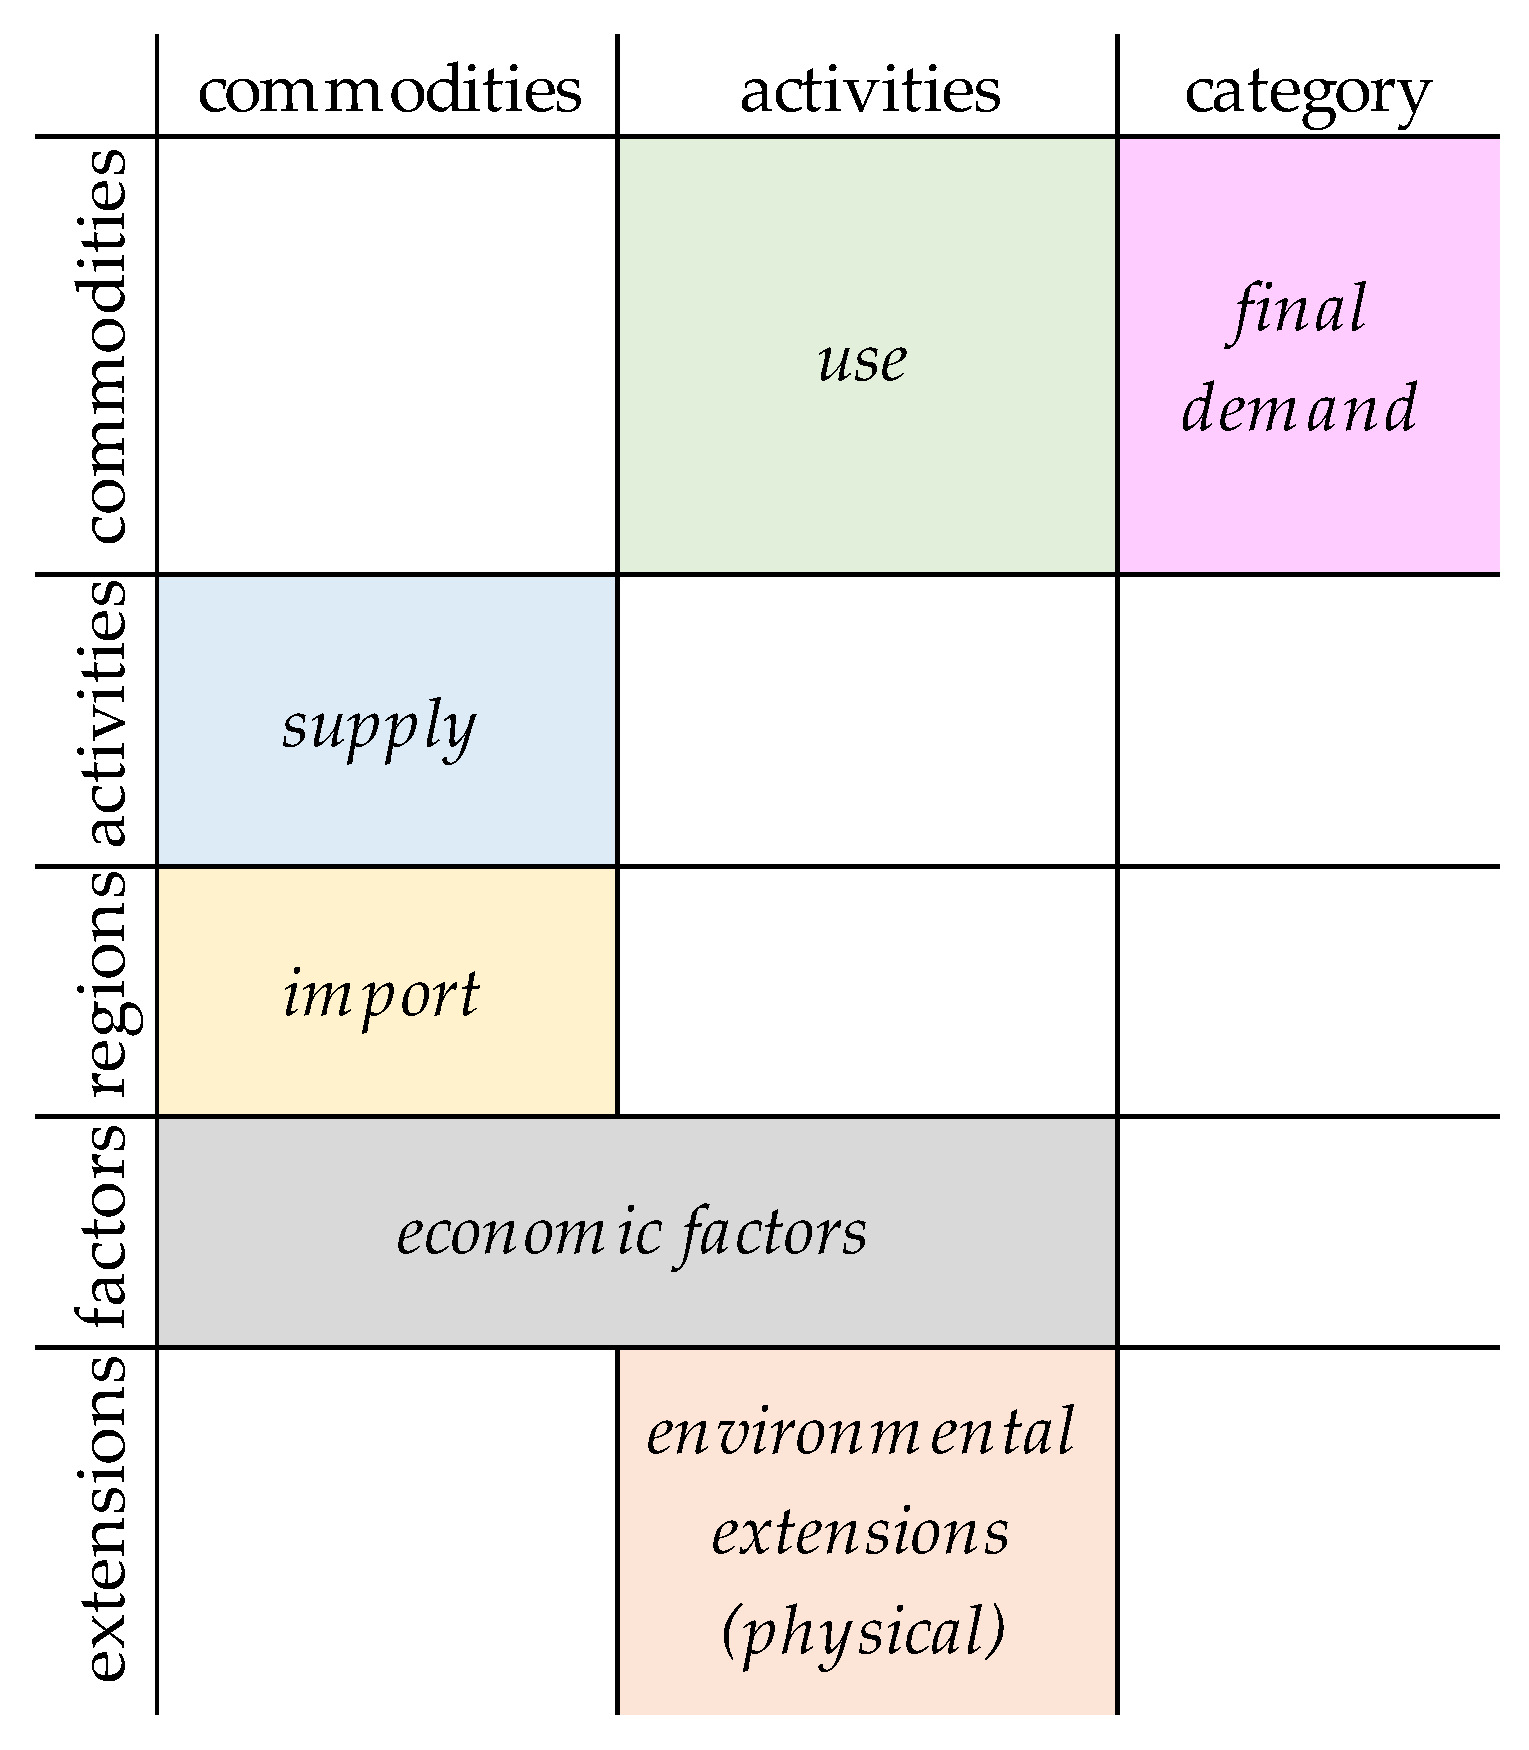
    • Change in the use coefficients matrix (u, the use side of matrix z): a specific variation of u can reflect a change in how much input of a certain commodity is required for one unit of output (e.g., machinery, not used in the baseline, will directly increase the consumption of diesel in a certain activity).
    • Change in the satellite account coefficients matrices (f and e): a specific variation of f or e can reflect a change in activity intensities (e.g., machinery, not used in the baseline, will directly emit an additional amount of CO2 emissions in performing a certain activity).
    • Change in the market share matrix (v, the make side of matrix z): a specific variation of a v coefficient represents how much of each activity is required every time a certain commodity is demanded. Therefore, a change in the v matrix could be used to model the change in the productivity of a specific activity. In fact, productivity is how much output is produced for each unit of input, or, in the case of a demand-driven model, how much input is needed to deliver the same output (e.g., the physical productivity of coffee plants increases because of the introduced technology).
Δ F i _ _ = f _ _   [ ( I _ _ z _ _ ) 1   Y i _ X i ] f _ _   [ ( I _ _ z _ _ ) 1   Y _ X ] Δ E i _ _ = e _ _   [ ( I _ _ z _ _ ) 1 Y i _ ] e _ _   [ ( I _ _ z _ _ ) 1   Y _ ]
Δ F o _ _ = f o _ _   [ ( I _ _ z o _ _ ) 1   Y _ X o ] f _ _   [ ( I _ _ z _ _ ) 1   Y _ X ] Δ E o _ _ = e o _ _   [ ( I _ _ z o _ _ ) 1 Y _ ] e _ _   [ ( I _ _ z _ _ ) 1   Y _ ]
Note that a variable with one underline identifies a vector, while one with a double underline identifies a matrix. A variable in capital letters has absolute units (e.g., M$ or Gg), while one in small letters has output-specific units (e.g., M$/M$ or Gg/M$).
Where X and Y represent the total production of commodities and industrial activities and the final demand of commodities, respectively, z symbolizes the supply and use representation of the technological structure of the economy and I is the identity matrix of the same dimensions of z. The calculation is carried out through an openly available Python-based tool for performing input–output analyses, called MARIO [19].
Eventually, in order to understand the required energy system planning to align with the identified technological changes in the supply chain of the determined local products, a model of the energy system is adopted. ESM consists of the practice of building a mathematical representation of a physical energy system in order to understand its dynamics and reaction to interventions or future scenarios. It can be summarized as a discipline to support energy policy and long-term strategic energy planning decisions with insights generated by models. In particular, for this work, it is possible to narrow the discussion to engineering models for energy systems sizing, investment planning, and operation or dispatch optimization. The selected modeling framework is the open-source software Calliope [20], a “linear programming framework for spatial–temporal energy system optimization” [21]. The framework allows for a 1-year modeling horizon, works with 1 h resolution, and is based on the power nodes model, meaning that the geographical resolution of the model is left to the modeler, depending on the specific needs. A power node is created to represent a region, an area, or a building, where energy can be produced, consumed, and transferred from one another. The advantage of being able to customize the modeled power nodes is that the geographical scope and resolution representable with the framework is completely up to the necessities of the modeler and able to adapt to the availability of data, often a critical aspect when modeling systems in developing economies. In this research, the spatial resolution of our modeling is set to the national scale.
In Figure 2, a set of possible interactions between the tools, which summarize the approach, is outlined. As it is mentioned, in the presented configuration, IOA, a fit-for-purpose modeling approach of Industrial Ecology [22], acts as a bridge between a robust characterization of the supply chain under investigation and detailed modeling of the energy system. Indeed, thanks to the exchange of information between SCA and IOA, (as the outputs of the SCA are input for the IOA), it is possible to evaluate impacts at the social, economic, and environmental levels of the formulated improvement strategies. Furthermore, the integration of results between IOA and ESM permits us to formulate an energy strategy ad hoc for these interventions, addressing sustainable development objectives.

2.2. Evaluating and Comparing Interventions within the CIVICS Framework

The scope of the CIVICS framework is to evaluate economic development opportunities in a specific socio-economic context from a country perspective. At the same time, it is possible to assess how these opportunities are configured with respect to national environmental objectives. In this sense, the approach should be seen as a way to coherently compare investment opportunities within the same limiting modeling assumptions.
Each opportunity is identified by a possible technological intervention. This intervention has an impact not only on the sector in which the direct change takes place but also on its interlinked activities. In real life, these changes occur while many other interrelated activities change in magnitude or in the needed input mix. The model is a representation of an approximated reality where it is possible to isolate the effect of each specific intervention.
If an intervention is beneficial in reducing the amount of input required for delivering the same products and services that were produced and delivered in the baseline case, this means that the intervention could be used to unleash the potential for expanding the production, increasing the wages, or improving the margins. Since it is not possible to evaluate the potential effects of these potential political choices, it is preferred to build up a general economic indicator that considers the total savings triggered by each intervention with respect to the required level of investment.
The name of this indicator, defined in (3), is Policy Return on Investment (PRoI), and represents the expected yearly economic return on the investment from a national perspective, considering all the direct and indirect implications of changing the sectoral interdependencies on the shape of each intervention. The yearly economic return embodies not only the savings in the form of economic factors from the sector where the intervention occurs (e.g., being more productive leads to using less capital land per unit of output) but also in the form of avoided import (e.g., the new configuration implies a self-production of an organic fuel that replaces a fraction of the imported oil) and avoided internal input request (e.g., trees are introduced for their shading potential but they also produce locally consumed fruit as a by-product which substitutes a fraction of bought food).
PRoI = Savings o   [ M $ / y ] Investment i   [ M $ ] = PPBT 1
The inverse of PRoI is the Policy Pay-Back Time (PPBT) and represents the number of years needed to repay the investment faced. It should be underlined that this repayment time must not be compared with entrepreneur-level repayment time, which is based on an individual investment perspective.
PRoI or PPBT are therefore used as a general economic indicator that reports the level of increase in the economic efficiency of the country involved in each intervention. Of course, there are many other possible case-specific indicators that can influence the choice between taking the investment opportunity or not.
For the sake of consistent comparison, each of these indicators should be referred to on the basis of the same functional unit. A functional unit is a quantified description of the function of a product or service that serves as the reference basis for all calculations regarding impact assessment [23]. In this case, and as a general rule, the same level of investment could be used as a functional unit to coherently compare interventions, providing useful insights for policymakers for each relevant dimension. This application of CIVICS will be referred to as Integrated Multidimensional Analysis.
Furthermore, this approach could be extended by adopting linear optimization techniques, which can turn into a Policy Goal application of CIVICS. In fact, assuming linearity between investment level and savings, therefore neglecting possible non-linear dependencies between the magnitude of the intervention and the relative costs and benefits, it is possible to build an optimization problem shaped on policy-maker objectives. For example, as can be seen by the set of inequalities in (4), it is possible to have a mix (mix) of interventions expressed in millions of investments that meet budget constraints and social and environmental objectives while minimizing the amount of input required to deliver the same final demand (i.e., maximizing savings).
M a x ( m i x _ T   P R o I _ ) s . t .   m i x _ T   1 _ B u d g e t m i x _ T   i j _ M i n i m u m _ s o c i a l _ o r _ e n v i r o n m e n t a l _ o b j e c t i v e j j
where ij represents the net intensity change expected with respect to social or environmental objective j. Note that all the underlined variables are vectors with dimensions as big as the number of possible interventions.
A more detailed description of the methodological approach can be found in the Supplementary Information (Supplementary Material S1).

3. Case Study

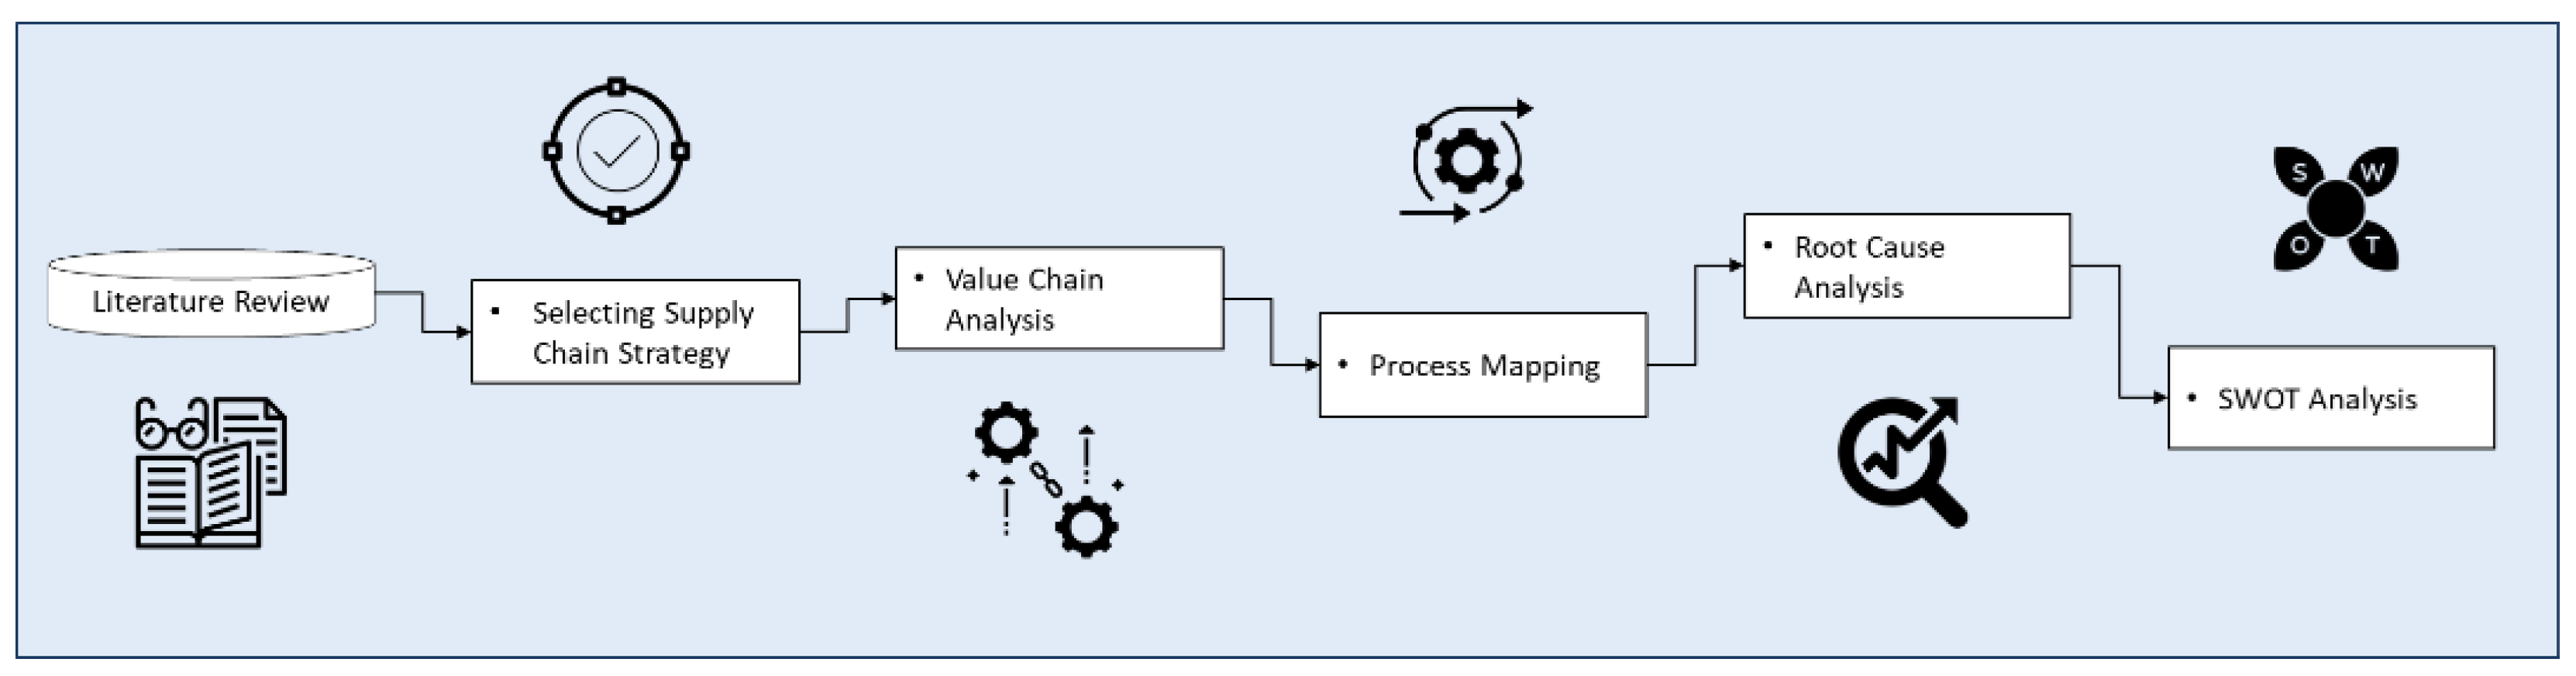
3.1. Agriculture in Kenya: Addressing the Supply Chain Analysis of the Coffee Sector

Over the last years, the Kenyan Government, in an attempt to strengthen the commitment toward sustainable development, has promoted key public investments based on four priority development pillars, namely: (i) enhancing food and nutrition security, (ii) providing affordable housing, (iii) increasing manufacturing and agro-processing, and (iv) achieving universal health coverage. The agriculture sector has a pivotal role in ushering in these sustainable economic development ambitions. Agriculture is not only central to the achievement of “a globally competitive and prosperous country with a high quality of life by 2030”, but it is also expected to deliver on Kenya’s global commitments, including the Sustainable Development Goals (SDGs) [24,25]. Nowadays, agricultural incomes (from crops, livestock, and fishing) account for 64% of the income sources of the poor and 53% of incomes for the non-poor (The World Bank, 2019a). Moreover, the sector establishes the industrialization framework by supplying raw materials to other industries (over 75% of industrial raw materials) and it lays the foundation of numerous off-farm activities, such as logistics and research [26]. In fact, agriculture contributed indirectly to 27% of the GDP in 2019, through the linkage with manufacturing, distribution, and other service-related sectors [27].
However, despite having one of the highest productivities in Eastern Africa, a large share of agriculture in Kenya is still prone to harvest failure (as caused by drought in 2019), being for the most part rainfed. For this reason, ongoing policy and institutional reforms are focusing on stabilizing agricultural output and reducing the risks, by supporting irrigation schemes, post-harvest losses management, and input markets.
In particular, the coffee sector in Kenya relies on a well-developed logistics hub, where all the main international traders, as well as a large pool of coffee experts, from farming to marketing, logistics, and trading are represented. However, Kenya contributes a small share to the global coffee market and accounts for 11.7% of African production. Despite the fact that coffee is still one of the strategic products for the Kenyan domestic economy, its role has been downgraded over the last decades. This decline follows a downward trend in production, which is expected to drop to a new record low for 2019–2020 (around 39,000 tons), as affected by the prolonged drought and low returns. In addition, and similarly to other coffee-producing countries, price volatility and significant fluctuations have deterred Kenyan producers and other value chain actors from making the necessary investments for increasing competitiveness, productivity, and production [28].
Average national productivity for Arabica coffee in Kenya is estimated at around 300 kg/ha of clean coffee for smallholder farms, which is low compared to average yields for Arabica worldwide (698 kg/ha) and in neighboring countries, such as Rwanda (1160 kg/ha) and Ethiopia (995 kg/ha) [29,30]. This gap may be the result of different factors such as sub-optimal or obsolete agricultural practices, the scarce availability of technical skills and knowledge, limited access to inputs and technologies (such as modern coffee varieties, chemicals, fertilizers, irrigation), and land size. At the same time, the high incidence of pests and diseases, such as coffee berry disease and leaf rust, remains a major issue, affecting cost and yields for most growers in Kenya [28,31,32].
Addressing the main outputs of the SCA, three interventions to enhance the sustainability and the value addition of the supply chain were identified for the CIVICS framework, in particular:
  • The introduction of shading management practices via trees, through intercropping in coffee plantations (shading trees);
  • The introduction of innovative water-saving pulping machinery for the wet milling process (eco-pulpers);
  • The exploitation of coffee wet-processing waste as a source of biomass for energy and fertilizer production (biomass).
These interventions have been contextualized considering Kenya’s specific background, whether they have been already implemented or not in similar cases, and the existence of technologies easily available, in order to provide a set of realistic interventions. Furthermore, since the lowest level of coffee productivity is observed within smallholder production, all the interventions have been modeled as if they took place at the rural cooperative level.

3.2. Applying CIVICS Methodology to the Coffee Sector in Kenya

In order to model the Kenyan economy, it is required to represent it in such a way that economic agents’ transactions could be accounted for entirely. In this research, the SUT, reported in Figure 3, is built from the information of the social accounting matrix (SAM), developed by the Joint Research Centre (JRC) [33], extended with EORA’s national environmental extension for the same period (i.e., 2014) [34]. This SAM has been selected because of its recently updated data and for the characterization of household activities as a contribution to the local economy. This is very important when it is required to model the agricultural sector in a developing economy such as Kenya’s, especially when analyzing the coffee sector, where smallholder production is extremely relevant.
The present structure, in the form of the observed exchanges during the year 2014, works as a baseline on which technological interventions have been modeled.
From the SCA, three possible interventions to improve the coffee sector have been identified. The technical details of the modeling of the following interventions are provided in the Supplementary Information (Supplementary Material S2), while here a general overview is provided.
  • Shading management via trees
Optimal coffee-growing conditions include cool to warm tropical climates, good rainfall, and rich soils. Rising temperatures and recurrent droughts, experienced by many regions in the world as a result of climate change, represent a challenge for coffee production. Therefore, adaption practices are required in order to reduce the risks and the decline in coffee productivity. Among those, coffee shading (so-called shade-grown coffee) represents a climate-smart practice, which is gaining popularity, especially within small-holder contexts. Data sources of this intervention are reported in Table 1.
In the framework of this study, Coffee-Banana Intercropping (CBI) was considered. Research conducted in different contexts in Sub-Saharan Africa [35,36] proved that CBI systems can bring multiple benefits for smallholders, in particular:
  • Increased resilience to climate change and extreme weather events;
  • Increased incomes and improved food and nutrition security;
  • Improved plant growth and enhanced coffee quality;
  • Reduction in greenhouse gas emissions.
Potential disadvantages and barriers to the adoption of CBI were also pointed out:
  • Negative impact on physical yield;
  • High level of initial investment.
Table 1. Input parameters for shading tree management intervention.
DescriptionValueUnit of MeasureReference
Number of coffee plants1800–2200 1Plants/hectare[28]
Fraction of shading trees to coffee plants25%[37]
Cost of purchasing a shading banana plant1.3$/plant[38]
Cost of planting a shading banana plant0.13$/plantEstimation: a 10% cost over purchasing was assumed.
Banana yield15kg/plant[39]
Banana price0.065$/kg[39]
Reduction in physical yield (optimum level of shading)8–15%[37]
Reduction in monetary yield (potential price growth)2%[36]
Increase in the total soil carbon stocks3.8ton/ha[36]
Reduction in required capital-machines27%[40]
Growth in demand for labor38%[40]
Useful life of the shading plants20yearsEstimation: multiple banana trees emerging from the same rhizome in a couple of decades
1 In an intercrop system, the plant population is going to be less than the actual number in Kenyan coffee monocrops, which is reported at around 2500 plants per hectare.
b
Eco-pulper for wet milling process
The pulping process is the last step of green-coffee production which takes place before drying. In the first step of the wet process, the skin and the pulp of the cherry are removed by a pulping machine, separating the pulp from the seed. Washing clears all remaining traces of pulp from the coffee seeds, which are then dried either by exposure to sunlight on concrete terraces or by passing through hot-air driers. The dry skin around the seed, called the parchment, is then mechanically removed, sometimes with polishing. This process takes place in the so-called wet mills and can affect the quality of coffee as a result of poor pulping. Losses incurred could be significant, but there are no available data to indicate their extent [28].
Pulping is normally based on a large water withdrawal and discharge, representing a risk for the sustainability of the process as well as for the communities living in the surroundings. Nowadays, available technology, the so-called eco-pulper machinery, is able to drastically reduce the impacts on water sources by minimizing water consumption and wastewater production. These machines can process up to 1 ton/h, reducing the processing time, serving several farms which can actually share the financial risk associated with the investment, and increasing the use of petroleum-based fuel. Data sources of this intervention are reported in Table 2.
c
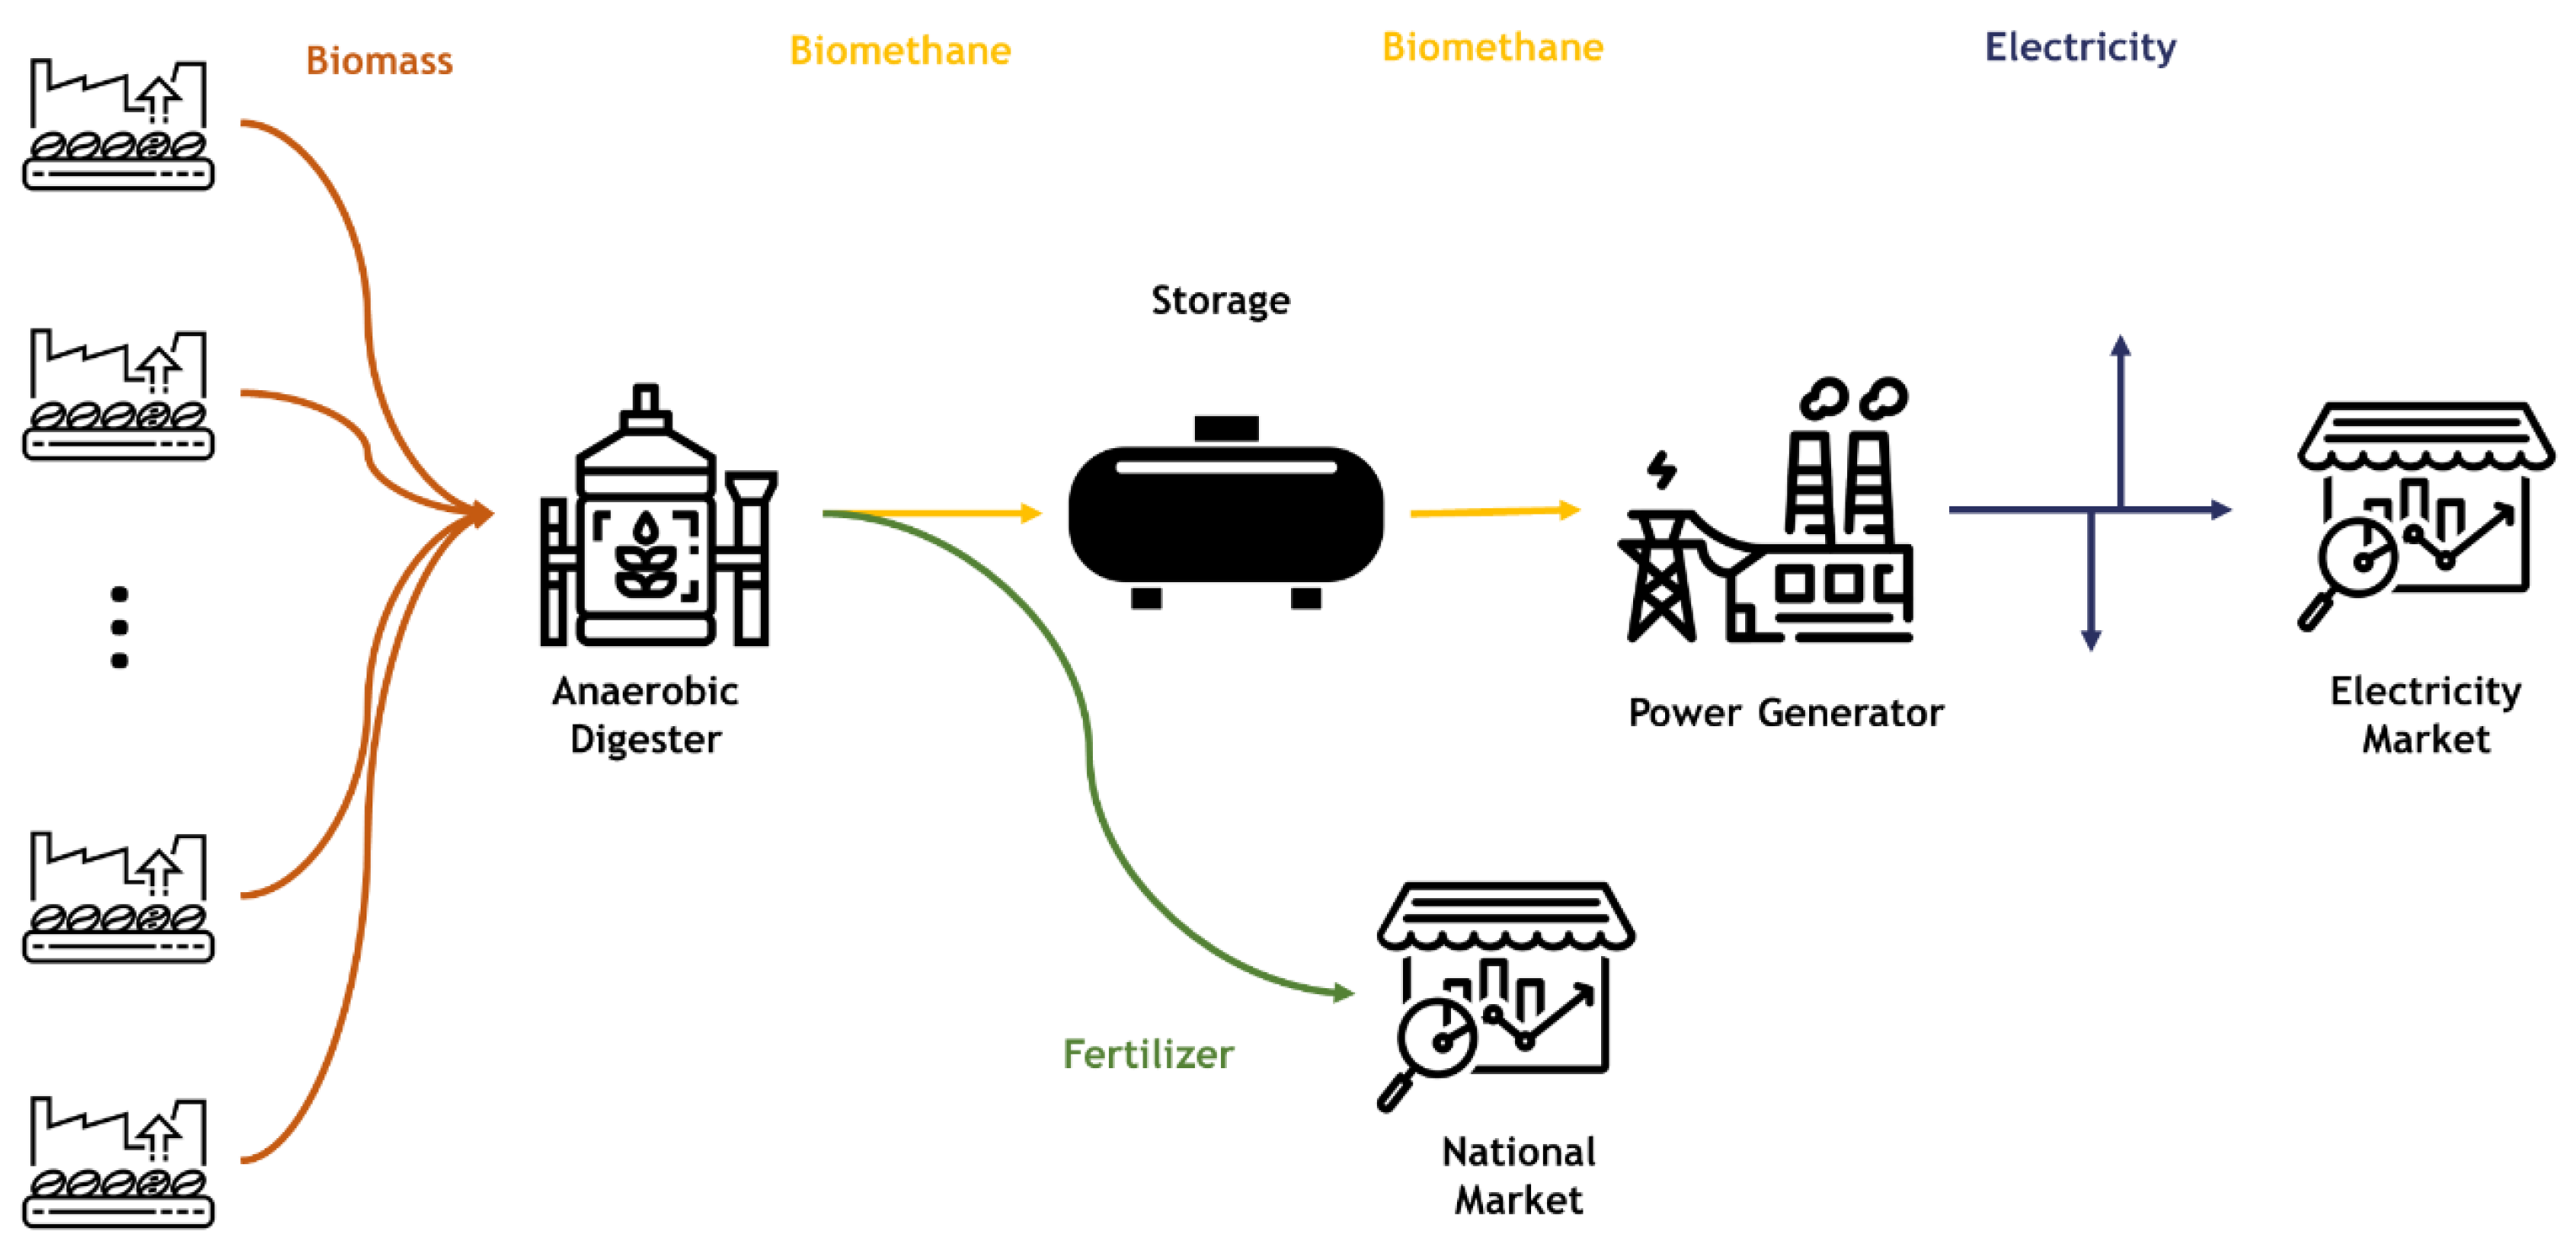
Exploiting biomass from coffee organic waste
As previously mentioned, from the SCA it has emerged that the wet processing generates waste, such as water and exhausted biomass. As also supported by observations in both Ethiopia and Kenya [44,45,46], waste, if not properly managed and discharged into the environment without any treatment, can affect the environment and pose a risk to communities. Data sources of this intervention are reported in Table 3 and the Logical Structure of the intervention reported in Figure 4.
Following the principles of the circular economy, the proposed intervention aims at taking advantage of the waste biomass by feeding an anaerobic digester coupled with a biogas upgrader to produce bio-methane [47]. It is noteworthy that, in addition to the production of biogas, the anaerobic digestion of agricultural waste also produces an organic residue, namely digestate, which is rich in nutrients. If this digestate is utilized in plant production, nutrients will be reintegrated into the soil nutrient cycle, contributing to maintaining soil quality and fertility. The utilization of digestates may replace or at least reduce the use of mineral fertilizers, since they usually are rich in plant-available nutrients such as ammonium (NH4+), phosphate (P), and potassium (K) [48,49]. Moreover, the re-use of digestate for plant production, including coffee, is of particular interest to the Kenyan economy, being that fertilizers are massively imported into the country and on which the domestic agricultural sector relies heavily [50].
Table 3. Input parameters for biomass powerplant intervention.
DescriptionValueUnit of MeasureReference
Specific cost of biodigester10,000$/Nm3/hEstimation: assumed on the basis of field interviews and industrial players’ judgments.
Specific cost of storage0$/Nm3Estimation: assumed on the basis of field interviews and industrial players’ judgments.
Specific cost of generator500$/kWEstimation: assumed on the basis of field interviews and industrial players’ judgments.
Electricity production in one year by new plants80GWhEnergy modeling output (Calliope) 1
Carbon intensity of electricity production from heavy fuel oil0.27kgCO2/kWh[43]
Efficiency of the old diesel generators to be replaced0.4-Estimation: average efficiency of diesel generators.
Biomass to fertilizer rate0.3-Estimation: assumed on the basis of field interviews and expert judgments.
Labor cost 237.5 [51]
Size of biodigester250Nm3/hEstimation: assumed on the basis of biomass plant characteristics.
Size of generator25,000Nm3Estimation: assumed on the basis of biomass plant characteristics.
Size of storage1MWEstimation: assumed on the basis of biomass plant characteristics.
Increase in use of transport commodity by cooperatives30%-Estimation: assumed based on coffee fields and biomass plant proximity.
Useful life of the machines25yearsEstimation: assumed on the basis of biomass plant characteristics.
1 To be changed for every different number of Gensets. 2 Considering 2 technicians, one process engineer, and one electrical and power engineer per each plant.
The wet-mill process produces two different kinds of biomass waste, namely pulp (assumed to be 200% of the weight of the final green coffee production) and parchment (assumed to be 20% of the weight of the final green coffee production). The amount of waste produced refers to [52], who performed a specific analysis on the coffee industry of Kenya. The intervention proposes to collect the biomass waste at the mills level for biogas production, installing a power-producing machine in 17 mills.
The power produced by such machines is assumed to be injected into the national grid, and the fertilizer produced to enter the national market. Given the extreme seasonality of the availability of the coffee waste biomass, it is necessary to account for a storage system, in which the bio-methane is stored to allow the electricity generation to be carried out all year long. The impact of such intervention is explored with a twofold approach, taking advantage of the two modeling strategies presented in this work. Through the energy system model of the country, it is possible to assess how the national electricity system reacts to the new generating technologies, integrating them into the energy mix, and to observe how and when this energy is used, while the IOA permits us to estimate the impacts on the economy of changing the inputs to the electricity sector and avoiding the import of a part of the fertilizers required by the smallholder coffee cooperatives.

4. Results and Discussion

In order to guarantee a coherent comparative analysis, the same investment level of KES 1 million, corresponding to approximately $9k, is adopted for the analysis.
Within this modeling structure, assuming a policy goal and a set of implementation strategies, it is possible to adopt the two applications of the CIVICS framework, depicted in Section 2.2.
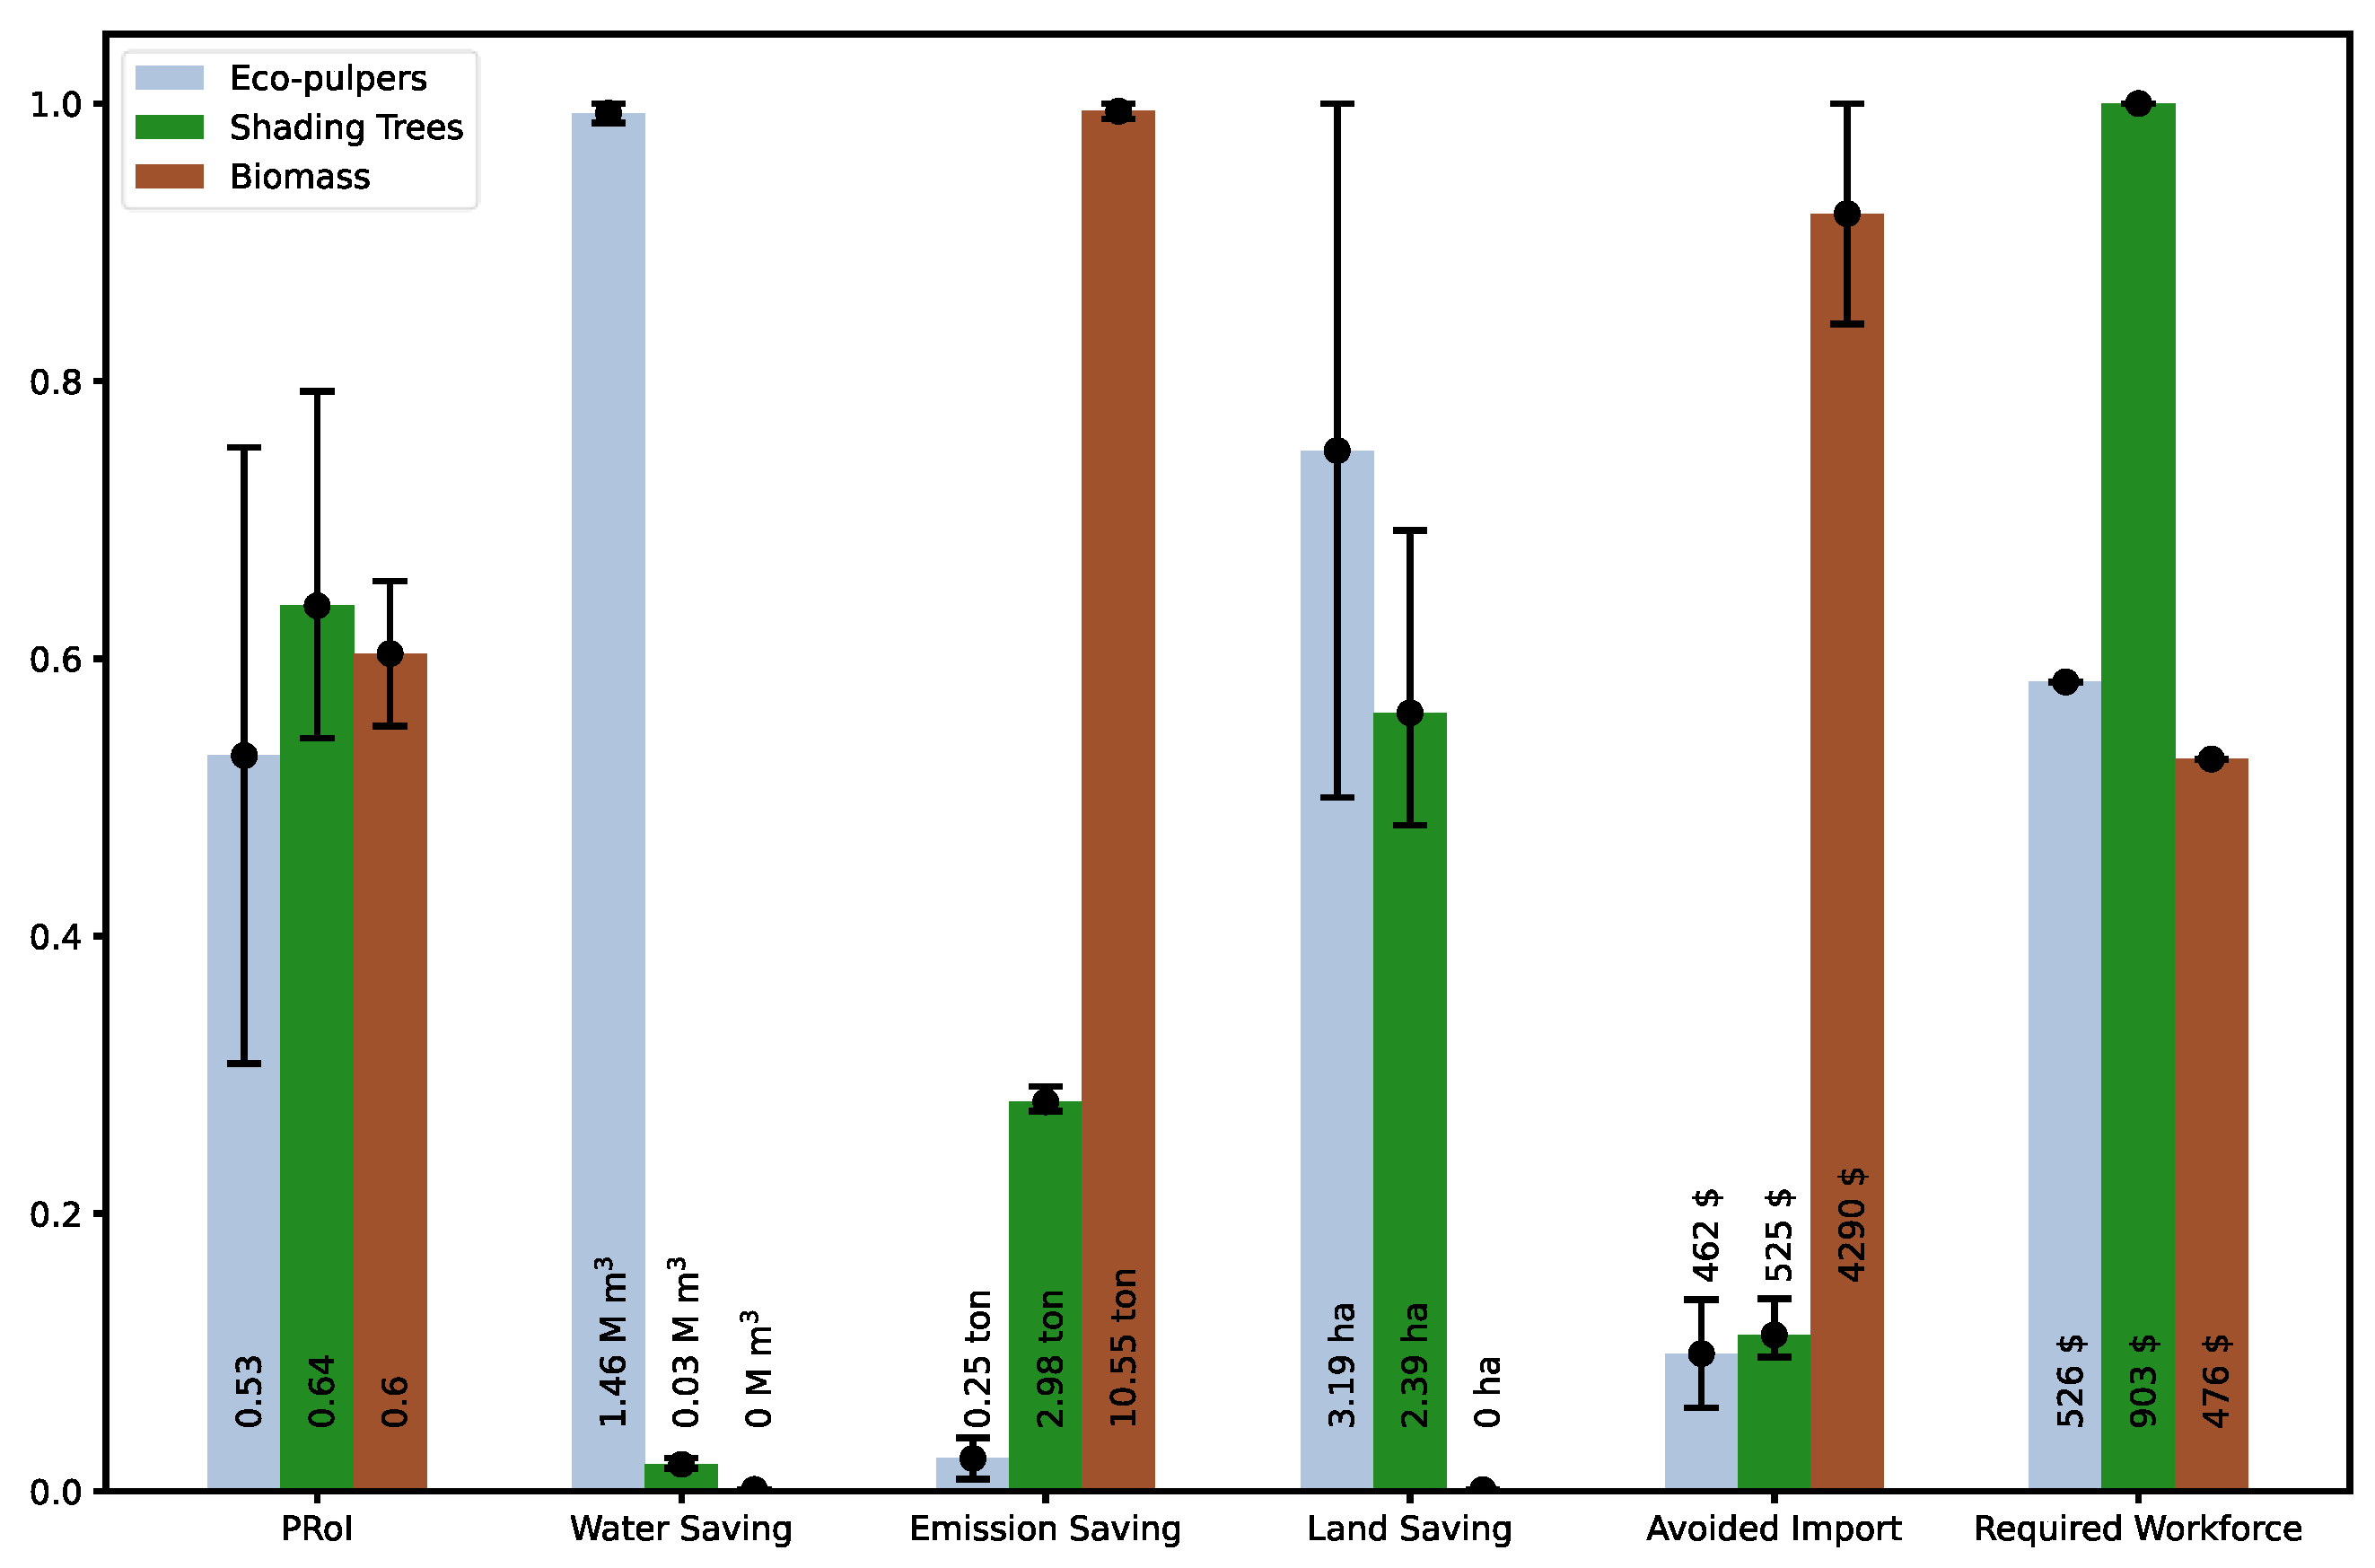
  • Integrated Multidimensional Analysis: evaluate the impact of different interventions and create a set of comparable and case-specific indices. In the present case, the focus is on six indicators, which are connected to as many SDGs.
  • Policy Goal: find an optimized mix of strategies that is compliant with policy-makers’ main concerns while respecting other policy objectives. For this specific case study, a budget constraint of $100m is set. In this case, the maximization of the savings of economic production factors is first compared in the absence of further constraints and then subjected to one on green-water savings and reduction in CO2 emissions.
Figure 5 represents an exhaustive summary of the Integrated Multidimensional Analysis, including six indicators by which the impact of various applied interventions is compared. In the following, a detailed description of the change in each indicator by the proposed strategies is reported.
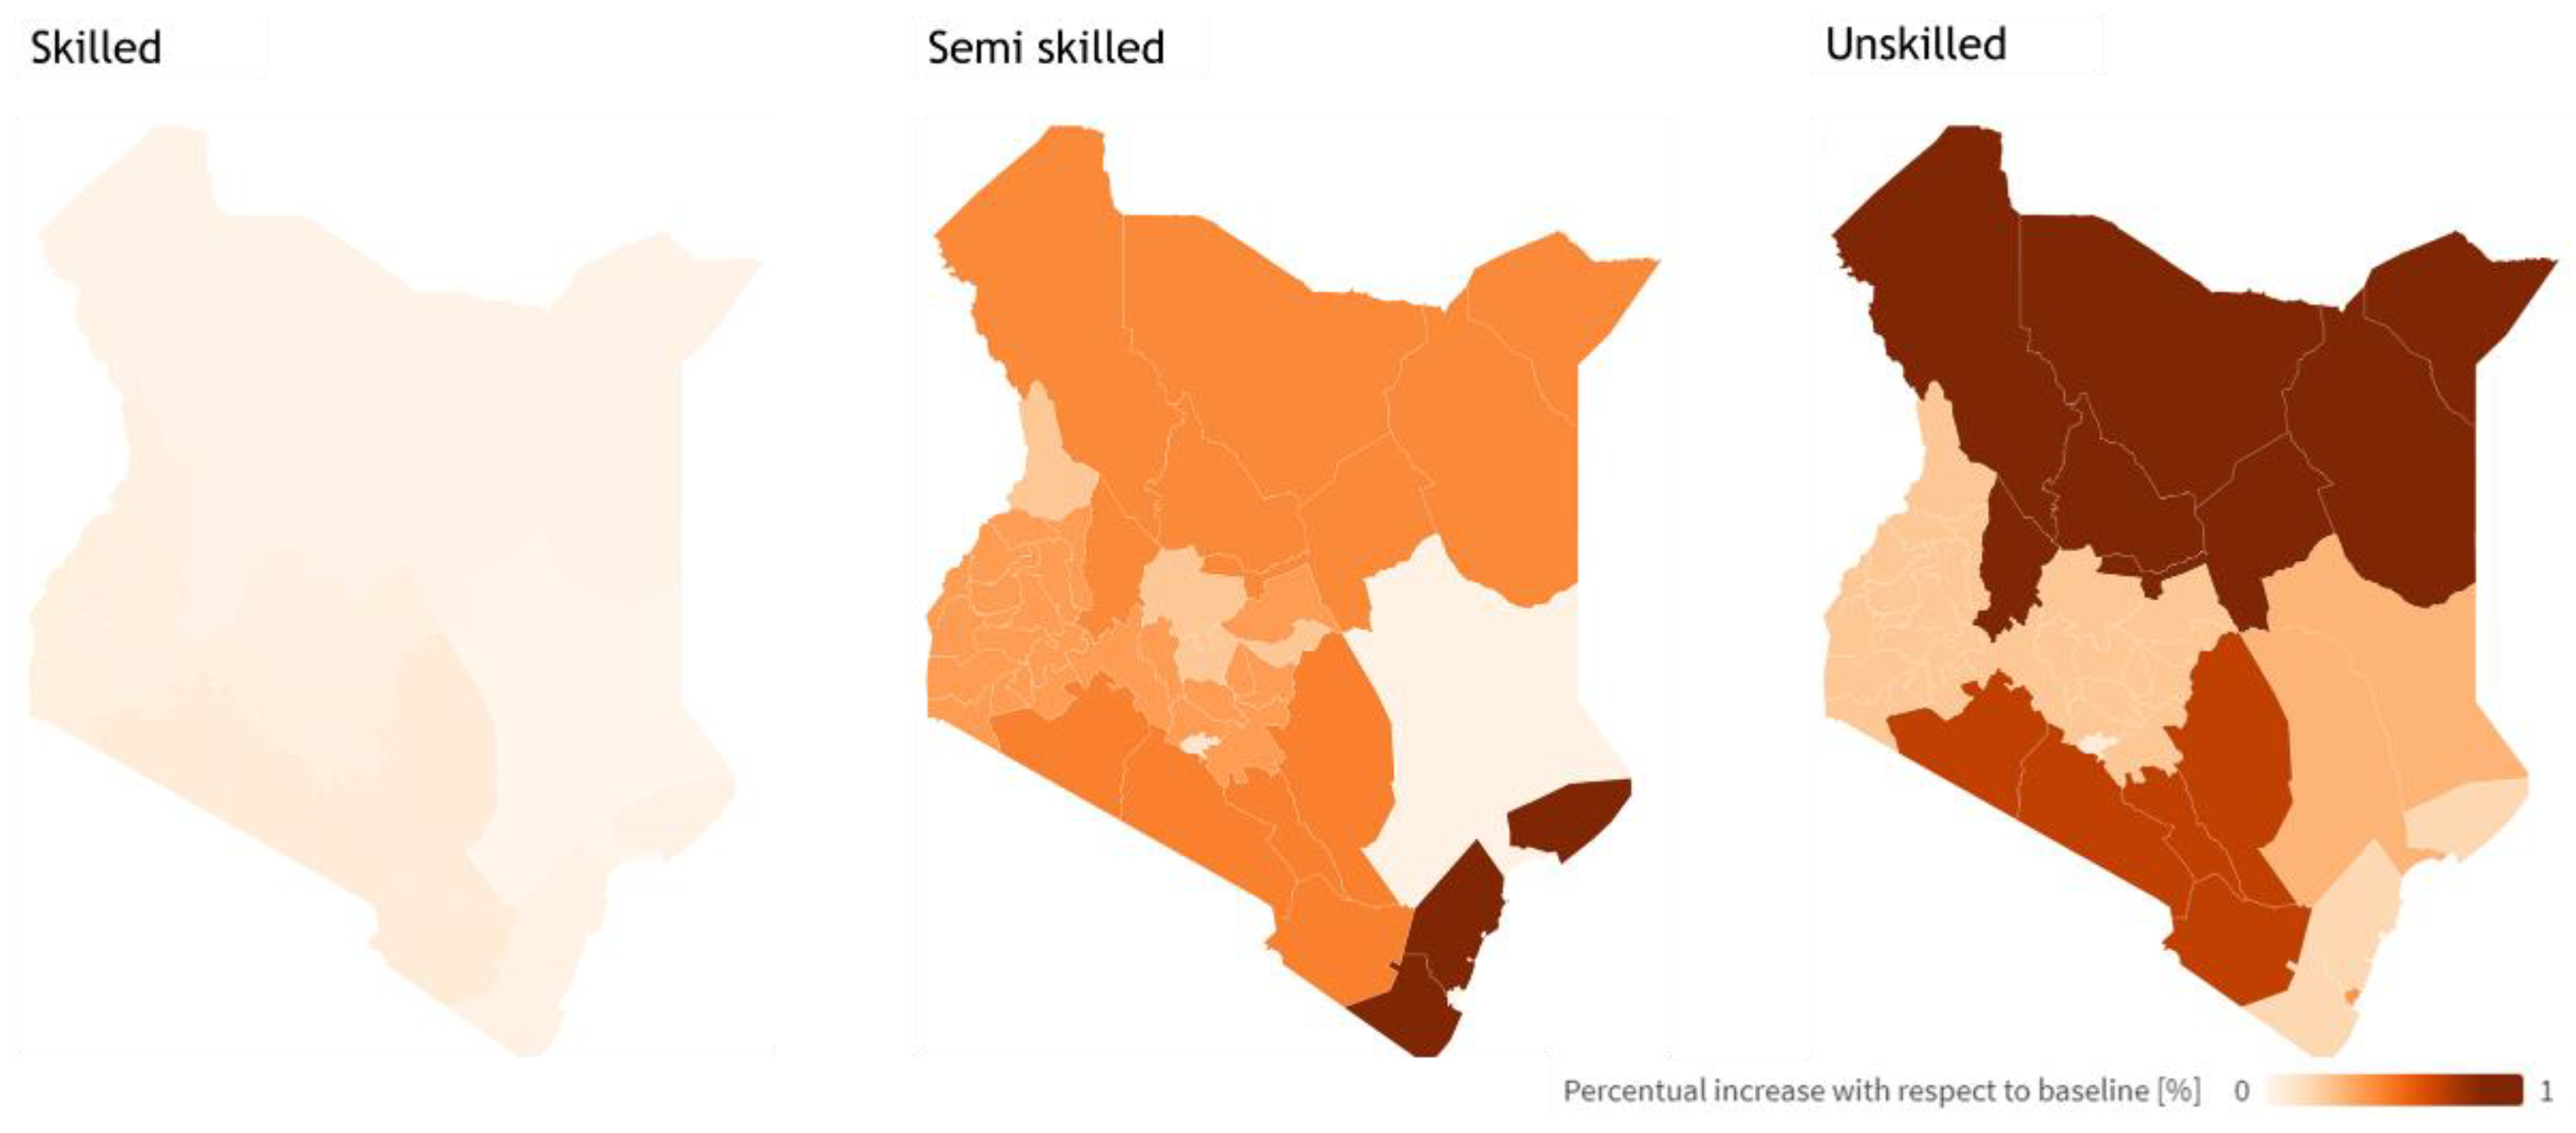
  • Required workforce: It represents the amount of additional labor, by means of required wages expenditure for $9k of investment. In this study, it can be noticed that introducing shading trees leads to the most dominant positive increase in local labor impact. In fact, the sectors associated with the harvesting and maintenance of banana trees are characterized by more labor intensiveness compared to the other interventions. This could have desirable effects in getting close to the objective depicted by SDG 8, introducing positive conditions to enable economic growth and decent jobs.
  • Avoided import: Although being resilient to external shocks can play a role in improving the economic conditions of a country, it is not easy to put into practice when the considered economy is largely dependent on the import of crucial commodities (e.g., petroleum). The biomass intervention in this research permits one to decrease this dependence by the local production of a non-negligible share of imported products. Furthermore, extracting value from coffee waste, which was formerly an unexploited resource, is aligned with SDG 12, ensuring a sustainable production and consumption pattern.
  • Land saving: This indicator is associated with SDG 6, which promotes the sustainable use of terrestrial ecosystems and avoids land degradation. Land-use reduction by installing eco-pulpers is highly dependent on the assumed new productivity, influencing, importantly, the number of new inputs saved per unit of production. On the one hand, eco-pulpers allow for a more resource-efficient conversion of coffee berries into green coffee, reducing waste per unit of output. On the other hand, intercropping makes land use more efficient by exploiting banana–coffee synergies.
  • Emission saving: Carbon emissions are considerably reduced by adopting biomass intervention due to the shift in electricity mix from heavy fuel oil to biomass combustion, which follows the climate action proposed by SDG 13. In fact, the activity of the highly carbon-intense heavy fuel oil is limited by substituting part of the fixed overall electricity production by means of the new—according to modeling assumptions, carbon-neutral—power production technology.
  • Water-saving: This impact is extremely relevant when wet mills are substituted by eco-pulpers, allowing for the sustainable management of water introduced by SDG 6. Eco-pulpers are increasing the overall efficiency of the process (which is also true for the shading trees intervention) and heavily reducing the amount of water required per unit of processed coffee.
  • PROI: Considering shading management intervention, the main economic benefit is associated with the introduction of additional revenue-generation activity, which is the production of bananas coming out of the shading trees. This benefit compensates for the reduction in coffee productivity in cooperatives, leading to a higher Policy Return on Investment compared to the other strategies. On the other hand, the annual return on investment in eco-pulper intervention is mostly due to the savings coming from the direct impact of the increase in the productivity in cooperatives on the economic factors of this sector. Although the adoption of biomass resources does not increase the physical productivity of coffee, the reduction in imports of petroleum and fertilizers due to the intervention leads to an annual saving of around $20m.
More detailed results are represented separately in the Supplementary Information (Supplementary Material S3) of this paper where the reader can refer to the impacts on the activities and also carbon emissions in various sectors alongside the changes in the import of different commodities due to each individual intervention.
For what concerns the Policy Goal application of the framework, a $100 m budget has been set, allowing investments among the selected interventions, but the result may change if environmental objectives are introduced (Table 4).
When no environmental objectives are set, the logic is straightforward: the only limits of the model are represented by physical boundaries, otherwise it would select only the intervention with the highest PRoI. However, since it is not possible to cover with trees more than the coffee plants, the budget is invested also in the second most profitable intervention (i.e., biomass).
The introduction of environmental constraints, in this example in the form of a minimum annual saving with respect to the baseline of circa 70 kton of CO2 and 300 Mm3 per year, slightly modifies the intervention choices. Now, all the biomass potential is exploited in order to reach the carbon reduction objective; similarly, the desired savings of water can be reached only by adding eco-pulpers into the interventions mix. The selected mix of interventions can be performed simultaneously and the combined results of the changes introduced by the new technologies and practices can diverge from the linear behavior assumed for finding the optimal mix.
An example of the combined effect of the intervention is represented by the employment consequences by skill level, driven by the investment of the $100 m budget if allocated as proposed by the Policy Goal mode including environmental objectives.
As shown in Figure 6, investments in the coffee sector trigger labor increases in other sectors all over Kenya, but the main change is associated with the increase in demand for low-skill workers in the north area of the country (see public.flourish.studio/visualisation/3338282/ accessed on 1 April 2022 for the interactive version of the map). It can be inferred that policies that aim at increasing the occupation level in the most vulnerable population share should be driven towards the coffee sector. This is particularly relevant since higher shares of unemployment are among unskilled workers and the northern part of the country is the one with the lowest wealth relative index [53]. Figure 6 shows, in particular, how from the optimal allocation of the $100 m investment, unskilled workers in the northern regions of the country are the category that benefits the most.
Furthermore, the same $100m of investment would not only positively impact the social sphere but would also benefit the economic and environmental dimensions of sustainability.

5. Conclusions

With the aim of providing a policy support system that is scientifically solid, evidence-driven, and able to grasp the complexity related to the Water-Energy-Food Nexus and the systemic nature of the challenges involved within the sustainable development challenge, the CIVICS framework is presented in this study.
CIVICS, the ComprehensIVe and Integrated Country Study, intends to be a tool to support the decision-makers of developing countries by evaluating the impact of the proposed policies and framing them in the bigger picture of SDGs, while ensuring that the desired local outcome is achieved. In this report, some possible applications of CIVICS to different policy options for the coffee sector in Kenya are outlined in order to provide examples of the potential of the approach.
In particular, attention can be drawn to the modularity and customizability of the framework, making it flexible to the context in which it is applied, and suitable for evaluating policies that range from the national or regional level, down to very context-specific local interventions. The model is offering different tools that can be used in synergy or as stand-alone impact evaluation methods accordingly to the needs of the specific context.
In addition to that, it is worth highlighting how an interesting feature is to use CIVICS as a benchmarker between policy interventions, offering the possibility to assign a series of indicators to the proposed policies, in order to evaluate the proposals within a single framework and provide insights based on their relevance with the SDGs, or other technical and socio-economic references. Furthermore, it is possible to exploit an operational research method to identify the optimal mix of interventions under a constrained budget to meet the desired policy outcomes.
In conclusion, some key take-away messages can be derived from the presented approach. In particular, it emerged how the use of an integrated framework is pivotal to achieving the full potential of the adopted models, which gain strength and provide deeper insights when coupled with the others. The double nature of the approach guarantees the achievement of specific local goals, without overlooking international frameworks, such as Agenda 2030, as a global blueprint for inclusive development.
The goal of this work is to propose a novel methodology, reproducible in other contexts and/or geographical areas. The source code and input data are therefore released with an open license for transparency and reproducibility purposes [54]. They are made freely available in the following repository: github.com/SESAM-Polimi/CIVICS-KENYA, accessed on 1 April 2022.

Supplementary Materials

The following supporting information can be downloaded at: https://www.mdpi.com/article/10.3390/en15093071/s1, Supplementary Material S1: Detailed Materials and Methods; Supplementary Material S2: Proposed Interventions in Detail; Supplementary Material S3: Detailed results by interventions; Supplementary Material S4: Supplementary Data.

Author Contributions

Conceptualization, N.G., N.S., M.A.T., F.I., M.V.R. and E.C.; Data curation, N.G., N.S., N.N., M.A.T., L.A.S.H. and B.C.; Formal analysis, N.G., N.S., N.N., M.A.T., L.A.S.H., B.C. and M.V.R.; Investigation, L.A.S.H., B.C. and F.I.; Methodology, N.G., N.S., N.N., M.A.T., L.A.S.H., B.C., M.V.R. and E.C.; Project administration, F.I., M.V.R. and E.C.; Software, N.G., N.S. and M.A.T.; Supervision, M.V.R. and E.C.; Validation, N.G., N.S. and N.N.; Visualization, N.G., N.S. and M.A.T.; Writing—original draft, N.G., N.S., N.N., M.A.T., L.A.S.H., B.C. and F.I.; Writing—review & editing, N.G., N.S., F.I., M.V.R. and E.C. All authors have read and agreed to the published version of the manuscript.

Funding

This research received no external funding.

Institutional Review Board Statement

Not applicable.

Informed Consent Statement

Not applicable.

Data Availability Statement

The source code and input data are made available in the following repository: https://github.com/FEEM-Africa-REP/CIVICS_Kenya, accessed on 1 April 2022.

Acknowledgments

The authors thank Fondazione Eni Enrico Mattei and Politecnico di Milano for supporting the research.

Conflicts of Interest

The authors declare no conflict of interest.

References

  1. UN. Transforming Our World: The 2030 Agenda for Sustainable Development; United Nations: New York, NY, USA, 2015. [Google Scholar]
  2. Nwanze, K.F. Smallholders Can Feed the World; IFAD: Rome, Italy, 2017. [Google Scholar]
  3. Ritchie, H.; Roser, M. Environmental Impacts of Food Production. Available online: https://ourworldindata.org/environmental-impacts-of-food (accessed on 1 April 2022).
  4. Welsch, M.; Hermann, S.; Howells, M.; Rogner, H.H.; Young, C.; Ramma, I.; Bazilian, M.; Fischer, G.; Alfstad, T.; Gielen, D.; et al. Adding Value with CLEWS—Modelling the Energy System and Its Interdependencies for Mauritius. Appl. Energy 2014, 113, 1434–1445. [Google Scholar] [CrossRef]
  5. Sridharan, V.; Ramos, E.P.; Zepeda, E.; Boehlert, B.; Shivakumar, A.; Taliotis, C.; Howells, M. The Impact of Climate Change on Crop Production in Uganda-An Integrated Systems Assessment with Water and Energy Implications. Water 2019, 11, 1805. [Google Scholar] [CrossRef] [Green Version]
  6. Bazilian, M.; Rogner, H.; Howells, M.; Hermann, S.; Arent, D.; Gielen, D.; Steduto, P.; Mueller, A.; Komor, P.; Tol, R.S.J.; et al. Considering the Energy, Water and Food Nexus: Towards an Integrated Modelling Approach. Energy Policy 2011, 39, 7896–7906. [Google Scholar] [CrossRef]
  7. Sridharan, V.; Broad, O.; Shivakumar, A.; Howells, M.; Boehlert, B.; Groves, D.G.; Rogner, H.H.; Taliotis, C.; Neumann, J.E.; Strzepek, K.M.; et al. Resilience of the Eastern African Electricity Sector to Climate Driven Changes in Hydropower Generation. Nat. Commun. 2019, 10, 1–9. [Google Scholar] [CrossRef] [Green Version]
  8. Wang, C.; Malik, A.; Wang, Y.; Chang, Y.; Lenzen, M.; Zhou, D.; Pang, M.; Huang, Q. The Social, Economic, and Environmental Implications of Biomass Ethanol Production in China: A Multi-Regional Input-Output-Based Hybrid LCA Model. J. Clean. Prod. 2020, 249, 119326. [Google Scholar] [CrossRef]
  9. Palma-Rojas, S.; Caldeira-Pires, A.; Nogueira, J.M. Environmental and Economic Hybrid Life Cycle Assessment of Bagasse-Derived Ethanol Produced in Brazil. Int. J. Life Cycle Assess. 2017, 22, 317–327. [Google Scholar] [CrossRef]
  10. Tanimonure, V.A.; Naziri, D. Impact of Climate Adaptation Strategies on the Net Farm Revenue of Underutilised Indigenous Vegetables’ (UIVs) Production in Southwest Nigeria. Resour. Environ. Sustain. 2021, 5, 100029. [Google Scholar] [CrossRef]
  11. Mungai, E.M.; Ndiritu, S.W.; Da Silva, I. Unlocking Climate Finance Potential and Policy Barriers—A Case of Renewable Energy and Energy Efficiency in Sub-Saharan Africa. Resour. Environ. Sustain. 2022, 7, 100043. [Google Scholar] [CrossRef]
  12. Mainar-Causapé, A.J.; Boulanger, P.; Dudu, H.; Ferrari, E. Policy Impact Assessment in Developing Countries Using Social Accounting Matrices: The Kenya SAM 2014. Rev. Dev. Econ. 2020, 24, 1128–1149. [Google Scholar] [CrossRef]
  13. Adil Suliman Hussain, L.; Inzoli, F.; Golinucci, N.; Stevanato, N.; Rocco, M.V.; Colombo, E. Supply Chain Analysis with Focus on Africa FEEM’s Methodological Approach; Milan, Italy, 2020. Available online: https://papers.ssrn.com/sol3/papers.cfm?abstract_id=3733685 (accessed on 1 April 2022).
  14. Galal, N.M.; Moneim, A.F.A. Developing Sustainable Supply Chains in Developing Countries. Procedia CIRP 2016, 48, 419–424. [Google Scholar] [CrossRef] [Green Version]
  15. Suh, S. Handbook of Input-Output Economics in Industrial Ecology; Springer: Berlin/Heidelberg, Germany, 2009; ISBN 9781402040832. Available online: https://link.springer.com/book/10.1007/978-1-4020-5737-3 (accessed on 1 April 2022).
  16. Miller, R.E.; Blair, P.D. Input-Output Analysis: Foundations and Extensions; Cambridge University Press: Cambridge, UK, 2009; ISBN 1139477595. [Google Scholar]
  17. Lenzen, M.; Rueda-Cantuche, J.M. A Note on the Use of Supply-Use Tables in Impact Analyses. Sort 2012, 36, 139–152. [Google Scholar]
  18. Södersten, C.J.H.; Lenzen, M. A Supply-Use Approach to Capital Endogenization in Input–Output Analysis. Econ. Syst. Res. 2020, 32, 451–475. [Google Scholar] [CrossRef]
  19. Tahavori, M.A.; Rinaldi, L.; Golinucci, N. SESAM-Polimi/MARIO: MARIO v0.1.0. 2022. Available online: https://zenodo.org/record/5879383#.YmIAptNBxPY (accessed on 1 April 2022).
  20. Pfenninger, S.; Pickering, B. Calliope: A Multi-Scale Energy Systems Modelling Framework. J. Open Source Softw. 2018, 3, 825. [Google Scholar] [CrossRef] [Green Version]
  21. Pfenninger, S.; Keirstead, J. Renewables, Nuclear, or Fossil Fuels? Scenarios for Great Britain’s Power System Considering Costs, Emissions and Energy Security. Appl. Energy 2015, 152, 83–93. [Google Scholar] [CrossRef] [Green Version]
  22. Shenoy, M. Industrial Ecology in Developing Countries; Springer: Cham, Switzerland, 2015; ISBN 9783319205717. [Google Scholar]
  23. Arzoumanidis, I.; D’Eusanio, M.; Raggi, A.; Petti, L. Functional Unit Definition Criteria in Life Cycle Assessment and Social Life Cycle Assessment: A Discussion. In Perspectives on Social LCA: Contributions from the 6th International Conference; Traverso, M., Petti, L., Zamagni, A., Eds.; Springer International Publishing: Cham, Switzerland, 2020; pp. 1–10. ISBN 978-3-030-01508-4. [Google Scholar]
  24. Boulanger, P.; Dudu, H.; Ferrari, E.; Causapé, A.J.M.; Balié, J.; Battaglia, L. Policy Options to Support the Agriculture Sector Growth and Transformation Strategy in Kenya; Joint Research Centre: Petten, The Netherlands, 2018; ISBN 9789279859496. [Google Scholar]
  25. Government of the Republic of Kenya. The Kenya Vision 2030, The Popular Version. 2007. Available online: https://vision2030.go.ke/publication/kenya-vision-2030-popular-version/ (accessed on 1 April 2022).
  26. Kenya Institute for Public Policy Research and Analysis. Kenya Economic Report 2019: Resource Mobilization for Sustainable. 2019. Available online: https://repository.kippra.or.ke/handle/123456789/2098 (accessed on 1 April 2022).
  27. World Bank Group. Kenya Economic Update: Unbundling the Slack in Private Sector Investment—Transforming Agriculture Sector Productivity and Linkages to Poverty Reduction. 2019, pp. 1–86. Available online: https://openknowledge.worldbank.org/handle/10986/31515 (accessed on 1 April 2022).
  28. International Coffee Organization. Country Coffee Profile Kenya. 2019. Available online: https://www.ico.org/documents/cy2018-19/icc-124-7e-profile-kenya.pdf (accessed on 1 April 2022).
  29. Thuku, G.K.; Gachanja, P.; Almadi, O. Effects of Reforms on Productivity of Coffee in Kenya. Int. J. Bus. Soc. Sci. 2013, 4, 196–213. [Google Scholar]
  30. Damianopoulos, R.A. Market Adaptability, Industrial Divergence, and the Politics of Liberalization in the Kenyan and Ugandan Coffee Industries; Queen’s University: Kingston, ON, Canada, 2005. [Google Scholar]
  31. Kenya Coffee Platform. Coffee Economic Viability Study. 2018. Available online: https://www.globalcoffeeplatform.org/wp-content/uploads/2021/03/Kenya-Coffee-Platform-Coffee-Economic-Viability-Study-Report-F.pdf (accessed on 1 April 2022).
  32. UNCTAD Commodoities at a Glance, Special Issue on Coffee in East Africa. United Nations Conference on Trade and Development. 2018. Available online: https://unctad.org/system/files/official-document/ditccom2018d1_en.pdf (accessed on 1 April 2022).
  33. Causapé, A.J.M.; Boulanger, P.; Dudu, H.; Ferrari, E.; Mcdonald, S. Social Accounting Matrix of Kenya. 2014. Available online: http://data.europa.eu/89h/bc924665-e888-4642-9b3b-297f4f6b13d3 (accessed on 1 April 2022).
  34. Lenzen, M.; Moran, D.; Kanemoto, K.; Geschke, A. Building Eora: A Global Multi-Region Input-Output Database at High Country and Sector Resolution. Econ. Syst. Res. 2013, 25, 20–49. [Google Scholar] [CrossRef]
  35. FAO. Agroforestry Coffee Cultivation in Combination with Mulching, Trenches and Organic Composting in Uganda. 2017. Available online: https://www.fao.org/3/ca3728en/ca3728en.pdf (accessed on 1 April 2022).
  36. van Asten, P.; Ochola, D.; Wairegi, L.; Nibasumba, A.; Jassogne, L.; Mukasa, D. Coffee-Banana Intercropping Implementation Guidance for Policymakers and Investors; FAO: Rome, Italy, 2015; p. 10. [Google Scholar]
  37. Rahn, E.; Vaast, P.; Läderach, P.; van Asten, P.; Jassogne, L.; Ghazoul, J. Exploring Adaptation Strategies of Coffee Production to Climate Change Using a Process-Based Model. Ecol. Model. 2018, 371, 76–89. [Google Scholar] [CrossRef]
  38. Shading Plant Cost. Available online: https://perfectdailygrind.com/2015/06/how-much-does-it-cost-a-farmer-to-plant-a-basic-plot/ (accessed on 1 April 2022).
  39. Wairegi, L.; Van Asten, P.; Giller, K.; Fairhurst, T. Banana-Coffee System Cropping Guide; CAB International: Wallingford, UK, 2014; ISBN 9781780644929. [Google Scholar]
  40. Jezeer, R.E.; Santos, M.J.; Boot, R.G.A.; Junginger, M.; Verweij, P.A. Effects of Shade and Input Management on Economic Performance of Small-Scale Peruvian Coffee Systems. Agric. Syst. 2018, 162, 179–190. [Google Scholar] [CrossRef]
  41. CAL—Coffee Machinery—Mini Eco Pulper. Available online: https://www.cal-ea.com/ (accessed on 1 April 2022).
  42. Alibaba.com Eco Mini Pulper Cost. Available online: https://www.alibaba.com/product-detail/Mini-Eco-Pulper-for-coffee_135021838.html (accessed on 23 September 2020).
  43. Combustion of Fuels—Carbon Dioxide Emission. Available online: https://www.engineeringtoolbox.com/co2-emission-fuels-d_1085.html (accessed on 1 April 2022).
  44. Murthy, P.S.; Madhava Naidu, M. Sustainable Management of Coffee Industry By-Products and Value Addition—A Review. Resour. Conserv. Recycl. 2012, 66, 45–58. [Google Scholar] [CrossRef]
  45. Ulsido, M.D.; Li, M. Solid Waste Management Practices in Wet Coffee Processing Industries of Gidabo Watershed, Ethiopia. Waste Manag. Res. 2016, 34, 638–645. [Google Scholar] [CrossRef]
  46. Mwangi, R.W.; Mwenda, L.K.M.; Wachira, A.W.; Mburu, D.K. Effect of Final Processing Practices Carried out by the Coffee Cooperative Societies on the Sustainability of the Coffee Industry in Kenya. Eur. J. Bus. Strateg. Manag. 2017, 2, 60–75. [Google Scholar]
  47. Surendra, K.C.; Takara, D.; Hashimoto, A.G.; Khanal, S.K. Biogas as a Sustainable Energy Source for Developing Countries: Opportunities and Challenges. Renew. Sustain. Energy Rev. 2014, 31, 846–859. [Google Scholar] [CrossRef]
  48. Sogn, T.A.; Dragicevic, I.; Linjordet, R.; Krogstad, T.; Eijsink, V.G.H.; Eich-Greatorex, S. Recycling of Biogas Digestates in Plant Production: NPK Fertilizer Value and Risk of Leaching. Int. J. Recycl. Org. Waste Agric. 2018, 7, 49–58. [Google Scholar] [CrossRef] [Green Version]
  49. Battista, F.; Frison, N.; Bolzonella, D. Energy and Nutrients’ Recovery in Anaerobic Digestion of Agricultural Biomass: An Italian Perspective for Future Applications. Energies 2019, 12, 3287. [Google Scholar] [CrossRef] [Green Version]
  50. Balié, J.; Battaglia, L.; Boulanger, P.; Dudu, H.; Ferrari, E.; Mainar Causapé, A.J. Returns to Investments in Fertilizers Production in Kenya. In An Analysis in Support of the New “Agriculture Sector Growth and Transformation Strategy”; Food and Agriculture Organization of the United Nations (FAO) and Joint Research C: Rome, Italy, 2019. [Google Scholar]
  51. Salaries by Positions—Kenya.Paylab.Com. Available online: https://kenya.paylab.com/ (accessed on 1 April 2022).
  52. Gathuo, B.; Rantala, P.; Maatta, R. Coffee Industry Wastes. Water Sci. Technol. 1991, 24, 53–60. [Google Scholar] [CrossRef]
  53. Chi, G.; Fang, H.; Chatterjee, S.; Blumenstock, J.E. Microestimates of Wealth for All Low- and Middle-Income Countries. Proc. Natl. Acad. Sci. USA 2022, 119, e2113658119. [Google Scholar] [CrossRef]
  54. Pfenninger, S.; DeCarolis, J.; Hirth, L.; Quoilin, S.; Staffell, I. The Importance of Open Data and Software: Is Energy Research Lagging Behind? Energy Policy 2017, 101, 211–215. [Google Scholar] [CrossRef]
Figure 1. SCA methodological steps. Source: [13].
Energies 15 03071 g001
Figure 2. CIVICS Integrated Modeling Framework.
Energies 15 03071 g002
Figure 3. Structure of the SUT input–output model adopted in this research.
Energies 15 03071 g003
Figure 4. Structure of the “exploiting biomass” proposed implementation.
Energies 15 03071 g004
Figure 5. Comparison between performance indicators representing the net yearly gain from every intervention assuming the same level of investment (i.e., KES 1 million corresponding to nearly $9k) in average scenarios (bar height). The end of the scale corresponds to the highest value among the considered options within the sensitivity cases (error bars), while PRoI is expressed as defined in Equation (3) using KES 1 million as the denominator. MCM stands for million cubic meters.
Energies 15 03071 g005
Figure 6. Labor demand induced by all the $100m mix of interventions by skill level and region.
Energies 15 03071 g006
Table 2. Input parameters eco-pulpers intervention.
DescriptionValueUnit of MeasureReferences
Cost of eco-pulping machine1430$[41,42]
Cost of delivery46$Estimation: a 10% cost over purchasing was assumed.
Required power1.1kW[41,42]
Capacity of the machine0.5tons of coffee/h[41,42]
Efficiency of the machine30%[41,42]
Decrease in water footprint85%[41,42]
Number of smallholders to be covered by each machine300–600Smallholder/machineEstimation: based on coffee fields productivity, proximity, and machinery capacity.
Productivity increase0–2.5%Estimation: assumed on the basis of field interviews and expert judgments.
Carbon intensity of the eco-pulpers electricity consumption0.27kgCO2/kWh[43]
Useful life of the eco-pulpers10yearsEstimation: based on similar machinery’s expected life.
Table 4. Optimization choices when running the model with only budget and physical constraints and when adding environmental objectives. The first percentage represents the budget allocation while the second compares the amount invested with the maximum possible level of investment.
Without Env. ObjectivesWith Env. Objectives
Eco-pulpers0%, 0%1%, 34%
Shading Trees63%, 100%50%, 79%
Biomass37%, 73%49%, 98%
Publisher’s Note: MDPI stays neutral with regard to jurisdictional claims in published maps and institutional affiliations.

