Article

Energy System Development Scenarios: Case of Poland

by
Radoslaw Wisniewski
1,*,
Piotr Daniluk
2,
Tomasz Kownacki
1 and
Aneta Nowakowska-Krystman
3
1
Faculty of Political Science and International Studies, University of Economics and Human Sciences in Warsaw, 01-043 Warsaw, Poland
2
Faculty of Security Sciences, General Tadeusz Kosciuszko Military University of Land Forces, 51-147 Wroclaw, Poland
3
Management and Command Faculty, War Studies University, 00-910 Warsaw, Poland
*
Author to whom correspondence should be addressed.
Energies 2022, 15(8), 2962; https://doi.org/10.3390/en15082962
Submission received: 22 March 2022 / Revised: 12 April 2022 / Accepted: 14 April 2022 / Published: 18 April 2022
(This article belongs to the Special Issue Green Energy Economies)

Abstract

:
Europe’s ambition to be the first climate-neutral continent and to achieve net-zero greenhouse gas emissions by 2050 will result in changes to the energy systems of many countries. This overlaps with the principles of circular economy, energy independence, and the continuity of operations enshrined in many national and regional documents. From the above, a scenario based on renewable resources emerges. However, in a country such as Poland, with conventional energy sources and large state participation in the sector, is this feasible? The authors assumed that the urgent need for a turbulence-sensitive analysis of energy sector changes can be met by using a new view, defined by the authors as a matrix of four oceans scenarios. Black, Grey, Red and Green scenarios are determined by the proportion of the state and the local-community sector. Then, assuming the possibility of introducing two of them by 2050—Green (radical) and Red (competitive)—empirical research was carried out on a purposively selected group of experts. The business model of the sector was analyzed in terms of six links that create economic and social value: energy sources, energy producers, transmission networks with infrastructure, energy storage, energy system management and energy consumers. According to experts, development of business model links will be based on the Red scenario. Thus, we get a picture of a model that should be considered by politicians, scientists, as well as a wide audience that absorbs the effects of environmental pollution.

1. Introduction

Climate change requires a reduction in CO2 emissions. This entails the need to change the management of energy resources [1] (pp. 135–136), including the need to integrate distributed energy generation sources, modernize infrastructure and ensure social prosperity—these are the challenges facing the energy industry as the new energy reality of the European Green Deal unfolds [2]. The fundamental problems of the energy sector in Poland involve the lack of production capacity (on a large scale) of traditional energy sources, dependence on energy produced from non-renewable sources (fossil fuels), and uncertain access to resources. However, this is not a single-country problem [3]. These considerations pose fundamental challenges both in the area of energy production itself (energy sources) and in the transformation of the entire energy system [4,5] (pp. 6–8). In this context, Poland’s current energy independence [6], understood as self-sufficiency, is not possible. However, is it achievable by 2050, the cut-off year for achieving the European Union’s (EU) climate neutrality?
The initial premises for creating a new energy system in Poland are [7]:
  • The need to fully transition to renewable energy sources by 2050—100% of energy production must come from renewable sources, reaching the milestone of zero-carbon energy production;
  • A constant increase in demand for electricity in the individual and collective supply sector—continuous development of energy sources and expansion of the distribution network;
  • Economic and industry requirements;
  • Efficient energy distribution—minimizing the losses between energy sources and end users;
  • The need to incorporate and integrate an increasing number of distributed energy sources into the energy system;
  • The need to create energy storage facilities closest to the end user and their integration into the power system;
  • Energy security of the region, citizens, and businesses;
  • Social and environmental awareness of citizens.
Taking into account the indicated premises, the authors undertook activities mainly to develop and test the possibility of implementing scenarios of the Polish energy system development in the 2050 perspective. It was assumed that out of four scenarios generated, testing two is the most reasonable way to achieve the assumed EU climate policy objectives in Poland. For the purposes of this study, the scenario method was used. It represents a qualitative approach to studying phenomena in the distant future, i.e., the year 2050. It was based on the assumption that the quantitative approach understood as forecasting used in building the energy system business model, which was subject to expert evaluation, is too unreliable for distant time perspectives.
The main objective was carried out from the angle of specific objectives:
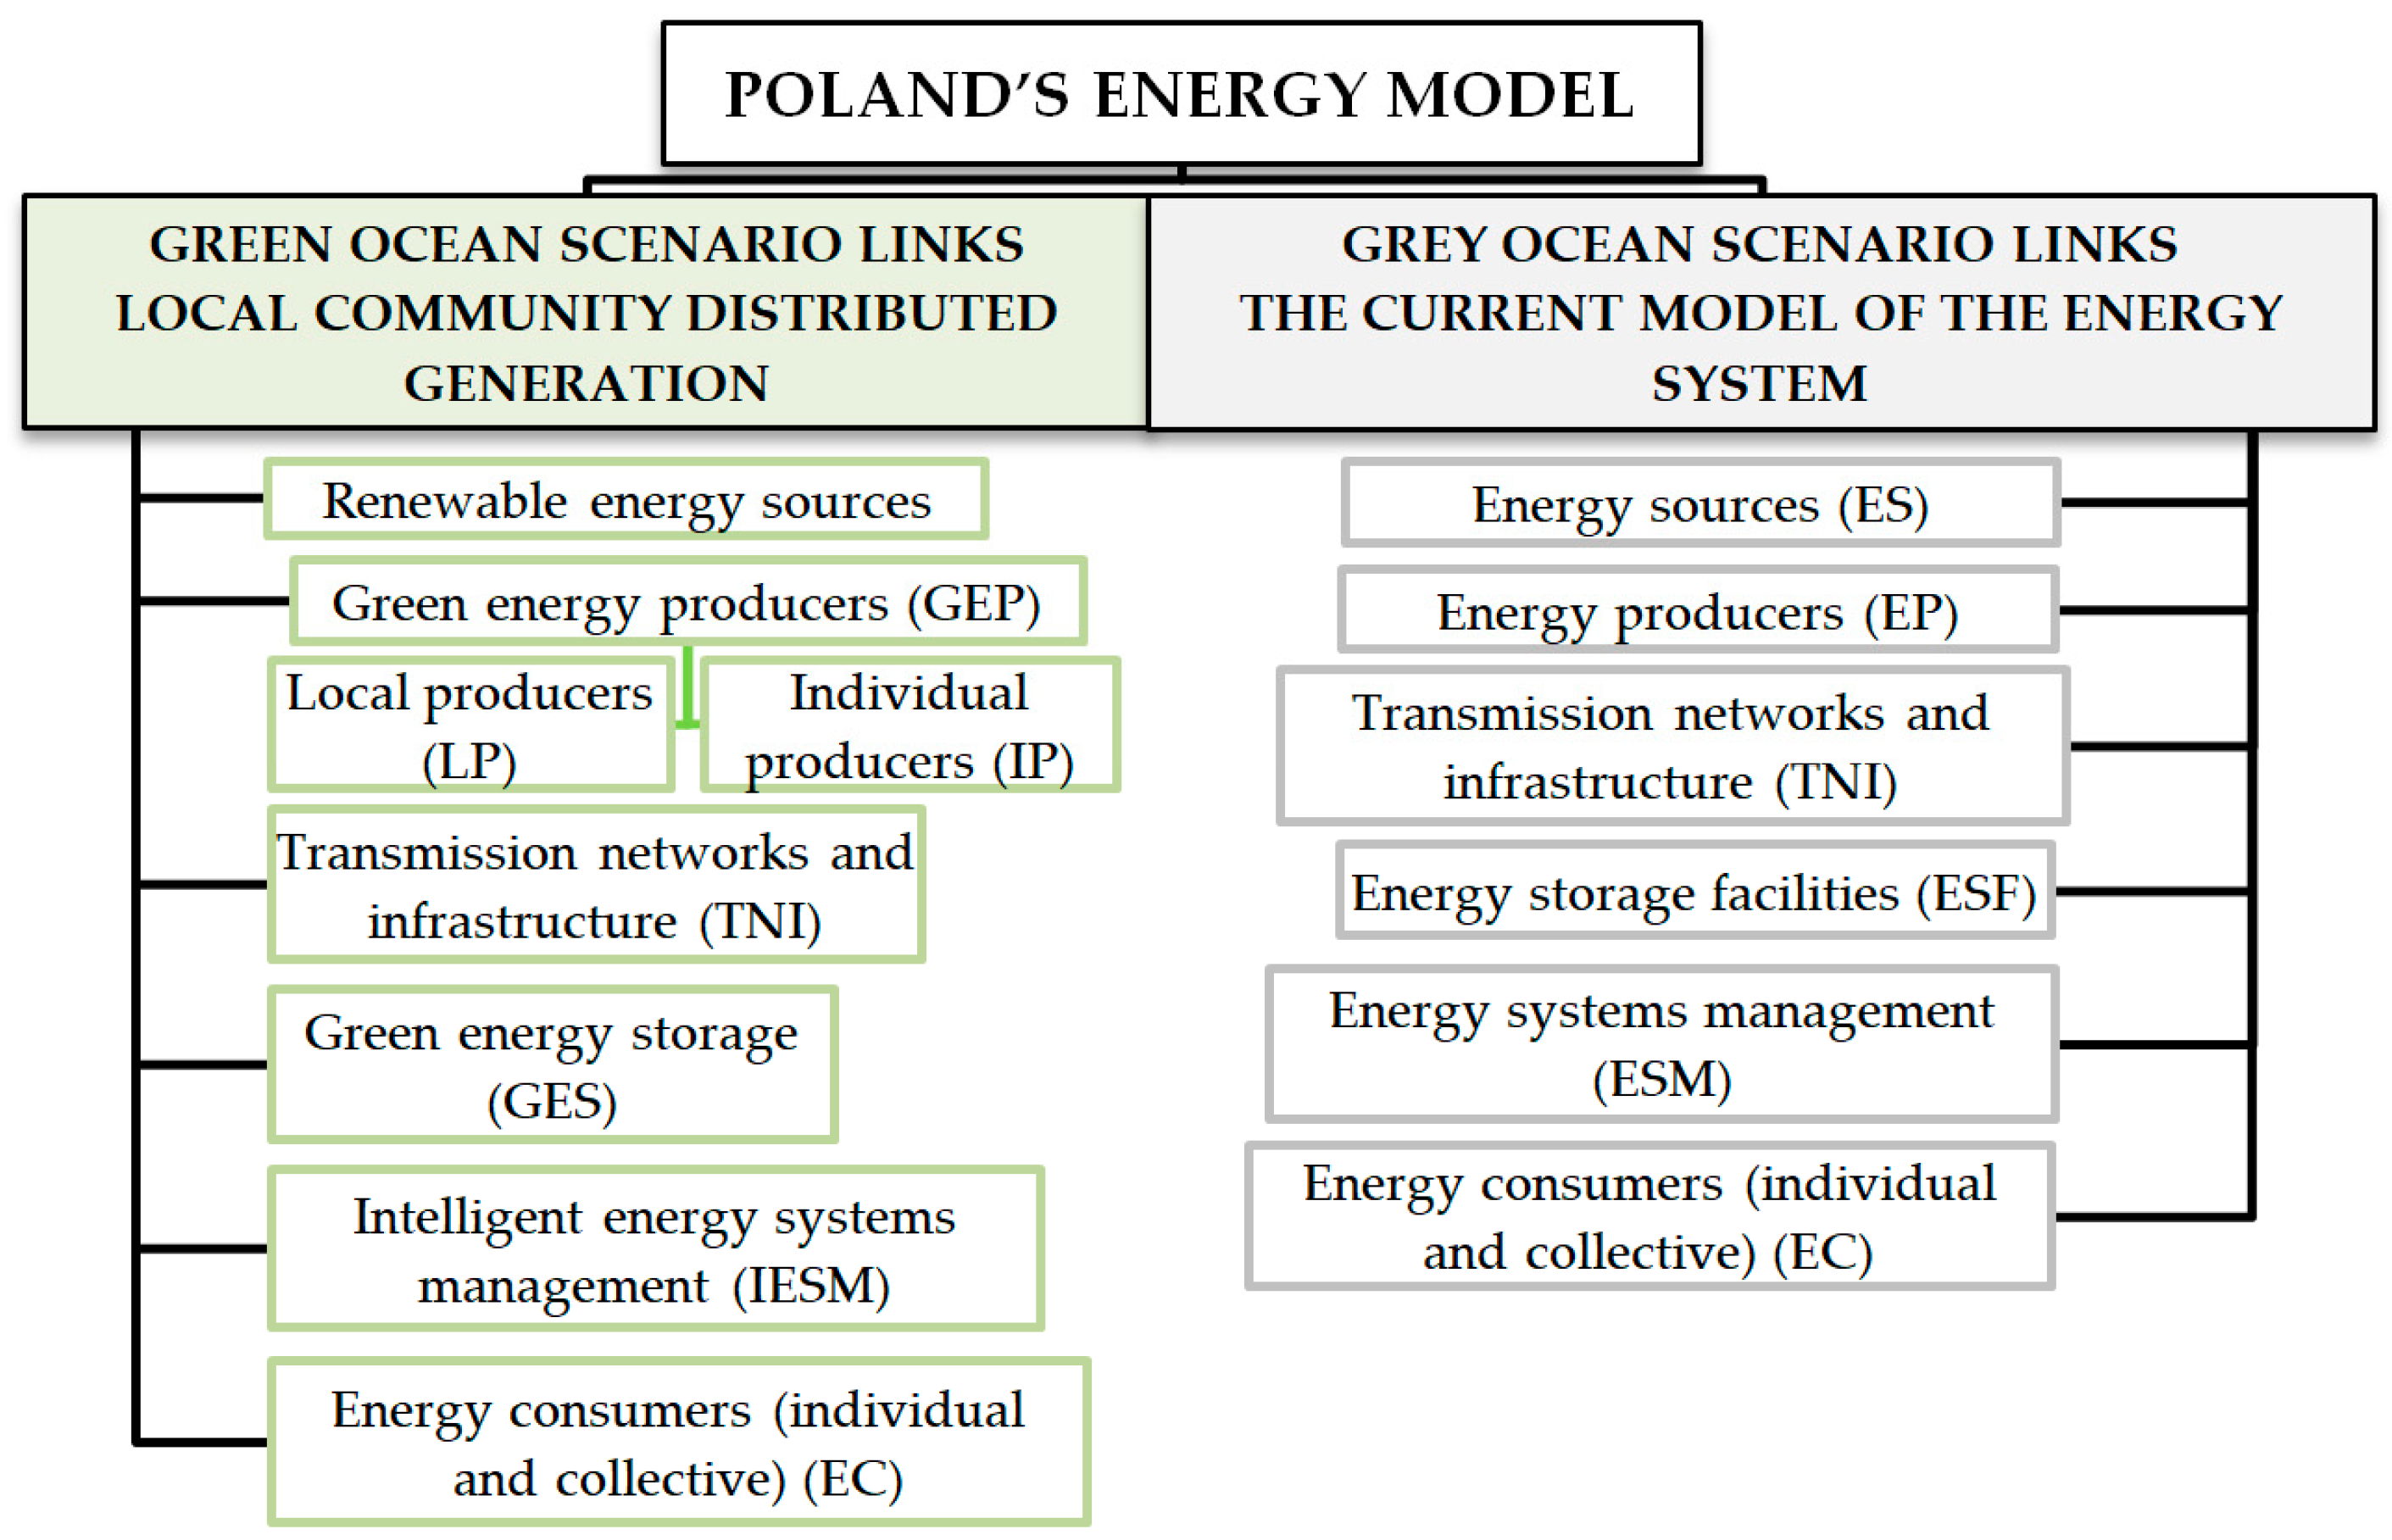
  • Building a new approach to energy system development (ES) scenarios—Black, Grey, Red, and Green Oceans—called the four oceans scenario matrix. The scenarios were defined as the Blue and Red Ocean strategies [8]. They were generated taking into account two variables: state participation and local-community (dispersed) participation in ES. Due to Poland’s energy development policy, it was determined that the Red Ocean scenario has the highest probability of being realized. However, due to the implementation of climate goals, the Green scenario is preferred. As the Black and Grey scenarios do not allow for implementation of a CO2 reduction policy, they were not tested:
    Verifying the feasibility of the Red Ocean scenario, Scenario A, which assumes that PES links will be transformed towards distributed energy development and the state’s participation will be gradually and proportionally reduced but it will remain an important player in the Polish energy sector after 2050;
    Verifying the feasibility of the Green Ocean scenario, Scenario B, where system links will be created exclusively for the development of distributed generation introduced rapidly in place of PES value chain links; the scenario assumes departing from conventional energy sources—they will not, however, make up Poland’s energy balance by 2050.
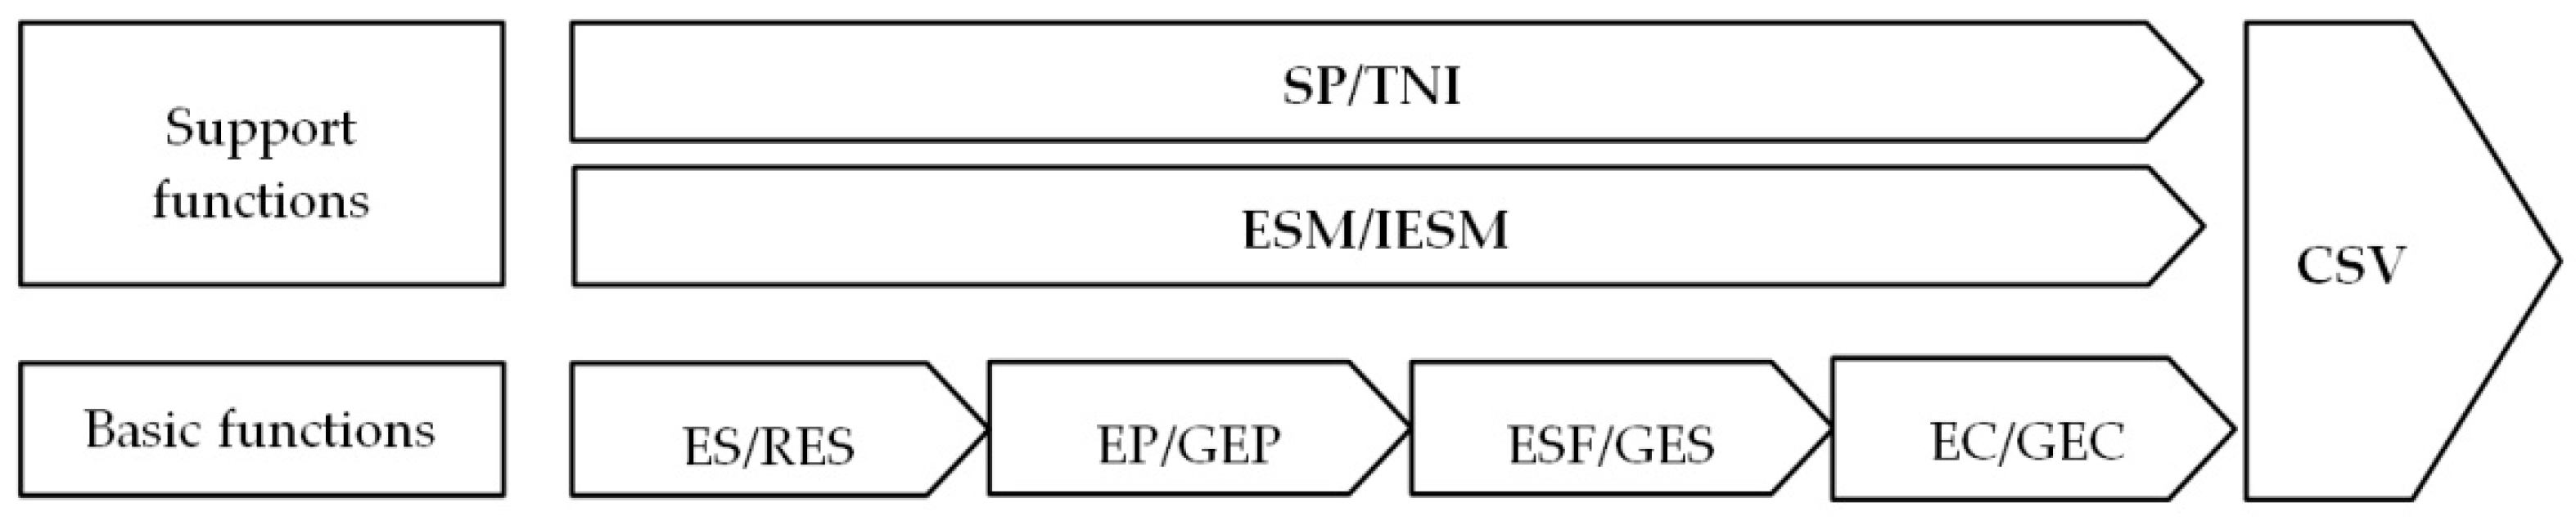
  • To develop the Polish energy system (PES) as a business model consisting of six energy system links creating shared economic and social value (CSV) [9,10]:
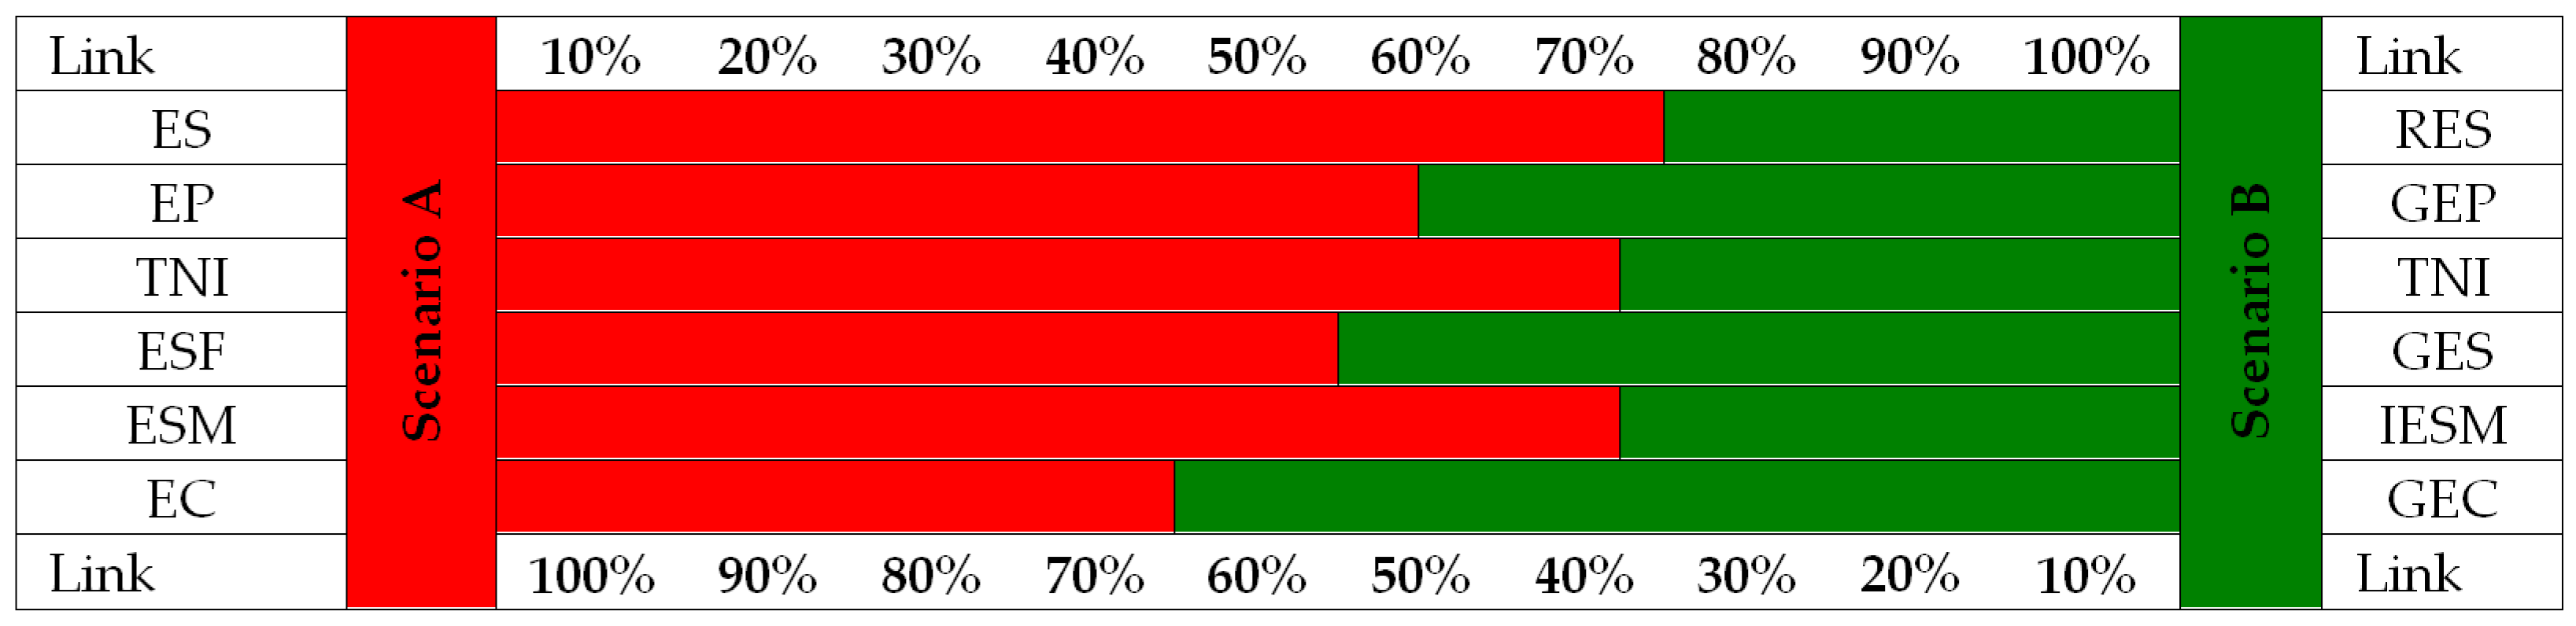
    The PES value chain was assumed to be the core business links: energy sources (ES), energy producers (EP), energy storage facility (ESF), energy consumers (EC) and its green counterparts: renewable energy sources (RES), green energy producers (GEP), green energy storage (GES), and green energy consumers (GEC). They form the main sequence of the process of implementing CSV.
    Links: transmission networks with infrastructure (TNI), energy systems management (ESM), and in the new TNI model—integrated transmission networks with infrastructure; intelligent energy systems management (IESM) is classified as supporting the implementation of the main process (Figure 1).
An expert opinion survey was used to determine the development of the links identified in the model and thus to verify the feasibility of the generated scenarios of PES development. The purposively selected group of experts came from four backgrounds [11,12]:
  • Government administration (Ministry of Climate, Ministry of State Assets, Energy Regulatory Office), which creates energy, climate, and resource management policies in Poland (the questionnaire was addressed to functionaries);
  • Scientists and professors from various academic circles from all over Poland specializing in energy market issues and with achievements in this field;
  • Energy market entities (executive representatives from ES, EP, ESF, EC, SP, and ESM);
  • Green energy market actors (RES, EP, and ESF).
Each group was represented by seven people.
The empirical research conducted therefore captures a broad analytical context due to the selection of the expert group. This allows us to capture both an outside-in and inside-out perspective.
This study used a standardized questionnaire consisting of 18 questions, three relating to each of the six PES links: ES, EP, TNI, ESM, ESF, EC/RES, GEP, GES, GEC, TNI, and IESM. In the first type of questions, experts were asked to evaluate the scenarios A and B for analyzed links. In the second stage of the process, respondents were asked to identify only one scenario: A or B. Then (the third type of question), they were asked to rate the probability of the scenario indicated in question two occurring for a given link.
The survey was conducted using computer assisted web interviews (CAWI) [13] (pp. 368–380), [14], in October/November 2021.
The selected experts received an e-mail request for a response with a link to the online survey. The survey form was prepared in the MS FORM system in Polish. The completed questionnaire was processed anonymously with the use of tools implemented in the MS FORMS system. Automatic algorithms generating results were used. In the next step, an in-depth analysis of the data was performed, using generally available MS EXCEL tools. Based on the analysis performed, the results were prepared and presented in tables and figures.
The current study utilizes the scenario approach, which is widely used to forecast changes in the distant future (15–30 years). (Classic examples of this approach are presented by H. Kahn [15] and A.J. Weiner [16], and modern examples by Global Trends 2040 [17].) It was modeled on an approach successfully used in several editions of research conducted by the National Intelligence Council (NIC), which were published as Global Trends [17,18]. There is also PES-related research of this type, however, in terms of scenario planning (analyzing the effects of the implementation of the selected options as well as indicating the process of selecting the scenarios themselves) [2,19]. Development scenarios are the result of many variables, including turbulence, speed of global, regional, and national processes resulting from the areas of PEST analysis [20] (pp. 76–101), or stakeholder activity, and should therefore not be treated as rigid planning, but emerging, spontaneous processes [21].
The presented approach allows for multiplying the research on possible variants of energy system scenarios in other countries, enabling comparative research for broader analyses—for example, regional. It is useful not only to scientists conducting national research but also to supranational institutions. The above methodology can be used to formulate conclusions for a more rational energy policy, including, above all, decision making based on science, when conducting research on a large scale.

2. Theoretical Approach

2.1. Scenarios Planning

The first use of the term scenario in relation to the ways of capturing the future was by H. Kahn, who distinguished forecasting from forming depictions of the future [22] (pp. 13, 14). Today, the scenario approach is extremely useful, especially in management research [23] (pp. 21–41). The scenario approach allows planning in increasingly uncertain times, since it takes into account both the multivariate nature of the environment and strategy [24] (p. 16). This corresponds to the requirements of contemporary concepts for not only prediction but also anticipation of the future. The scenario approach can be described as the possessed or developed ability to build multiple and possible concepts of the future based on plots, storylines, and narratives. It is not a quantitative forecast, although it may support such forecasting. Rather, it is a way of capturing dynamic and complex depictions of the future [23] (pp. 19–21).
The scenario approach stems not only from the long period of its popularity since the end of the Second World War but mainly from the wide range of its applications. These include security (Rand Corporation [16]), energy and natural resources extraction (Shell Corporation [25] (pp. 9–10), politics (the end of the Vietnam War and “Mont Flauer” scenarios), and social and technological development (periodic reports of NIC Global Trends). This has resulted in scenarios that, as much as they require knowledge and specialists in many fields, become useful in numerous areas. A key success factor of the scenario approach is its multivariant/multithreaded nature, which is the only such effective research approach to the increasing complexity and turbulence of the analyzed phenomena.
The scenario approach was used both by the Stanford Research Institute and in the draft of The Limits to Growth by the Club of Rome [26]. The development of scenario planning thus progressed from the security and defense sphere to the economic sphere (Shell, McKinsey, Boston Consulting Group, and Global Bussines Network) [22] (p. 15). Interest in scenarios shifted from economics to social projects (addressing, for example, the social consequences of the Vietnam War) and then regional and national projects in Norway, Canada, Finland, Guatemala, Scotland and South Africa [22] (p. 117).
The most well known, and extensively analyzed in many worldwide publications, is the Royal Dutch/Shell scenario planning case study introduced by Peter Wack in the late 1960s and early 1970s [23] (pp. 3–10). The above involved creating scenarios describing the future situation in the oil markets. There was one among them that would become a reality in the future. This method also proved useful in 1979 and 1986. However, it failed in the face of mounting social pressures of ongoing environmental changes in 1995 [27] (pp. 52–56). It was then replaced by a new method of studying the environment—stakeholder analysis [28] (pp. 262–270). This method is worth mentioning in the context of this study, as there is currently a developmental trend which considers the rights of the community [29]. This group is made up of communities of interest, ranging from local to national or even global. Stakeholder analysis involves contextual stakeholders, considering their involvement [30] (p. 241). The value created therefore takes into account not only the needs of primary but also secondary stakeholders/contextual stakeholders [31]. This is an attempt to reconcile the economic and social points of view—a shared economic and social value. There are three ways to create shared value: by reconceiving products and markets, by redefining productivity in the value chain, and by enabling local cluster development. As a result, new ways of doing business will emerge through which the level of innovation and the pace of development of entities will increase—and society will benefit more [9] (p. 38). CSV is about creating new business opportunities and creating new value, following the concept of doing well by doing good [32].
The concept of scenario-based reasoning presented by P. Schwartz is also worth noting. It sets out principles and a methodology for assessing key forces in the macro-environment based on the Society, Technology, Economics, Politics, Environment (STEPE) typology [33] (pp. 100–108, 122–134, 164–172). A similar approach was adopted towards the security sectors within the Copenhagen School a few years later [34]. An interesting concept, representing the output of the Stanford Research Institute which is vital to the development of scenario planning is presented by B. Ralston and I. Wilson. The model presented here skillfully incorporates the analyses of macro-environmental, micro-environmental, and stakeholder forces [24] (pp. 39–177).
The model proposed by G. Ringland is also important in scenario planning. The exclusion of the Delphi method and forecasting from scenario planning is noteworthy there [22] (p. 35). The idea is not quite unique as K. van der Heijden has made similar suggestions [23] (pp. 26–27, 107–111). His concept of scenario planning is based on identifying key trends that subsequently define scenarios of the environment. The number of environmental scenarios is reduced to four and these serve then as a context for testing the quality of the strategies built. In this case, the strategy that meets the requirements of all or the largest number of the resulting scenarios will constitute the primary variant [23] (p. 118). This approach forms the basis of the four-ocean scenario matrix we have adopted. This is in line with The Oxford Scenario Planning Approach (OSPA) model and the concept of scenario building developed by P. Wack and K. Heijden at Shell [35] (pp. 25–50).
As the concept of scenario planning evolved, the set of scenario types considered grew. Nowadays, the amount of these approaches can be considered problematic [36] (pp. 424–443). Therefore, we propose narrowing down the focus to the three most prevalent and yet useful approaches in this analysis.
The first classical typology of scenarios, dating back 40 years, includes research, anticipatory, normative, and descriptive approaches [37] (pp. 52–53). The research approach allows one to determine future impacts based on assumed and understood causes. The depiction of the future is then often unclear. The anticipatory approach, on the other hand, proceeds from an assumed future state to identifying the factors and behaviors leading to it. Consequently, the depictions of the future and the means of achieving it become understandable. The descriptive approach involves building a set of future events without assessing the quality of their impact on the organization. As such, the assessment is more unbiased, realistic, and professional. The normative approach, however, is based on values against which certain phenomena are evaluated. Optimistic and pessimistic scenarios are constructed, and both can also be assigned a degree of probability [37] (p. 53).
The second typology of scenarios is more contemporary and is based on the distinction between deductive and inductive reasoning [23] (pp. 237–251). Inductive scenario creation involves collecting and organizing the data at hand, on the basis of which scenarios emerge [23] (pp. 237–239). This resembles a research approach that can be exemplified by the creation of future scenarios for South Africa during the emergence of the country’s new political order [38] (pp. 239–242), [22] (pp. 117–123). The deductive approach involves identifying the key structures that define the future and then building scenarios based on those structures and data [23] (pp. 242–250). This resembles an anticipatory approach.
The third typology of scenarios considers two approaches to the future—forward and backward [22] (p. 19). Nowadays, when speaking of innovation, the concept itself involves two very different approaches. The traditional one is about continuous development and improvement of current products or services. This is the forward approach. The breakthrough approach requires entirely new insights, structures, and skills. The modern backward approach is associated with Moonshot Thinking which was developed by Astro Teller of X (formerly Google X). This scenario method allows keeping up with the fast pace of technology in the digital age, which needs resourceful minds and unlimited innovative power. Such a pace of innovation is not enough for a 10% but a 10-fold improvement [39,40] (pp. 209–231). The idea originated in John F. Kennedy’s Moon Speech at Rice University. It initiated a mindset of focusing efforts and resources on achieving an almost impossible goal [41]. Moonshot Thinking is when you choose a huge problem, such as climate change, and propose creating a radical solution to the problem using a disruptive technology.

2.2. The Assumptions Made at the Level of Scenario Thinking

For the purposes of the research, the two approaches mentioned above were applied, offering respondents a choice between the traditional scenario, which describes the forward-looking view, and the breakthrough scenario, which describes the backward-looking view. The first, the Red scenario, has many of the characteristics of an incremental view of the future based on a simple approximation of past energy trends. The second, the Green scenario, presents a challenge that can be compared almost to JFK’s Moon Speech in 1963. This satisfies one of the basic demands that scenarios should differ radically from one another [22] (pp. 60, 73, 25), [42] (p. 144).
In the empirical layer, the scenario approach refers to NIC reports. They are characterized by several features that other industry or sector analyses lack or have less of. This research stems from a number of follow-ups that have already been conducted over a period of more than 20 years. Such studies are conducted every few years (4–5), with projections for the next five years and several years into the distant future. The very large-scale studies often involve several thousand experts from many disciplines in dozens of countries. A wide range of research methods are used—from historical analysis of major global trends covering the period since WWII, in-depth interviews with hundreds or thousands of experts and representatives of different spheres of social activity on different continents and in numerous countries, analysis of statistical data, simulation, consultation with a wide range of interested people, and numerous scientific conferences [25] (p. 11–12). In this kind of research, there is a clear reliance on the “leading futurist” output from the most prominent and distinguished schools of scenario planning represented by Rand Corporation, Shell, or the UN/Millennium Project [43] (p. 22). However, the methodology developed by Shell can be considered the leading one, and is relevant to the energy development issue presented in this paper: “Shell builds global scenarios every three years to help its leaders make better decisions. Following initial research, Shell’s team spends about a year conducting interviews and holding workshops to develop and finalize the scenarios, seeking throughout the process to ensure a balance between unconventional thinking and plausibility. We used a similar approach. We also benefited from consultations with other organizations that do futures work” [43] (p. 22).
Attention was directed especially to those editions of the analyses that dealt with the modern day. This is indicated by two reports—one published in 2004 and looking at 2020 [44] and one published in 2008 showing predictions for 2025 [22]. In those editions, the issue of the future of energy is an important component, but is not the only one. In our opinion, this is an undeniable advantage of global research such as this over studies focused solely on energy. Above all, they allow, which is not possible to this extent in studies dedicated only to energy problems, broad and independent interpretation, and inference. In addition, such research provided a remarkable opportunity to utilize intelligence analysis for the chosen energy sector, covering the contexts of geopolitics, demographics, migration, technology, and security (nuclear energy, bioterrorism, etc.). This ultimately gave the research teams more control over properly selecting the specific type of scenario approach and formulating the research assumptions. Due to the 2021/2022 study period, the Global Trends 2025: A Transformed World report was particularly useful, as its accuracy can be verified. This report takes a unique approach to the future of energy [22] (p. 2). For the purpose of the research, the assumption made in the analysis was applied: a crisis is not a matter of if, but a matter of when and how rapidly [22] (pp. 3–4). This allows researchers to identify two basic scenarios—those resulting from rapid, radical change (Scenario B–Green Ocean) and those resulting from a stable development process (Scenario A–Red Ocean). However, the NIC report itself indicates that it is most likely that “change or crisis will not occur gradually and gently.” [22] (p. 54). Therefore, in addition to these two scenarios (rapidly vs. slowly), a third too late scenario must be considered [2] (p. 57). It deals with a situation in which the events on Earth occur exponentially (according to an exponential function), which eliminates the reasoning behind the two main scenarios. In case of, for instance, global changes or destruction, the question of if is no longer relevant, so the question of when remains. Then, matters of global importance come to the forefront, such as relocation of coastal populations [22] (p. 57) or space habitation (the reasons behind them being the same) [45].
The above assumptions were the basis for building a scenario model based on four fields of the future energy sector forecast (Table 1).
The model proposed by the research team presented in the form of a matrix is characterized by three key distinguishing features: (1) it considers a very wide range of changes in the global environment, allowing for its long-term view, (2) it takes into account divergent scenarios of energy sector development containing all main directions of possible changes, and (3) it admits any direction of changes between fields. It allows for simultaneous consideration of limiting behavior, habits and conformism (Grey and Red scenarios) as well as encouraging non-standard, disruptive and unimaginative approaches (Green and Black scenarios).
The proposed model of energy sector scenarios takes into account all of the fundamental areas that determine the energy sector. Each of the scenarios takes into account a different proportion of the impact of STEPE factors. Thus, it is a very universal model, not only because of all of the basic spheres and factors considered, but also the possibility of application depending on the country or region and the type of entity studied—community of states, state, NGO, local government community, town or village, etc.
It is a model that, due to its openness, can better take into account such a dynamically growing range of changes and threats in the international environment which was not provided by the previously mentioned classical scenario models of the second half of the 20th century and the turn of the 20th and 21st centuries.
References in the scenarios to the oceans indicate areas subject to constant fluctuations (waves) and possible rapid changes (storms and tempests).

2.3. The Assumptions Made at the Energy System Level

The European Green Deal (EGD) is a development strategy to transform the European Union (EU) into a climate neutral area [46]. It is a response to the climate crisis and strong environmental degradation processes. Among the basic principles of the EGD is the transformation of the existing and functioning energy system across all EU countries into a new one that will meet the requirements of the new approach, including, above all, decarbonization. Further energy system decarbonization is critical to reach climate objectives in 2030 and 2050. The production and use of energy across economic sectors account for more than 75% of the EU’s greenhouse gas emissions. Energy efficiency must be prioritized [46].
Taking into account the main determinants of energy system transformation processes in Poland, it is necessary to undertake measures to develop, test, and then implement a new model of the energy system in Poland until 2050. The process of developing the concept behind the model should stem from current and projected needs, and economic, social, environmental, technological, or legal situations. Current PES model (Grey Ocean scenario) links are shown in Figure 2 [7].
The first link is ES—in the form of non-renewable sources and renewable sources. In Polish conditions, these are mainly: hard coal and lignite, natural gas, crude oil, and its derivatives. The share of renewable sources in the energy production structure in Poland is only 15.96%. The trends of changes in the Polish electric power industry in 2020 were almost identical to those in 2019 [47]. For the year 2021, the following was noted: growth in renewable energy generation, primarily from photovoltaics (PV)—especially prosumer PV. Solar power plants delivered 176% more energy to the system year by year. Co-firing of biomass with coal increased by 20% (to 2.2 TWh), supported by the high price of CO2 emission rights. The third and fourth places in terms of growth dynamics among green power plants were biogas plants (up 10%) and hydropower plants (up 8%). Wind farms and biomass-only units both experienced growth (wind up 4% and biomass up 3%). Electricity and heat production from natural gas continues to grow [47,48].
The second link of EP includes traditional power plants using non-renewable energy sources, power plants using renewable energy sources, local producers (LP) and individual producers (citizens—IP)—in total, generating 157.7 TWh. The main energy producers in Poland are the so-called baseload power plants, in which energy production is based on hard coal (71.6 TWh—46%) and lignite (38.3 TWh—24%) [48]. The second largest producers by volume are thermal power plants (natural gas 16 TWh—10%). In total, the most carbon-intensive coal sources account for 70% of domestic electricity generation, which is the lowest share in the century-long history of the Polish electricity industry (based on data from the Agencja Rynku Energii (Polish Energy Market Agency), as of the end of 2020) [47]. Electricity is also produced by photovoltaic (2 TWh—1%), hydroelectric (2.9 TWh—2%), and wind (15.7 TWh—10%) sources, as well as biogas, and biomass combustion (8.2 TWh—5%) [47]. However, RES exhibits the highest growth rate (based on PSE, ARE data as of the end of June 2021). Renewable energy plants sell all of the energy they generate to the PES. The predominant support system for RES in Europe is the so-called feed-in tariff (FiT), which consists of planning the price at which renewable energy will be sold over the next [17] few years. In such a model, each state decides on the amount of renewable energy in its energy system—by providing an appropriate amount of subsidies to FiT auction systems [47]. This is due to, among other things, the lack of effective energy storage technology, intermittency of production caused by the number of days without wind or sun [47].
The third link is TNI—transmission networks of various types with a set of supporting infrastructure. Right now, they are owned by energy companies. Electricity is transported from the power plant to the end customer via two types of networks—220 kV and 400 kV high-voltage lines. The transmission system operator transmits energy through them directly from the generators. In turn, the distribution system operator distributes it via medium- and low-voltage lines from 230 kV to 110 kV directly to end customers. In 2020, there were five large distribution system operators in the electricity market whose networks are directly connected to the transmission grid [49]. However, a total of 188 entities have a valid license from the Energy Regulatory Office for electricity distribution (as of 19 August 2021) [44]. In the case of generation and trading companies, it is possible to operate on a competitive basis, while the network business is a natural monopoly. Purchasers do not have the option to choose the operator that will deliver the purchased energy, but they do have the option to choose the seller.
The fourth link, ESF—energy storage—is considerably limited. Existing storage facilities are currently owned by energy companies. The emergence of cooperatives and energy clusters that can create storage capacity in notable numbers is in its infancy. Analysis of the trends of changes in 2020 in the Polish energy industry shows that pumped storage hydroelectric power plants, the largest energy storage facilities in Poland, were also used more frequently by 16% (0.8 TWh). This was mainly due to the increased share of variable energy sources (wind and solar PV), which the transmission system operator had to balance more often with stored energy.
The fifth link, ESM—system management—is currently carried out by the energy companies that own the TNI and ESF. These systems are appropriate for the current level of energy system development.
The sixth link, is EC—citizens (individual consumers), small industrial plants and small cities, medium industrial plants and medium cities, and large collective consumers, that is, large industrial plants and large cities.

3. Methods

3.1. Scenario Method

Based on the type of scenario approach presented earlier, the authors generated four possibilities for SE developments with respect to state and local-community participation (distributed energy) on the matrix presented before in the research assumptions in Table 1):
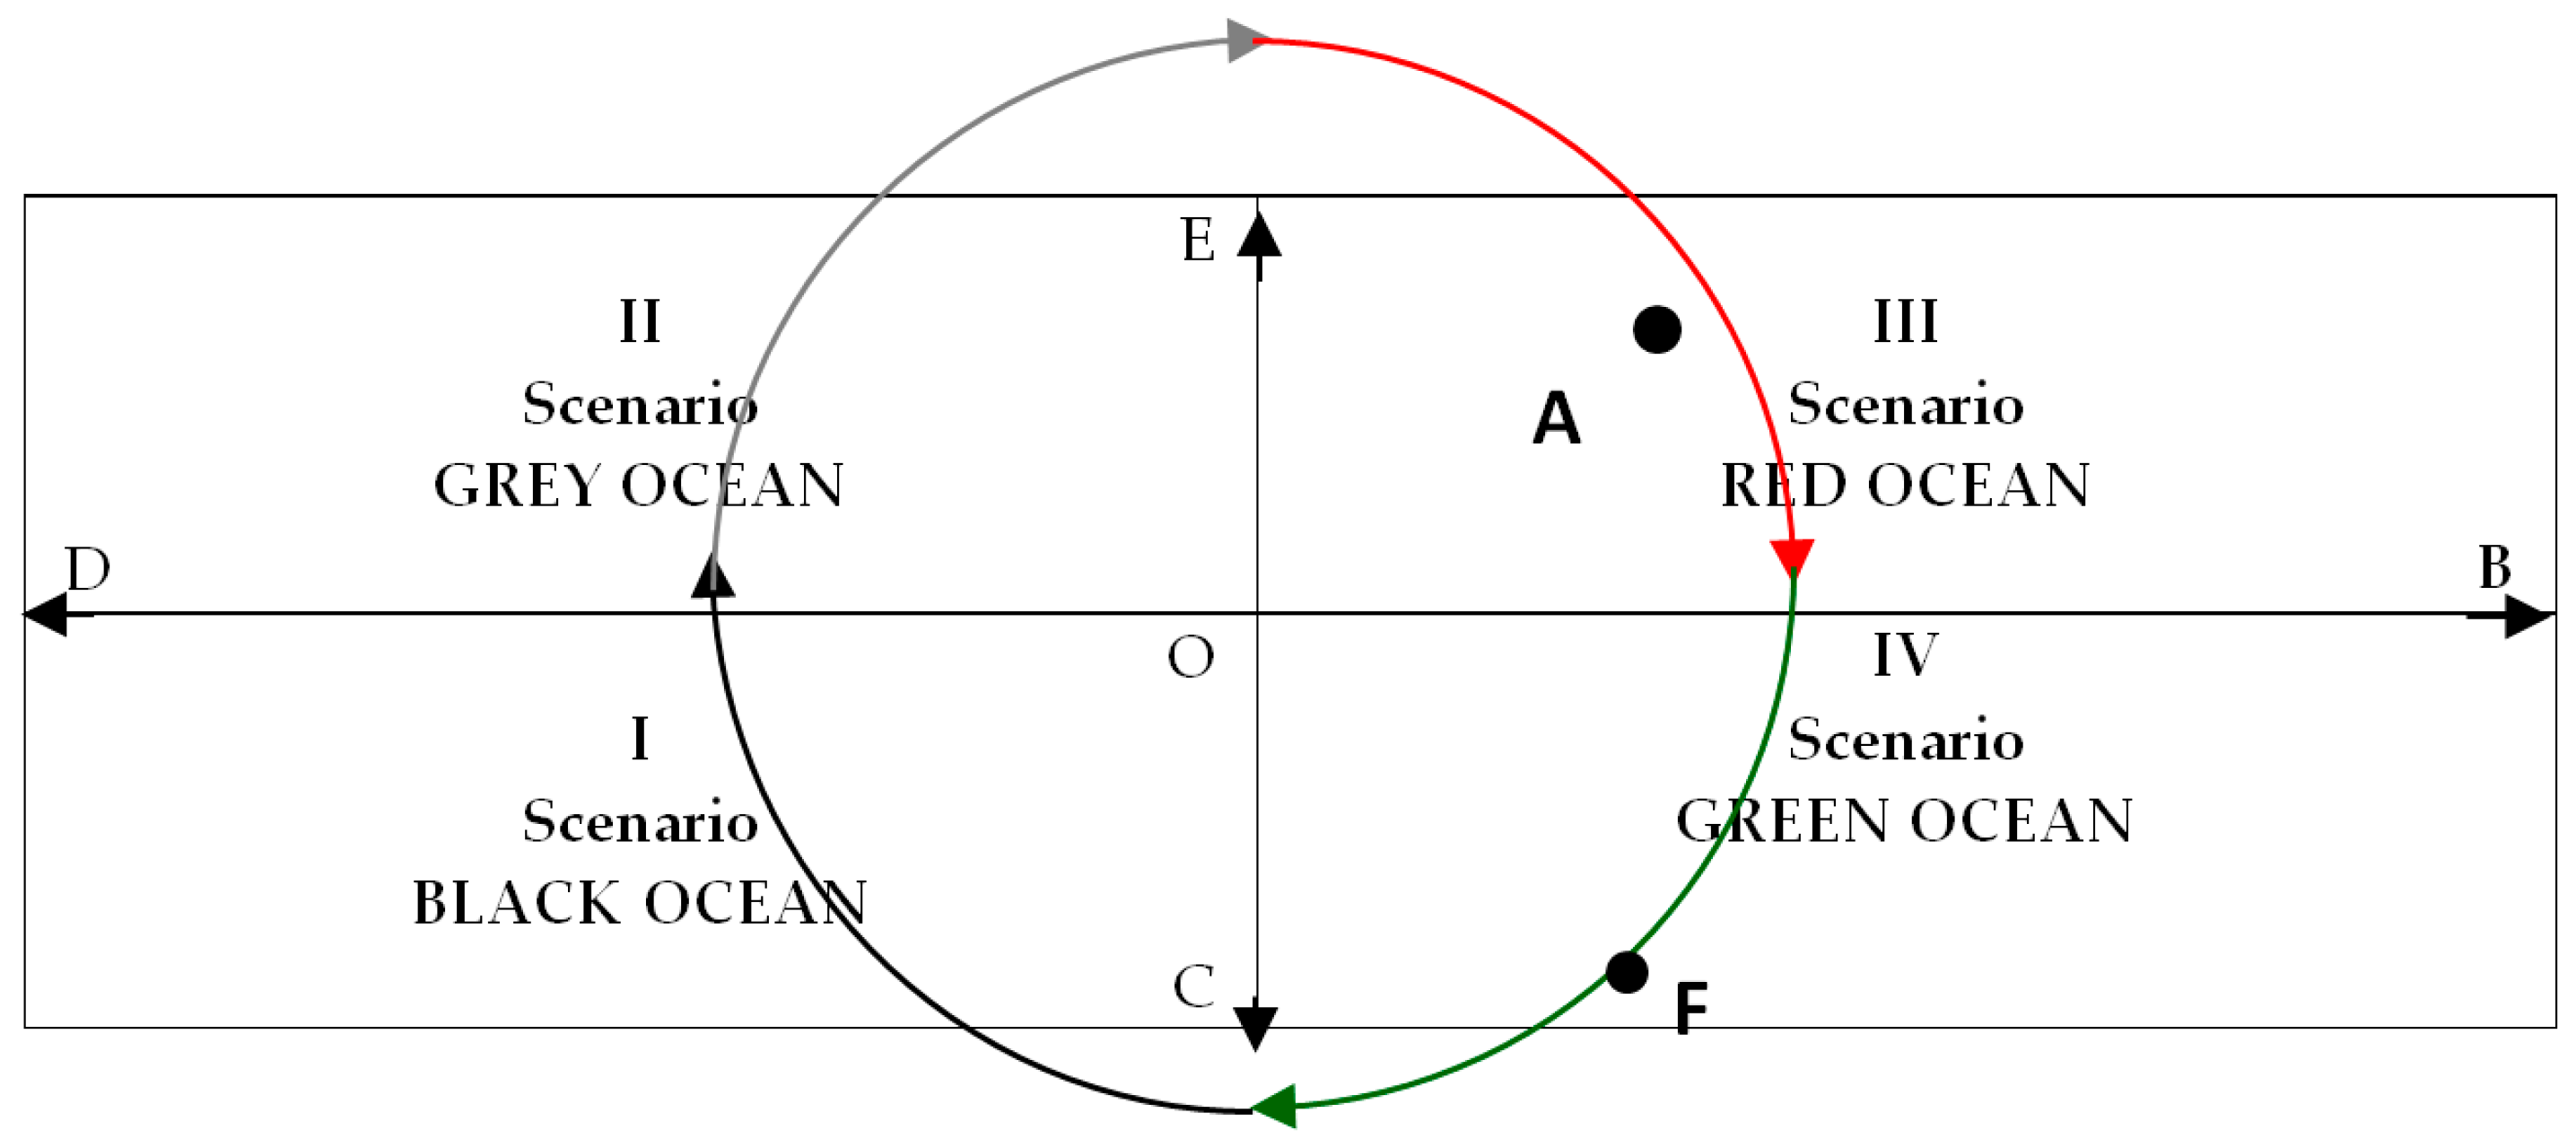
  • The Black Ocean scenario (collapse), low state system participation (conventional, monopoly), and low community participation (distributed energy)—first quarter;
  • The Grey Ocean scenario (continuation), high state participation and low community participation—second quarter;
  • The Red Ocean scenario (intense competition), high state participation, and high community participation—third quarter;
  • The Green Ocean scenario (radical), low state participation and high community participation—fourth quarter [5].
Figure 3 shows state participation (commitment), determined by the vertical axis, and community participation (commitment), determined by the horizontal axis. The point labeled O serves as the reference point. The OE section shows large increasing state commitment (all positive values), while the OC section shows decreasing state commitment (all positive values—a larger value means decreasing state involvement). The OB section shows high commitment of the community sector (all values positive), while the OD section shows decreasing involvement of this sector (all values positive—a higher value means a decreasing involvement of the community sector).
For PES, this article assumes the verifications of two scenarios illustrated as point A and point F. Point A shows large state participation and significant community energy participation in PES. Point F indicates the dominant participation of community energy in the PES with little state participation (Figure 3).
State participation and community participation were determined based on the STEPE analysis method. It was assumed that state participation is primarily determined by political factors, including legal, environmental, time, ecological, and social factors, as well as ethics/values. Community participation within the PES system is primarily determined by technological (breakthrough) factors, including energy infrastructure factors and economic factors (due to the involvement of private capital) [6,20] (pp. 76–101).
The factors from each area interact with the generated six energy system links. For each of the six links and in each of the four scenarios, two interacting factors were defined (Table 2). In the first row of a given link, factors associated with state participation were recorded, and in the second row, factors associated with community (distributed) participation were recorded. For the purpose of determining PES pathways for each link, the most significant factors were identified. The influence of each factor was determined by indicating its significance (weight) within the link, assigning values: 1—low significance in the scenario, 2—medium significance in the scenario, 3—high significance in the scenario. The generated factors and their weight for PES were estimated by the authors based on literature review (Table 2) [50,51,52,53,54,55,56,57].
In Table 2, we present the assessment of the significance (weight) of the development factors of each PES link in the analyzed scenarios.

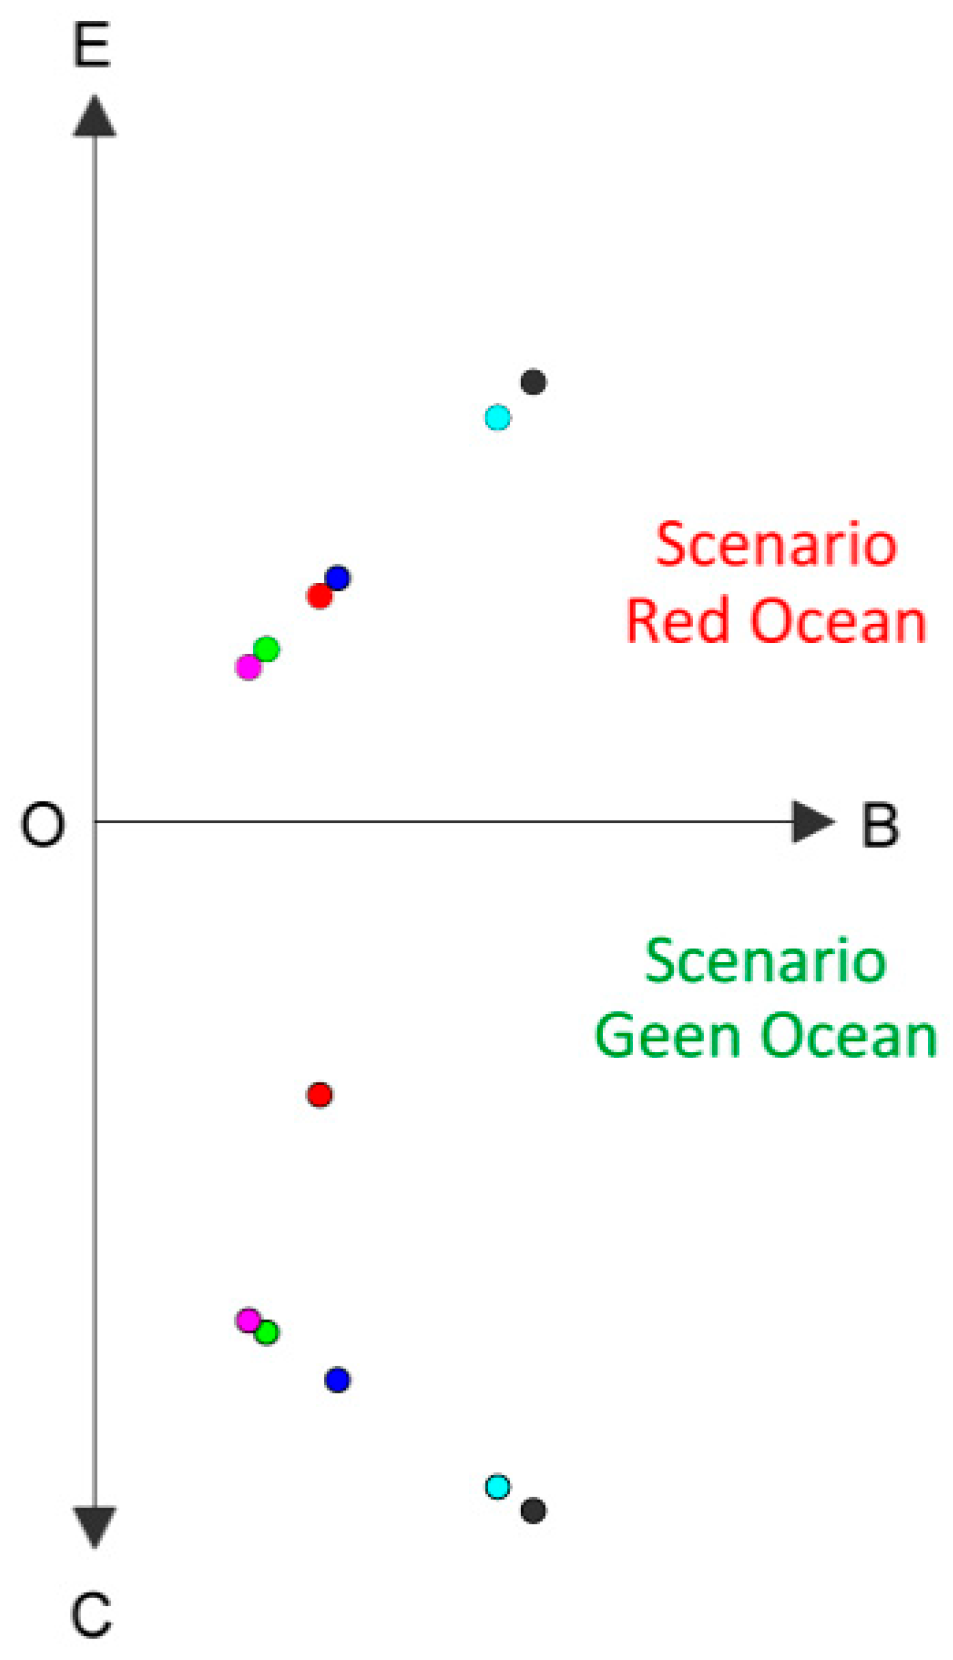
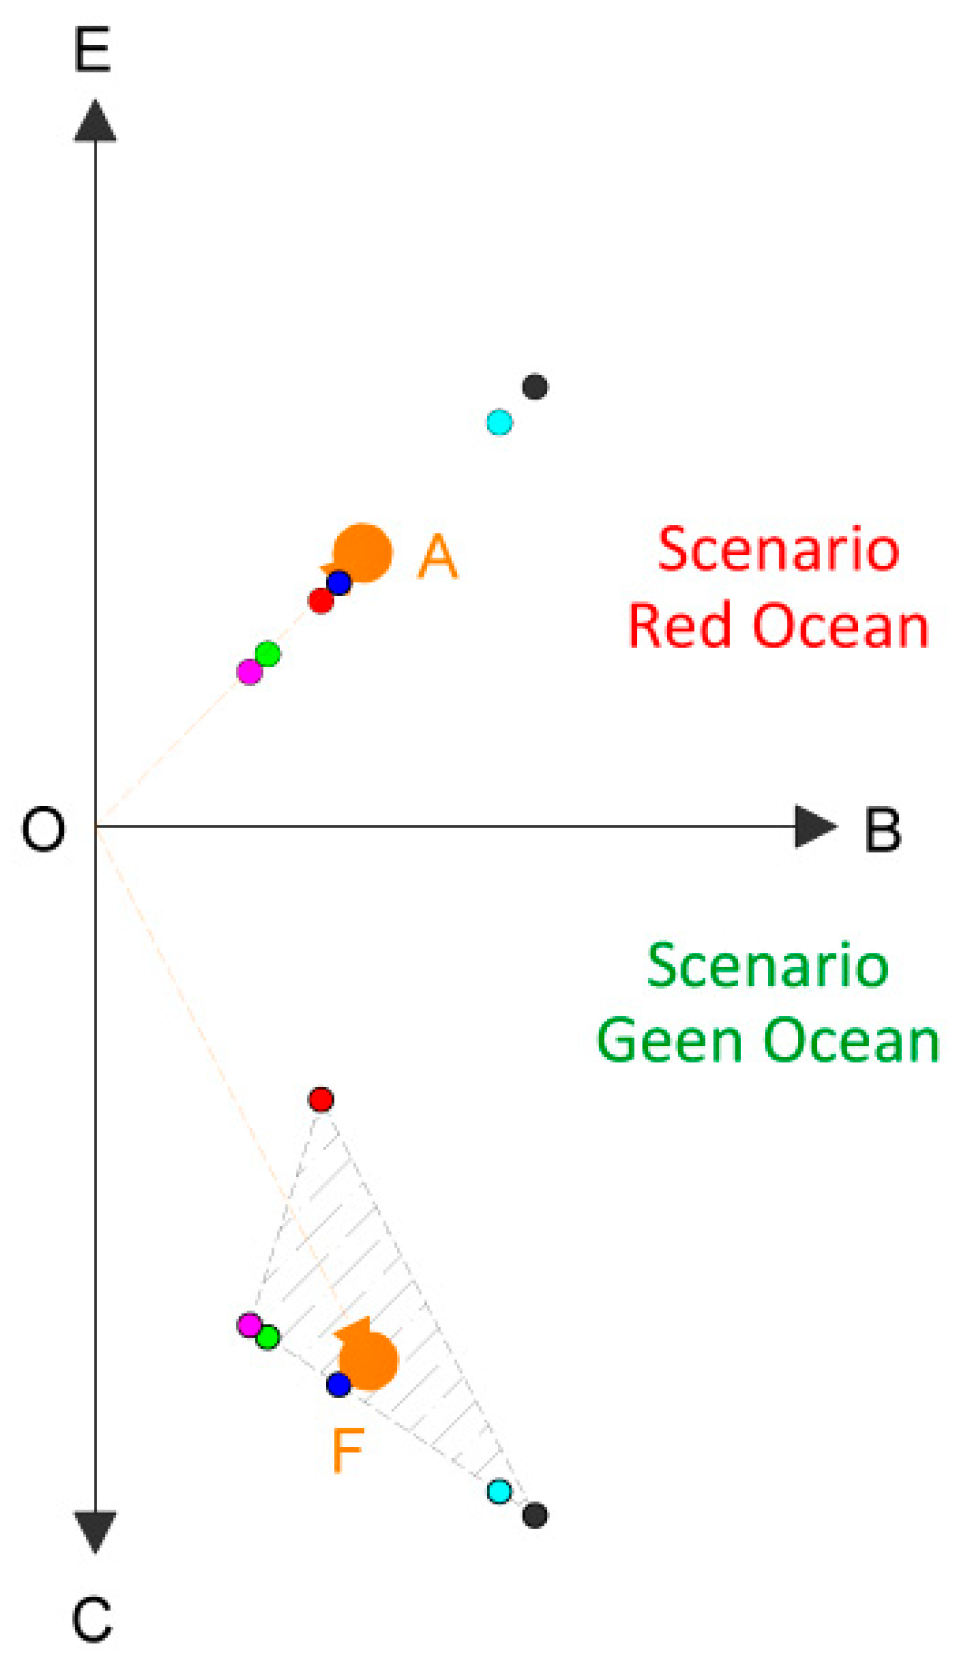
3.2. Individual Coordinates of Development Factors Method

PES development path in each quarter in Figure 3 can be determined by assigning individual coordinates for development factors specific to each PES link. The coordinates of link-specific development factors within a given scenario can be determined by using:
  • Mean calculated from the opinions of experts evaluating the probability of a scenario;
  • Assessment of the significance (weight) of the indicated development factors in individual PES links in the analyzed scenarios.
Given the assumptions made, the coordinates of the development factors W(Wp, Wo) for a given link under a given scenario can be determined using Equations (1)–(3).
Equation (1) allows calculating the first component of the coordinate W—the Wp value. This component is a reflection of state influence in a given quarter (row number 1 for each link in Table 2).
W p i j = X ¯ i × S i j
where
W p i j coordinate’s component for a given factor reflecting state influence.
X i ¯ weighted average for a given link.
S i j scales/the significance of the factor.
i = 1, 2, …, 6links in the system: 1 (ES/RES), 2 (EP/GEP), 3 (TNI/TNI), 4 (ESF/GES), 5 (ESM/IESM), and 6 (EC/GEC).
j = 1, 2, 3, 4scenario: 1—Black Ocean, 2—Grey Ocean, 3—Red Ocean, and 4—Green Ocean.
Equation (2) allows the calculation of the second component of coordinate W—the Wo value. This component reflects the impact of the community sector in a given quarter (row number 2 for each link in Table 2).
W o i j = X ¯ i × S i j
where
W o i j coordinate’s component for a given factor reflecting the influence of the distributed sector.
X i ¯ weighted average for a given link.
S i j scales/the significance of the factor.
i = 1, 2, …, 6links in the system: 1 (ES/RES), 2 (EP/GEP), 3 (TNI/TNI), 4 (ESF/GES), 5 (ESM/IESM), and 6 (EC/GEC).
j = 1, 2, 3, 4scenario: 1—Black Ocean, 2—Grey Ocean, 3—Red Ocean, and 4—Green Ocean.
The coordinates of the development factors W(Wp, Wo) for a given link under a given scenario can be determined using Equation (3).
W ( W p , W o ) i j = ( W p i j , W o i j )
where
W p i j coordinate’s component for a given factor reflecting state influence.
W o i j coordinate’s component for a given factor reflecting the influence of the community sector.
i = 1, 2, …, 6links in the system: 1 (ES/RES), 2 (EP/GEP), 3 (TNI/TNI), 4 (ESF/GES), 5 (ESM/IESM), and 6 (EC/GEC).
j = 1, 2, 3, 4scenario: 1—Black Ocean, 2—Grey Ocean, 3—Red Ocean, and 4—Green Ocean.
The presented method of determining the coordinates of development factors W(Wp, Wo) for a given link within a given scenario allows us to define six coordinates W(Wp, Wo) for each scenario. These coordinates delineate the area within a given scenario where the characteristic point of the OA or OF vector is located. This point, at a given time, determines the coordinate of a given scenario on the PES development path. Performing this study over several periods will allow us to illustrate the dynamics of how a given scenario changes along the PES development path.

4. Research Results

4.1. Energy System Development Scenario

In the outlook to 2050, the Black Ocean (collapse) scenario assumes underdeveloped links of the state system and underdeveloped links of the community system (Figure 3—first quarter, Table 3). Such a scenario is projected to unfold in the event of a global crisis, conflict or war. From a scientific perspective, it may concern the assumption that any improvement by 2050 is impossible to achieve—we no longer have the ability to positively influence the negative environmental changes that are occurring [22] (p. 57). In this scenario, due to various political and economic factors, the PES does not undergo any adjustment changes. The primary sources of energy will be fossil fuels, whose continuity of supply may be at risk due to the crisis. Due to the risk level, activities related to the possibility of developing renewable energy sources will be suspended or limited. The law is degressive in terms of pro-environmental changes. Preference will be given to state-owned energy producers; power transmission systems will be fully centralized. Storage facilities will be minimal and the management system will not change due to lack of technological development. Over time, the system will become outdated, unsafe, and vulnerable to external attacks of various nature. The strategies used in the first quarter are defensive strategies focused on survival and minimizing losses [58] (pp. 105, 120).
The Grey Ocean scenario (a continuation of the current one) can be described using the KI links of the current PES model (Figure 2). This scenario assumes well-developed links of the state system and underdeveloped links of the community system (Figure 3—second quarter, Table 3). From a scientific point of view, it can refer to the assumption that an energy system begins to age, and a new one—another one—does not take its place or supports it. Under this scenario, the current ways of supervision, financing, and investing within PES will remain unchanged. Standard development activities will be conducted. The structure of energy sources (ES) will not change substantially. Large entities using existing fossil fuel resources will remain the power producers (EP). Transmission networks along with all infrastructure (TNI) will be renovated and expanded according to existing rules. Energy storage (ESF) will be a secondary investment and the PES will be balanced according to the existing measures. Due to increasing demand, energy systems management (ESM) processes will expand and change due to technical and technological advances. Individual and collective energy consumers (EC) will continue to operate according to the existing rules, and connecting their equipment will remain difficult. This scenario means abandoning the development of new energy quality and disregarding trends in the area of environmental protection needs, compliance with European and global trends related to social needs, increasing energy security, etc. The strategies used in this quarter represent stabilization strategies retained by the state: conservative actions, aversion to growth and risk, decisions related to unchanged functioning [59].
The Red Ocean (intense competition) scenario [60] assumes well-developed links of the state system and well-developed links of the community system (Figure 3—third quarter, Table 3). Therefore, the existing system-wide structure is projected to remain as it is. Nevertheless, it will require qualitative changes in the conventional system, state participation: restructuring of state-owned companies, modernization of transmission networks (TNI), introduction of smart management of ESM. In this scenario, the current ES link (weakening of the importance of non-renewable sources), EP link (closing of traditional power plants using non-renewable sources of energy and replacement by renewable sources) and EC link (creation of awareness and ecological habits in energy consumption) will change. Ultimately, in 2050, the energy sector would be modernized in the public area and its share would be limited to large consumers (large cities and enterprises), which would use modified RES. The existing power plants would serve as possible back up and bypasses that could carry the burden of energy production if the country’s security is at risk.
The scenario also assumes well-developed community system links, which means an increased share of distributed energy generation. This would concern community producers—small local producers and prosumers autonomously building their own power plants—producing energy for their own use and for the use of their immediate environment. The energy generated by them would gradually relieve the public power system and balance energy consumption nationwide. In the outlook to 2050, the distributed energy industry would be consolidated, that is, cooperatives, clusters would be formed to enable the creation of energy storage facilities (ESF) and local transmission networks (TNI), as an alternative to state-owned (TNI) networks. The development of this direction would lead to the replacement of existing energy sources with new green sources.
The Red Ocean scenario assumes that the current energy system would undergo the following changes:
  • The ES link will be diversified as a result of the conversion towards RES;
  • The EP link will be transformed in the direction of GEP—it will undergo changes consisting of elimination of traditional power plants using non-renewable energy sources and replacing them with modern power plants operating on a macro scale: offshore and onshore wind farms, large photovoltaic power plants, large cogeneration-based power plants, hydrogen plants, etc. At the same time, distributed renewable energy sources supplied by local producers (smaller power plants using RES and citizens, i.e., individual producers) will become more important;
  • The TNI link will be expanded and upgraded into an TNI link aimed at increasing the availability of transmission networks and associated infrastructure, increasing the efficiency of energy distribution in transmission networks, and creating conditions for energy transmission;
  • The ESF link will be transformed towards GES—realized by planning and building modern energy storage facilities;
  • The ESM link will be modified towards smart management of the entire system (ISE link) by using analytical tools to simulate, plan, and report what is happening on the grid, implementing information systems for monitoring and data visualization, and installing smart devices on the grid that communicate with each other;
  • The EC link—for consumers, policies and programs should be implemented to save and rationalize energy use, including creating green habits within energy consumption as part of, for instance, smart cities [61] (NOE link).
The basis of development in the third quarter, Red Ocean, is the assumption of change as a result of competition (negative cooperation) [6] in individual market segments (small cities, businesses, institutions, etc.). These are strategies implemented according to Porter’s low-cost leadership strategies [60]. The existence of co-action (positive cooperation) of the entities that constitute the quality of the links in the PES should also be assumed. The occurrence of both phenomena is referred to as coopetition [62] (p. 128), [63,64] (p. 782). This quarter will focus on state-side stabilization and growth strategies stemming from distributed energy side.
The Green Ocean scenario (radical but beneficial change) is based on intentionally underdeveloped state system links and very well-developed community system links. What it means is to develop and implement an entirely new and innovative PES, along with a significant weakening of the current system (Figure 3—fourth quarter, Table 3). The scenario assumes that maintaining the existing system-wide structure as it is [7]:
  • Troublesome from the technological and modernization side;
  • Not economically viable, economically inefficient;
and
  • Unacceptable from the perspective of the region’s energy independence.
The Green Ocean scenario assumes that the energy system will be based on the model we called the Distributed Community Energy Model (DCEM).
The DCEM chain will consist of the following links (Figure 2):
  • Renewable energy sources (RES)—all renewable energy sources available now and in the future. These energy sources include solar, wind, biogas, biomass, cogeneration-based, hydrogen, decarbonized gas, water, and modern nuclear. The RES link in the DCEM is responsible for producing clean and green energy. These sources can be located on land or on water, under-, on-, and above-ground. The model assumption is that the location of energy sources should be as close as possible to the consumers of that energy. This last element is the realization of the DCEM’s assumption that energy sources are distributed and local;
  • Green energy producers (GEP)—a link consisting of many types of producers. This group includes large (over 500 MW), medium (100 MW to 500 MW), and small (up to 100 MW) renewable energy eco power plants. This type of eco power plants will be established by large energy producers, including public sector, local government, and private sector entities. These producers will be responsible for producing energy primarily through commercial operations. A collection of eco-power plants of this type should be responsible for the energy system stability and security of supply. In the proposed DCEM, local producers (LP) and individual producers (citizens, IP) should be the green energy producers, in addition to the previously identified entities forming the GEP. Local producers (LP) are a group of different entities that will produce green energy for their own consumption with the option to sell surplus. Individual producers (IP) are citizens of Poland who produce energy primarily for their own needs;
  • Transmission networks with infrastructure (TNI)—the set of equipment and associated infrastructure necessary to transmit energy throughout the established power grid. TNI should be responsible for transmitting energy from RES to NOE, RES to GES, GES to NOE, RES to RES, GES to RES. TNI are a critical element in the energy system, and thus are a very important part of the DCEM. TNI sensitivity is conditioned by the reach and spatial distribution of its infrastructure resulting from the need to connect millions of points across the power grid. The effectiveness and efficiency of the entire system depend on this link of the DCEM. This warrants a question—who should own them? TNI, for a number of reasons (technical, economic, (cyber)security, etc.) should largely be owned by energy companies. This does not preclude local producers (LP) or individual producers (IP) from having PSI;
  • Green energy storage (GES)—an indispensable component in a modern energy system based on RES. In the DCEM, GES has [2] primary functions: stabilization and storage. The stabilization function is related to the need for continuous balancing of the entire power system on a scale that does not currently exist. The scale is determined by the presumed vast number of RES. Energy supplied by RES across the system will be balanced using TNI, GES and IESM. Without GES, the entire system will be unstable and balancing processes will be impossible. GES in this case will form a strategic reserve of energy in the system. The second function is related to energy storage. This storage will primarily apply to local producers (LP) and individual producers (IP). For LP and IP, the DCEM envisions that every small business and citizen will have a small energy storage facility at their business and home. GES will be developed based on modern and efficient technologies. The ownership of GES will be determined by the development scenario applied in the transformation of the energy sector;
  • Intelligent energy systems management (IESM)—the technical, teletechnical, and IT infrastructure necessary to ensure operation of the entire power system at the assumed level of efficiency, effectiveness, and security. In the DCEM, the IESM link is responsible for all processes from RES, through TNI and GES, to NOE. One can also imagine a management scenario quite the opposite of the latter. Building a modern IZS infrastructure is a determinant of the success of building a whole modern energy system in Poland. IESM infrastructure will be implemented by power companies/operators that own TNI and GES;
  • Green energy consumers (individual and collective) (GEC)—all energy consumers in Poland. This group includes all state, local government and private sector entities, including large, medium and small industries, and all cities (large, medium and small). Another group, NOE, consists of citizens (individual consumers) and various entities operating in Poland that consume energy. NOEs are the final and boundary element in the overall energy system. In the DCEM, NOE is not limited to energy consumption. Energy consumers have an active role in creating the overall system. On the one hand, they are conscious consumers who care about how energy is produced; on the other hand, they can be active participants in the energy system by, for example, providing their own storage facilities.
The DCEM links will perform the following functions:
  • The RES link will be created exclusively by renewable energy sources; other energy sources that will appear in the future will be gradually included in the system; let us not forget that renewable energy sources can coexist in one location and, moreover, energy storage can be located next to the energy sources;
  • The GEP link will be created primarily by distributed renewable energy sources supplied by local producers (smaller power plants using RES and citizens, i.e., individual producers), modern power plants operating on a macro scale (offshore and onshore wind farms, large photovoltaic farms); large power plants using cogeneration, hydrogen, etc., will play a strategic role related to the stability of energy supply and energy security; in this link, various organizational structures will be created to enable community energy production, for instance, energy clusters or energy cooperatives;
  • The TNI link will be created to serve community energy sources created in this scenario within the EP link; existing transmission networks will be upgraded to serve a service role with the goal of increasing access to transmission networks and associated infrastructure, and increasing the efficiency of energy distribution;
  • The GES link will be realized by planning and building modern energy storage facilities located closest to the energy end users; it is also necessary to implement solutions related to smart local energy storage located at energy consumers’ premises;
  • The IESM link will be built from the ground up and will be designed to intelligently manage the entire system through the use of analytical tools to simulate, plan, and report on what is happening in the system; it will allow for the implementation of information systems for monitoring and data visualization, and the installation of smart devices that will communicate with each other;
  • The GEC link should be implemented for consumers, policies and programs to enable smart energy system management (generation and storage), energy conservation and rationalization, including the formation of green habits in energy consumption.
In the Green Ocean scenario, all DCEM links are planned and constructed from scratch based on those elements of the existing system that can be used for new needs. For this scenario, a pathway can be proposed involving the construction of a completely new energy system, correlated with the slow, systematic decommissioning of the existing, old links in the energy infrastructure in appropriate proportions, according to the growth of new energy sources, new infrastructural elements and available financial resources. The result would be the existence of two energy systems: a new one based on RES, and an old one for backup, functioning with a minimum reliance on conventional energy sources. The already existing infrastructure would thus remain in standby, in case of situations involving risks to the nation’s energy security.
The DCEM is based on the indicated premises (P) and is based on the existing links of the energy system in Poland. With this approach, the DCEM links are based on the foundations that now exist (that is, as of 2021), described as: ES, EP, TNI, ESF, ESM and EC. The adopted 2050 perspective based on EGD assumptions has forced the need to remodel existing links and create equivalents, thus the resulting links of the DCEM: RES, GEP, TNI, GES, IESM and GEC. With the proposed approach of developing the DCEM on the basis of current solutions with their modernization in the future, the model is relevant to the current situation of the energy system in Poland. Based on expert feedback, modifications were made to accommodate EGD requirements, thereby changing the entire system. These arguments allow us to assume that the DCEM is a good representation of the energy system in Poland in the 2050 perspective.
It remains undisputed that in the DCEM, energy is produced and distributed in an environmentally friendly manner, energy sources are dispersed, transmission systems are accessible, and management systems are efficient and not prone to external attacks. In this model, an important role is played by citizens and local energy producers, who at the same time are the final consumers of energy, and participate in energy storage processes. The fourth quarter thus illustrates innovation-driven development. Thus, innovation strategies may apply [65]: blue ocean [8], innovation network, innovation niche, innovation cluster, or open innovation. This entails creating new value for consumers and businesses. Implementation of such strategies must be preceded by extensive analysis and consultation. The current article is part of that process.
The scenario chosen in Poland will have a significant impact on all aspects of the country’s economy. It will affect the achieved indicators of economic activity, and the competitiveness of the economy in the international perspective. Therefore, how do the experts interviewed view the possibilities of energy system development?
Considering the premises (P) indicated in the introduction, the existing and planned links of the energy system (PES), and the results obtained within the expert panel “New Model of the Energy System in Poland” [7], we assume that two of the indicated scenarios may be implemented in Poland:
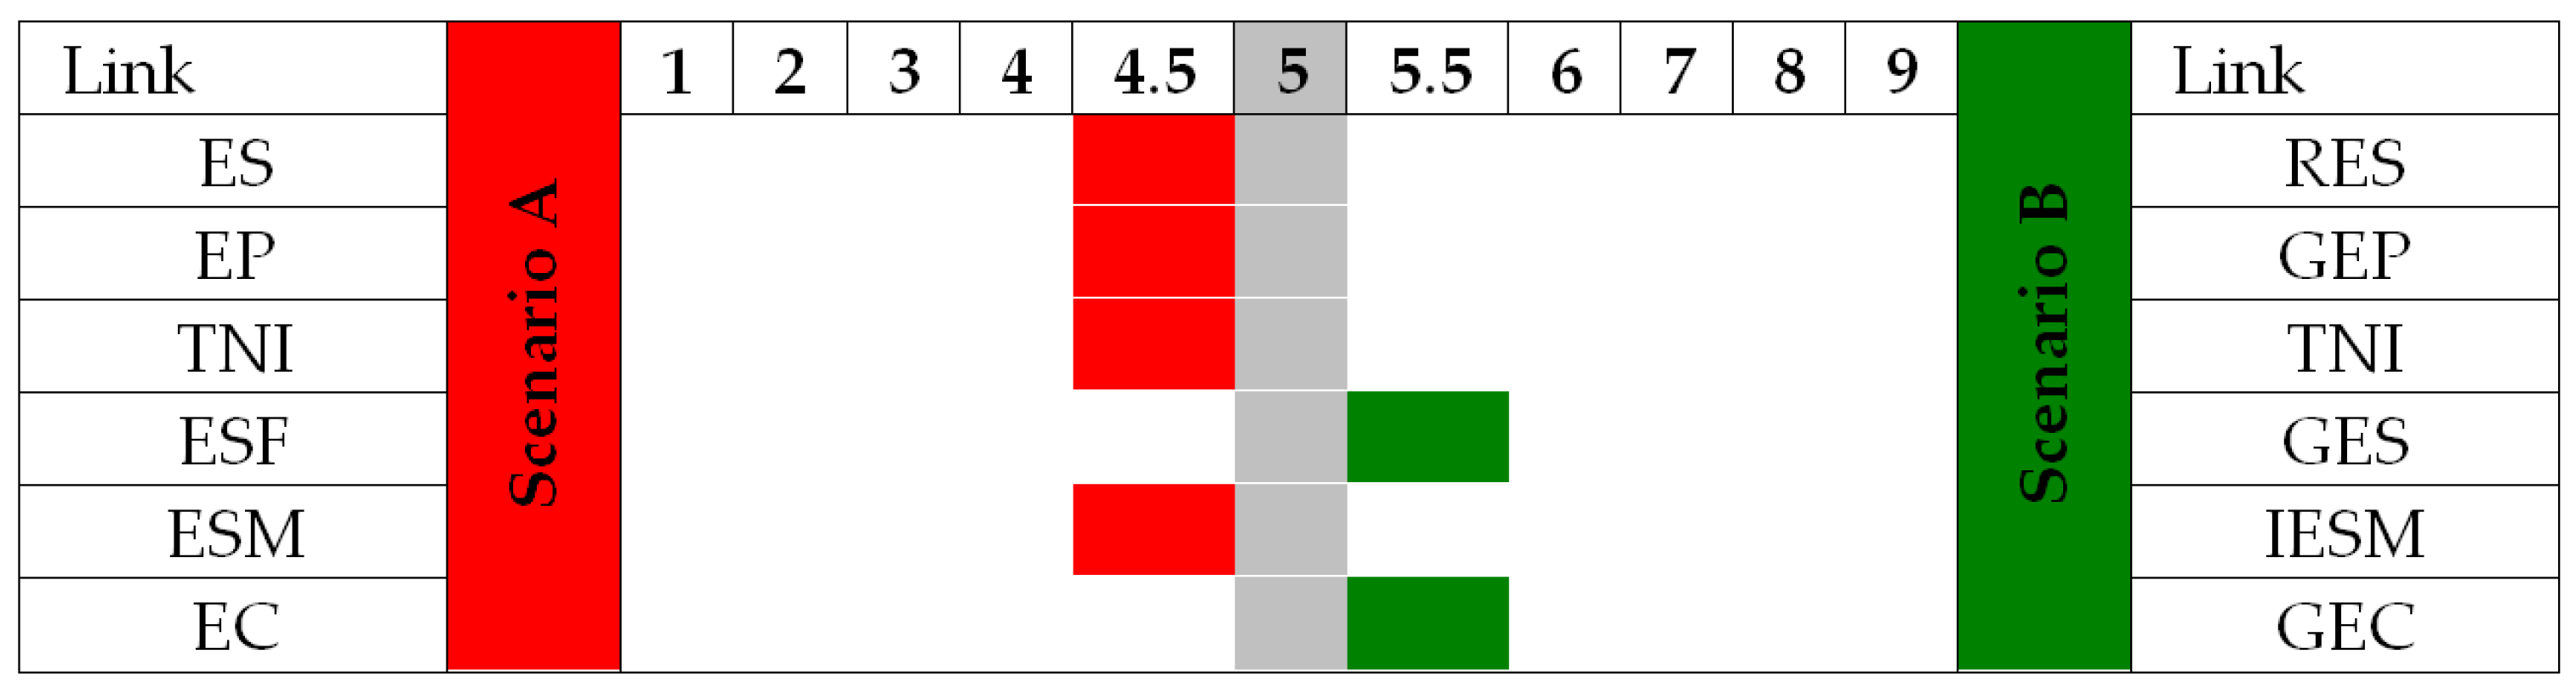
  • Red Ocean (intense competition)—scenario A;
  • Green Ocean (radical change)—scenario B.
As part of the survey, experts were asked to rate the chances of a scenario being realized when compared (Table 3, col. 2–3). The scale is designed in the following way: 1—only implementing the Red Ocean scenario (100%); 9—only implementing the Green Ocean scenario (100%). This was the first item of the questionnaire. The next question consisted of choosing a single scenario (single-choice question: A—Red Ocean scenario, B—Green Ocean scenario (Table 3, col. 4 and 5)—this was the second item. The third item considered the scenario selected in the second item. Respondents were asked to assess its likelihood in the outlook to 2050 (0—very unlikely; 10—very likely) (Table 3, col. 6–9). The indicated three questions were defined for the links: ES/RES, EP/GEP, TNI/TNI, ESF/GES, ESM/IESM, and EC/GEC.
The results in Table 3 (col. 2,3) and presented in Figure 4 indicate that the experts (aggregated results) are split between scenario A and scenario B. If we assume a value of (5.0) as the baseline, which is the mean score/median, the experts tended to choose scenario A, as four of the six links in this study scored below the baseline. The mean values for TNI/TNI—4.2 and ZS/IZS—4.3 were below the baseline by −0.8 and −0.7, respectively. EP/RES—4.6 and EP/GEP—4.7 were below the baseline by −0.4 and −0.3, respectively. In contrast, the ESF/GES—5.6 and EC/GEC—5.8 links were the baseline by 0.6 and 0.8, respectively. The analysis conducted indicates only a slight preference toward the Red Ocean scenario. At this stage, we can conclude that the experts do not have a solidified view as to which scenario to choose; however, there is a slight inclination towards the links of scenario A.
The results in Table 3 (col. 4 and 5) and presented in Figure 5 demonstrate the probability of experts choosing a given scenario in a situation where only one scenario can be chosen—second item. The values presented indicate that the experts for five links out of six possible selected scenario A, that is, the Red Ocean scenario. Scenario A, for links:
  • ES was selected by 7 out of 10 experts;
  • TNI and ZS was selected by nearly 6.7 out of 10 experts;
  • EP, ESF, and GES was selected approximately 5.5 out of 10 experts.
A different opinion was expressed in the case of the GEC link—6 out of 10 experts chose scenario B.
The analysis of the first item is confirmed by the probability of the indicated choices (second item). Experts indicating scenario A regarded it as less likely (in three out of five links—Table 3, col. 8) than scenario B. Experts indicated it less frequently, while they were more confident in its implementation (four out of six links—Table 3, col. 9).
The results in Table 3 (col. 6 and 7) show the likelihood of supporting, or not supporting, the previously selected scenario A or B. Experts, by assigning a score between 0 (very unlikely) and 10 (very likely), were classified into 3 groups (scores 9–10 identify supporters, 7–8 identify neutrals, while 0–6 identify non-supporters) according to the Net Promoter Score (NPS) methodology [66]. NPS is calculated based on the response and takes a value from −100 to 100. Negative values indicate a larger percentage of non-supporters relative to supporters of a given scenario. In practice, this means that a score in the 0–6 range was chosen by more experts than in the 9–10 range.
Analyzing the results obtained, we can conclude that for both scenarios (A and B), the non-supporter group was larger than the supporter group. A remarkable case is that of scenario A within the ES link. In it, the two groups were equal in number. The prevalence of negative values is evidence that supports the conclusions indicated earlier related to the lack of uniformity in the choice of any of the evaluated scenarios (A or B). Experts preferring scenario A (Red Ocean) are unable to confirm their stance in subsequent steps of the qualitative study.
The aggregated survey results were derived from the responses obtained from each group of energy experts. The distribution of responses was analyzed in four groups (Table 4):
  • Scientists;
  • Local and central government officials, politicians;
  • Managers of state-owned companies;
  • Producers of green energy and green storage/infrastructure.
The analysis of these groups shows that scientists were the most likely to select the Red Ocean scenario. This was true for the first item (four out of six links—Table 4, col. 2 and 3). However, in the second item, they chose variant A (Table 4, col. 4). The likelihood of implementation for TNI/TNI and EC/RES exceeds 70% for variant A. Slightly above the median value of 5.0 in the first choice, scientists indicated the Green Ocean scenario for ESF/GES (by 0.4) and EC/GEC (by 0.2). Scientists therefore favored the Red Ocean scenario the most.
Another group favoring variant A in the first item (four out of six links) are representatives of state-owned companies. As with the group of scientists, scenario B was indicated for ESF/GES and EC/GEC. They were more radical, as the deviation from the median value was (0.7 and 1.9) (the highest deviation value). In the second item, however, they did not hold their view on the implementation of scenario B in the case of ESF/GES (Table 4, col. 4), they also changed their opinion on the implementation of scenario A with respect to EP/GEP (Table 4, col. 5). They were consistent regarding EC/GEC, indicating a high likelihood (78%—Table 4, col. 7). This consistency can also be seen with TNI/TNI.
Next, the local and state administration group was examined. This group was more radical in their opinions than the other groups. For the first item, they indicated three of the six links for scenario B (Table 4, col. 3): ES/RES with a deviation of 0.2, ESF/GES with a deviation of 0.9, and EP/GEP with a deviation of 1.2. However, the indications for scenario A were negligible, with a deviation of 0.1 (Table 4, col. 2). This was reflected in the second item because apart from indicating EP/GEP (energy producers) for scenario B, the responses were equally distributed (Table 4, col. 4, 5).
However, RES representatives were the most radical group who indicated scenario B in four cases out of six (Table 4, col. 3). With this, the median value was obtained for TNI/TNI and the deviation for ESM/IESM was 0.1 (Table 4, col. 2). This was reflected in the second item, which confirmed the choice of scenario B (Table 4, col. 4, 5). However, in two cases (EP/GEP and ESM/IESM) the responses were equally distributed, however, the probability of realization is higher for scenario B (Table 4, col. 7).
The Green Ocean scenario, defined as requiring radical change, seems unlikely in the 2050 timeframe. In fact, it is unrealistic, although the respondents understand and want it to come to fruition. Experts preferring scenario A (Red Ocean) are not entirely convinced of its advantage over scenario B (Green Ocean). This is confirmed by the value of the arithmetic mean calculated from the results for the following item: “In the first phase of the decision-making process, you are asked to make an assessment, based on which it will be possible to evaluate the likelihood of a developmental scenario, in a situation where scenarios are compared. “Assume that: 1—is the realization of only (100%) scenario A, and 9—is the realization of only (100%) scenario B, please rate their likelihood.” The obtained value of 4.6 is located slightly below the reference value of 5.0. At the same time, the median calculated on the same sample gives exactly a value of 5.0. The results presented also show that experts try to rationalize their choice by pointing to scenario A, which is more conservative and at the same time they would like to see the more radical scenario B implemented. In isolated links of the value chain, closely related to the experts’ own activities (personal and professional), they are able to make choices more clearly. This is the case when scenario B is selected for the GEC link evaluation (see Table 3).

4.2. Individual Coordinates of Development Factors

The following were taken into account: (a) the performed assessment of the significance (weight) of the indicated development factors within each PES link for the assumed scenarios A and B performed in Table 3 and; (b) the mean calculated from the opinions of experts who evaluated the likelihood of a scenario included in Table 4, col. 2. Then, we performed coordinate calculations of the development factors W(Wp, Wo) within a given link for scenarios A—Red Ocean and B—Green Ocean. To do so, we used formulas (1), (2) and (3). The results are shown in Table 5 and Figure 6 and Figure 7.
Analysis of the data in Table 5 and Figure 6 indicates that at the time the analyses were performed, the development factors W(Wp, Wo) for a given link under scenario A—Red Ocean, balanced each other out. That is, it is not possible to indicate whether the dominant share is held by the state or the community sector. In this case, the coordinates of the development factors W(Wp, Wo) are distributed along a straight line and do not form a separate area. The coordinate of the characteristic point of the OA vector was calculated using the mean value of Wp and Wo coordinates.
For the development factors W(Wp, Wo) for a given link under scenario B—Green Ocean, asymmetry was observed for the community factors (Figure 7). Community factors are dominant. The coordinates W(Wp, Wo) under this scenario delineated an area (Figure 7), where the characteristic point of the vector OF is located. The coordinate of the characteristic point of the OF vector was calculated as the figure’s midpoint. The characteristic points of vector OA and OF, at a given time, determine the coordinates of scenario A and scenario B, respectively, on the PES development path.
The research conducted on the location of scenario A and scenario B on the PES development path confirms the assessments defined earlier by the experts. PES in scenario A (Red Ocean) is balanced at the time of this study with no state or community sector dominance. In this situation, we must emphasize that it is more probable and, from the perspective of experts and analyses performed, more secure. For scenario B (Green Ocean), there is a far-reaching disparity towards solution we referred to as the DCEM. The DCEM, as proven by expert opinions and studies, is too radical and dangerous at the moment. At the time this study was performed, the observed imbalance of development factors in almost all links allows us to conclude that this is a less likely but future-oriented scenario.

5. Discussion

The results presented above raise a number of considerations and, at the same time, provide a wide area for further discussion, especially in the context of the uncertainties they carry. First, it is important to highlight the global direction of change in business models, which must be oriented, due to climate change, towards corporate social responsibility [67], sustainable development/sustainability [68,69] or the realization of economic and social values [9,10,70]. It should be emphasized that the terms corporate social responsibility, sustainability, and creating shared value are not used interchangeably in the scientific literature, although some of the actions taken in the name of these ideas may be similar or identical. Each of these terms refers to a different level of engagement aimed at improving the environment and business benefits. Many organizations undertake initiatives at various levels, defining them as elements of responsible business. They are guided by the principle that the organization should aim to satisfy, or preferably exceed, the wants and expectations of its stakeholders without compromising the ability of other parties to meet their needs [71] (p. 742). On the practical side, the boundaries between the concepts discussed are blurred. This approach is part of the ethical aspect of doing business. The environment, health, the value of the common good, and social responsibility become the dominant values [20] (p. 83).
Our PES business model consists of six links. Experts consider ESF and EC links as opportunities for change (however, aggregated data slightly exceed the average of 5.0), while prosumers, as well as local and central government officials indicate ES and EP links. This means that the core business can create economic and social value in line with the global trend for change. However, ancillary activities located in TNI and ESM cells indicate a low probability of realizing such a development path (Table 2 and Table 3). The research paints a picture of great uncertainty as to the choice of a particular variant of development of the energy sector, resulting from, on the one hand, the conservatism of decision makers, experts, and scientists who are aware of the conditions (according to the adopted PESTE typology) inhibiting the drive for dynamic change dictated by economic aspects. On the other hand, they are also aware of the necessity of transformations, ensuring not only progress and economic development, but also high levels of well-being, and in extreme circumstances—survival in the era of unfavorable climate changes. This is evidenced by the respondents’ indications concerning the probability of realization of the selected scenarios in both assumed variants. This uncertainty, from a social perspective, is reinforced by survey results among all respondent groups (except RES entrepreneurs) related to social determinants associated with a low likelihood of achieving desired changes in the Green Ocean direction. Pursuing climate goals that take into account the rights of the community, the community of interest, from the local community to the national or even the global community is not a simple matter. From the point of view of political processes, the Red Ocean and Green Ocean scenarios assume progress in the area of ecology and a common-sense will for technological progress. Political decisions conditioned by the populist perspective of caring for the support of a spoiled and lazy electorate in the European Union do not necessarily determine their implementation in the indicated directions. This applies both to the old EU member states, where such political parties have enjoyed considerable electoral success (e.g., France, Italy) and to the so-called new countries, which joined after 2004 (e.g., Hungary, Poland, Romania). For populist groups, the European Union and its community policies represent a threat to domestic sovereignty and a threat of leftist ideology. These are merely scapegoats, blamed for the erroneous or ill-advised policy decisions of their governments. In the case of Poland, this view is substantiated by the words of the vice president predicting a potentially very different direction—the Grey Ocean. It would become a possibility with the termination of the agreement on the climate package adopted by Poland [72]. The possibility of such a scenario becoming reality not only poses a threat to the entire energy sector, which is stagnating, but also poses a serious obstacle to the progress of integration processes across the European Union, for the functioning of which the energy policy sector is currently of fundamental importance.
Considering the results presented in Figure 7, the Red Ocean scenario seems to be the most likely, in which the development factors W(Wp, Wo) for a given link under scenario A balance each other. In this scenario, neither the dominant participation of the state sector nor the community sector can be demonstrated. Changes and their course occur incrementally and are correlated with potentially acceptable social expectations that approve of gradually introduced solutions. On the one hand, they allow for a change in the ownership structure in the energy sector that is acceptable to the state and; on the other hand, they allow for the development of the private energy sector, which makes individual prosumers independent from the supply of monopolies and gives them self-sufficiency in energy. The Red Ocean scenario requires modernization changes within the existing areas, which makes it more secure for the current interests of entities responsible for their development, as well as from the point of view of acceptability of these solutions for Polish citizens, including groups with strong identity ties to non-renewable energy resources. Uncertainty conditioned by the social perspective results from deeply rooted beliefs of some local communities regarding their traditional way of life, including obtaining energy and using it, as well as professions, the persistence of which is not only associated with the source of income, but also family traditions and sometimes symbolism of the region. This applies, for example, to Upper Silesia [73] (pp. 234–236). It must be assumed that the empirical results obtained are conditioned by Poland’s conventional energy sources and the way they are operated and managed [62]. However, it should be noted that the specifics resulting from asset ownership do not prioritize caring for one’s own needs at the expense of other stakeholder groups. This has implications for the new layout of business models [74] (p. 83). Given the inevitable clashes of economic interests, however, the Green Ocean scenario is thus supremely problematic. Moreover, the profound changes it envisages seem to be too radical socially, as they would result in changes in the structure of the labor market and financial burdens that many citizens cannot afford. It is also unlikely that the state will hand over the energy sector to private entities. This sector is one of the basic instruments of state security and economic stability. However, for the respondents, changes of a radical character are a tempting proposition. Their effects, of which they are aware of, would be indicative of both a high level of energy awareness and zero impact on the environment, which would place Poland in the forefront of highly developed countries with significant potential to influence the directions of changes in the climate sphere.
At this point, the problem of Dutch Disease Effects [75] should also be stressed, which could occur in the process of changes in the energy sector in Poland, in the direction of Green Ocean, leaving, in a way, the state sector behind—by reducing competitiveness of energy production. The latter, pushed to peripheral positions, would lose its importance as a security tool in the hands of the state and, moreover, would significantly reduce its role as a major market player. As a result, this could also entail a deterioration in the quality of democratic institutions functioning in Poland, leading to a slowdown in economic growth in other areas [76].
Another uncertainty facing the implementation of the Green Ocean scenario lies in the economic layer related to the costs of transforming existing energy systems borne by low- and average-income citizens. According to Shelleneberger, we cannot expect concern for the climate from people who are not sure about their next day, and it is naive to expect that their behavior, so far embedded in the sphere of energy poverty and underdevelopment, will change to a pro-environmental one without state intervention in the spheres of poverty and unemployment [77]. Such a situation can be observed in Poland, where, according to estimates of the head of Poland’s Centre for Analysis (Rządowe Centrum Analiz), as many as 2.6 million fully employed workers in Poland earn less than 2750 PLN gross per month (€607). This is lower than the minimum wage in 2022, but also lower than that in 2021 [78,79].
The transition to the Green Ocean scenario does not have to mean lowering costs resulting from the domination of the private sector in the long run, as the latter, guided by the goal of profit, will probably strive to maximize it rather than minimize it. On the other hand, it should be remembered that remaining in the sphere of functioning of the Red Ocean also does not necessarily mean stabilization of energy costs. The state sector, which has a dominant position in it, may also take actions aimed at profit maximization. In this case, among the most important buffers against grabbing strategies are strong democratic institutions and a stable legal system [80], which in recent years in some countries of Central and Eastern Europe have been undermined. Their further erosion could lead to a drain on citizens’ wallets and thus pauperization of societies at the expense of their elites.
Considering all of the basic areas of analysis in the discussion according to the STEPE method [33] (pp. 100–108, 122–134, 164–172), the technological aspect should be considered important. The assumption is that it cannot be analyzed without constant reference to cost-effectiveness. Dynamics in the sustained application of modern technological solutions cannot be forecast without the basis of financial viability. The development of space technology may serve as an example of this. Nowadays, it is experiencing an incredible post-Cold War renaissance and exceptional growth simply because of the investment of private capital in the area. The same is true in the area of RES. It must be viable even without state support. This means that only sufficient development of energy storage and transmission links (even on a local basis) will make this profitable for the individual consumer. Currently, due to the periodic nature of renewable energy availability, the individual consumer is dependent on the state and large corporations.
GEC energy consumers—here optimism is demonstrated by almost every group of respondents, as they pointed towards scenario B. However, the question of GES remains—probably noticed the most by green energy producers. However, why are scientists focused on it too? After all, the two motors of green energy development, wind, and sun, are highly dependent on natural cycles—time of day, seasons, and meteorological conditions. The key to the frailty of the system should be sought in this. We do not have enough efficient energy storage, even though some elements may be directed towards green energy—in this link, they point further to traditional sources giving constant power supply or towards nuclear energy. As long as the energy storage link is underdeveloped, the whole system will limp along, relying on traditional energy. Research related to RES systems should focus efforts on storage and then transmission to create new solutions. The question is—why do scientific experts see a high Green Ocean likelihood in this area? What non-battery based solutions can replace such heavy and inefficient solutions?
The analysis presented for discussion is based on the two most important aspects that emerged from the survey.
The first one concerns the expressed evaluations by all respondents (Table 3, Figure 5), indicating a slight predominance of scenario B only in the case of the ESF and EC links. While the predominance of scenario B in the GEC chain is easy to explain—we all experience these favorable changes—it is difficult to explain the choice of GES. Perhaps a detailed analysis, targeting the indications of particular groups of respondents, will clarify this.
The choices of each group of experts (Table 4) are not representative, but due to the wide selection of respondents they allow for a considerable spread of opinions. It is understandable that the experts of the RES group in almost all links pointed to scenario B, and the representatives of state-owned enterprises to scenario A. This is due to the competitive position taken representing the profitability of their own enterprises. These are the two sides where consensus is only reached regarding GES and GEC. Officials and politicians take a position very similar to state entrepreneurs. although they see room for beneficial change for two cells—RES and GEP. In this area, they show similar optimism to the RES expert group. Most puzzling, however, is the pessimism or pragmatism of the scientist group. Their opinion coincides with that of representatives of state-owned enterprises, where the predominance of scenario B is seen only for GES and GEC. While in the case of scientists, pointing to the predominance of scenario in the GEC link is obvious—we are all witnessing the biggest (and so far in Poland) shift towards the DCEM—the same result for GES is puzzling. After all, it is the least evolving link in the system besides power transmission. Could it be that scientists see the greatest potential for change in this very link? It is still the least understood and least determined link by the state factor. In addition, it should be noted that the GES link was the only one all groups indicated as moving toward scenario B.
Additionally noteworthy is the fact that the implementation of both scenarios is in line with the need to build social prosperity through economic and social value creation. Thus, a whole new group of stakeholders involved in both the Red and Green Ocean scenarios—prosumers, green energy producers and consumers—emerges from the research. The intensity and rate of value creation contributing to positive changes in the environment are therefore the result of cooperation between many types of stakeholders: primary stakeholders (creating the value chain) and secondary stakeholders (politicians, local communities, scientists, and energy consumers—businesses and citizens) [81] (pp. 80–89).
To summarize, realizing the European Union’s New Green Deal requires strategic thinking to achieve the unprecedented transformations resulting from climate change in all sectors of the economy within the assumed timeframe.

6. Conclusions

The results obtained were the outcome of the applied methodology. First, our novel approach towards calculating the results of the conducted research and the applied research methodology of the scenario approach deserve special attention. Research was conducted based on scenario analysis rather than scenario planning. This allows the results to be used by a wider audience. This approach also allowed us to define a new dimension of energy sector development by capturing it in the matrix of the four oceans scenario—Black, Grey, Red, and Green—depending on the state’s participation and that of the community sector.
As a result of deductive reasoning, the proposed model allows us to focus on the essential pictures of the future right away. Of course, this has its consequences not only in terms of advantages but also in terms of limitations. It is a model that requires certain experience and knowledge from analysts. The inductive approach at the stage of generating scenarios is probably more transparent [82] but it does not allow taking into account pictures of the future such as the “Black Scenario” in which the political events of this year in Eastern Europe are embedded. One of the “unthinkable” scenarios (Table 2) has become a reality and may have a revolutionary impact on the development of the energy sector (faster and more rapid transition to cleaner energy). The reference in the scenarios to the oceans points to areas of constant fluctuation (waves) and possible rapid change (storms). This does not mean that it does not take into account easily predictable changes [83], but they are not the only determinants building scenarios. The same line of thinking was adopted in not including game theory in this research. Game theory fulfills its role more in scenario or strategic planning [84] than in scenario or strategic analysis itself. The strategies considered would have to involve specific entities in relationships with each other or with nature, and such sets would limit the scope of the analysis. This would lose the essential meaning and advantage of strategic or scenario analysis in the form of a wide range of use and long-term perspective. This study focused on the most possible and currently popular scenarios, Red and Green (Figure 3), evolving according to the “clock of change” in Figure 3. The war in Ukraine has resulted in the Black scenario, which the authors assumed to be “less possible” but still probable. It will probably cause the most radical change in the business model of the energy sector worldwide in the 21st century on a scale similar to that of the oil crisis of the 1970s. The rapidity of change triggered by political-military factors resulting from the decisions of the EU, RF and the US is manifested in the form of a crisis. This crisis forced a reversal of the direction of the “clock of changes” from the diagram presented in Figure 3, causing at the same time the possibility of a very fast (faster than expected and forecasted) transition to the Green scenario, unfortunately through the field outlined by the Black scenario.
The second aspect is the analysis of the system through the lens of the six links of the energy system, which enables the presentation of a business model of the energy system geared towards climate transition. We assumed that this required a CSV approach. It presumes that the essence of building business models/business systems by individual entities constituting ES is based on creating value for primary and secondary stakeholders, while at the same time generating value for the entities. The development of isolated ones indicates the realization of the Red Ocean scenario.
In analyzing the experts’ assessment of the various links, the most surprising and puzzling finding was the conservative preference of the scientific experts for the Red Ocean scenario. Green Ocean was indicated only by consumer and storage links. The scientists’ approach probably demonstrates their most rational one among all expert groups to assessing the development of the energy system in Poland. However, the same group of experts pointing to two RES and GES links as elements of the Green Ocean scenario may, according to us, indicate not only the greatest uncertainty in these areas but the lack of knowledge of methods that would allow such a high level of uncertainty to be reduced. This, in turn, suggests that there is an urgent and important need to propose a methodology or scenario approach such as ours.
Conclusions resulting from the content presented above, due to the lack of publications dealing with the analyzed issues in the approach adopted by us, encourage reflections on the methodology of their development and the possibilities of their application for subsequent analyses carried out in the future. It is therefore worth considering them in terms of utilitarian values for further scientific work and their usefulness for decision-making processes.

Author Contributions

Conceptualization, R.W., T.K., P.D. and A.N.-K.; data curation, R.W. and A.N.-K.; formal analysis, R.W. and A.N.-K.; investigation, T.K. and P.D.; methodology, R.W., P.D. and A.N.-K.; project administration, A.N.-K.; resources, A.N.-K. and R.W.; supervision, T.K. and P.D.; validation, T.K. and P.D.; visualization, R.W.; writing—original draft, R.W., T.K., P.D. and A.N.-K.; writing—review and editing, R.W., T.K., P.D. and A.N.-K. All authors have read and agreed to the published version of the manuscript.

Funding

This article was funded by research funds from: University of Economics and Human Sciences in Warsaw: AEH2022A1; General Tadeusz Kosciuszko Military University of Land Forces: II.2.7/216; War Studies University: II.2.7/216.

Institutional Review Board Statement

Not applicable.

Informed Consent Statement

Not applicable.

Data Availability Statement

Not applicable.

Conflicts of Interest

The authors declare no conflict of interest.

Abbreviations

The following abbreviations are used in this manuscript:
EU [UE]European Union
ES [ZE]energy sources
EP [PE]energy producers
TNI [SP]transmission networks with infrastructure
ESF [ME]energy storage facilities
ESM [ZSE]energy systems management
EC [OE]energy consumers
PES [SEP]Poland’s energy system
ES [SE]energy system
EGDEuropean Green Deal
RES [OZE]renewable energy sources
RFRussian Federation
LP [PEL]local producers
IP [PEO]individual producers
GEP [ZPE]green energy producers
GES [ZME]green energy storage
IESM [IZSE]Intelligent energy systems management
GEC [ZOE]green energy consumers (individual and collective)
DCEM [MRELO]Distributed Community Energy Model
CSVcreating shared value

References and Notes

  1. Streimikiene, D. Assessment of Progress Towards 20-20-20: Targets: Evidence from Baltic States. Contemp. Econ. 2022, 16, 135–136. [Google Scholar] [CrossRef]
  2. Haigh, N. Scenario Planning for Climate Change, A Guide for Strategists, 1st ed.; Routledge: London, UK, 2019; ISBN 9781138498402. [Google Scholar]
  3. Sadik-Zada, E.R.; Gatto, A. Energy Security Pathways in South East Europe: Diversification of the Natural Gas Supplies, Energy Transition, and Energy Futures. In From Economic to Energy Transition: Three Decades of Transitions in Central and Eastern Europe; Mišík, M., Oravcová, V., Eds.; Palgrave Macmilan: Cham, Switzerland, 2021; ISBN 978-3-030-55084-4. [Google Scholar]
  4. Ajchel, M. Potrzebny Jest Nowy Model Energetyki [A New Energy Model Is Needed]. 2016. Available online: https://ceo.com.pl/potrzebny-jest-nowy-model-energetyki-62818 (accessed on 14 July 2021).
  5. Ruszel, M. Rola surowców energetycznych w procesie produkcji energii elektrycznej w UE do 2050 roku [The role of energy raw materials in the process of electricity production in the EU until 2050]. Polityka Energetyczna Energy Policy J. 2017, 20, 5–15. [Google Scholar]
  6. Horzela, I.; Gromadzki, S.; Gryz, J.; Kownacki, T.; Nowakowska-Krystman, A.; Piotrowska-Trybull, M.; Wisniewski, R. Energy Portfolio of the Eastern Poland Macroregion in the European Union. Energies 2021, 14, 8426. [Google Scholar] [CrossRef]
  7. Conditions defined as part of the work of the expert panel “New Model of the Energy System in Poland”. During the meetings (Q2-Q32021), the Brainstorming Technique and the Delphi Method were used. Unpublished material.
  8. Kim, W.C.; Mauborgne, R. Blue Ocean Strategy. How to Create Uncontested Market Space and Make the Competition Irrelevant; Harvard Business Review Press: Boston, MA, USA, 2015; ISBN 978-1625274496. [Google Scholar]
  9. Porter, M.E.; Kramer, M. Creating Shared Value. Harvard Business Review. 2011, pp. 62–77. Available online: https://hbr.org/2011/01/the-big-idea-creating-shared-value (accessed on 24 January 2022).
  10. Porter, M.E.; Kramer, M.R. Strategy and Society: The Link Between Competitive Advantage and Corporate Social Responsibility. Harvard Business Review. December 2006, pp. 76–93. Available online: https://hbr.org/2006/12/strategy-and-society-the-link-between-competitive-advantage-and-corporate-social-responsibility (accessed on 31 January 2022).
  11. Brown, B.B. Delphi Process: A Methodology Used for the Elicitation of Opinions of Experts; Document No: P-3925; RAND: Santa Monica, CA, USA, 1968; 15p. [Google Scholar]
  12. Rowe, G.; Wright, G. Expert Opinions in Forecasting. Role of the Delphi Technique. In Principles of Forecasting: A Handbook of Researchers and Practitioners; Armstrong, J.S., Ed.; Kluwer Academic Publishers: Boston, MA, USA, 2001. [Google Scholar]
  13. Seker, S.E.; Sadi, E. Computerized Argument Delphi Technique. IEEE Access 2015, 3, 368–380. [Google Scholar] [CrossRef]
  14. Turoff, M.; Hiltz, S.R. Computer-based Delphi processes. In Gazing into the Oracle, The Delphi Method and Its Application to Social Policy and Public Health; Adler, M., Ziglio, E., Eds.; Jessica Kingsley Publishers: London, UK, 1996. [Google Scholar]
  15. Kahn, H. The Next Two Hundred Years: A Scenario for America and the World; William Morrow & Company: New York, NY, USA, 1976; ISBN 0688080294. [Google Scholar]
  16. Kahn, H.; Weiner, A.J. The Year 2000: A Framework for Speculation on the Next Thirty-Three Years; Macmillan: New York, NY, USA, 1967; ISBN 978-0025604407. [Google Scholar]
  17. National Intelligence Council. Global Trends 2040. More Contested World. NIC 2021-02339; March 2021. Available online: https://www.dni.gov/files/ODNI/documents/assessments/GlobalTrends_2040.pdf (accessed on 4 January 2022).
  18. National Intelligence Council. Global Trends. Paradox of Progress. NIC 2017-001; January 2017. Available online: https://www.dni.gov/files/documents/nic/GT-Full-Report.pdf (accessed on 4 January 2022).
  19. Polski Sektor Energetyczny 2050. 4 Scenariusze [Polish Energy Sector 2050. 4 Scenarios]. September 2017. Available online: https://forum-energii.eu/pl/analizy/polska-energetyka-2050-4-scenariusze (accessed on 10 January 2022).
  20. Daniluk, P.; Wyligała, H. Analiza Zagrożeń Sektorowych dla Bezpieczeństwa [Analysis of Sectoral Threats to Security]; Diffin: Warsaw, Poland, 2021; pp. 76–101. ISBN 978-83-66491-37-3. [Google Scholar]
  21. Mintzberg, H. The Fall and Rise of Strategic Planning. Harvard Business Review. January 1994. Available online: https://www.theisrm.org/documents/Mintzberg (accessed on 31 January 2022).
  22. Ringland, G. Scenario Planning. Managing for the Future, 2nd ed.; John Wiley & Sons: Chichester, UK, 2006; pp. 13–14. ISBN 978-0-470-01881-1. [Google Scholar]
  23. Van der Heijden, K. Scenarios. The Art of Strategic Conversation; John Wiley & Sons: Chichester, UK, 2005; pp. 21–41. ISBN 0-470-02368-6. [Google Scholar]
  24. Ralston, B.; Wilson, I. The Scenario-Planning Handbook: Developing Strategies in Uncertain Times; Thomson South-Western: Mason, OH, USA, 2006; pp. 15–16. ISBN 978-0-324-31285-0. [Google Scholar]
  25. Daniluk, P. Strategic Analysis of Energy Security. Methodological Aspects of the Scenario Approach. Energies 2021, 14, 4639. [Google Scholar] [CrossRef]
  26. Meadows, D.H.; Meadows, D.L.; Randers, J.; Behrens, W.W. The Limits to Growth: A Report for the Club of Rome’s Project on the Predicament of Mankind; A Potomac Associates Book; Universe Books: New York, NY, USA, 1972. [Google Scholar]
  27. Tsoukas, H.; Mavros, G.D. Complex Knowledge: Studies in Organizational Epistemology; Oxford University Press: Oxford, UK, 2005; pp. 52–56. [Google Scholar]
  28. Godet, M. Creating Futures. Scenario Planning as a Strategic Management Tool, 2nd ed.; Economica: London, UK, 2006; pp. 262–266. ISBN 2-7178-5244-1. [Google Scholar]
  29. Khazaei, A.; Elliot, S.; Joppe, M. An application of stakeholder theory to advance community participation in tourism planning: The case for engaging immigrants as fringe stakeholders. J. Sustain. Tour. 2015, 23, 1049–1062. [Google Scholar] [CrossRef]
  30. Paliwoda-Matiolańska, A. Teoria interesariuszy w procesie zarządzania współczesnym przedsiębiorstwem [Stakeholder theory in the management process of the modern enterprise]. In Wspólna Europa. Zrównoważony Rozwój Przedsiębiorstwa a Relacje z Interesariuszami [A Common Europe. Corporate Sustainability and Stakeholder Relations]; Burdulak, H., Gołębiowski, T., Eds.; SGH: Warsaw, Poland, 2005; p. 241. ISBN 83-7378-173-0. [Google Scholar]
  31. Enduring Ideas: The Business System. McKinsey Quarterly. 1 June 2009. Available online: https://www.mckinsey.com/business-functions/strategy-and-corporate-finance/our-insights/enduring-ideas-the-business-system (accessed on 31 January 2022).
  32. Kramer, M. CSR vs. CSV—What’s the Difference? FSG Creating Shared Value Blog. Available online: http://www.fsg.org/KnowledgeExchange/Blogs/CreatingSharedValue/PostID/66.aspx (accessed on 18 February 2022).
  33. Schwartz, P. The Art of the Long View, Planning for the Future in an Uncertain World, 1st ed.; Currency Doubleday: New York, NY, USA, 1991; pp. 100–172. ISBN 0-385-26732-0. [Google Scholar]
  34. Buzan, B.; Waever, O.; Wild, J. Security: A New Framework for Analysis; Lynne Rienner: London, UK, 1998; ISBN 978-1-55587-2. [Google Scholar]
  35. Wilkinson, A.; Kupers, R. The Essence of Scenarios: Learning from the Shell Experience; Amsterdam University Press: Amsterdam, The Netherlands, 2014; pp. 25–50. ISBN 978-90-8964-594-4. [Google Scholar]
  36. The scenario typology problem has been addressed many times, as exemplified by Van Notten, P.W.F.; Rotmans, J.; van Asselt, M.B.A.; Rothman, D.S. An updated scenario typology. Futures 2003, 35, 424–443. [Google Scholar]
  37. Ducot, C.; Lubben, G.J. A typology for Scenarios. Futures 1980, 12, 51–57. [Google Scholar] [CrossRef]
  38. The Mont Fleur Scenarios. What Will South Africa Be like in the Year 2002. Deeper News 1992, 7, 1. Available online: https://reospartners.com/wp-content/uploads/old/Mont%20Fleur.pdf (accessed on 10 January 2022).
  39. Mention, A.-L.; Ferreira, J.J.P.; Torkkeli, M. Moonshot innovations: Wishful Thinking or Business-As-Usual? J. Innov. Manag. 2019, 1–6. [Google Scholar] [CrossRef]
  40. Guizzo, E.; Teller, A. Captain of Moonshots at X, on the Future of AI, Robots, and Coffeemakers. The Head of Alphabet’s Innovation Lab Talks about Its Latest “Moonshot” Projects. IEEE Spectrum. 8 December 2016. Available online: https://spectrum.ieee.org/astro-teller-captain-of-moonshots-at-x (accessed on 4 December 2021).
  41. Jordan, J.W. Kennedy’s Romantic Moon and Its Rhetorical Legacy for Space Exploration. Rhetor. Public Aff. 2003, 6, 209–231. Available online: https://www.jfklibrary.org/asset-viewer/archives/JFKPOF/040/JFKPOF-040-001 (accessed on 26 November 2021). [CrossRef]
  42. Chermack, T.J. Scenario Planning in Organizations: How to Create, Use, and Assess Scenarios; Berrett-Koehler Publishers: Oakland, CA, USA, 2011; p. 144. ISBN 978-1-60509-413-7. [Google Scholar]
  43. National Intelligence Council. Mapping the Global Future. Report of the National Intelligence Council’s 2020 Project. NIC 2004-13; December 2004; p. 22. Available online: https://www.dni.gov/files/documents/Global%20Trends_Mapping%20the%20Global%20Future%202020%20Project.pdf (accessed on 26 January 2022).
  44. Energy Regulatory Office (ERO). Available online: https://www.ure.gov.pl (accessed on 24 November 2021).
  45. Musk, E. This Is Why We Have to Build Civilizations in Space. CNBS. 26 June 2018. Available online: https://www.cnbc.com/2018/06/26/elon-musk-on-twitter-why-we-have-to-build-civilizations-in-space.html (accessed on 24 January 2022).
  46. European Commission. Communication from the Commission. The European Green Deal. 2019. Available online: https://eur-lex.europa.eu/legal-content/EN/TXT/?qid=1576150542719&uri=COM%3A2019%3A640%3AFIN (accessed on 24 November 2021).
  47. Świrski, K. Rynek Mocy Krok po Kroku [Energy Market Step-by-Step]. Proste Wyjaśnienie dla Niewtajemniczonych—O Co chodzi w Rynku Mocy [A Simple Explanation for the Uninitiated—What the Power Market Is all about]. 2017. Available online: http://konradswirski.blog.tt.com.pl/rynek-mocy-krok-po-kroku-proste-wyjasnienie-dla-niewtajemniczonych-o-co-chodzi-w-rynku-mocy/ (accessed on 24 November 2021).
  48. Statistics Poland (GUS). Energy from Renewable Sources in 2020. 2022. Available online: https://stat.gov.pl/download/gfx/portalinformacyjny/en/defaultaktualnosci/3304/3/13/1/energy_from_renewable_sources_in_2020.pdf (accessed on 30 January 2022).
  49. OSD (Operator Systemu Dystrybucyjnego)—Dystrybutorzy prądu. Available online: https://enerad.pl/prad/osd-dystrybutorzy (accessed on 24 November 2021).
  50. Chmura, A. Economic determinants of Poland’s energy industry development in the national security system. Obron. Zesz. Nauk. Wydziału Zarządzania Dowodzenia Akad. Szt. Wojennej 2018, 3, 20. [Google Scholar]
  51. Polityka energetyczna Polski do 2030 roku [Energy Policy of Poland until 2030]: Załącznik do Uchwały nr 202/2009 Rady Ministrów z Dnia 10 Listopada 2009 r [Annex to Resolution No. 202/2009 of the Council of Ministers of 10 November 2009]; Ministerstwo Gospodarki [Ministry of Economy]: Warsaw, Poland, 2009.
  52. Ministry of Climate and Environment. Energy Policy of Poland until 2040, Warsaw, Poland. 2021. Available online: https://www.gov.pl/web/klimat/polityka-energetyczna-polski (accessed on 1 June 2021).
  53. Maśloch, G. Uwarunkowania i Kierunki Rozwoju Energetyki Odnawialnej w Polsce [Conditions and Directions of Renewable Energy Development in Poland]; Oficyna Wydawnicza SGH: Warsaw, Poland, 2018; ISBN 978-83-8030-270-9. [Google Scholar]
  54. Lach, Z. (Ed.) Bezpieczeństwo Energetyczne Wyzwaniem XXI Wieku [Energy Security: The challenge of the 21st Century]; AON: Warsaw, Poland, 2013. [Google Scholar]
  55. Gałecki, A.; Bolewski, A. (Eds.) Bezpieczeństwo Energetyczne Wyzwaniem XXI Wieku [Energy Security: The Challenge of the 21st Century]; Wyższa Szkoła Bezpieczeństwa: Poznań, Poland, 2020; ISBN 978-83-65096-64-7. [Google Scholar]
  56. Bednarczyk, J.L.; Brzozowska-Rup, K.; Luścińki, S. Determinants of the Energy Development Based on Renewable Energy Sources in Poland. Energies 2021, 14, 6762. [Google Scholar] [CrossRef]
  57. Top 10 Energy Industry Trends & Innovations in 2022. Available online: http//www.startus-insights.com/innovators-guide/top-10-energy-industry-trends-innovations-in-2021/ (accessed on 29 January 2022).
  58. Zononi, A.B. Strategic Analysis, Proceses and Tools; Routledge: London, UK, 2011; ISBN 10: 0415880637. [Google Scholar]
  59. Keehnen, E. Grey Ocean Strategy: Agewise Marketing for the Mature Consumer, 1st ed.; Stili Novi Publishing: Utrecht, The Netherlands, 2015; ISBN 978-9078094692. [Google Scholar]
  60. Such actions can be included in the matrix of three competitive strategies defined in: Porter, M. Competitive Strategy. Techniques for Analysing Industries and Competitors; Free Press: New York, NY, USA; Maxwell Macmillan: Toronto, ON, Canada, 1980; ISBN 0029253608. [Google Scholar]
  61. Kownacki, T.; Wiśniewski, R. Społeczeństwo w Smart City [Society in the Smart City]; Wyd. Akademii Ekonomiczno-Humanistycznej: Warsaw, Poland, 2020; ISBN 978-83-66552-34-0. [Google Scholar]
  62. Wang, Y.; Krakover, S. Destination marketing: Competition, cooperation or coopetition? Int. J. Hosp. Manag. 2008, 20, 126–141. [Google Scholar] [CrossRef]
  63. Bengtsson, M.; Kock, S. Coopetition in Business Networks: To Cooperate and Compete Simultaneously. Ind. Mark. Manag. 2000, 29, 411–426. [Google Scholar] [CrossRef]
  64. Zineldin, M. Co-opetition: The Organisation of the Future. Mark. Intell. Plan. 2004, 22, 782. [Google Scholar] [CrossRef]
  65. Żuber, R. (Ed.) Zarządzanie Innowacjami w Przedsiębiorstwie: Wybrane Aspekty [Innovation Management in the Enterprise. Selected Aspects]; Difin: Warsaw, Poland, 2016; ISBN 9788380851566. [Google Scholar]
  66. What Is NPS? Your Ultimate Guide to Net Promoter Score. Available online: https://www.qualtrics.com/experience-management/customer/net-promoter-score/ (accessed on 30 December 2021).
  67. Dalhsrud, A. How Corporate Social Responsibility is Defined: An Analysis of 37 Definitions. Corp. Soc. Responsib. Environ. Manag. 2006, 15, 1–13. [Google Scholar] [CrossRef]
  68. Baumgartner, R. Tools for sustainable business management. In Ecosystems and Sustainable Development IV; Tiezzi, E., Brebbia, C.A., Usao, J.L., Eds.; WIT Press: Southampton, UK, 2003; pp. 187–196. ISBN 1-85312-974-7. [Google Scholar]
  69. Hart, S.L.; Milstein, M.B. Creating sustainable value. Acad. Manag. Perspect. 2003, 17. [Google Scholar] [CrossRef]
  70. Deloitte. 2030 Purpose: Good Business and a Better Future. Connecting Sustainable Development with Enduring Commercial Success. Available online: https://www2.deloitte.com/global/en/pages/about-deloitte/articles/purpose-2030-good-business-better-future.html (accessed on 24 January 2022).
  71. Garvare, R.; Johansson, P. Management for sustainability—A stakeholder Theory. Total Qual. Manag. Bus. Excell. 2010, 21, 737–744. [Google Scholar] [CrossRef]
  72. Sasin: Być Może Trzeba Będzie Wypowiedzieć Pakiet Klimatyczny [Sasin: Climate Package May Have to Be Terminated]. Business Insider Polska. 13 January 2022. Available online: https://businessinsider.com.pl/gospodarka/sasin-byc-moze-trzeba-bedzie-wypowiedziec-pakiet-klimatyczny/9ny8n08 (accessed on 14 January 2022).
  73. Trembaczowski, Ł. Socjologiczne aspekty badań górnictwa węgla kamiennego [Sociological aspects of coal mining research]. In Jakość Pracy a Stan Więzi Społecznych; Trembaczowski, Ł., Ed.; Uniwersytet Śląski: Katowice, Poland, 2020; pp. 223–251. Available online: https://rebus.us.edu.pl/bitstream/20.500.12128/18506/1/Trembaczowski_socjologiczne_aspekty_badan_gornictwa.pdf (accessed on 15 January 2022)ISBN 978-83-226-3947-4. [CrossRef]
  74. Freeman, R.E.; McVea, J. A stakeholder approach to strategic management. In Handbook of Strategic Management; Hitt, M.A., Freeman, R.E., Harrison, J.S., Eds.; Blackwell Publishing: Oxford, UK, 2011; p. 32. ISBN 0-631-21860-2. [Google Scholar]
  75. Niftiyev, I. Dutch Disease Effects in the Azerbaijan Economy: Results of Multivariate Linear Ordinary Least Squares (OLS) Estimations. HSE Econ. J. Natl. Res. Univ. High. Sch. Econ. 2021, 25, 309–346. Available online: https://ideas.repec.org/a/hig/ecohse/202126.html (accessed on 21 March 2022). [CrossRef]
  76. Niftiyev, I. A comparison of institutional quality in the South Caucasus: Focus on Azerbaijan. In Proceedings of the European Union’s Contention in the Reshaping Global Economy; Juhász, J., Ed.; University of Szeged, Faculty of Economics and Business Administration, Doctoral School in Economics: Szeged, Hungary, 2022; pp. 146–175, ISBN 978-963-306-852-6. Available online: https://www.econstor.eu/bitstream/10419/251193/1/Niftiyev_2022.pdf (accessed on 21 March 2022).
  77. Shellebergen, M. Apokalipsy nie Będzie! Dlaczego Klimatyczny Alarmizm Szkodzi nam Wszystkim [Apocalypse Never: Why Environmental Alarmism Hurts Us All]; CiS: Stare Gruszki, Poland, 2021; ISBN 9788361710370. [Google Scholar]
  78. Ceglarz, J. Rząd Pokazał, Jak w Rzeczywistości Zarabiają Polacy. Przy Okazji Obnażył Bolesną Prawdę [The Government Has Revealed What Polish Workers Actually Earn. In the Process, it Exposed a Painful Truth]. Available online: https://businessinsider.com.pl/gospodarka/rzad-pokazal-jak-naprawde-zarabiaja-polacy-26-mln-ponizej-placy-minimalnej/eslhc1q (accessed on 15 January 2022).
  79. Energy Poverty. Available online: https://ec.europa.eu/energy/eu-buildings-factsheets-topics-tree/energy-poverty (accessed on 5 February 2022).
  80. Sadik-Zada, E.R.; Loewenstein, W. A Note on Revenue Distribution Patterns and Rent-Seeking Incentive. Int. J. Energy Econ. Policy 2018, 8, 196–204. Available online: https://zbw.eu/econis-archiv/bitstream/11159/2234/1/1024752283.pdf (accessed on 21 March 2022).
  81. Kramer, M.; Pfitzer, M.W. The Ecosystem of Shared Value. Harvard Business Review. October 2016, pp. 80–89. Available online: https://hbr.org/2016/10/the-ecosystem-of-shared-value (accessed on 20 January 2022).
  82. Jägemann, C.; Fürsch, M.; Hagspiel, S.; Nagl, S. Decarbonizing Europe’s Power Sector by 2050—Analyzing the Implications of Alternative Decarbonization Pathways. EWI Working Paper. 2021, pp. 10–14. Available online: https://www.ewi.uni-koeln.de/cms/wp-content/uploads/2015/12/EWI_WP_12-13_Decarbonizing_Europes_Power_Sector.pdf (accessed on 21 March 2022).
  83. Peng, X.; Tao, X.; Feng, K.; Hubacek, K. Drivers toward a Low-Carbon Electricity System in China’s Provinces. Environ. Sci. Technol. 2020, 54, 5774–5782. [Google Scholar] [CrossRef] [PubMed]
  84. Sadik-Zada, E.R. Distributional Bargaining and the Speed of Structural Change in the Petroleum Exporting Labor Surplus Economies. Eur. J. Dev. Res. 2020, 32, 51–98. [Google Scholar] [CrossRef]
Figure 1. PES business model. Source: own study.
Energies 15 02962 g001
Figure 2. PES links in the Grey Ocean and Green Ocean scenarios. Source: own study.
Energies 15 02962 g002
Figure 3. Four-ocean PES scenario matrix. Source: own study.
Energies 15 02962 g003
Figure 4. Aggregated expert opinions—assessment of the likelihood of a scenario (first item). Source: own calculation. Red color means the Red Ocean—Scenario A. Green color means the Green Ocean—Scenario B.
Energies 15 02962 g004
Figure 5. Aggregated expert opinions—indicating only one scenario (second item). Source: own calculation. Red color means the Red Ocean—Scenario A. Green color means the Green Ocean—Scenario B.
Energies 15 02962 g005
Figure 6. Visualization of development factor coordinates for the Red Ocean and the Green Ocean. Source: own calculation. The designations O, E, B and C are as shown in Figure 3.
Energies 15 02962 g006
Figure 7. Visualization of development paths: vector OA and vector OF. Source: own calculation. The designations O, E, A, B, F and C are as shown in Figure 3.
Energies 15 02962 g007
Table 1. A scenario model based on four fields of the projected future for the energy sector. Source: own study.
Slow Changes in the Global Environment (More Imaginable for Analysts and Experts)Rapid, Abrupt Changes in the Global Environment (Difficult to Imagine for Analysts and Experts)
Two basic scenarios—imaginable and possibleThe ‘traditional’ scenario or the forward-looking view
RED SCENARIO
The “breakthrough” scenario, which describes the backward-looking view
GREEN SCENARIO
Two scenarios possible—unimaginable but possibleStagnation scenario
GREY SCENARIO
Global crisis, catastrophe, war scenario
BLACK SCENARIO
Table 2. Development of PES links in each scenario.
PES LinksDescription of Link DevelopmentWeight
Scales (1–3)
Description of Link DevelopmentWeight Scales
(1–3)
Grey Ocean Scenario
Strong State/Weak Distributed
Red Ocean Scenario
Strong State/Strong Distributed
ES/RES1Investing in the development of conventional sources3Generating new investment in renewables3
2Sustaining the development of renewable sources 2Investing in the development of renewables in the community sector3
EP/GEP1Investing in baseload power plants3Restructuring and investing in baseload power plants 3
2Sustaining investment in the renewable energy producer sector2Investing in renewable energy producers3
TNI/TNI1Development of transmission networks and infrastructure, according to needs3Modernization of existing and construction of new transmission networks and infrastructure 3
2Limited development of opportunities to connect new entities to the transmission network1Development and creation of new opportunities to connect new entities to the transmission network3
ESF/GES1Modernization and creation of new storage facilities3Creation of new storage facilities and increasing storage capacity3
2Development of local storage2Development of local medium and large capacity storage3
ESM/IESM1Modernization of the transmission network and energy infrastructure management system3Creation of a smart transmission grid and energy infrastructure management system3
2Lack of smart management of the whole system taking into account the renewable component1Development of smart management of the whole system taking into account the renewable component3
EC/GEC1Decreasing dependence on baseload energy supply, increasing consumer commitment3Low dependence on baseload energy supply, high consumer commitment and awareness of their role in the system3
2Consumers who understand their position and role in the renewable energy space2Consumers with a high level of awareness and role in the energy system in the area of renewable energy 3
System linksBlack Ocean Scenario
Weak State/Weak Distributed
Green Ocean Scenario
Weak State/Strong Distributed
ES/RES1ES(BO)—Insecurity of energy supply from conventional sources2Investing in modern technologies related to energy sources1
2Underinvestment in renewables 1Systemic investment in renewable development in the community sector3
EP/GEP1Insecurity of energy supply from conventional sources2Limited investment in baseload power plants2
2Limited funding for renewable energy producers 1Systemic commitment and investment by renewable energy producers3
TNI/TNI1Transmission networks and infrastructure not fit for purpose1Modernization of transmission networks and infrastructure according to the new model2
2Impossibility of connecting new entities to the transmission network1Creating new solutions related to the construction of transmission networks and connecting new entities to them3
ESF/GES1Sustaining existing system storage capacity1Creating storage used for balancing and security purposes 2
2No local storage1Storage with demand-driven capacity built by all energy consumers3
ESM/IESM1Outdated grid and energy infrastructure management system1Smart grid and energy infrastructure management system used for balancing and security purposes2
2Lack of system management that takes renewables into account1Smart grid system takes over the whole management system 3
EC/GEC1Customers dependent on baseload energy supply, uncommitted and passive 1Consumers who are committed, active, and aware of their role and importance in the energy system2
2Consumers uncommitted and passive regarding renewables1Committed and active recipients with a very high level of awareness regarding renewables3
Source: own study based on [50,51,52,53,54,55,56,57].
Table 3. Aggregated expert opinions.
System LinksMean *
X ¯ i
Scenario (First Item)Scenario (Second Item)Probability of Scenario (Second Item)
A
%
B
%
A
NPS® **
B
NPS® **
A
%
B
%
123456789
ES/RES4.6A ***70300−107370
EP/GEP4.7A5545−33−206570
TNI/TNI4.2A6733−32−726661
ESF/GES5.6B ****5248−59−195772
ESM/IESM4.3A6733−50−465657
EC/GEC5.8B3961−62−155570
* From expert opinion—reference level: 5.0. ** NPS—Net Promoter Score is calculated based on responses and takes a value from −100 to 100. Source: own calculation. ***—red color means the Red Ocean—Scenario A. ****—green color means the Green Ocean—Scenario B.
Table 4. Distribution of expert opinions.
PES LinksMean *Scenario (First Item)Scenario (Second Item)Likelihood (Second Item)
A [%]B [%]A [%]B [%]
1234567
Experts: scientists
ES/RES4.3A **78227060
EP/GEP4.0A78226180
TNI/TNI4.0A78227360
ESF/GES5.4B ***67334873
ESM/IESM4.2A89115210
EC/GEC5.2B67334667
Experts: local and central government officials, politicians
ES/RES5.2B50507570
EP/GEP6.2B37636368
TNI/TNI4.9A50504562
ESF/GES5.9B50505282
ESM/IESM5.0AB50504565
EC/GEC4.9A50505260
Experts: managers of state-owned companies
ES/RES4.3A89117180
EP/GEP4.5A44567070
TNI/TNI3.7A89117160
ESF/GES5.7B56447077
ESM/IESM4.2A67337263
EC/GEC6.9B22787078
Experts: producers of green energy and green storage/infrastructure
ES/RES5.9B25757568
EP/GEP5.6B50505780
TNI/TNI5.0AB33676358
ESF/GES6.4B33675668
ESM/IESM4.9A50505562
EC/GEC6.6B25754566
*—arithmetic mean. **—red color means the Red Ocean—Scenario A. ***—green color means the Green Ocean—Scenario B. Source: own calculation.
Table 5. PES development path—coordinates of development factors for the Red Ocean and the Green Ocean.
PES LinksRed Ocean
(j = 3)
Green Ocean
(j = 4)
W ( W p , W o ) i j
W p i j W o i j W p i j W o i j
ES/RES (i = 1)13.813.84.613.8
EP/GEP (i = 2)14.114.19.414.1
TNI/TNI (i = 3)12.612.68.412.6
ESF/GES (i = 4)16.816.811.216.8
ESM/IESM (i = 5)12.912.98.612.9
EC/GEC (i = 6)17.417.411.617.4
Source: own calculation.
Publisher’s Note: MDPI stays neutral with regard to jurisdictional claims in published maps and institutional affiliations.

