Article

Impact Analysis of a National and Corporate Carbon Emission Reduction Target on Renewable Electricity Use: A Review

International Research Division, Chung-Hua Institution for Economic Research (CIER), Taipei 10672, Taiwan
*
Author to whom correspondence should be addressed.
Energies 2022, 15(5), 1794; https://doi.org/10.3390/en15051794
Submission received: 5 January 2022 / Revised: 10 February 2022 / Accepted: 16 February 2022 / Published: 28 February 2022
(This article belongs to the Special Issue Green Energy Economies)

Abstract

:
The Paris Agreement requires countries to propose their National Determined Contributions (NDCs) and encourages companies to engage in climate action. This two-stage study explores the mutual influence of national and corporate carbon reduction targets and their effect on the adoption of renewable energy using Hierarchical Linear Modeling (HLM). The subjects are companies nested in the G20, engaging in the Science-Based Target initiative (SBTi) or the RE100 initiative. These empirical results show corporate targets are positively correlated to adoption of renewable energy, and development of renewable energy varies by country groups, however; national targets are insignificantly correlated. Our key findings: (1) companies which set SBTs are more willing to use renewable energy to achieve their targets but prefer power purchase agreements (PPAs) and renewable energy certificates (RECs) to investment in renewables. (2) The effect of a national-level target on corporate renewable energy use is non-significant, probably because most multinational corporations are used to compliance and their performances are likely to be better than the national deployment on climate change. We argue that an industrial energy transition to renewables is economically beneficial and needs substantial support in the form of policies or subsidies, instead of just setting targets or attracting publicity.

1. Introduction

Climate change has become one of the most crucial issues affecting human survival and has resulted in action to prevent a major crisis, including mitigation and adaption. The aim of mitigation is to fundamentally lessen the impacts of climate change. For example, technologies associated with energy efficiency and renewable energy have been developed to reduce greenhouse gas (GHG) emissions. However, the goal of overcoming the global challenges posed by climate change will remain elusive through the endeavors of a single country or area and is feasible only through worldwide collaboration. To this end, reliance has to be placed on an effective global governance mechanism [1], under which governments, companies and the public are encouraged to actively take measures to reduce carbon emissions, for example through investment and the adoption of renewable energy.
The concept of global governance originates from public issues related to globalization and its associated management mechanism [2,3,4,5]. Conventionally, the discussions and solutions in relation to climate change have been jointly steered by the governments of major countries, and the international community has also addressed the global issues on the basis of legitimacy, as shown in the Montreal Protocol, a treaty to protect the ozone layer, and the Kyoto Protocol, which was aimed at mitigating global warming. However, the conflicts of interest between developed and developing countries have resulted in their lack of a consensus regarding the implementation of environmental policies, and the realization of environmental goals under the international legal framework has become a protracted process. Therefore, in order to resolve the above-mentioned predicaments, the concept and framework of global governance has gradually been revived in recent years. The decision-makers with regard to environmental issues were originally composed of states and international organizations, but now include local governments, companies and non-governmental organizations (NGOs) [3,6]. Compared to the collaborative partnerships at the state level, while the initiatives of NGOs and others have not been mandatory, they are still authoritative in relation to public issues. They have also helped establish common standards, have promoted international discussion, and have further led to the implementation of related solutions [7,8].
As part of the Paris Agreement, parties reached a consensus on limiting carbon emissions to keep global warming well below 2 °C and on mitigating the impact of global climate risk [9]. Moreover, since 2020, more than 100 countries have announced targets of net-zero emissions and have expressed their resilience to climate change in order to make a transition to a low-carbon economy [10]. The Paris Agreement has resulted in new multilateral climate action, which incorporates the concept of global governance. The climate action not only includes national commitments, but also places an emphasis on non-state actors [11]. The non-state actors are wide-ranging and include both organizations and individuals. According to the Oslo Principle, companies, as the basic participants in a country’s economy, have the ability and obligation to reduce carbon emissions and mitigate climate change. Taebi and Safari (2017) also argue that multinational corporations (MNCs) have a great influence on the mitigation of carbon emissions in a country. However, it would be difficult for a government to mandate companies to take action by law. It is more feasible to offer incentives or put social pressure on companies to make them reduce their emissions [12,13]. This also implies the close interaction and correlation between countries and companies regarding climate change issues.
Under the framework of the Paris Agreement, countries are required to submit Nationally Determined Contributions (NDCs), the goals set to limit global warming by countries depending on their respective capabilities. The NDCs are to be reviewed every five years. In addition, in response to the international trend and the impact of climate risk, more and more companies have committed themselves to climate action and have shifted towards a low-carbon and sustainable commercial model. Since the corporate carbon reduction outcomes are taken into account in the overall national carbon reduction plan, the government encourages the private sector to commit to carbon reduction and to treat the adoption of renewable energy as a priority through legal mandates and policy incentives [14]. Corporate carbon reduction action is related to a whole host of factors, such as government policy, the social environment and their own risk. In particular, the adoption of renewable electricity by companies is dependent not only on their operations and financial conditions, but also on national renewable energy policies [15,16]. Thus, this study hypothesizes that the corporate and national carbon reduction actions are part of a nested structure. The targets of national carbon reduction and corporate carbon reduction are correlated, and the variables at the national level might have an interaction effect on the corporate decision to adopt renewable electricity.
This study focuses on the companies within the Group of Twenty (G20), which voluntarily engage in climate action, and analyzes what drives them to adopt renewable electricity. This study includes two stages. The objective in stage I is to evaluate the effect of corporate carbon reduction targets on their own adoption of renewable energy, that is, to confirm whether the companies will actually use renewable energy because of their targets. Stage II investigates the effect of a national carbon reduction target on the corporate target. By using Hierarchical Linear Modeling (HLM), this study analyzes the relationship between the national carbon reduction target, the corporate carbon reduction target and the corporate adoption of renewable electricity. The analysis starts by examining the hypothesis that companies are nested in the country and then verifies the direct and intermediary effect of the national carbon reduction target on the corporate target and the corporate adoption of renewable energy.
We focus on the effect of global carbon reduction action on the corporate adoption of renewable energy and presumes that a national carbon reduction target would exert a positive influence on corporate carbon reduction action and would encourage companies to give priority to renewable electricity. Following this section, which introduces the study’s background and objectives, Section 2 outlines the international carbon reduction action and provides a literature review. Section 3 explains the data sources and methodology, Section 4 presents the empirical results and a discussion. Finally, Section 5 and Section 6 finally provide discussion, conclusions and recommendations.

2. Literature Review

2.1. The Development of International Carbon Reduction Action and Related Studies

In December 1997, the United Nations Framework Convention on Climate Change (UNFCCC) held the third Conference of the Parties (COP3) and adopted the Kyoto Protocol, which outlined the prospects for GHG emissions mitigation, and required both developed and developing countries to adopt Common But Differentiated Responsibilities (CBDR) [17]. However, while the Clinton Administration agreed with this treaty, it was never submitted to the US Senate for ratification because of potential political disapproval [18]. Thus, without the US’s cooperation, the Kyoto Protocol did not work well. At the COP15, held in Copenhagen in 2009, China and the US, the two largest CO2 contributors, did not reach any consensus, and their boycott also hindered the follow-up carbon reduction plans beyond 2012 [19]. The Doha Amendment to the Kyoto Protocol in 2012 only extended the first commitment period to 2020 [17]. However, compared with the Kyoto Protocol, which set equal mandates of carbon reduction for all countries, the Paris Agreement of December 2015 permitted all signatory states to determine their own contributions under the common goal of keeping the rise in global temperature well below 2 °C. In addition, for the first time non-state actors, such as cities and companies, became involved in the global carbon reduction action [20]. To respond to the goals of the Paris Agreement, since 2020 over 100 countries have set their roadmap for net-zero emissions, which is to be achieved through government legislation and policy implementation. Cities and companies have also made commitments to net-zero emissions and a transition toward a sustainable and circular economy.
According to Persson (2019), global governance in relation to climate change is categorized as consisting of four parts [21]. First, the signatory states are required to make substantive commitments without using definitions or metrics to quantify such commitments. Second, all countries are required to report their plan and its implementation through regular reviews. Developing countries are also provided with support in order to design their program for climate action. Third, developed countries submit regular reports and are committed to helping finance developing countries. Parties and the funding boards enact the rules on eligibility and set the standards for priority activities to assist developing countries. Fourth, international initiatives and databases are established for the purpose of knowledge development and sharing information.
Of these four aspects, establishing international initiatives and databases is most of all related to non-state actors. In particular, the CDP (formerly the Carbon Disclosure Project until 2012) is the organization with the most outstanding achievements on climate action. The CDP started with the “Climate Change Program” in 2000 and has established the largest and most comprehensive GHG emissions dataset, which covers companies worldwide and discloses their contributions to GHG emissions [22]. Through annual questionnaires and the cooperation of 590 investment institutions holding over 110 trillion dollars in assets, and hundreds of brand companies with over 5.5 trillion dollars in total purchasing power, the CDP collects and analyzes the data from thousands of companies regarding their carbon management and climate change strategies. Both the investors and the brand companies are invited to fill in the questionnaire with a view to affecting the industry supply chain and urging companies to respond to climate change issues, set their carbon reduction targets and consider the climate risks and opportunities when making business decisions. As climate change issues have received more attention, the CDP has worked with the UN Global Compact, the World Resources Institute and the World Wildlife Fund to found the Science Based Target initiative (SBTi) and support companies in fulfilling their carbon reduction targets through climate science [23]. It has also urged companies to realize the 2 °C scenario set by the International Energy Agency (IEA) and has further raised their emissions reduction target in order to achieve the 1.5 °C scenario.
Led by the Climate Group and in partnership with the CDP in 2014, the RE100 is now the most prominent global corporate leadership initiative, with its member companies aiming to source 100% renewable electricity by 2050 [24]. The RE100, in addition to tracking their progress regularly, also encourages its member companies to disclose their data on electricity management and share their success stories. Energy produced from renewable sources, such as solar, wind, biomass, biogas, geothermal and hydropower, is recognized by the RE100.
The RE100 has driven its member companies to procure and invest in renewable energy. According to Bloomberg New Energy Finance (BNEF), by 2030, they will purchase 190 TWh of renewable energy, 102 GW of solar and wind energy and create investment opportunities amounting to 94 billion dollars. Like the CDP, the RE100 also requires its member companies to influence their suppliers to achieve the target of 100% renewable electricity and to encourage them to create mechanisms in countries where the legislation on renewable energy is still insufficient. For example, Apple has made a pledge to facilitate the adoption of 100% renewable energy within its supply chain.

2.2. Corporate Carbon Reduction and Related Studies on the Adoption of Renewable Energy

The basic philosophy of corporate social responsibility (CSR) is that companies, along with their pursuit for profit, have to consider and exercise their responsibility from the perspectives of the environment, humanity and prosocial behaviors. Maximizing stockholders’ wealth is not the sole principle of decision making. Currently, CSR has gradually been extended to include international initiatives in the hope of becoming more influential.
Gonzalez-Ramos, Donate, and Guadamillas (2018) argue that the purposes behind the exercise of CSR among companies are as follows. First, it could help companies attract and retain talent, which would help them maintain a leading position in the industry. Second, information regarding innovative activities could make companies react to market changes more swiftly and detect the needs of new stakeholders. Third, via a CSR campaign, companies could gain invisible assets, such as goodwill, and further improve their financial performance [25]. Although CSR includes environmental, social and governance (ESG) dimensions, companies have devoted the most resources to environmental protection. Previous studies also indicate that the disclosure of information on environmental protection is beneficial to corporate operation. Akrout and Othman (2016) looked at companies in the Middle East and North Africa (MENA) and found that disclosing environmental protection information in their annual reports could enhance the market liquidity of their stocks [26]. Matsumura, Prakash and Vera-Muñoz (2014) also found that the components of Standard and Poor’s 500 index which disclosed their carbon emissions resulted in companies having higher market value, and their market value was positively correlated to the extent of disclosure [27]. However, for companies, the incentives are not the sole factor which pushes them to campaign for environmental protection. The reason why they do so is that they want to address climate risk and lower compliance costs. Harrast and Olsen (2016) argued that the companies with more GHG emissions and releases of toxic chemicals were more likely to choose to disclose their environmental information to avoid prosecution [28].
In addition, companies also adopt renewable energy to improve their environmental performance. Shin, Ellinger, Nolan, DeCoster, and Lane (2018) found that companies on the EPA Green Power Partner List had better financial performance compared to their peer group [29]. van Prooijen (2019) also pointed out that energy suppliers are likely to gain public trust when they invest in renewable energy to reduce costs and increase the economic benefits for consumers. However, the incentive to achieve better financial performance does not necessarily encourage more companies to discard their high emission energy and turn to renewable energy [30]. Nilsen (2017) took the Norwegian state-owned energy company, Equinor, as an example, and argued that the company increased its investment in renewable energy mainly because of its technological development strategy [31]. Zhang, Lai, Wang, and Wang (2017) investigated Chinese stockholders’ opinions with regard to the clean development mechanism (CDM) and argued that CDM could increase the corporate stockholder value. However, they preferred the industrial gas reuse project to investment in renewable energy, although the two effects are not different statistically [14]. To sum up, companies adopt multiple approaches to achieve their carbon reduction targets, and renewable energy might not be their first choice when seeking to reduce cost.

3. Research Methodology

With its focus on companies in the G20 countries, this study explores the effect of global carbon reduction action on the corporate adoption of renewable energy. The RE100 is an international initiative for renewable energy that is mainly composed of companies, and all members set their own target date for achieving 100% renewable electricity, which is no later than 2050. According to its 2020 annual report, over 300 companies worldwide responded to the RE100 initiative, and their total power demand has exceeded that of one G7 country, such as the UK or Italy [24]. This study aims to analyze the companies’ motivation to adopt renewable energy and is divided into two stages. As shown in Figure 1, Stage I sets out to evaluate the effect of the corporate carbon reduction target on its adoption of renewable energy. Stage II turns to evaluate the effect of a national carbon reduction target on the corporate adoption of renewable energy by HLM. It is essential to perform 3-step regression processing under HLM to test whether the data are nest form and to confirm whether the high-level explanatory variable affects the low-level explanatory variables and the dependent variable.

3.1. Data Sources

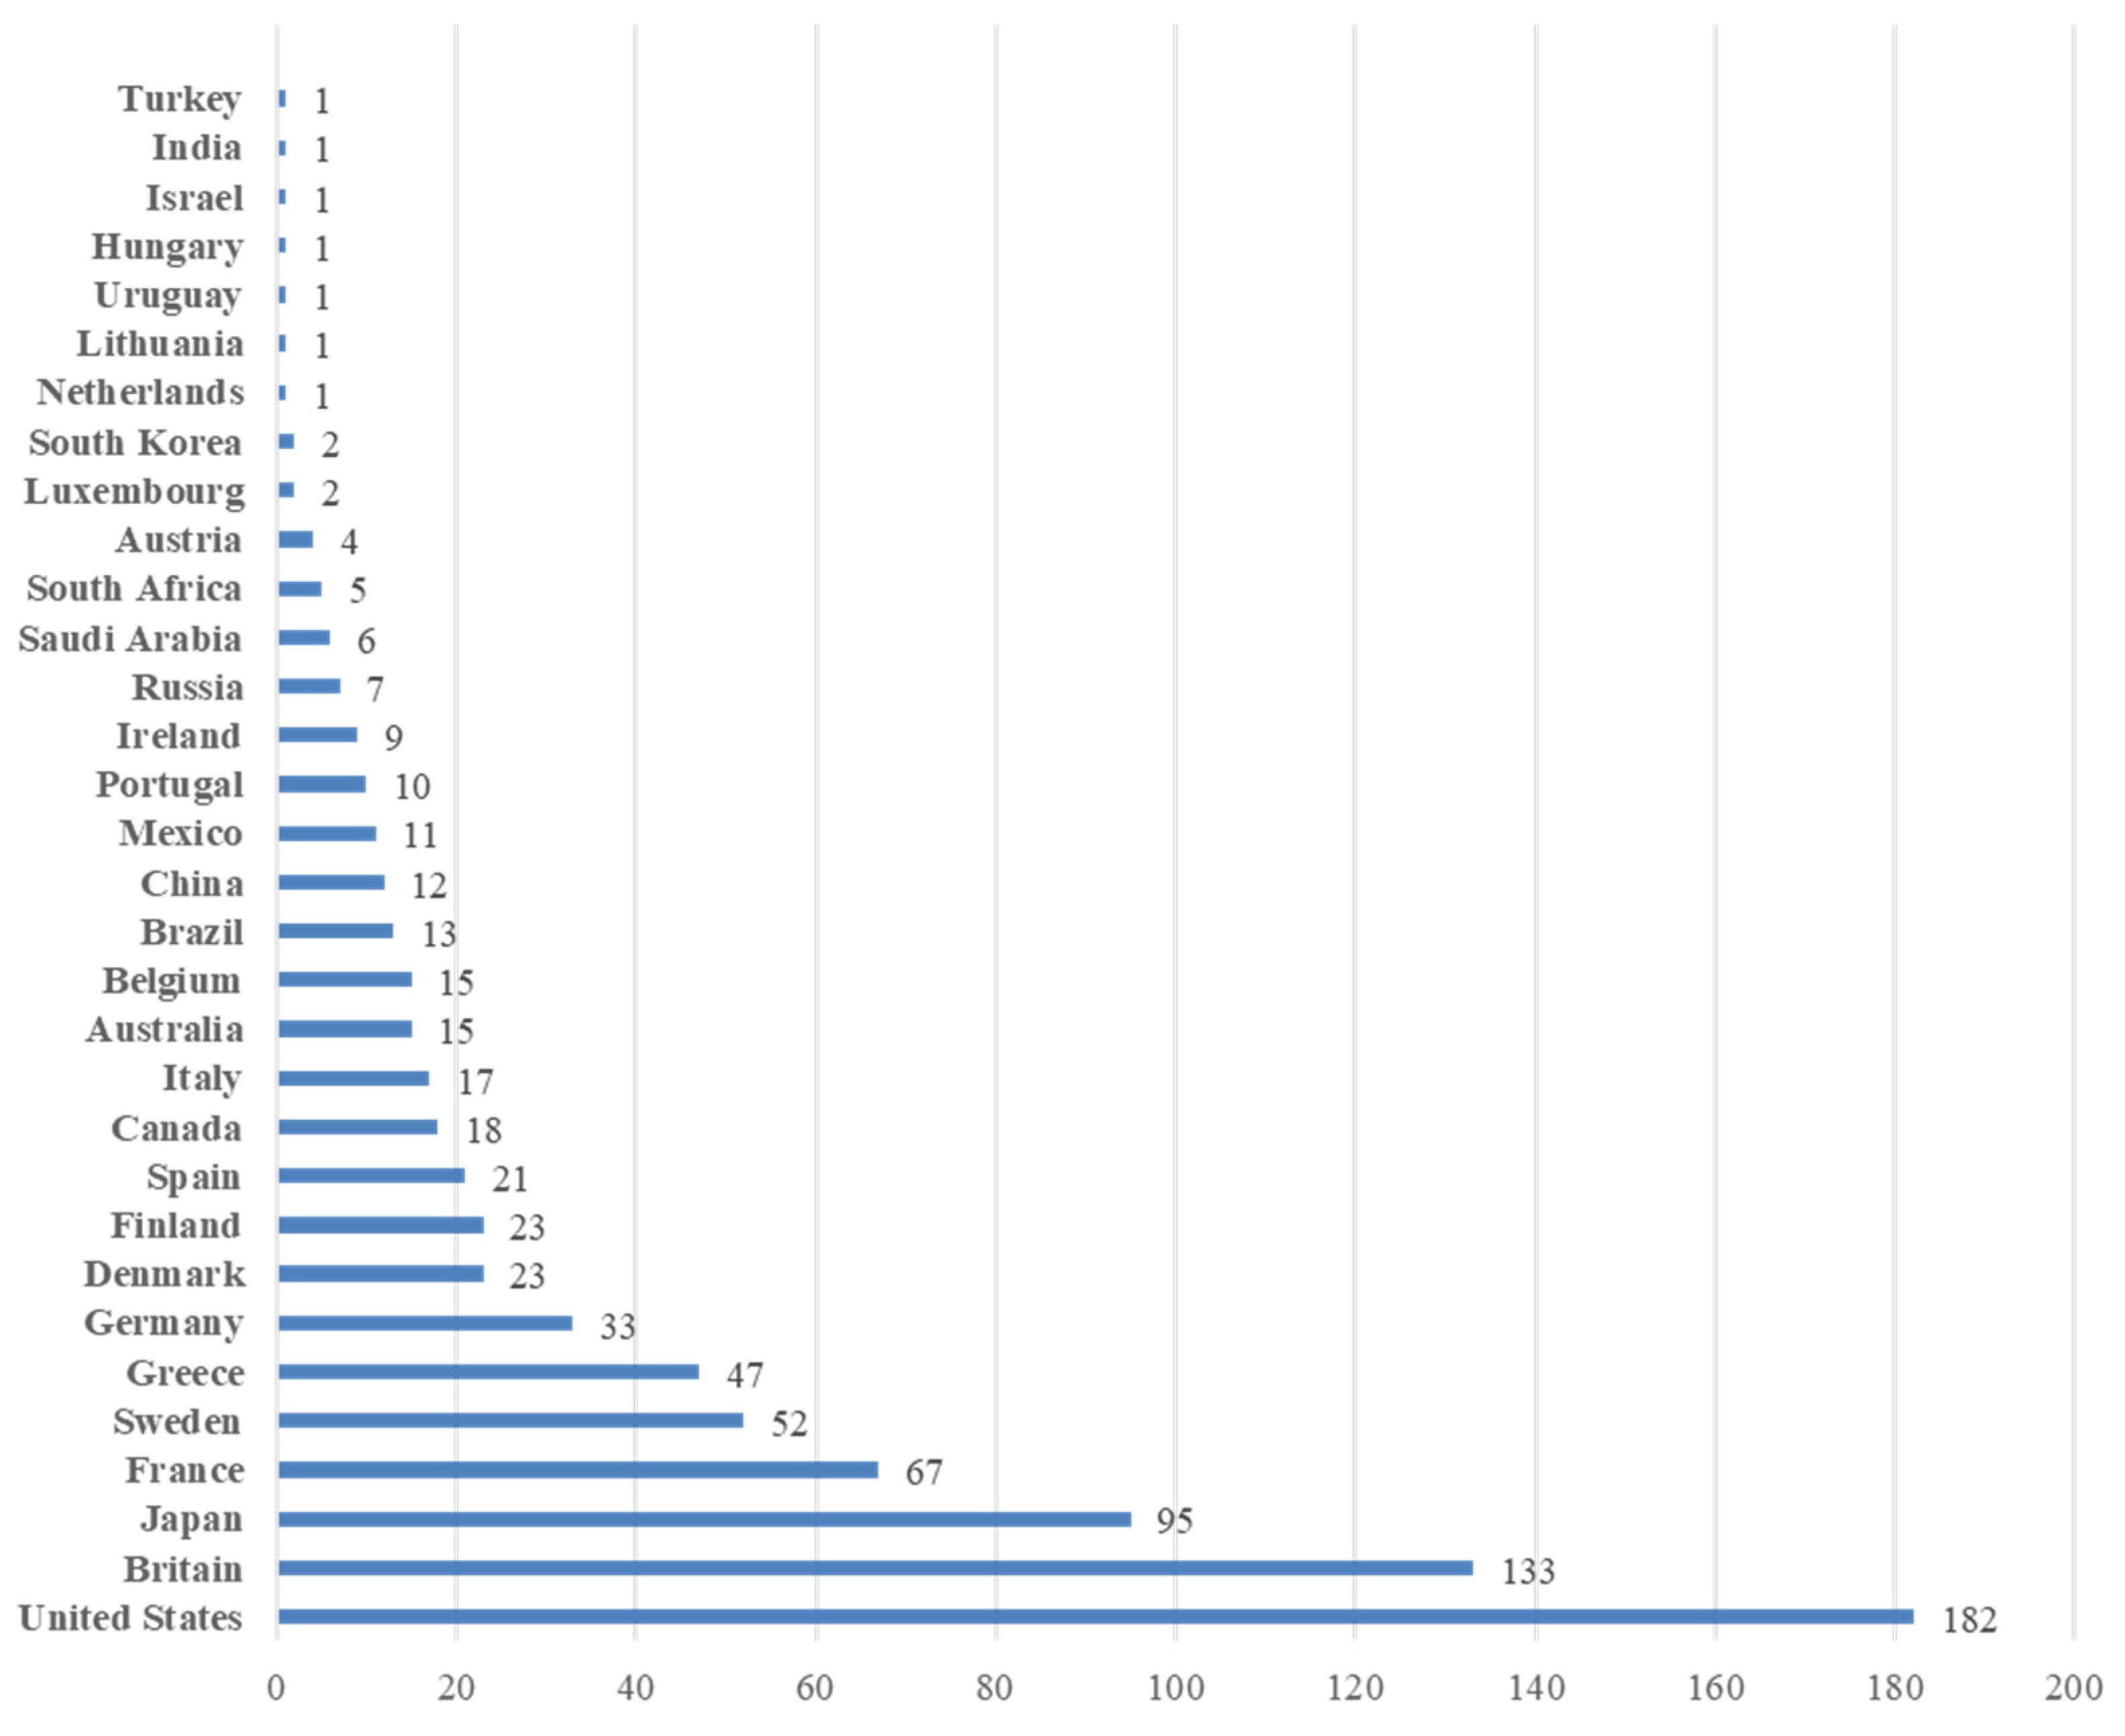
This study focuses on two dimensions, namely, target adoption and target stringency, in analyzing corporate carbon reduction targets by referring to Wang and Sueyoshi (2018) [32]. The science-based targets (SBTs) dataset from the BNEF includes the corporate target, base year, end year, industrial sector and home country where the company is headquartered. The RE100 members’ targets come from their annual report, including the company name, home country, joining year and target year, interim target year and progress in target achievement over the years. In addition, the corporate information, from the Compustat database, is incorporated into this analysis as the control variables, since the industrial sector and financial conditions are probably related to the corporate adoption of renewable energy and their target setting. Figure 2 shows the distribution of countries of samples. Most companies are located in developed countries.

3.2. Empirical Model

To achieve the reduction target, the companies not only try to reduce their own direct emissions, but also use renewable electricity to reduce indirect emissions. The fact that the companies set an RE100 target also implies the priority they attribute to renewable electricity use. As a result, Equation (1) and Equation (2) are developed to assess the effect of the RE100 initiative on the corporate carbon reduction.
Since the dependent variable RE100i is a dummy variable, we employ a logistic regression with the dependent variable RE100i, which refers to whether company i has joined the RE100 initiative in Equation (1). SBTi stands for target adoption and is applied as the independent variable in Equation (1). CVsi is a number of control variables, including the natural log of total assets, the intensity of research and development, and corporate financial leverage. ϕ stands for a logistic regression, and εi is the residual term.
R E 100 i = ϕ ( β 0 + β 1 X i + β k   C V s i + β I   I n d u s t r y i + ε i   )
Equation (2) is a multiple regression in which the dependent variable REPRi and the independent variable TSi, respectively, refer to the target intensity of renewable energy use and emission reduction. The intensity of the reduction target is calculated as the average annual reduction during the target period [32,33,34]. Corporate emissions can be distinguished into Scope 1, 2 and 3, and the reduction target only covers Scope 1 and 2 emissions without separation, since the Scope 3 emissions are difficult to measure, and companies also lack direct incentives to reduce those emissions [35]. Other variables have the same definitions as applied in Equation (1), and operational definitions and data sources are summarized in Table 1.
R E P R i = β 0 + β 1 X i + β k   C V s i + β I   I n d u s t r y i + ε i
To achieve their NDCs, countries can promote energy transition policies to strike a balance between national economic growth and environmental protection [36,37,38]. The Paris Conference (COP 21), for the first time, incorporates non-state actors into its global carbon reduction plans, and the Madrid Conference (COP 25) places emphasis on the public–private partnership (PPP) collaborative mechanism among the private sectors and governments to achieve the goals, consistent with the spirit of COP 21. Existing studies also recognize non-state actors playing the key role in emissions mitigation. Both conferences suggest that corporate action on emission mitigation is related to national efforts to achieve NDCs [39,40,41].
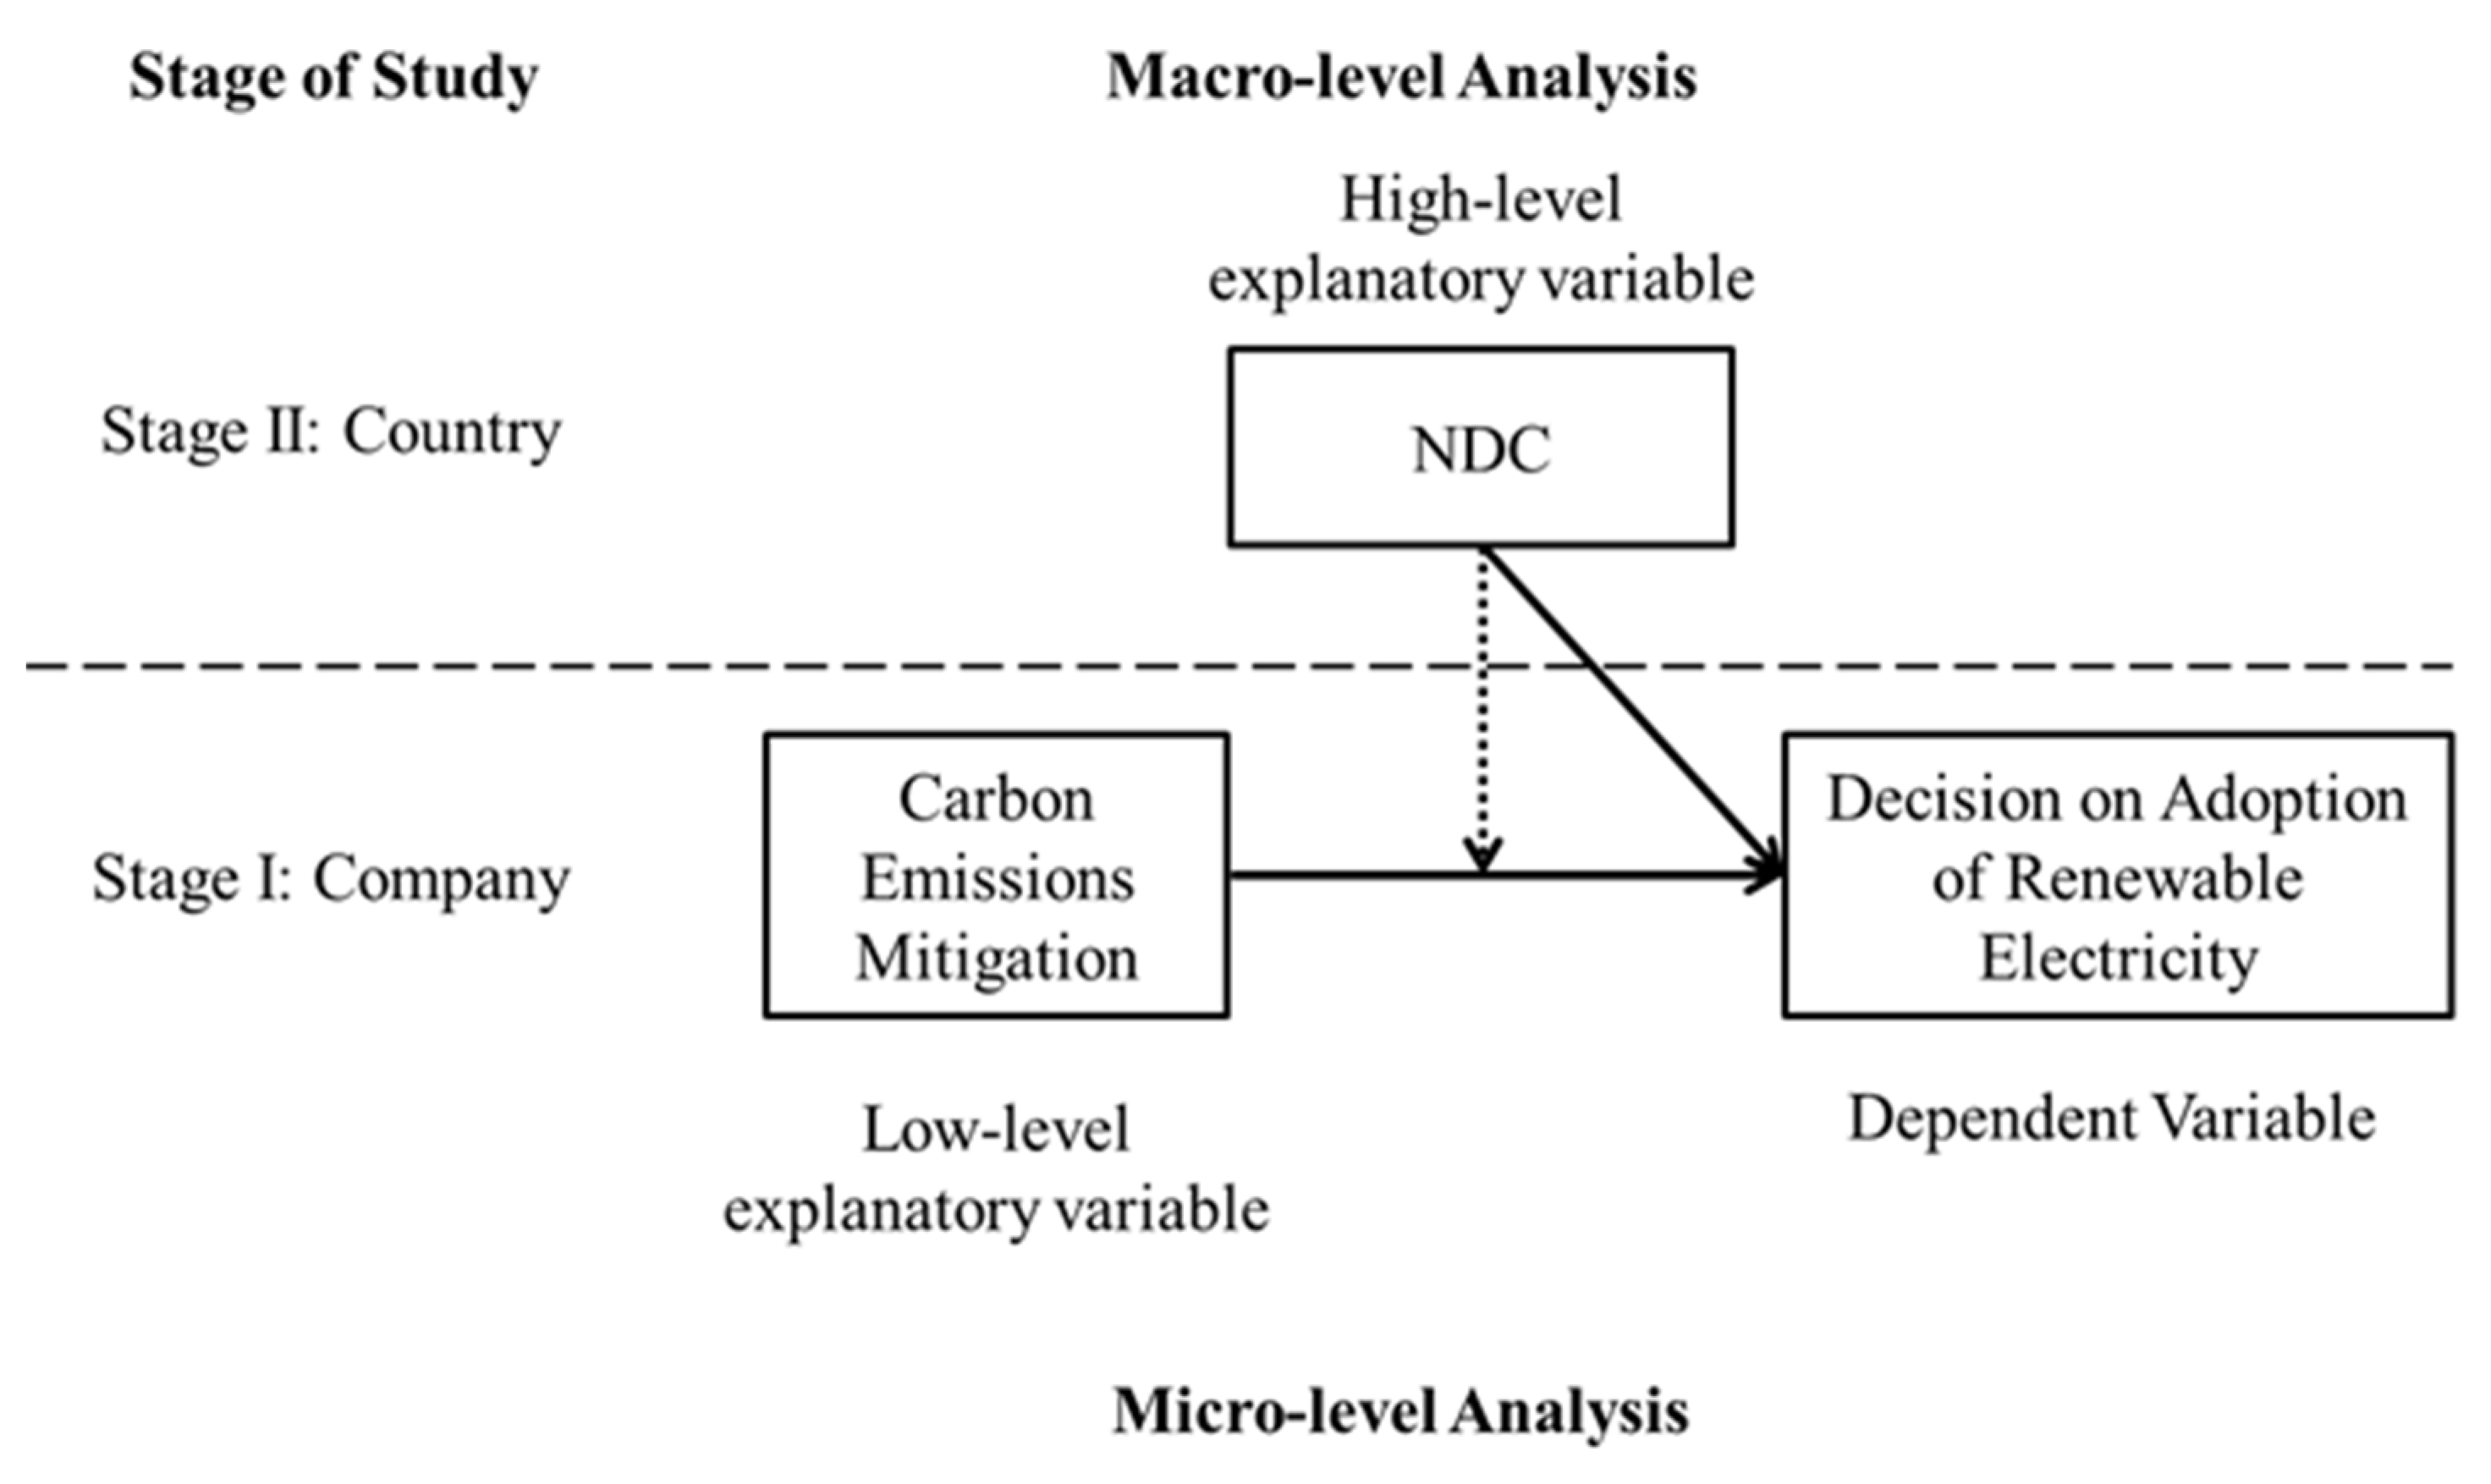
Since the corporate carbon reduction action is likely to be influenced by the national policy and the social atmosphere of environmental awareness, and the use of renewable energy highly depends on the support by the country itself, this study infers that the corporate carbon reduction action is nested in the national target, and further analyzes the effect of corporate and national-level targets. We hypothesize that the intensity of the corporate carbon reduction target is related to NDCs and acts as a mediator between the national-level variable and the corporate renewable energy adoption. We propose using the HLM, which is commonly used in the field of educational psychology, to establish models with Equations (1) and (2) accordingly and to study the effect of a national carbon emission reduction target on corporate renewable energy use [42]. The structure and relationships of the relevant variables are shown in Figure 3.
In Study II, by referring to Goldstein (2011) and Hox (2010), we simplify the structure of Equation (1), and refer to Raudenbush and Bryk (2002) to construct a multilevel logistic regression, as shown in Equations (3)–(6), and combine the two-level regressions into a mixed model, as shown in Equation (7) [43,44,45].
Level   1 :   R E 100 i , j = ϕ ( β 0 , j + β 1 , j S B T i , j + β 2 , j T S i , j + ε i , j )
Level   2 :   β 0 , j = r 00 + r 01 N D C j + u 0 , j
β 1 , j = r 10 + r 11 N D C j + u 1 , j
β 2 , j = r 20 + r 21 N D C j + u 2 , j
Mixed :   R E 100 i , j = ϕ ( β 0 , j + β 1 , j S B T i , k + β 2 , j T S i , j + ε i , j ) = ϕ [ r 00 + r 01 N D C j + u 0 , j + ( r 10 + r 11 N D C j + u 1 , j ) S B T i , j + ( r 20 + r 21 N D C j + u 2 , j ) T S i , j + ε i , j ] = ϕ ( r 00 + r 10 T A i , j + r 20 T S i , j + r 01 N D C j + r 11 N D C j × S B T i , j + r 21 N D C j × T S i , j + u 0 , j + u 1 , j T A i , j + u 2 , j T S i , j + ε i , j )
We also apply the aforementioned approach to establish a two-level HLM by simplifying the structure of Equation (2) and applying the intensity of promoting renewable energy use by a company to a dependent variable, as shown in Equations (8)–(11), which can be further integrated into Equation (12).
Level   1 :   R E P R i , j = β 0 , j + β 1 , j S B T i , j + β 2 , j T S i , j + ε i , j
Level   2 :   β 0 , j = r 00 + r 01 N D C j + u 0 , j
β 1 , j = r 10 + r 11 N D C j + u 1 , j
β 2 , j = r 20 + r 21 N D C j + u 2 , j
Mixed :   R E P R i , j = r 00 + r 10 S B T i , j + r 20 T S i , j + r 01 N D C j + r 11 N D C j × S B T i , j + r 21 N D C j × T S i , j
The full HLM is presented in Equations (7) and (12), but the analysis has to determine the data applicability for the models step by step, and not directly use the full model for analysis in practice. The following describes the process of HLM adoption [45].
  • HLM-ANOVA Model
The analysis of variance (ANOVA) model under the HLM is known as the null model implemented without the explanatory variables. This model is aimed to test whether the data is nest form. The ANOVA model implies testing for differences between means by groups, as shown in Equations (13)–(15), where Yi,j is the level 1 dependent variable.
Level   1 :   Y i , j = β 0 j + ε i , j
Level   2 :   β 0 , j = r 00 + u 0 j
Mixed :   Y i , j = r 00 + u 0 j + ε i , j
Since no explanatory variables are used, β0j represents the means within each group and r00 represents the overall mean, the average of β0j. Furthermore, the variance of Yi,j is calculated under the mixed model as shown in Equation (16).
V a r ( Y i , j ) = V a r ( r 00 + u 0 j + ε i , j ) = τ 00 + σ e 2
where τ00 is the between-group variance, and σ e 2 is the variance of the residuals under the level 1 HLM, also known as the within-group variance. We can obtain the intra-class correlation coefficient (ICC) by calculating the proportion of the between-group variance in the total variance. ICC denotes the degree of homogeneity between groups, and also stands for ρ, the correlation between variables. A higher coefficient ρ refers to the higher correlation within groups and lower homogeneity between groups, and vice versa.
We expect that u0j is significant and Yi,j with large variance to prove the dependent variable varies by different country groups.
  • HLM-Random Coefficients Regression Model
The HLM-random coefficients regression model is the regression based on the null model, performed with level 1 explanatory variables and incorporating the random effects for the level 2 coefficients, as shown in Equations (17)–(20), where Xi,j and Yi,j are, respectively, the explanatory variables and dependent variables in the level 1 regression. This model is to confirm the effect between the dependent and the explanatory variables is still correlated under HLM. Additionally, we expect not only r 10 but also u0j u1j are significant to prove the correlation and further to show the effect of high-level explanatory variable dependent variable.
Level   1 :   Y i , j = β 0 j + β 1 j X i , j + ε i , j
Level   2 :   β 0 , j = r 00 + u 0 j
β 1 , j = r 10 + u 1 j
Mixed :   Y i , j = r 00 + r 10 X i , j + u 0 j + u 1 j X i , j + ε i , j
  • Intercepts and Slopes as the Outcome Model
The intercepts and slopes as the outcome model represent the full HLM, also being referred to as the random slope model, where Xi,j, Yi,j, and Zj are, respectively, the explanatory and dependent variables in level 1, and the explanatory variables in level 2, as shown in Equations (21)–(23). The random slope model uses explanatory variables in both levels of model, and the explanatory variables in level 2 will affect the intercept and slope estimation in level 1. [46]
Level   1 :   Y i , j = β 0 j + β 1 j X i , j + ε i , j
Level   2 :   β 0 , j = r 00 + γ 10 Z j + u 0 j
β 1 , j = r 10 + r 11 Z j + u 1 j
Mixed :   Y i , j = r 00 + r 10 Z j + + r 10 X i , j + r 11 X i , j Z j + u 0 j + u 1 j X i , j + ε i , j
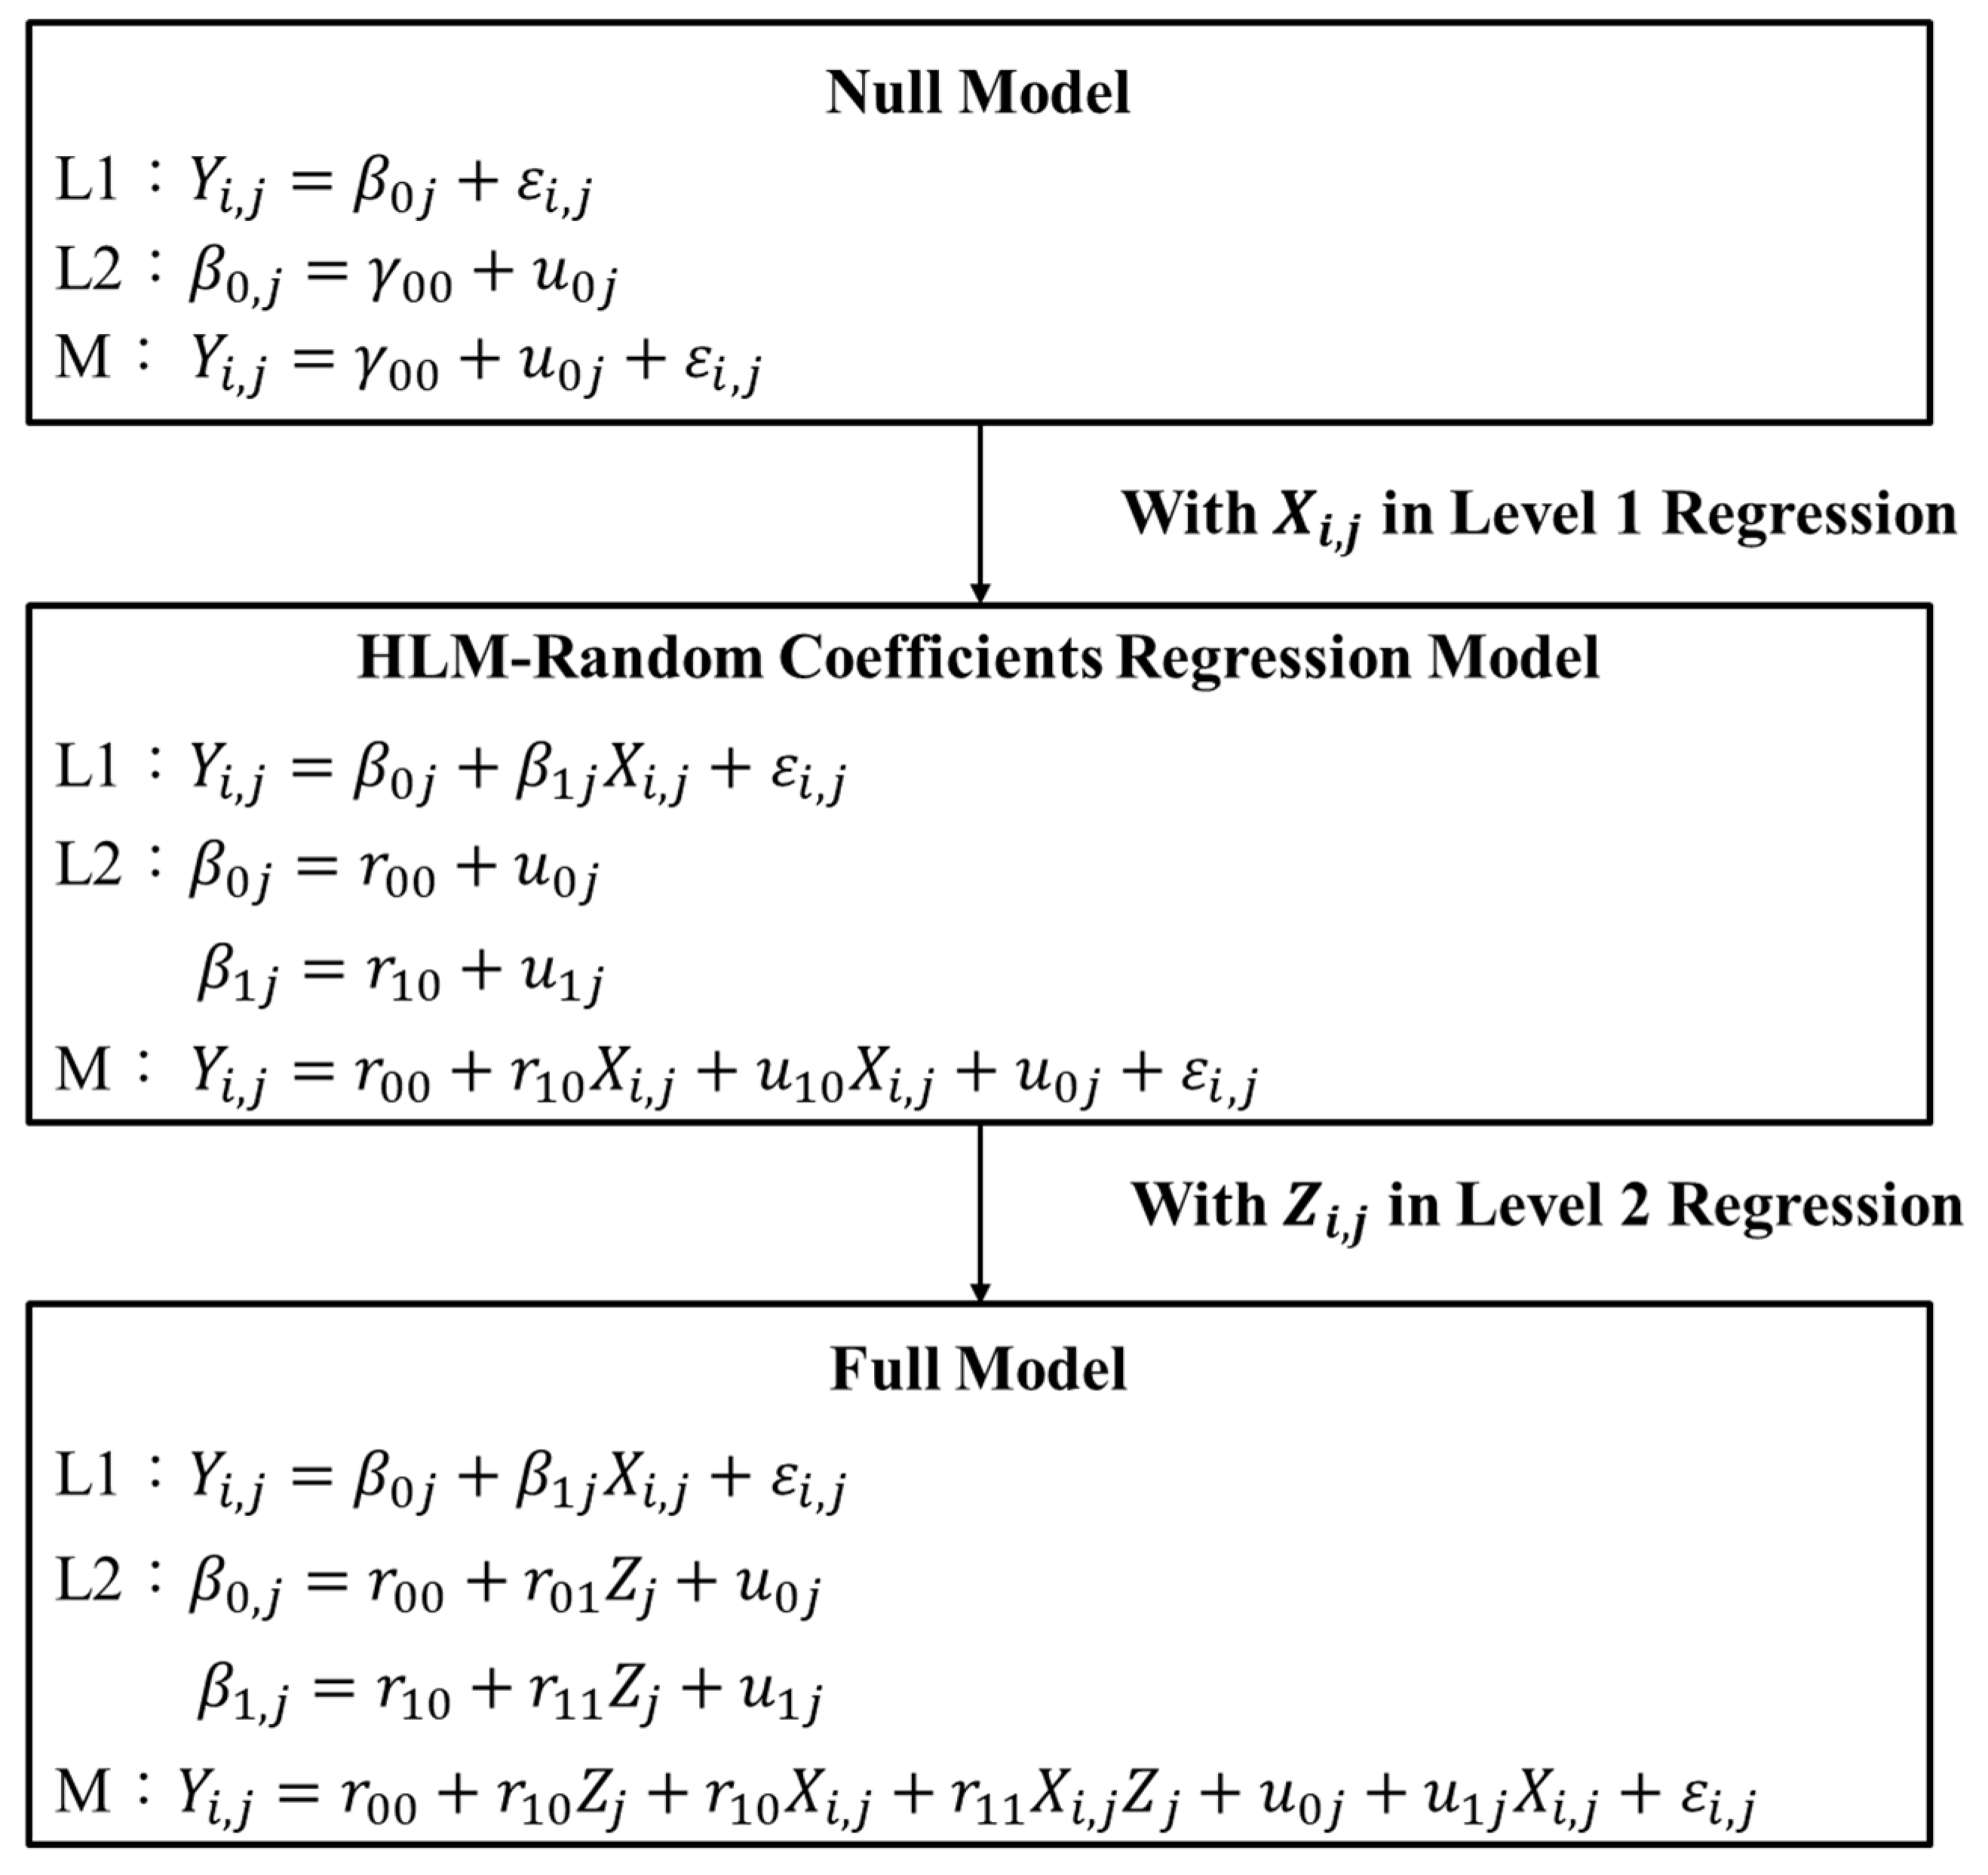
We gradually examine the applicability from the null model, to perform the HLM regression. The development process is shown in Figure 4.

4. Empirical Results

This study analyzes the regression results of the two stages, respectively. Table 2 presents the regression results for stage I. When Model 1-1 adopts the company’s participation in the RE100 as the dependent variable, the estimated coefficient of SBT is positive and significant, which implies that the company with a carbon reduction target is inclined to join the RE100 and to switch to renewable energy. In Model 1-2, the annual growth rate of the renewable electricity target REPR is the dependent variable and has a significantly positive correlation with the annual carbon reduction rate (TS). The stringency of corporate carbon reduction is positively correlated with its adoption of renewable energy. The regression results of Model 1-1 and Model 1-2 both illustrate that the companies are more likely to adopt renewable electricity and to cut carbon emissions when they set higher carbon reduction targets.
Previous studies demonstrate that large enterprises and companies with higher R&D expenses usually have better environmental performance. The empirical results also suggest that company size is positively correlated with the willingness of a company to adopt renewable energy [47,48]. A company that is larger in size (with greater lnA) is usually more willing to adopt renewable energy, and those with higher R&D expenses (with greater RD) are also more inclined to adopt renewable electricity. However, our empirical results show that there is a non-significant correlation between R&D expenses and the annual increase in renewable electricity. The coefficient of the long-term liability rate, L, is non-significant, suggesting that the long-term liability rate is not correlated with the adoption of renewable electricity.
In Stage II, this study explores the effect of the national carbon reduction target on the corporate adoption of renewable electricity by means of the HLM. The HLM is different from other linear regressions, in that the full model needs to go through a series of steps. Table 3 presents the estimated results of the null model’s coefficients. The null model only tests whether there is any difference existing between the dependent variables in different groups. The fixed effects coefficient of the intercept r00 plus the random effects coefficient u01 is β0, and the variant component is related to the existence of a random effect. If the estimated value, Var(u0), were to be significant, it would mean that significant differences exist among the random coefficients, u0. On the contrary, if Var(u0) is non-significant, this would mean that no significant differences exist among the random coefficients, u0, and would imply that there are no random effects among the average dependent variables of countries. Although the random effects coefficient, u0, can be estimated, respectively, in up to twenty country groups, in order to make the layout more concise, the existence of random effects is only shown by the estimated variance components. Companies in different countries express different extents of willingness to join the RE100. This demonstrates that the national factor might affect the corporate adoption of renewable electricity. However, there is no significant difference in the renewable energy progress rate REPR.
In addition, ICC is also an indicator used to analyze the differences among country groups. ICC is calculated by dividing the variance component of the intercept with the sum of variance components of the intercept and residual. A higher ICC implies higher differences between country groups. On the contrary, if the variance component of the intercept is non-significant, the ICC would be 0, and all variances would be caused by the individual differences of companies. The results of the ICC analysis in Model 2-1 and Model 2-2 show that the corporate participation in the RE100 varies in different countries, while REPR does not.
Model 2-1 and Model 2-2 indicate that the corporate transition to renewable electricity varies in different countries. Furthermore, Table 4 presents detailed result among different country groups. r0,0 denotes the estimated average of all country groups, and uoj denotes the effect on the dependent variable caused by country groups. uoj is positive, which means the companies in the country are more willing to engage in RE100 or have stronger ambitions to develop renewable energy on average. The result shows that uoj of developing countries on RE100 and REPR, compared to those of developed countries, are negative. However, the effects on RE100 and REPR are not always in consistency. For example, the US companies are aggressive in joining RE100 as well as adoption of renewable, while Japanese companies are more willing to join RE100 but have slower progress in deployment of renewable energy. In conclusion, the result as shown in Table 4 is coherent to Model 2-1 and 2-2.
Through Model 3-1 and Model 3-2, this study further includes the dependent variable of the corporate carbon reduction target and the control variable to estimate the effect of the corporate carbon reduction target on their decision to use renewable electricity. As shown in Table 5, the effect is estimated through the sum of the fixed effects and random effects. The corporate decision to adopt renewable energy is more related to the stringency of corporate carbon reduction, compared to a corporate willingness to reduce carbon emissions. Furthermore, from the analysis of the control variables, company size (lnA) and R&D expenses (RD) still have an influence on the decision to use renewable energy. As mentioned above, large companies caring about environmental performance tend to respond to global trends and adopt renewable electricity.
Following the analysis in Model 3-1 and Model 3-2, Model 4-1 and Model 4-2 evaluate the effect of NDCs on the corporate decision to adopt renewable electricity. The estimated results of the random-sloped model under the HLM are presented in Table 6. The variable NDC stands for the national carbon reduction target and is measured by the absolute carbon emissions under the BAU scenario. The estimated coefficient of NDC is negative, which represents a positive influence on the corporate adoption of renewable electricity and implies that those countries have an active attitude towards carbon reduction. However, without being statistically significant, the result does not validate the view that the corporate carbon reduction target and its stringency are affected by the NDC.

5. Discussion

The study in Stage I is to evaluate the effect of the corporate carbon reduction target on its adoption of renewable energy by Model 1-1 and 1-2. Both empirical results prove that the companies with greater ambitions, if they have set carbon reduction targets, are more willing to adopt renewable electricity. Additionally, the results suggest that and company with larger size or higher R&D expense is positively correlated with the willingness of a company to adopt renewable energy. It implies that the reason why multinational corporations adopt renewable electricity is probably because of global trends and CSR. This implication also applies to those companies that invest significant amounts of resources in R&D to maintain their competitiveness. Moreover, the long-term liability rate is uncorrelated to the adoption of renewable electricity. In other words, those companies with deployment of renewable electricity do not make their long-term liability significantly increase. For most companies, long-term liabilities are not caused by investment in renewable power plants, and they are inclined to obtain renewable energy certificates (RECs) or sign Power Purchase Agreements (PPAs) [49].
In Stage II, we explore the effect of the national carbon reduction target on the corporate adoption of renewable electricity by Model 2-1 to 4-2 under HLM. The result of Model 2-1 indicates the sample of the study is nest form and proves companies do have different willing to set targets by countries. In addition, the result of Model 3-1 and 3-2 suggest the adoption of renewable energy by company is more related to the stringency of corporate carbon reduction target. These results are consistent with those of previous studies. Without pressure to reduce carbon emissions, companies are less likely to make renewable energy a priority choice since its cost is higher than conventional fossil energy [14,50].
Model 4-1 and 4-2 are to confirm whether the national level target could influence the corporate decision to adopt renewable electricity. However, the results show national level variable NDC has no significant influence on the corporate adoption of renewable energy in the analysis, probably because of the limitation of the samples, since most companies committed to carbon reduction are mainly composed of multinational corporations, and they conventionally follow the international consensus in terms of compliance. In addition, most companies are headquartered in the developed countries and are restricted by advanced environmental regulations.
The results of this study can provide the empirical evidence that companies with mitigation targets, usually under pressures, are willing to make an energy transition. Furthermore, the methodology is also an innovation to explore cross-nation data through HLM although our study is not causal analysis because of the limitation of the samples. High cost of renewable energy is supposed one of main obstacles to sustainability transition. We suggest the nations should not only expand the renewable energy and decrease the renewable electricity cost through policies but also jointly building the trading mechanism and regulation system under carbon credit obligation to companies [51,52].

6. Conclusions

To tackle the issue of climate change, the main carbon reduction action, which was originally the compulsory target at the national level, has gradually been expanded to the voluntary target set by the company. This study combines the company data of the SBTi with the member information of the RE100 and focuses on the companies in G20 to explore the correlation among the NDC, science-based targets, target stringency and the decision to adopt renewable energy. Overall, for companies, the adoption of renewable energy is one of the pathways open to them to enable them to achieve their SBTs. However, in general, the cost of renewable energy is still high, and its development is in need of government support. Thus, this study applies the HLM model to analyze the effect of the NDC on the corporate adoption of renewable electricity.
This study arrives at the following: (1) companies which voluntarily set carbon reduction targets are more willing to adopt renewable electricity, and companies with a greater target stringency are also more active in adopting renewable electricity. However, instead of building their own power plants, companies are inclined to sign PPAs or to obtain RECs. (2) The intermediary effect of a national carbon reduction target on the corporate adoption of renewable energy is not obvious, which implies that the effect of a national carbon reduction target does not pass through the corporate carbon reduction target with regard to the corporate adoption of renewable energy. The sample data applied in this study are subject to multiple corporations while unlisted companies and local companies are not included. These limitations of the samples might contribute to this conclusion. (3) Most multinational corporations are willing to take climate action and abide by the international consensus and laws. They are headquartered in developed countries, and their action is often better than the government policy on climate change. These factors might all lessen the influence of a national carbon reduction target on the corporate adoption of renewable energy. This study’s results indicate that companies would seek to use renewable energy to improve their performance in reducing carbon. The effect of NDCs on the corporate adoption of renewable energy is non-significant, but the NDC still exerts a positive influence on companies and encourages them to take action. An industrial power transition to renewables needs to be economically beneficial. Thus, governments should provide more incentives, such as financing or subsidies, to expand the supply and demand in the renewable energy market, instead of just setting targets or for attracting publicity.
This study fails to validate that companies are encouraged by NDCs to set more ambitious targets to reduce carbon and to expand their adoption of renewable electricity. Still, from the scenario that companies of different countries make different decisions regarding the use of renewable energy, this study argues that, although non-significant, the targets of home countries do exert some influence on these companies. Probably because these multinational corporations have a greater sufficiency of resources, their performances in relation to carbon reduction are even better than what is required by the legislative bodies of their home country strategies regarding renewable energy. Thus, the effect the targets of their home countries have on their strategies for using renewable energy is not as significant as expected. We believe that with more comprehensive disclosure on corporate carbon emissions in the future, the empirical model built in this study could serve as a good tool for examining such issues.

Author Contributions

Conceptualization, S.-F.L.; methodology, C.-H.C.; software, C.-H.C.; validation, C.-H.C. and S.-F.L.; formal analysis, C.-H.C. and S.-F.L.; resources, C.-H.C.; data curation, C.-H.C.; writing—original draft preparation, C.-H.C. and S.-F.L.; writing—review and editing, S.-F.L.; visualization, C.-H.C.; supervision, S.-F.L.; project administration, S.-F.L.; funding acquisition, S.-F.L. Both authors have read and agreed to the published version of the manuscript.

Funding

This research was funded by Ministry of Science and Technology (MOST), Taiwan, grant number: MOST 109-2410-H-170-001.

Institutional Review Board Statement

Not applicable.

Informed Consent Statement

Not applicable.

Data Availability Statement

3rd Party Data. Restrictions apply to the availability of these data. Data were obtained from Bloomberg New Energy Finance and are available https://www.bnef.com (accessed on 13 August 2021) with the permission of Bloomberg New Energy.

Acknowledgments

The authors would like to thank Yung-Chen Shih, CIER, for writing advice and corrections to our study.

Conflicts of Interest

The authors declare no conflict of interest.

Abbreviations

greenhouse gasGHG
non-governmental organizationsNGOs
Nationally Determined ContributionsNDCs
Group of TwentyG20
Hierarchical Linear ModelingHLM
Conference of the PartiesCOP
Science Based Target InitiativeSBTi
Bloomberg New Energy FinanceBNEF
corporate social responsibilityCSR
Middle East and North Africa MENA
clean development mechanismCDM
science-based targetsSBTs
analysis of varianceANOVA
intra-class correlation coefficientICC
renewable energy certificatesRECs
Power Purchase AgreementsPPAs
Akaike information criterionAIC

References

  1. Saran, S. Global Governance and Climate Change. Glob. Gov. 2009, 15, 457–460. Available online: http://www.jstor.org/stable/27800775 (accessed on 5 January 2020). [CrossRef]
  2. Rosenau, J.N. Governance in the Twenty-First Century. Glob. Gov. 1995, 1, 13–43. Available online: http://www.jstor.org/stable/27800099 (accessed on 5 January 2020). [CrossRef]
  3. Dingwerth, K.; Pattberg, P. Global Governance as a Perspective on World Politics. Glob. Gov. 2006, 12, 185–203. Available online: http://www.jstor.org/stable/27800609 (accessed on 5 January 2020). [CrossRef] [Green Version]
  4. Biermann, F.; Pattberg, P.; van Asselt, H.; Zelli, F. The Fragmentation of Global Governance Architectures: A Framework for Analysis. Glob. Environ. Politics 2009, 9, 14–40. [Google Scholar] [CrossRef]
  5. Lederer, M. Global governance. In Research Handbook on Climate Governance; Bäckstrand, K., Lövbrand, E., Eds.; Edward Elgar Publishing: Cheltenham, UK, 2015; pp. 3–13. [Google Scholar] [CrossRef] [Green Version]
  6. Weiss, T.; Thakur, R.; Ruggie, J. Global Governance and the UN: An Unfinished Journey; Indiana University Press: Bloomington, IN, USA, 2010; pp. 1–420. [Google Scholar]
  7. Andonova, L.; Betsill, M.; Bulkeley, H. Transnational Climate Governance. Glob. Environ. Politics 2009, 9, 52–73. [Google Scholar] [CrossRef]
  8. Persson, Å. Global adaptation governance: An emerging but contested domain. WIREs Clim. Chang. 2019, 10, e618. [Google Scholar] [CrossRef] [Green Version]
  9. The Paris Agreement (United Nations Framework Convention on Climate Change). Available online: https://unfccc.int/process-and-meetings/the-paris-agreement/the-paris-agreement (accessed on 23 January 2022).
  10. Energy & Climate Intelligence Unit. Available online: https://eciu.net/netzerotracker (accessed on 23 January 2022).
  11. Wirth, D.A. The Paris Agreement as a New Component of the UN Climate Regime. Int. Organ. Res. J. 2017, 12, 185–214. [Google Scholar] [CrossRef] [Green Version]
  12. Taebi, B.; Safari, A. On Effectiveness and Legitimacy of ‘Shaming’ as a Strategy for Combatting Climate Change. Sci. Eng. Ethics 2017, 23, 1289–1306. [Google Scholar] [CrossRef]
  13. Sutherland, P. Obligations to Reduce Emissions: From the Oslo Principles to Enterprises. J. Eur. Tort Law 2017, 8, 177–216. [Google Scholar] [CrossRef]
  14. Zhang, B.; Lai, K.H.; Wang, B.; Wang, Z.H. Shareholder Value Effects of Corporate Carbon Trading: Empirical Evidence from Market Reaction Towards Clean Development Mechanism in China. Energy Policy 2017, 110, 410–421. [Google Scholar] [CrossRef]
  15. Le, T.H.; Nguyen, C.P.; Park, D. Financing Renewable Energy Development: Insights from 55 Countries. Energy Res. Soc. Sci. 2020, 68, 101537. [Google Scholar] [CrossRef]
  16. Carfora, A.; Pansini, R.V.; Romano, A.A.; Scandurra, G. Renewable Energy Development and Green Public Policies Complementarities: The Case of Developed and Developing Countries. Renew. Energy 2018, 115, 741–749. [Google Scholar] [CrossRef]
  17. What is the Kyoto Protocol? (United Nations Framework Convention on Climate Change). Available online: https://unfccc.int/kyoto_protocol (accessed on 23 January 2022).
  18. Royden, A.U.S. Climate Change Policy Under President Clinton: A Look Back. Gold. Gate Univ. Law Rev. 2002, 32. Available online: https://digitalcommons.law.ggu.edu/ggulrev/vol32/iss4/3 (accessed on 21 January 2022).
  19. Christoff, P. Cold climate in Copenhagen: China and the United States at COP15. Environ. Politics 2010, 19, 637–656. [Google Scholar] [CrossRef]
  20. History of Non-Party Stakeholder Engagement (United Nations Framework Convention on Climate Change). Available online: https://unfccc.int/climate-action/introduction-climate-action/history-non-party-stakeholder-engagement (accessed on 23 January 2022).
  21. Hall, N.; Persson, Å. Global Climate Adaptation Governance: Why Is It Not Legally Binding? Eur. J. Int. Relat. 2017, 24, 540–566. [Google Scholar] [CrossRef] [PubMed]
  22. CDP. Available online: https://www.cdp.net/en (accessed on 24 January 2022).
  23. Science Based Targets. Available online: https://sciencebasedtargets.org/ (accessed on 24 January 2022).
  24. RE100. Available online: https://www.there100.org/ (accessed on 24 January 2022).
  25. González-Ramos, M.; Donate, M.; Guadamillas, F. The Effect of Technological Posture and Corporate Social Responsibility on Financial Performance through Corporate Reputation. Int. J. Innov. 2018, 6, 164–179. [Google Scholar] [CrossRef] [Green Version]
  26. Akrout, M.M.; Othman, H.B. Environmental Disclosure and Stock Market Liquidity: Evidence from Arab MENA Emerging Markets. Appl. Econ. 2016, 48, 1840–1851. [Google Scholar] [CrossRef]
  27. Matsumura, E.M.; Prakash, R.; Vera-Muñoz, S.C. Firm-Value Effects of Carbon Emissions and Carbon Disclosures. Account. Rev. 2014, 89, 695–724. [Google Scholar] [CrossRef]
  28. Harrast, S.A.; Olsen, L.M. Climate Change Disclosures Are Getting Hotter. J. Corp. Account. Financ. 2016, 27, 21–28. [Google Scholar] [CrossRef]
  29. Shin, H.J.; Ellinger, A.E.; Nolan, H.H.; DeCoster, T.D.; Lane, F. An Assessment of the Association between Renewable Energy Utilization and Firm Financial Performance. J. Bus. Ethics 2018, 151, 1121–1138. [Google Scholar] [CrossRef]
  30. Van Prooijen, A.M. Public Trust in Energy Suppliers’ Communicated Motives for Investing in Wind Power. J. Environ. Psychol. 2019, 61, 115–124. [Google Scholar] [CrossRef]
  31. Nilsen, T. Innovation from the Inside Out: Contrasting Fossil and Renewable Energy Pathways at Statoil. Energy Res. Soc. Sci. 2017, 28, 50–57. [Google Scholar] [CrossRef]
  32. Wang, D.D.; Sueyoshi, T. Climate Change Mitigation Targets Set by Global Firms: Overview and Implications for Renewable Energy. Renew. Sustain. Energy Rev. 2018, 94, 386–398. [Google Scholar] [CrossRef]
  33. Ioannou, I.; Li, S.X.; Serafeim, G. The Effect of Target Difficulty on Target Completion: The Case of Reducing Carbon Emissions. Account. Rev. 2016, 91, 1467–1492. [Google Scholar] [CrossRef]
  34. Gouldson, A.; Sullivan, R. Long-Term Corporate Climate Change Targets: What Could They Deliver? Environ. Sci. Policy 2013, 27, 1–10. [Google Scholar] [CrossRef]
  35. Wang, D. A Comparative Study of Firm-Level Climate Change Mitigation Targets in the European Union and the United States. Sustainability 2017, 9, 489. [Google Scholar] [CrossRef] [Green Version]
  36. Huang, Y.A.; Weber, C.L.; Matthews, H.S. Categorization of Scope 3 Emissions for Streamlined Company Carbon Footprinting. Environ. Sci. Technol. 2009, 43, 8509–8515. [Google Scholar] [CrossRef] [Green Version]
  37. Ari, I.; Yikmaz, R.F. The Role of Renewable Energy in Achieving Turkey’s NDC. Renew. Sustain. Energy Rev. 2019, 105, 244–251. [Google Scholar] [CrossRef]
  38. Chunark, P.; Limmeechokchai, B.; Fujimori, S.; Masui, T. Renewable Energy Achievements in CO2 Mitigation in Thailand’s NDCs. Renew. Energy 2017, 114, 1294–1305. [Google Scholar] [CrossRef] [Green Version]
  39. Hu, W.C.; Lin, J.C.; Fan, C.T.; Lien, C.A.; Chung, S.M. A Booming Green Business for Taiwan’s Climate Perspective. Renew. Sustain. Energy Rev. 2016, 59, 876–886. [Google Scholar] [CrossRef]
  40. Blok, K.; Höhne, N.; van der Leun, K.; Harrison, N. Bridging the Greenhouse-Gas Emissions Gap. Nat. Clim. Chang. 2012, 2, 471–474. [Google Scholar] [CrossRef]
  41. Hsu, A.; Moffat, A.S.; Weinfurter, A.J.; Schwartz, J.D. Towards a New Climate Diplomacy. Nat. Clim. Chang. 2015, 5, 501–503. [Google Scholar] [CrossRef]
  42. Chiou, H.J.; Wen, F.H. Hierarchical Linear Modeling of Contextual Effects: An Example of Organizational Climate of Creativity at Schools and Teacher’s Creative Performance. J. Educ. Psychol. 2007, 30, 1–35. [Google Scholar] [CrossRef]
  43. Goldstein, H. Multilevel Statistical Models, 4th ed.; John Wiley: New York, NY, USA, 2011. [Google Scholar]
  44. Hox, J.J. Multilevel Analysis: Techniques and Applications, 2nd ed.; Lawrence Erlbaum: Mahwah, NJ, USA, 2010. [Google Scholar]
  45. Raudenbush, S.W.; Bryk, A.S. Hierarchical Linear Models: Applications and Data Analysis Methods, 2nd ed.; Sage: Newbury Park, CA, USA, 2002. [Google Scholar]
  46. Burstein, L.; Linn, R.L.; Capell, F.J. Analyzing Multilevel Data in the Presence of Heterogeneous Within-Class Regressions. J. Educ. Stat. 1978, 3, 347–383. [Google Scholar] [CrossRef]
  47. Anton, W.R.; Deltas, Q.G.; Khanna, M. Incentives for Environmental Self-Regulation and Implications for Environmental Performance. J. Environ. Econ. Manag. 2004, 48, 632–654. [Google Scholar] [CrossRef]
  48. Bowen, F.E. Environmental Visibility: A Trigger of Green Organizational Response? Bus. Strategy Environ. 2000, 9, 92–107. [Google Scholar] [CrossRef]
  49. Jin, T.; Shi, T.; Park, T. The quest for carbon-neutral industrial operations: Renewable power purchase versus distributed generation. Int. J. Prod. Res. 2018, 56, 5723–5735. [Google Scholar] [CrossRef] [Green Version]
  50. Wu, P.I.; Qiu, K.Z.; Liou, J.L. Project cost comparison under the clean development mechanism to inform investment selection by industrialized countries. J. Clean. Prod. 2017, 166, 1347–1356. [Google Scholar] [CrossRef]
  51. Bogdanov, D.; Ram, M.; Aghahosseini, A.; Gulagi, A.; Oyewo, A.S.; Child, M.; Caldera, U.; Sadovskaia, K.; Farfan, I.; Barbosa, L.S.N.S.; et al. Low-cost renewable electricity as the key driver of the global energy transition towards sustainability. Energy 2021, 227, 120467. [Google Scholar] [CrossRef]
  52. Rachmaniar, A.; Supriyadi, A.P.; Pradana, H.; Mustriadhi, A. Carbon trading system as a climate mitigation scheme: Why Indonesia should adopt it? IOP Conf. Ser. Earth Environ. Sci. 2021, 739, 012015. Available online: https://iopscience.iop.org/article/10.1088/1755-1315/739/1/012015 (accessed on 23 January 2022). [CrossRef]
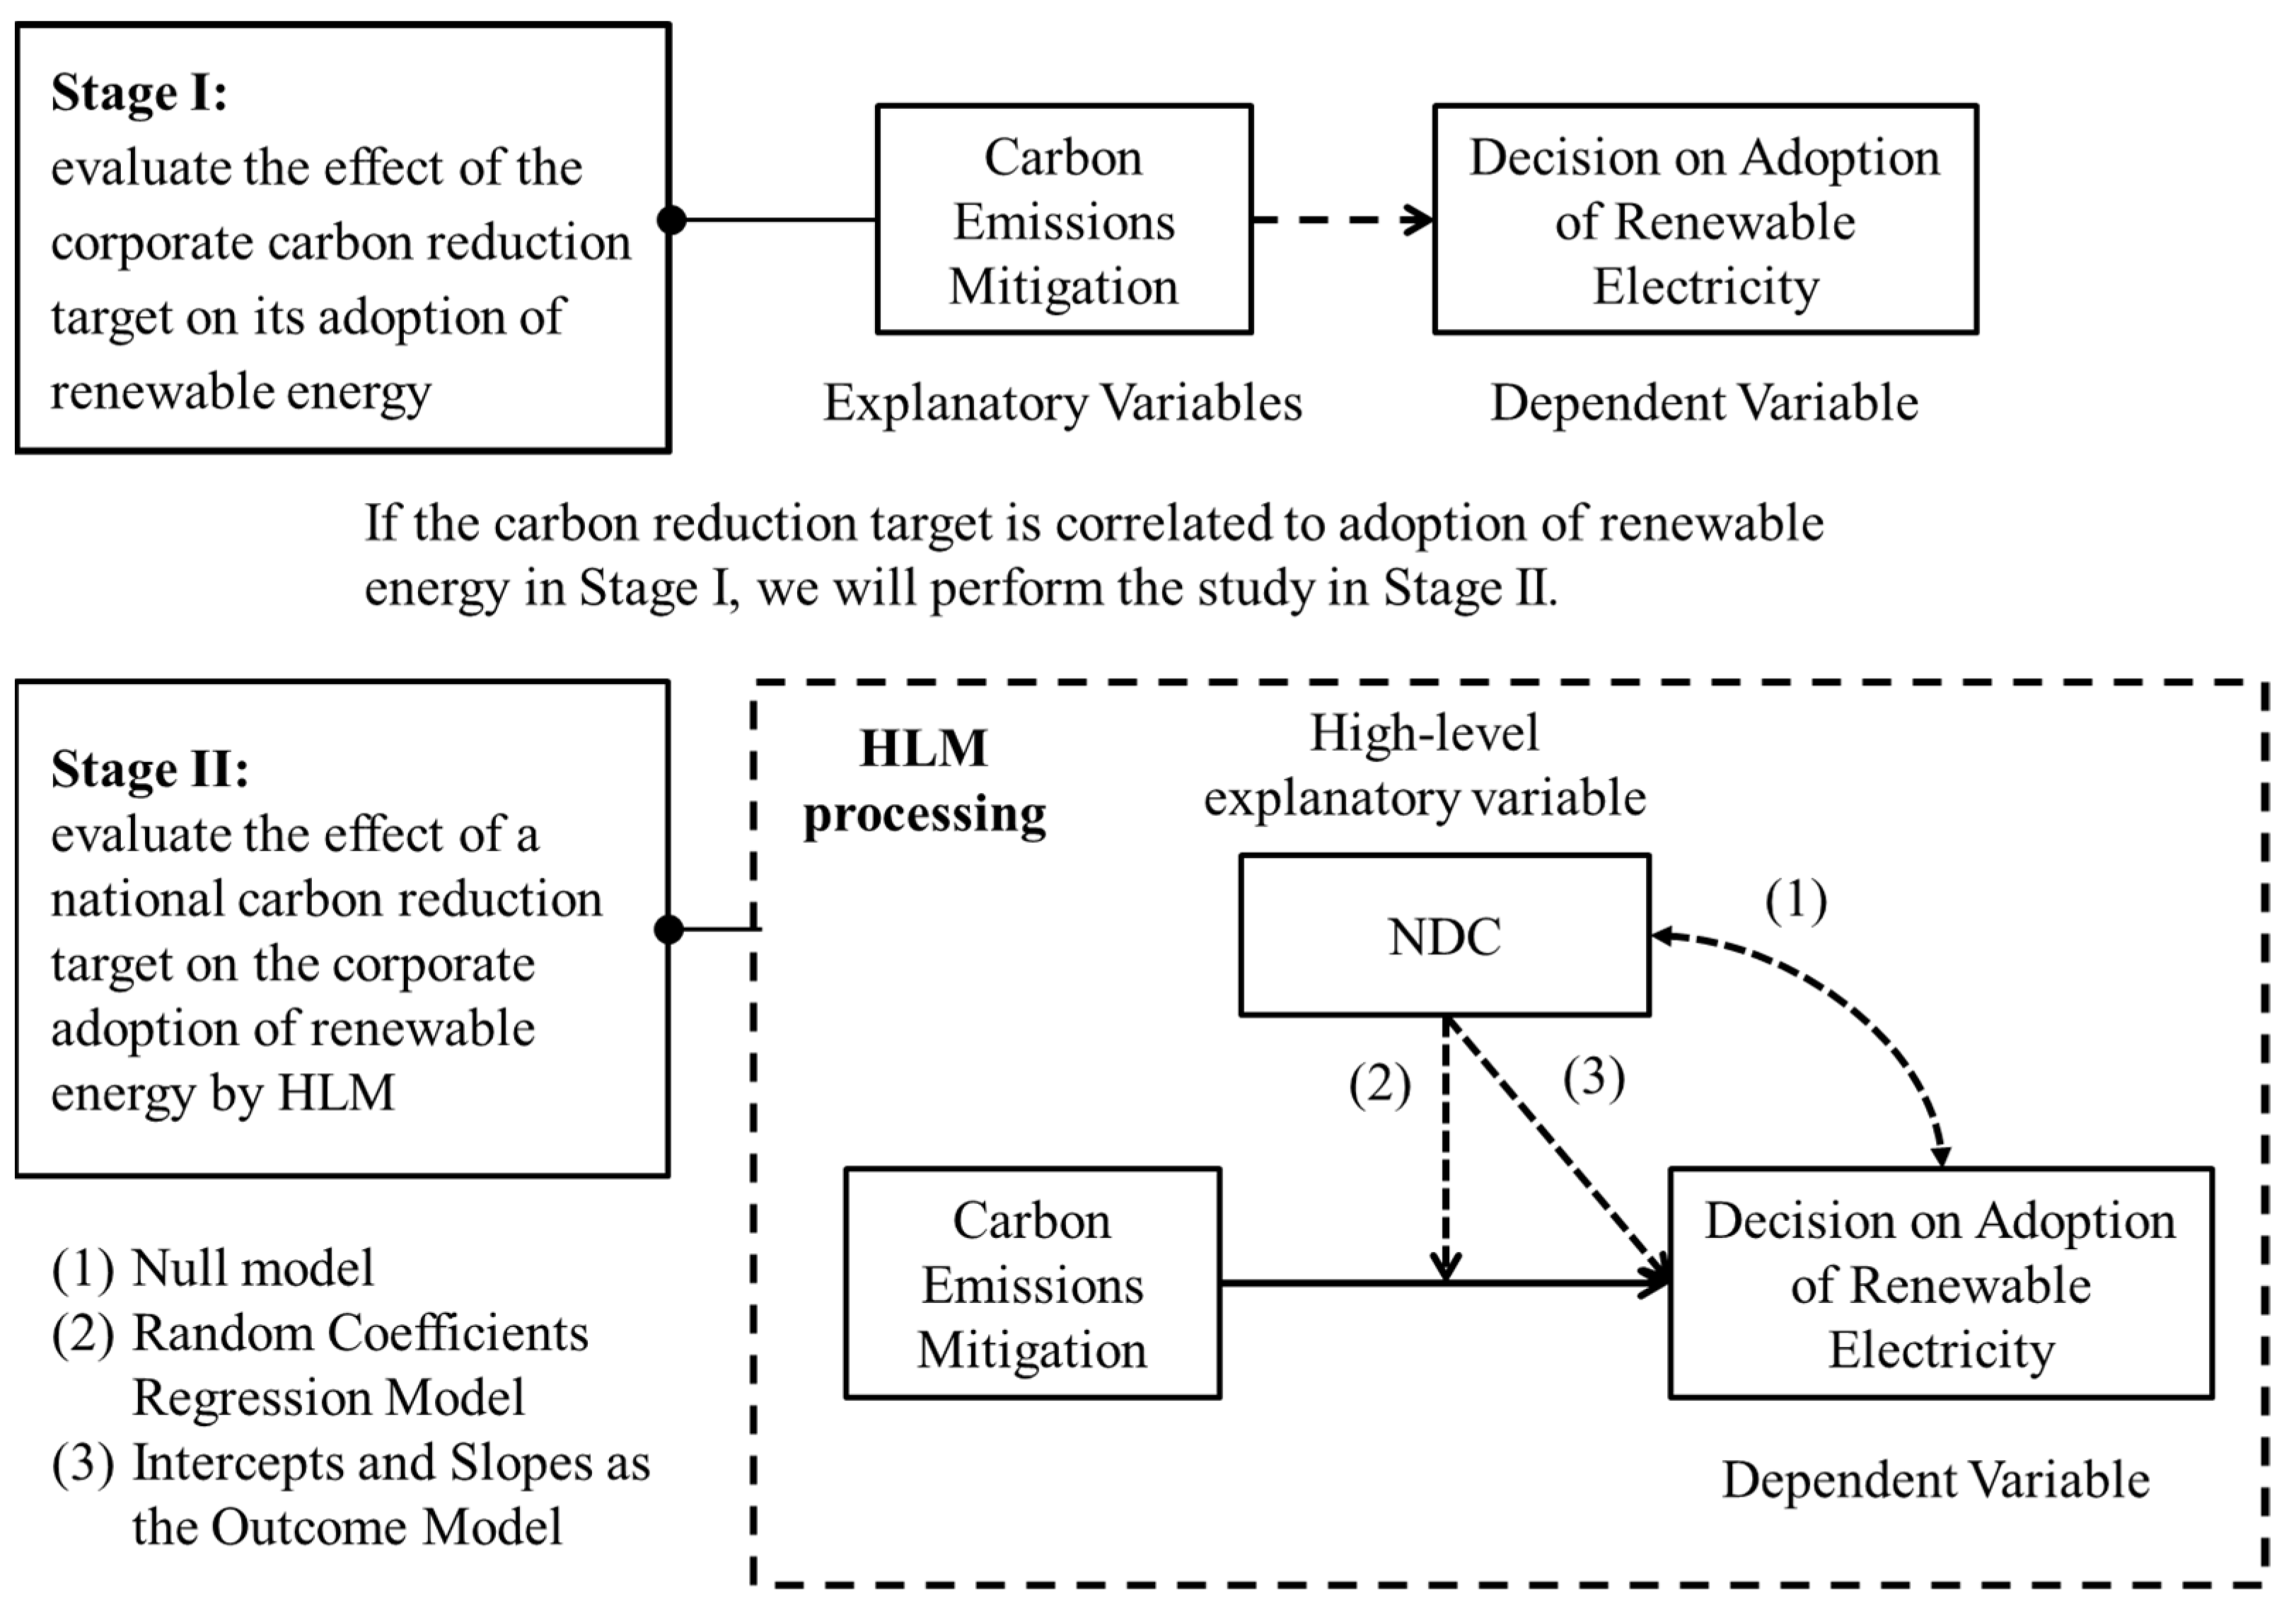
Figure 1. The flowchart of the methodology.
Energies 15 01794 g001
Figure 2. The distribution of countries of samples.
Energies 15 01794 g002
Figure 3. The structure and relationships of the relevant variables in a two-level HLM.
Energies 15 01794 g003
Figure 4. The development process of the HLM. L1 stands for the level 1 regression under the HLM; L2 stands for the level 2 regression under the HLM; M stands for the mixed model under the HLM.
Energies 15 01794 g004
Table 1. Variable definitions and data sources.
VariableDefinitionSource
RE100iWhether company i has joined the RE100 initiative.RE100 Annual Report
REPRiAverage annual growth rate of renewable energy use by company iRE100 Annual Report
XiSBTiWhether company i has disclosed its SBT.BNEF
TSiAverage annual mitigation rate of carbon emissions for company iBNEF
CVsilnAiNatural log of the total assets of company iCompustat
LiLeverage of company i, the ratio of long-term liabilities to total assets in the latest yearCompustat
RDiR&D intensity of company i, the ratio of R&D expenses to total sales in the latest yearCompustat
IndustryiIndustrial classification of company iBNEF
Source: revised from Wang and Sueyoshi (2018) [32].
Table 2. The results for parameter estimates in Stage I.
ModelModel 1-1Model 1-2
VariablesRE100REPR
Intercept−7.881 ***
(66.79)
−0.022 *
(−1.89)
SBT1.112 ***
(6.67)
−0.006
(−0.80)
TS3.570
(0.55)
0.224 **
(2.12)
lnA0.498 ***
(29.72)
0.003 **
(2.50)
L0.661
(0.91)
0.012
(0.99)
RD3.961 **
(5.06)
−0.031
(−0.73)
Control Variables of Industrial SectorYesYes
Goodness of Fit487.1660.035
Observations829829
Note: Statistics are shown in parentheses, but those of the two models are different. Model 1 is a logistic regression with a Chi-squared statistic and Akaike information criterion (AIC) measured for goodness of fit. Model 2 is a multiple linear regression with a t statistic and R-squared measured for goodness of fit. *** represents the 99% significance level, ** represents the 95% significance level, and * represents the 90% significance level.
Table 3. The results of null model estimates under the HLM (difference for means between groups).
ModelModel 2-1Model 2-2
VariableRE100REPR
Fixed EffectsComponent of Variance
Var(u01)
Random EffectsFixed EffectsComponent of Variance
Var(u01)
Random Effects
Intercept (r0,0)0.087 ***
(4.91)
0.003 **
(1.77)
Yes0.010 ***
(4.01)
0.001
(0.94)
No
Residuals (ε)-0.095 ***
(20.18)
--0.004 ***
(20.27)
-
Goodness of Fit (AIC)0.040
Observations427.1−2270.7
Note: *** represents the 99% significance level, ** represents the 95% significance level, and * represents the 90% significance level.
Table 4. The results of null model estimates under the HLM by country.
VariablesRE100REPRObservations
Fixed effect (r0,0)0.0870.01829
uoj by Country
Australia0.0360.00115
Austria−0.0100.0004
Belgium0.0150.00015
Brazil−0.025−0.00113
Canada−0.0100.00117
China−0.0010.00012
Denmark0.0550.00123
Finland−0.036−0.00123
France0.0000.00069
Germany−0.0130.00033
Greece−0.0030.0001
Hungary−0.0030.0001
India−0.038−0.00245
Ireland0.0450.00112
Italy−0.030−0.00117
Japan0.023−0.00294
Lithuania−0.0030.0001
Luxembourg−0.0070.0003
Mexico0.0010.00011
Portugal−0.022−0.00111
Russia−0.0050.0002
Saudi Arabia−0.0030.0001
South Africa−0.0120.0005
South Korea−0.0160.0007
Spain−0.016−0.00121
Sweden−0.042−0.00253
Turkey−0.0140.0006
United Kingdom (UK)0.0250.003136
United States of America (USA)0.1080.007178
Note: 0.000 is nonzero and positive but not indicates complete number because of decimal place.
Table 5. The results of random coefficients regression model estimates under the HLM.
ModelModel 3-1Model 3-2
VariableRE100REPR
Fixed EffectsComponent of Variance
Var(uij)
Random EffectsFixed EffectsComponent of Variance
Var(uij)
Random Effects
Intercept (r0,0)−0.234 ***
(-4.21)
0.000
(0.00)
No−0.020 *
(−1.72)
0.000
(0.00)
No
SBT (r1,0)0.0489
(1.40)
0.001
(0.14)
No−0.006
(−0.79)
0.000
(0.00)
No
TS (r2,0)0.497
(0.79)
1.355 **
(1.67)
Yes0.197 *
(1.76)
0.013
(0.94)
No
lnA0.034 ***
(5.40)
--0.003 **
(2.40)
--
L0.009
(0.14)
--0.008
(0.67)
--
RD0.492 **
(2.44)
--−0.033
(−0.79)
--
Residuals (ε)-0.0832 ***
(20.04)
--0.004 ***
(20.28)
-
Control Variables of Industrial SectorYesYes
Goodness of Fit (AIC)341.0−2280.5
Observations829829
Note: *** represents the 99% significance level, ** represents the 95% significance level, and * represents the 90% significance level.
Table 6. The results of random slope regression model estimates under the HLM.
ModelModel 4-1Model 4-2
VariableRE100REPR
Fixed EffectsComponent of Variance
Var(uij)
Random EffectsFixed EffectsComponent of Variance
Var(uij)
Random Effects
Intercept (r0,0)−0.228 ***
(−4.07)
0.000
(0.00)
No−0.019
(−1.62)
0.000
(0.00)
No
SBT (r1,0)0.066
(1.42)
0.000
(0.17)
No−0.005
(−0.49)
0.000
(0.00)
No
TS (r2,0)−0.011
(−0.01)
1.328 *
(1.63)
Yes0.159
(0.85)
0.013
(0.93)
No
NDC (r0,1)−0.008
(−0.38)
--−0.002
(−0.34)
--
NDC×SBT (r1,1)0.040
(0.50)
--0.002
(0.11)
--
NDC×TS (r2,1)−1.245
(−0.71)
--−0.083
(−0.24)
--
lnA0.033 ***
(5.22)
--0.003 **
(2.27)
--
L0.007
(0.11)
--0.008
(0.63)
--
RD0.487 **
(2.41)
--−0.034
(−0.82)
--
Residuals (ε)-0.083 ***
(20.04)
--0.004 ***
(20.28)
-
Control Variables of Industrial SectorYesYes
Goodness of Fit (AIC)346.2−2274.9
Observations829829
Note: *** represents the 99% significance level, ** represents the 95% significance level, and * represents the 90% significance level.
Publisher’s Note: MDPI stays neutral with regard to jurisdictional claims in published maps and institutional affiliations.