

Effect of Varying AgNO3 and CS(NH2)2 Concentrations on Performance of Ag2S/ZnO NRs/ITO Photoanode

 ,
,  ,
,  ,
,  and
and 
Abstract
:1. Introduction
2. Materials and Methods
2.1. Preparation of Ag2S NPs/ZnO NRs
2.2. Characterizations of Ag2S NPs/ZnO NRs
2.3. Photoelectrochemical Performance of Ag2S NPs/ZnO NRs
3. Results
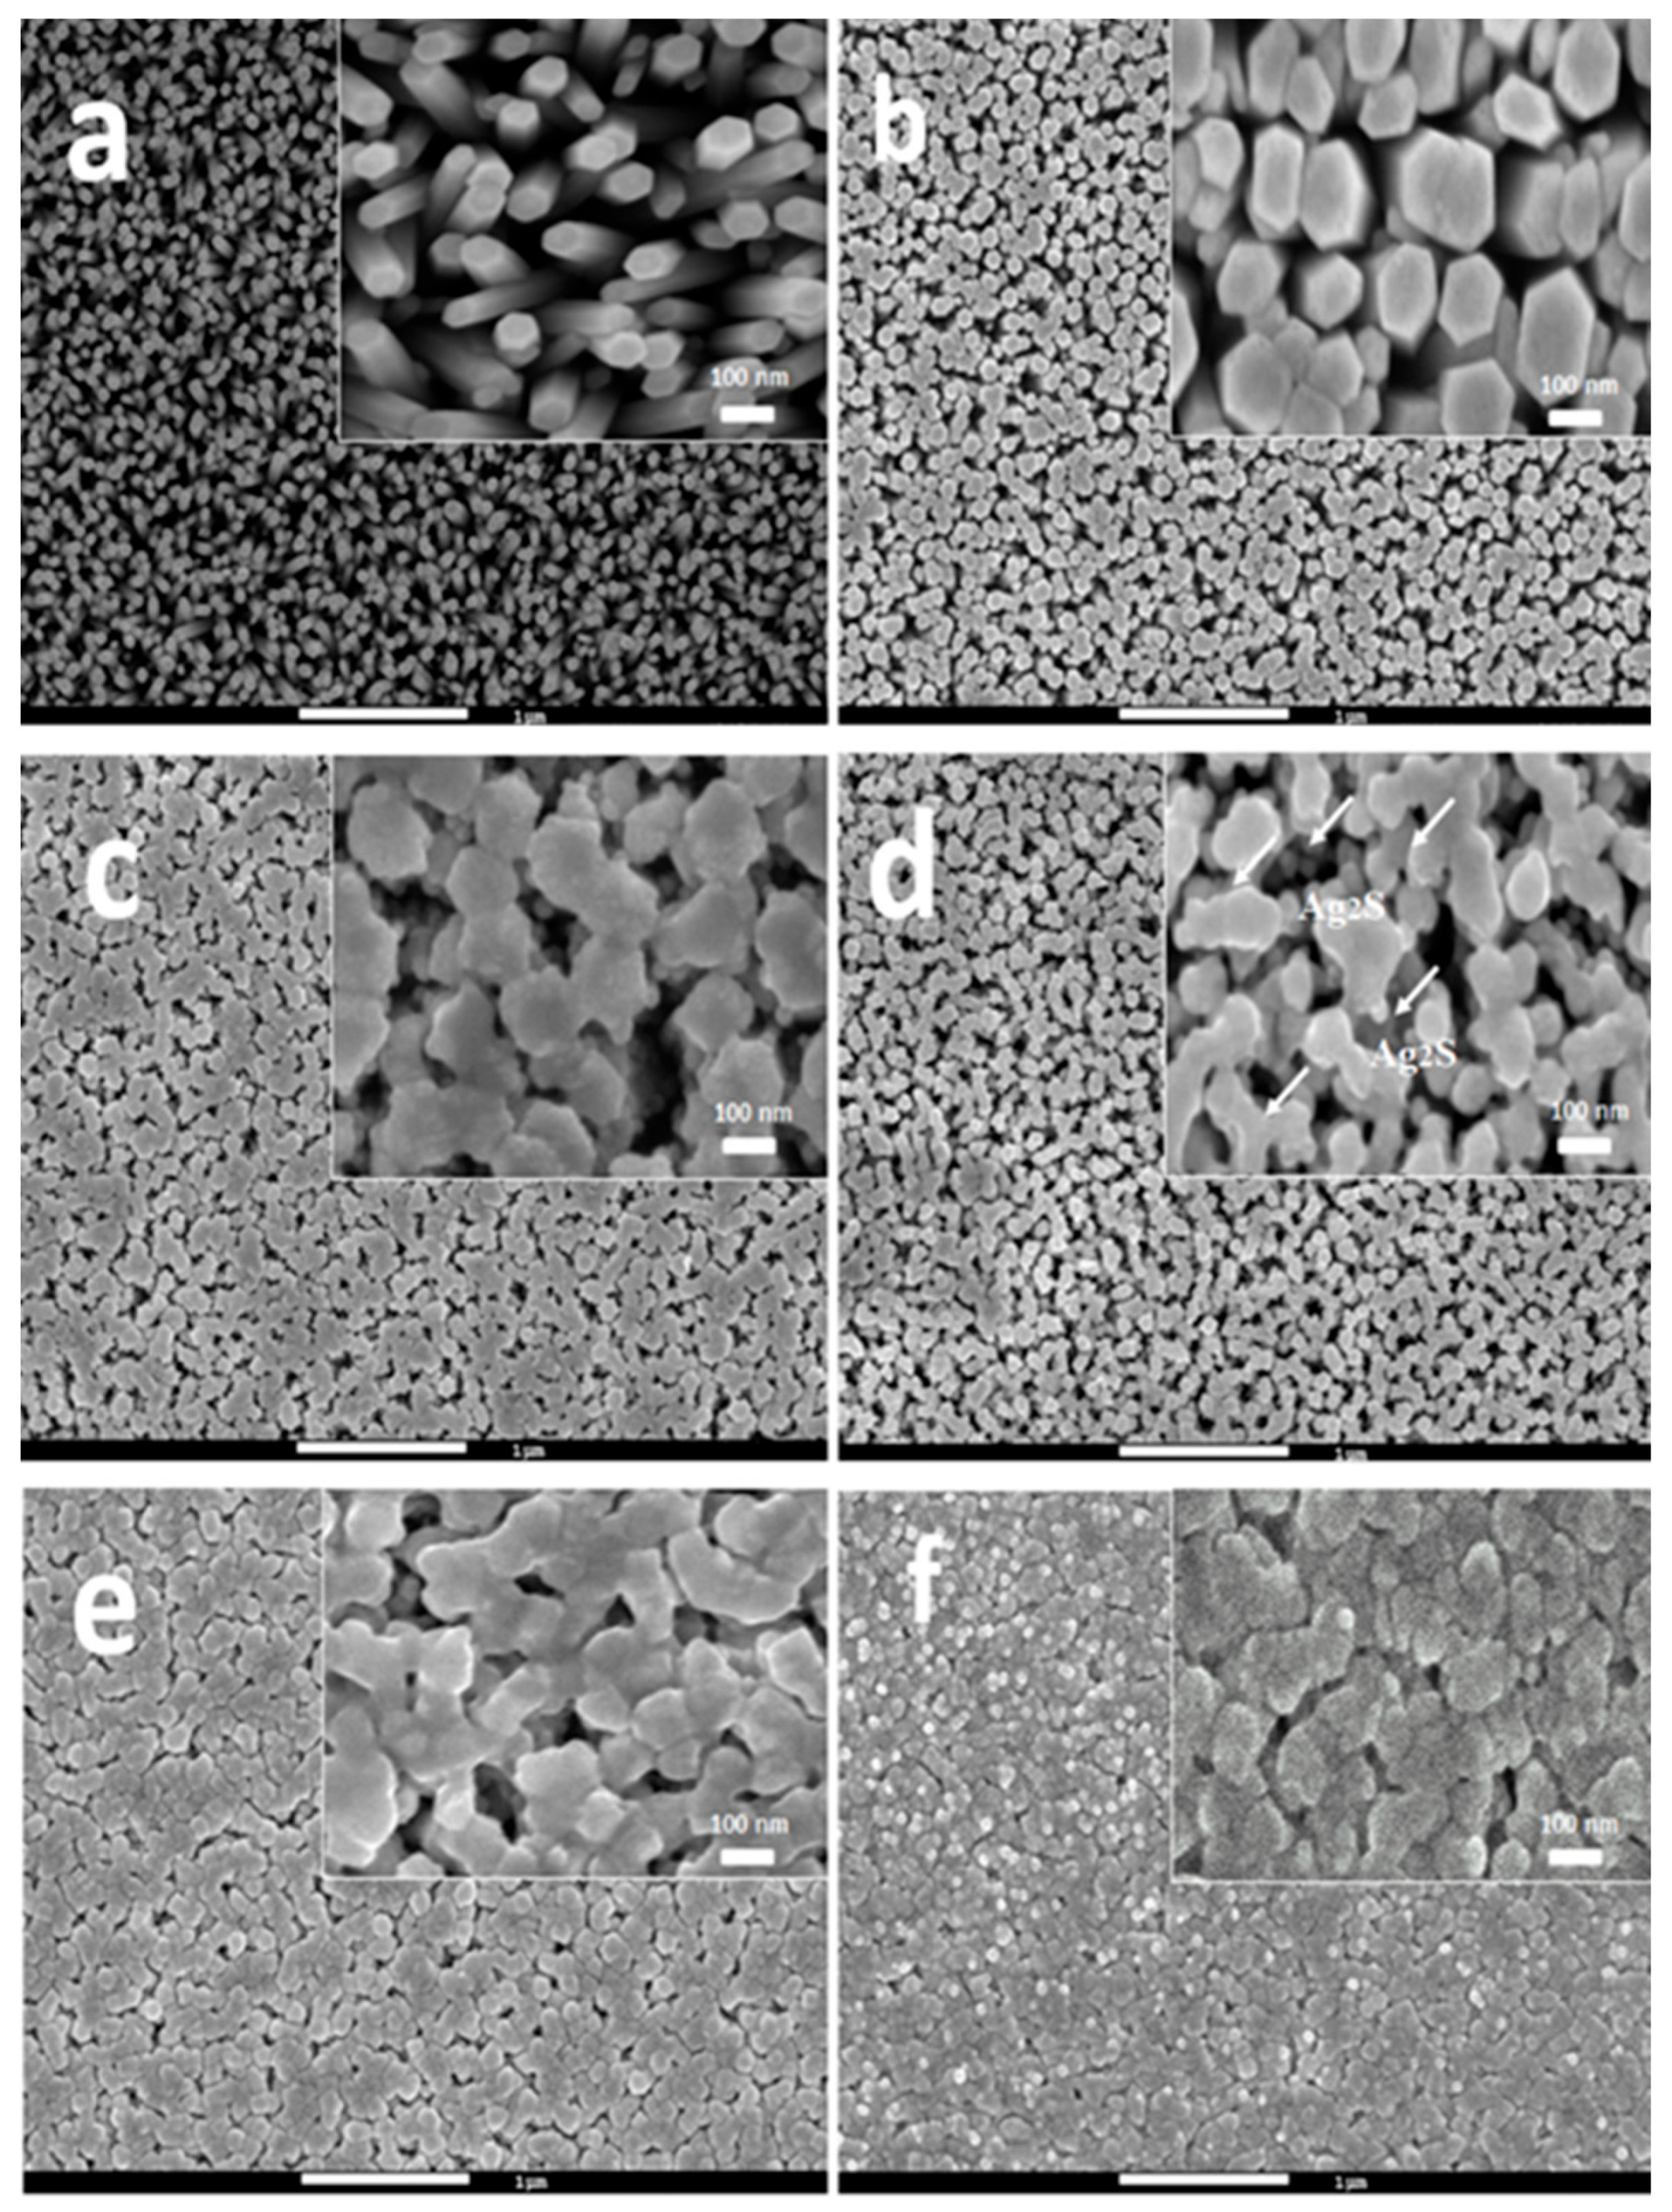
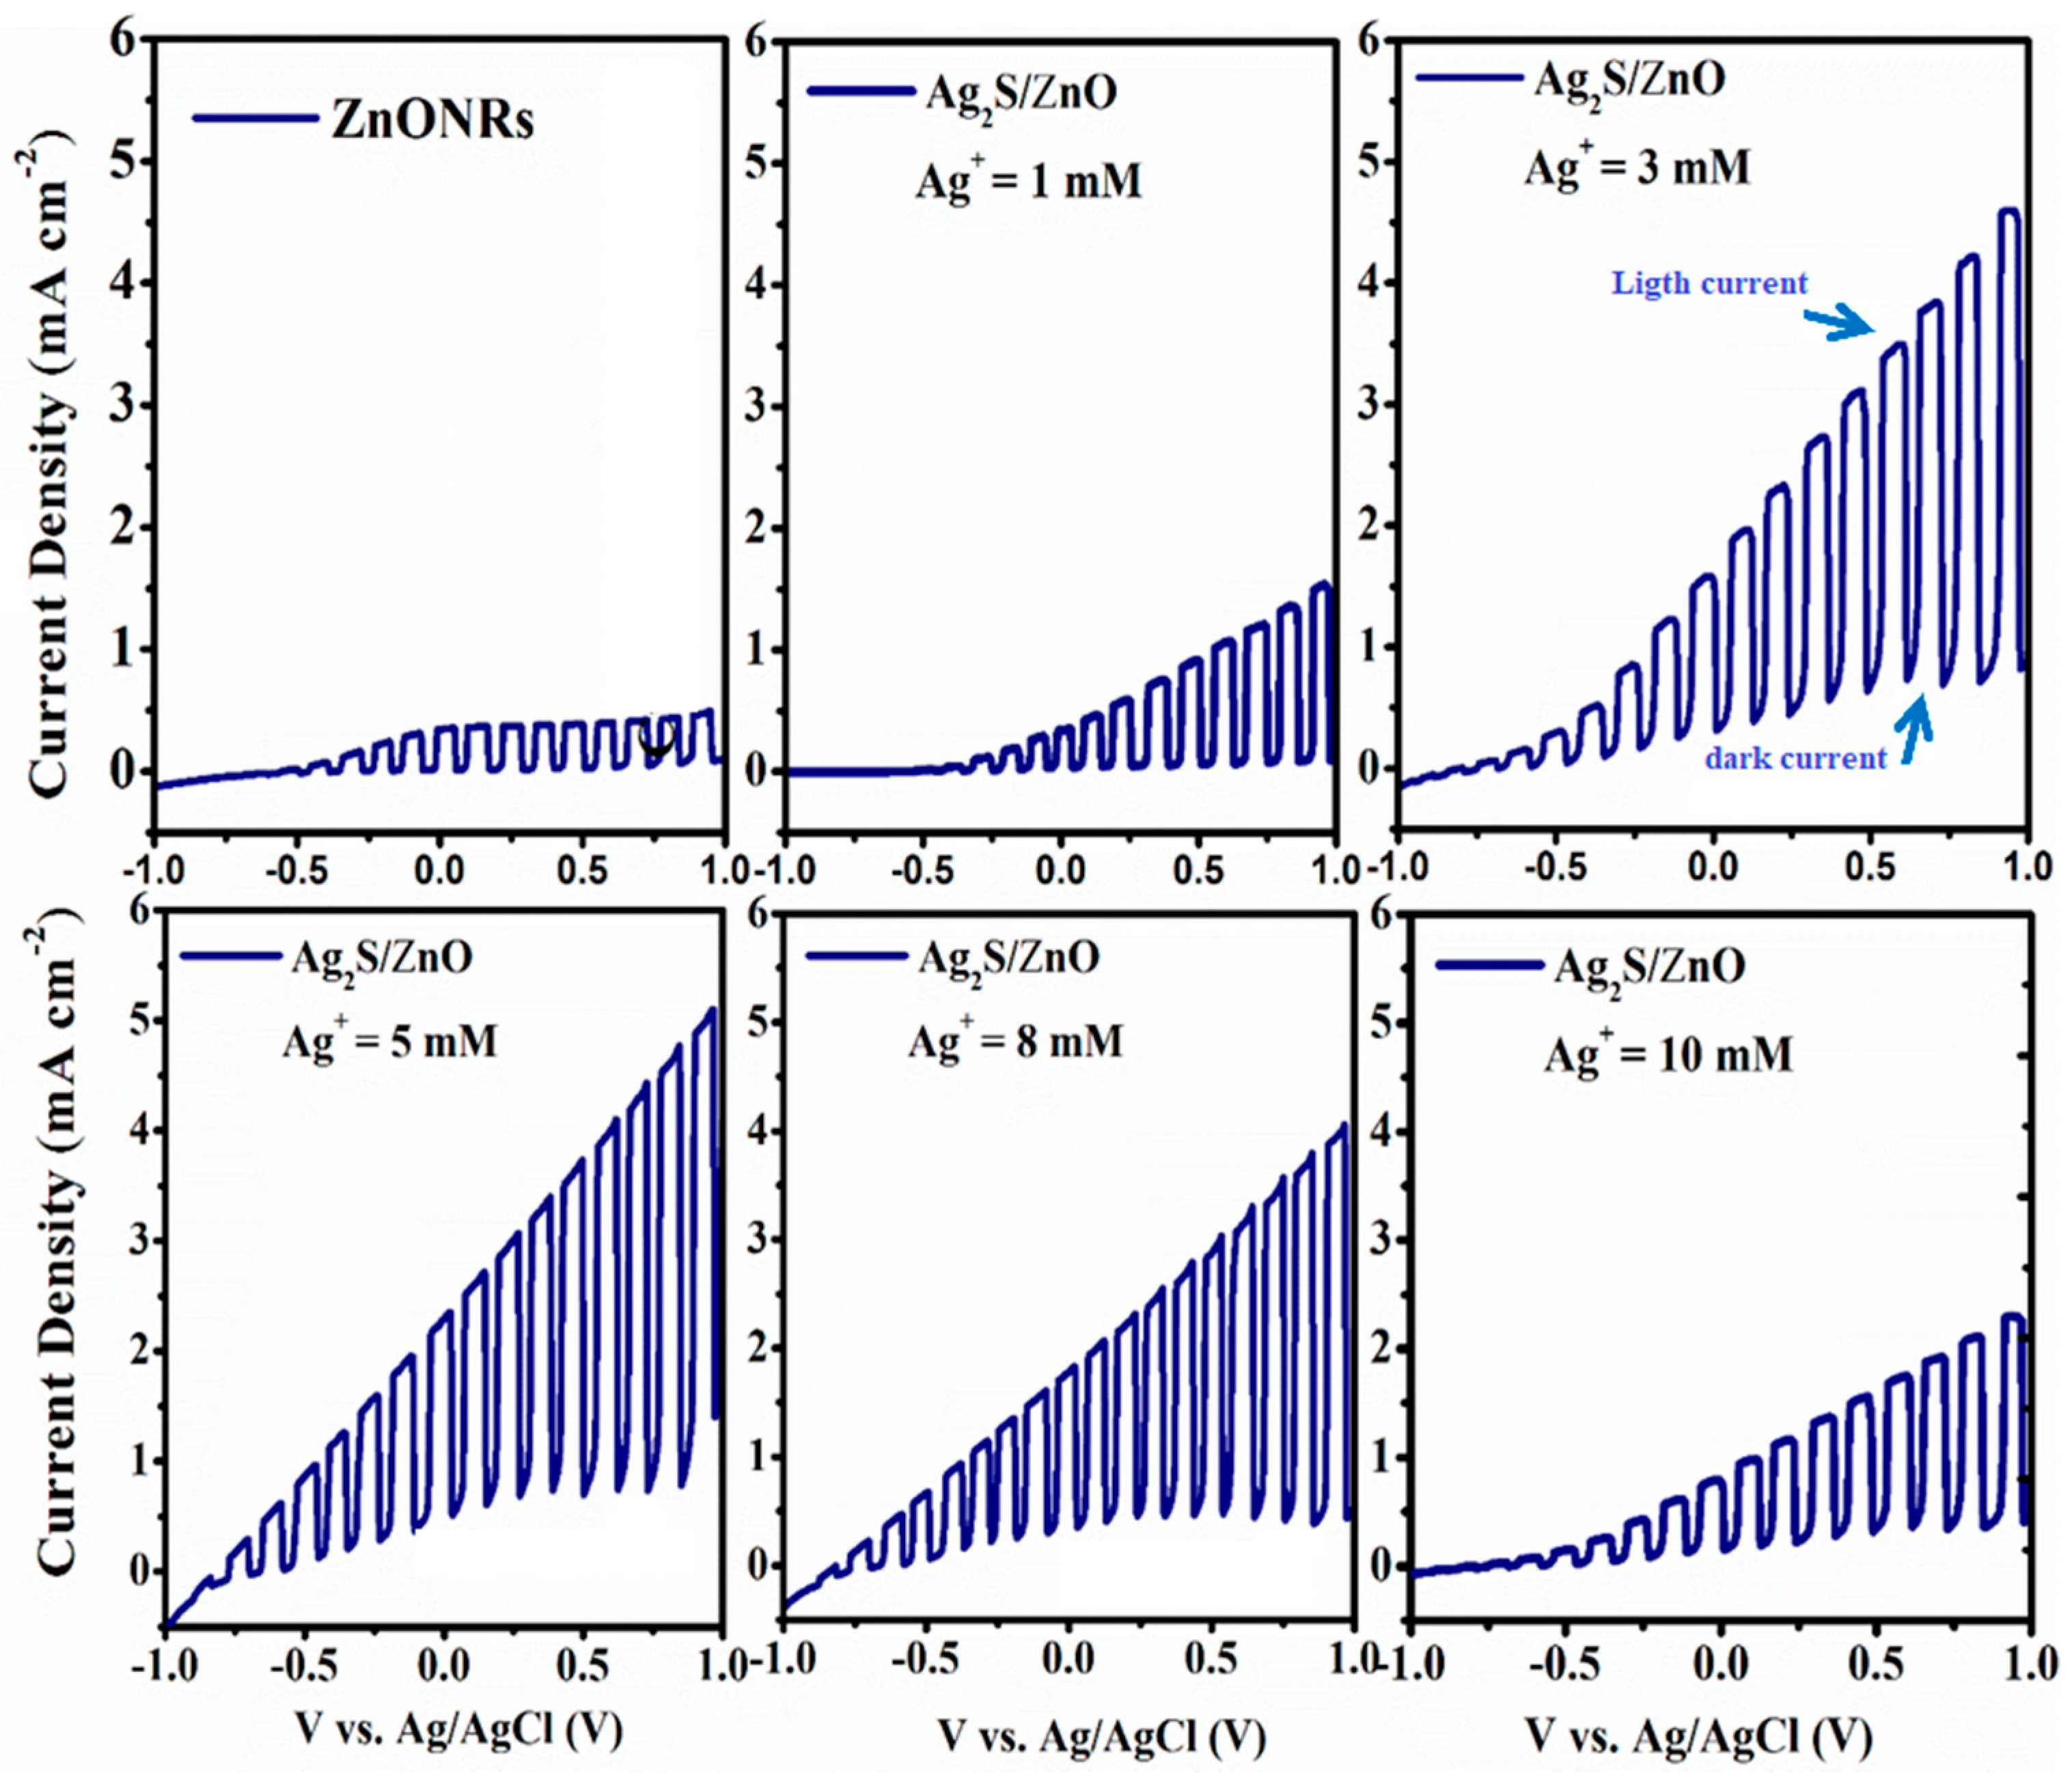
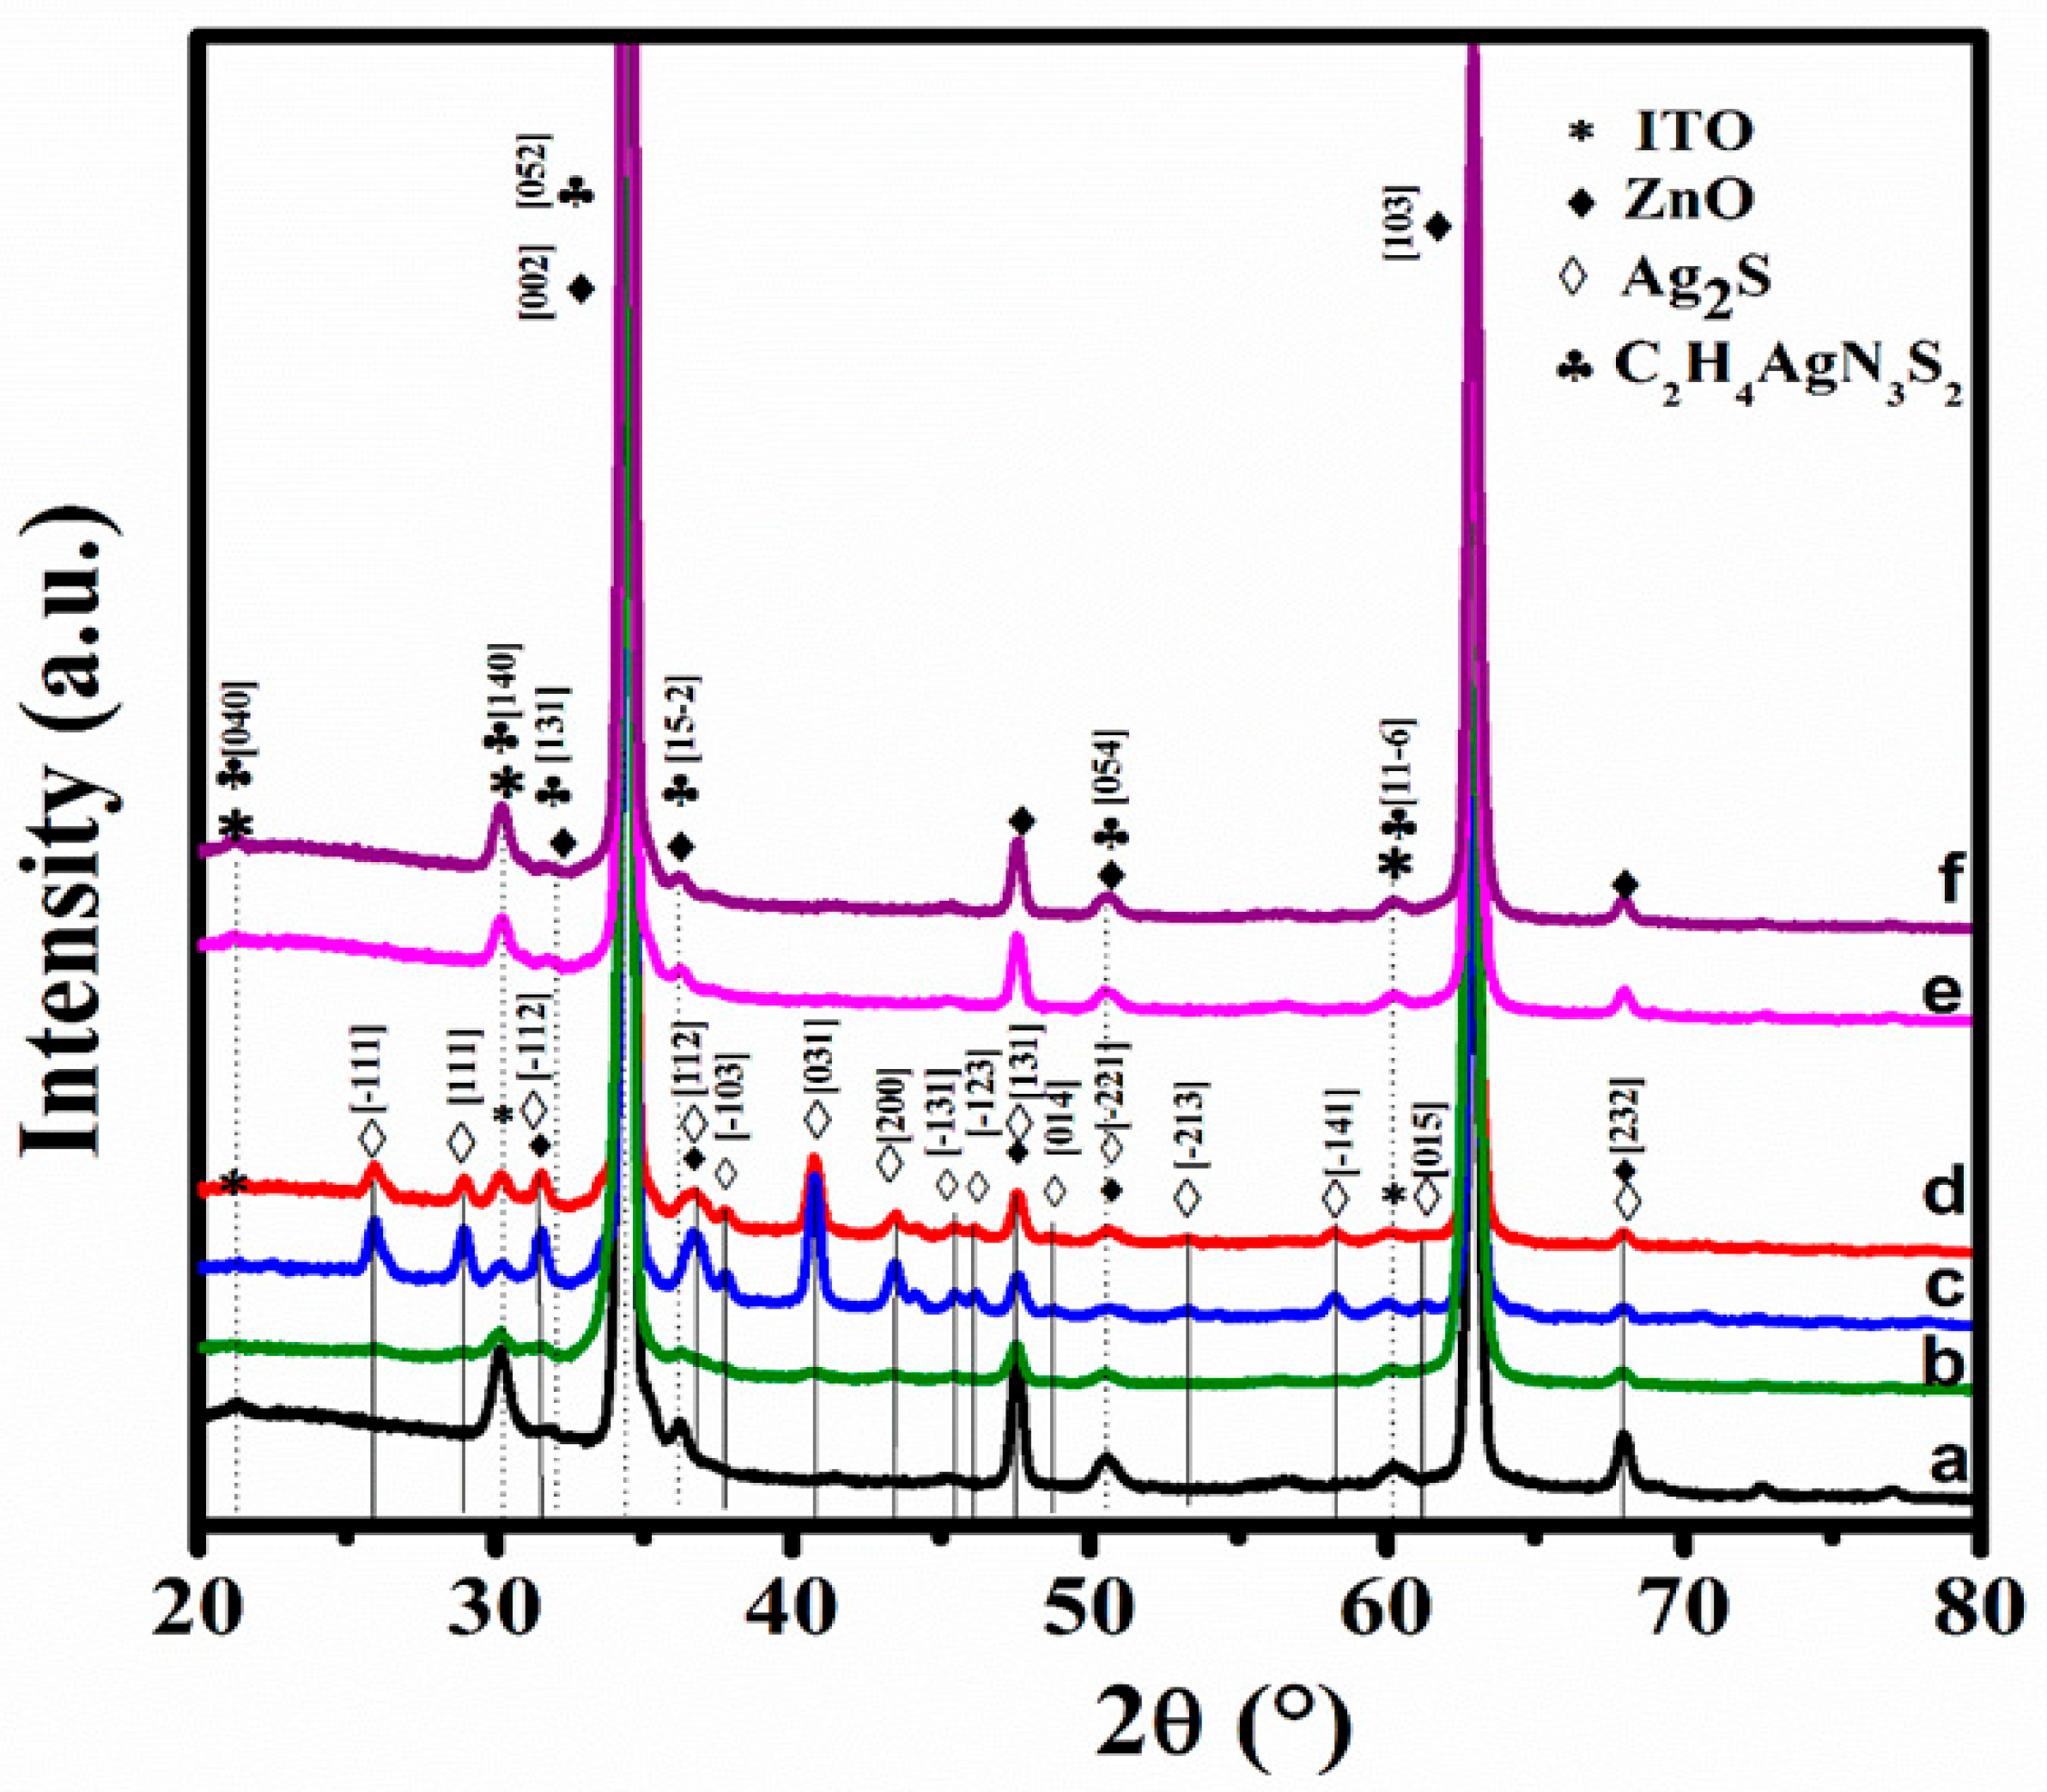
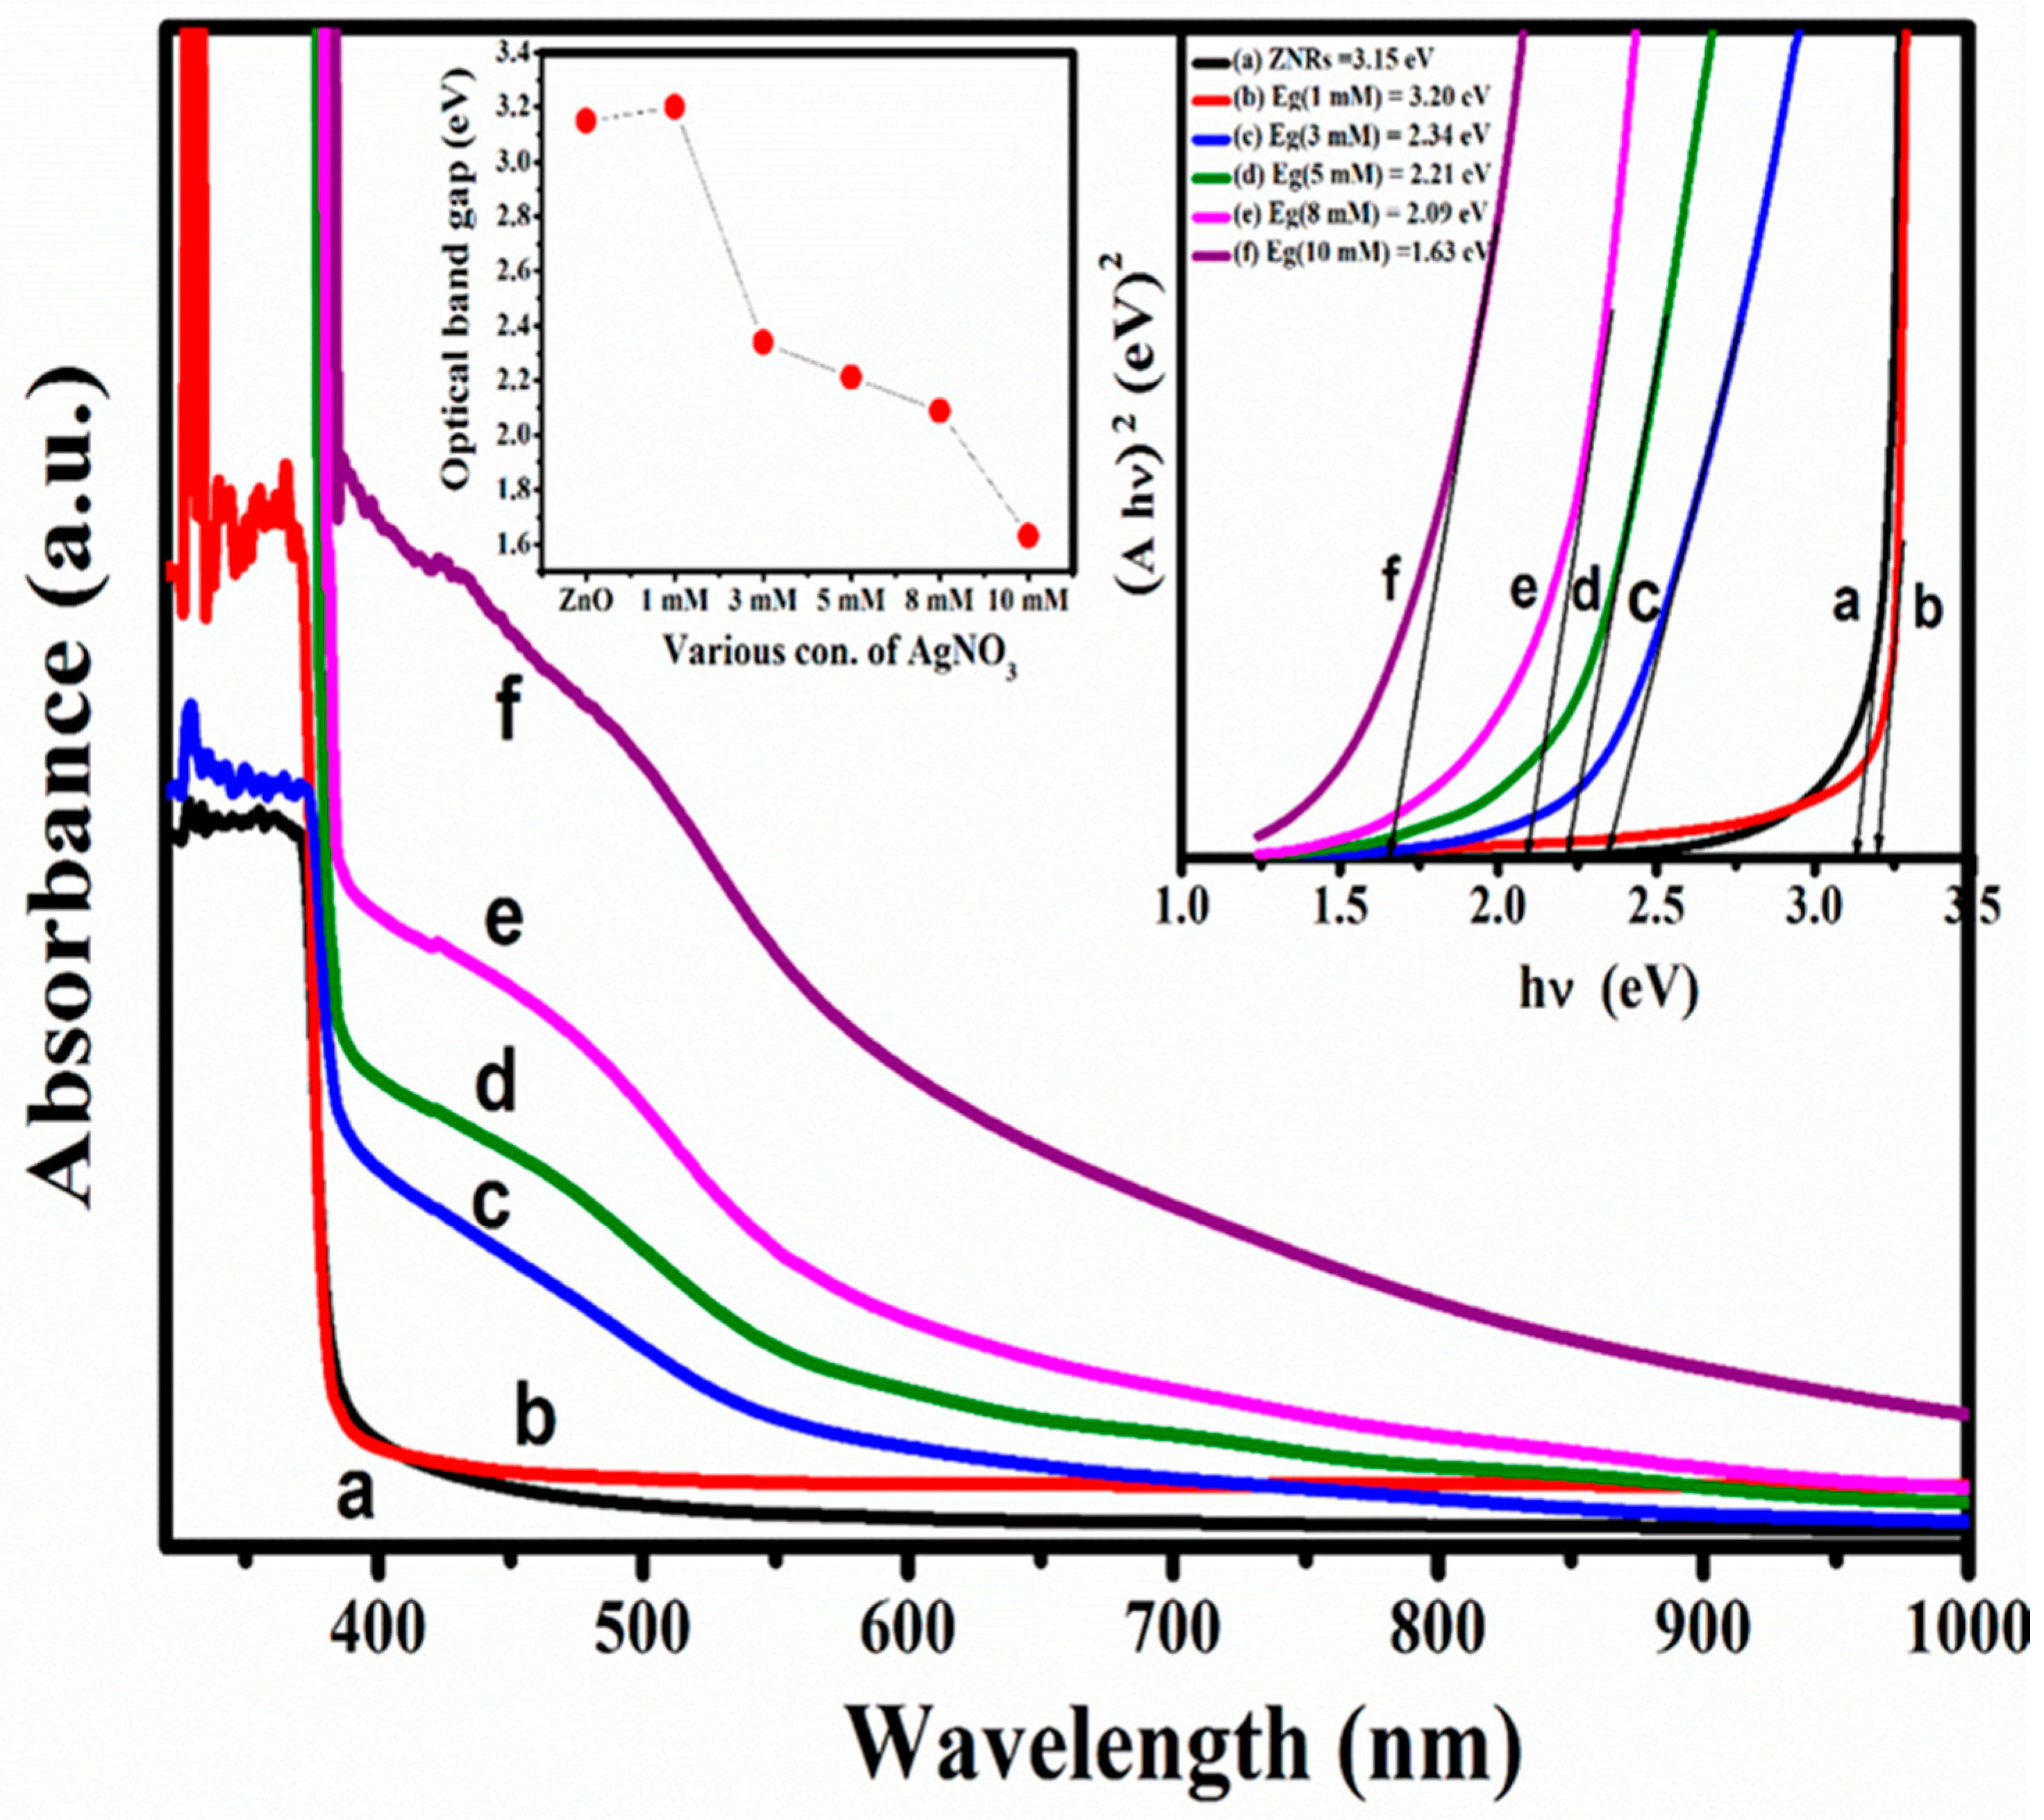
3.1. Part A: Effect of Varying AgNO3 Concentrations
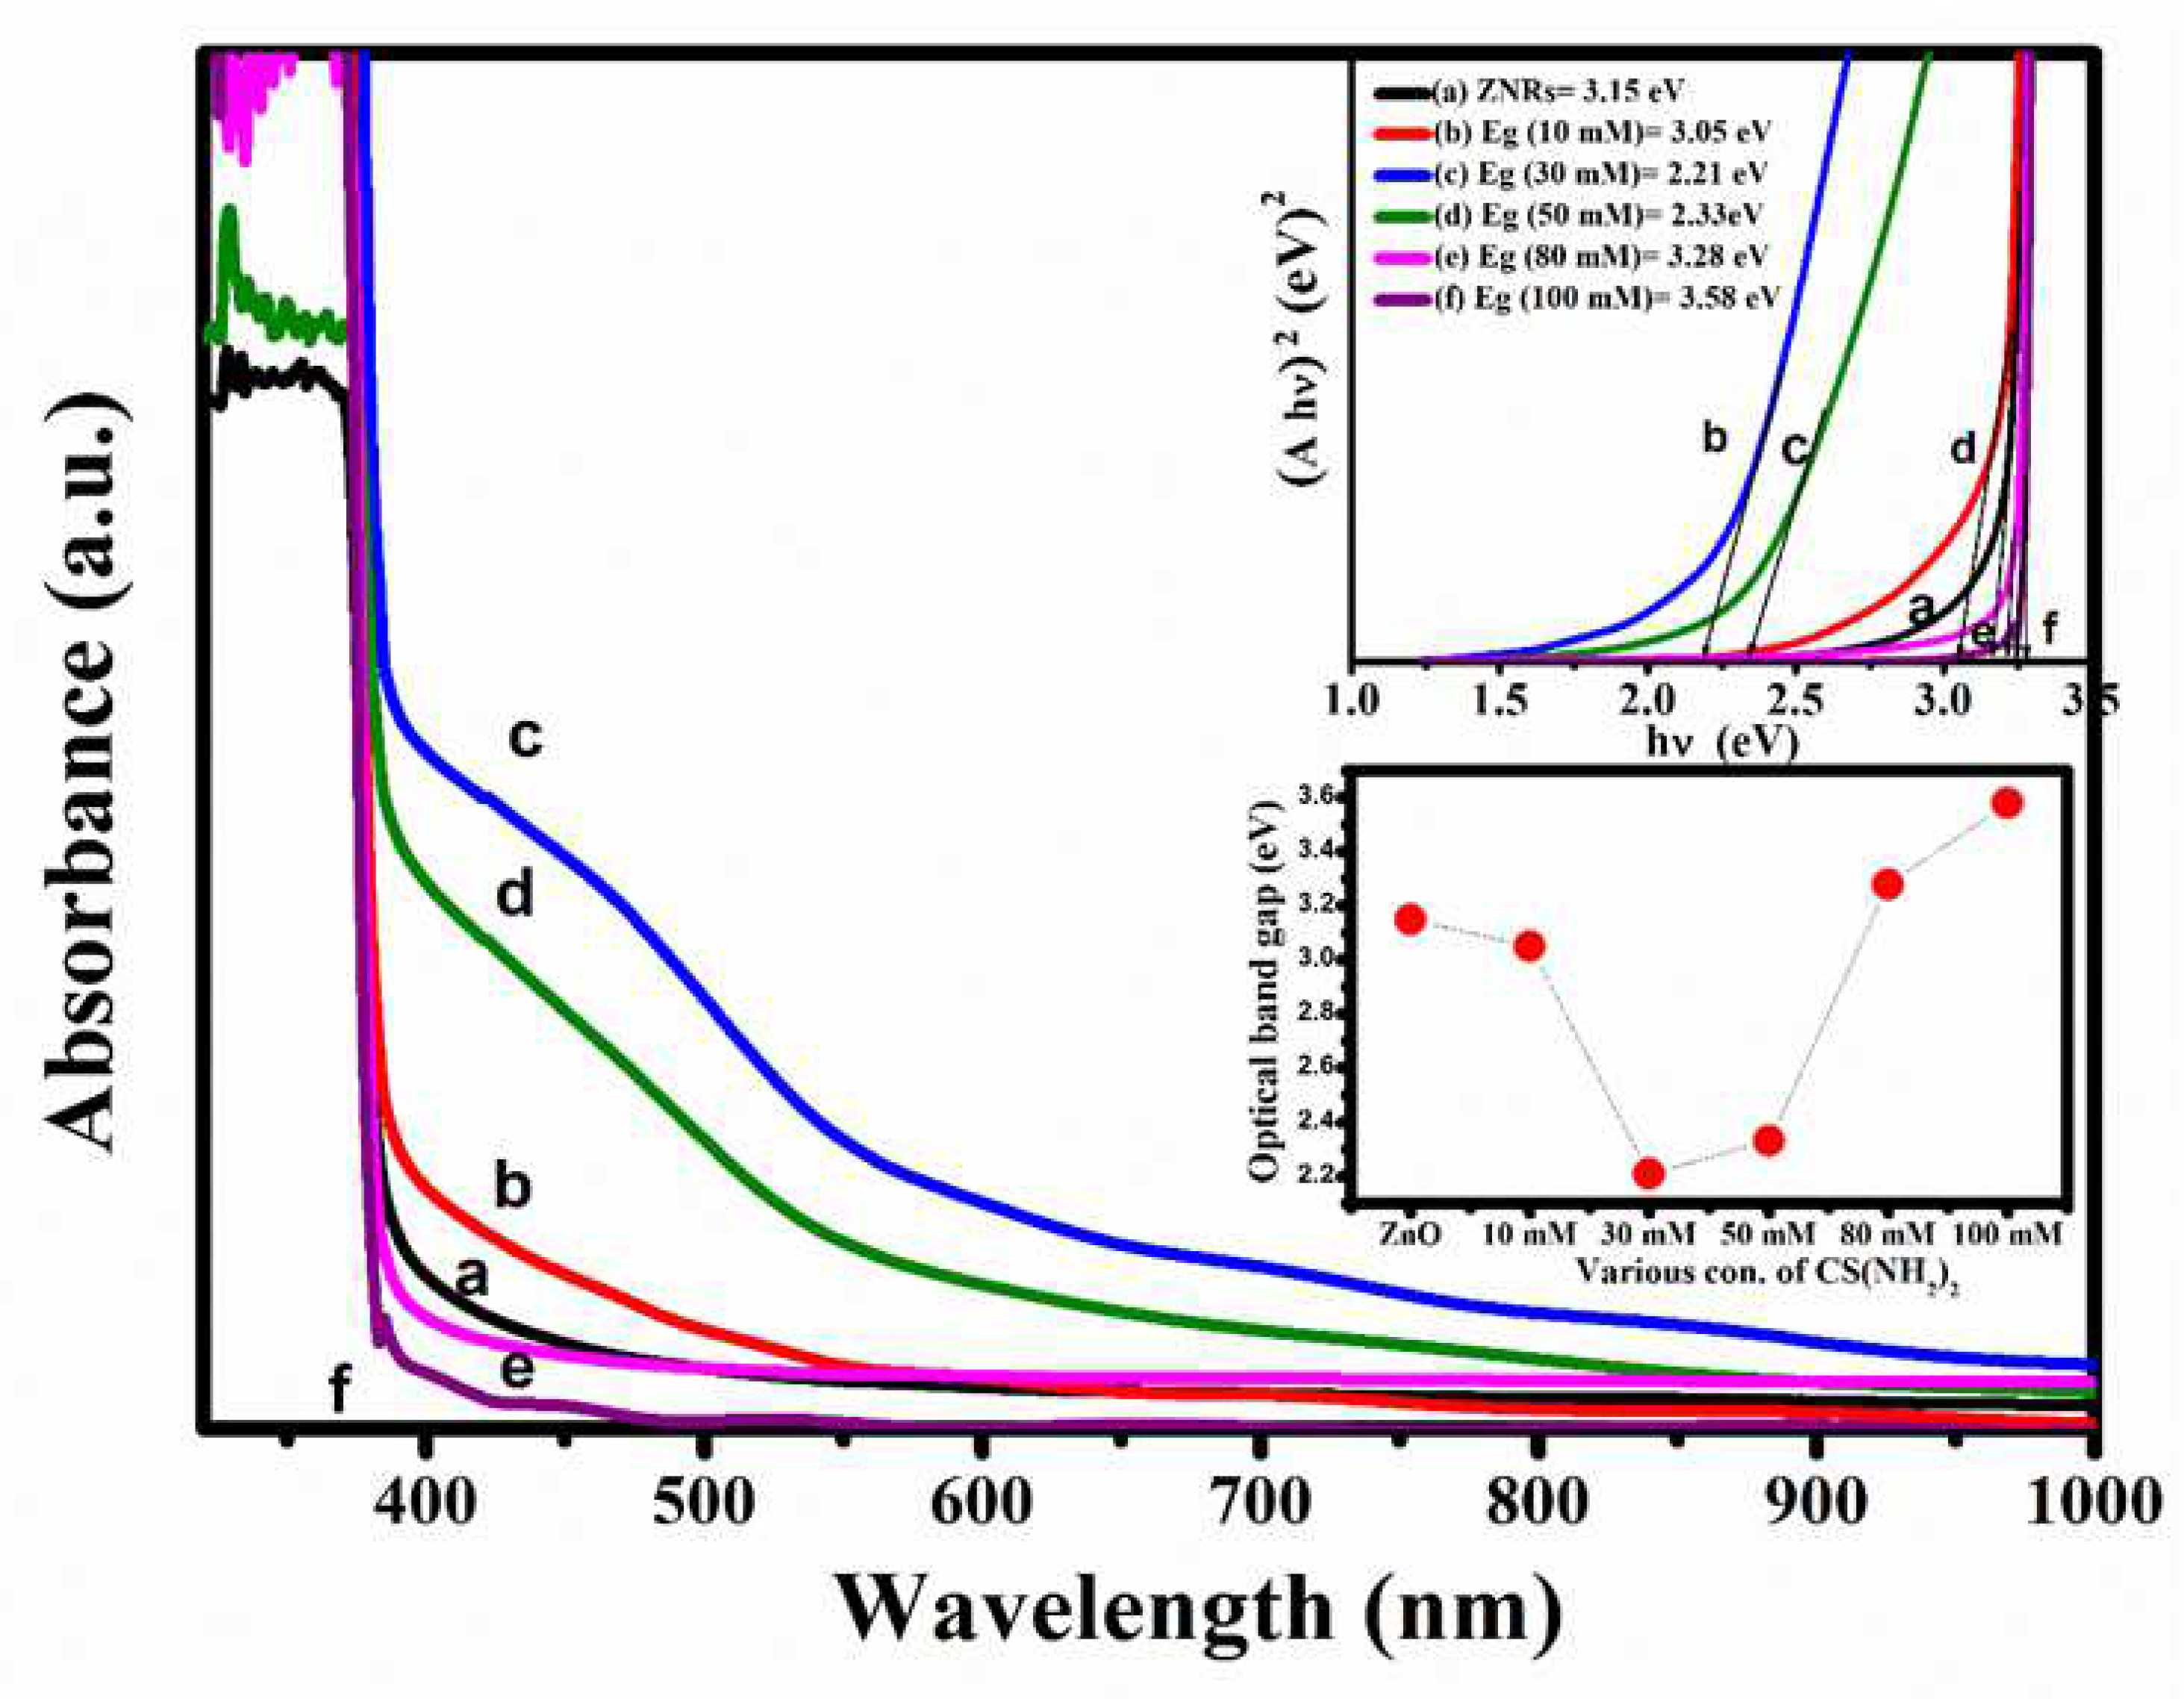
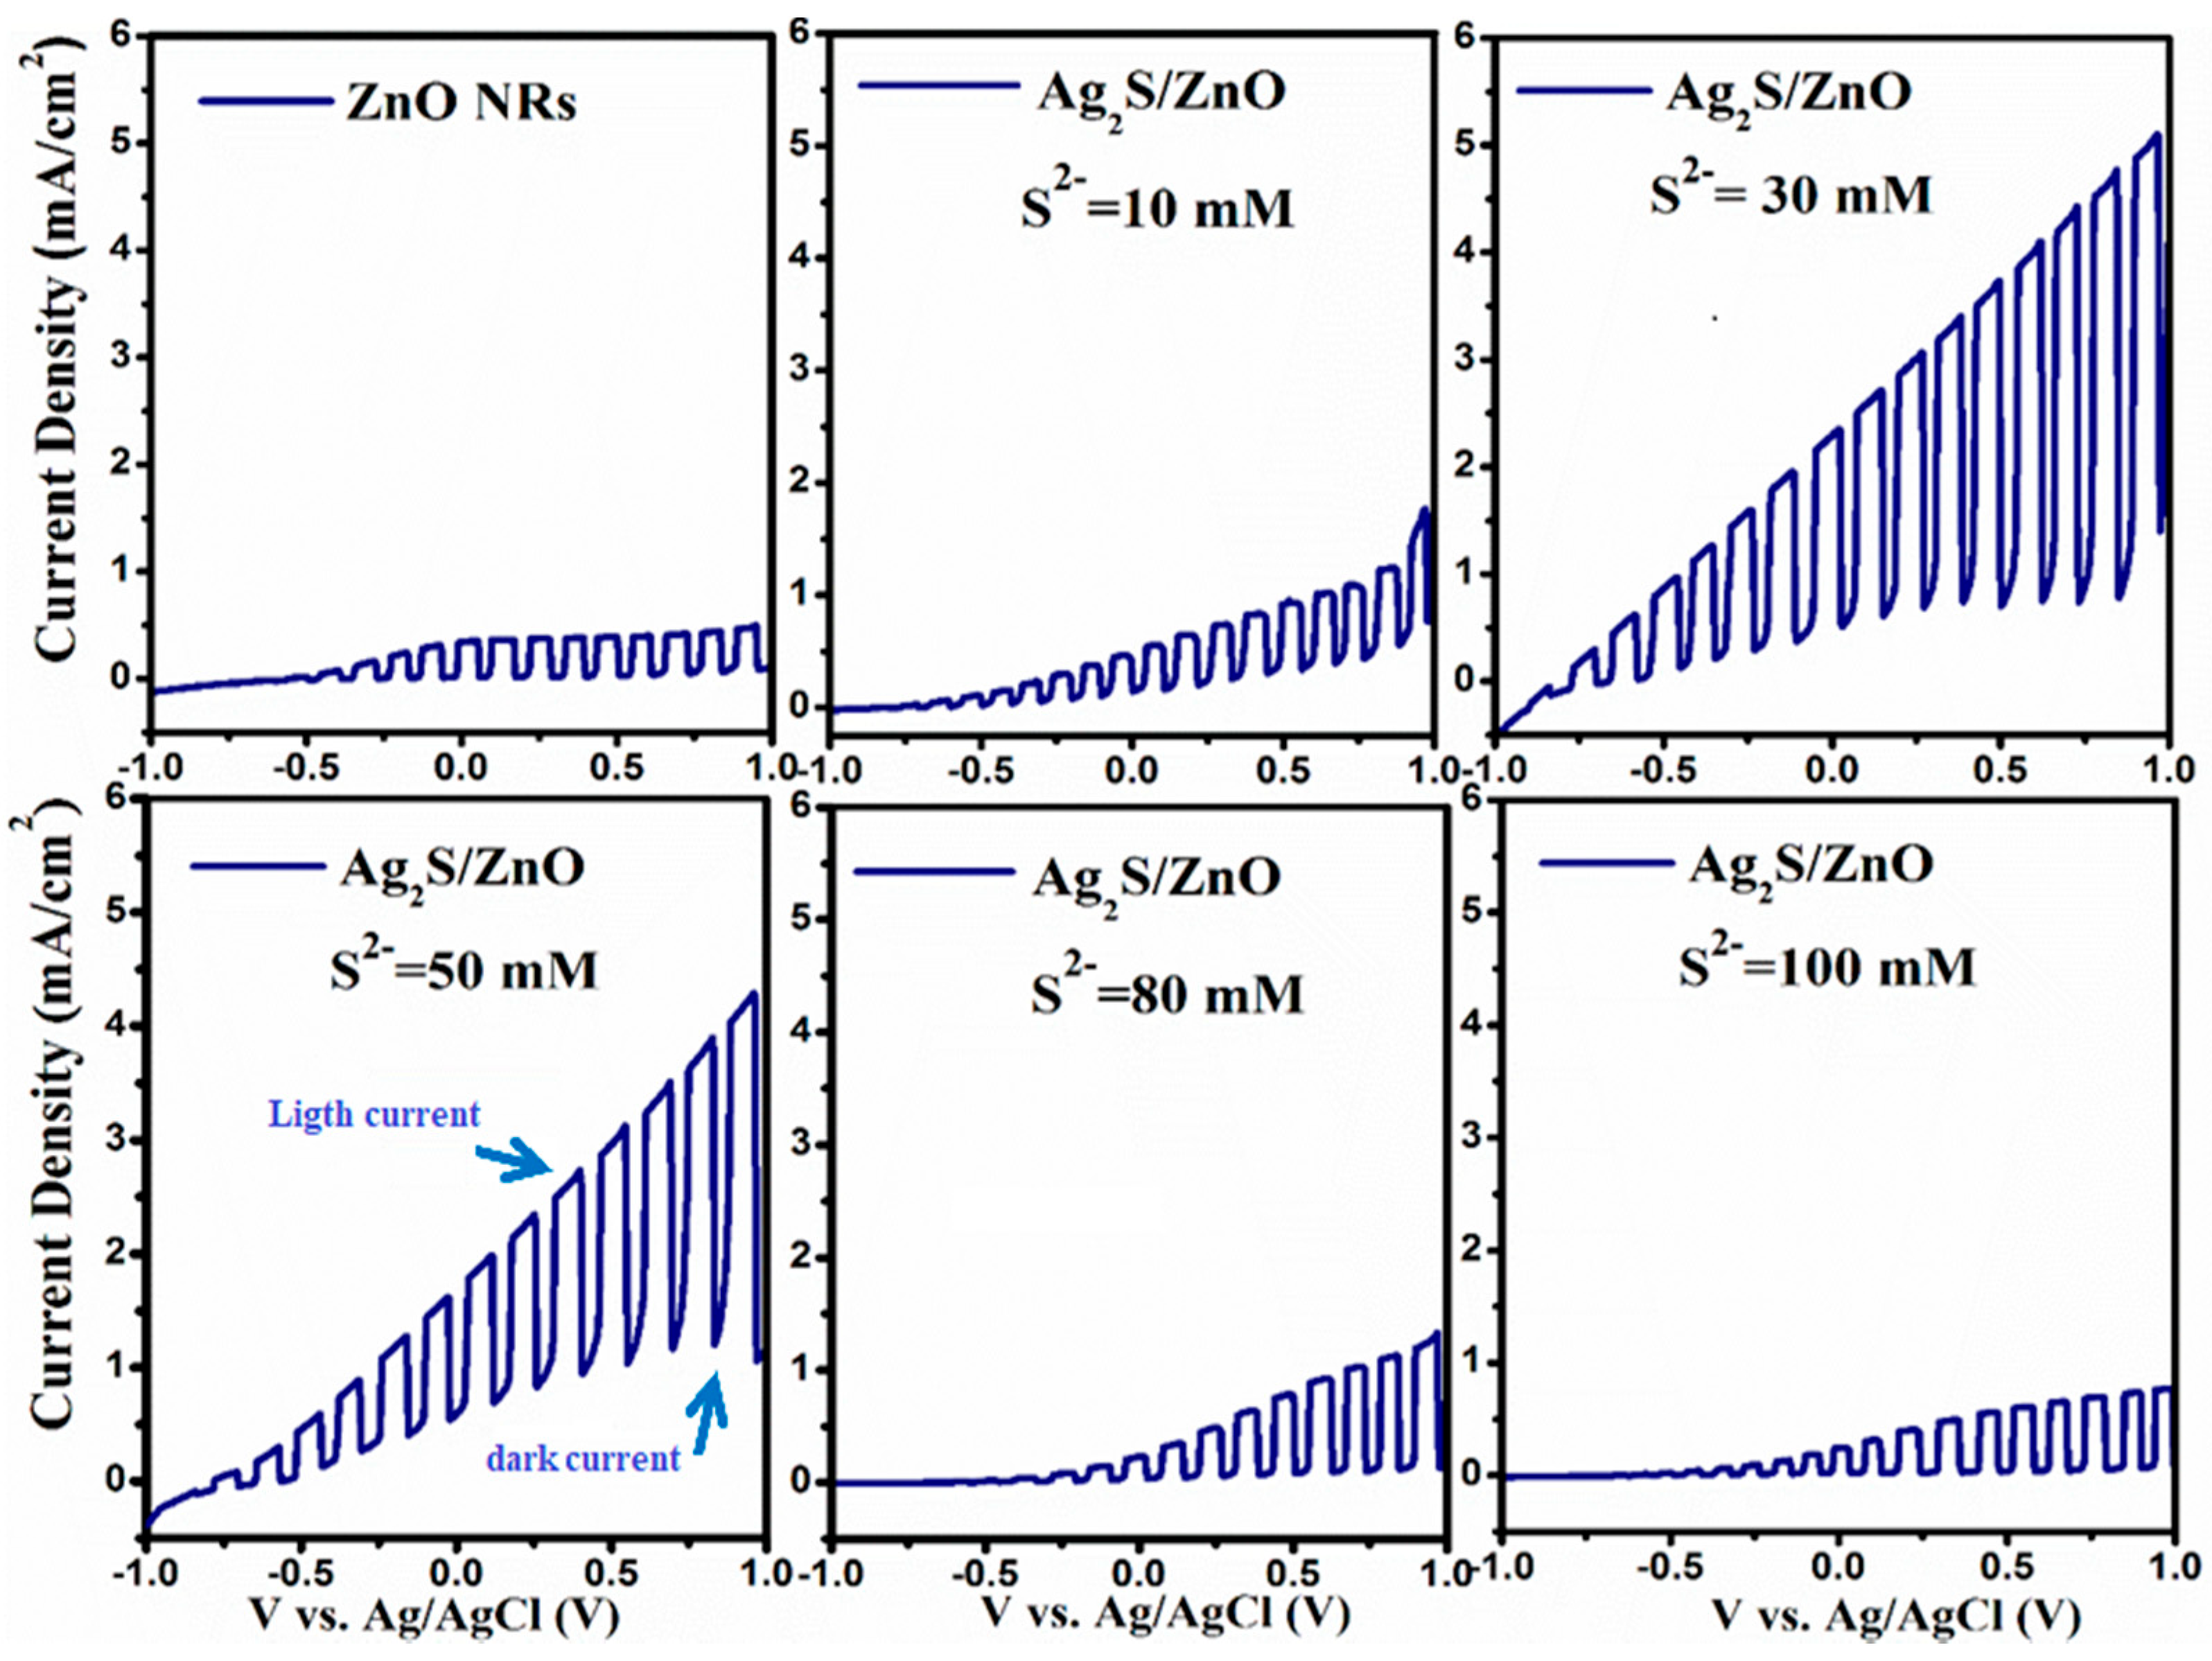
3.2. Part B: Effect of Varying CS(NH2)2 Concentration
4. Conclusions
Author Contributions
Funding
Institutional Review Board Statement
Informed Consent Statement
Conflicts of Interest
References
- Bian, H.; Li, D.; Yan, J.; Liu, S.F. Perovskite—A wonder catalyst for solar hydrogen production. J. Energy Chem. 2021, 57, 325–340. [Google Scholar] [CrossRef]
- Raj, J.S.; Sivaraman, P.; Prem, P.; Matheswaran, A. Wide Band Gap semiconductor material for electric vehicle charger. Mater. Proc. 2021, 45, 852–856. [Google Scholar]
- Wang, F.; Li, Q.; Xu, D. Recent progress in semiconductor-based nanocomposite photocatalysts for solar-to-chemical energy conversion. Adv. Energy Mater. 2017, 7, 1700529. [Google Scholar] [CrossRef] [Green Version]
- Cao, F.; Oskam, G.; Searson, P.C. A solid state, dye sensitized photoelectrochemical cell. J. Phys. Chem. 1995, 99, 17071–17073. [Google Scholar] [CrossRef]
- Nayak, S.; Parida, K. Recent Progress in LDH@ Graphene and Analogous Heterostructures for Highly Active and Stable Photocatalytic and Photoelectrochemical Water Splitting. Chem. Asian J. 2021, 16, 2211–2248. [Google Scholar] [CrossRef]
- Kim, J.H.; Hansora, D.; Sharma, P.; Jang, J.W.; Lee, J.S. Toward practical solar hydrogen production—An artificial photosynthetic leaf-to-farm challenge. Chem. Soc. Rev. 2019, 48, 1908–1971. [Google Scholar] [CrossRef]
- Jiang, C.; Moniz, S.J.; Wang, A.; Zhang, T.; Tang, J. Photoelectrochemical devices for solar water splitting–materials and challenges. Chem. Soc. Rev. 2017, 46, 4645–4660. [Google Scholar] [CrossRef] [Green Version]
- Awaid, T.J.; Ayal, A.K.; Farhan, A.M.; Sando, M.S.; Chin, L.Y. Effect of electrolyte composition on structural and photoelectrochemical properties of titanium dioxide nanotube arrays synthesized by anodization technique. Baghdad Sci. J. 2020, 17, 1183. [Google Scholar] [CrossRef]
- AL-Zahrani, A.A.; Zainal, Z.; Talib, Z.A.; Lim, H.N.; Mohd Fudzi, L.; Holi, A.M. Synthesis of binary Bi2S3/ZnO nanorod array heterostructure and their photoelectrochemical performance. J. Nanomater. 2019, 2019, 5212938. [Google Scholar] [CrossRef] [Green Version]
- Kumar, P.; Thakur, U.K.; Alam, K.; Kar, P.; Kisslinger, R.; Zeng, S.; Patel, S.; Shankar, K. Arrays of TiO2 nanorods embedded with fluorine doped carbon nitride quantum dots (CNFQDs) for visible light driven water splitting. Carbon 2018, 137, 174–187. [Google Scholar] [CrossRef]
- Al-Zahrani, A.A.; Zainal, Z.; Talib, Z.A.; Lim, H.N.; Holi, A.M.; Bahrudin, N.N. Enhanced photoelectrochemical performance of Bi2S3/Ag2S/ZnO novel ternary heterostructure nanorods. Arab. J. Chem. 2020, 13, 9166–9178. [Google Scholar] [CrossRef]
- Guan, P.; Bai, H.; Wang, F.; Yu, H.; Xu, D.; Chen, B.; Xia, T.; Fan, W.; Shi, W. Boosting water splitting performance of BiVO4 photoanode through selective surface decoration of Ag2S. ChemCatChem 2018, 10, 4927–4933. [Google Scholar] [CrossRef]
- Zoha, S.; Ahmad, M.; Zaidi, S.J.; Ashiq, M.N.; Ahmad, W.; Park, T.J.; Basit, M.A. ZnO-based mutable Ag2S/Ag2O multilayered architectures for organic dye degradation and inhibition of E. coli and B. subtilis. J. Photochem. Photobiol. A Chem. 2020, 394, 112472. [Google Scholar] [CrossRef]
- Orimolade, B.O.; Arotiba, O.A. Towards visible light driven photoelectrocatalysis for water treatment: Application of a FTO/BiVO4/Ag2S heterojunction anode for the removal of emerging pharmaceutical pollutants. Sci. Rep. 2020, 10, 5348. [Google Scholar] [CrossRef] [PubMed] [Green Version]
- Chen, C.; Li, Z.; Lin, H.; Wang, G.; Liao, J.; Li, M.; Lv, S.; Li, W. Enhanced visible light photocatalytic performance of ZnO nanowires integrated with CdS and Ag2S. Dalton Trans. 2016, 45, 3750–3758. [Google Scholar] [CrossRef] [PubMed]
- Tatarchuk, T.; Peter, A.; Al-Najar, B.; Vijaya, J.; Bououdina, M. Photocatalysis: Activity of nanomaterials. In Nanotechnology in Environmental Science; Hussain, C.M., Mishra, A.K., Eds.; Wiley-VCH: Weinheim, Germany, 2018; pp. 209–292. [Google Scholar]
- Shafi, A.; Ahmad, N.; Sultana, S.; Sabir, S.; Khan, M.Z. Ag2S-sensitized NiO–ZnO heterostructures with enhanced visible light photocatalytic activity and acetone sensing property. ACS Omega 2019, 4, 12905–12918. [Google Scholar] [CrossRef] [Green Version]
- Maevskaya, M.V.; Rudakova, A.V.; Koroleva, A.V.; Sakhatskii, A.S.; Emeline, A.V.; Bahnemann, D.W. Effect of the Type of Heterostructures on Photostimulated Alteration of the Surface Hydrophilicity: TiO2/BiVO4 vs. ZnO/BiVO4 Planar Heterostructured Coatings. Catalysts 2021, 11, 1424. [Google Scholar] [CrossRef]
- Enesca, A.; Isac, L. Tuned S-Scheme Cu2S_TiO2_WO3 Heterostructure Photocatalyst toward S-Metolachlor (S-MCh) Herbicide Removal. Materials 2021, 14, 2231. [Google Scholar] [CrossRef]
- Adachi, S. Properties of Semiconductor Alloys: Group-IV, III–V and II–VI Semiconductors; John Wiley & Sons: New York, NY, USA, 2009. [Google Scholar]
- Li, D.; Wu, W.; Zhao, Y.; Qiao, R. Type-II heterojunction constructed by Ag2S-coupled ZnO microspheres with visible light-responsive antibacterial activity. Mater. Lett. 2020, 271, 127709. [Google Scholar] [CrossRef]
- Jin, Y.; Jiao, S.; Wang, D.; Gao, S.; Wang, J. Enhanced UV Photoresponsivity of ZnO Nanorods Decorated with Ag2S/ZnS Nanoparticles by Successive Ionic Layer Adsorption and Reaction Method. Nanomaterials 2021, 11, 461. [Google Scholar] [CrossRef]
- Subash, B.; Krishnakumar, B.; Pandiyan, V.; Swaminathan, M.; Shanthi, M. An efficient nanostructured Ag2S–ZnO for degradation of Acid Black 1 dye under day light illumination. Sep. Purif. Technol. 2012, 96, 204–213. [Google Scholar] [CrossRef]
- Adnan, M.A.; Julkapli, N.M.; Abd Hamid, S.B. Review on ZnO hybrid photocatalyst: Impact on photocatalytic activities of water pollutant degradation. Rev. Inorg. Chem. 2016, 36, 77–104. [Google Scholar]
- Su, T.; Shao, Q.; Qin, Z.; Guo, Z.; Wu, Z. Role of interfaces in two-dimensional photocatalyst for water splitting. ACS Catal. 2018, 8, 2253–2276. [Google Scholar] [CrossRef]
- Chen, D.; Wei, L.; Wang, D.; Chen, Y.; Tian, Y.; Yan, S.; Mei, L.; Jiao, J. Ag2S/ZnO core-shell nanoheterojunction for a self-powered solid-state photodetector with wide spectral response. J. Alloy. Compd. 2018, 735, 2491–2496. [Google Scholar] [CrossRef]
- Arakawa, Y.; Holmes, M.J. Progress in quantum-dot single photon sources for quantum information technologies: A broad spectrum overview. Appl. Phys. Rev. 2020, 7, 021309. [Google Scholar] [CrossRef]
- Holi, A.M.; Zainal, Z.; Talib, Z.A.; Lim, H.N.; Yap, C.C.; Chang, S.K.; Ayal, A.K. Hydrothermal deposition of CdS on vertically aligned ZnO nanorods for photoelectrochemical solar cell application. J. Mater. Sci. Mater. Electron. 2016, 27, 7353–7360. [Google Scholar] [CrossRef]
- Ayal, A.K. Enhanced photocurrent of titania nanotube photoelectrode decorated with CdS nanoparticles. Baghdad Sci. J. 2018, 15, 57–62. [Google Scholar]
- Ayal, A.K.; Zainal, Z.; Holi, A.M.; Lim, H.N.; Talib, Z.A.; Lim, Y.C. Sensitization of TiO2 nanotube arrays photoelectrode via homogeneous distribution of CdSe nanoparticles by electrodeposition techniques. J. Phys. Chem. Solids 2021, 153, 110006. [Google Scholar] [CrossRef]
- Li, Z.; Jin, D.; Wang, Z. ZnO/CdSe-diethylenetriamine nanocomposite as a step-scheme photocatalyst for photocatalytic hydrogen evolution. Appl. Surf. Sci. 2020, 529, 147071. [Google Scholar] [CrossRef]
- Zhang, Q.; Xiao, Y.; Li, Y.; Zhao, K.; Deng, H.; Lou, Y.; Chen, J.; Cheng, L. NiS-Decorated ZnO/ZnS Nanorod Heterostructures for Enhanced Photocatalytic Hydrogen Production: Insight into the Role of NiS. Sol. RRL 2020, 4, 1900568. [Google Scholar] [CrossRef]
- Liu, Y.; Chen, F.; Li, Q.; Bao, H. Synthesis of CdTe/Carbon nanotube/ZnO flower-like micro-spheres and their photocatalytic activities in degradation of rohdamine B. Mater. Lett. 2018, 210, 23–25. [Google Scholar] [CrossRef]
- Holi, A.M.; Al-Zahrani, A.A.; Najm, A.S.; Chelvanathan, P.; Amin, N. PbS/CdS/ZnO nanowire arrays: Synthesis, structural, optical, electrical, and photoelectrochemical properties. Chem. Phys. Lett. 2020, 750, 137486. [Google Scholar] [CrossRef]
- Holi, A.M.; Zainal, Z.; Ayal, A.K.; Chang, S.K.; Lim, H.N.; Talib, Z.A.; Yap, C.C. Ag2S/ZnO nanorods composite photoelectrode prepared by hydrothermal method: Influence of growth temperature. Optik 2019, 184, 473–479. [Google Scholar] [CrossRef]
- Jayswal, S.; Moirangthem, R.S. Construction of a solar spectrum active SnS/ZnO p–n heterojunction as a highly efficient photocatalyst: The effect of the sensitization process on its performance. New J. Chem. 2018, 42, 13689–13701. [Google Scholar] [CrossRef]
- AL-Zahrani, A.A.; Zainal, Z.; Talib, Z.A.; Lim, H.N.; Holi, A.M. Study the Effect of the Heat Treatment on the Photoelectrochemical Performance of Binary Heterostructured Photoanode Ag2S/ZnO Nanorod Arrays in Photoelectrochemical Cells. Mater. Sci. Forum 2020, 1002, 187–199. [Google Scholar] [CrossRef]
- Lei, Y.; Jia, H.; He, W.; Zhang, Y.; Mi, L.; Hou, H.; Zhu, G.; Zheng, Z. Hybrid solar cells with outstanding short-circuit currents based on a room temperature soft-chemical strategy: The case of P3HT: Ag2S. J. Am. Chem. Soc. 2012, 134, 17392–17395. [Google Scholar] [CrossRef]
- Sadovnikov, S.I.; Gusev, A.I. Recent progress in nanostructured silver sulfide: From synthesis and nonstoichiometry to properties. J. Mater. Chem. A 2017, 5, 17676–17704. [Google Scholar] [CrossRef] [Green Version]
- Sankapal, B.R.; Mane, R.S.; Lokhande, C.D. A new chemical method for the preparation of Ag2S thin films. Mater. Chem. Phys. 2000, 63, 226–229. [Google Scholar] [CrossRef]
- Zamiri, R.; Abbastabar Ahangar, H.; Zakaria, A.; Zamiri, G.; Shabani, M.; Singh, B.; Ferreira, J.M. The structural and optical constants of Ag2S semiconductor nanostructure in the Far-Infrared. Chem. Cent. J. 2015, 9, 28. [Google Scholar] [CrossRef] [Green Version]
- Xue, J.; Liu, J.; Liu, Y.; Li, H.; Wang, Y.; Sun, D.; Wang, W.; Huang, L.; Tang, J. Recent advances in synthetic methods and applications of Ag2S-based heterostructure photocatalysts. J. Mater. Chem. C 2019, 7, 3988–4003. [Google Scholar] [CrossRef]
- Holi, A.M.; Zainal, Z.; Ayal, A.K.; Chang, S.K.; Lim, H.N.; Talib, Z.A.; Yap, C.C. Effect of heat treatment on photoelectrochemical performance of hydrothermally synthesised Ag2S/ZnO nanorods arrays. Chem. Phys. Lett. 2018, 710, 100–107. [Google Scholar] [CrossRef]
- Holi, A.M.; Zainal, Z.; Talib, Z.A.; Lim, H.N.; Yap, C.C.; Chang, S.K.; Ayal, A.K. Effect of hydrothermal growth time on ZnO nanorod arrays photoelectrode performance. Optik 2016, 127, 11111–11118. [Google Scholar] [CrossRef]
- Morales Masis, M. Resistive Switching in Mixed Conductors: Ag2S as a Model System; Leiden University: Leiden, The Netherlands, 2012. [Google Scholar]
- Nishimura, D. Report on the Chemical Treatment of Photographic Materials Workshop: A Chemist’s Perspective. Top. Photogr. Preserv. 2001, 9, 1–43. [Google Scholar]
- James, T.H. The Theory of the Photographic Process; Macmillan: New York, NY, USA, 1966. [Google Scholar]
- Liu, Y.; Yan, X.; Kang, Z.; Li, Y.; Shen, Y.; Sun, Y.; Wang, L.; Zhang, Y. Synergistic effect of surface plasmonic particles and surface passivation layer on ZnO nanorods array for improved photoelectrochemical water splitting. Sci. Rep. 2016, 6, 29907. [Google Scholar] [CrossRef]
- Kumar, S.; Ahirwar, S.; Satpati, A.K. Insight into the PEC and interfacial charge transfer kinetics at the Mo doped BiVO4 photoanodes. RSC Adv. 2019, 9, 41368–41382. [Google Scholar] [CrossRef] [Green Version]
- Yavarinasab, A.; Abedini, M.; Tahmooressi, H.; Janfaza, S.; Tasnim, N.; Hoorfar, M. Potentiodynamic Electrochemical Impedance Spectroscopy of Polyaniline-Modified Pencil Graphite Electrodes for Selective Detection of Biochemical Trace Elements. Polymers 2021, 14, 31. [Google Scholar] [CrossRef]


| Ag+ | 2θ (°) | D-Spacing (Å) | (hkl) | Compound | |
|---|---|---|---|---|---|
| Source | Observed | Observed | Standard | ||
| 0.001 M | 21.236 | 4.174 | 4.157 | (040) | C2H4AgN3S2 |
| 30.358 | 2.958 | 2.919 | (140) | C2H4AgN3S2 | |
| 31.744 | 2.815 | 2.81 | (131) | C2H4AgN3S2 | |
| 34.399 | 2.6 | 2.629 | (052) | C2H4AgN3S2 | |
| 36.247 | 2.474 | 2.487 | (15) | C2H4AgN3S2 | |
| 50.45 | 1.802 | 1.806 | (054) | C2H4AgN3S2 | |
| 60.149 | 1.533 | 1.539 | (11) | C2H4AgN3S2 | |
| 0.003 M | - | - | 3.96 | (01) | Ag2S |
| 25.899 | 3.427 | 3.437 | (11) | Ag2S | |
| 28.128 | 3.069 | 3.08 | (111) | Ag2S | |
| 31.549 | 2.831 | 2.836 | (12) | Ag2S | |
| 40.658 | 2.217 | 2.213 | (031) | Ag2S | |
| 43.656 | 2.076 | 2.083 | (200) | Ag2S | |
| 45.501 | 1.996 | 1.995 | (31) | Ag2S | |
| 46.193 | 1.964 | 1.963 | (23) | Ag2S | |
| 0.005 M | 22.538 | 3.949 | 3.96 | (01) | Ag2S |
| 25.871 | 3.441 | 3.437 | (11) | Ag2S | |
| 28.975 | 3.081 | 3.08 | (111) | Ag2S | |
| 31.618 | 2.833 | 2.836 | (12) | Ag2S | |
| 40.699 | 2.214 | 2.213 | (031) | Ag2S | |
| 43.458 | 2.083 | 2.083 | (200) | Ag2S | |
| 45.297 | 1.999 | 1.995 | (31) | Ag2S | |
| 46.217 | 1.963 | 1.963 | (23) | Ag2S | |
| 0.008 M | - | - | 3.96 | (01) | Ag2S |
| 25.936 | 3.43 | 3.437 | (11) | Ag2S | |
| 28.902 | 3.08 | 3.08 | (111) | Ag2S | |
| 31.516 | 2.831 | 2.836 | (12) | Ag2S | |
| 40.783 | 2.211 | 2.213 | (031) | Ag2S | |
| 43.431 | 2.08 | 2.083 | (200) | Ag2S | |
| 45.512 | 1.99 | 1.995 | (31) | Ag2S | |
| 46.174 | 1.965 | 1.963 | (23) | Ag2S | |
| 0.01 M | 22.438 | 3.947 | 3.96 | (01) | Ag2S |
| 25.937 | 3.433 | 3.437 | (11) | Ag2S | |
| 28.086 | 3.07 | 3.08 | (111) | Ag2S | |
| 31.535 | 2.829 | 2.836 | (12) | Ag2S | |
| 39.348 | 2.291 | 2.3 | (0, 2, 10) | S | |
| 40.748 | 2.218 | 2.213 | (031) | Ag2S | |
| 43.43 | 2.082 | 2.083 | (200) | Ag2S | |
| 45.529 | 1.989 | 1.995 | (31) | Ag2S | |
| 46.229 | 1.965 | 1.963 | (23) | Ag2S | |
| 57.308 | 1.608 | 1.61 | (2, 2, 14) | S | |
| 64.655 | 1.438 | 1.44 | (5, 3, 11) | S | |
| S2− Source | 2θ (°) | D-Spacing (Å) | (hkl) | Compound | |
|---|---|---|---|---|---|
| Observed | Observed | Standard | |||
| 0.01 M | - | - | 3.96 | (01) | Ag2S |
| 26.047 | 3.421 | 3.437 | (11) | Ag2S | |
| - | - | 3.08 | (111) | Ag2S | |
| 31.531 | 2.835 | 2.836 | (12) | Ag2S | |
| 40.83 | 2.21 | 2.213 | (031) | Ag2S | |
| 43.452 | 2.078 | 2.083 | (200) | Ag2S | |
| 45.36 | 1.948 | 1.995 | (31) | Ag2S | |
| - | - | 1.963 | (23) | Ag2S | |
| 0.03 M | 22.538 | 3.949 | 3.96 | (01) | Ag2S |
| 25.871 | 3.441 | 3.437 | (11) | Ag2S | |
| 28.975 | 3.081 | 3.08 | (111) | Ag2S | |
| 31.618 | 2.833 | 2.836 | (12) | Ag2S | |
| 40.699 | 2.214 | 2.213 | (031) | Ag2S | |
| 43.573 | 2.083 | 2.083 | (200) | Ag2S | |
| 45.297 | 1.999 | 1.995 | (31) | Ag2S | |
| 46.102 | 1.963 | 1.963 | (23) | Ag2S | |
| 0.05 M | - | - | 3.96 | (01) | Ag2S |
| 25.96 | 3.435 | 3.437 | (11) | Ag2S | |
| 28.95 | 3.076 | 3.08 | (111) | Ag2S | |
| 31.596 | 2.829 | 2.836 | (12) | Ag2S | |
| 40.798 | 2.212 | 2.213 | (031) | Ag2S | |
| 43.443 | 2.08 | 2.083 | (200) | Ag2S | |
| 45.514 | 1.992 | 1.995 | (31) | Ag2S | |
| 46.204 | 1.965 | 1.963 | (23) | Ag2S | |
| 0.08 M | 21.236 | 4.18 | 4.157 | (040) | C2H4AgN3S2 |
| 30.246 | 2.949 | 2.919 | (140) | C2H4AgN3S2 | |
| - | - | 2.81 | (131) | C2H4AgN3S2 | |
| 34.52 | 2.602 | 2.629 | (052) | C2H4AgN3S2 | |
| 36.253 | 2.474 | 2.487 | (15) | C2H4AgN3S2 | |
| 50.577 | 1.806 | 1.806 | (054) | C2H4AgN3S2 | |
| 60.28 | 1.534 | 1.539 | (11) | C2H4AgN3S2 | |
| 0.1 M | 21.354 | 4.17 | 4.157 | (040) | C2H4AgN3S2 |
| 30.601 | 2.953 | 2.919 | (140) | C2H4AgN3S2 | |
| 31.621 | - | 2.81 | (131) | C2H4AgN3S2 | |
| 34.065 | 2.603 | 2.629 | (052) | C2H4AgN3S2 | |
| 36.086 | 2.477 | 2.487 | (15) | C2H4AgN3S2 | |
| 50.475 | 1.801 | 1.806 | (054) | C2H4AgN3S2 | |
| 60.037 | 1.535 | 1.539 | (11) | C2H4AgN3S2 | |
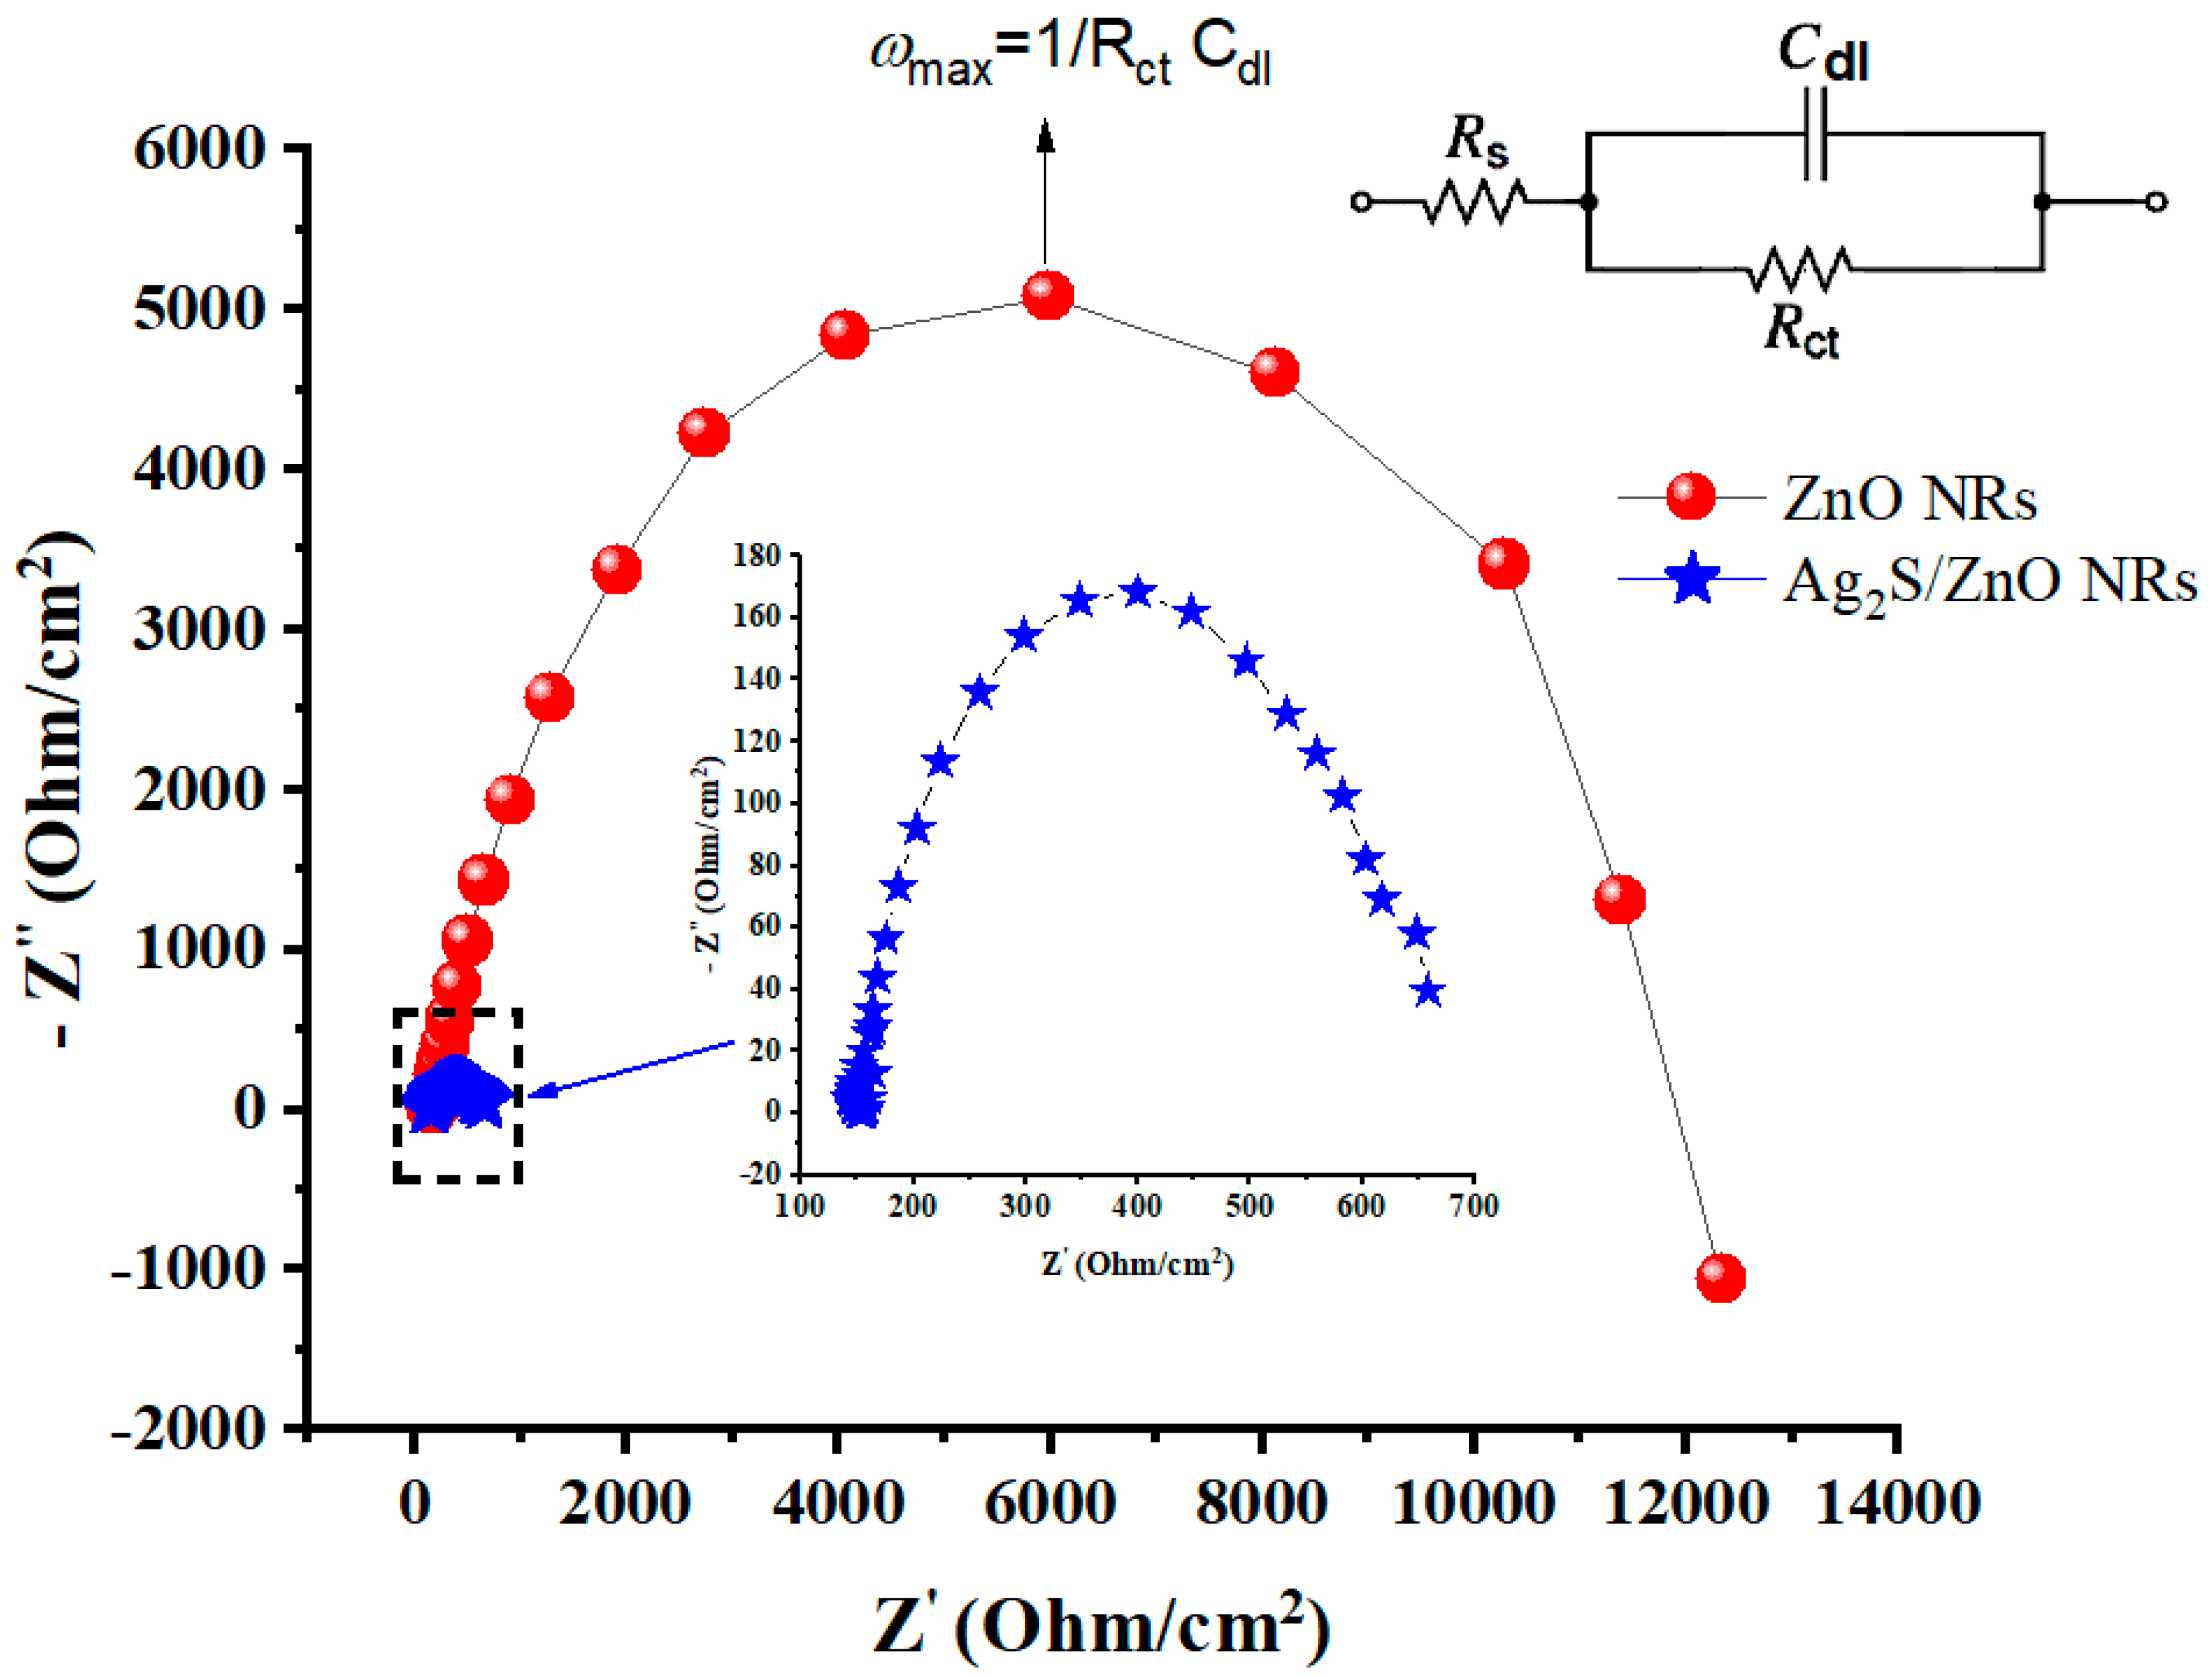
| Photoanode Construction | fmax (mHz) | Rct (Ω) | Rs (Ω) | Cdl (μF) |
|---|---|---|---|---|
| ZnO NRs | 45 | 12 × 103 | 184 | 296 |
| Ag2S3/ZnO NRs (Optimal sample) | 295 | 673 | 153 | 802 |
Publisher’s Note: MDPI stays neutral with regard to jurisdictional claims in published maps and institutional affiliations. |
© 2022 by the authors. Licensee MDPI, Basel, Switzerland. This article is an open access article distributed under the terms and conditions of the Creative Commons Attribution (CC BY) license (https://creativecommons.org/licenses/by/4.0/).
Share and Cite
Holi, A.M.; Zainal, Z.; Al-Zahrani, A.A.; Ayal, A.K.; Najm, A.S. Effect of Varying AgNO3 and CS(NH2)2 Concentrations on Performance of Ag2S/ZnO NRs/ITO Photoanode. Energies 2022, 15, 2950. https://doi.org/10.3390/en15082950
Holi AM, Zainal Z, Al-Zahrani AA, Ayal AK, Najm AS. Effect of Varying AgNO3 and CS(NH2)2 Concentrations on Performance of Ag2S/ZnO NRs/ITO Photoanode. Energies. 2022; 15(8):2950. https://doi.org/10.3390/en15082950
Chicago/Turabian StyleHoli, Araa Mebdir, Zulkarnain Zainal, Asla A. Al-Zahrani, Asmaa Kadim Ayal, and Asmaa Soheil Najm. 2022. "Effect of Varying AgNO3 and CS(NH2)2 Concentrations on Performance of Ag2S/ZnO NRs/ITO Photoanode" Energies 15, no. 8: 2950. https://doi.org/10.3390/en15082950
APA StyleHoli, A. M., Zainal, Z., Al-Zahrani, A. A., Ayal, A. K., & Najm, A. S. (2022). Effect of Varying AgNO3 and CS(NH2)2 Concentrations on Performance of Ag2S/ZnO NRs/ITO Photoanode. Energies, 15(8), 2950. https://doi.org/10.3390/en15082950