
Research on Application Characteristics of Zirconia-Based High-Temperature NOx Sensors


Abstract
:1. Introduction
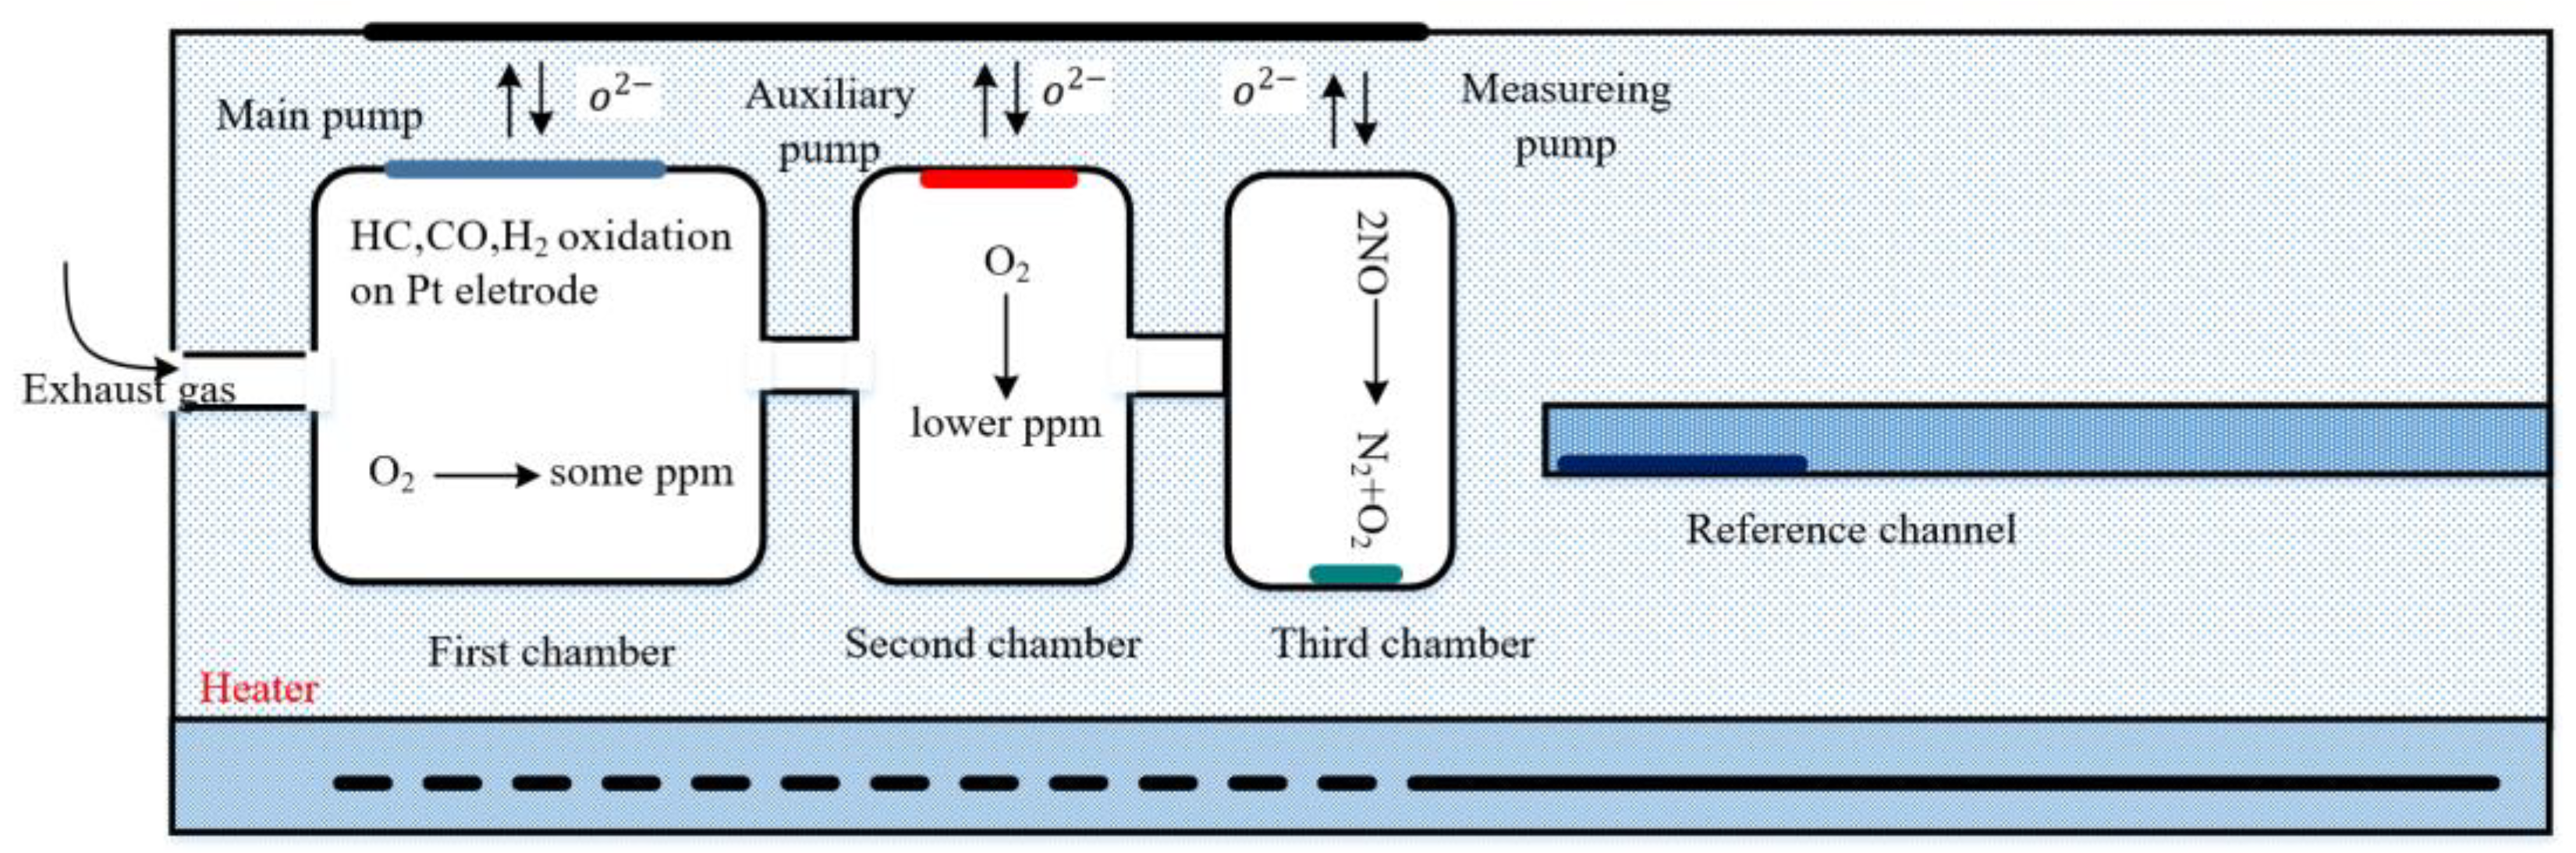
2. The Working Principle
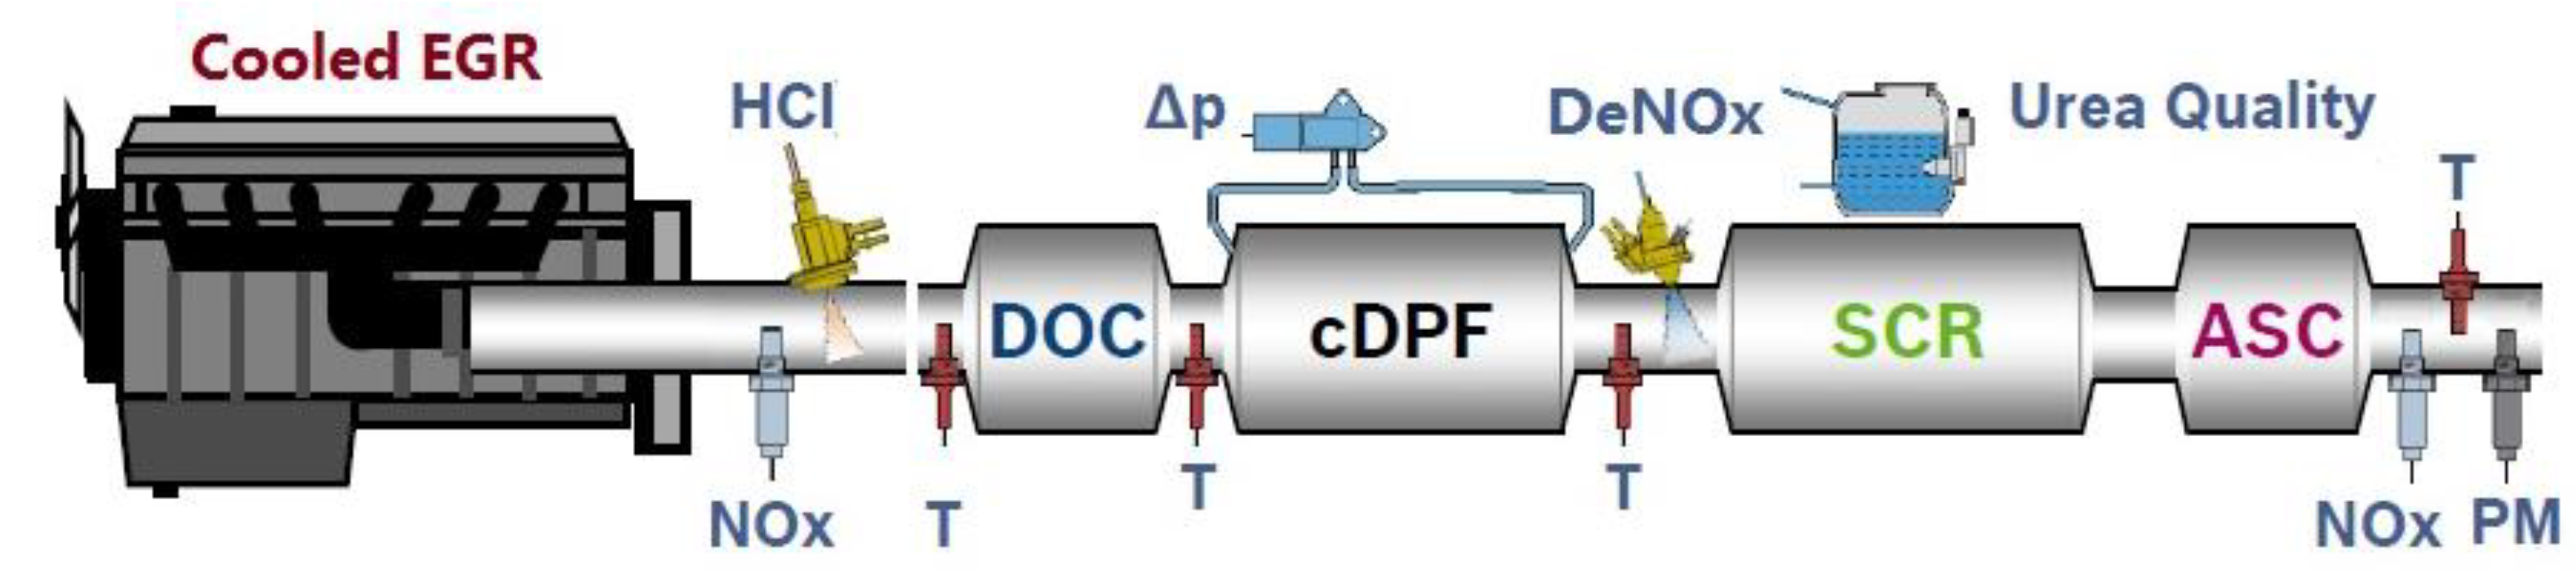
3. Problem Description in Vehicle Application
4. Theoretical Analysis and Experiments
4.1. Theoretical Analysis
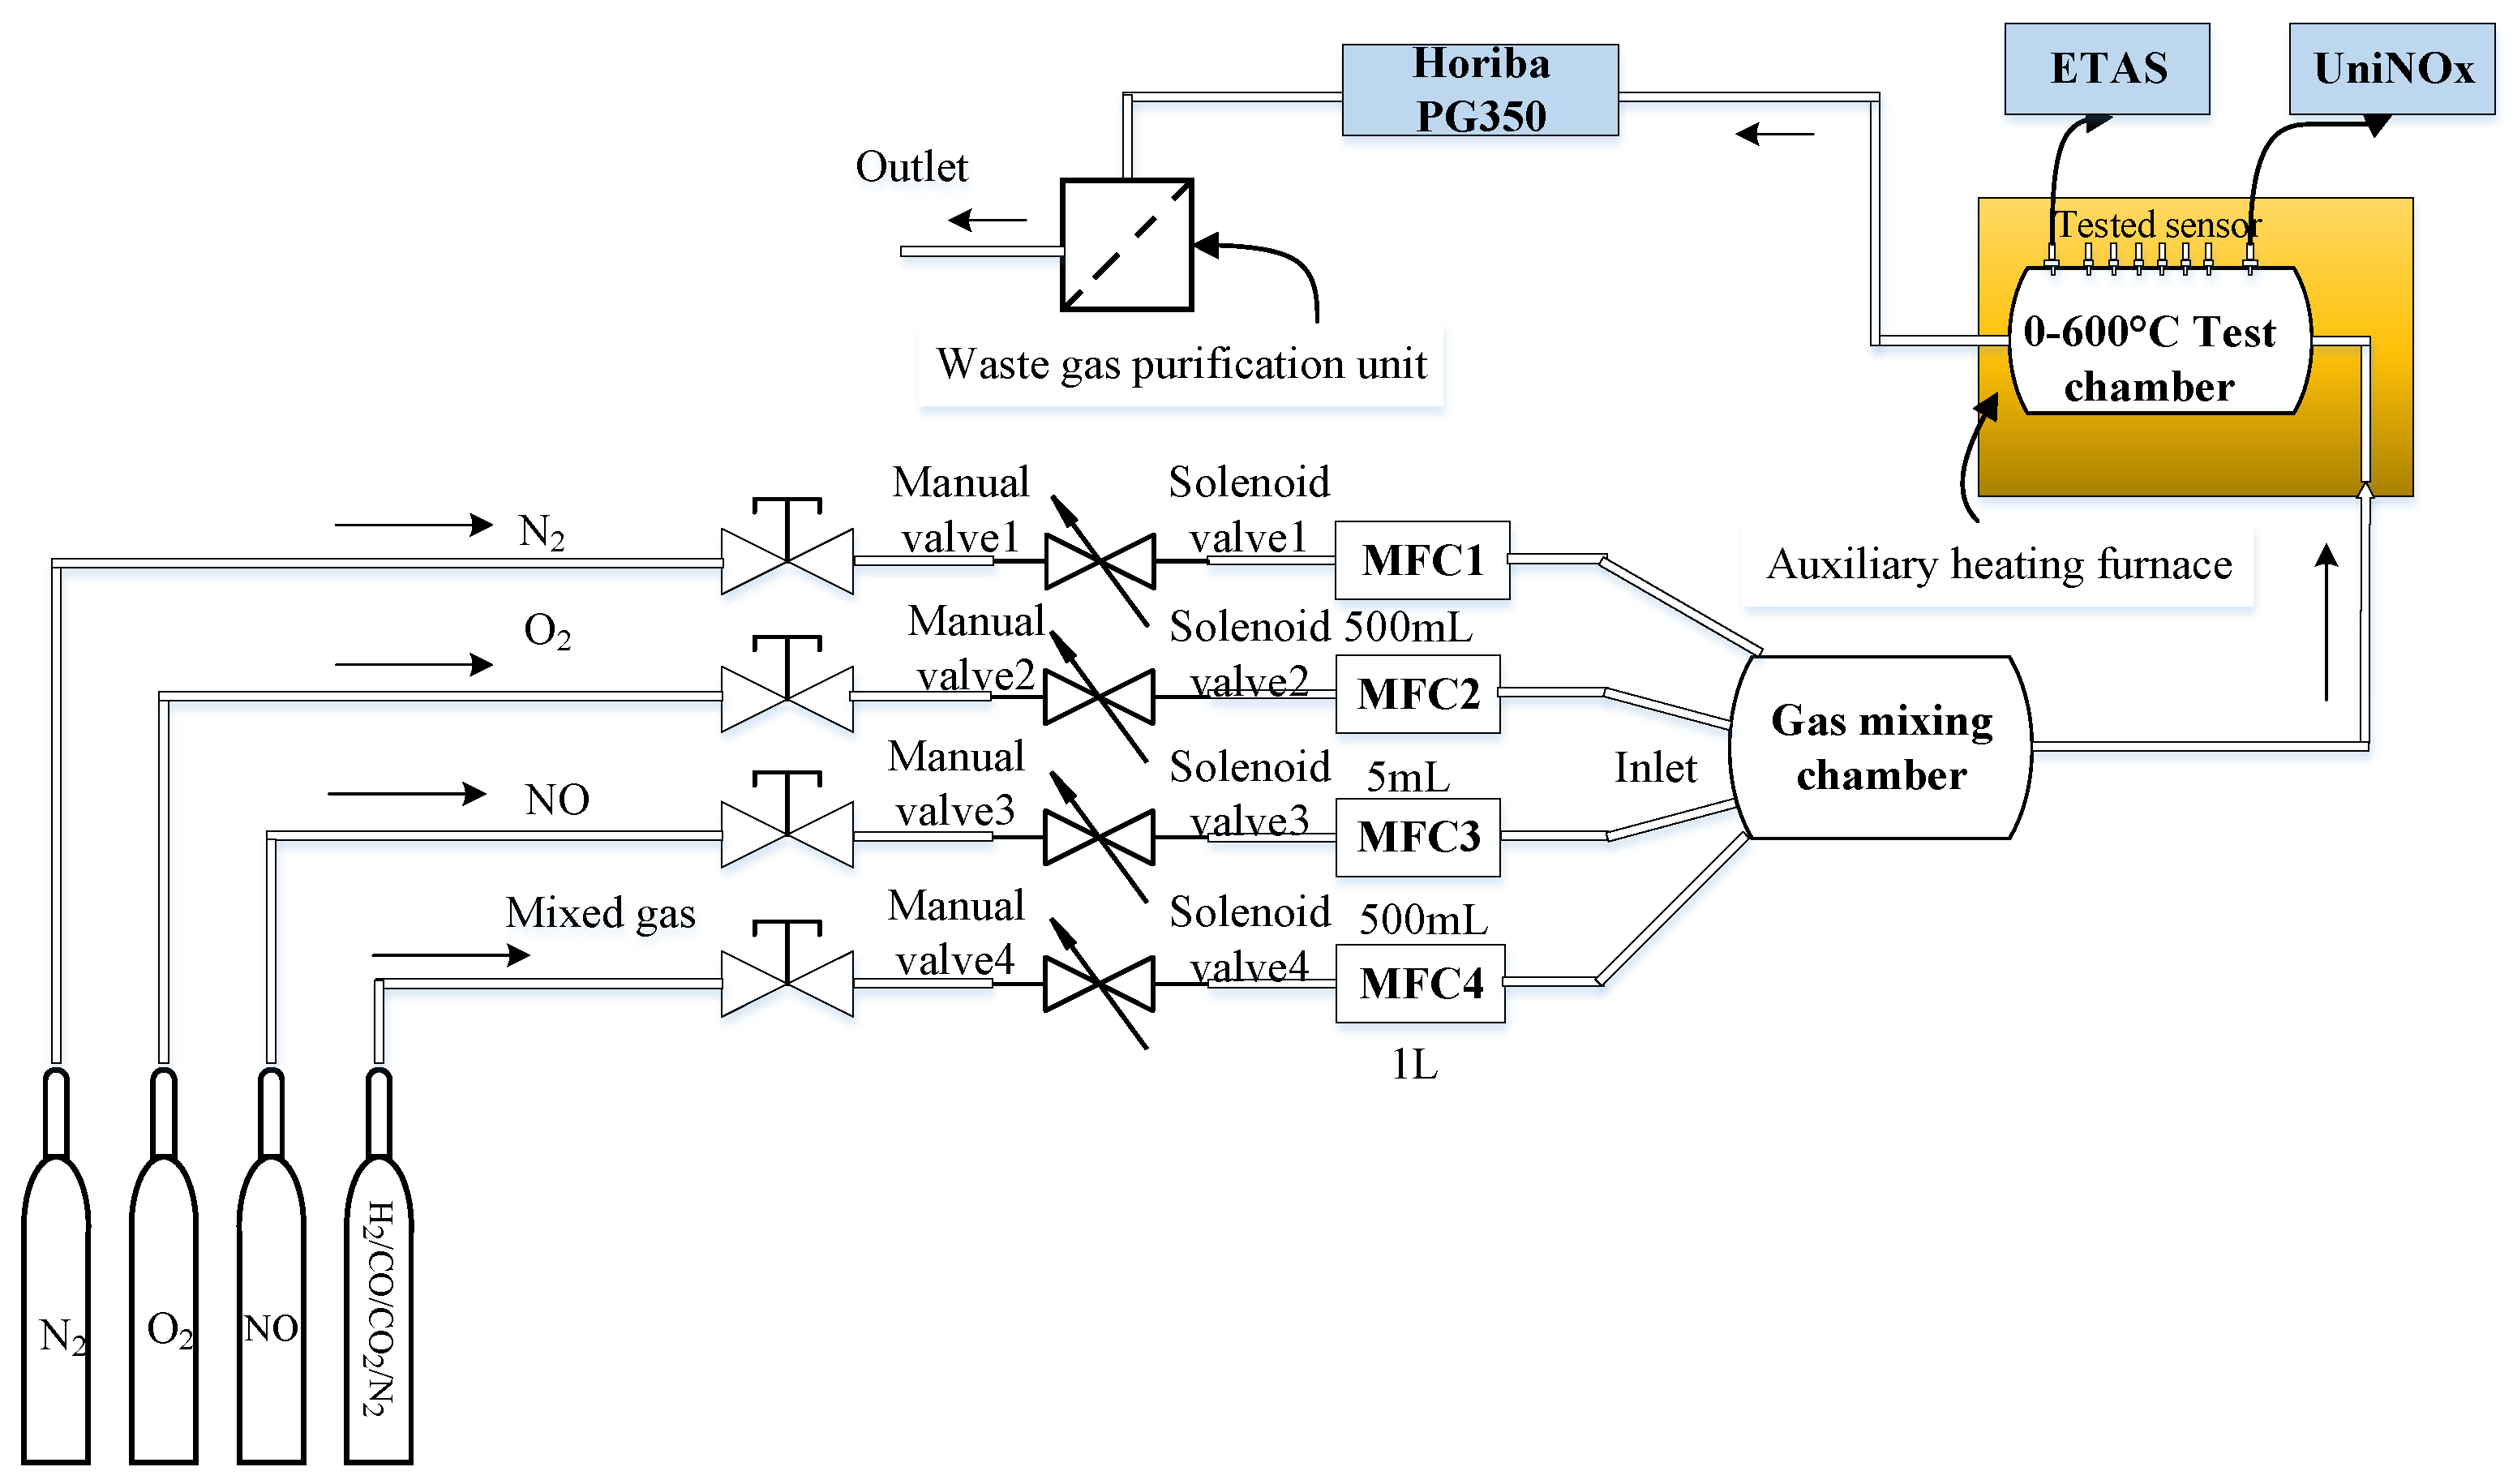
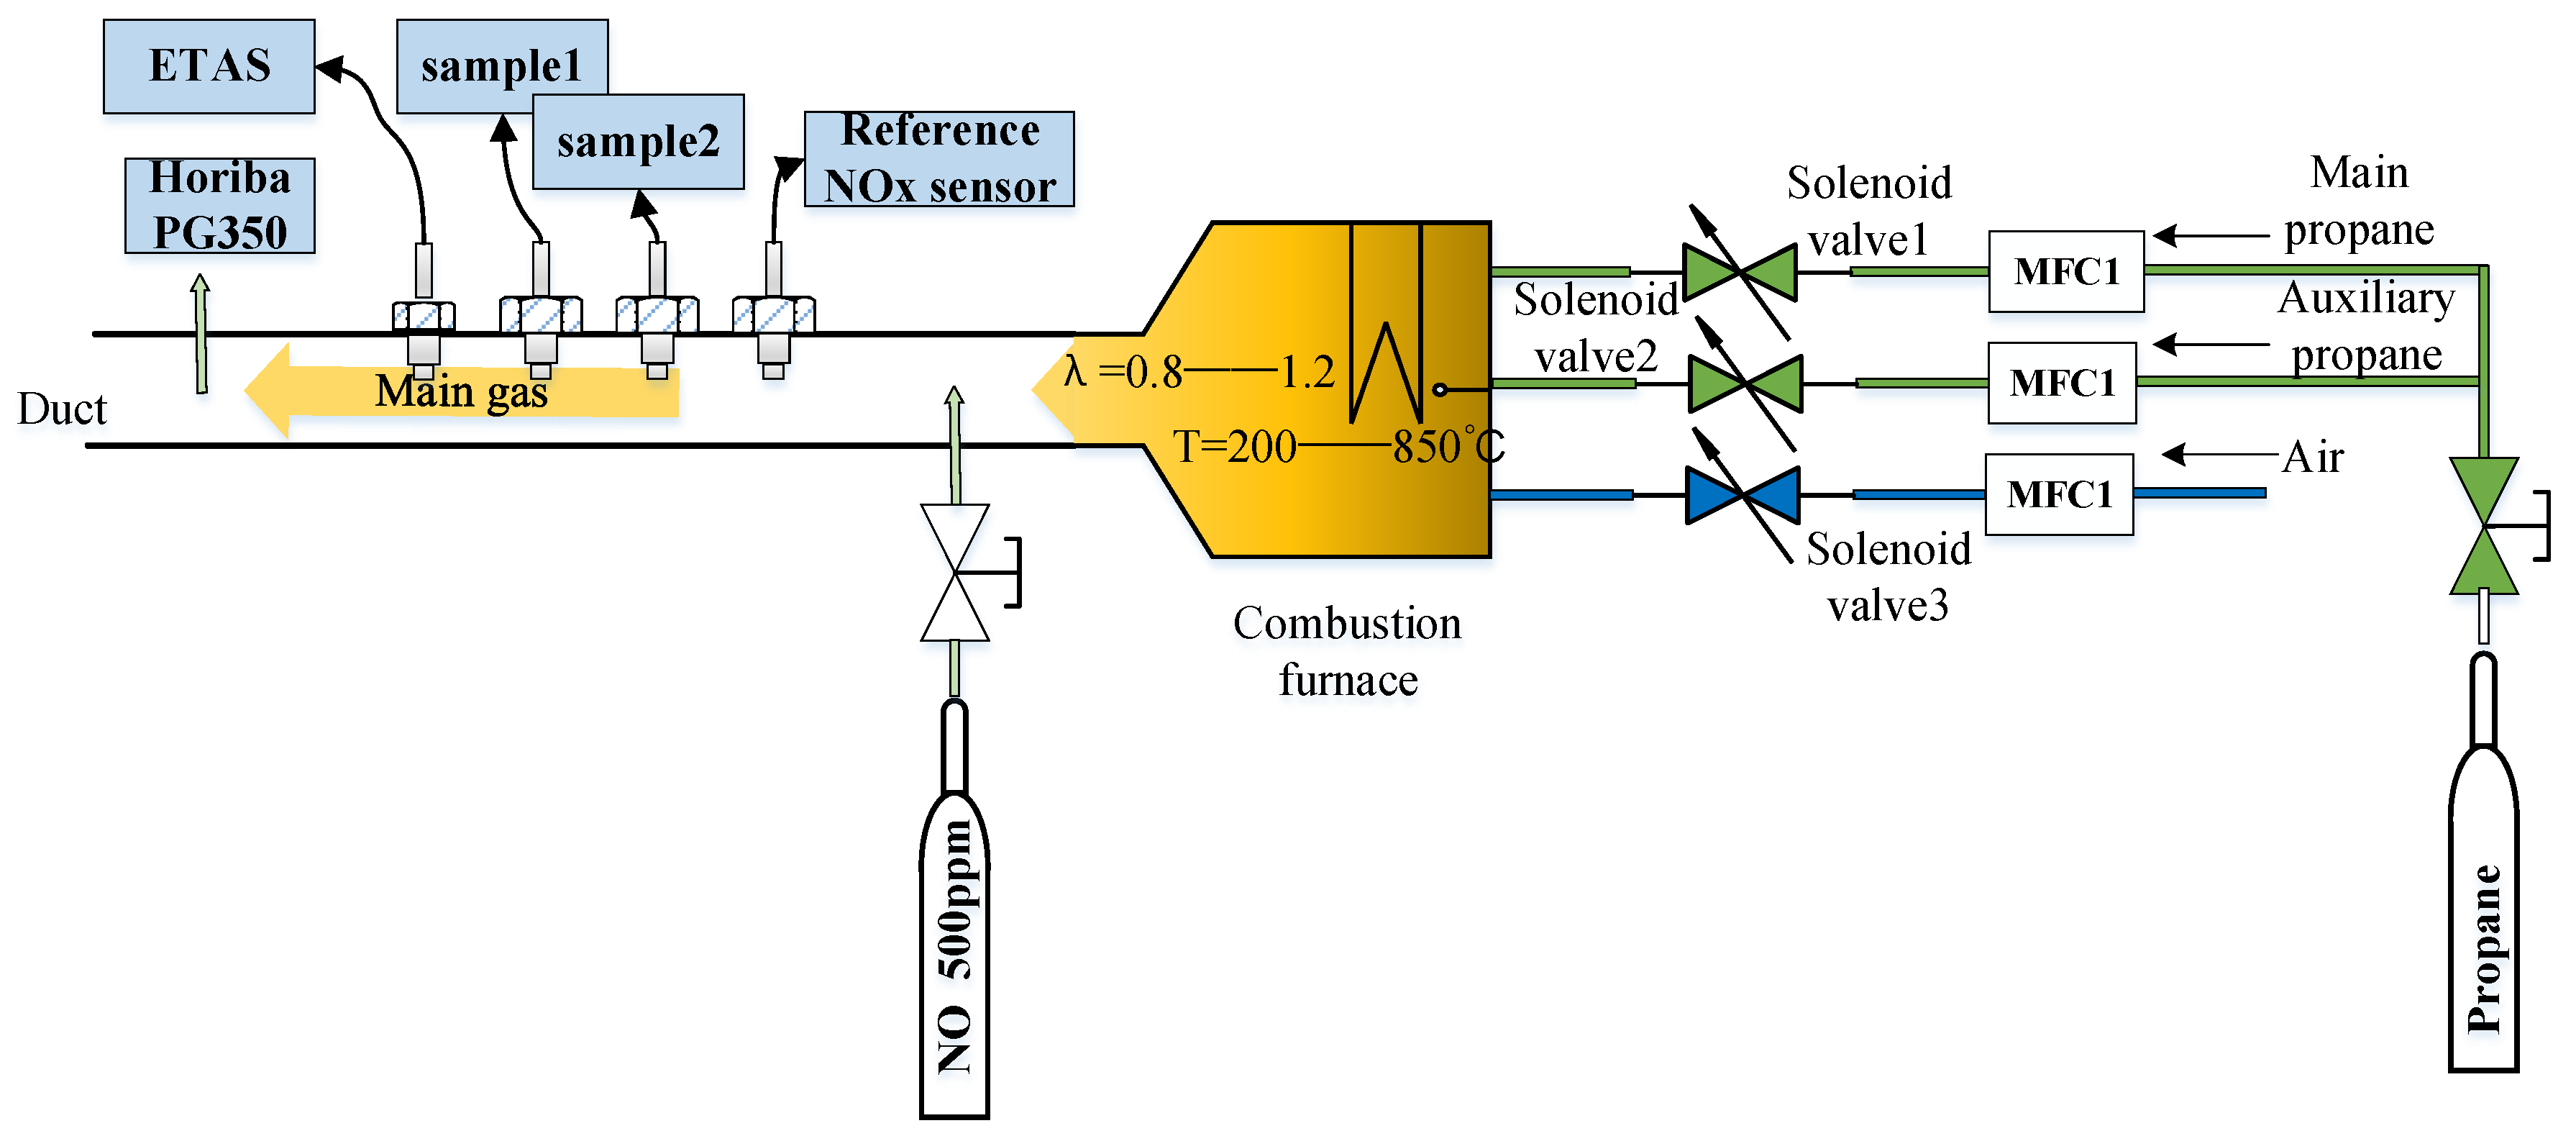
4.2. Test Equipment and Test Methods in Laboratory
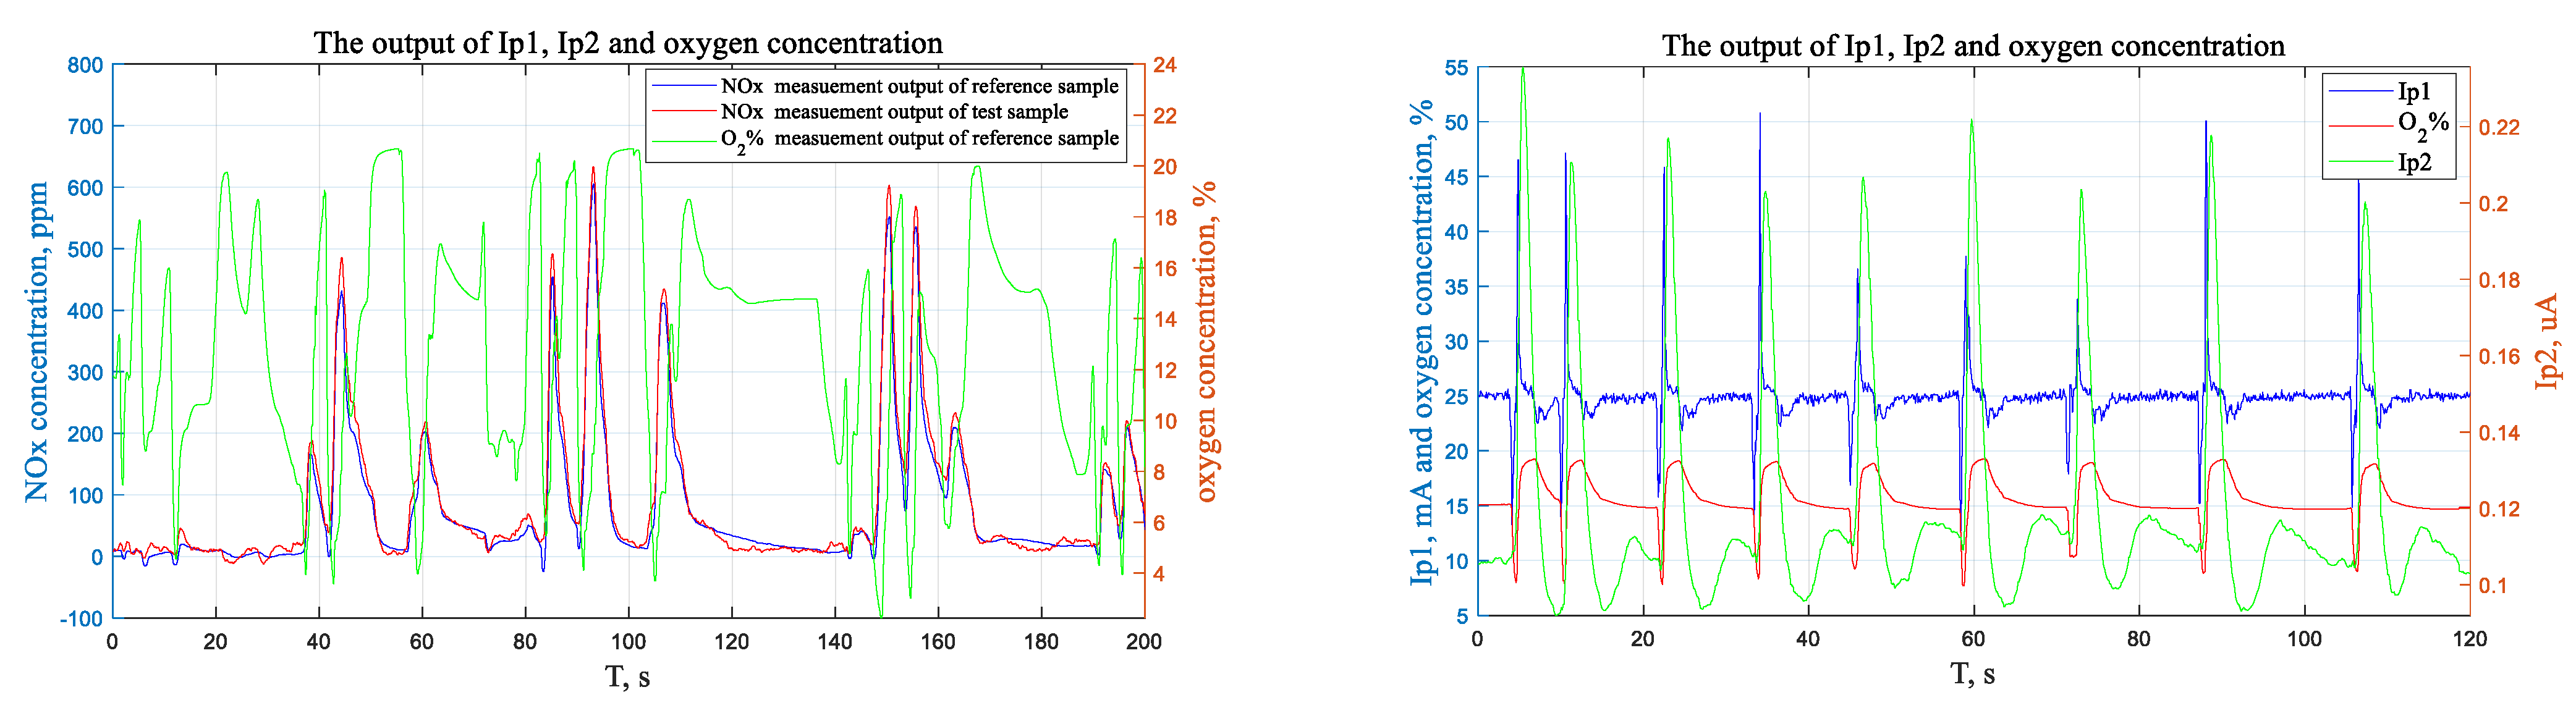
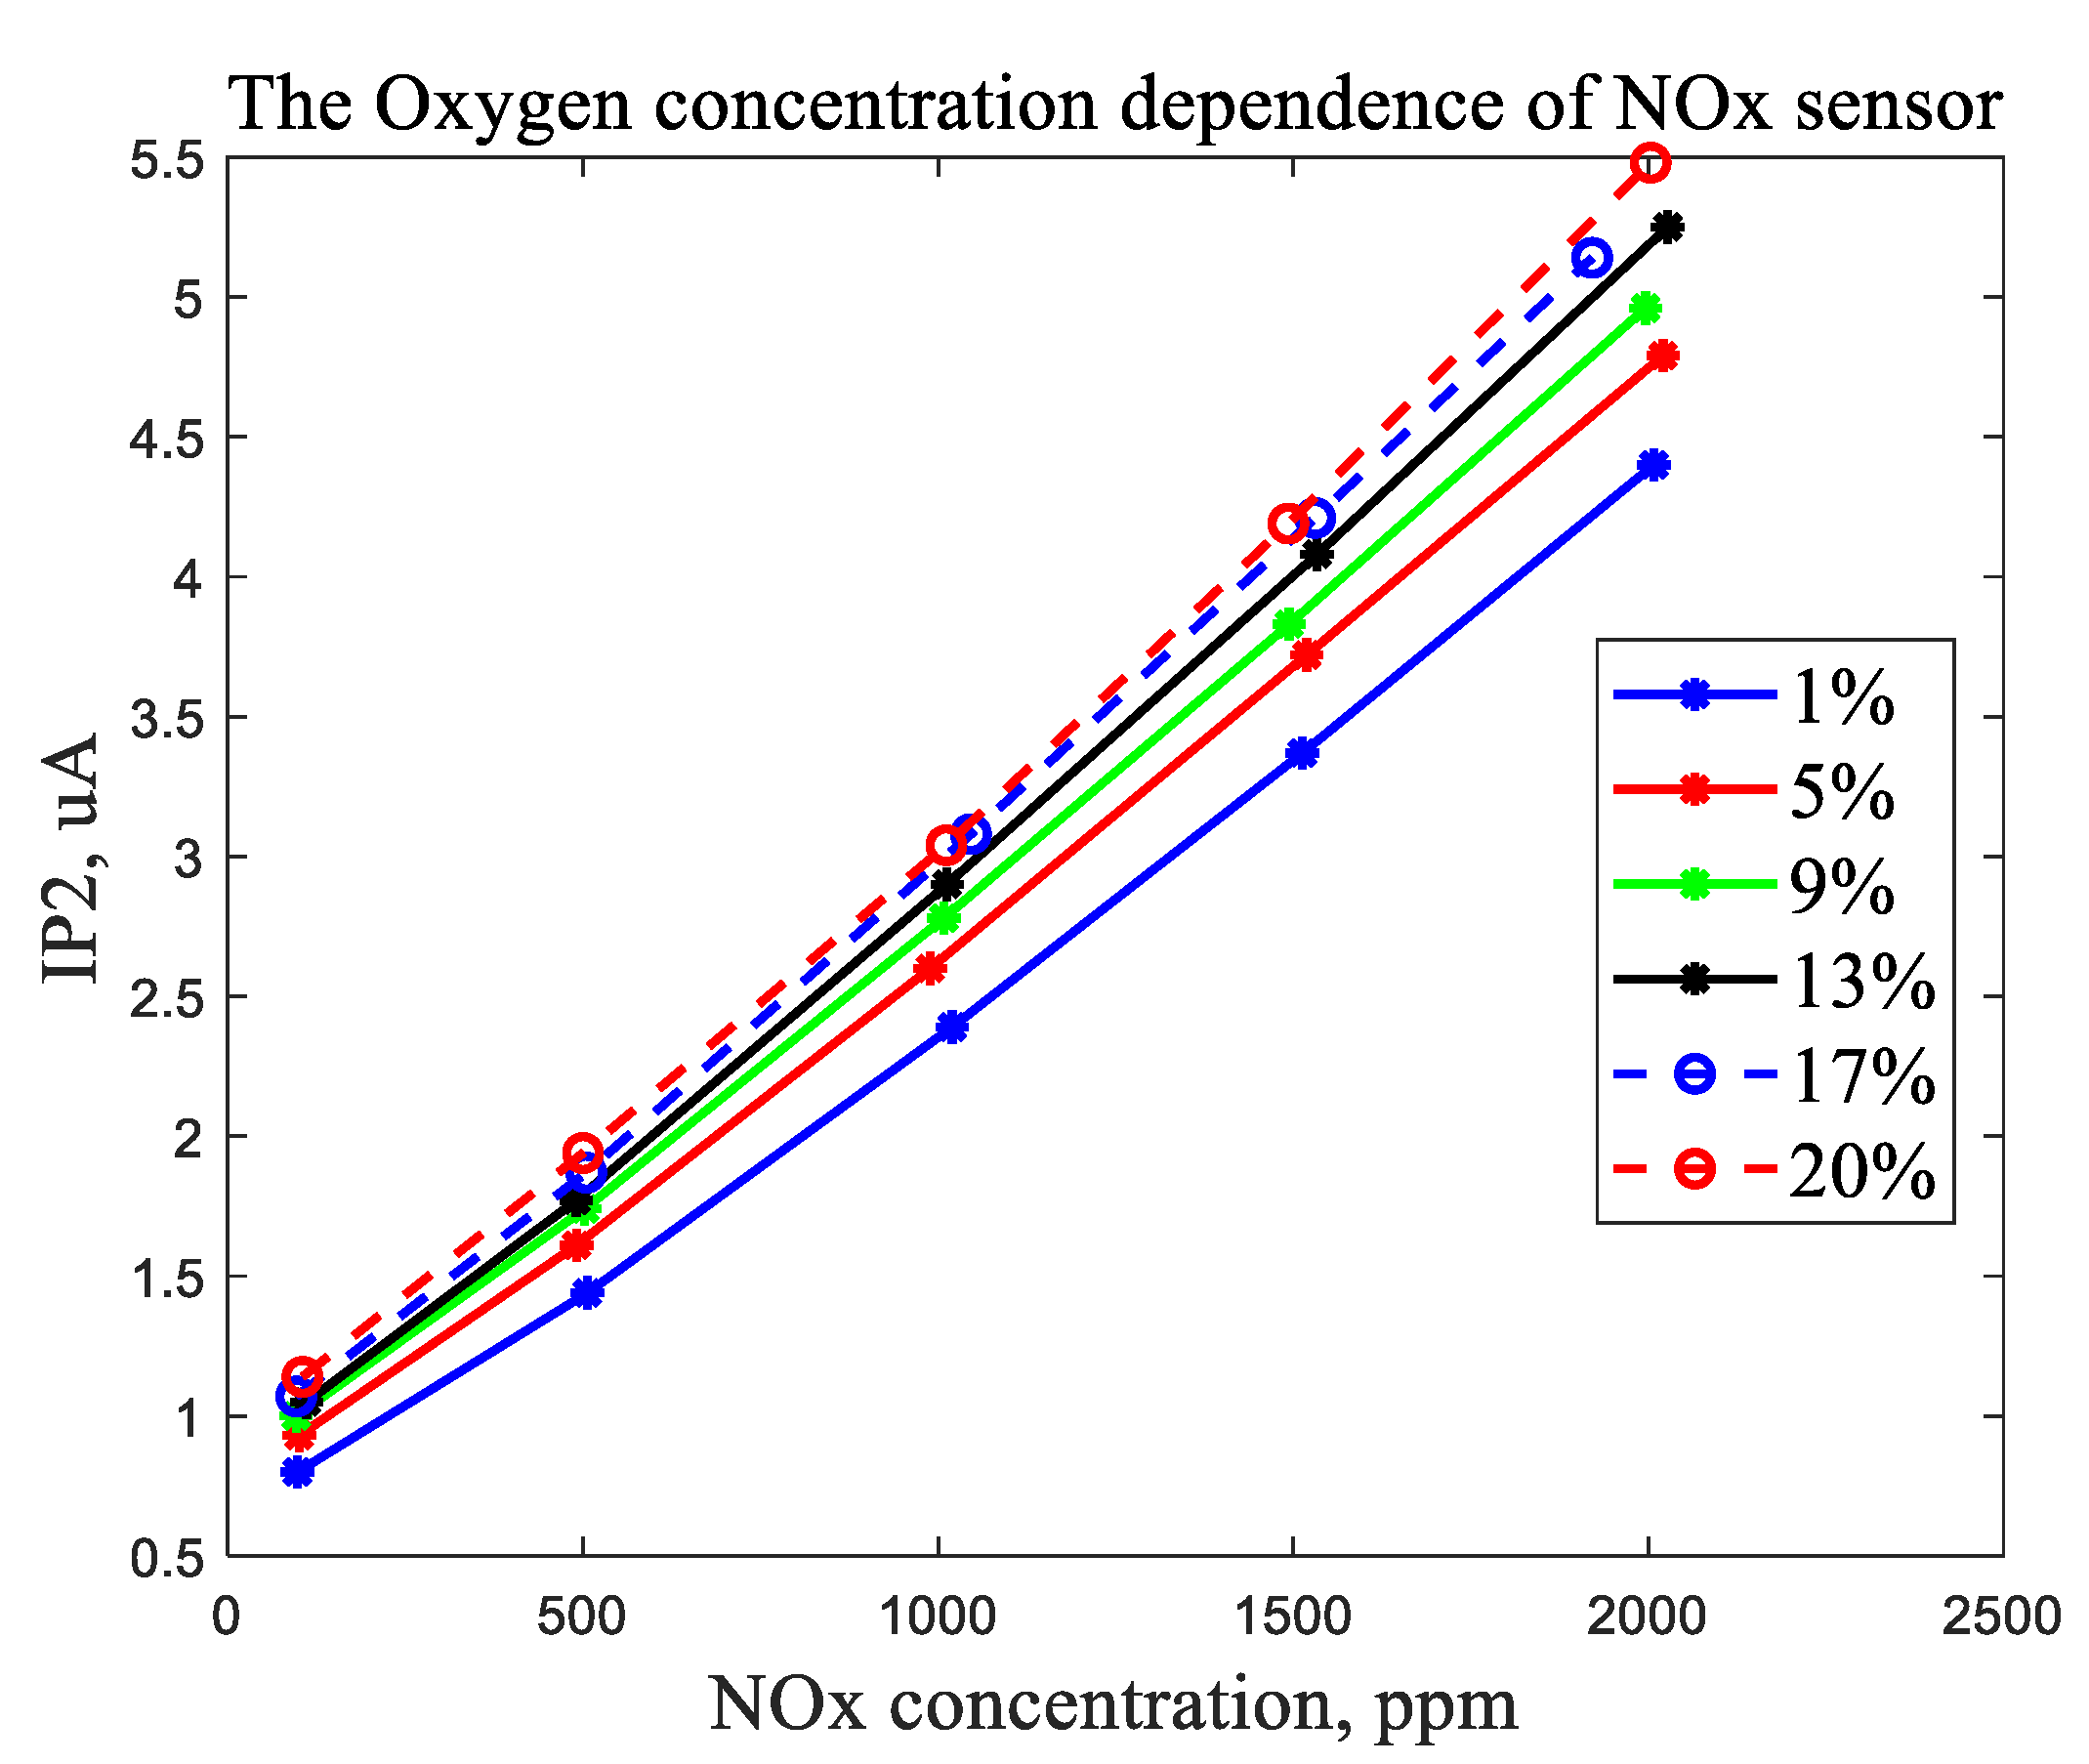
4.3. Test Results
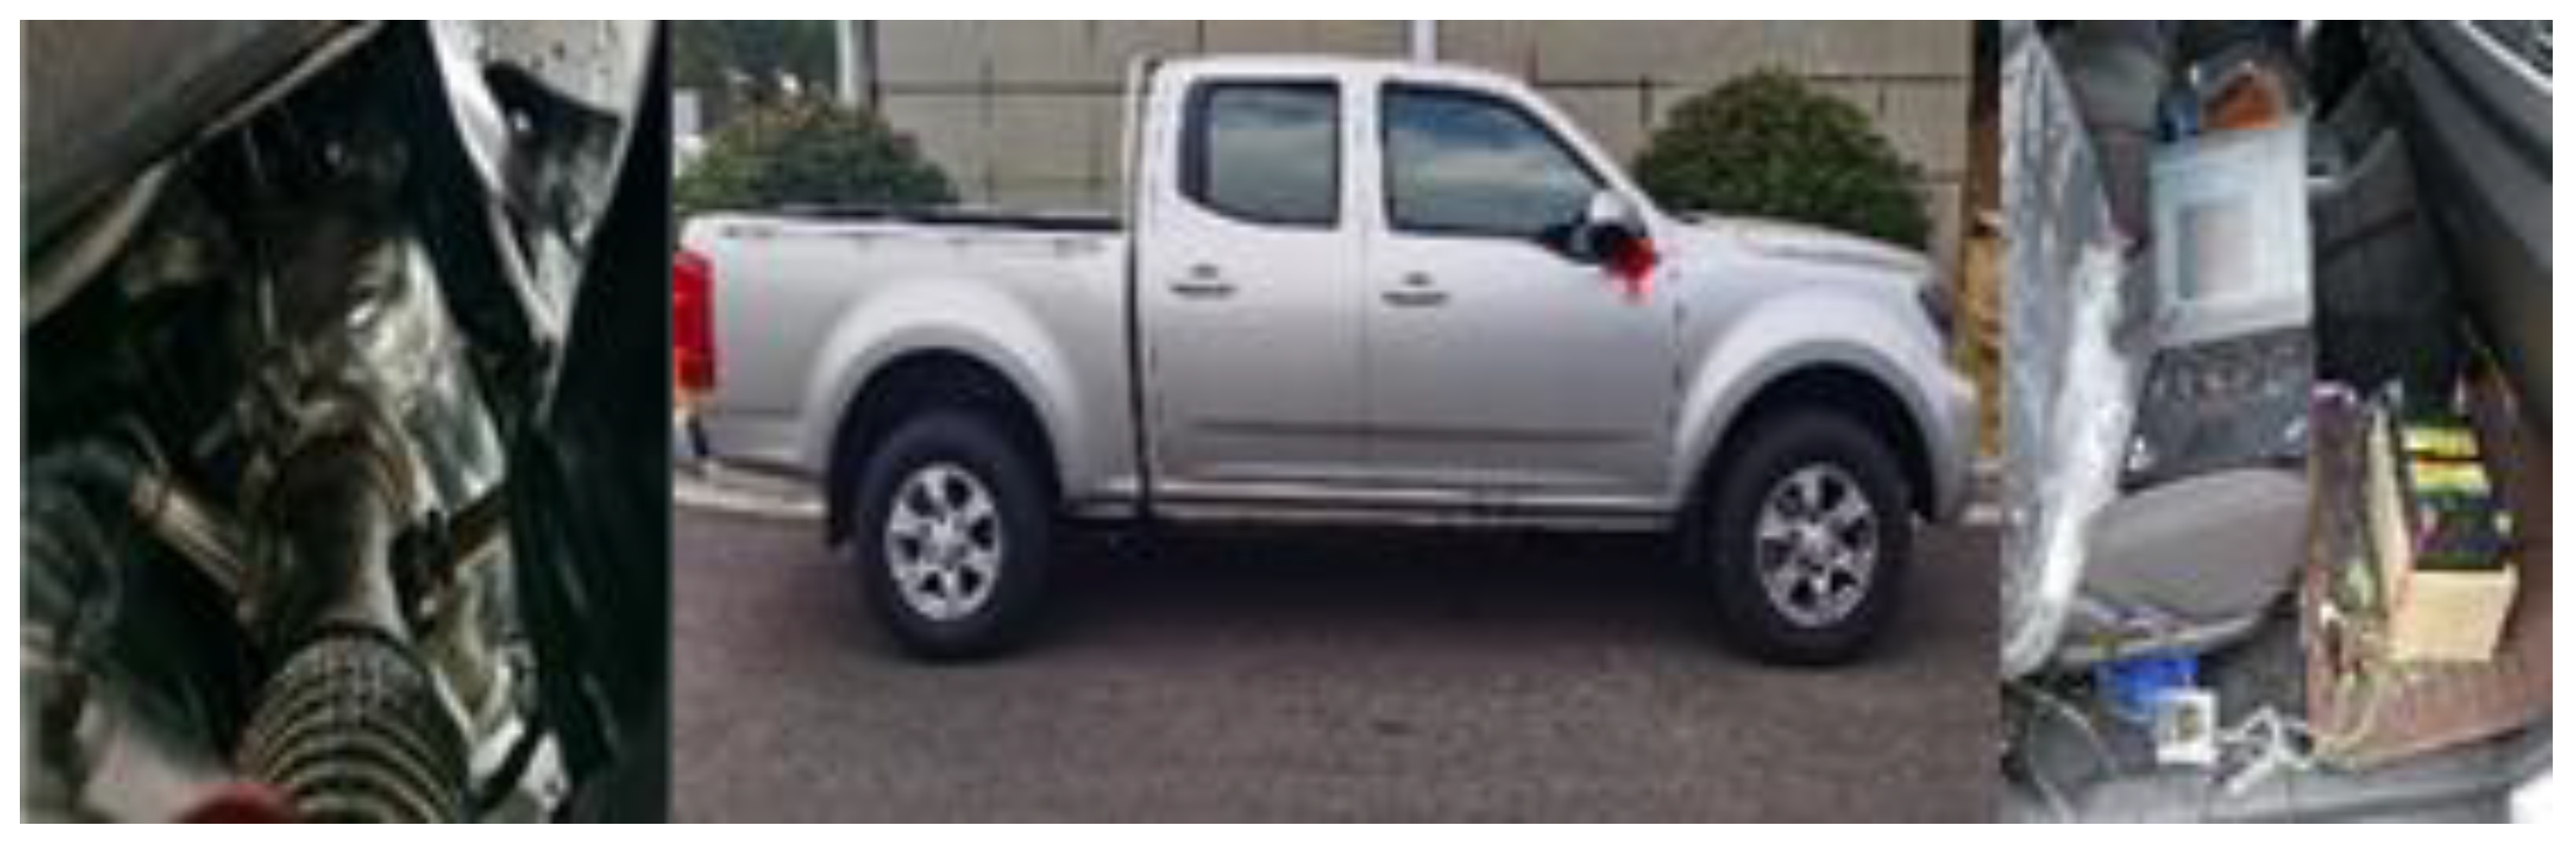
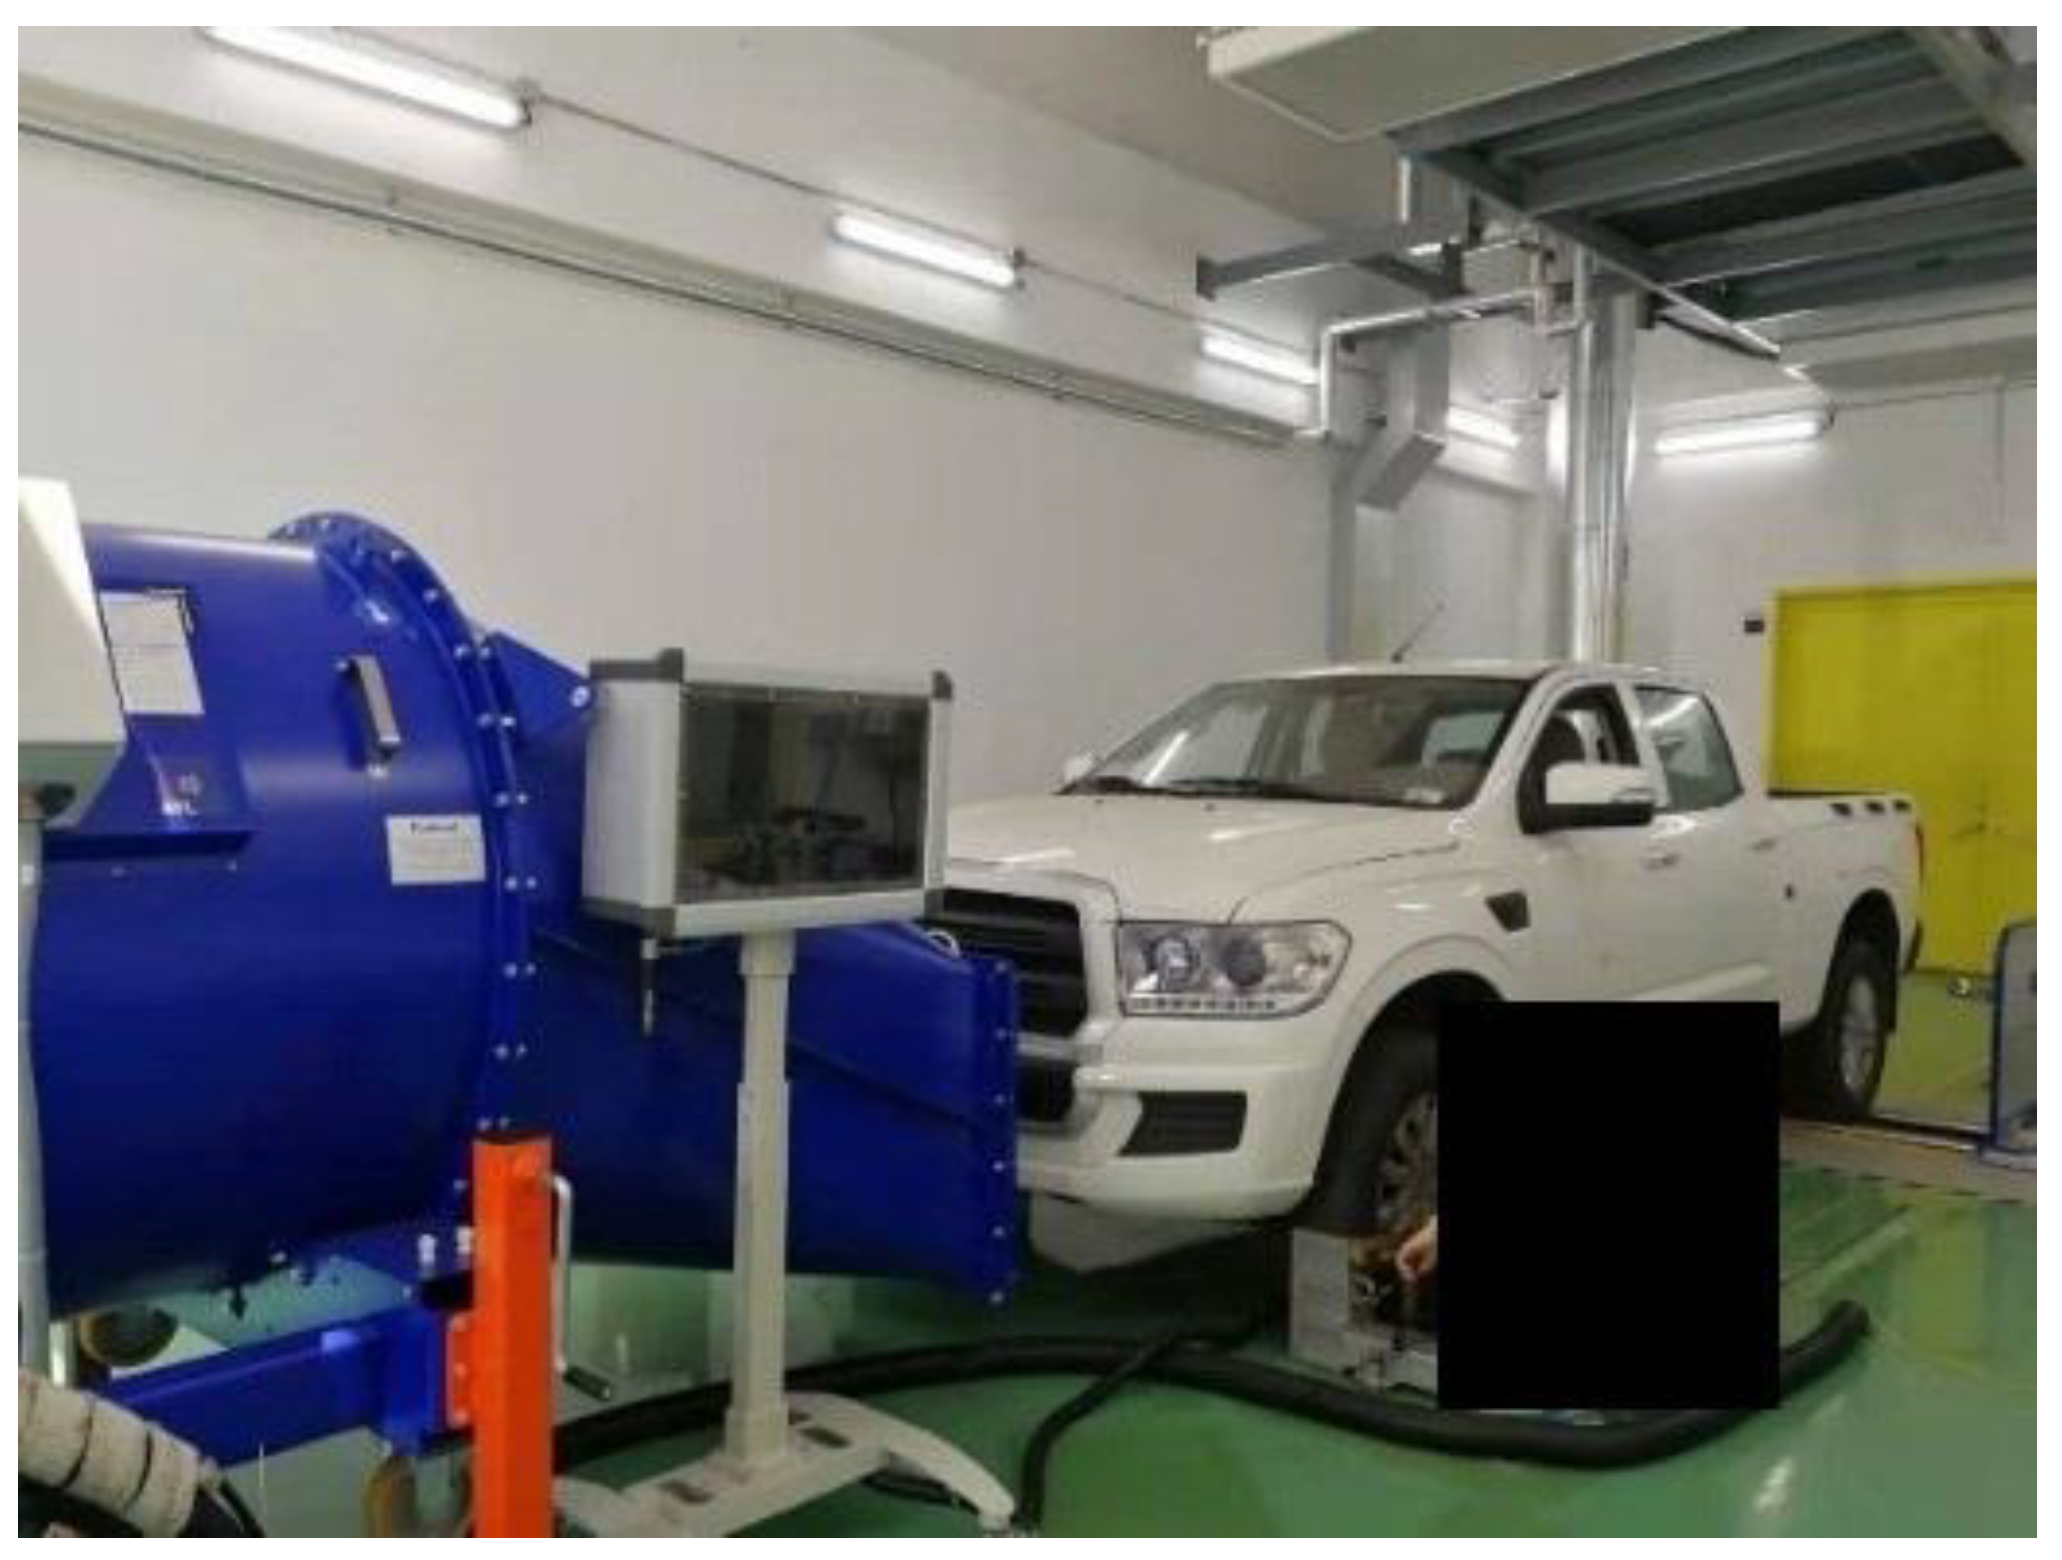
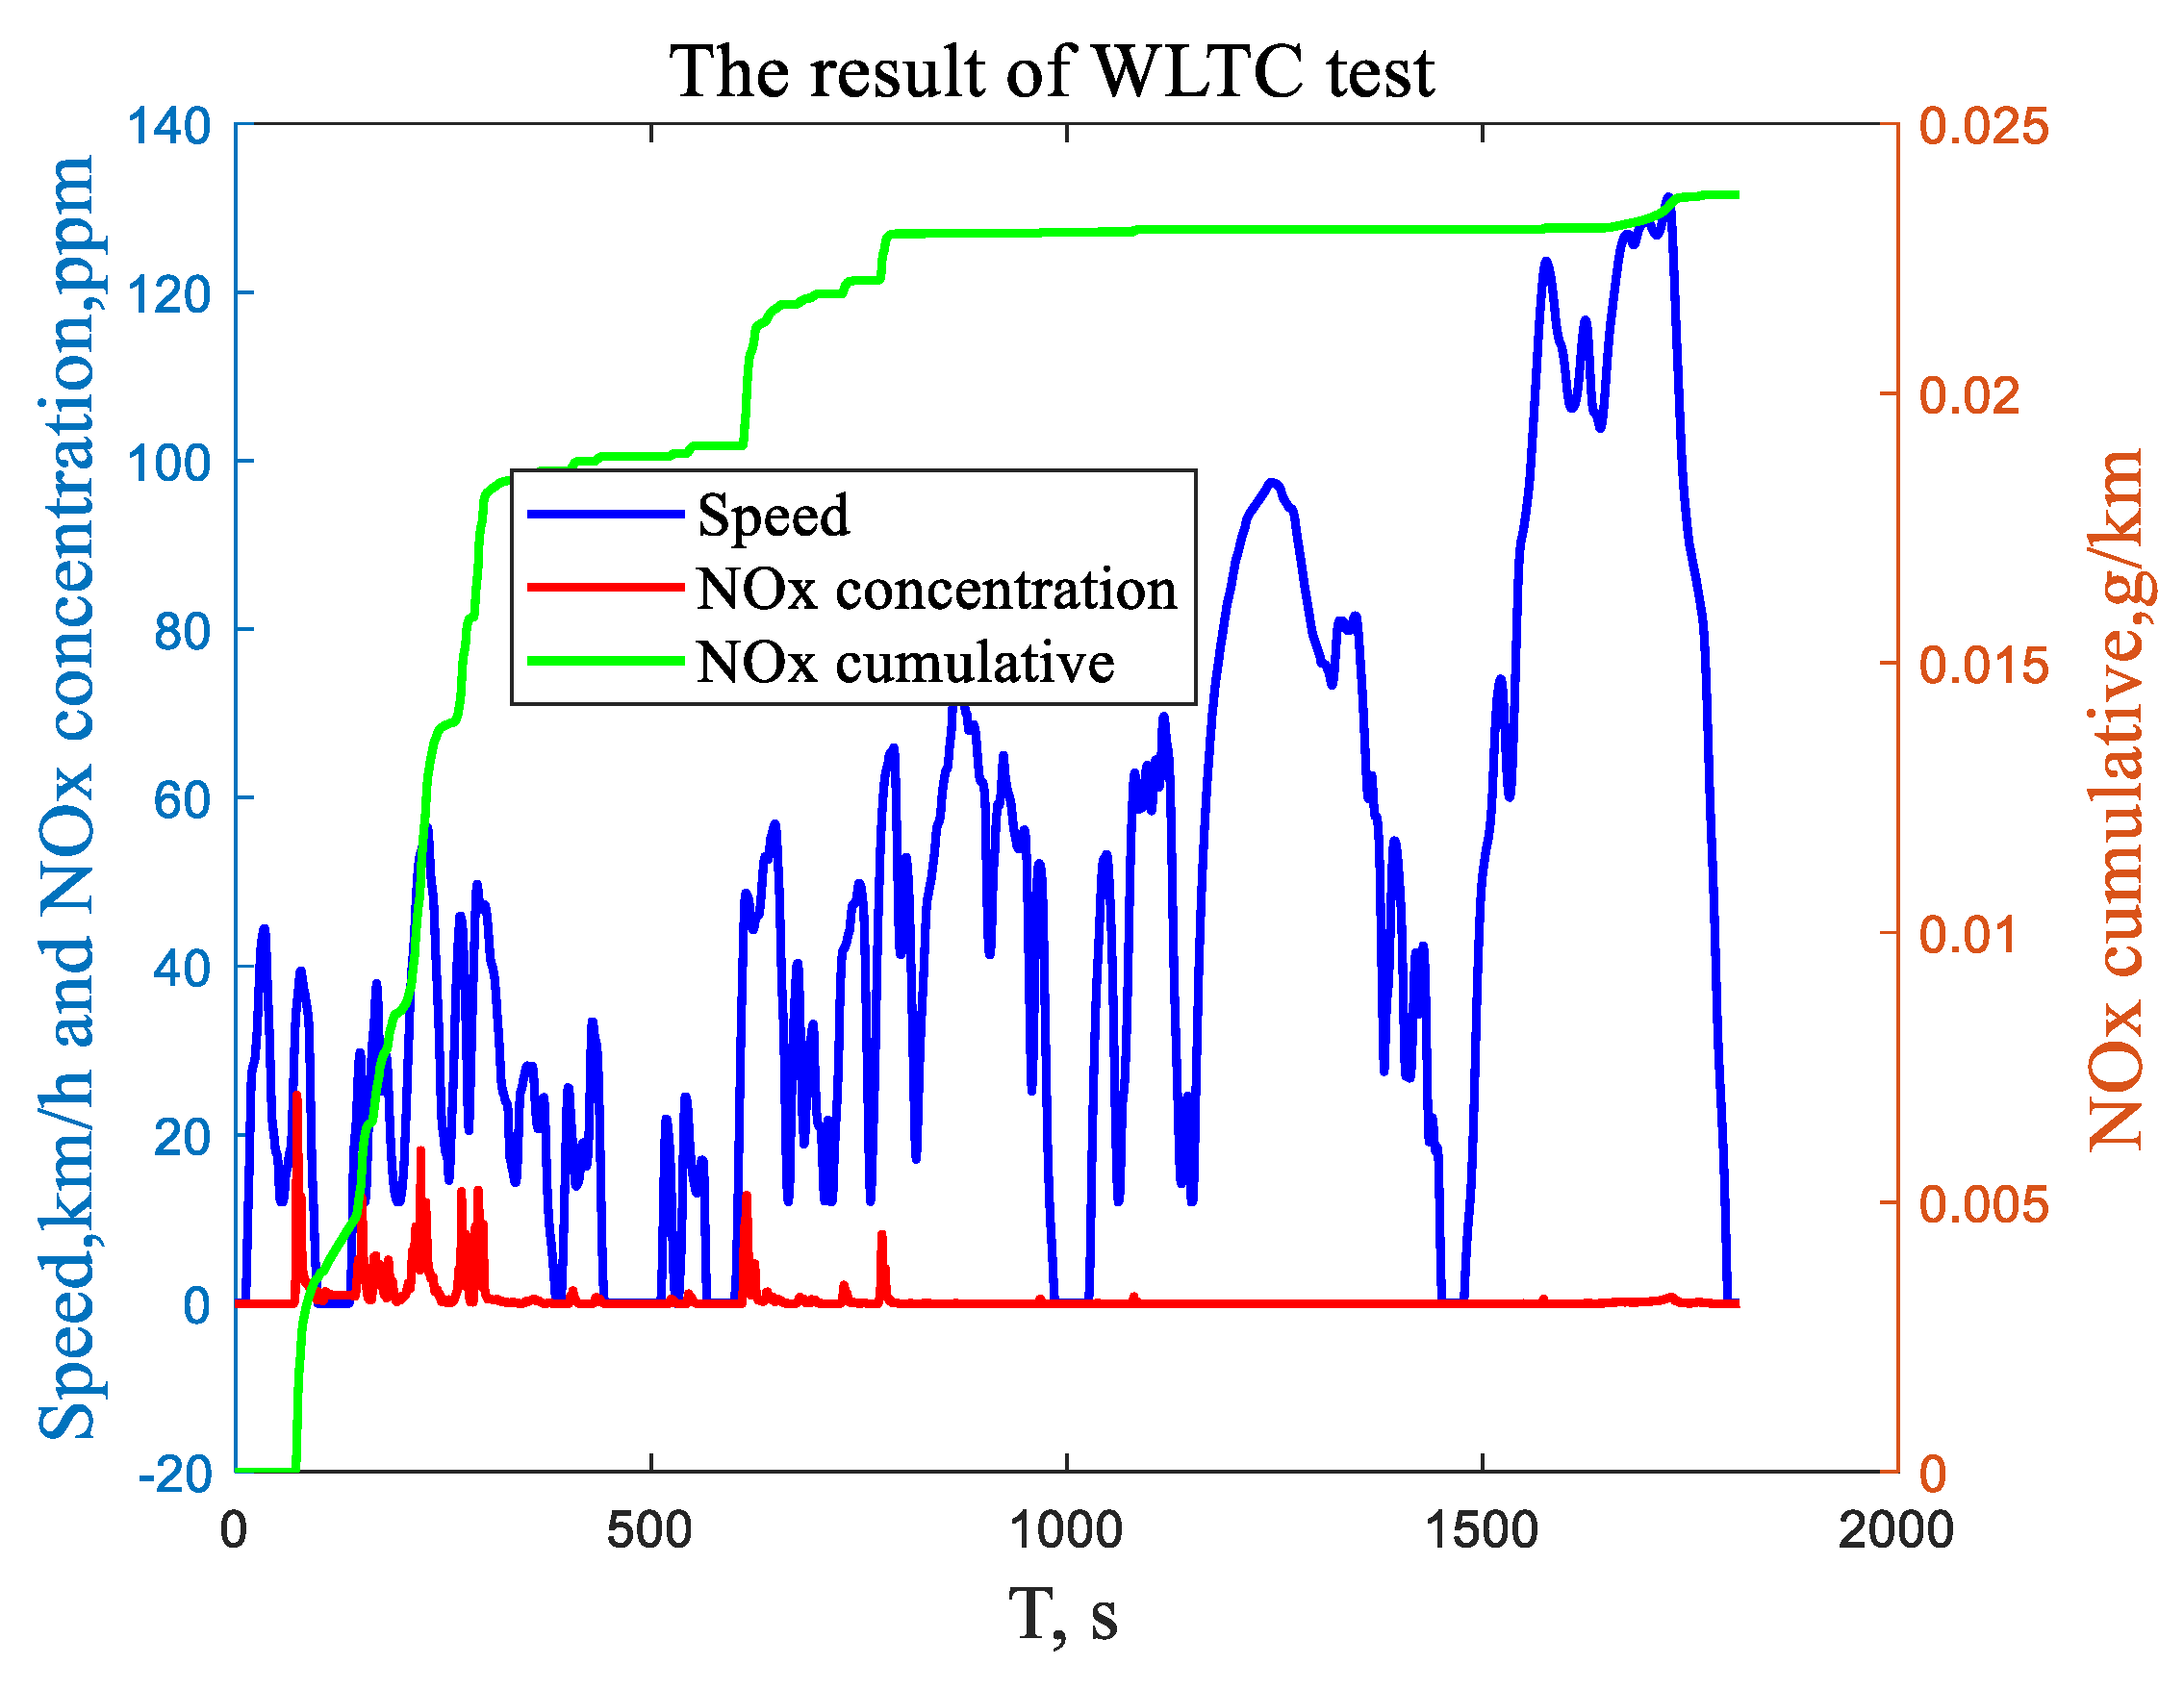
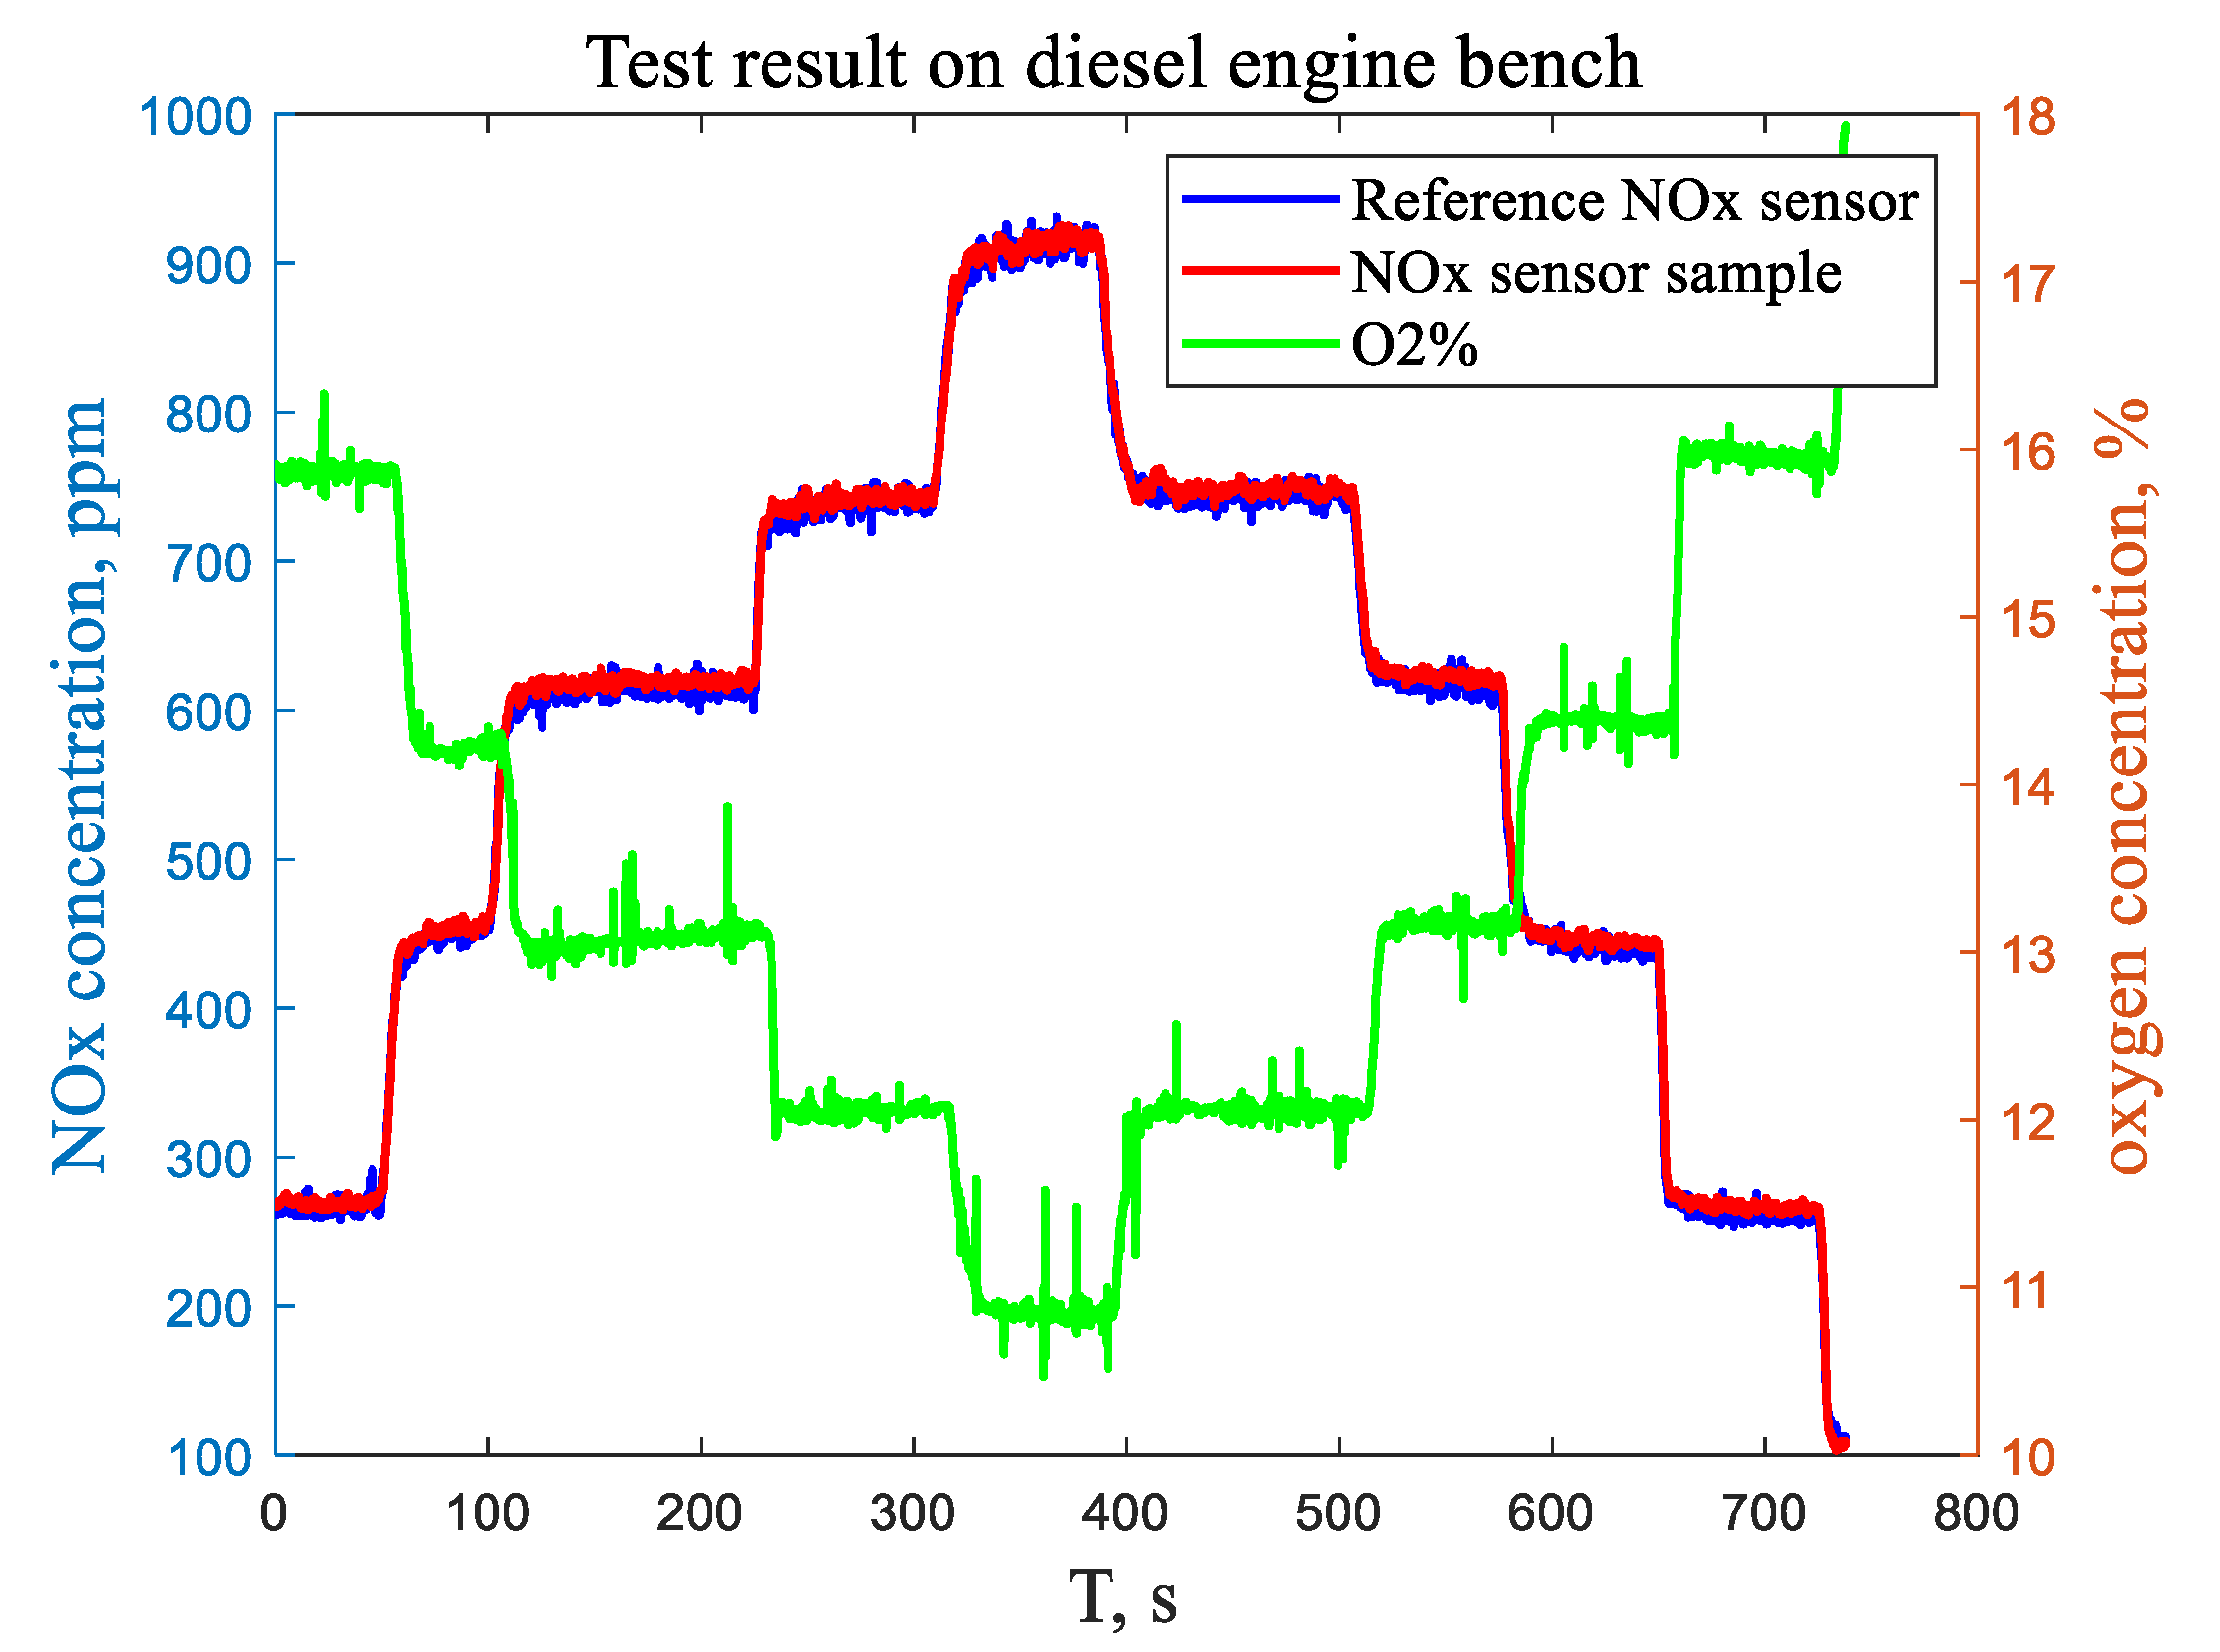
4.4. Diesel Engine Bench and Revolving Drum Test
5. Conclusions
Author Contributions
Funding
Institutional Review Board Statement
Informed Consent Statement
Data Availability Statement
Acknowledgments
Conflicts of Interest
References
- Cheng, H.; Jing, S.; Xu, Y.; Deng, Z.; Li, J.; Li, X. Control-oriented modeling analysis and optimization of planar solid oxide fuel cell system. Int. J. Hydrog. Energy 2016, 41, 22285–22304. [Google Scholar] [CrossRef] [Green Version]
- Zhang, L.; Jiang, J.; Cheng, H.; Deng, Z.; Li, X. Control strategy for power management, efficiency-optimization and operating-safety of a 5-kW solid oxide fuel cell system. Electrochim. Acta 2015, 177, 237–249. [Google Scholar] [CrossRef]
- Liu, Y.; Parisi, J.; Sun, X.; Lei, Y. Solid-state gas sensors for high temperature applications—A review. J. Mater. Chem. A 2014, 2, 9919–9943. [Google Scholar] [CrossRef]
- Cao, H.; Deng, Z.; Li, X.; Yang, J.; Qin, Y. Dynamic modeling of electrical characteristics of solid oxide fuel cells using fractional derivatives. Int. J. Hydrog. Energy 2010, 35, 1749–1758. [Google Scholar] [CrossRef]
- Riegel, J. Exhaust gas sensors for automotive emission control. Solid State Ionics 2002, 152–153, 783–800. [Google Scholar] [CrossRef]
- Tao, L.; Wang, X.; Lin, L.; Yu, J. Electrochemical NOx gas sensors based on stabilized zirconia. J. Electrochem. Soc. 2017, 164, B610–B619. [Google Scholar]
- Janardhanan, V.M.; Deutschmann, O. Modeling of Solid-Oxide Fuel Cells. Z. Für Phys. Chem. 2007, 221, 443–478. [Google Scholar] [CrossRef]
- Praveena, V.; Martin, M.L.J. A review on various after treatment techniques to reduce NOx emissions in a CI engine. J. Energy Inst. 2018, 91, 704–720. [Google Scholar] [CrossRef]
- Geng, P.; Tan, Q.; Zhang, C.; Wei, L.; He, X.; Cao, E.; Jiang, K. Experimental investigation on NOx and green house gas emissions from a marine auxiliary diesel engine using ultralow sulfur light fuel. Sci. Total Environ. 2016, 572, 467–475. [Google Scholar] [CrossRef]
- Guan, B.; Zhan, R.; Lin, H.; Huang, Z. Review of state of the art technologies of selective catalytic reduction of NOx from diesel engine exhaust. Appl. Therm. Eng. 2014, 66, 395–414. [Google Scholar] [CrossRef]
- Todo, Y.; Ichikawa, H.; Yotou, H.; Aoki, K.; Kawai, M. Development of High Accuracy and Quick Light-off NOx Sensor; WCX World Congress Experience: Detroit, MI, USA, 10–12 April 2018. [Google Scholar]
- Sasaki, H.; Scholl, D.; Parsons, M.; Inagaki, H.; Shiotani, K.; Visser, J.; Zawacki, G.; Kawai, T.; Teramoto, S.; Kubinski, D. Development of an Al2O3/ZrO2-Composite High-Accuracy NOx Sensor. In Proceedings of the SAE 2010 World Congress & Exhibition, Detroit, MI, USA, 13–15 April 2010. [Google Scholar] [CrossRef]
- Sekiya, T.; Saito, N.; Kagenyama, S. Gas Sensor. U.S. Patent 9804118B2, 31 October 2017. [Google Scholar]
- Cao, Y.; Li, Y.; Yu, Y.; Jiang, J.; Li, X. Numerical analysis and design for NOx sensor pump units decoupling control. In Proceedings of the 2019 Chinese Automation Congress (CAC), Hangzhou, China, 22–24 November 2019; pp. 5815–5820. [Google Scholar] [CrossRef]
- Schmidt-Zhang, P.; Zhang, W.; Gerlach, F.; Ahlborn, K.; Guth, U. Electrochemical investigations on multi-metallic electrodes for amperometric NO gas sensors. Sens. Actuators B Chem. 2005, 108, 797–802. [Google Scholar] [CrossRef]
- Walsh, K.J.; Fedkiw, P.S. Nitric oxide reduction using iridium electrodes on yttria-stabilized zirconia. Solid State Ionics 1997, 104, 97–108. [Google Scholar] [CrossRef]
- Do, J.-S.; Chang, W.-B. Amperometric nitrogen dioxide gas sensor: Preparation of PAn/Au/SPE and sensing behaviour. Sens. Actuators B Chem. 2001, 72, 101–107. [Google Scholar] [CrossRef]
- Dutta, A.; Ishihara, T. Amperometric NOX sensor based on oxygen pumping current by using LaGaO3-based solid electrolyte for monitoring exhaust gas. Sens. Actuators B Chem. 2005, 108, 309–313. [Google Scholar] [CrossRef]
- Nakamura, T.; Sakamoto, Y.; Saji, K.; Sakata, J. NOx decomposition mechanism on the electrodes of a zirconia-based amperometric NOx sensor. Sens. Actuators B Chem. 2003, 93, 214–220. [Google Scholar] [CrossRef]
- de Lucas-Consuegra, A.; Caravaca, Á.; Dorado, F.; Valverde, J.L. Pt/K–βAl2O3 solid electrolyte cell as a “smart electrochemical catalyst” for the effective removal of NOx under wet reaction conditions. Catal. Today 2009, 146, 330–335. [Google Scholar] [CrossRef]
- Gao, J.; Hua, Z.; Xu, S.; Wan, H.; Zhi, Z.; Chen, X.; Fan, S. Amperometric gas sensors based on screen printed electrodes with porous ceramic substrates. Sens. Actuators B Chem. 2021, 342, 130045. [Google Scholar] [CrossRef]
- Yang, J.-C.; Dutta, P.K. High temperature amperometric total NOx sensors with platinum-loaded zeolite Y electrodes. Sens. Actuators B Chem. 2007, 123, 929–936. [Google Scholar] [CrossRef]
- Kaneko, H. Reduction of pulse-injected nitric monoxide using a zirconia oxygen pump-gauge. Solid State Ion. 2000, 136–137, 607–612. [Google Scholar] [CrossRef]
- Bashir, M.; Patri, S.R.; Krishnaprasad, K. A low power, high accuracy amperometric potentiostat for NOx gas sensors. In Proceedings of the International Conference on Next Generation Intelligent Systems (ICNGIS), Kottayam, India, 1–3 September 2016; pp. 1–4. [Google Scholar] [CrossRef]
- Aliramezani, M.; Koch, C.R.; Patrick, R. Phenomenological model of a solid electrolyte NOx and O2 sensor using temperature perturbation for on-board diagnostics. Solid State Ion. 2018, 321, 62–68. [Google Scholar] [CrossRef]
- Aliramezani, M.; Koch, C.R.; Hayes, R.E.; Patrick, R. Amperometric solid electrolyte NOx sensors—The effect of temperature and diffusion mechanisms. Solid State Ionics 2017, 313, 7–13. [Google Scholar] [CrossRef]
- Auckenthaler, T.S.; Onder, C.H.; Geering, H.P. Modelling of a Solid-Electrolyte Oxygen Sensor. SAE Trans. 2002, 111, 2162–2171. [Google Scholar] [CrossRef]
- Chen, Z.; Wang, J.; Wang, Y. Strategies for the performance enhancement of graphene-based gas sensors: A review. Talanta 2021, 235, 122745. [Google Scholar] [CrossRef] [PubMed]
- Wang, Z.; Deng, Z.-H.; Zhu, R.-J.; Zhou, Y.-H.; Li, X. Modeling and analysis of pumping cell of NOx sensor—Part Ⅰ: Main oxygen pumping cell. Sens. Actuators B Chem. 2022, 359, 131622. [Google Scholar] [CrossRef]
- Mitterdorfer, A.; Gauckler, L. Reaction kinetics of the Pt, O2(g)|c-ZrO2 system: Precursor-mediated adsorption. Solid State Ionics 1999, 120, 211–225. [Google Scholar] [CrossRef]
- Velle, O.; Norby, T.; Kofstad, P. The electrode system O2Pt‖ZrO2: 8Y2O3 investigated by impedence spectroscopy. Solid State Ionics 1991, 47, 161–167. [Google Scholar] [CrossRef]
- Okamoto, H.; Kawamura, G.; Kudo, T. Study of oxygen adsorption on platinum through observation of exchange current in a solid electrolyte concentration cell. Electrochim. Acta 1983, 28, 379–382. [Google Scholar] [CrossRef]
- Brailsford, A.; Yussouff, M.; Logothetis, E. Theory of gas sensors: Response of an electrochemical sensor to multi-component gas mixtures. Sens. Actuators B Chem. 1996, 34, 407–411. [Google Scholar] [CrossRef]
- Kato, N.; Kurachi, H.; Hamada, Y. Thick Film ZrO2 NOx Sensor for the Measurement of Low NOx Concentration. In Proceedings of the SAE International Congress & Exposition, Detroit, MI, USA, 23–27 February 1998; Volume 107, pp. 312–320. [Google Scholar] [CrossRef]
- Sekiya, T.; Saito, N.; Kageyama, S. Gas Sensor. U.S. Patent 0276659A1, 1 October 2015. [Google Scholar]
- Fujita, H.; Kasugai; Shindo, H. Sensor Element and Gas Sensor. U.S. Patent 9804139B2, 31 October 2017. [Google Scholar]


| Symbol | Description |
|---|---|
| P+ | Common external electrode of pump cell |
| P− | Internal electrode of main pump cell |
| M1 | Internal electrode of auxiliary pump cell |
| M2 | Internal electrode of measuring pump cell |
| Ref | reference electrode |
| Ip0 | Pumping current of main pump cell |
| Ip1 | Pumping current of auxiliary pump cell |
| Ip2 | Pumping current of measuring pump cell |
| C0, C1, C2 | Three chambers |
| Vp0 | Pumping voltage of main pump cell between P+ and P− |
| Vp1 | Pumping voltage of auxiliary pump cell between P+ and M1 |
| Vp2 | Pumping voltage of measuring pump cell between P+ and M2 |
| V0 | Nernst voltage in the first chamber between Ref and P− |
| V1 | Nernst voltage in the second chamber between Ref and M1 |
| V2 | Nernst voltage in the third chamber between Ref and M2 |
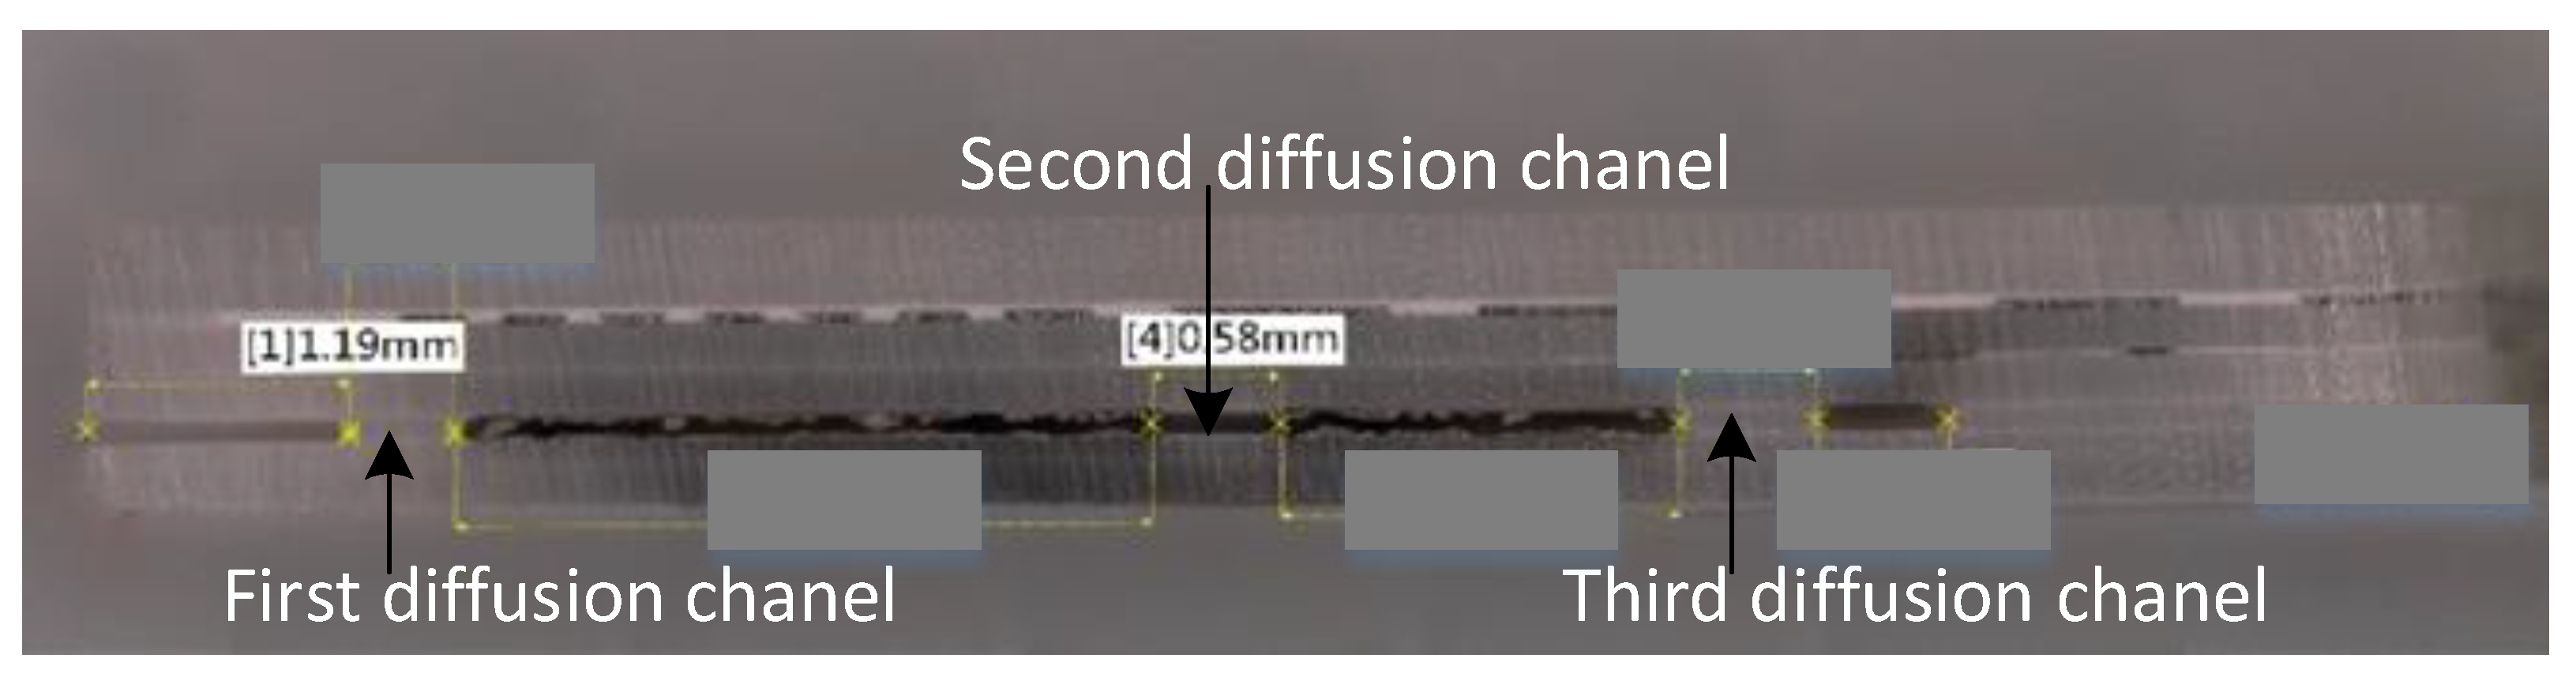
| D0, D1, D2 | Three diffusion channels |
| Second Diffusion Channel Structure Size | Ip1 Set Point | Ip1 Limit Current Value in Air |
|---|---|---|
| D1: L = 600 μm, W = 2500 μm, H = 16 μm | 35 μA | 1.45 mA |
| D1: L = 600 μm, W = 1500 μm, H = 16 μm | 25 μA | 1.25 mA |
| D1: L = 600 μm, W = 800 μm, H = 8 μm | 15 μA | 1.12 mA |
| Num. | λ = Air Fuel Ratio/14.7 | Ip0 μA | Ip1 μA | Ip2 μA | O2% | NOx ppm |
|---|---|---|---|---|---|---|
| Sample1 | λ = 1.000 | −32 | 20 | 0.772 | 0.18 | 473 |
| Sample2 | −32 | 20 | 0.778 | 0.19 | 475 | |
| Reference NOx sensor | - | - | - | 0.21 | 501 | |
| Sample1 | λ = 0.965 | −186 | 20 | 0.747 | −1.34 | 453 |
| Sample2 | −190 | 20 | 0.778 | −1.35 | 475 | |
| Reference NOx sensor | - | - | - | −1.29 | 481 | |
| Sample1 | λ = 0.935 | −315 | 20 | 0.52 | −2.51 | 294 |
| Sample2 | −311 | 20 | 0.721 | −2.45 | 435 | |
| Reference NOx sensor | - | - | - | −2.44 | 458 | |
| Sample1 | λ = 0.912 | −445 | 20 | 0.324 | −3.69 | 157 |
| Sample2 | −438 | 20 | 0.647 | −3.65 | 383 | |
| Reference NOx sensor | - | - | - | −3.63 | 389 | |
| Sample1 | λ = 0.890 | −560 | 20 | 0.159 | −4.69 | 58 |
| Sample2 | −558 | 20 | 0.593 | −4.63 | 345 | |
| Reference NOx sensor | - | - | - | −4.58 | 353 |
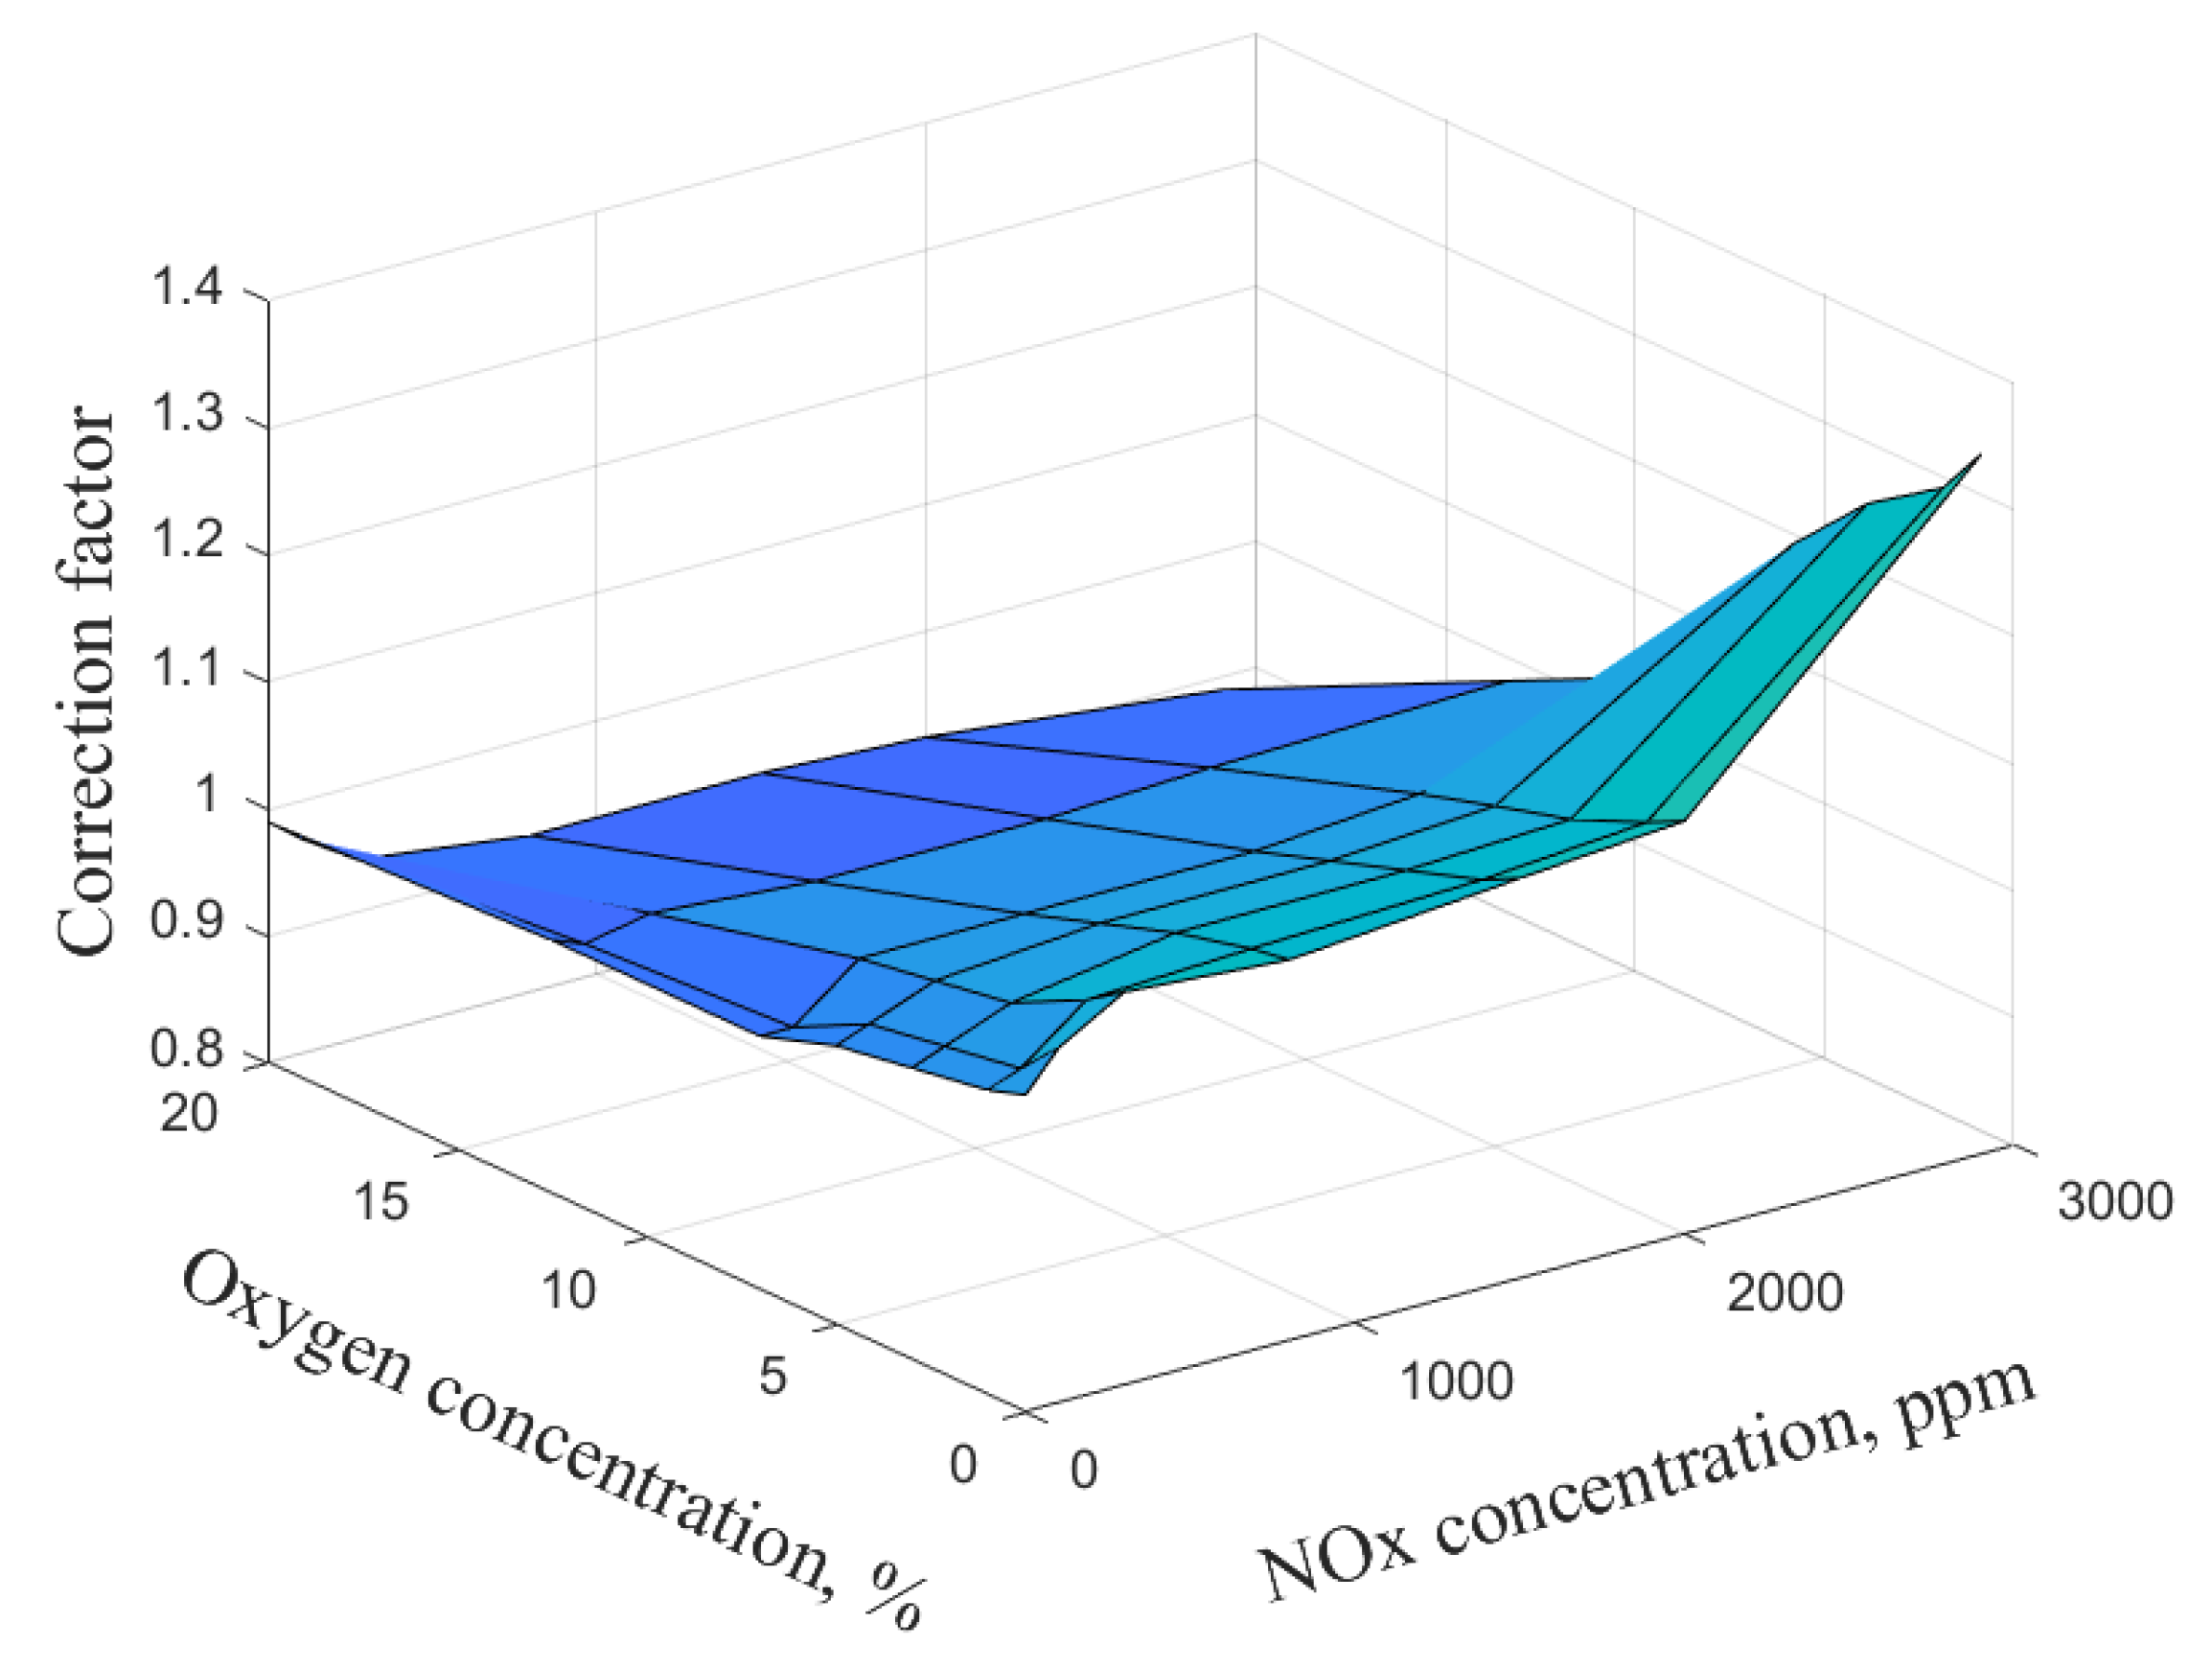
| NOx Concentration | 0.00 ppm | 100.00 ppm | 300.00 ppm | 800.00 ppm | 1500.00 ppm | 2000.00 ppm | 2900.00 ppm | ||
|---|---|---|---|---|---|---|---|---|---|
| Correction Factor | |||||||||
| O2 Concentration | |||||||||
| 0.00% | 1.05 | 1.08 | 1.11 | 1.10 | 1.12 | 1.13 | 1.35 | ||
| 1.00% | 1.04 | 1.05 | 1.09 | 1.10 | 1.10 | 1.11 | 1.31 | ||
| 3.00% | 1.03 | 1.04 | 1.06 | 1.08 | 1.08 | 1.09 | 1.27 | ||
| 5.00% | 1.02 | 1.03 | 1.05 | 1.06 | 1.06 | 1.07 | 1.21 | ||
| 7.00% | 1.00 | 1.00 | 1.04 | 1.04 | 1.04 | 1.05 | 1.08 | ||
| 12.50% | 1.00 | 0.99 | 1.00 | 0.99 | 0.99 | 1.00 | 1.00 | ||
| 20.00% | 0.99 | 0.97 | 0.94 | 0.92 | 0.92 | 0.92 | 0.89 | ||
| Test Name | SDPK Test | ||||||||
|---|---|---|---|---|---|---|---|---|---|
| Test Record Name | WLTC Class3b SDPK Vehicle 20200430 2 | ||||||||
| Gas composition | CO2 | CO | THC | CH4 | NMHC | NOX | HC + NOX | NMHC + NOX | N2O |
| unit | g/km | mg/km | mg/km | mg/km | mg/km | mg/km | mg/km | mg/km | mg/km |
| Dilute | 239.60 | 154.7 | 27.7 | 14.9 | 18.7 | 23.7 | 51.4 | 42.3339 | 15.2 |
| Bag | 239.46 | 142.1 | 26.7 | 15.3 | 10.2 | 22.6 | 49.2 | 32.8058 | 14.8 |
| China GB6b Class 2 _III limit | - | 740 | 80 | - | - | 50 | - | 55 | 3 |
Publisher’s Note: MDPI stays neutral with regard to jurisdictional claims in published maps and institutional affiliations. |
© 2022 by the authors. Licensee MDPI, Basel, Switzerland. This article is an open access article distributed under the terms and conditions of the Creative Commons Attribution (CC BY) license (https://creativecommons.org/licenses/by/4.0/).
Share and Cite
Wang, J.; Li, X.; Wang, Z.; Feng, J.; Lin, W.; Peng, J. Research on Application Characteristics of Zirconia-Based High-Temperature NOx Sensors. Energies 2022, 15, 2919. https://doi.org/10.3390/en15082919
Wang J, Li X, Wang Z, Feng J, Lin W, Peng J. Research on Application Characteristics of Zirconia-Based High-Temperature NOx Sensors. Energies. 2022; 15(8):2919. https://doi.org/10.3390/en15082919
Chicago/Turabian StyleWang, Jie, Xi Li, Zhen Wang, Jiangtao Feng, Weixun Lin, and Jingxuan Peng. 2022. "Research on Application Characteristics of Zirconia-Based High-Temperature NOx Sensors" Energies 15, no. 8: 2919. https://doi.org/10.3390/en15082919
APA StyleWang, J., Li, X., Wang, Z., Feng, J., Lin, W., & Peng, J. (2022). Research on Application Characteristics of Zirconia-Based High-Temperature NOx Sensors. Energies, 15(8), 2919. https://doi.org/10.3390/en15082919