Article

Research on Conductivity Damage Based on Response Surface Analysis

School of Petroleum Engineering, Yangtze University, Wuhan 430100, China
*
Author to whom correspondence should be addressed.
Energies 2022, 15(8), 2818; https://doi.org/10.3390/en15082818
Submission received: 20 February 2022 / Revised: 2 April 2022 / Accepted: 9 April 2022 / Published: 12 April 2022

Abstract

:
Hydraulic fracturing is an important means of developing unconventional oil and gas layers. The fracture conductivity of tight sandstone reservoirs after fracture is affected by many factors, such as the interaction between the fracturing fluid, water, and rocks; the fracturing materials; and the construction parameters. This paper improves the experimental process of the long-term conductivity test and provides insight into conductivity prediction and optimization based on the response surface test method. The test process is conducted in the following manner: (1) inject nitrogen to evaluate the fracture conductivity before fracturing fluid damage; (2) inject fracturing fluid to simulate shut-in; and (3) inject nitrogen again to evaluate fracture conductivity after the damage ability of the fracturing fluid. The single factor test results show that the lower the sand concentration is, the higher the fracturing fluid viscosity will be, and the longer the fracturing fluid retention time is, the greater the damage to the conductivity of the fracturing fluid will be. The response surface test results show that the order of factors affecting the retention of conductivity is fracturing fluid viscosity > sand concentration > fracturing fluid retention time. There is a certain interaction between sand concentration and fluid viscosity, and there is also a certain interaction between fluid viscosity and fluid retention time, but these interactions are not significant; when the fracturing fluid retention time is longer, there will be an interaction between the sand concentration and the fracturing fluid retention time. In addition, based on the model used to optimize the fracturing construction parameters from the perspective of proppant conductivity damage, the optimal solution is when the viscosity of the fracturing fluid is 1 mPa.s, the paved-sand content is 8.49 kg/m2, and the retention time of the fracturing fluid is 10 h. The maximum retention rate of the flow conductivity is 63.19%.

1. Background

Horizontal well fracturing technology has been widely used in tight gas reservoirs and has achieved good results. The question of how to obtain artificial fractures with long-term high-efficiency conductivity is a key issue in fracturing design [1]. Sandstone reservoir conditions are complex, and fracture conductivity after fracturing begins is affected by many factors [2]. Therefore, it is necessary to conduct a systematic study of the conductivity damage test.
There are many factors that affect the conductivity of hydraulic fractures, including the properties of the fracturing fluid [3], the proppant [4], and its interaction with the reservoir rocks [5]. Jansen et al. [6] studied the characteristics of rocks and fractures. The influence of conductivity indicates that proppant embedding is more likely to occur under low-density proppant placement; the research results of Abhinav Mittal et al. [7] revealed that proppant fragmentation and migration are the main reasons for the decline in conductivity. The study of J. Zhang et al. [8] showed that, as rock softens after being exposed to water and the proppant embedment becomes serious, up to 88% of conductivity may be lost.
The response surface method is an alternative to the traditional sensitivity analysis. The basic idea behind this methodology is to vary multiple parameters at the same time so that maximum inference can be attained with minimum cost [9]. This method can simultaneously explain the influence of multiple factors and their interactions with nonlinear equations, so it is widely used in the petroleum field [10,11,12]. Current long-term conductivity tests, rarely consider the effect of fluids, and due to the limitations of conventional test methods, the accurate prediction and optimization of conductivity cannot be performed. Experiments can be difficult to conduct when the interactions between factors are unclear. These situations provide opportunities for the application of response surface methods.
This study was based on the reservoir conditions of the Linxing block in China. First, single-factor tests were used to investigate the degree of damage caused by different parameters to the proppant conductivity. On this basis, the Box–Behnken design was used to create a three-factor three-level test plan and apply it. The Design-Expert software was used to process the test data; analyze the significance ranking of the damage caused to the conductivity of factors such as sand concentration, fracturing fluid viscosity, and fracturing fluid retention time and their pairwise interactions; and establish related regression equations. The research results can provide guidance for the design and optimization of the fracturing parameters of sandstone reservoirs.

2. Test Equipment and Methods

2.1. Test Experimental Procedure

2.1.1. Test Material

The test rock slab was processed from the collected Linxing sandstone outcrop, which meets the API diversion chamber standard. The rock slab was 17.78 cm long, 3.81 cm wide, and 1.5 cm high. The test fluid was clean water, the fracturing fluids had different viscosities, and the test gas was dry nitrogen. The proppant used in the experiment was low-density 30/50 mesh ceramsite.

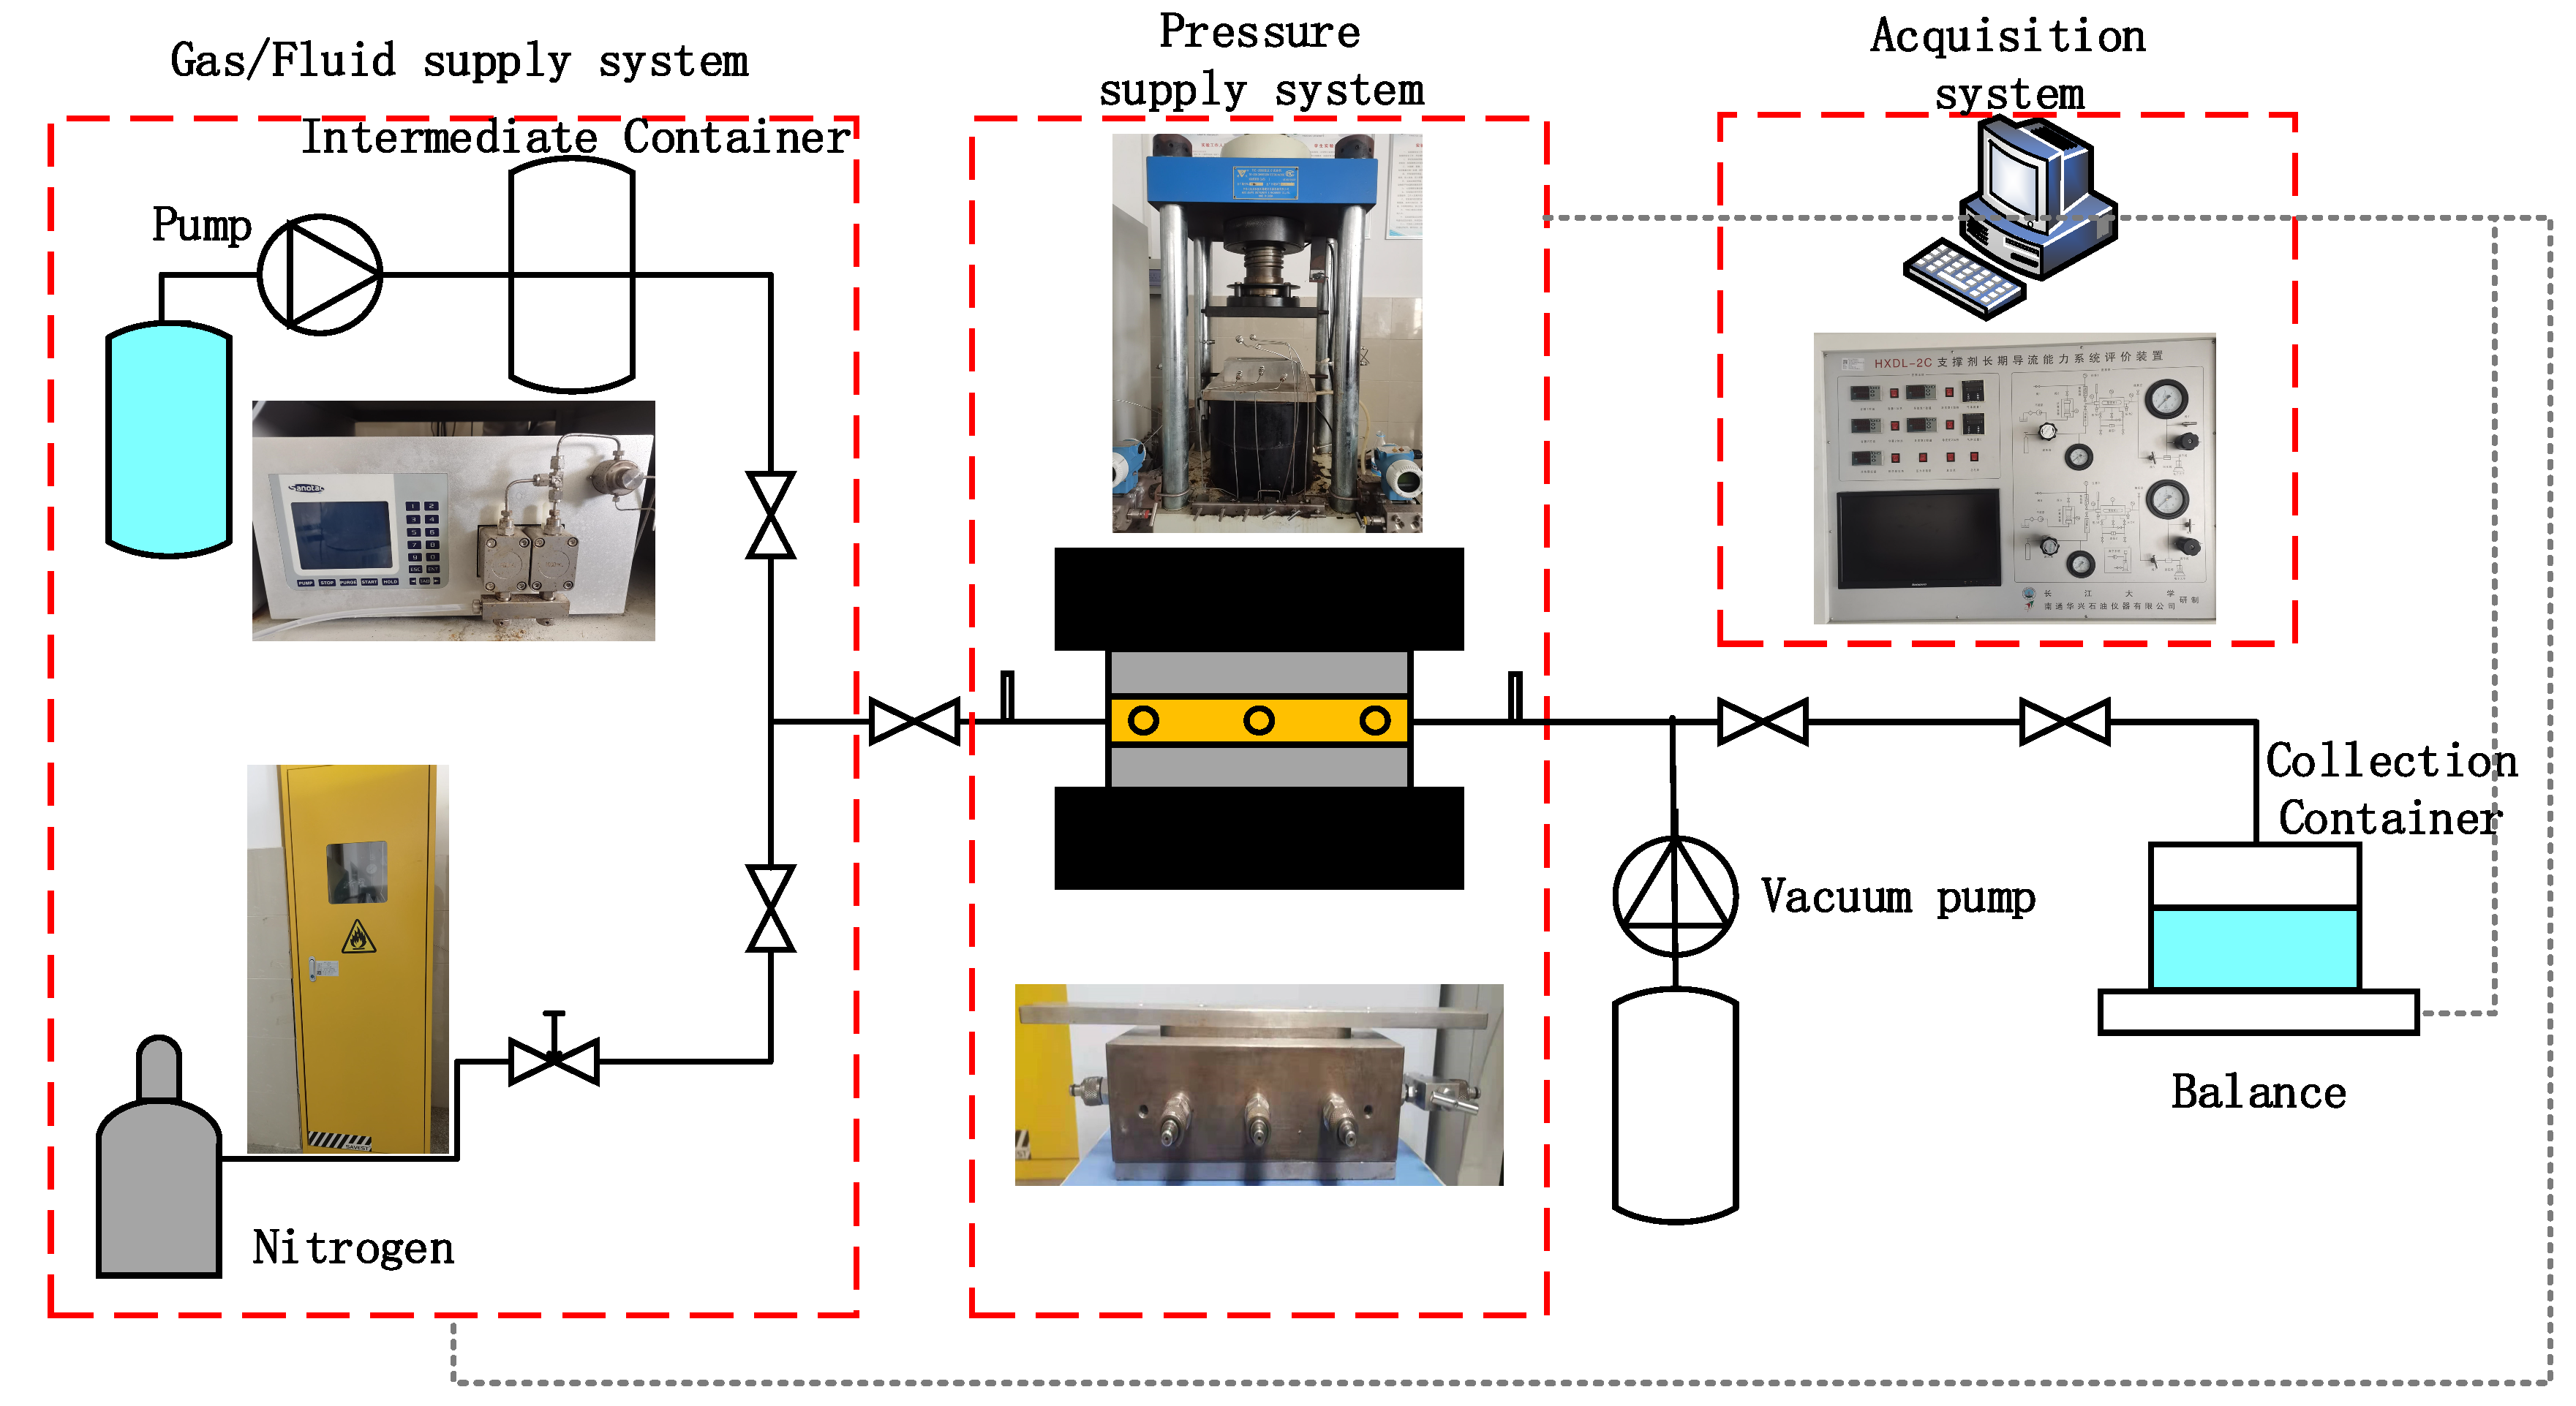
2.1.2. Test Equipment

For the test, we used the self-developed HXDL-2C long-term conductivity evaluation device, which can simulate the conductivity of fractures under the closing pressure of 10–150 MPa. Figure 1 shows the process used for conducting the damage test of the proppant conductivity. The system used consisted of a diversion chamber, a hydraulic press, a vacuum pump, and a constant-flow plunger pump, together with a pressure sensor, a displacement sensor, and a balance to form a research and evaluation system. Both the front and rear ends of the diversion chamber were connected with high-precision pressure sensors and displacement sensors. During the test, data, such as the pressure, flow rate, and dynamic fracture width, could be collected in real time so as to calculate the real-time fracture conductivity.

2.2. Test Methods

2.2.1. Calculation Method of Conductivity Damage

The calculation of conductivity was based on Darcy’s law. For the test, we adopted the API standard diversion chamber. After conversion, the calculation formula of fluid conductivity and gas conductivity can be expressed as follows:
F c D w = k w w f = 5.555 Q w μ w p 1 p 2
F c D g = k g w f = 1.11 × 10 3 Q g μ g p 1 2 p 2 2
In order to characterize the influence of fracturing fluid damage on conductivity, the conductivity retention rate was defined as the ratio of gas conductivity before and after the fracturing fluid invaded:
R f g = F c D g 2 F c D g 1
where F c D w is the conductivity of liquid measurements, F c D g is the conductivity of gas measurements, Q w is the liquid flow, Q g is the gas flow, μ w is the liquid viscosity, μ g is the gas viscosity, and p 1 and p 2 are the test point pressures.

2.2.2. Test of Proppant Conductivity Damage

The proppant conductivity damage test was divided into three stages. (1) In the initial stage of gas supply, the long-term conductivity of the gas was tested with nitrogen. The test time was 24 h, which indicates the fracture conductivity before the fracturing fluid penetrated. (2) In the mid-term fluid supply stage, fracturing fluids of different viscosities were injected to simulate the intrusion process of fracturing fluids. The test time of this stage was 1–48 h, which represents the residence time of different fracturing fluids (time of after-fracturing shut-in). (3) In the late stage of gas supply, nitrogen gas was supplied again for the conductivity test to obtain the conductivity of the artificial fractures after the penetration of the fracturing fluid [13].
During the test, the temperature was kept constant at 25 °C, the formation closing pressure was 50 MPa, the liquid flow rate was 5 mL/min, and the gas flow rate was 300 mL/min. We used the factors shown in Table 1 to carry out a damage test of the proppant conductivity. The ratio of the conductivity before and after the fracturing fluid invasion (i.e., retention rate) was used as the evaluation index to investigate the influence of the three factors on the diversion capacity. On this basis, we selected a reasonable variation range value for each factor and used the conductivity retention rate as an evaluation index. Based on the Box–Benhnken method, the response surface test was designed, and the test data were processed and analyzed through the Design-Expert software to determine the factors and differences. The significance of the combination of factors was determined so as to systematically analyze the mechanism of influence of each factor on the damage of the proppant conductivity.
At the same time, using the conductivity retention rate as the response variable, and the sanding concentration, fracturing fluid viscosity, and fracturing fluid retention time as the independent variables, a three-dimensional quadratic regression model was established and variance analysis and regression fitting were performed to verify the regression. Parameter optimization was performed on the basis of the reliability of the model, and the model was used to guide the optimal design of fracturing in the actual production.

3. Results and Discussion

3.1. Single Factor Test Results and Discussion

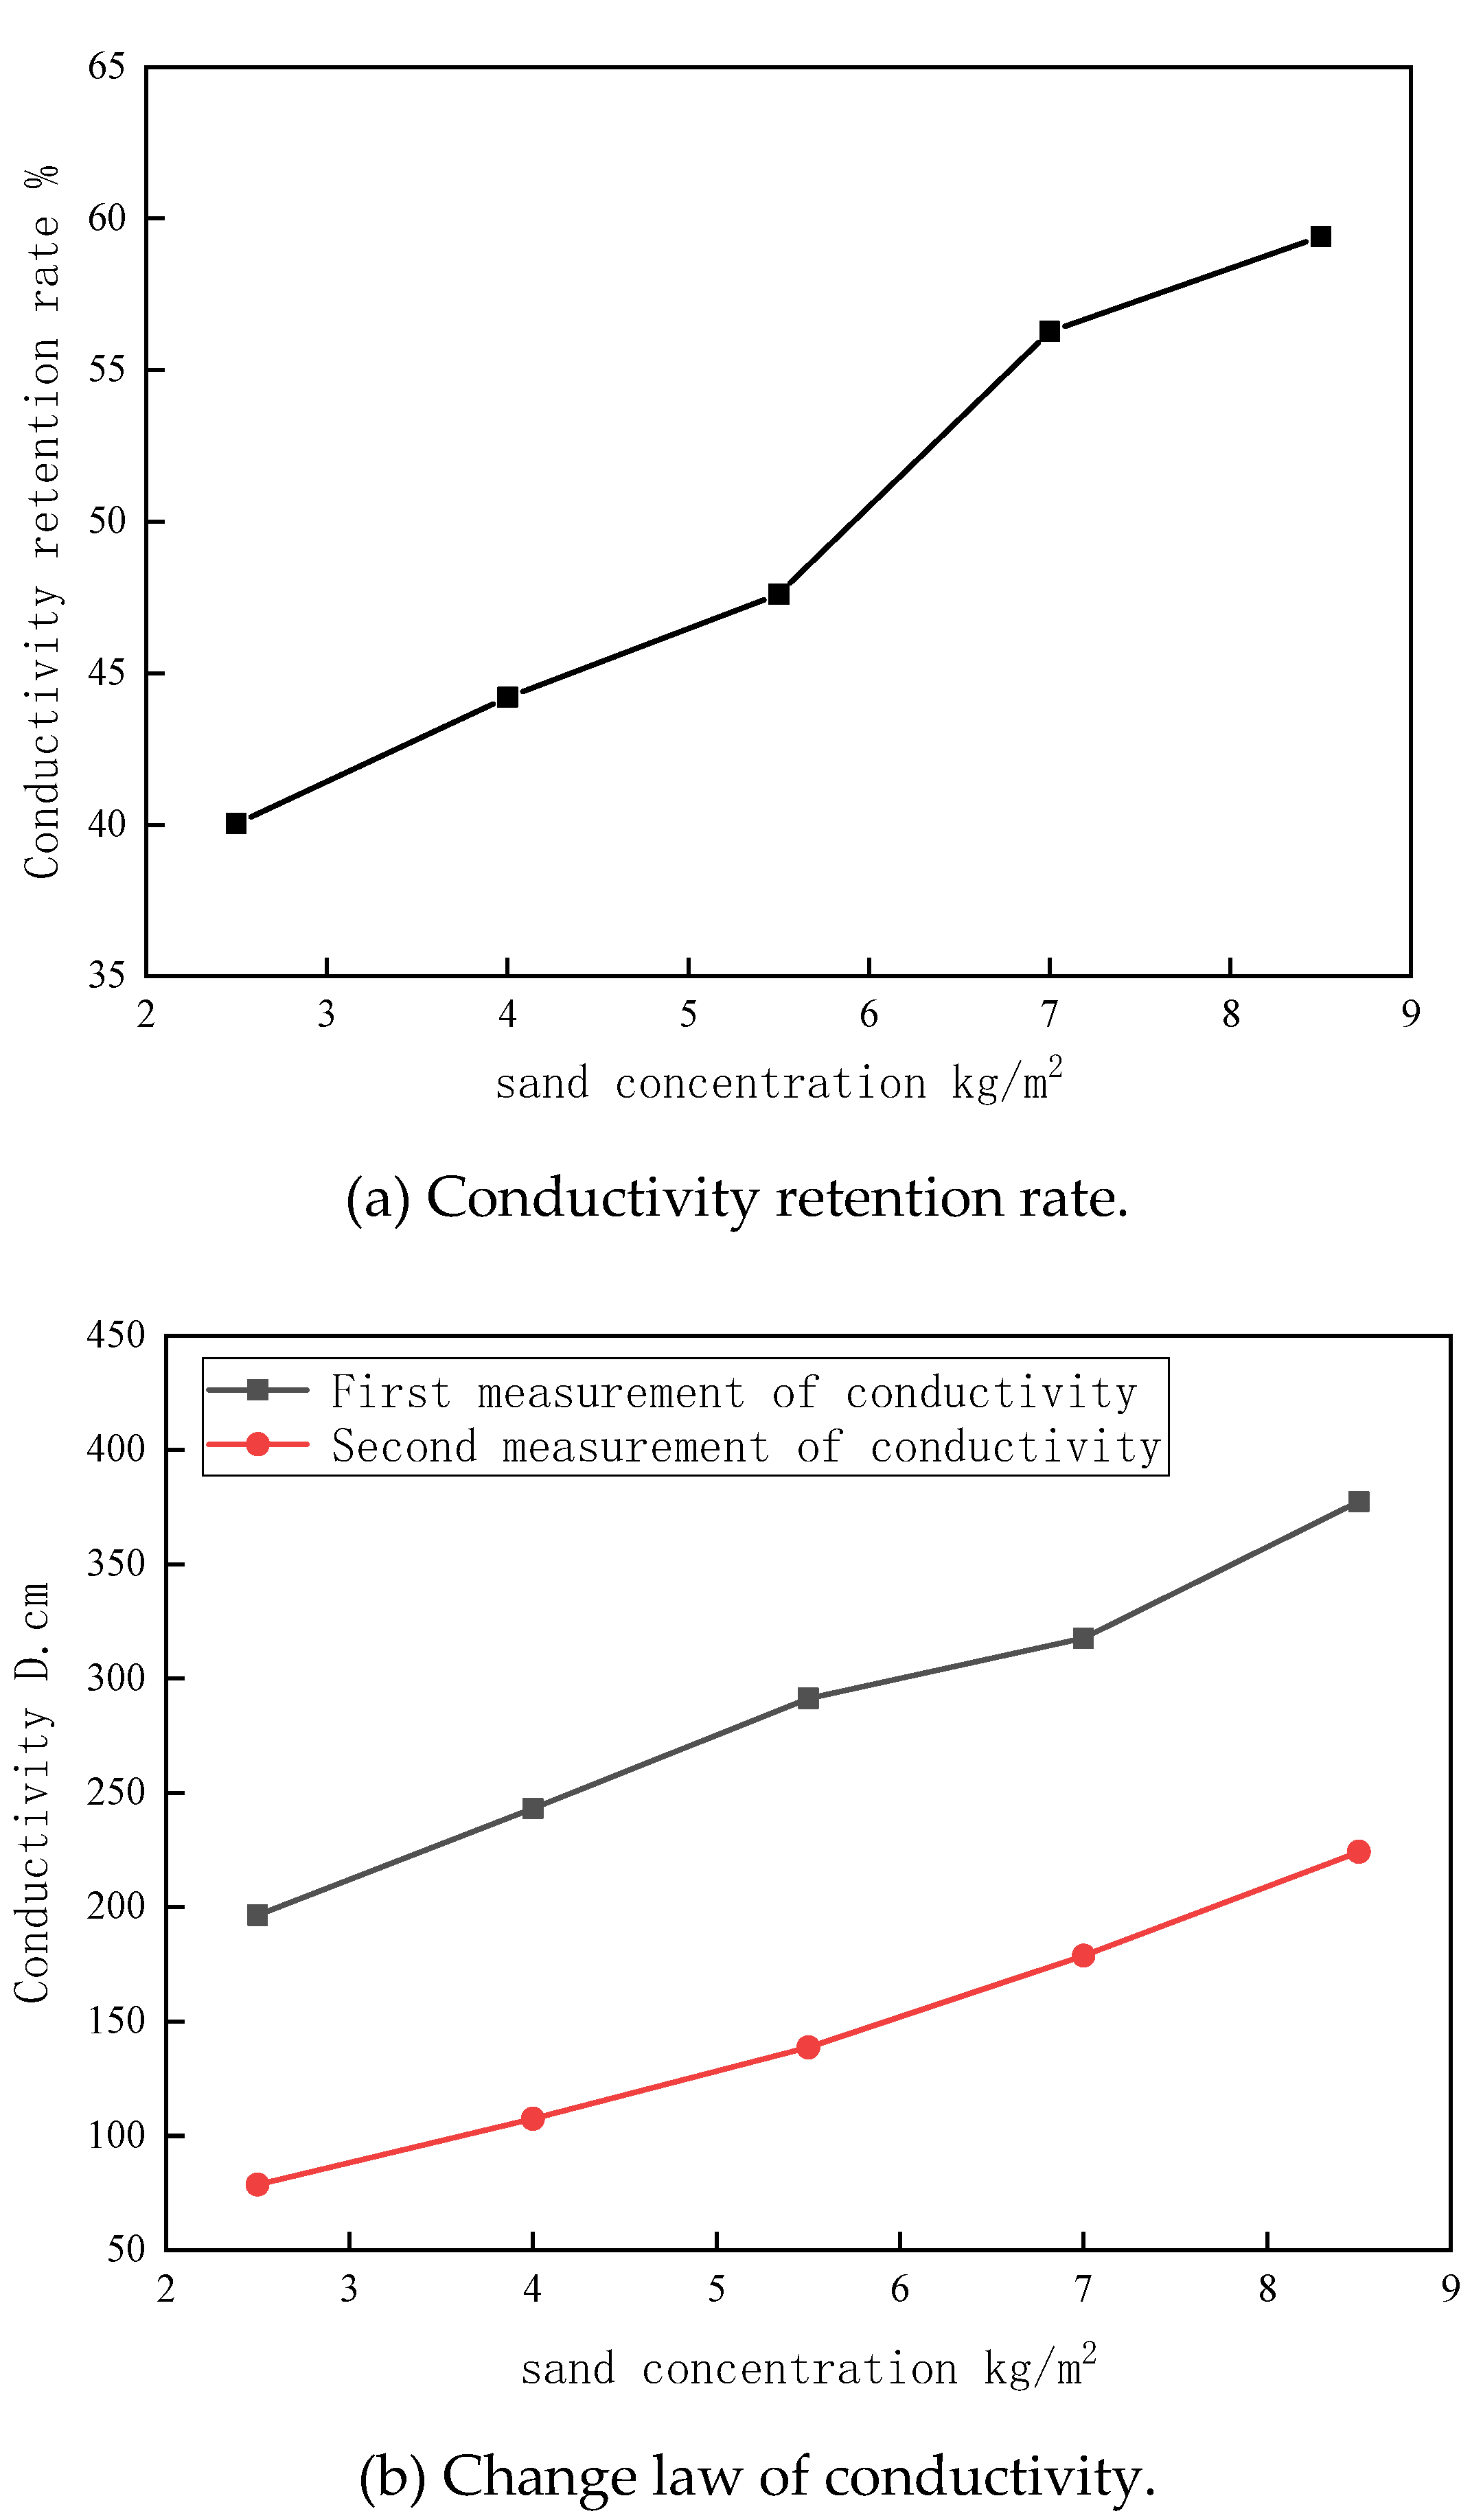
3.1.1. The Influence of Sand Concentration

Figure 2 shows the variation in fracture conductivity under different sanding concentrations when the fracturing fluid has a viscosity of 1 mPa.s and a retention time of 12 h. It can be seen from Figure 2b that the conductivity of the two gas measurements gradually increased with the increase in sanding concentration [14]. Taking the first measurement as an example, when the sand concentration increased from 2.5 kg/m2 to 8.5 kg/m2, the conductivity increased from 147 D.cm to 283 D.cm. This is because the sand concentration will affect the crack width, which, in turn, affects the diversion capacity [15].
Using Figure 2a to analyze the conductivity retention rate under different sanding concentrations, the test results show that the intrusion of fracturing fluid damages the proppant conductivity [16], and the conductivity gradually increases with the increase in sanding concentration. When the sanding concentration is 2.5 kg/m2, the damage is the most serious. At this time, the conductivity retention rate is 40.03%. This is because, when the sand concentration is low, the proppant particles are more likely to be embedded and broken; thus, the effective heights of the proppant packing layer and the effective flow pores are reduced, so the conductivity of the proppant is more damaged. In addition, it can be seen from Figure 2a that, when the sand concentration is greater than 7 kg/m2, the curve trend slows down. Therefore, the three levels of sand concentration in the Box–Benhnken design of this study are 5.5, 7, and 8.5 kg/m2, respectively.

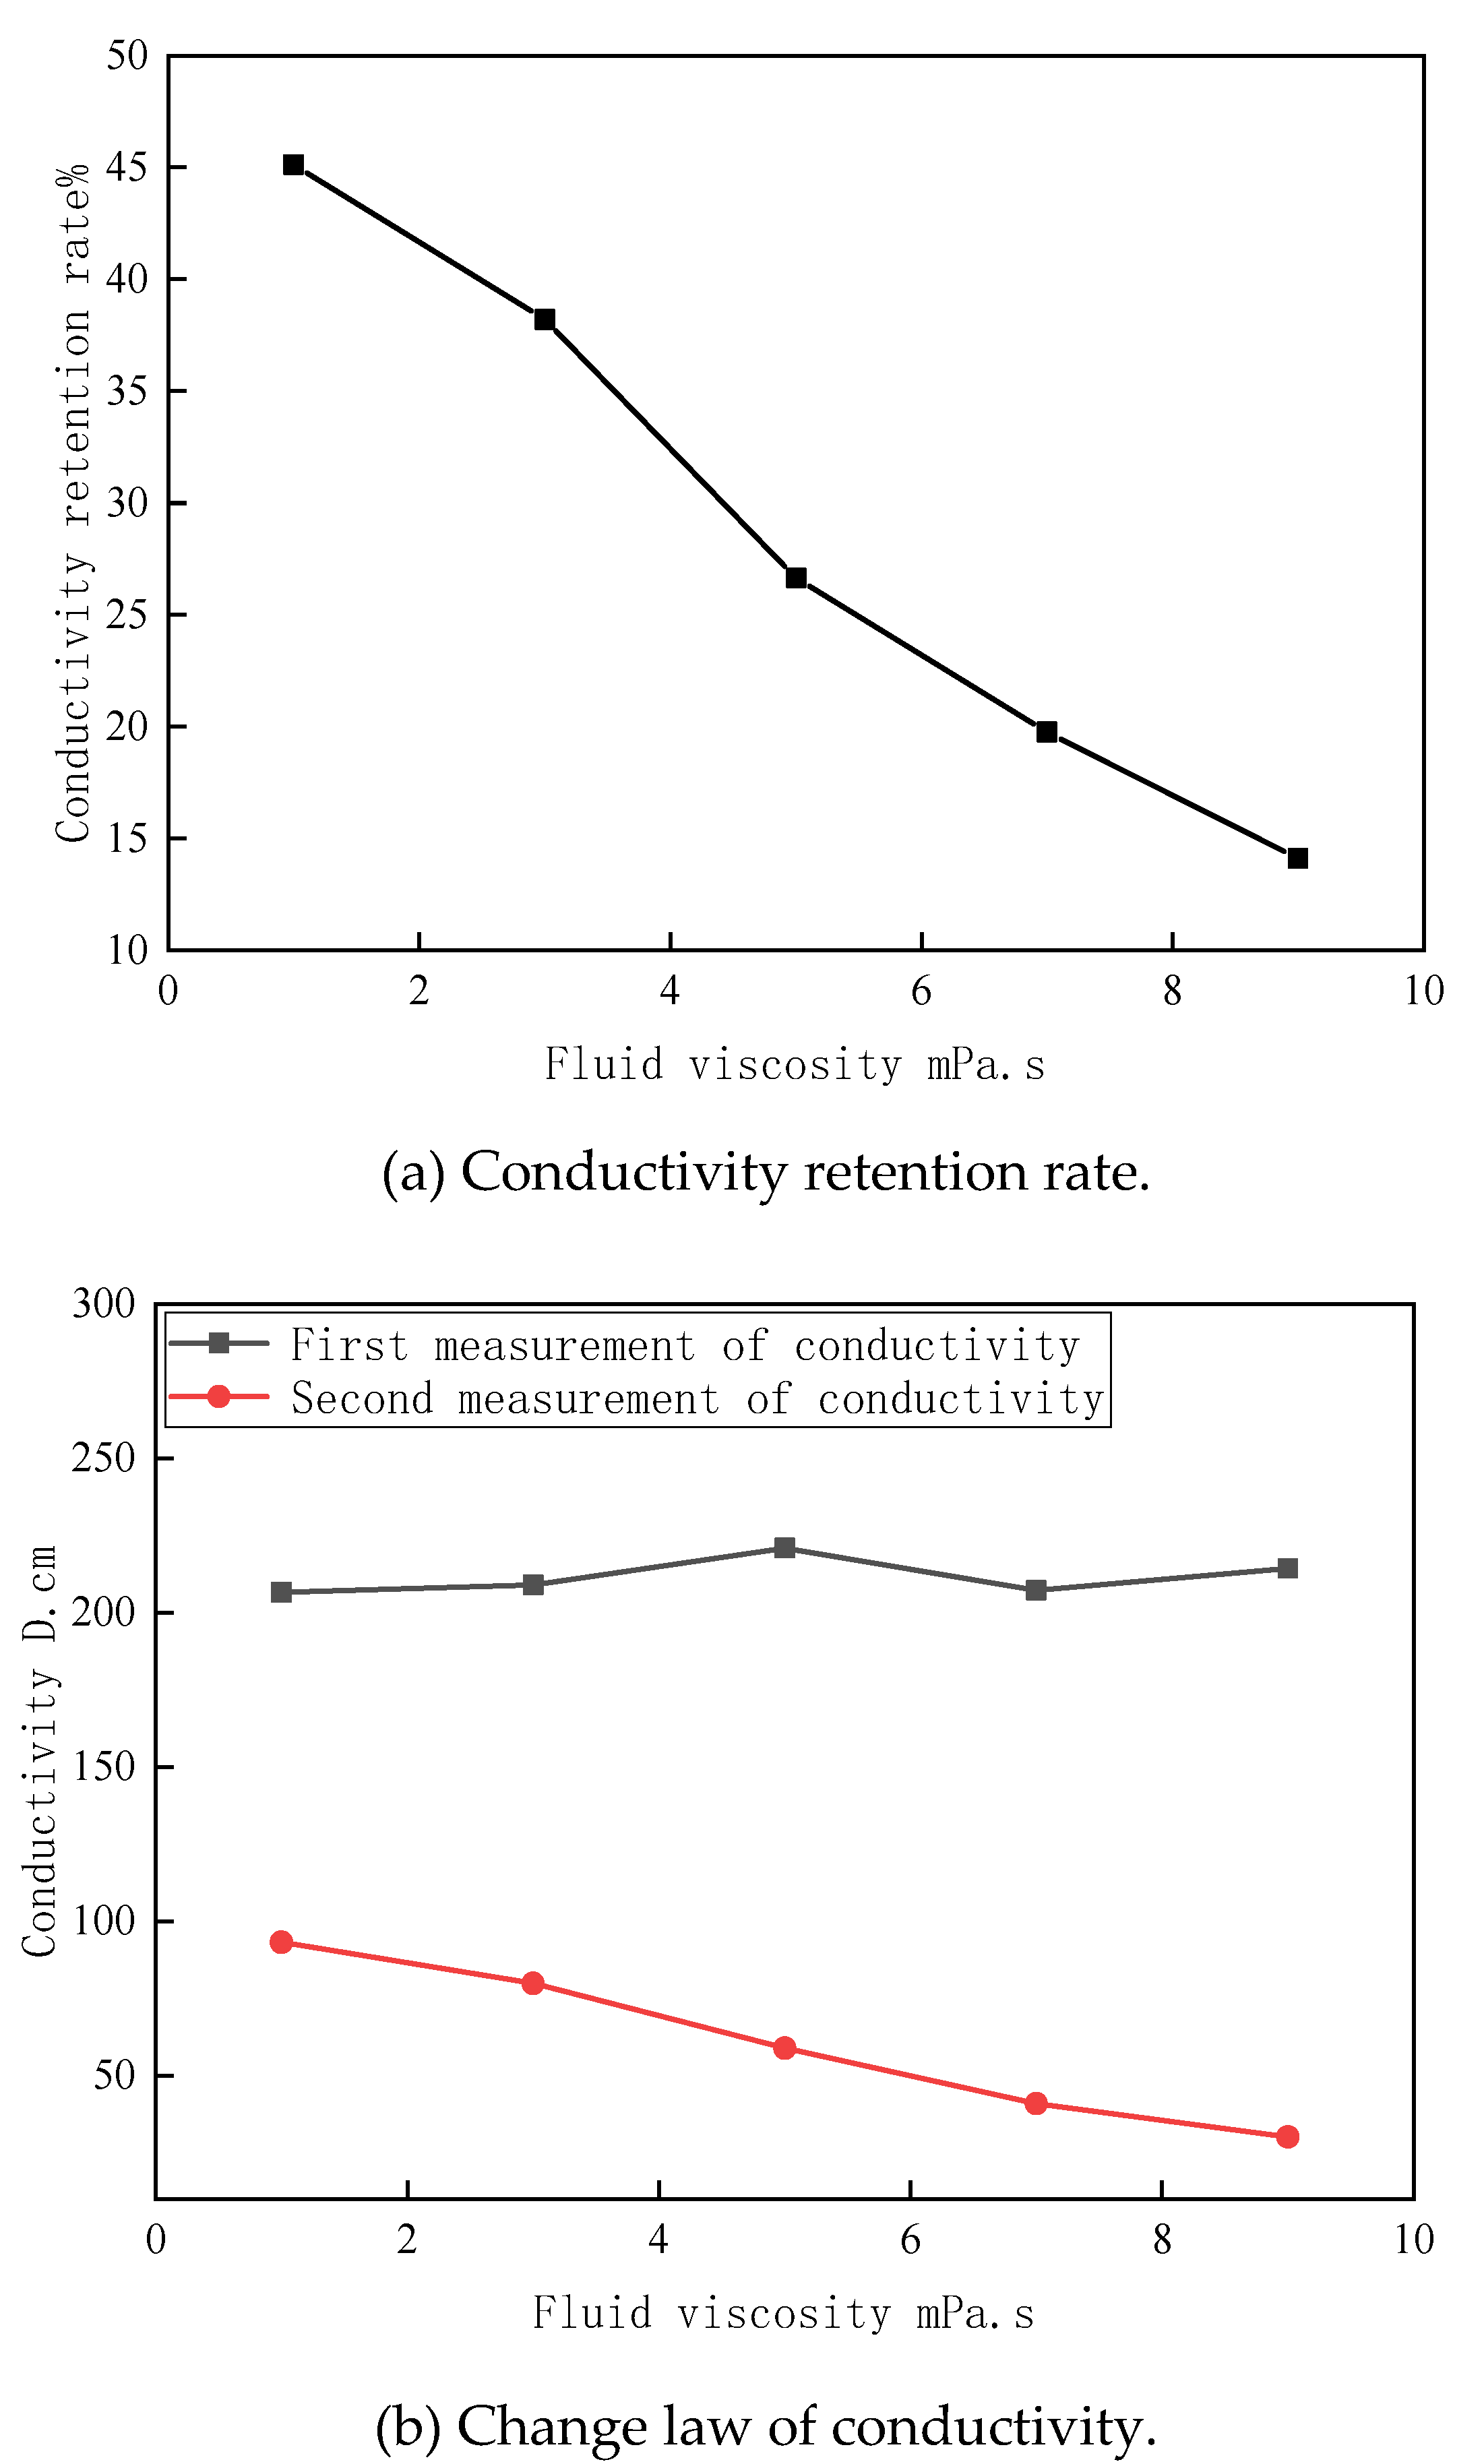
3.1.2. The Influence of Fracturing Fluid Viscosity

Figure 3 shows the change rule of fracture conductivity under different fracturing fluid viscosities when the sanding concentration is 5.5 kg/m2 and the residence time is 12 h. It can be seen from Figure 2b that, as the viscosity of the fracturing fluid increases, the conductivity value of the second gas measurement gradually decreases [17]. When the viscosity of the fracturing fluid changes from 1 mPa.s (clear water) to 9 mPa.s, the second measurement of the conductivity changes from 93 D.cm to 30 D.cm. This is because, after the fracturing fluid penetrates the proppant packing layer, the residues in the fracturing fluid system settle and accumulate in the supporting fractures and block the flow channels [18], which reduces the fracture conductivity.
It can also be seen from Figure 2a that, as the viscosity of the fracturing fluid increases, the conductivity of the damage increases, and the relationship is almost linear. Considering that the actual fracturing fluid is mostly slippery water with a low viscosity and less residue, the three levels of fracturing fluid viscosity in the Box–Benhnken design are 1, 3, and 5 mPa.s.

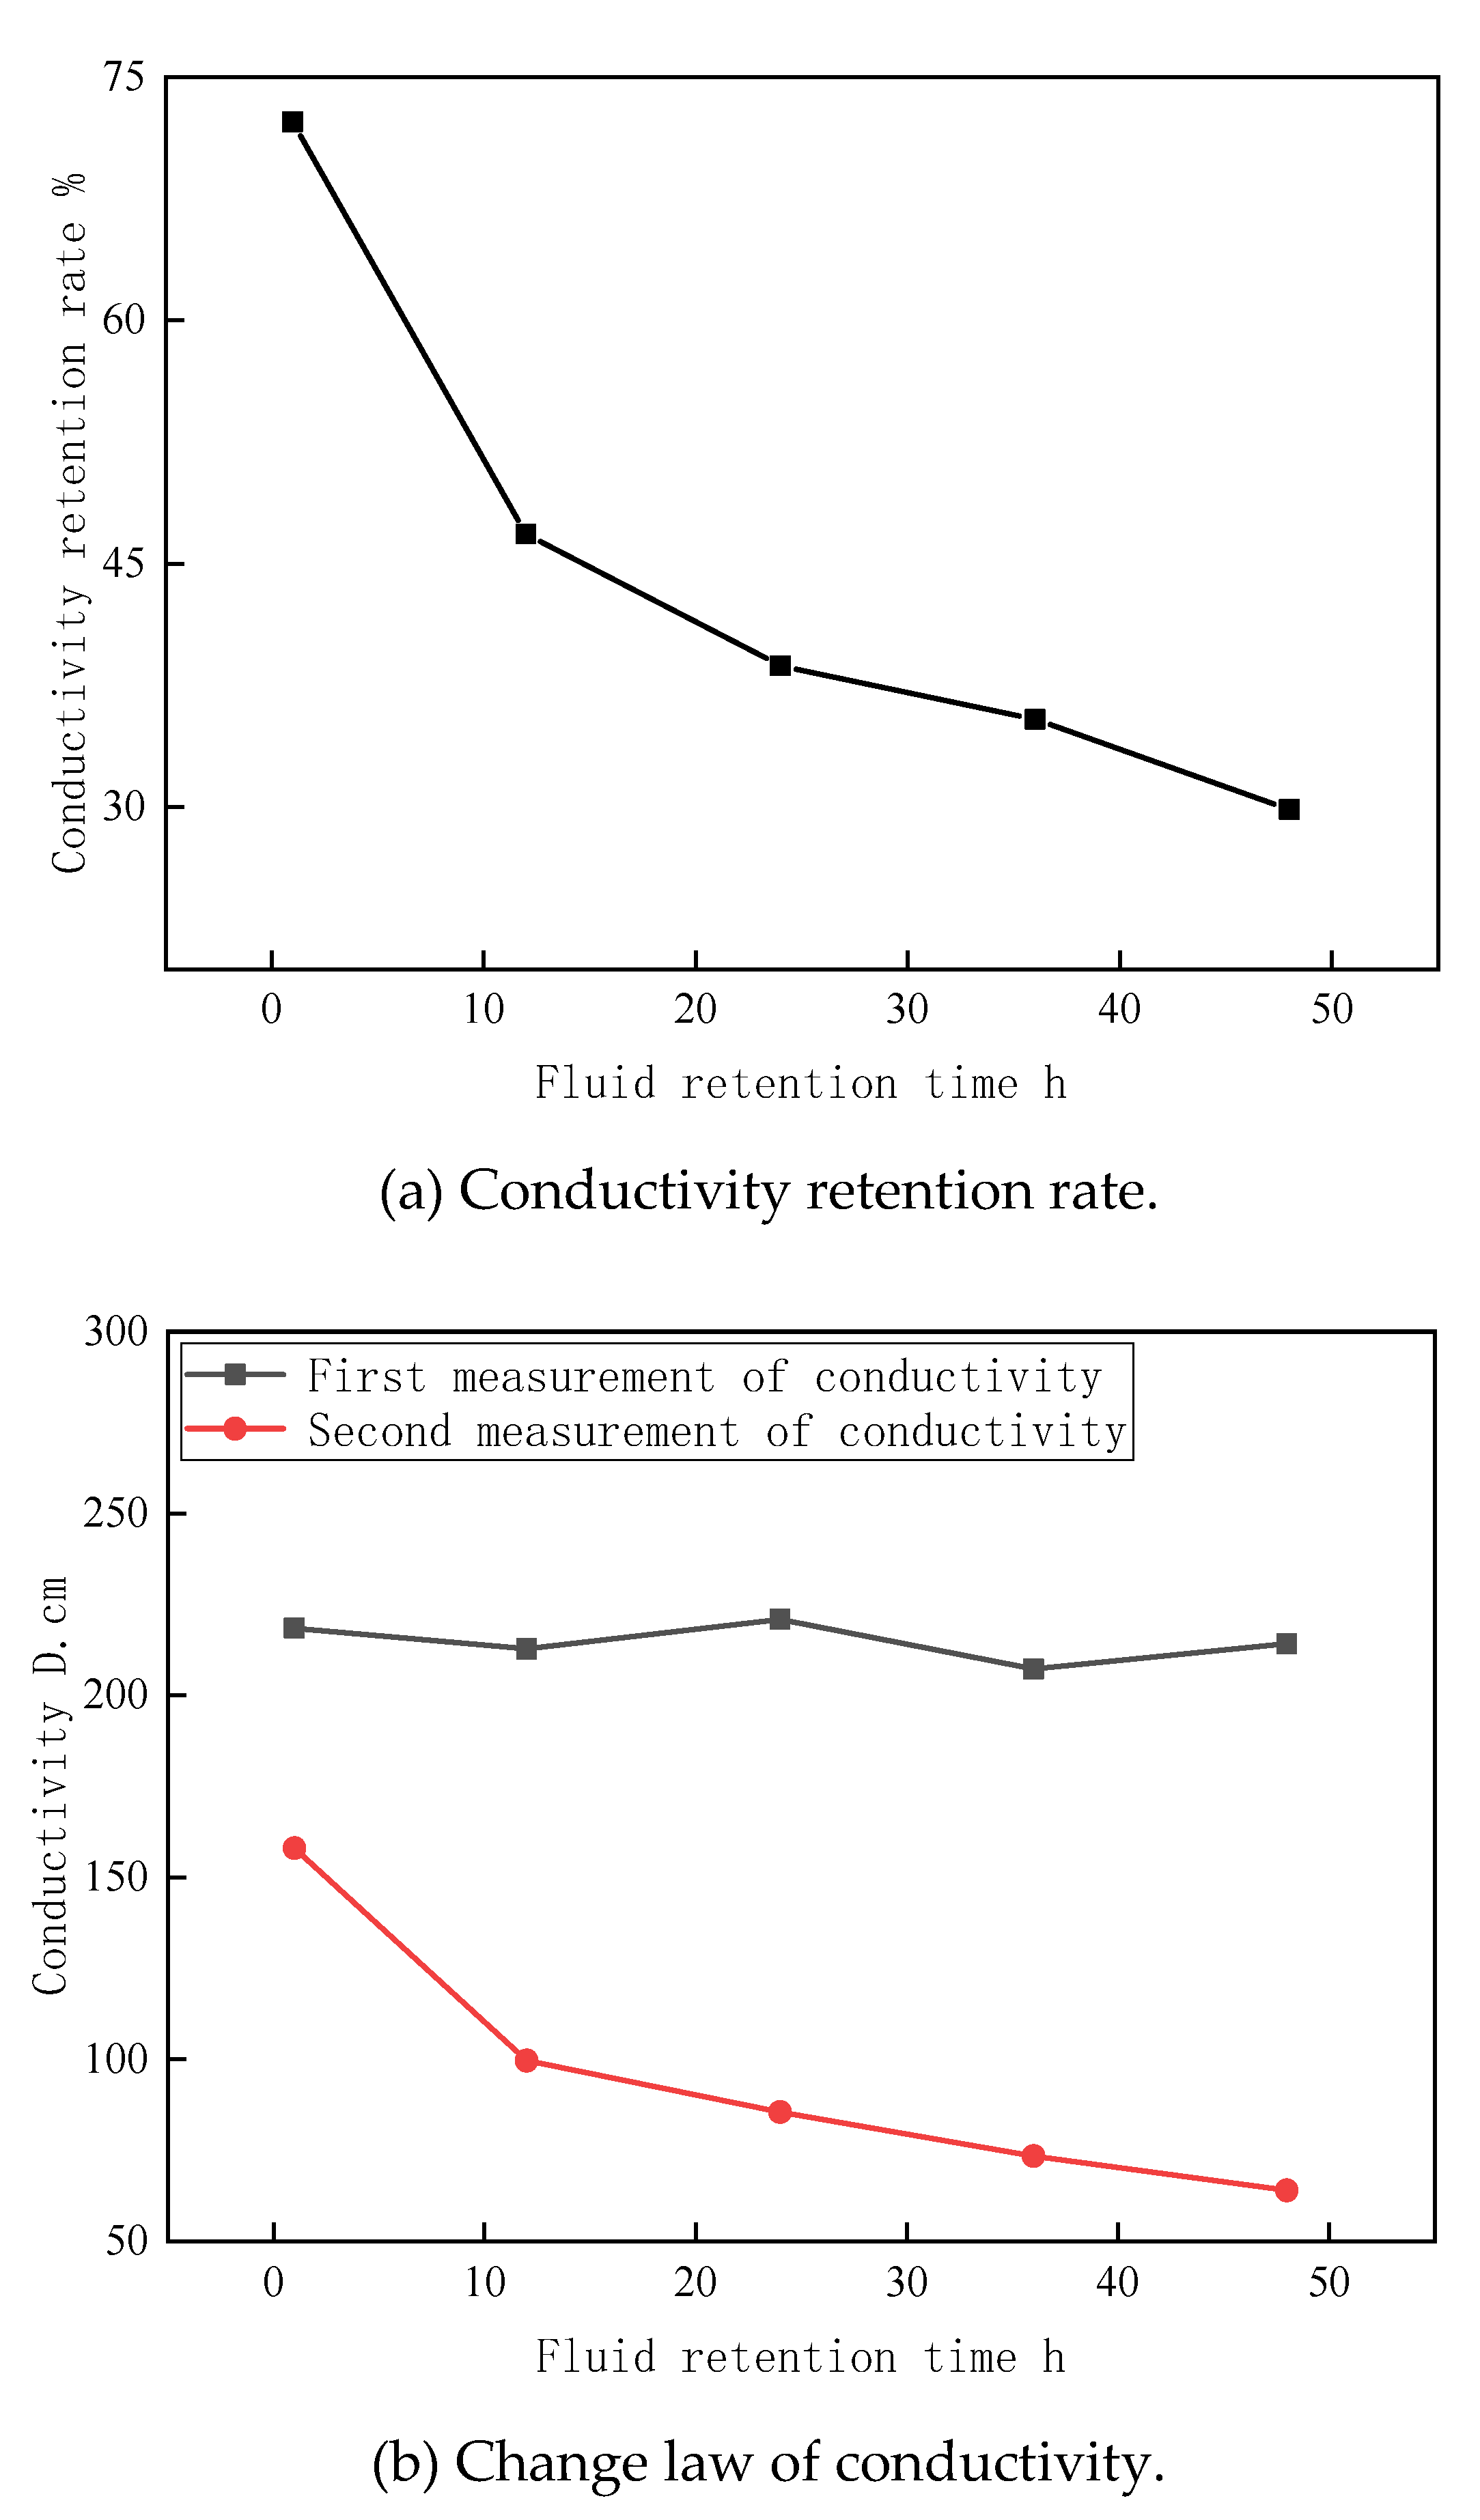
3.1.3. The Influence of Fracturing Fluid Retention Time

Figure 4 shows the change law of fracture conductivity under different fracturing fluid retention times when the sand concentration is 5.5 kg/m2 and the fracturing fluid viscosity is 1 mPa.s. It can be seen from Figure 4b that the proppant conductivity gradually decreases with the increase in the fracturing fluid retention time. When the fracturing retention time is 48 h, the second measurement of conductivity is 63 D.cm, and only the initial measurement of conductivity is 30.6% of the capacity, which is mainly due to proppant embedding [19] and proppant fragmentation [20].
Figure 5 shows a photo of the proppant crushing test. It can be seen from the figure that the crushing rate of proppants of the same weight and the same type is different under different residence times of fracturing fluid. The soaking of the fracturing fluid will reduce the compressive strength of the proppant and increase the crushing rate. At the same time, the fine particles produced by the crushing of the proppant will further damage the conductivity of the flow.
It can be seen from Figure 4a that, as the retention time of fracturing fluid becomes longer, the damage to the conductivity of the fracturing fluid gradually increases, and the retention rate of the conductivity is gradually reduced, but the decrease becomes smaller and smaller. This is because the proppant fracture mainly occurs in the early stage of the test—that is, within 1–12 h of the beginning of the test—so the conductivity retention rate during this period is significantly reduced; after a certain period of soaking, the proppant fracture rate reaches its peak. Therefore, less proppant will be broken within 12–48 h, and the conductivity damage during this period gradually stabilizes. In addition, it can be seen from Figure 4a that, when the fracturing fluid retention time exceeds 12 h, the curve slows down. Therefore, the three levels of fracturing fluid retention time in the Box–Benhnken design of this study are 10, 12, and 14 h.

3.2. Response Surface Test Result and Discussion

3.2.1. Experimental Results and Analysis of Conductivity Damage Response Surface

The single-factor conductivity damage test shows that the sand concentration, fracturing fluid viscosity, and fracturing fluid retention time have different effects on fracture conductivity. Based on the above test results, the conductivity retention rate (Y) was used as the evaluation index to design a three-factor three-level response surface test. The levels of sand concentration (A), fracturing fluid viscosity (B), and fracturing fluid retention time (C) are shown in Table 2.
Table 3 shows the results of the response surface test. The greater the conductivity retention rate, the greater the conductivity that is finally measured in this group of tests, which guides the actual fracturing design. Using the Design-Expert software, the response surface analysis was carried out with the conductivity retention rate as the response value, and the regression equation was obtained as follows:
Y = 41.83 + 7.09 A 10.96 B 2 C +   0.2316 A B + 0.0238 A C + 0.2610 B C +   0.5755 A 2 + 1.34 B 2 0.6028 C 2
where Y is the conductivity retention rate, A is the sand concentration, B is the fracturing fluid viscosity, and C is the fracturing fluid retention time.
Table 4 shows the results of the analysis of variance of the response surface test. The F value is the significance of the effect of different factors on the conductivity retention rate. It can be seen from the table that the significance order of the three factors on the conductivity retention rate is as follows: fracturing fluid viscosity > sand concentration > fluid retention time. The p-values of A and B are lower than 0.0001, indicating that the viscosity of the fracturing fluid and the concentration of sand laying have a very significant effect on the retention rate of conductivity. The p-value of C is 0.0018, which shows that the fracturing fluid residence time is only significant.
In addition, the F value of the regression model is 87.41, indicating that the equation is extremely significant (p < 0.0001) and the lack-of-fit term is not significant (p = 0.4585), while the coefficient of determination R2 = 0.9471. This shows that the model has a good fitting degree; thus, the model can be used to predict the damage of the proppant conductivity.

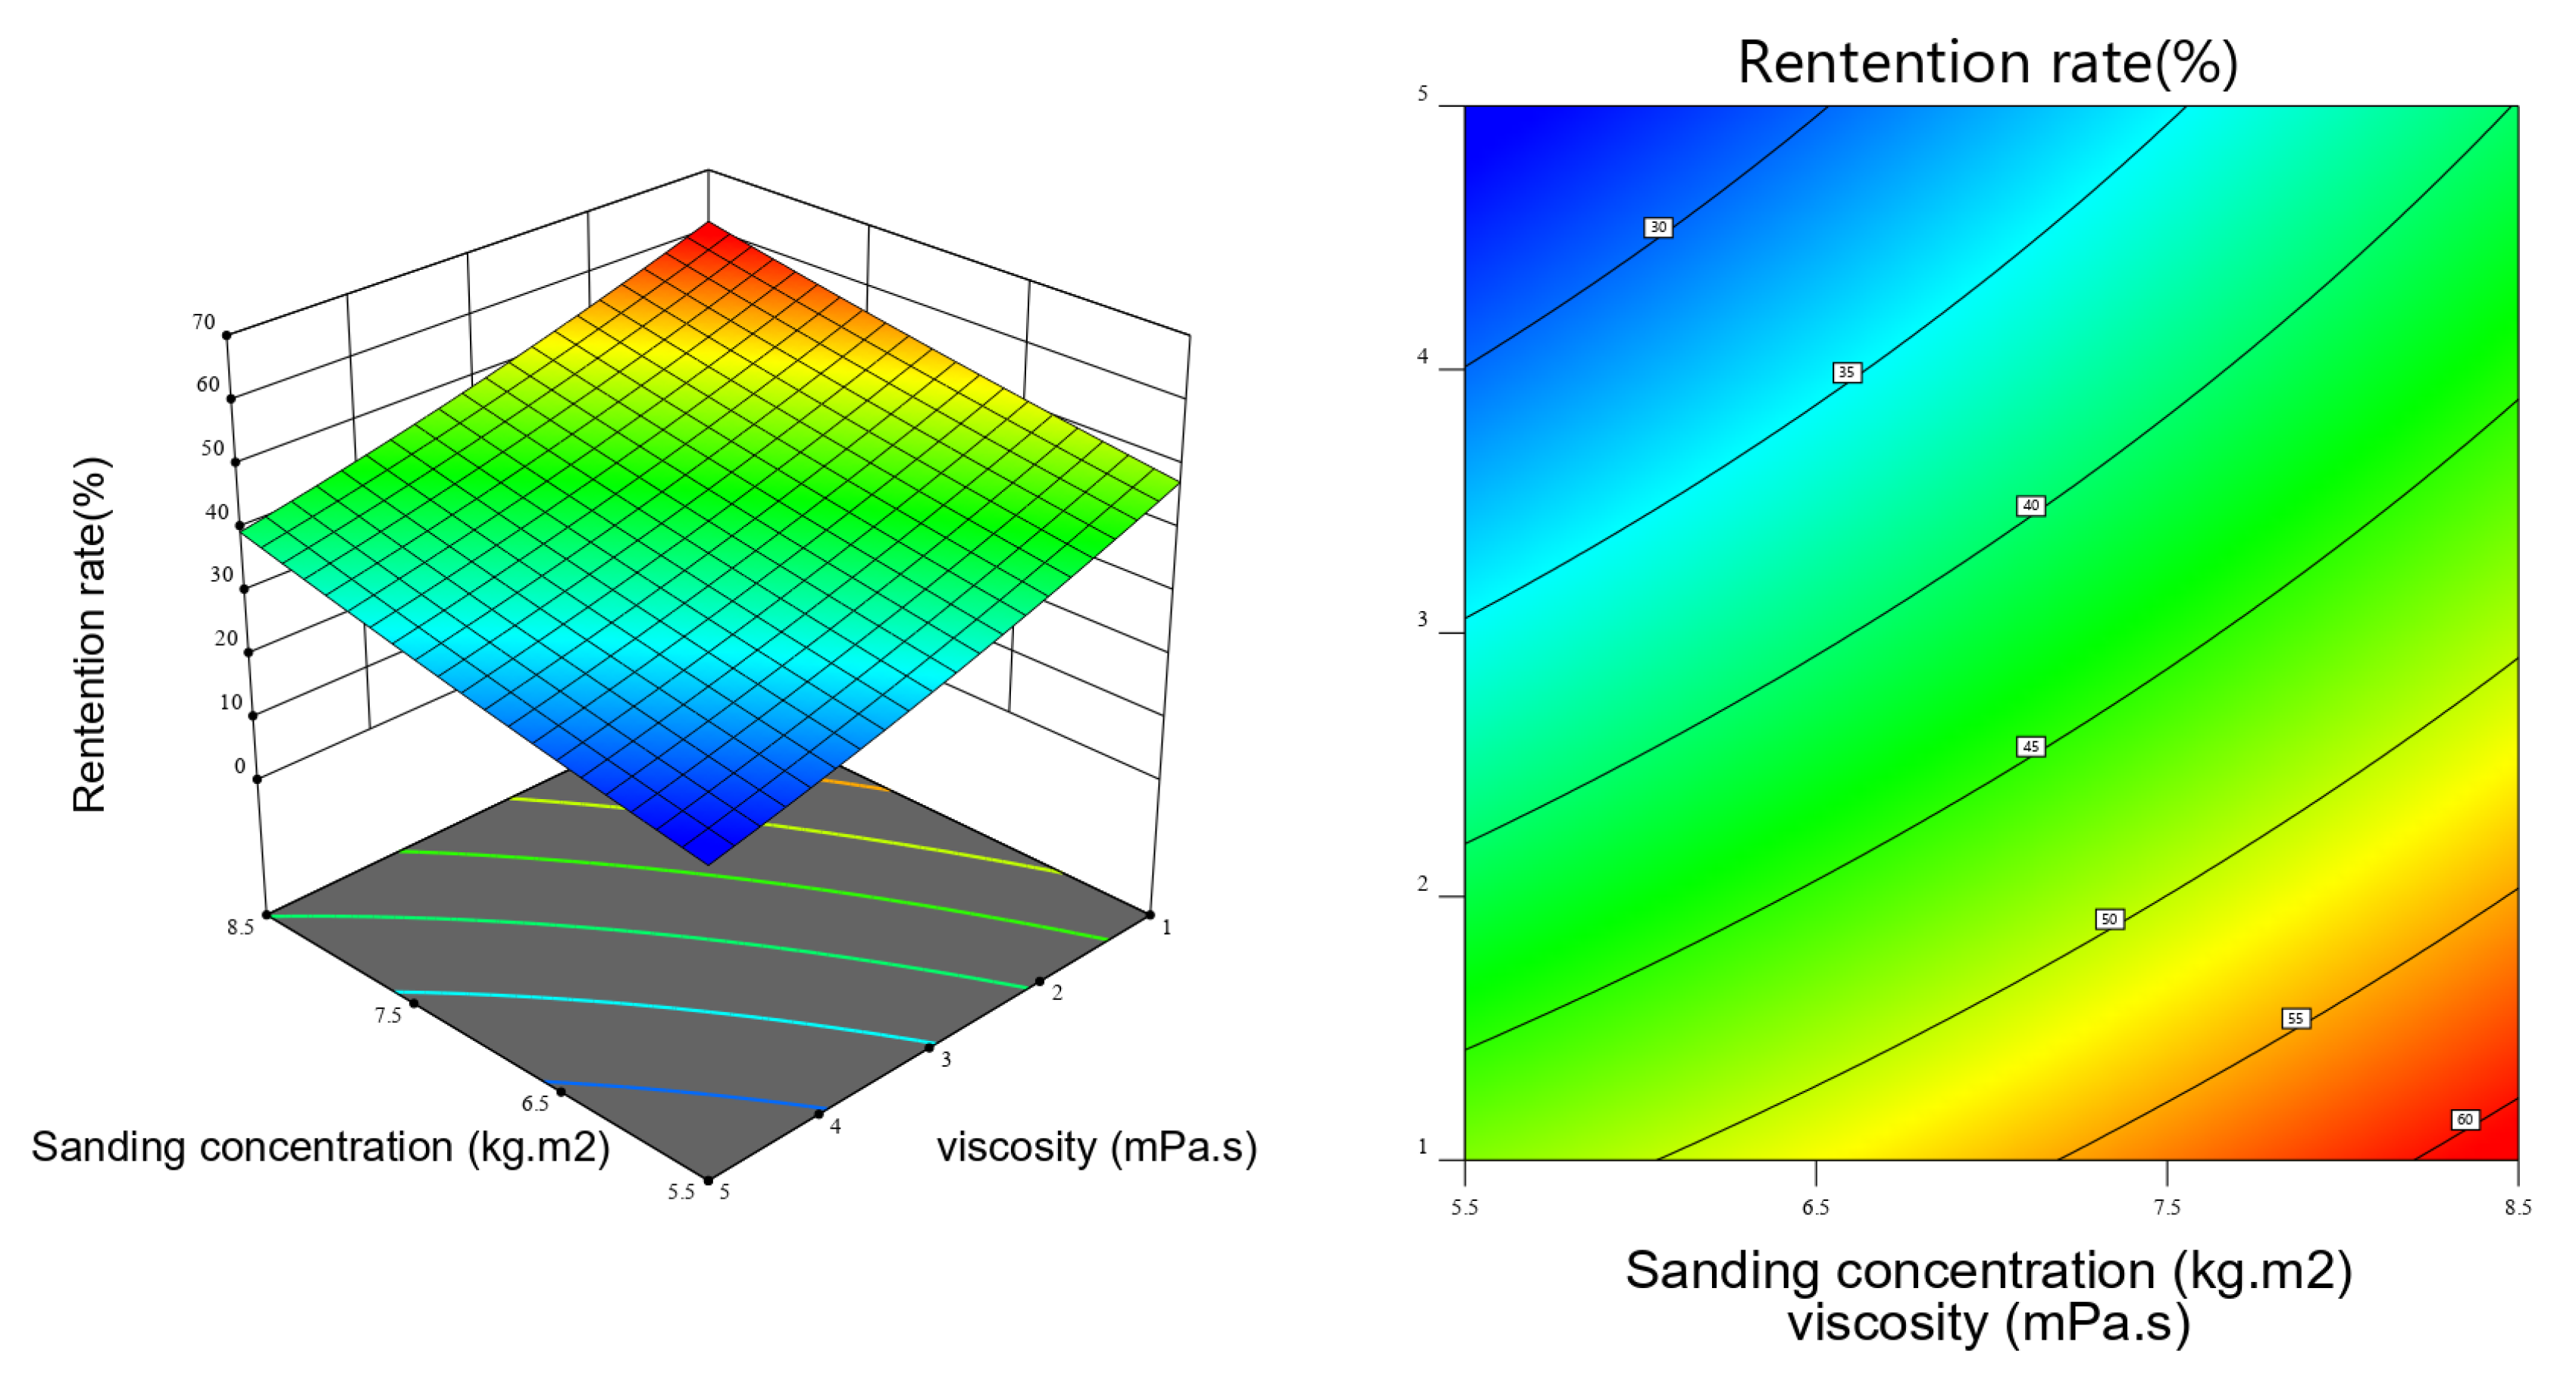
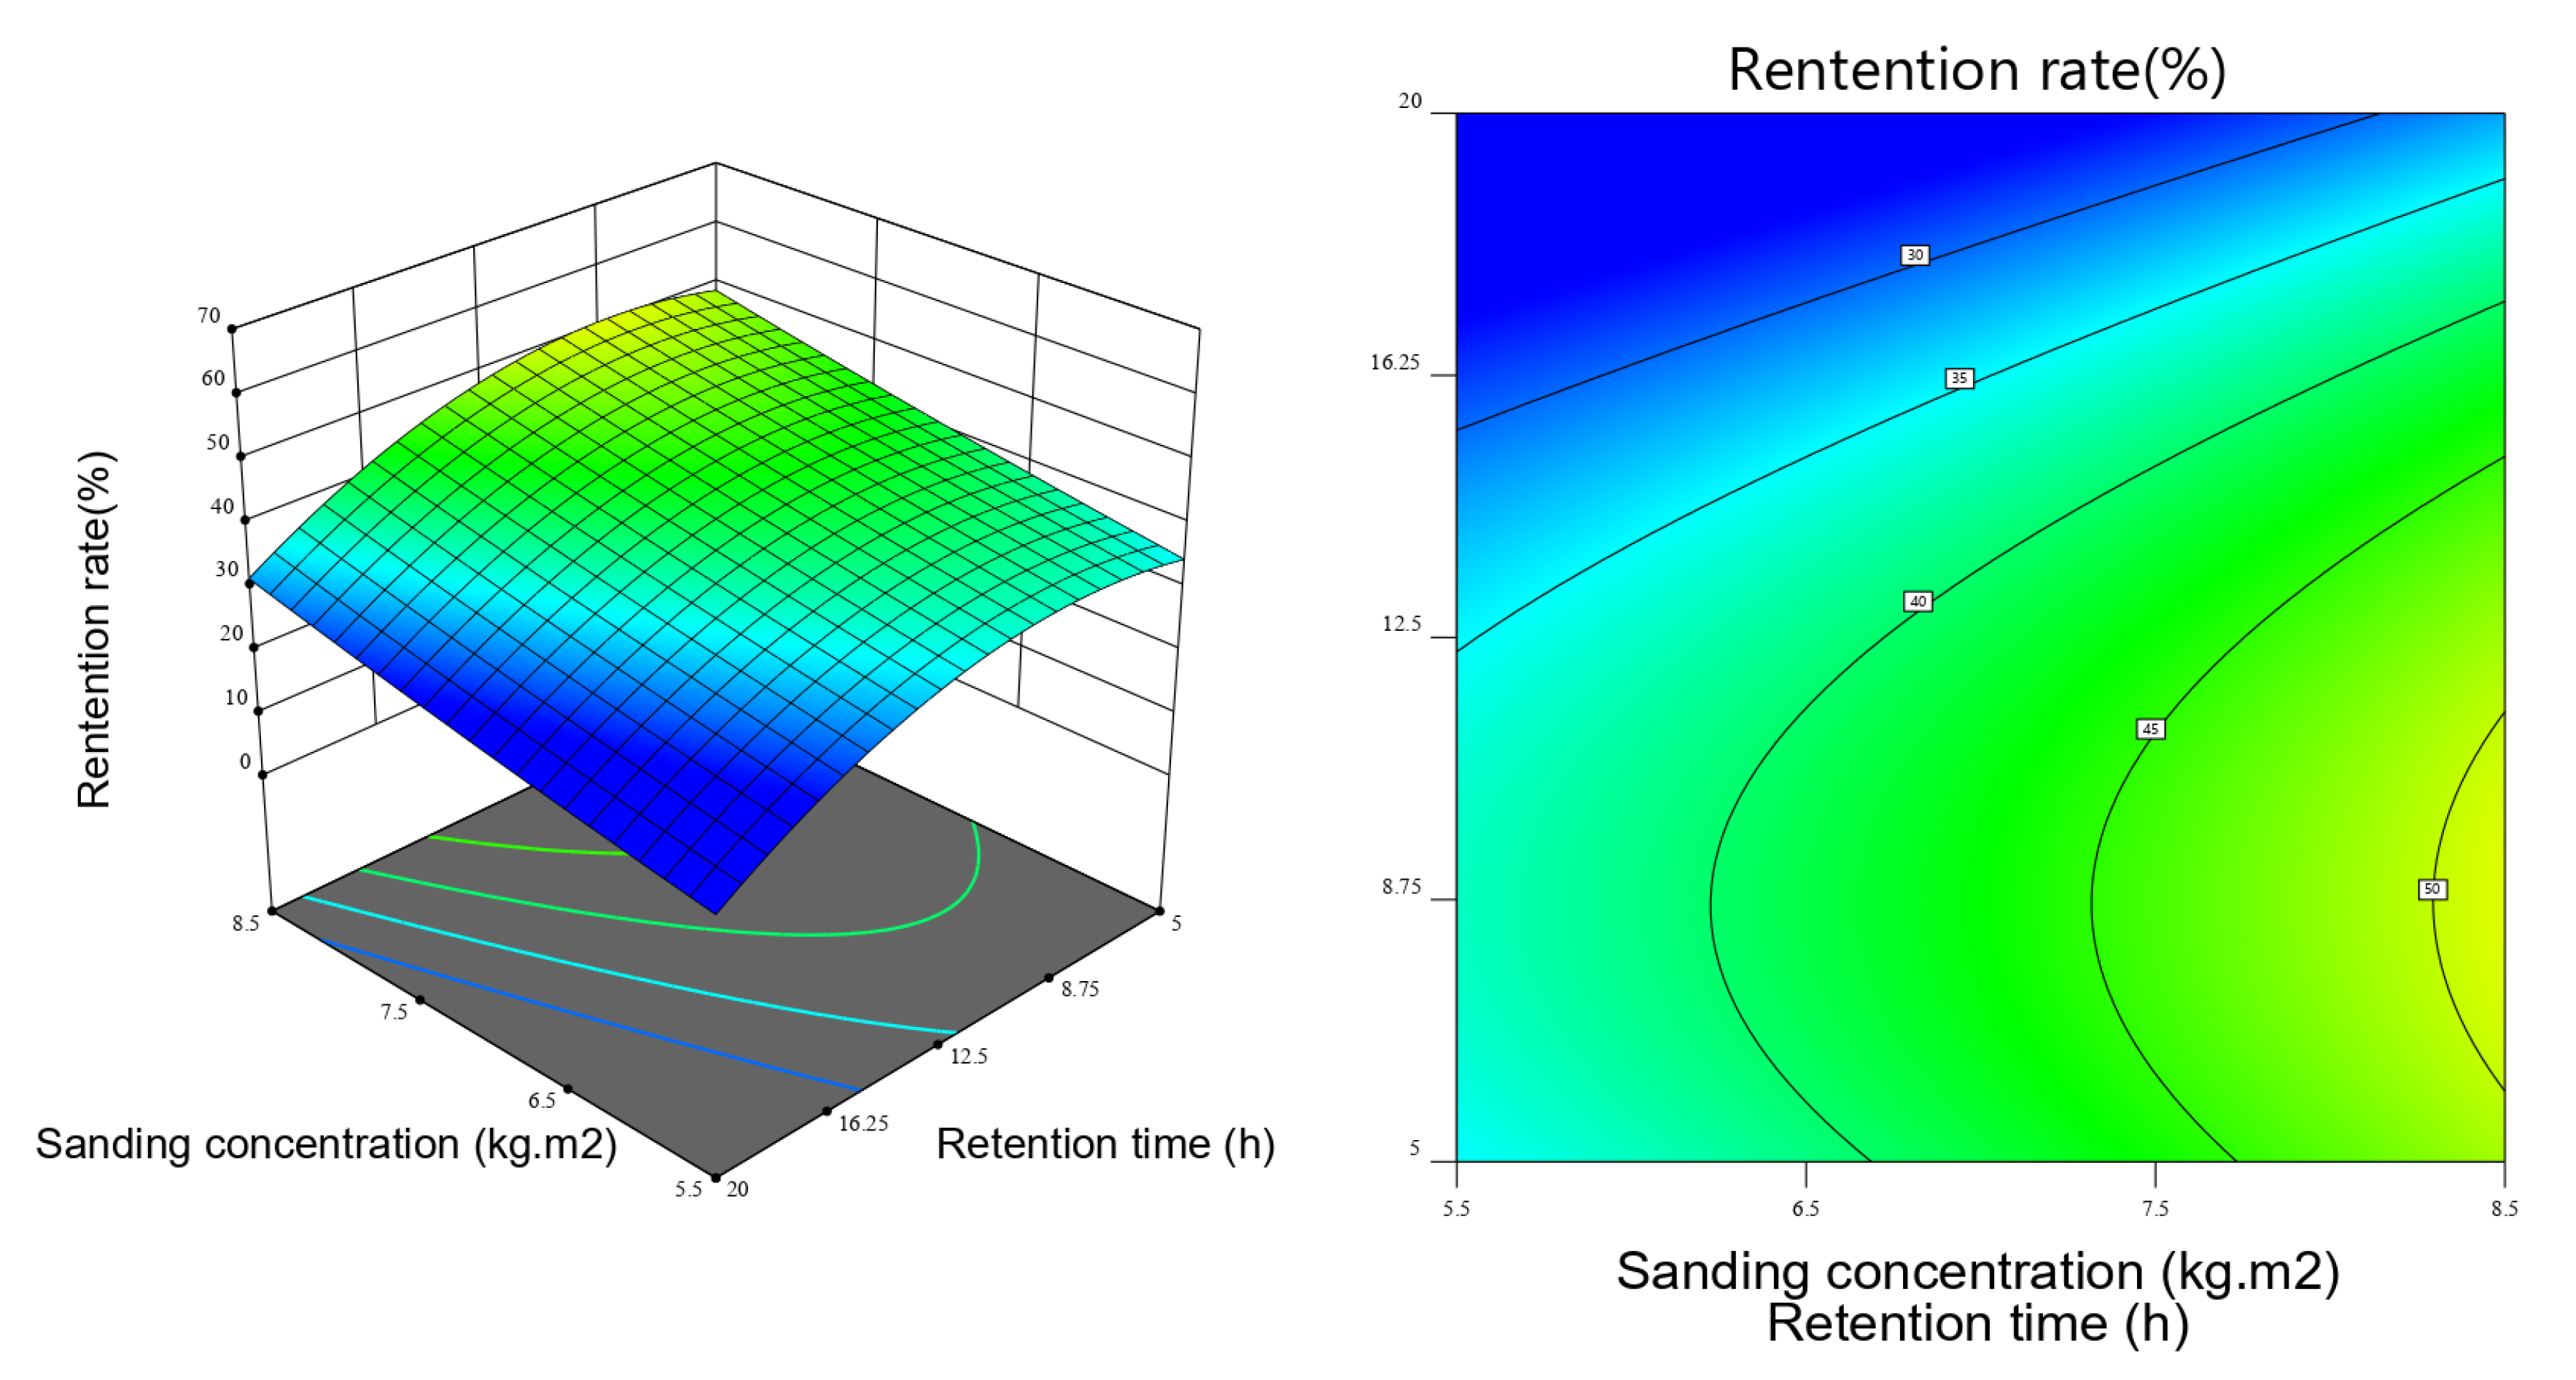
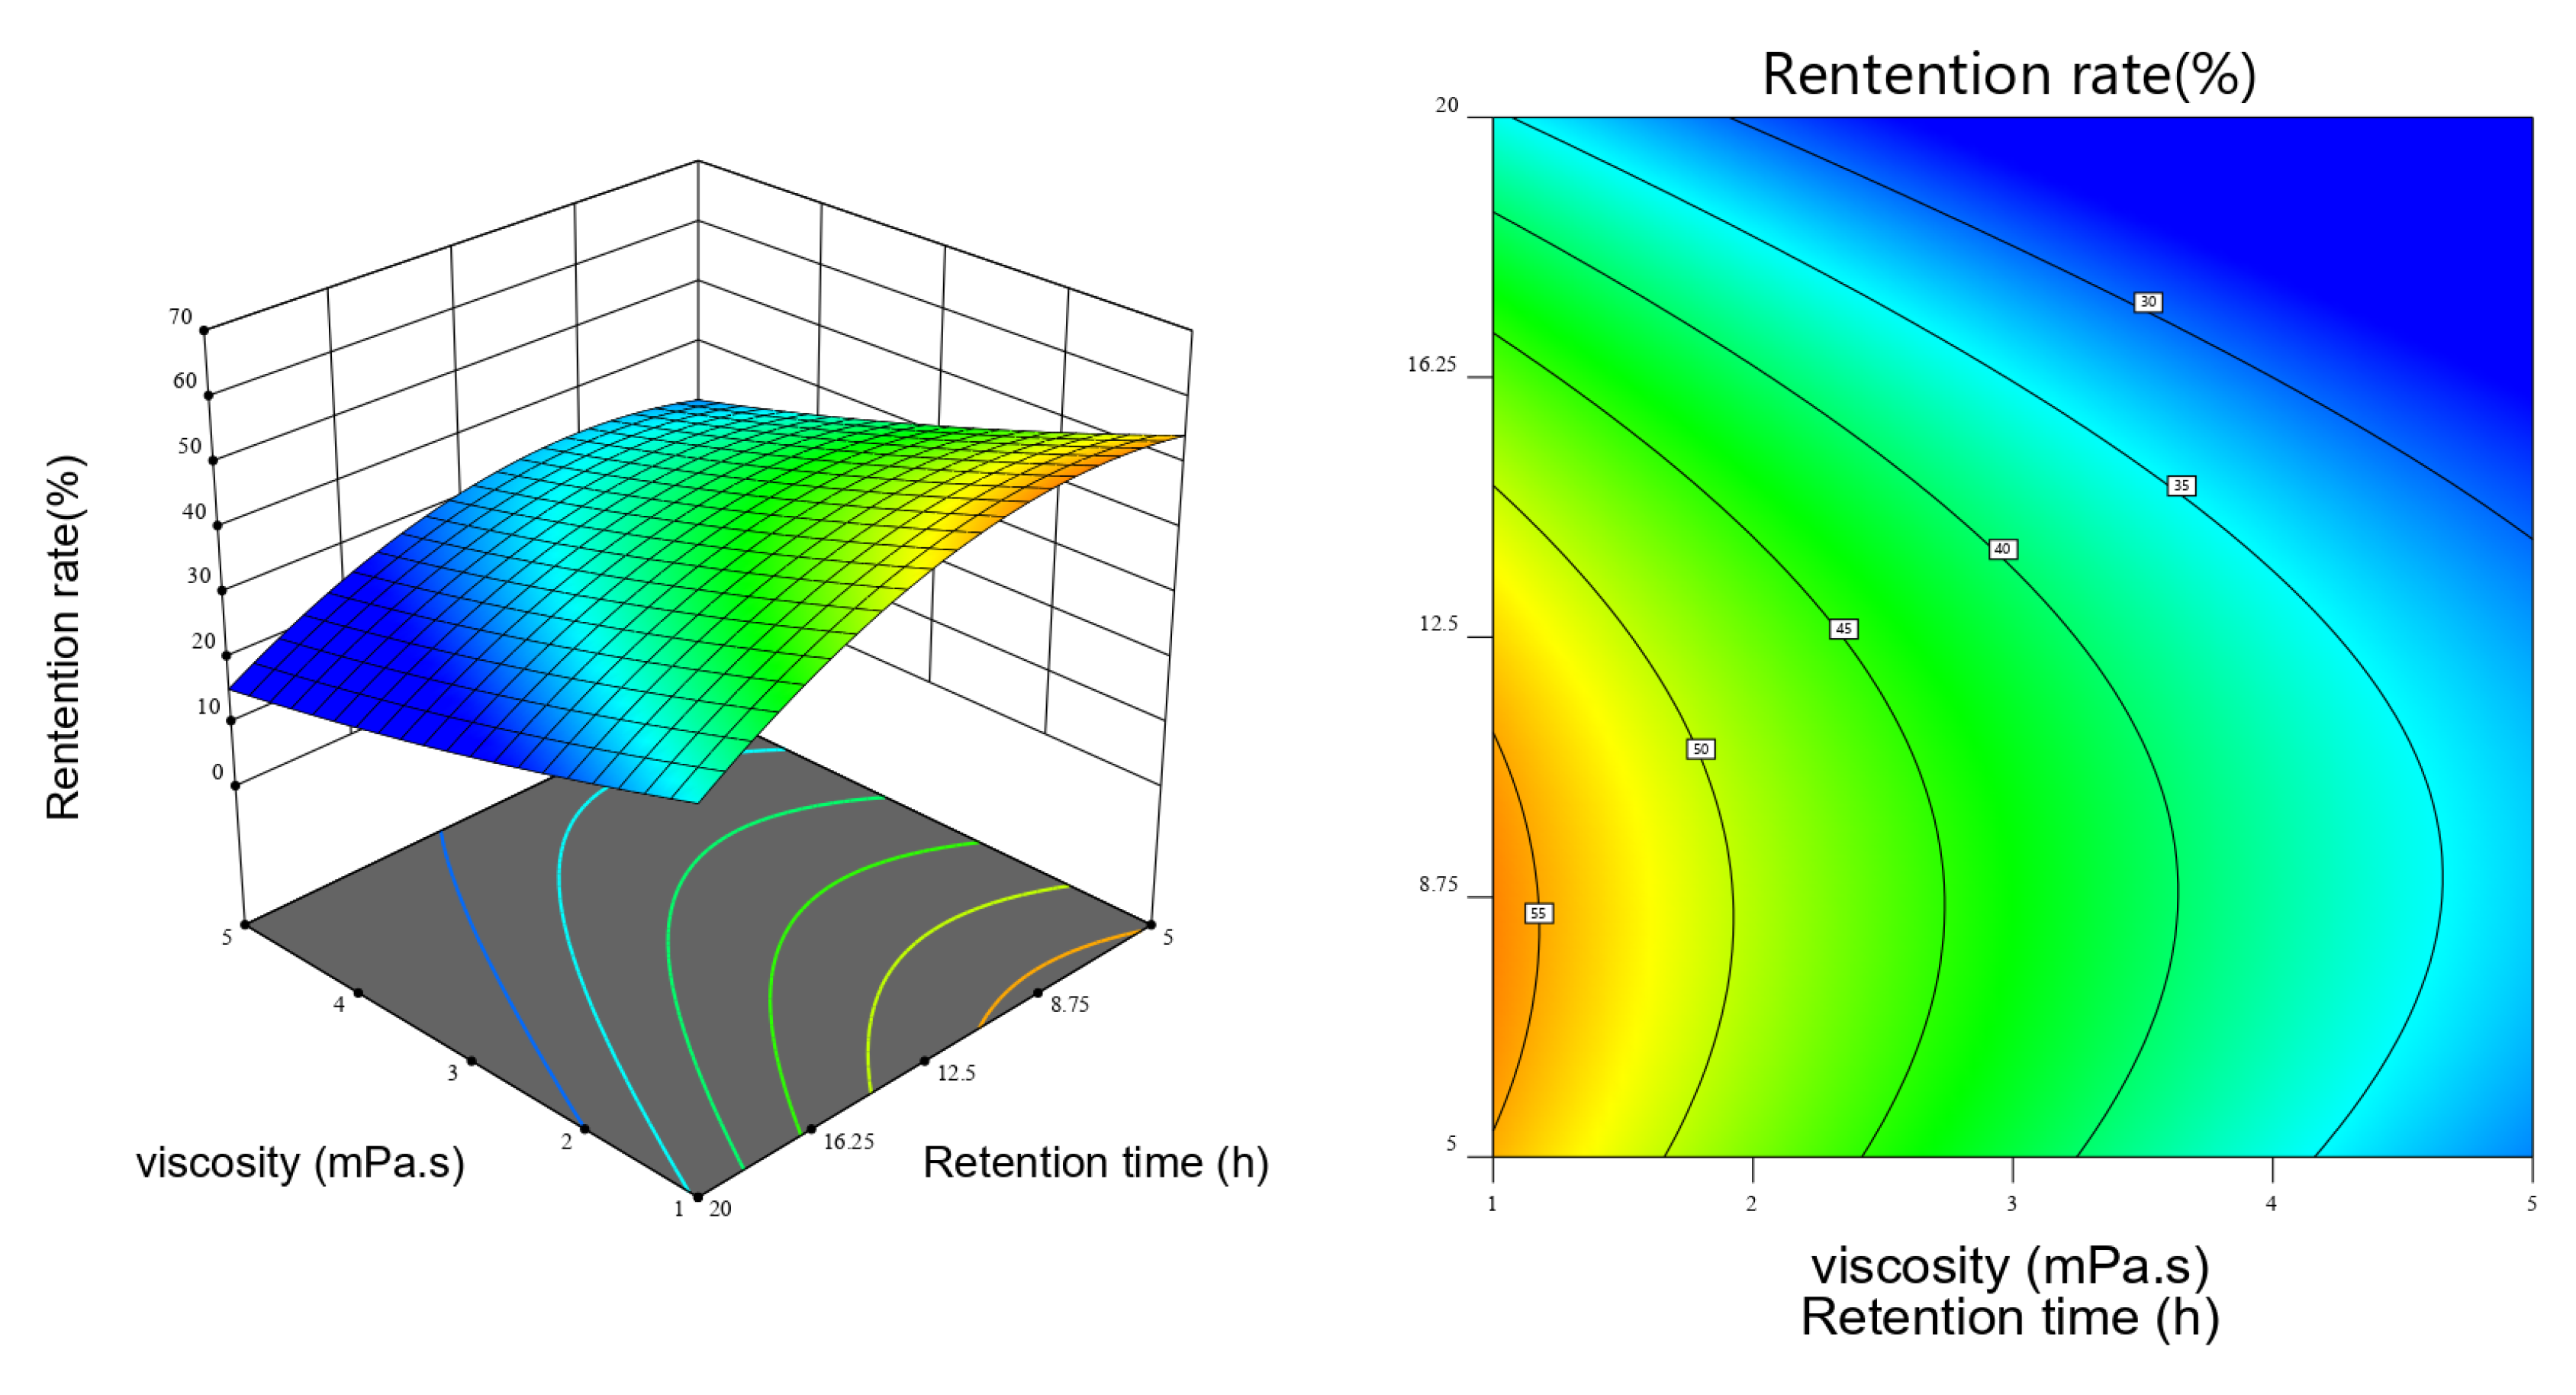
3.2.2. Contour and Response Surface Plots

The effect of the interactions among the sand laying concentration (A), fracturing fluid viscosity (B), and fracturing fluid residence time (C) on the conductivity retention rate was further studied. We set the value range of the commonly used parameters, and obtained the response surface graph and contour graph of the equation simulation.
Figure 6 shows the effect of sand concentration (A) and fracturing fluid viscosity (B) on conductivity retention. When the fracturing fluid viscosity is at any level, the proppant conductivity retention rate increases with the increase in sand concentration. In addition, taking a sand-laying concentration of 8.5 kg.m2 as an example in the contour map, when the sand-laying concentration is at a higher level, the contour lines become denser as the viscosity of the fracturing fluid decreases. This means that the rate of increase in the conductivity retention rate is faster at this time. This may be due to the fact that, when the viscosity of the fracturing fluid is low and the sand concentration is high, relatively less fracturing fluid residue remains in the proppant pack, which increases the conductivity retention rate. Additionally, the higher the sand concentration, the faster the conductivity retention rate increases.
From the overall view of the curved surface, the increase in the conductivity retention rate along the B-axis is 22.32%, which is higher than the corresponding 14.67% of the A-axis. This shows that the effect of fracturing fluid viscosity on the conductivity retention rate is greater than that of the sand concentration. In general, the contour plot of the sand concentration and fracturing fluid viscosity shows an elliptical trend, which indicates that there is an interaction between the sand-laying concentration and fracturing fluid viscosity, but this is not obvious.
Figure 7 shows the effect of sand concentration (A) and fracturing fluid retention time (C) on conductivity retention. When the fracturing fluid retention time is at any level, the conductivity retention rate will gradually increase with the increase in sand concentration. The difference is that, when the fracturing fluid retention time is less than 12.3 h, the conductivity retention rate increases more greatly. This is because, when the fracturing fluid retention time is short, the fracture rate of the proppant is low, meaning that the damage to the conductivity is low.
It can also be seen from the contour map that the contour lines are denser when the fracturing fluid retention time and sand concentration are at higher levels, indicating that the conductivity retention rate increases faster at this time. This also means that, when the shut-in time is longer, a higher sand concentration can lead to a higher conductivity retention rate being retained, and the higher the sand concentration, the faster the conductivity retention rate increases.
In addition, from the overall view of the curved surface, the conductivity retention rate increases by 17.54% along the A-axis, which is greater than the value of 14.27% corresponding to the C-axis. This shows that the effect of the sand concentration on the conductivity retention rate is greater than the effect of the fracturing fluid retention time on the conductivity retention time. Despite the oval shape of the contour plot, this trend is less pronounced when the fracturing fluid has a long residence time. This shows that the two factors have a certain interaction at this time, which may be related to the type of proppant and the type of fracturing fluid used.
Figure 8 shows the effects of fracturing fluid viscosity (B) and fracturing fluid retention time (C) on conductivity retention. The contour map shows that, under a certain sand concentration, with the increase in fracturing fluid retention time, the proppant conductivity retention rate gradually decreases. This is caused by the adsorption of the fracturing fluid residue on the proppant packing layer. When the fracturing fluid retention time is short, less fracturing fluid residue remains in the proppant packing layer, meaning that the conductivity retention rate is higher.
From the overall view of the curved surface, the conductivity retention rate increases by 19.77% along the B-axis, which is greater than the 15.25% corresponding to the C-axis. This shows that the influence of fracturing fluid viscosity on the conductivity retention rate is greater than that of the fracturing fluid retention time. The contour line is a relatively regular ellipse, indicating that the interaction between the two is not strong.

3.3. Fracturing Parameter Optimization Analysis

The obtained response surface model was used to find the optimal parameter combination, and then the fracturing construction parameters were optimized from the perspective of conductivity damage. The optimization results show that there are 73 groups of solutions, of which the optimal solution is the fracturing fluid viscosity of 1 mPa.s, the sand concentration of 8.49 kg/m2, and the fracturing fluid retention time of 10 h. At this time, the corresponding conductivity retention rate is the largest, at 63.19%.
These optimal conditions were verified by three sets of parallel experiments, and the retention rates of the conductivity were 59.21%, 60.45%, and 57.93%. This shows that the model has a high precision and can be used for the optimal design of fracturing parameters.

4. Conclusions

(1) Based on the single factor test, the influence mechanism of different factors on the conductivity damage was discussed. The results show that the lower the sand concentration, the higher the fracturing fluid viscosity; additionally, the longer the fracturing fluid retention time, the greater the conductivity damage.
(2) After fracturing fluid soaking, the proppant is more likely to be broken, and this likelihood increases with the soaking time, which also means that early well opening and flowback are helpful for obtaining a higher conductivity.
(3) The ternary quadratic regression equation for predicting conductivity damage was obtained by fitting the test results of the response surface. The regression model shows extremely significant characteristics, the lack of fit is not significant, and the coefficient of determination R2 = 0.9471, indicating that the model fits well to a good degree.
(4) The contour map of the response surface shows that the factors influencing the conductivity retention rate are in the order of fracturing fluid viscosity > sand concentration > fracturing fluid retention time. In addition, there is a certain interaction between the sand concentration and fluid viscosity, and between the fluid viscosity and fluid retention time, but these interactions are not significant; when the fracturing fluid retention time is at a higher level, there is an interaction between the sand concentration and the fracturing fluid retention time.
(5) The fracturing construction parameters were optimized from the perspective of proppant conductivity damage. The optimal solution is when the fracturing fluid viscosity is 1 mPa.s, the sand-laying concentration is 8.49 kg/m2, and the fracturing fluid retention time is 10 h. At this time, the corresponding maximum conductivity retention rate is 63.19%.

Author Contributions

Conceptualization, Y.P. (Yuan Pan) and Z.Y.; methodology, Y.P. (Yuan Pan); software, Y.P. (Yuan Pan); validation, Z.Y. and Y.P. (Yuting Pan); formal analysis, Y.P. (Yuan Pan); investigation, Y.X.; resources, Y.X.; data curation, Z.Y.; writing—original draft preparation, Y.P. (Yuan Pan); writing—review and editing, R.L.; visualization, Y.P. (Yuan Pan); supervision, R.L.; project administration, R.L.; funding acquisition, R.L. All authors have read and agreed to the published version of the manuscript.

Funding

This research was funded by [National Natural Science Foundation of China] grant number [61572084].

Institutional Review Board Statement

Not applicable.

Informed Consent Statement

Not applicable.

Data Availability Statement

Not applicable.

Conflicts of Interest

The authors declare no conflict of interest.

References

  1. Ryosuke, K.; Nozomu, Y.; Kei, F. Productivity Improvement by Reperforation of Multistage-Fractured Wells in High-Pressure/High-Temperature Tight Gas Reservoirs: A Case History. SPE Prod. Oper. 2021, 36, 97–115. [Google Scholar]
  2. Kelvin, A.; John, W.; Derek, E. Laboratory Investigation of Impact of Slickwater Composition on Multiphase Permeability Evolution in Tight Sandstones. In Proceedings of the SPE Low Perm Symposium, Denver, CO, USA, 5–6 May 2016. [Google Scholar]
  3. Abhinav, M.; Chandra, S.; Carl, H. A Study of Propped-Fracture Conductivity: Impairment Mechanisms Under Laboratory Conditions. In Proceedings of the SPWLA 58th Annual Logging Symposium, Oklahoma City, OK, USA, 17–21 June 2017. [Google Scholar]
  4. Antonia, S.; Victor, T.; Ulrich, B. Assessment of Polymer-Induced Clogging Using Microfluidics. SPE J. 2021, 26, 3793–3804. [Google Scholar]
  5. Jesse, G.; Zhu, D.; Hill, A.D. Impairment of Fracture Conductivity in the Eagle Ford Shale Formation. SPE Prod. Oper. 2018, 33, 637–653. [Google Scholar]
  6. Jansen, T.; Zhu, A.D. The Effect of Rock Mechanical Properties on Fracture Conductivity for Shale Formations. In Proceedings of the SPE Hydraulic Fracturing Technology Conference, The Woodlands, TX, USA, 3–5 February 2015. [Google Scholar]
  7. Aadtiya, K.; Ruud, W. Distinguishing Fracture Conductivity and Fracture Flux: A Systematic Investigation of Individual Fracture Contribution to Well Productivity. In Proceedings of the SPE/AAPG/SEG Unconventional Resources Technology Conference, Virtual, 20–22 July 2020. [Google Scholar]
  8. Zhang, J.J.; Ouyang, L.; Hill, A.D. Experimental and Numerical Studies of Reduced Fracture Conductivity due to Proppant Embedment in Shale Reservoirs. In Proceedings of the SPE Annual Technical Conference and Exhibition, Amsterdam, The Netherlands, 27–29 October 2014. [Google Scholar]
  9. Yeten, B.; Castellini, A.; Guyaguler, B. A Comparison Study on Experimental Design and Response Surface Methodologies. In Proceedings of the SPE Reservoir Simulation Symposium, The Woodlands, TX, USA, 31 January–2 February 2005. [Google Scholar]
  10. Myers, R.; Montgomery, D.; Anderson-Cook, C. Response Surface Methodology: Process and Product Optimization Using Designed Experiments. Technometrics 1996, 38, 285. [Google Scholar]
  11. Shusei, T.; Tsubasa, O.; Dongjae, K. Application of Combined Streamline Based Reduced-Physics Surrogate and Response Surface Method for Field Development Optimizaion. In Proceedings of the International Petroleum Technology Conference, Dhahran, Saudi Arabia, 13 January 2020. [Google Scholar]
  12. Xiaodong, K.; Baozhen, L.; Jian, Z. Optimization of the SAGP Process in L Oil-Sand Field with Response Surface Methodology. In Proceedings of the Abu Dhabi International Petroleum Exhibition & Conference, Abu Dhabi, United Arab Emirates, 11–14 November2019. [Google Scholar]
  13. Yuan, X.; Xu, D.J.; Chen, S.H. The damage of fracturing fluid intrusion to the conductivity of shale reservoir. Sci. Technol. Eng. 2020, 20, 3591–3597. [Google Scholar]
  14. Liang, T.; Cai, B.; Meng, C. The effect of proppant performance of hydraulic fracturing on conductivity. Fault-Block Oil Gas Field 2021, 28, 403–407. [Google Scholar]
  15. Sarvesh, N.; Amit, S. Impact of Fracture Conductivity on Production: How Much Proppant do We Really Need in Unconventional Reservoirs? In Proceedings of the SPE/AAPG/SEG Unconventional Resources Technology Conference, Houston, TX, USA, 16–18 November 2021. [Google Scholar]
  16. Zou, Y.; Shi, S.; Zhang, S. Experimental modeling of sanding fracturing and conductivity of propped fractures in conglomerate: A case study of tight conglomerate of Mahu sag in Junggar Basin, NW China. Pet. Explor. Dev. 2021, 48, 1202–1209. [Google Scholar] [CrossRef]
  17. Abhishek, G.; Chandra, R.; Carl, S. Experimental Investigation of Propped Fracture Conductivity and Proppant Diagenesis. In Proceedings of the SPE/AAPG/SEG Unconventional Resources Technology Conference, Denver, CO, USA, 22–24 July 2019. [Google Scholar]
  18. Liu, X. Influencing factors of hydraulic propped fracture conductivity in shale reservoir. Fault-Block Oil Gas Field 2020, 27, 394–398. [Google Scholar]
  19. Ahmed, E.; Hisham, A. Propped Fracture Conductivity in Shale Reservoirs: A Review of Its Importance and Roles in Fracturing Fluid Engineering. In Proceedings of the SPE Kingdom of Saudi Arabia Annual Technical Symposium and Exhibition, Dammam, Saudi Arabia, 23–26 April 2018. [Google Scholar]
  20. Ming, F.; Yan, H.; James, M. Hydraulic Fracture Conductivity as a Function of Proppant Concentration Under Various Effective Stresses: From Partial Monolayer to Multilayer Proppants. In Proceedings of the SPE/AAPG/SEG Unconventional Resources Technology Conference, Austin, TX, USA, 24–26 July 2017. [Google Scholar]
Figure 1. Flow conductivity damage test procedure.
Energies 15 02818 g001
Figure 2. Influence of sand concentration on conductivity.
Energies 15 02818 g002
Figure 3. Influence of fracturing fluid viscosity on conductivity.
Energies 15 02818 g003
Figure 4. Influence of fluid retention time on conductivity.
Energies 15 02818 g004
Figure 5. Proppant crushing test results.
Energies 15 02818 g005
Figure 6. Response surface and contour plots (sand concentration vs. viscosity).
Energies 15 02818 g006
Figure 7. Response surface and contour plots (sand concentration vs. retention time).
Energies 15 02818 g007
Figure 8. Response surface and contour plots (viscosity vs. retention time).
Energies 15 02818 g008
Table 1. Design of the single factor test for the proppant conductivity damage.
NumberSand Concentration
(kg/m2)
Fracturing Fluid Viscosity
(mPa.s)
Fracturing Fluid Retention Time
(h)
1–52.5, 4, 5.5, 7, 8.5112
6–105.51, 3, 5, 7, 912
10–155.511, 12, 24, 36, 48
Table 2. Conductivity damage response surface factor level table.
LevelSand Concentration (kg/m2)Fluid Viscosity
(mPa.s)
Fluid Retention Time
(h)
−15.5110
07312
18.5514
Table 3. Results of the response surface test.
NumberSand Concentration
(kg/m2)
Fluid
Viscosity
(mPa.s)
Fluid Retention Time (h)Conductivity Retention Rate (%)
1731243.03
2731239.96
35.511247.61
4731242.38
58.531447.43
6711056.53
7751032.89
8711451.71
98.511260.59
108.531051.08
115.551226.43
12731241.85
135.531432.46
14731241.88
158.551240.34
16751429.11
175.531036.21
Table 4. The results of the analysis of variance test.
FactorSum of SquaresDfMean SquareF-Valuep-Value
Model1405.989156.22116.31<0.0001
A402.261402.26299.50<0.0001
B960.891960.89715.43<0.0001
C31.94131.9423.780.0018
AB0.214610.21460.15980.7013
AC0.002310.00230.00170.9684
BC0.272510.27250.20290.6660
A21.3911.391.040.3422
B27.5917.595.650.0490
C21.5311.531.140.3213
Residual9.4071.34
Lack of Fit4.1731.391.060.4585
Publisher’s Note: MDPI stays neutral with regard to jurisdictional claims in published maps and institutional affiliations.

