Abstract
Transport is one of the most important sources of environmental pollution. More and more information has shown that one of the greatest sources of emissions from transport are emissions related to the release of microplastics from tyres. This is one of the most underestimated sources of emissions into the environment. In this study, environmental samples are analysed for the presence of these particles. For this purpose, optical methods and spectroscopic methods are used. Fourier transform infrared (FTIR) spectroscopy is used to identify synthetic rubber, most likely derived from car tyres. A complementary confocal microscopy method is used to confirm the FTIR results. The soil samples and road dust from the areas with heavy traffic are tested. An average of 372 ± 50 fragments per kilogram dry weight are detected in the soil samples. In the case of samples from the road, this number is 515 ± 20 fragments per kilogram of dry matter. In the samples, most of the microplastics come from tyres, which confirms the scientists’ assumptions about the amount of emissions in the environment. More than 90% of the black fragments later identified as tyre-derived synthetic rubber are found in the samples. A greater number of microplastics are found in road dust samples than in the soil. This may be due to the direct influence of braking, which causes greater accumulation of samples at the emission source than at a short distance into the soil. There is also a noticeable difference in the size of the fraction. In the case of soils, a fraction below 50 µm accounts for the majority of cases. When one analyses road dust samples, one may observe that most of the fractions are between 50 and 200 µm. This may be due to the possibility of smaller emission particles over longer distances and the greater degradation process that occurs in soils. The microplastics from the road dust are less degraded than the microplastics from the soil.
1. Introduction
Contamination from transport has a significant impact on the environment and the health of living organisms [1,2]. This applies to both gaseous and dust pollutants, including microplastics. Particularly dangerous are suspended dusts (PM), which have the greatest potential to interfere with human health [3]. The contribution of road transport to the weight of PM is 14–25% [1,4]. The spread of PM in different areas has a significant impact, both direct and indirect, on the state of the climate [5]. Vehicles are considered to be the main source of transport-related contamination [6]. The contribution of road traffic to the emission of the carbonaceous fraction in the atmospheric aerosol at the communication and urban background stations in Kraków was reported at the level of 57% and 47%, respectively [7]. The testing and determination of such emissions is therefore a priority due to their toxicity. There are a number of options for testing these pollutants, ranging from laboratory methods to environmental measurements [8]. Significant differences between laboratory results and actual results have led to the introduction of RDE (real-driving emissions) [8]. EU directives require the testing of solid particles with a lower limit > 23 nm [9]. Measurements of the particles of some engine technologies have shown a large number of particles less than >23 nm. For this reason, it is assumed that the new directives introduced will change the range to >10 nm. An analysis of emissions from spark ignition direct injection (SIDI) vehicles showed the visibility of primary particles with a size of 10 nm [8,10]. For tests conducted in real operating conditions, portable emission measurement systems (PEMS) are used [11]. Due to the limited possibilities to reduce these emissions, it is necessary to use multi-component off-engine exhaust after treatment systems during the engine operating process. An important issue in enabling the reduction of volatile particles is associated with filters, usually GPF and DPF [12].
Emissions from braking systems and tyres are often overlooked, which contribute significantly to the overall emissions of a vehicle [13]. In order to minimise this risk, processes have been initiated to incorporate this emission without exhaust gas into the existing regulations, limiting overall emissions from vehicles. It is believed that through the wear of the brakes while driving in vehicles, nanoparticles are formed; these are the most dangerous in terms of their permeation potential. Recent studies have shown that non-exhaust emissions are comparable to those of diesel engines and that the relative share of brake emissions, in total for the vehicle, increases emissions due to improvements in exhaust emission abatement technologies [5,14]. The emission of microplastics from brake blocks varies depending on their structure. According to the research that was carried out, low-steel (LS) brake blocks emit much higher emissions than non-steel or semi-metallic blocks [15,16]. Braking is a key element in the release of microplastics from brake blocks. The properties of the abrasive layer formed on the surface of the brakes play an important role. The tribological response of brake materials is intimately related to the characteristics of the friction layer that develop on wear surfaces during braking [15].
Tyre wear is considered to be one of the hidden main sources of micro- and nanoplastics, which are often under-detected [17]. In the case of tyres, in addition to the composition and braking process, an important role is played by the climate, tyre structure, road surface, speed, vehicle weight and driving style [18]. It is assumed that electric vehicles, due to their increased mass, emit more microplastic particles from the tyres. In the environment, tyres are a source of chemicals and metals [19]. The tyres are made of natural rubber, synthetic rubber, metals, carbon black and other compounds [20]. Due to the presence of toxic metals in tyre dust, they were tested for this material [21]. The zinc content was dominant in the samples. The metal content was ranked in the order of average concentrations of Zn > Cu > Pb > Sn > Sb > Ni > Cr > As > Cd. Depending on their origin, the tested tyres differed in the content of Ni, Zn, Sn and Sb and Cu, Cd and Pb [21]. The concentrations and isotopic compositions of Cu and Pb in tyres showed large differences depending on the product and manufacturer, in contrast to Zn [21]. Tyre and road particles under various conditions were also investigated. The samples collected with the use of the suction system while driving were compared with the particles collected during the driving simulation in the laboratory and the tread particles from the unused tyre, cryogenically comminuted. In the first two cases, the content of metals and other elements was examined. PAH concentrations in the field tyre and road wear particles were 19 times higher than in the tyre tread particles and 24 times higher than in the tyre and road wear particles produced in the laboratory [22].
The emitted tyre fragments end up in the environment. In aquatic ecosystems, concentrations up to 179 mg L−1 in sediments flowing from rivers and up to 480 mg g−1 in sediments flowing from the motorway were found. There is a general scarcity of information on their levels in the aquatic environment, possibly due to a lack of availability or inadequate detection methods [17]. Scientists report that tyre particles may account for more than 50% of the weight of identified primary sources of microplastics in Norway. Model studies have shown that tyre wear may be responsible for 40% by weight of the total amount of microplastics in the rivers in Europe [23]. Environmental studies have shown the presence of fragments of tyre rubber in both road dust and floating particles [23]. There is a general scarcity of information on their levels in the aquatic environment, possibly due to a lack of availability or inadequate detection methods. The microparticle fraction content of soils in China was mainly composed of the PP fraction, 50.5%; PE, 43.3%; and PES, 6.1%. The abundance of microplastics was 78.00 ± 12.91 and 62.50 ± 12.97 items per kg depending on the depth of the sample taken [24]. The content of microprine fractions in the soils tested in Switzerland, which were exposed to high accumulation, showed the content of 593 particles per kilogram. The fractions mainly contained PE, 88%; PP, <1%; PS, 3%; PVC, 2%; and others, 7.5% [25]. Half of them consist of an elastomer tread containing a polymer with a mineral surface and the other half of binder encrustations [22,23,26]. These components are introduced into the environment in which they will be released. Then, the fragments accumulate in the soil and on the roadway, and with rain they are rinsed directly into surface waters or into the sewage system. Smaller fragments float in the air and spread for miles with the wind [23]. The key parameters which influence the dispersion of microplastic particles from tyres are their shape and density [23]. Identification of single particles includes an elongated or circular shape with a variable amount of mineral encrustation [19]. The specific gravity of rubber given by various sources is similar. According to the US Federal Highway Administration, the specific gravity of tyre rubber is approximately 1.15 [27]. Literature sources report that the specific gravity is between 1.17 and 1.18 [28,29]. It should be noted, however, that when the tyre comes into contact with the road, it changes its chemical and structural composition by evaporating volatile substances, incorporating road building materials and other dusts on it [30]. The fraction that contains particles from the road in its structure has a density of 1.7–2.1 g/cm3. The asphalt fraction has a density of 2.38–2.52 g/cm3. For polymer rubber tyres natural rubber has a density of 1.15 g/cm3, and for butadiene rubber the density is 0.900 g/cm3. Styrene butadiene rubber has a density of 0.910–0.965 g/cm3. About 85% of the particles that are released from the tyres are larger than 50 μm in size and have a density of >1.7 g/cm3. These are fractions that have fragments from the road and road dust embedded on their surface. This information is also important for the separation of microplastics from environmental samples. For particles that end up in the soil, the density may change due to degradation [23]. The shape of the tyre wear particles varies. The emitted particles can be in the form of both fragments and fibres. Scientific studies showed longitudinal fractions that had mineral particles out of the way in their structure [22]. Scientific research shows that the particles can also be irregularly shaped fragments [31]. Fibre emission from roadways can also be caused by adding aramid to the tyre sidewall reinforcements. Variations in the shape and elasticity have the potential to cause different kinds of effects on the organisms consuming the particles [23].
In addition, atmospheric conditions (rainfall, wind) and the environment in which the microplastics will be eventually located play a significant role in the migration of microplastic particles. Rolling resistance machines or other methods were used to characterise the particles from the microplastics [19,32]. However, this method does not take into account the changes in the composition of the microplastics released from the tyres. When identifying the fraction of tyres from environmental samples, a single particle analysis (SPA) is performed. This is necessary due to the individual nature of each faction [19,33,34,35]. Typically, two estimation methods are used to quantify tyre wear. The first involves the application of the emission factor to the vehicle per kilometre [27]. The second method is based on estimating the degree of tyre weight loss [27].
The broad overview compares tyre emissions per capita in different countries (Figure 1). It shows that the estimated emission masses per capita are in the range of 0.2 to 5.5 kg/year [27].
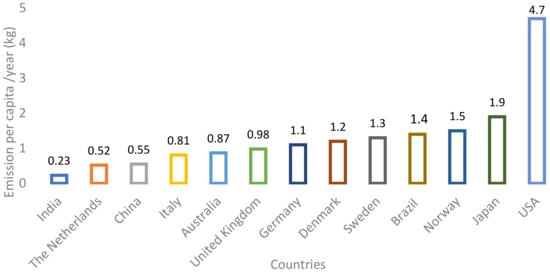
Figure 1.
The amount of wear and tear of car tyres emitted per capita per year [27].
The standardisation of microparticle emissions from tyres has not been defined. During its lifetime of 20–50,000 km, the tyre will release into the environment about 10–30% of the tread tyre, at least 1–2 kg [14].
There are several tyre parameters that can help minimise microplastic emissions. These include tyre pressure, tread pattern, tyre size and wheel alignment [23]. If the tyre pressure is too low, internal heat builds up, leading to faster tread wear [23]. The development of airless tyres has greatly increased the possibilities of reducing rubber particle emissions. Higher loads and speeds lead to an increased release of the plastic fraction, which decreases with increasing tyre pressure, tread diameter and tread width [23]. Tyres tilted in the direction of travel wear faster than correctly positioned tyres. Important parameters, as already mentioned, are driving style, weight and the ability to accelerate vehicles. High speeds, fast acceleration and deceleration and high cornering speeds all lead to increased tyre wear [36]. The public should be made aware of the risk posed by the emitted tyre particles, especially those of the smallest size. Electric cars and SUVs, which have considerable weight, pose an important issue. Cars, which are considered zero emission, emit huge amounts of microparticles from tyres because of their weight [23,35]. In order to reduce the emissions of tyre fragments, access to city centres can also be restricted. As mentioned, traffic jams, intersections and speed changes are among the key parameters that affect emissions. All of this is intensifying in the centre of cities, especially large ones.
To identify microplastics of tyres emitted from transport, optical, spectroscopic and gas chromatography methods are most often used. The microscopic methods that are used include light microscopy and electron microscopy. High-resolution light microscopy (stereoscopic microscopy) can be used to identify thermoplastic particles. Rubber and bitumen particles can be identified by visual inspection, stretching with tweezers or by performing melting tests [37]. For a more accurate analysis, electron microscopes are used. They use electrons instead of lighting. They enable an analysis of much smaller particles, including individual atoms. Scanning electron microscopy (SEM) is most commonly used for polymeric materials [23]. The possibilities of the SEM microscope are considerable. Thanks to it, it is possible to study the surface topography, chemical composition and conductivity of the material [23]. Spectroscopic methods play an important role in identifying the emitted tyre microplastics. For FTIR methods, the removal of biological organic materials is an important consideration. This process is necessary due to the hydrophobic nature of plastics, which accumulate organic fractions on their surface [38]. In the broad spectrum of FTIR analyses, manual separation of individual particles is not required. It is possible to test entire filters, but this is done with appropriate criteria and reference materials [23]. A manual analysis is highly time consuming. This method can identify the presence of rubber particles in the size range of 10–500 µm [23]. On the other hand, in the case of Raman spectroscopic methods, a significant advantage is the ability to analyse particles with a size as low as 1 μm [39]. A significant disadvantage is the weak signal strength and distortion, especially in relation to soot-filled materials. Both before the analysis and using microscopic and spectroscopic methods, the sample preparation process is lengthy. Raman spectroscopy is not considered an effective method of analysing tyre particles [40,41]. We combine an optical microscope with a Raman spectrometer to visualise samples at high magnification and to transfer the Raman analysis on the sample using a microscopic laser beam. With the right structure, the signal is stronger. Currently, it is a promising method [42].
Other methods used to identify tyre microparticles are those related to gas chromatography. One of them is pyrolysis-GC/MS gas. It is a time-consuming method [43]. There are reports of the possibility of conducting tests directly in small-sized environmental samples [44]. The main advantages of pyrolysis-GC/MS gas include the ability to determine both the polymer type and the content of various organic additives [45]. Temperature is an important condition when performing the analysis [23]. Moreover, studies comparing the μ-Fourier transform infrared spectroscopy with weakened total reflectance and GC/MS pyrolysis demonstrated consistent results [46].
The aim of the research is to determine the emission of microplastics released from communication routes, mainly in terms of the content of fragments of synthetic rubber in environmental samples. The abundance of tyre wear particles and their distribution in road dust and soil adjacent to roadways are analysed. Following the first description of tyre wear particles as a potential pollutant [47] in 1978, there is still a considerable lack of knowledge about their introduction into the environment, the release of organic components and metals as well as the processes involved. Collected particles are complex mixtures of compounds from tyres, brakes, parts wear and road surface. Examination of particles present in the soil shows changes in structure and chemical composition and provides information about potential pollutants which originate from their degradation and fragmentation. A small number of studies have examined tyre, brake and road wear particles in field samples [5,20,26,48,49]. In this work, a comparison of contribution, particle size, morphology and chemical characterisation of microplastics from road dust and the soil from a roadside site is performed. In order to examine the microplastics, optical spectroscopic methods, including confocal and FTIR microscopy, are used. Raman microspectroscopy is used to obtain a more complete characterisation of the morphology and the presence of functional groups in the studied microplastics and as a method which is complementary to the most commonly used analytical laboratory technique, which is FTIR spectroscopy [27,37]. Both road dust and soil samples are taken into account.
2. Materials and Methods
2.1. Sampling
Hydrogen peroxide (H2O2, 30 wt.%) and calcium chloride (CaCl2, purity of 99%) were purchased form Chempur. Deionised water was supplied by HLP5 pure water system (Hydrolab, Straszyn, Poland). The samples were collected from the area of communication traffic with daily traffic intensity ranging from 1000 to 20,000 vehicles per day depending on the day of the week and time of day located in the centre of Kraków (soil samples—50.068107 N, 19.913494 E and road dust samples—50.06809 N, 19.91347 E) (Figure 2). Soil and road dust samples were collected in October 2020.
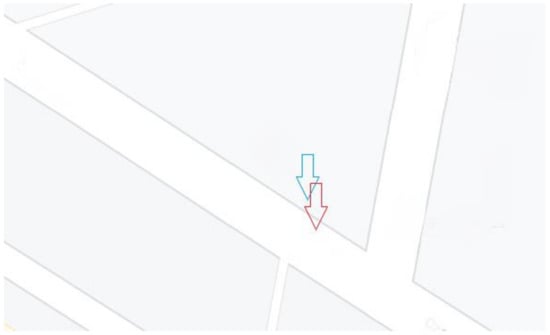
Figure 2.
Sampling points: soil (blue arrow), road dust (red arrow).
2.1.1. Soil
Soil sampling was performed according to the method presented in the literature [49,50,51,52]. During this time, three samples were collected from each site. The weight of the samples taken was different. Their weight ranged from 150 to 200 g. The samples were taken from a depth of 5 cm. The area of the collected fragment was 20 × 30 cm. The process of collection was performed with a steel spade. The samples were stored in glass containers and secured with aluminium foil. The soil samples were dried in a drier under air at 60 °C for 24 h. In the next step, the samples were screened. This allowed the removal of larger inorganic and organic fractions such as stones, roots and pieces of wood. For this purpose, stainless steel sieves with a mesh size of 500 μm were used. The amount of microplastic particles was determined in relation to the dry mass of the soil. A control sample was also taken to eliminate the possibility of microplastic contamination from the air. A glass bottle was opened in parallel with the soil sampling.
2.1.2. Road Dust
The samples were taken from the road with a stainless steel spatula. Road dust samples were collected if no rain occurred within 3 days prior to the process of collection. A control sample was also taken to eliminate the possibility of microplastic contamination from the air. A glass bottle was opened in parallel with the soil sampling.
2.1.3. General Remarks
The samples were taken with particular care and attention. No plastic objects were used during the collection and analysis.
2.2. Sample Processing—Separation Methods
In order to separate the plastics from the environmental samples, a density separation was performed. The dried environmental samples were mixed with a saturated solution of anhydrous calcium chloride solution, with a density of 1.6 g/cm3. This choice of separating substance is due to the fact that it is cheap, easily available and non-toxic to the environment compared to frequently used salts such as ZnCl2 or NaI [53]. The samples with saturated solution were mixed with a ratio of 1: 5 (v/v sample: saturated solution). In the case of soil samples, separation was carried out several times (up to 3 times) to ensure the most accurate separation. The samples were mixed for one hour with a magnetic stirrer and then allowed to separate by gravity. After 24 h, the upper layer with the floating pieces was poured off and filtered through a quantitative hard filter. The filter residue was washed with deionized water and left for further analysis. In order to eliminate the biological substance, which is also of lower density, oxidative etching with 15% H2O2 was used. The mixture was heated to 35 °C. The process lasted from 24 to 72 h, after which no biological substance was observed in the sample. In the case of dust, the process took 24 h, and in the case of soils, 72 h. The samples were filtered with a quantitative hard filter and then washed with deionised water. Such preparations were dried under atmospheric conditions. The filters were protected with aluminium foil to avoid contamination.
2.3. Characterisation of Microplastics
The morphology of the microplastic particles from the soil samples and road dust was initially examined with a Perkin Elmer Frontier Spotlight 150 FTIR microscope. For this purpose, all the residue on the filter was transferred to a microscope slide. During the analysis, microplastics were counted and classified according to the colour and shape of the materials, including division into fibres and fragments.
Fourier transform infrared (FTIR) spectroscopy was used to record IR absorption spectra of microplastics and to identify functional groups specific to them. For this purpose, a Perkin Elmer Frontier FTIR spectrometer was applied with a MIR range, a DTGS detector and an additional wide-range MCT detector. The FTIR spectra were measured in the wavenumber range of 500–4000 cm−1 and averaging 64 scans per spectrum at room temperature. The DRIFT mode was used, which is better for smaller fractions. Microplastic particles were put on sticks covered with a layer of abrasive material strongly reflecting the incident radiation (aluminium).
To verify and complete the results of IR spectroscopy, Raman microspectroscopy was used. The measurements were performed with a confocal WiTec Alpha 300 R microscope equipped with a 532 nm excitation laser beam module, a 100× air lens (Zeiss EC Epiplan-Neofluar, NA-0.9), a UHRS 300 spectrometer (600 gratings/mm) and a highly-efficient, thermoelectrically cooled CCD camera. The molecular spectra were collected from road pollution particles which were placed on CaF2 glasses having a low background and distinctive strong peaks that could be easily eliminated from the microparticles spectra. The settings of the microscope were optimised with respect to the purposes of this certain experiment in order to obtain the best quality spectral data without the risk of the destruction of the sample. The laser power on the sample was 10 mW, the integration time of spectra was equal to 0.5 s and 20 accumulations were recorded per a single Raman spectrum.
The great advantage of the conducted research is the combination of infrared and Raman methods. These are complementary methods.
2.4. Quality Control and Assurance
Control samples were treated in the same way as environmental ones in order to identify the possible background contamination from plastics. Such contaminants may include those from the laboratory (e.g., airborne fractions, contamination from the chemicals used); therefore, to minimise the presence of contaminants, all the processes were carried out in a fume hood. Moreover, the laboratory equipment made of plastics was not applied and each one that was used was thoroughly cleaned (rinsed several times with deionised water) and secured with aluminium foil or glass covers. Only cotton aprons were used in the course of the analyses. During the instrumental analysis, casings made of aluminium foil were used.
3. Results
3.1. Quality Control/Quality Assurance
One fibre was detected in a blank run. No fragments or fibres were detected in the control samples. The blank fibre was characterised as non-plastic. Several fragments were identified as non-plastic (2 fragments from soil and 1 from dust). They have been identified as silica. They were not taken into account.
3.2. Microplastics in Soil and Dust
The average amount of microplastics in the soil samples was 515 ± 20 fragments per kilogram of dry weight. For road dust samples, this number was 372 ± 50 per kilogram of dry weight.
Black fragments were dominant for each sampling source (Figure 3). In the case of soil and road dust samples, the content of black fragments was 91%. The morphology of the black fragments was very similar to the microplastics identified as tyre-derived microplastics in other literature sources (Figure 4) [52,54]. The fragments found had an elongated shape that changed when touched by the tweezers.
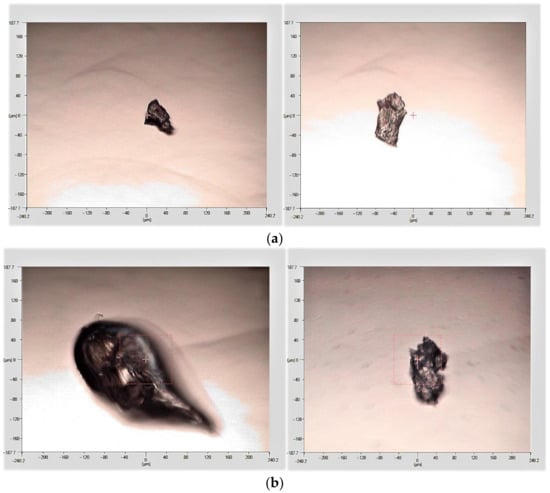
Figure 3.
FTIR microscope imaging of microplastics extracted from (a) soil, (b) road.
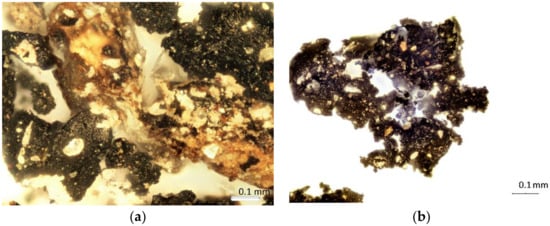
Figure 4.
FTIR microscope imaging of microplastics with 100 magnification. Samples extracted from (a) road dust, (b) soil.
For both soil and dust samples, fragments were the dominant microplastic fraction (Figure 5a). The fibres found during the analysis were very rare and similar to the values for soil and dust samples (Figure 5b). In the case of microplastics from soil samples, fractions below 50 µm were significantly dominant (Figure 5c). Then, there were fractions between 50 and 100 µm. In the case of road dust samples, the dominant fractions were between 50 and 100 µm and larger microparticles had a size between 100 and 200 µm (Figure 5c).
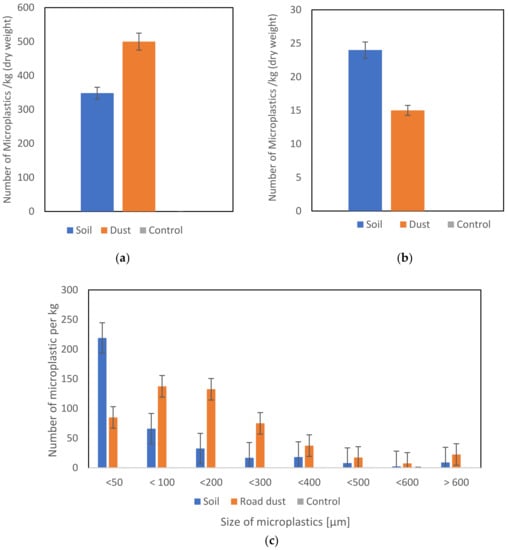
Figure 5.
The number of microplastics: (a) fragments per kg (dry weight), (b) fibres per kg (dry weight), (c) number and size of microplastics per kg (dry weight).
In Figure 6, the representative microplastic spectra from the soil samples and road dust are shown. The spectra were compared with the spectra of synthetic rubbers to support the hypothesis that the black fragments came from the tyre. The intensities at 2900, 2910 and 2950 cm−1 are the repeating and characteristic bands in the spectra. They testify to the presence of symmetrical and asymmetric stretching vibrations of methylene groups [55]. They are characterised as a substitute for black carbon derived from natural rubber tyres. In spectra, derived from rubber, which contain methylene groups in their structure, two separate types of stretching are distinguished. Asymmetric stretching occurs when two bonds between C-H lengthen and the third one contracts. The second variant concerns symmetrical stretches, in which the C-H bonds stretch and contract in three cases [56]. There are also very wide bands in the spectra around 3300 cm−1, which testify to the presence of hydroxyl groups. Also present in the spectra are peaks at 1458 cm−1, derived from CH2 scissor vibration, which may be derived from ethylene propylene diene monomer (EPDM)2. EPDM is an additive to rubbers that is used to improve quality and stability. In all spectra of the black fragments, the spectrum was found at a wavelength of 1095 cm−1. This is typical of the presence of C-S-C groups [57]. It has been proven that these peaks are found in rubbers after vulcanisation and the reinforcing of elastomers. Bands at 700 and 755 cm−1 are distinguished in black microfragments from both soil and dust, which are attributed to bending, aromatic =C-H and C=C vibrations from polystyrene [55]. There are also bands in the vicinity of 900 cm−1 and 960 cm−1, which were attributed to vibrations of the trans –CH=CH– group, originating from butadiene present in styrene-butadiene rubber (SBR) [55]. The analysis of microplastics from environmental samples is not easy. It is difficult to predict how environmental conditions such as temperature, pH, sunlight, salinity of water and soil will affect the process of degradation and leaching of various substances [57]. Research reports that the presence of microplastics in an acidic environment (pH below 3) ensures the quick elution of organic carbon and organic substances from them [58]. Tyre particle spectra have low permeability due to the strong adsorption of carbon added to the tyres. This methodology is used to prevent their oxidation.
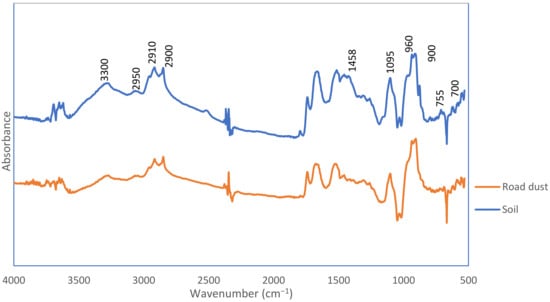
Figure 6.
FTIR spectra of black fragments detected in soil and road dust samples.
Figure 7 shows the representative Raman spectra of black fragments from the environmental samples (road dust and soil). Similarities of the functional groups present in the spectra were noticed. The spectra were compared with the literature spectra of NR (natural rubber), SBR and of impurities with silicon [59,60]. The peaks around 3060 cm−1 are responsible for the C–H ring stretching. The peaks around 2930 cm−1 account for CH2 asymmetric stretching. Peaks around 2900 cm−1 come from CH2 symmetric stretching. Peaks around 1650 cm−1 are ascribed to C=C stretching. The peaks around 1600 cm−1 result from =C-H ring stretching. The peaks around 1450 cm−1 are from CH2 deformation. The peaks at 1350 cm−1 are from CH2 deformation. The peaks present in each spectrum are at 1300 cm−1 and are derived from =C–H in-plane deformation. The peaks at 1217 cm−1 are from =C–H in plane bending. The 1000 cm−1 peaks are from symmetric ring breathing.
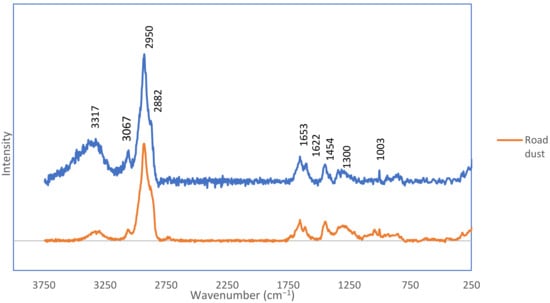
Figure 7.
The typical Raman spectra of black fragments from the soil and road dust samples.
The FTIR spectroscopy enables an analysis of black carbon-rich particles that absorb infrared light completely. Particles deposited on filters can be screened without the necessity of their individual extraction. However, this requires specific criteria and reference materials. Moreover, the FTIR spectroscopy detection limit is 20 µm. The main advantage of Raman is that even small particles, in the 1μm size range, can be detected [35,39]. This is significant for the characterisation of particles extracted from the soil and other secondary sources where the processes of degradation and fragmentation were dominant. These phenomena were observed in our study and the utilisation of Raman microspectroscopy has enriched the characterisation of particles below 10 µm. Confocal Raman microscopy use in conjunction with a Raman spectrometer enables high-magnification visualisation of samples and analysis of particles [23]. Accumulation of organic materials and chemical compounds on the microplastics such as tyre and road particles occur in different parts of the environment. This causes difficulties with reference to the analysis of complex field sample materials. The key significance for the proper characterisation of collected environmental materials is associated with methods of preparation which usually require generally time-consuming density separation and etching to remove interferences. The research which was conducted and reported in the literature stresses the requirement of the improvement of existing analytic methods toward more automated, faster and higher quality methods for analysis of complex field samples. Moreover, the lack of reference materials for an environmental matrix limits their analysis.
4. Discussion
The study analysed environmental samples for the presence of microplastic fractions. A huge number of black fragments (91% from the soil and the road dust) were found in all samples, which were defined as synthetic materials derived from vehicle tyres. Both the FTIR and Raman spectra confirm the presence of the most characteristic functional groups and admixtures used in tyres. The vast majority of the separated microplastic fractions were fragments (94% from soil samples, 97% from the road dust samples). A greater number of microplastics is found in road dust samples than in the soil. This may be due to the direct influence of braking, which causes greater accumulation of samples at the emission source than at a short distance in the soil. There is also a noticeable difference in the size of the fraction. In the case of soils, a fraction below 50 µm accounts for the majority of cases. When one analyses road dust samples, one may observe that most of the fractions are between 50 and 200 µm. This may be due to the possibility of smaller emission particles over longer distances and the greater degradation process that occurs in soils. Considering the presence of road runoffs and street washing, it can be assumed that the emission of tyre fragments in the dust from a road poses a very high risk, which is emitted directly to the sewage treatment plant and then to the reservoirs. The degradation processes of microplastics run downstream to the water ecosystem. It should be emphasised that both in soil samples and road dust samples over 90%, which occur in the soil, are a source of high pollution through the release of toxins into the soil and with it into groundwater and surface run-off. The study of samples from the terrestrial environment is a big gap in the world of science, where most research concerns samples from the aquatic environment. Another big gap in knowledge is the influence of the environment in which microplastics are found and the influence of separation methods, especially matrix etching, on its degradation. The degradation processes of microplastics run downstream to the water ecosystem. The research confirms that communication routes are an important source of the emission of microplastics into the environment. The advantage of the conducted research is the combination of infrared and Raman methods. These are complementary methods. The limitation of the conducted analysis may be the time-consuming nature of the separation processes of tyre microplastics from environmental samples. A low percentage oxidant concentration was used during the analysis. This was due to the conduct of tests which showed that 30% concentration of hydrogen peroxide destroys and discolours rubber microparticles, which can significantly affect the identification. Moreover, it was difficult to analyse the smallest particles below 10 µm which are the most harmful in terms of health. The main problems of microplastics’ analysis include the lack of standardization and the reference unit of the obtained results, which would allow the comparison of the obtained results between researchers. In the future, it is planned to deepen the analysis of samples for the presence of microplastics in tyres, including in Total Suspended Particles.
Author Contributions
Conceptualization, J.W. and K.S.; methodology, J.W., J.C., A.B. and K.S.; formal analysis, J.W., A.B. and K.S.; investigation, J.W., K.K. and X.B.; writing—original draft preparation, J.W., K.S., J.C. and A.B.; visualisation, J.W. and X.B. All authors have read and agreed to the published version of the manuscript.
Funding
The research project was partially financed by the “Initiative for Excellence—Research University” programme for the AGH University of Science and Technology. Research project partly supported by program “Excellence initiative—research university” for the University of Science and Technology No. 2071. Research was supported by Research Subsidy AGH 16.16.210.476 and AGH UST Rector Grant No. 61.2021.
Institutional Review Board Statement
Not applicable.
Data Availability Statement
Data supporting reported results are collected on the disc. They can be shared upon request.
Acknowledgments
The Raman microscope used for the study was financed from the funds granted to AGH UST within the framework of the “Excellence Initiative—Research University” programme.
Conflicts of Interest
The authors declare no conflict of interest.
Abbreviations
| DPF | Diesel particulate matter |
| EPDM | Ethylene Propylene Diene Monomer |
| GPF | Gasoline Particulate Filter |
| PAH | Polycyclic aromatic hydrocarbon |
| PEMS | Portable emission measurement systems |
| PM | Particulate matter |
| RDE | real-driving emissions |
| SBR | Styrene-Butadiene Rubber |
| SIDI | spark ignition direct injection |
| SPA | single particle analysis |
| NR | natural rubber |
References
- Karagulian, F.; Belis, C.A.; Dora, C.F.C.; Prüss-Ustün, A.M.; Bonjour, S.; Adair-Rohani, H.; Amann, M. Contributions to Cities’ Ambient Particulate Matter (PM): A Systematic Review of Local Source Contributions at Global Level. Atmos. Environ. 2015, 120, 475–483. [Google Scholar] [CrossRef]
- Samek, L.; Stegowski, Z.; Styszko, K.; Furman, L.; Fiedor, J. Seasonal Contribution of Assessed Sources to Submicron and Fine Particulate Matter in a Central European Urban Area. Environ. Pollut. 2018, 241, 406–411. [Google Scholar] [CrossRef] [PubMed]
- Styszko, K.; Samek, L.; Szramowiat, K.; Korzeniewska, A.; Kubisty, K.; Rakoczy-Lelek, R.; Kistler, M.; Giebl, A.K. Oxidative Potential of PM10 and PM2.5 Collected at High Air Pollution Site Related to Chemical Composition: Krakow Case Study. Air Qual. Atmos. Health 2017, 10, 1123–1137. [Google Scholar] [CrossRef]
- Samek, L.; Stegowski, Z.; Styszko, K.; Furman, L.; Zimnoch, M.; Skiba, A.; Kistler, M.; Kasper-Giebl, A.; Rozanski, K.; Konduracka, E. Seasonal Variations of Chemical Composition of PM2.5 Fraction in the Urban Area of Krakow, Poland: PMF Source Attribution. Air Qual. Atmos. Health 2020, 13, 89–96. [Google Scholar] [CrossRef]
- Pant, P.; Harrison, R.M. Estimation of the Contribution of Road Traffic Emissions to Particulate Matter Concentrations from Field Measurements: A Review. Atmos. Environ. 2013, 77, 78–97. [Google Scholar] [CrossRef]
- Kumar, P.; Morawska, L.; Birmili, W.; Paasonen, P.; Hu, M.; Kulmala, M.; Harrison, R.M.; Norford, L.; Britter, R. Ultrafine Particles in Cities. Environ. Int. 2014, 66, 1–10. [Google Scholar] [CrossRef] [Green Version]
- Samek, L.; Styszko, K.; Stegowski, Z.; Zimnoch, M.; Skiba, A.; Turek-Fijak, A.; Gorczyca, Z.; Furman, P.; Kasper-Giebl, A.; Rozanski, K. Comparison of Pm10 Sources at Traffic and Urban Background Sites Based on Elemental, Chemical and Isotopic Composition: Case Study from Krakow, Southern Poland. Atmosphere 2021, 12, 1364. [Google Scholar] [CrossRef]
- Giechaskiel, B.; Mamakos, A.; Woodburn, J.; Szczotka, A.; Bielaczyc, P. Evaluation of a 10 Nm Particle Number Portable Emissions Measurement System (PEMS). Sensors 2019, 19, 5531. [Google Scholar] [CrossRef] [Green Version]
- Giechaskiel, B.; Dilara, P.; Sandbach, E.; Andersson, J. Particle Measurement Programme (PMP) Light-Duty Inter-Laboratory Exercise: Comparison of Different Particle Number Measurement Systems. Meas. Sci. Technol. 2008, 19, 5401. [Google Scholar] [CrossRef]
- Barone, T.L.; Storey, J.M.E.; Youngquist, A.D.; Szybist, J.P. An Analysis of Direct-Injection Spark-Ignition (DISI) Soot Morphology. Atmos. Environ. 2012, 49, 268–274. [Google Scholar] [CrossRef]
- Giechaskiel, B.; Vlachos, T.; Riccobono, F.; Forni, F.; Colombo, R.; Montigny, F.; Le-Lijour, P.; Carriero, M.; Bonnel, P.; Weiss, M. Implementation of Portable Emissions Measurement Systems (PEMS) for the Real-Driving Emissions (RDE) Regulation in Europe. J. Vis. Exp. 2016, 2016, 4753. [Google Scholar] [CrossRef] [Green Version]
- Giechaskiel, B.; Woodburn, J.; Szczotka, A.; Bielaczyc, P. Particulate Matter (PM) Emissions of Euro 5 and Euro 6 Vehicles Using Systems with Evaporation Tube or Catalytic Stripper and 23 Nm or 10 Nm Counters. In SAE Technical Papers; SAE International: Warrendale, PA, USA, 2020. [Google Scholar] [CrossRef]
- Park, J.; Joo, B.; Seo, H.; Song, W.; Lee, J.J.; Lee, W.K.; Jang, H. Analysis of Wear Induced Particle Emissions from Brake Pads during the Worldwide Harmonized Light Vehicles Test Procedure (WLTP). Wear 2021, 466–467, 203539. [Google Scholar] [CrossRef]
- Grigoratos, T.; Martini, G. Brake Wear Particle Emissions: A Review. Environ. Sci. Pollut. Res. 2015, 22, 2491–2504. [Google Scholar] [CrossRef] [Green Version]
- Eriksson, M.; Bergman, F.; Jacobson, S. On the Nature of Tribological Contact in Automotive Brakes; Elsevier: Amsterdam, The Netherlands, 2002; Volume 252. [Google Scholar]
- Sanders, P.G.; Xu, N.; Dalka, T.M.; Maricq, M.M. Airborne Brake Wear Debris: Size Distributions, Composition, and a Comparison of Dynamometer and Vehicle Tests. Environ. Sci. Technol. 2003, 37, 4060–4069. [Google Scholar] [CrossRef]
- Arias, A.H.; Alfonso, M.B.; Girones, L.; Piccolo, M.C.; Marcovecchio, J.E. Synthetic Microfibers and Tyre Wear Particles Pollution in Aquatic Systems: Relevance and Mitigation Strategies. Environ. Pollut. 2021, 295, 118607. [Google Scholar] [CrossRef]
- Alexandrova, O.; Kaloush, K.E.; Allen, J.O. Impact of Asphalt Rubber Friction Course Overlays on Tire Wear Emissions and Air Quality Models for Phoenix, Arizona, Airshed. Transp. Res. Rec. 2007, 2011, 98–106. [Google Scholar] [CrossRef]
- Kovochich, M.; Liong, M.; Parker, J.A.; Oh, S.C.; Lee, J.P.; Xi, L.; Kreider, M.L.; Unice, K.M. Chemical Mapping of Tire and Road Wear Particles for Single Particle Analysis. Sci. Total Environ. 2021, 757, 4085. [Google Scholar] [CrossRef]
- Sommer, F.; Dietze, V.; Baum, A.; Sauer, J.; Gilge, S.; Maschowski, C.; Gieré, R. Tire Abrasion as a Major Source of Microplastics in the Environment. Aerosol Air Qual. Res. 2018, 18, 2014–2028. [Google Scholar] [CrossRef]
- Jeong, H. Toxic Metal Concentrations and Cu–Zn–Pb Isotopic Compositions in Tires. J. Anal. Sci. Technol. 2022, 13, 2. [Google Scholar] [CrossRef]
- Kreider, M.L.; Panko, J.M.; McAtee, B.L.; Sweet, L.I.; Finley, B.L. Physical and Chemical Characterization of Tire-Related Particles: Comparison of Particles Generated Using Different Methodologies. Sci. Total Environ. 2010, 408, 652–659. [Google Scholar] [CrossRef]
- Andersson-Sköld, Y.; Johannesson, M.; Gustafsson, M.; Järlskog, I.; Lithner, D.; Polukarova, M.; Strömvall, A.-M. Microplastics from Tyre and Road Wear; Digitala Vetenskapliga Arkivet: Stockholm, Sweden, 2020. [Google Scholar]
- Liu, M.; Lu, S.; Song, Y.; Lei, L.; Hu, J.; Lv, W.; Zhou, W.; Cao, C.; Shi, H.; Yang, X.; et al. Microplastic and Mesoplastic Pollution in Farmland Soils in Suburbs of Shanghai, China. Environ. Pollut. 2018, 242, 855–862. [Google Scholar] [CrossRef] [PubMed]
- Zhou, Y.; Liu, X.; Wang, J. Characterization of Microplastics and the Association of Heavy Metals with Microplastics in Suburban Soil of Central China. Sci. Total Environ. 2019, 694, 3798. [Google Scholar] [CrossRef] [PubMed]
- Unice, K.M.; Kreider, M.L.; Panko, J.M. Comparison of Tire and Road Wear Particle Concentrations in Sediment for Watersheds in France, Japan, and the United States by Quantitative Pyrolysis GC/MS Analysis. Environ. Sci. Technol. 2013, 47, 8138–8147. [Google Scholar] [CrossRef] [PubMed]
- Jan Kole, P.; Löhr, A.J.; van Belleghem, F.G.A.J.; Ragas, A.M.J. Wear and Tear of Tyres: A Stealthy Source of Microplastics in the Environment. Int. J. Environ. Res. Public Health 2017, 14, 1265. [Google Scholar] [CrossRef] [PubMed]
- Dumne, S.M. An Experimental Study on Performance of Recycled Tyre Rubber-Filled Concrete. Int. J. Eng. Res. Technol. (IJERT) 2013, 2, 766–772. [Google Scholar]
- Banerjee, S.; Mandal, A.; Rooby, J. Studies on Mechanical Properties of Tyre Rubber Concret. Int. J. Civ. Eng. 2016, 3, 18–21. [Google Scholar] [CrossRef] [Green Version]
- Adachi, K.; Tainosho, Y. Characterization of Heavy Metal Particles Embedded in Tire Dust. Environ. Int. 2004, 30, 1009–1017. [Google Scholar] [CrossRef]
- Karlsson, T.M.; Ekstrand, E.; Threapleton, M.; Mattsson, K.; Nordberg, K.; Hassellöv, M. Undersökning Av Mikroskräp Längs Bohuslänska Stränder Och i Sediment; Digitala Vetenskapliga Arkivet: Stockholm, Sweden, 2019. [Google Scholar]
- Camatini, M.; Crosta, G.F.; Corbetta, G.M.; Ottin-Bocat, M.; Ambrosio, S.; Giuliani, G.P.; Cencetti, S.; Regazzoni, C. Fractal Shape Analysis of Tire Debris Particles: Preliminary Results and Applications. Mater. Res. Soc. Symp. Proc. 2001, 661, KK1.6. [Google Scholar] [CrossRef]
- Li, W.; Shao, L.; Zhang, D.; Ro, C.U.; Hu, M.; Bi, X.; Geng, H.; Matsuki, A.; Niu, H.; Chen, J. A Review of Single Aerosol Particle Studies in the Atmosphere of East Asia: Morphology, Mixing State, Source, and Heterogeneous Reactions. J. Clean. Prod. 2016, 112, 1330–1349. [Google Scholar] [CrossRef]
- Elmes, M.; Gasparon, M. Sampling and Single Particle Analysis for the Chemical Characterisation of Fine Atmospheric Particulates: A Review. J. Environ. Manag. 2017, 202, 137–150. [Google Scholar] [CrossRef]
- Mai, L.; Bao, L.J.; Shi, L.; Wong, C.S.; Zeng, E.Y. A Review of Methods for Measuring Microplastics in Aquatic Environments. Environ. Sci. Pollut. Res. 2018, 12, 11319–11332. [Google Scholar] [CrossRef]
- Pohrt, R. Tire Wear Particle Hot Spots–Review of Influencing Factors. Facta Univ. Ser. Mech. Eng. 2019, 17, 17–27. [Google Scholar] [CrossRef] [Green Version]
- Järlskog, I.; Strömvall, A.M.; Magnusson, K.; Gustafsson, M.; Polukarova, M.; Galfi, H.; Aronsson, M.; Andersson-Sköld, Y. Occurrence of Tire and Bitumen Wear Microplastics on Urban Streets and in Sweepsand and Washwater. Sci. Total Environ. 2020, 729, 8950. [Google Scholar] [CrossRef]
- Olesen, K.B.; van Alst, N.; Simon, M.; Vianello, A.; Liu, F.; Vollertsen, J.; Agilent, M.K.; Photo, A.; Blair, R.M. Analysis of Microplastics Using FTIR Imaging Application Note MarinePlastic View Project Goletta Verde’s Legambiente and Ispra Microlitter Monitoring Project View Project Application Note Environmental Authors; Aalborg University: Aalborg, Denmark, 2017. [Google Scholar]
- Anger, P.M.; von der Esch, E.; Baumann, T.; Elsner, M.; Niessner, R.; Ivleva, N.P. Raman Microspectroscopy as a Tool for Microplastic Particle Analysis. TrAC Trends Anal. Chem. 2018, 109, 214–226. [Google Scholar] [CrossRef]
- Renner, G.; Schmidt, T.C.; Schram, J. Analytical Methodologies for Monitoring Micro(Nano)Plastics: Which Are Fit for Purpose? Curr. Opin. Environ. Sci. Health 2018, 1, 55–61. [Google Scholar] [CrossRef]
- Wagner, S.; Hüffer, T.; Klöckner, P.; Wehrhahn, M.; Hofmann, T.; Reemtsma, T. Tire Wear Particles in the Aquatic Environment-A Review on Generation, Analysis, Occurrence, Fate and Effects. Water Res. 2018, 139, 83–100. [Google Scholar] [CrossRef]
- Araujo, C.F.; Nolasco, M.M.; Ribeiro, A.M.P.; Ribeiro-Claro, P.J.A. Identification of Microplastics Using Raman Spectroscopy: Latest Developments and Future Prospects. Water Res. 2018, 142, 426–440. [Google Scholar] [CrossRef]
- Nguyen, B.; Claveau-Mallet, D.; Hernandez, L.M.; Xu, E.G.; Farner, J.M.; Tufenkji, N. Separation and Analysis of Microplastics and Nanoplastics in Complex Environmental Samples. Acc. Chem. Res. 2019, 52, 858–866. [Google Scholar] [CrossRef] [Green Version]
- Unice, K.M.; Kreider, M.L.; Panko, J.M. Use of a Deuterated Internal Standard with Pyrolysis-GC/MS Dimeric Marker Analysis to Quantify Tire Tread Particles in the Environment. Int. J. Environ. Res. Public Health 2012, 9, 4033–4055. [Google Scholar] [CrossRef]
- Fries, E.; Dekiff, J.H.; Willmeyer, J.; Nuelle, M.T.; Ebert, M.; Remy, D. Identification of Polymer Types and Additives in Marine Microplastic Particles Using Pyrolysis-GC/MS and Scanning Electron Microscopy. Environ. Sci. Processes Impacts 2013, 15, 1949–1956. [Google Scholar] [CrossRef] [Green Version]
- Käppler, A.; Fischer, M.; Scholz-Böttcher, B.M.; Oberbeckmann, S.; Labrenz, M.; Fischer, D.; Eichhorn, K.J.; Voit, B. Comparison of μ-ATR-FTIR Spectroscopy and Py-GCMS as Identification Tools for Microplastic Particles and Fibers Isolated from River Sediments. Anal. Bioanal. Chem. 2018, 410, 5313–5327. [Google Scholar] [CrossRef] [PubMed]
- Cadle, S.H.; Williams, R.L. Gas and Particle Emissions from Automobile Tires in Laboratory and Field Studies. J. Air Pollut. Control Assoc. 1978, 28, 502–507. [Google Scholar] [CrossRef]
- Knight, L.J.; Parker-Jurd, F.N.F.; Al-Sid-Cheikh, M.; Thompson, R.C. Tyre Wear Particles: An Abundant yet Widely Unreported Microplastic? Environ. Sci. Pollut. Res. 2020, 27, 18345–18354. [Google Scholar] [CrossRef]
- Eisentraut, P.; Dümichen, E.; Ruhl, A.S.; Jekel, M.; Albrecht, M.; Gehde, M.; Braun, U. Two Birds with One Stone-Fast and Simultaneous Analysis of Microplastics: Microparticles Derived from Thermoplastics and Tire Wear. Environ. Sci. Technol. Lett. 2018, 5, 608–613. [Google Scholar] [CrossRef]
- Chai, B.; Wei, Q.; She, Y.; Lu, G.; Dang, Z.; Yin, H. Soil Microplastic Pollution in an E-Waste Dismantling Zone of China. Waste Manag. 2020, 118, 291–301. [Google Scholar] [CrossRef] [PubMed]
- Dehaut, A.; Hermabessiere, L.; Duflos, G. Current Frontiers and Recommendations for the Study of Microplastics in Seafood. TrAC Trends Anal. Chem. 2019, 116, 346–359. [Google Scholar] [CrossRef]
- Ziajahromi, S.; Drapper, D.; Hornbuckle, A.; Rintoul, L.; Leusch, F.D.L. Microplastic Pollution in a Stormwater Floating Treatment Wetland: Detection of Tyre Particles in Sediment. Sci. Total Environ. 2020, 713, 136356. [Google Scholar] [CrossRef]
- Hidalgo-Ruz, V.; Gutow, L.; Thompson, R.C.; Thiel, M. Microplastics in the Marine Environment: A Review of the Methods Used for Identification and Quantification. Environ. Sci. Technol. 2012, 46, 3060–3075. [Google Scholar] [CrossRef]
- Sun, J.; Dai, X.; Wang, Q.; van Loosdrecht, M.C.M.; Ni, B.J. Microplastics in Wastewater Treatment Plants: Detection, Occurrence and Removal. Water Res. 2019, 152, 21–37. [Google Scholar] [CrossRef]
- Gunasekaran, S.; Natarajan, R.K.; Kala, A. FTIR Spectra and Mechanical Strength Analysis of Some Selected Rubber Derivatives. Spectrochim. Acta Part A Mol. Biomol. Spectrosc. 2007, 68, 323–330. [Google Scholar] [CrossRef]
- Chaudhry, A.N.; Billingham, N.C. Characterisation and Oxidative Degradation of a Room-Temperature Vulcanised Poly(Dimethylsiloxane) Rubber. Polym. Degrad. Stab. 2001, 73, 505–510. [Google Scholar] [CrossRef]
- Ovchinnikov, O.V.; Evtukhova, A.V.; Kondratenko, T.S.; Smirnov, M.S.; Khokhlov, V.Y.; Erina, O.v. Manifestation of Intermolecular Interactions in FTIR Spectra of Methylene Blue Molecules. Vib. Spectrosc. 2016, 86, 181–189. [Google Scholar] [CrossRef]
- Selbes, M.; Yilmaz, O.; Khan, A.A.; Karanfil, T. Leaching of DOC, DN, and Inorganic Constituents from Scrap Tires. Chemosphere 2015, 139, 617–623. [Google Scholar] [CrossRef]
- Prasertsri, S.; Lagarde, F.; Rattanasom, N.; Sirisinha, C.; Daniel, P. Raman Spectroscopy and Thermal Analysis of Gum and Silica-Filled NR/SBR Blends Prepared from Latex System. Polym. Test. 2013, 32, 852–861. [Google Scholar] [CrossRef]
- Cornell, S.W.; Koenig, J.L. The Raman Spectra of Polybutadiene Rubbers. Rubber Chem. Technol. 1970, 43, 322–332. [Google Scholar] [CrossRef]
Publisher’s Note: MDPI stays neutral with regard to jurisdictional claims in published maps and institutional affiliations. |
© 2022 by the authors. Licensee MDPI, Basel, Switzerland. This article is an open access article distributed under the terms and conditions of the Creative Commons Attribution (CC BY) license (https://creativecommons.org/licenses/by/4.0/).